Embed Size (px)
Citation preview

Hydrothermal fluid flow and deformation in large calderas:
Inferences from numerical simulations
Shaul Hurwitz,1 Lizet B. Christiansen,1 and Paul A. Hsieh1
Received 10 September 2006; revised 5 October 2006; accepted 17 October 2006; published 24 February 2007.
[1] Inflation and deflation of large calderas is traditionally interpreted as being induced byvolume change of a discrete source embedded in an elastic or viscoelastic half-space,though it has also been suggested that hydrothermal fluids may play a role. To test thelatter hypothesis, we carry out numerical simulations of hydrothermal fluid flow andporoelastic deformation in calderas by coupling two numerical codes: (1) TOUGH2[Pruess et al., 1999], which simulates flow in porous or fractured media, and (2) BIOT2[Hsieh, 1996], which simulates fluid flow and deformation in a linearly elastic porousmedium. In the simulations, high-temperature water (350�C) is injected at variable ratesinto a cylinder (radius 50 km, height 3–5 km). A sensitivity analysis indicates that smalldifferences in the values of permeability and its anisotropy, the depth and rate ofhydrothermal injection, and the values of the shear modulus may lead to significantvariations in the magnitude, rate, and geometry of ground surface displacement, or uplift.Some of the simulated uplift rates are similar to observed uplift rates in large calderas,suggesting that the injection of aqueous fluids into the shallow crust may explain some ofthe deformation observed in calderas.
Citation: Hurwitz, S., L. B. Christiansen, and P. A. Hsieh (2007), Hydrothermal fluid flow and deformation in large calderas:
Inferences from numerical simulations, J. Geophys. Res., 112, B02206, doi:10.1029/2006JB004689.
1. Introduction
[2] Calderas are large, quasi-circular volcanic depres-sions, ranging up to 75 kilometers in the largest dimension,that form by roof collapse over an underlying shallowmagma reservoir [Lipman, 1984, 1997]. The larger calderas(>5 km in diameter) are usually associated with cataclysmicignimbrite eruptions in which magmatic volumes of at leastseveral cubic kilometers are ejected [Lipman, 1997, 2000].Sixteen large caldera forming eruptions have occurred in theQuaternary, of which the largest occurred at 760 ka, formingthe Long Valley Caldera in California, 640 ka, forming theYellowstone Caldera in Wyoming, and 75 ka, forming theToba Caldera in Indonesia [Lipman, 2000].[3] Most Quaternary calderas are characterized by peri-
ods of unrest at various timescales that are manifested bysome combination of intense thermal activity, gas emis-sions, seismicity, and ground surface displacements (GSD)[Newhall and Dzurisin, 1988]. GSD rates in calderas rangeover several orders of magnitude (Table 1) and thosedetectable with modern geodetic techniques (e.g., trilatera-tion, electronic distance meters, interferometric syntheticaperture radar, and GPS) are of special interest, becausethey are often interpreted as indicators of recent magmaintrusion into the shallow crust [Dvorak and Dzurisin, 1997;Dzurisin, 2003; Poland et al., 2006; Wicks et al., 2006].However, most reported GSD have not culminated in
magma eruption, and eruptions can occur without signifi-cant GSD [Pritchard and Simons, 2002].[4] Interpretations of GSD usually invoke volume change
of a discrete source (often assumed to be a magma chamber)with a specified geometry in a homogeneous, isotropic, andelastic [Mogi, 1958; Walsh and Decker, 1971; Vasco et al.,1988; Yang et al., 1988; Fialko et al., 2001], or viscoelastic[Bonafede et al., 1986; Newman et al., 2001] half-space.The calculated depth, shape, and volume change of thesource in these models are derived from inversion ofmeasured GSD. In many cases, observed surface displace-ments display a multifaceted pattern, implying that themagma plumbing system has a complex geometry thatcan only be modeled using a number of superimposedsources. In these circumstances, determination of the sourceparameters (e.g., depth, shape, volume change) is a non-unique problem.[5] Such models cannot distinguish between an aqueous,
low-density, low-viscosity fluid and a dense and viscousmagma. Further, an increasing number of observationsindicate a causal link between transient groundwater and/or gas pressures and GSD in calderas [Dzurisin et al., 1990;Bonafede, 1991; Wicks et al., 1998; De Natale et al., 2001;Chiodini et al., 2003; Battaglia et al., 2006]. This suggeststhat a poroelastic approach, coupling fluid and solidstresses, to modeling GSD in calderas should be considered.Despite the growing number of suggestive observations, theinterplay between groundwater flow dynamics and crustalmechanics in active calderas is poorly understood. In thisstudy, we carry out numerical simulations of caldera hydro-thermal systems with a goal of determining the range of
JOURNAL OF GEOPHYSICAL RESEARCH, VOL. 112, B02206, doi:10.1029/2006JB004689, 2007ClickHere
for
FullArticle
1U.S. Geological Survey, Menlo Park, California, USA.
This paper is not subject to U.S. copyright.Published in 2007 by the American Geophysical Union.
B02206 1 of 16

plausible conditions under which poroelastic-induced GSDmay occur.
2. Conceptual Model
[6] Following a widely accepted model of volcano hy-drothermal systems [Fournier, 1999], we envision a calderawith a near-hydrostatic pressure distribution down to abrittle-ductile transition zone where the temperature is350–450�C (Figure 1). Below the brittle-ductile transitionzone there is a decrease in permeability and pressures arenear lithostatic.[7] Aqueous fluids and gas derived from crystallizing or
convecting magma, or from episodic dike intrusion intocrystallizing magma, are injected into the base of thehydrothermal system [Fournier, 1999]. Injection of high-
temperature magmatic fluid into the shallow hydrothermalsystem can induce fluid overpressures that cause the hostrocks to inflate by an amount controlled in part by therigidity of the rock. Heating and thermal expansion of thesaturated host rock also contributes to the inflation.[8] In this conceptual model, subsidence can result from
either a decrease in the flux of magmatic fluid entering thehydrothermal system or in response to rapid permeabilityincreases that may occur when the pore pressures exceed thecritical yield strength of the host rocks.
3. Numerical Methods
[9] To simulate poroelastic effects of magmatic fluidinjection into the shallow hydrothermal system, we coupletwo numerical codes: (1) TOUGH2 [Pruess et al., 1999], a
Table 1. Documented Examples of Vertical Ground Surface Displacements in Large Calderas
Caldera Period
VerticalDisplacementRate, mm/yr
Radius ofDeformedArea, km Comments Reference
Millennial and Centennial Displacements Based on MappingCampi Flegrei 150 B.C. to 394 �14 6 Rapid uplift terminated by the 1538
Monte Nuovo eruptionOrsi et al. [1999]
and Morhange etal. [2006]
1450–1538 +1021538–1905 �17
Iwo Jima 1539–1988 +250 Uplift of the entire islandCaldera displacements areunknown
Newhall et al.[1998]
Yellowstone 16–3 ka �2 20–25 Secular trend of subsidenceepisodically interrupted byuplift
Pierce et al. [2002]
Subannual to Decadal Displacements Based on Geodetic MeasurementsAniakachak 1992–200 �13 5 Kwoun et al.
[2006]Campi Flegrei 1905–1968 �14 8 Secular trend of subsidence
episodically interrupted byuplift
Orsi et al. [1999],De Nataleet al. [2001], andBeauducel et al.[2004]
1969–1972 +5101972–1975 �701982–1984 +5101985–1988 �501988–1989 +130
Iwo Jima 1977–1995 �30 5 Concurrent with the islanduplifting at a rate of165 mm/yr
Ukawa et al.[2006]
Long Valley 1976–1980 +60 5 Displacement of the resurgentdome
Langbein [2003]
1980–1983 +601988–1992 +181997–1998 +1001998–2002 �5
Rabaul 1971–1983 +115 5 McKee et al. [1984]and Archboldet al. [1988]
1983–1985 +200Taupo 1979–1983 �2–10 12 Otway et al. [2002]
1983–1984 +601984–1996 �5–111996–1999 +40
Yellowstone 1923, 1975–1977 +14 20–25 Pelton and Smith[1979], Wicks et al.[1998], andDzurisin et al.[1999]
1976–1984 +221985–1995 �19
B02206 HURWITZ ET AL.: DEFORMATION IN LARGE CALDERAS
2 of 16
B02206

three-dimensional (3-D) integrated finite difference simula-tor for nonisothermal, multicomponent and multiphase flowin porous or fractured media and (2) BIOT2 [Hsieh, 1996],which simulates axisymmetric or plane strain deformationand fluid flow in a linearly elastic porous medium. Weselected TOUGH2 as the flow simulator because (1) it is awidely used public domain code; (2) it can simulate
multiphase and multicomponent (H2O-CO2-NaCl) fluidflow, enabling future simulations to examine these effects,and (3) it allows for complex geometries, so that futuresimulations can incorporate effects of topography. BIOT2 isin the public domain, facilitating widespread use andverification of the coupled model.
Table 2. Summary of Numerical Simulations and the Variable Parameters
Simulation kx, m2 kx/kz Porosity
InjectionRate, t/d
Height ofCylinder, km
Heat Flux,mW/m2
ShearModulus, GPa
REFER 1 � 10�15 1 0.10 2,000 5 100 1
Series A, Varying Injection RateINJ-200 1 � 10�15 1 0.10 200 5 100 1INJ-5000 1 � 10�15 1 0.10 10,000 5 100 1INJ-10000 1 � 10�15 1 0.10 20,000 5 100 1
Series B, Varying Injection Source DepthDEPTH-3 1 � 10�15 1 0.10 2,000 3 100 1DEPTH-4 1 � 10�15 1 0.10 2,000 4 100 1DEPTH-6 1 � 10�15 1 0.10 2,000 6 100 1DEPTH-7 1 � 10�15 1 0.10 2,000 7 100 1
Series C, Varying PermeabilityPERM-17 1 � 10�17 1 0.10 2,000 5 100 1PERM-16 1 � 10�16 1 0.10 2,000 5 100 1PERM-14 1 � 10�14 1 0.10 2,000 5 100 1PERM-13 1 � 10�13 1 0.10 2,000 5 100 1
Series D, Varying Anisotropic PermeabilityANIS-10 1 � 10�15 10 0.10 2,000 5 100 1ANIS-100 1 � 10�15 100 0.10 2,000 5 100 1
Series E, Varying Basal Heat FluxFLUX-150 1 � 10�15 1 0.10 2,000 5 150 1FLUX-200 1 � 10�15 1 0.10 2,000 5 200 1
Series F, Varying Shear ModulusSHEAR-1 1 � 10�15 1 0.10 2,000 5 100 0.1SHEAR-10 1 � 10�15 1 0.10 2,000 5 100 10SHEAR-30 1 � 10�15 1 0.10 2,000 5 100 30
Series G, Varying PorosityPORO-5 1 � 10�15 1 0.05 2,000 5 100 1PORO-20 1 � 10�15 1 0.20 2,000 5 100 1PORO-25 1 � 10�15 1 0.25 2,000 5 100 1
Series H, Comparison With Observed Displacements in Campi Flegrei and Long ValleyCYCL-INJ 1 � 10�16 1 0.10 0–2,000 5 100 1CYCL-PERM 1 � 10�15–1 � 10�14 1 0.10 2,000 3 100 1
Series I, Comparison With Observed Displacements in Campi Flegrei and Long ValleyCF-3 km 1 � 10�15 1 0.10 20,000 3 100 1LVC-5 km 1 � 10�16 1 0.10 4,000 5 100 1LVC-8 km 8 � 10�17 1 0.10 8,000 8 100 1
Figure 1. Conceptual model of a caldera [after Lipman, 1984] which includes the boundary faults and aresurgent dome (RD). The brittle-ductile transition (BDT) coincides with a transition from lithostatic(below) to hydrostatic (above) pressure distribution (following Fournier [1999]). The arrows representfluid derived from magma crystallization, being injected into the base of the hydrothermal system.
B02206 HURWITZ ET AL.: DEFORMATION IN LARGE CALDERAS
3 of 16
B02206

[10] Fluid flow in the coupled simulator is modeled byTOUGH2 by solving a set of governing equations describ-ing the conservation of mass, energy, and momentum. Thecompressibility of water is internally coded in TOUGH2and varies with temperature and pressure. Detailed formu-lation of these equations can be found elsewhere [Pruess etal., 1999]. BIOT2 is used to simulate poroelastic deforma-tion of the host rock.[11] In our simulations, both codes have the same com-
putational mesh. However, the variables in TOUGH2 aredefined at element centroids, whereas the variables inBIOT2 are defined at element corners. For each time step,the temperature and pressure at element centroids arecalculated by TOUGH2. The values of pressure and tem-
perature are interpolated to element corners, and then fedinto BIOT2, where the displacement vector u is calculatedfor each node by solving
Gr2uþ G
1� 2nr r � uð Þ � r p� p0ð Þ
� 2G 1þ nð Þa3 1� 2nð Þ r T � T0ð Þ ¼ 0 ð1Þ
where G, n, and a are the shear modulus, Poisson’s ratio(drained), and the volumetric thermal expansion coefficientof the saturated porous medium, respectively; p is pressure,T is temperature; and the subscript zero indicates conditionsat the initial state. Note that in its original version, BIOT2
Figure 2. (a) Model domain showing the location of fluid injection and a slice through the cylindricaldomain (rectangle with dashed gray boundaries) on which the computational grid was constructed and(b) computational grid for TOUGH2 and BIOT2 simulations. Boundary conditions for BIOT2 simulationsare in italics.
Table 3. Constant Model Parameters
Parameter Value Unit Reference
Thermal conductivity 2.8 W m�1 K�1 Turcotte and Schubert [2002]Rock density 2700 kg m�3 Turcotte and Schubert [2002]Source temperature 350 �CThermal expansion coefficient 1 � 10�5 �C�1 Wong and Brace [1979] and
Bauer and Handin [1983]Poisson’s ratio 0.25 dimensionless Christensen [1996]
B02206 HURWITZ ET AL.: DEFORMATION IN LARGE CALDERAS
4 of 16
B02206

was designed for isothermal conditions, and therefore didnot include the temperature term in equation (1). In otherwords, BIOT2 solves
Gr2uþ G
1� 2nr r � uð Þ � r p� p0ð Þ ¼ 0 ð2Þ
For the current application, temperature is introduced intoBIOT2 by replacing r(p � p0) in equation (2) with
r p� p0ð Þ þ 2G 1þ nð Þa3 1� 2nð Þ T � T0ð Þ
� �ð3Þ
Since both pressure and temperature are computed byTOUGH2, they are treated as specified values in BIOT2.
[12] Note that the gravity term does not appear in thedeformation equation. This is because the deformation andstresses are referenced to an initial state that is in staticequilibrium. Since the deformed state is also at staticequilibrium, the gravity term drops out when then equationis formulated in terms of the change from the initial staticstate. In addition, BIOT2 implements an infinitesimal strainformulation in which the displacement is computed at eachnode (element corner); however, the computational meshitself does not deform.
4. Model Assumptions and Simplifications
[13] The most significant simplification in this study isthe emphasis on single phase (liquid), single component
Figure 3. Time evolution in the reference simulation (Tables 2 and 3), showing (a) pressure change(DP) relative to pressure at the initial state, (b) temperature, and (c) deformation. For purpose ofillustration, deformation is exaggerated 500 times, so that for example, a surface rise of 1 km correspondsto an actual rise of 2 m.
B02206 HURWITZ ET AL.: DEFORMATION IN LARGE CALDERAS
5 of 16
B02206

(pure water) fluid flow, except for a single simulation(CYCL-PERM; Table 2) where a steam phase develops(details in section 7.2). Many real caldera hydrothermalsystems likely include vapor dominated, two-phase regionswith large CO2 fractions in the gas phase [Chiodini et al.,2001, 2003; Werner and Brantley, 2003]. This single-phasesimplification is not a requirement of the TOUGH2-BIOT2model, but it allows us to more readily determine thesensitivity of key parameters and boundary conditions.[14] In all but a small subset of the simulations we assume
that model parameters remain constant throughout a 10,000year simulation period. We further assume that all rockproperties are homogeneous. In natural settings, the me-chanical parameters are temperature and pressure dependent[Heard and Page, 1982], and permeability generallydecreases with depth [Manning and Ingebritsen, 1999; Saarand Manga, 2004] and with time [Hurwitz et al., 2002].[15] We further assume that the water table coincides with
the ground surface and that the topography is flat. Incontrast to stratovolcanoes where topography is a majorcontrol on hydrodynamics [Hurwitz et al., 2003], topo-graphic gradients in calderas are in fact relatively smalland the water table is usually close to the ground surface.Finally, we assume that the change in stress (as calculatedby BIOT2) has no effect on permeability, porosity, or fluidflow. Such a one-way coupling approach (that is, fromTOUGH2 to BIOT2 but not vice versa) has been also
adopted in similar simulations [Reid, 2004; Todesco et al.,2004].
5. Model Configuration and Boundary and InitialConditions
[16] The model domain is a radially symmetric cylinder3–8 km high with a radius of 50 km (Figure 2a). Simu-lations with a cylinder radius of 500 km produced identicalresults and demonstrated that there are no boundary effects.The model grid and results can be visualized on a rectan-gular cross section, with the left edge of the cross sectioncoinciding with the central axis of the cylinder (Figure 2b).The cross section is divided into 50 columns and 56 layers.Horizontal grid spacing varies from 25 m at the center of thedomain and increases toward the right-hand boundary. Thevertical thickness of the uppermost layer is 1 m in order torepresent the specified temperature and pressure at landsurface in TOUGH2. Vertical resolution decreases down-ward, with 100 m thick layers throughout most of thedomain (Figure 2b).[17] The left-hand (center of the domain) and right-hand
(outer edge of the domain) boundary conditions are set asinsulating and impermeable in TOUGH2 (Figure 2b). Theupper (land-surface) boundary is maintained at a constanttemperature of 10�C and a pressure of 0.1 MPa to representwater table conditions. The basal boundary has a range ofspecified heat flux (100–250 mW/m2), representing typical
Figure 4. Effects of thermal expansion coefficient (a) after 1 simulation year, (b) 100 simulation years,and (c) 10,000 simulation years.
B02206 HURWITZ ET AL.: DEFORMATION IN LARGE CALDERAS
6 of 16
B02206

background values for Quaternary calderas, and is imper-meable except at the injection point located at the centerof the bottom of the domain. Boundary conditions forBIOT2 include no displacement on the right-hand andbottom boundaries, vertical displacement only on the leftboundary, and a traction-free surface on the upper boundary(Figure 2b).[18] Initial conditions entail a hydrostatic pressure distri-
bution throughout the domain and a linear temperaturedistribution between the fixed temperature upper boundaryand the constant heat flux lower boundary. Numericalexperiments were carried out for 10,000 simulation yearsto examine both short- and long-term deformation patterns.In most simulations parameters remain constant throughoutthe simulation; however, in two experiments the fluidinjection rate or the permeability varied with time.
6. Key Parameters
[19] Because volcano hydrothermal systems are highlyvariable in space and time, the range of plausible values formost simulation parameters is large. Parameters that exhibitlarge variability in nature, or were regarded as highlyuncertain, were the subject of our sensitivity analysis(Table 2). Those parameters which exhibit relatively smallvariability in natural systems were not varied (Table 3).[20] The flux and composition of magmatic volatiles
entering a caldera-hosted hydrothermal system are poorlyconstrained and depend in part on the depth, composition,
and dimensions of the underlyingmagma body [Podladchikovand Wickham, 1994; Hanson, 1996]. In simulations of seriesA (Table 2) we invoke a magmatic fluid flux ranging from200 to 20,000 t/d (0.7 to 73 km3 over the 10,000simulated years) at the base of the domain. The highervalue is equivalent to the flux liberated by the annualcrystallization of 2 � 10�4 km3 of granitic magma contain-ing 5 wt % H2O. These flux are generally larger than thosemodeled in previous studies [Hanson, 1996] but are con-sistent with the range of magmatic CO2 fluxes measured inLong Valley (250 t/d) [Gerlach et al., 1999], Campi Flegrei(1500 t/d) [Chiodini et al., 2001], Taupo (1700 t/d) [Sewardand Kerrick, 1996], and Yellowstone (45,000 t/d) [Wernerand Brantley, 2003]. Magmatic H2O fluxes are poorlyconstrained but are probably at least as large as CO2 fluxes.For instance, in recent episodes of unrest in Campi Flegrei,H2O flux was between 1500 and 3000 t/d, based on CO2
flux measurements and molar H2O/CO2 determinations[Chiodini et al., 2003].[21] In simulations of series B the depth of the injection
source was varied to represent varying depths to the brittle-ductile transition, which is traditionally estimated from themaximum depth of earthquakes within the caldera. Thedepths in several documented cases range from 3 to 8 km[Waite and Smith, 2002; Hill et al., 2003].[22] Permeabilities of igneous rocks are highly heteroge-
neous and range over at least 8 orders of magnitude at thescale of in situ hydraulic testing [Brace, 1984]. This rangeresults largely from the variability of fracture density,
Figure 5. Effects of injection rate (series A in Table 2) on calculated ground surface displacement after(a) 1 simulation year, (b) 100 simulation years, and (c) 1000 simulation years.
B02206 HURWITZ ET AL.: DEFORMATION IN LARGE CALDERAS
7 of 16
B02206

aperture, and geometry, and is also strongly influenced bythe degree of hydrothermal alteration and fracture filling.The range of permeabilities we considered in simulations ofseries C in Table 2 (2 � 10�17 m2 to 1 � 10�13 m2) islimited by the large overpressures that form near theinjection source at low permeabilities and numerical insta-bilities at high permeabilities. Fluid injection into lowpermeability rocks is likely to induce hydrofracturing, butsuch an effect was not incorporated into our model. Therange of permeability values in our simulations is consistentwith a large compilation of permeability measurements ingeothermal fields [Bjorbsson and Bodvarsson, 1990].[23] Direct measurements of permeability anisotropy are
rare, and it is often neglected in numerical models. Calderasoften consist of subparallel layered lava flows and pyro-clastic units, suggesting that, on a large scale, permeabilitymay be greater in the horizontal direction than in the verticaldirection. Subvertical faults may act either as high-permeability conduits or as low-permeability seals thatdisrupt large-scale horizontal flow. In simulations of seriesD (Table 2), the general effects of anisotropic permeabilityare examined by varying the ratio of horizontal (kx) tovertical (kz) permeability.[24] The value of thermal conductivity used in all simu-
lations (Table 3) is an average for the continental crust.The range of heat flow values we invoke in simulations ofseries E (Table 2) is consistent with available data forQuaternary calderas [Lachenbruch et al., 1976; Bibby et al.,1995; Wohletz et al., 1999].
[25] In linear elastic models, deformation of the crustscales inversely with shear (rigidity) modulus; as rigidityincreases, less deformation occurs [Turcotte and Schubert,2002]. Laboratory experiments at high pressures and tem-peratures indicate that the intrinsic shear modulus of crys-talline rocks varies from 0.2 to 50 GPa, depending on rocktype, temperature, pressure, and porosity [Heard and Page,1982]. Large-scale crustal values, on the order of 30 GPa[Turcotte and Schubert, 2002], are commonly invoked fordeformation models. However, several studies have sug-gested that the rigidity of warm volcanic rocks should be aslow as 0.3 GPa [Davis, 1986]. In a majority of oursimulations, the shear modulus was 1 GPa. However, insimulations of series F (Table 2), the effects of shearmodulus values ranging between 1 and 30 GPa wereexamined.[26] Typical values for the thermal expansion coefficient
for saturated rocks at high temperature and pressure rangefrom 5 � 10�6 �C�1 to 15 � 10�6 �C�1, with a strongtemperature dependence and a modest pressure dependence[Wong and Brace, 1979; Heard and Page, 1982; Bauer andHandin, 1983]. We invoke an average value of 10 � 10�6
�C�1 in all simulations (Table 3).
7. Simulation Results
[27] Following the onset of high-temperature fluid injec-tion through the base of the model domain at t = 0, anoverpressured zone with elevated temperature develops near
Figure 6. Effects of injection source depth (series B in Table 2) on calculated ground surfacedisplacement after (a) 1 simulation year, (b) 100 simulation years, and (c) 1000 simulation years.
B02206 HURWITZ ET AL.: DEFORMATION IN LARGE CALDERAS
8 of 16
B02206

the injection point, causing local deformation (Figure 3).With time, the affected volume expands and at later timesan additional overpressure zone develops at shallow depths(<2 km) and deformation is enhanced (Figure 3c).[28] Both, poroelastic response to increased fluid pressure
and thermoelastic rock expansion cause deformation. In orderto isolate the effects of rock thermal expansion, the referencesimulation (Tables 2 and 3) is compared with a simulationwhere the thermal expansion coefficient in BIOT2 is zero.There are no noticeable differences at early times (Figure 4a)and small differences after 100 simulation years (Figure 4b).However, after 10,000 simulation years, the GSD in thesimulation including a nonzero thermal expansion coefficientis greater by a factor of 6 (Figure 4c) because upwardmigration of the thermal plume has caused the rock to expandand enhanced surface uplift.
7.1. Sensitivity Analysis
[29] To assess the sensitivity of the deformation field andGSD to key controlling parameters we examined the effectof a wide range of injection rates and depths, values ofseveral rock properties, and the basal heat flux (Table 2).[30] An order-of-magnitude increase in the injection rate
(series A, Table 2) results in a fivefold increase in the GSD atthe center of the domain after one simulation year (Figure 5a)and more than a factor of 10 after 1000 simulation years(Figure 5c). With higher injection rates the uplift is focusedtoward the center of the domain, whereas at lower injectionrates uplift is more uniform.
[31] Testing the effect of source depth (series B, Table 2),showed that decreasing source depth increased calculatedGSD (Figure 6). The difference in the calculated GSDbetween a source at 7 km and a source at 5 km is smallerthan the calculated GSD between a source at 5 km and asource at 3 km. Some of this difference is due to theincreasing effect of rock thermal expansion as the injectionsource is shallower. Decreasing the depth of the injectionsource also results in a more focused deformation field inthe center of the domain.[32] Varying permeability over almost 5 orders of mag-
nitude (series C, Table 2) yielded a complex pattern ofresponse (Figure 7). After 1 simulation year, uplift in thesimulation with the lowest permeability (2 � 10�17 m2)is less than the uplift with higher permeabilities of 1 �10�15 m2 and 1 � 10�16 m2 (Figure 7a). However, at latertimes, uplift is largerwhen permeabilities are lower (Figures 7band 7c). For permeabilities 1 � 10�14 m2, uplift rates arerelatively small and focused near the center of the domain(Figure 7c, inset). At later times, uplift in the center of thedomain, in the simulation with a permeability of 1� 10�13 m2
is greater than the uplift associated with the simulation with apermeability of 1 � 10�14 m2 (inset in Figure 7c). Thisphenomenon results from the enhanced upward flow of thehot fluid at higher permeabilities, which causes an increase inrock thermal expansion at shallow depths.[33] To assess the effects of permeability anisotropy, we
fixed the horizontal permeability at 1 � 10�15 m2 anddecreased the vertical permeability by 1 and 2 orders of
Figure 7. Effects of permeability (series C in Table 2) on calculated ground surface displacement after(a) 1 simulation year, (b) 100 simulation years, and (c) 1000 simulation years. Inset in Figure 7c shows indetail the displacement for simulations with higher permeability in the inner 5 km of the domain.
B02206 HURWITZ ET AL.: DEFORMATION IN LARGE CALDERAS
9 of 16
B02206

magnitude (series D, Table 2). The increase in anisotropyhad a minor effect after one and ten years (Figures 8aand 8b), but the effect is significant after 1000 simulationyears (Figure 8c). Lateral flow of the high-temperature fluidis enhanced as the anisotropy increases, reducing heatingand rock thermal expansion near the center of the domain.[34] Increasing the basal heat flux to 200 mW/m2 (series E,
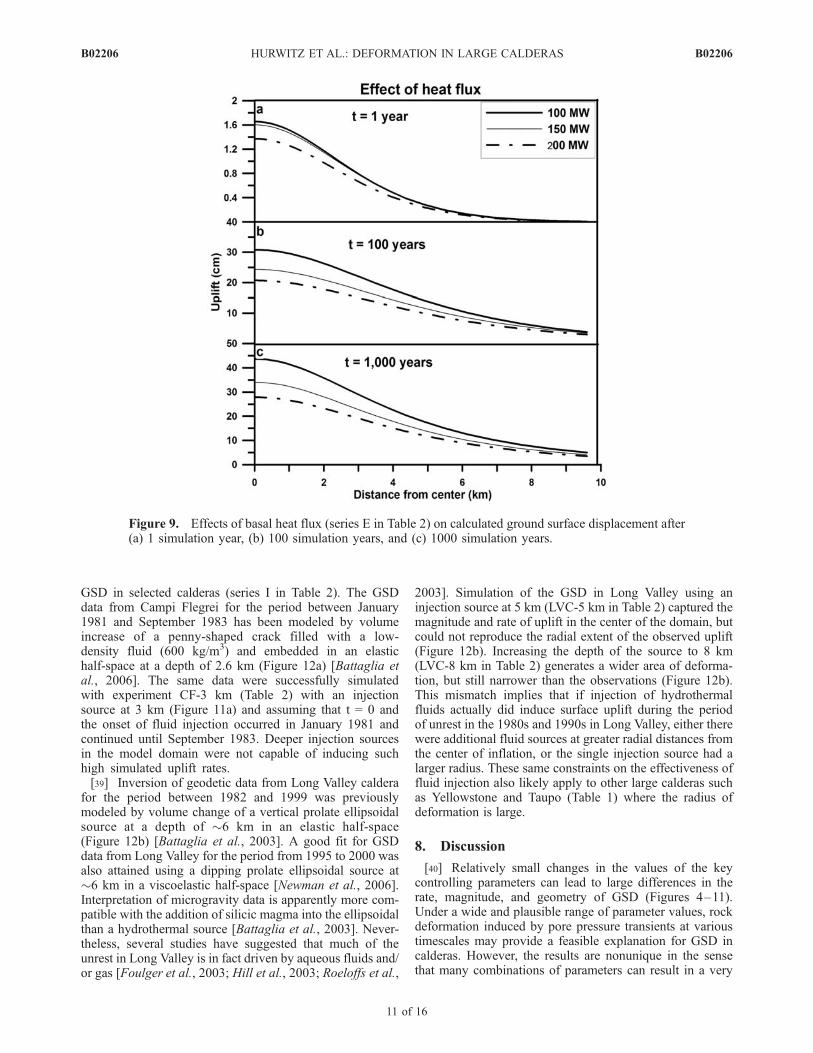
Table 2) slightly decreases GSD rates (Figure 9). Thehigher temperatures at the bottom of the domain reducewater viscosity which, in turn, leads to lower pore fluidpressures and reduced deformation. The magnitude of theeffect is limited by the fact that the thermal state is dominatedby the high-temperature (350�C) fluids at the center of thedomain.[35] The rigidity of the domain has a substantial effect
on GSD. Increased displacements do not scale linearlywith increased shear modulus (Figure 10). For example, a30-fold increase of the shear modulus (series F, Table 2)results in a fivefold increase in GSD at the center of thedomain after one simulation year (Figure 10a) and a 3.5-foldincrease after 1000 simulation years (Figure 10c). Porositychanges within the range tested (series G in Table 2) haveminor effects on the calculated displacements.
7.2. Subsidence
[36] One of the limitations of classic elastic models forcaldera deformation is the lack of a straightforward expla-nation for subsidence. In simulations of series H (Table 2),we applied two different poroelastic subsidence scenarios
based on the conceptual model presented in section 2, usingparameters of the reference simulation (Tables 2 and 3). Inthe first simulation, the injection source varied episodicallyto represent episodic magma degassing (simulation CYCL-INJ in Table 2). Thirty-year on-off cycles (arbitrary value)were continued for a total of 600 simulation years. Wheninjection ceased, subsidence began instantaneously andcontinued gradually over the following 30 years. Uponrenewed injection, gradual uplift occurred for the next30 years (Figure 11a).[37] In the second simulation, permeability was varied
cyclically from 1 � 10�15 m2 to 1 � 10�14 m2, to representhydrofracturing and sealing (simulation CYCL-PERM inTable 2), with 30-year cycles of low and high permeabilitycontinued for 600 simulation years (Figure 11b). Whenpermeability was increased, subsidence also commencedinstantaneously, but in contrast to the variable sourcescenario, the return to near-initial elevation (at t = 0) wasvery rapid (within 1 year, Figure 11b). In the cyclicpermeability experiment net uplift accelerated after about220 simulation years. The accelerated uplift occurred as avapor phase formed accelerating the ascent of the low-density thermal plume to shallow depths where thermalexpansion became significant.
7.3. Comparison With Measured Deformation inCalderas
[38] We carried out a few additional simulationsintended to mimic the major characteristics of observed
Figure 8. Effects of permeability anisotropy (series D in Table 2) on calculated ground surfacedisplacement after (a) 1 simulation year, (b) 100 simulation years, and (c) 1000 simulation years.
B02206 HURWITZ ET AL.: DEFORMATION IN LARGE CALDERAS
10 of 16
B02206
GSD in selected calderas (series I in Table 2). The GSDdata from Campi Flegrei for the period between January1981 and September 1983 has been modeled by volumeincrease of a penny-shaped crack filled with a low-density fluid (600 kg/m3) and embedded in an elastichalf-space at a depth of 2.6 km (Figure 12a) [Battaglia etal., 2006]. The same data were successfully simulatedwith experiment CF-3 km (Table 2) with an injectionsource at 3 km (Figure 11a) and assuming that t = 0 andthe onset of fluid injection occurred in January 1981 andcontinued until September 1983. Deeper injection sourcesin the model domain were not capable of inducing suchhigh simulated uplift rates.[39] Inversion of geodetic data from Long Valley caldera
for the period between 1982 and 1999 was previouslymodeled by volume change of a vertical prolate ellipsoidalsource at a depth of 6 km in an elastic half-space(Figure 12b) [Battaglia et al., 2003]. A good fit for GSDdata from Long Valley for the period from 1995 to 2000 wasalso attained using a dipping prolate ellipsoidal source at6 km in a viscoelastic half-space [Newman et al., 2006].Interpretation of microgravity data is apparently more com-patible with the addition of silicic magma into the ellipsoidalthan a hydrothermal source [Battaglia et al., 2003]. Never-theless, several studies have suggested that much of theunrest in Long Valley is in fact driven by aqueous fluids and/or gas [Foulger et al., 2003; Hill et al., 2003; Roeloffs et al.,
2003]. Simulation of the GSD in Long Valley using aninjection source at 5 km (LVC-5 km in Table 2) captured themagnitude and rate of uplift in the center of the domain, butcould not reproduce the radial extent of the observed uplift(Figure 12b). Increasing the depth of the source to 8 km(LVC-8 km in Table 2) generates a wider area of deforma-tion, but still narrower than the observations (Figure 12b).This mismatch implies that if injection of hydrothermalfluids actually did induce surface uplift during the periodof unrest in the 1980s and 1990s in Long Valley, either therewere additional fluid sources at greater radial distances fromthe center of inflation, or the single injection source had alarger radius. These same constraints on the effectiveness offluid injection also likely apply to other large calderas suchas Yellowstone and Taupo (Table 1) where the radius ofdeformation is large.
8. Discussion
[40] Relatively small changes in the values of the keycontrolling parameters can lead to large differences in therate, magnitude, and geometry of GSD (Figures 4–11).Under a wide and plausible range of parameter values, rockdeformation induced by pore pressure transients at varioustimescales may provide a feasible explanation for GSD incalderas. However, the results are nonunique in the sensethat many combinations of parameters can result in a very
Figure 9. Effects of basal heat flux (series E in Table 2) on calculated ground surface displacement after(a) 1 simulation year, (b) 100 simulation years, and (c) 1000 simulation years.
B02206 HURWITZ ET AL.: DEFORMATION IN LARGE CALDERAS
11 of 16
B02206

similar deformation field. Higher injection rates (Figure 5),shallower injection sources (Figure 6), lower permeabilities(Figure 7), higher permeability anisotropy (Figure 8), lowerbasal heat flux (Figure 9), and lower shear modulus(Figure 10), generally lead to greater deformation and GSD.[41] At annual to decadal timescales, fluid volume in-
crease is the dominant process inducing deformation,whereas over longer times (centennial and millennial) whenhydrothermal upflow has heated larger volumes of crust,rock thermal expansion becomes more significant. Thus, atsome calderas, measured displacement fields could repre-sent a delayed response to magma degassing events thatcommenced long ago.[42] In absence of independent data, it is difficult to
determine whether GSD in calderas is induced by injectionof hydrothermal fluids into the shallow crust or by magmaintrusion. Several lines of indirect evidence suggest that insome cases subsurface volume changes and caldera defor-mation may be associated with the dynamics of a low-viscosity, low-density, gas-rich fluid at shallow depths. Forexample, the occurrence of numerous Holocene hydrother-mal explosion craters in Yellowstone [Muffler et al., 1971]have been associated with episodes of Yellowstone Calderauplift [Pierce et al., 2002], indicating that large water and/orgas pressures are intermittently attained in the shallowsubsurface. In Campi Flegrei, caldera inflation-deflationcycles correlate with CO2/H2O transients in vents, suggest-ing that CO2 pressures are high during inflation periods[Chiodini et al., 2003]. The 45 ± 16 kt/d of diffuse
magmatic CO2 flux emitted from the Yellowstone volcanicsystem [Werner and Brantley, 2003] cannot be sustained bydiscrete episodes of basalt intrusion into the upper crust(<0.03 km3/yr) during periods of inflation [Dzurisin et al.,1994; Wicks et al., 1998], suggesting that perhaps also inYellowstone some of the deformation is associated with thedynamics of CO2 in the hydrothermal system. The involve-ment of gas-rich fluids in the deformation of the Yellow-stone caldera may be inferred by the abrupt change fromuplift to subsidence in 1985 and from subsidence to uplift in1995, which in each instance were followed by largeearthquake swarms migrating away from the caldera atrapid rates [Waite and Smith, 2002].[43] Recent developments in satellite-based geodetic
techniques will likely enable better spatial and temporalresolution of GSD in calderas and thus potentially providebetter constraints on subsurface fluid dynamics. Continu-ous, high-precision microgravity measurements may dis-criminate between magma intrusion and hydrothermalinjection at shallow depths, because the density of magmadiffers by a factor of 3 or more from the density ofsuperheated vapor or gas [Rymer, 1994; Gottsmann andRymer, 2002; de Zeeuw-van Dalfsen et al., 2005]. Combin-ing such geodetic and microgravity data with quantitativedynamic models should provide insight into the nature ofthe fluid inducing deformation.[44] A more direct way to detect water pressure transients
in the shallow subsurface of calderas is through continuousand precise pressure measurements in deep drillholes.
Figure 10. Effects of shear modulus (series F in Table 2) on calculated ground surface displacementafter (a) 1 simulation year, (b) 100 simulation years, and (c) 1000 simulation years.
B02206 HURWITZ ET AL.: DEFORMATION IN LARGE CALDERAS
12 of 16
B02206

However, in many calderas there are no deep wells and inothers, such as Taupo and Long Valley, geothermal produc-tion introduces large human-induced noise into the data.[45] For the sake of simplicity, this study focused on
simulations of poroelastic deformation induced by liquidgroundwater flow. Future studies will consider the effects ofmultiphase and multicomponent H2O-CO2-NaCl subsurfacefluid flow. The assumption of ‘‘one-way coupling’’ in thisstudy does limit the general applicability of the simulationresults. To implement a fully coupled simulation, it isnecessary to consider the interaction between stress change,pressure, and permeability. We partially examined the effectof stress change on pressure (assuming permeability is notaffected) by solving the fully coupled Biot equations undersingle phase, saturated isothermal conditions. For the fluidinjection scenarios considered in this paper, we found thatthe one-way coupling simulation differed from the fullycoupled simulation by less than 10%. By contrast, theeffects of permeability change can be drastic. Our simula-tion of cyclically varying permeability (CYCL-PERM) is acrude attempt to illustrate the effects of permeability changewithout explicitly coupling the permeability change topressure change. This type of coupling deserves a morerigorous treatment in future studies.[46] The feasibility of large GSD resulting from aqueous
fluid overpressure, as demonstrated in this study, suggests
that such phenomena should be considered in hazard assess-ments of active calderas. The consequences resulting fromlarge groundwater overpressures may be very different fromthose of magma ascent into the shallow crust. For example,large aqueous overpressures might result in hydrothermalexplosions, whereas magma ascent into the shallow crustmight signal an impeding volcanic eruption.
9. Conclusions
[47] We conducted numerical simulations of hydrother-mal fluid flow and associated ground surface displacement(GSD) in calderas. Simulation results reveal the following:[48] 1. Small changes in the values of key controlling
parameters, particularly permeability and its anisotropy, theinjection rate and depth, and the shear modulus may lead tolarge differences in the rate, magnitude, and geometry ofGSD.[49] 2. Subsidence was simulated successfully both by
terminating the injection of hot fluid into the model domainand by increasing the permeability after uplift occurred.Subsidence was more abrupt in the case of a permeabilityincrease.[50] 3. The major patterns of ground surface uplift in
Campi Flegrei were effectively mimicked by the simula-
Figure 11. Effects of cyclic variations in permeability and injection rate on calculated GSD andinflation-deflation cycles (a) results from 600 simulation years. (b) Shaded area in Figure 11a shown ingreater detail. Shaded areas represent periods of no injection or increased permeability.
B02206 HURWITZ ET AL.: DEFORMATION IN LARGE CALDERAS
13 of 16
B02206

tions, but only some of uplift characteristics in Long Valleywere reproduced.[51] 4. On the basis of the numerical experiments, and a
growing number of observations which indicate a causallink between GSD and dynamics of hydrothermal fluidsand/or gases, we propose that future studies should focus onresolving the nature of the fluid causing GSD (e.g., magmaor aqueous fluid and gas).
[52] Acknowledgments. Funding for this research came from theU.S. Geological Survey Volcano Hazards Program. L. B. Christiansenwas funded by an associateship from the National Research Council. Wethank Maurizio Battaglia for providing the Long Valley and Campi Flegreidata and simulation results. Sebastian Geiger, Mark Reid, Martin Saar,Ward Sanford and Wayne Thatcher are thanked for constructive reviews.
ReferencesArchbold, M. J., C. O. McKee, B. Talai, J. Mori, and P. de Saint Ours(1988), Electronic distance measuring network monitoring during theRabaul seismicity-deformational crisis of 1983– 1985, J. Geophys.Res., 93, 12,123–12,136.
Battaglia, M., P. Segall, and C. Roberts (2003), The mechanics of unrest atLong Valley caldera, California: 2. Constraining the nature of the source
using geodetic and micro-gravity data, J. Volcanol. Geotherm. Res., 127,219–245.
Battaglia, M., C. Troise, F. Obrizzo, F. Pingue, and G. De Natale (2006),Evidence for fluid migration as the source of deformation at CampiFlegrei caldera (Italy), Geophys. Res. Lett., 33, L01307, doi:10.1029/2005GL024904.
Bauer, S. J., and J. Handin (1983), Thermal expansion and cracking of threeconfined, water-saturated igneous rocks to 800�C, Rock Mech. RockEng., 16, 181–198.
Beauducel, F., G. De Natale, F. Obrizzo, and F. Pingue (2004), 3-D model-ling of Campi Flegrei ground deformations: Role of caldera boundarydiscontinuities, Pure Appl. Geophys., 161, 1329–1344.
Bibby, H. M., T. G. Caldwell, F. J. Davey, and T. H. Webb (1995), Geo-physical evidence on the structure of the Taupo Volcanic Zone and itshydrothermal circulation, J. Volcanol. Geotherm. Res., 68, 29–58.
Bjorbsson, G., and G. Bodvarsson (1990), A survey of geothermal reservoirproperties, Geothermics, 19, 17–27.
Bonafede, M. (1991), Hot fluid migration: An efficient source of grounddeformation: Application to the 1982–1985 crisis at Campi Flegrei, Italy,J. Volcanol. Geotherm. Res., 48, 187–198.
Bonafede, M., M. Dragoni, and F. Quareni (1986), Displacement and stressfields produced by a centre of dilation and by a pressure source in aviscoelastic half-space: Application to the study of ground deformationand seismic activity at Campi Flegrei, Italy, Geophys. J. R. Astron. Soc.,87, 455–485.
Brace, W. F. (1984), Permeability of crystalline rocks: New in situ measure-ments, J. Geophys. Res., 89, 4327–4330.
Figure 12. (a) Observed Campi Flegrei vertical ground surface displacements (circles) with twostandard deviation error bars, calculated displacements from an elastic half-space model (dashed line)[Battaglia et al., 2006], and results of simulation CF-3 km (2.5 simulation years) from this study (solidcurve) and (b) observed Long Valley GSD (circles) with two standard deviation error bars, calculateddisplacements from an elastic half-space model (dashed line) [Battaglia et al., 2003], and results ofsimulation LVC-5 km (solid curve) and LVC-8 km (dash-dotted curve), simulating 17 years ofdeformation. Simulation parameters are listed in Table 2.
B02206 HURWITZ ET AL.: DEFORMATION IN LARGE CALDERAS
14 of 16
B02206

Chiodini, G., F. Frondini, C. Cardellini, D. Granieri, L. Marini, andG. Ventura (2001), CO2 degassing and energy release at Solfatara volcano,Campi Flegrei, Italy, J. Geophys. Res., 106, 16,213–16,221.
Chiodini, G., M. Todesco, S. Caliro, C. Del Gaudio, G. Macedonio, andM. Russo (2003), Magma degassing as a trigger of bradyseismic events:The case of Phlegrean Fields (Italy), Geophys. Res. Lett., 30(8), 1434,doi:10.1029/2002GL016790.
Christensen, N. I. (1996), Poisson’s ratio and crustal seismology, J. Geo-phys. Res., 101, 3139–3156.
Davis, P. M. (1986), Surface deformation due to inflation of an arbitrarilyoriented triaxial ellipsoidal cavity in an elastic half-space, with referenceto Kilauea Volcano, Hawaii, J. Geophys. Res., 91, 7429–7438.
De Natale, G., C. Troise, and F. Pingue (2001), A mechanical fluid-dynamical model for ground movements at Campi Flegrei caldera,J. Geodyn., 32, 487–517.
de Zeeuw-van Dalfsen, E., H. Rymer, F. Sigmundsson, and E. Sturkell(2005), Net gravity decrease at Askja volcano, Iceland: Constraints onprocesses responsible for continuous caldera deflation, 1988–2003,J. Volcanol. Geotherm. Res., 139, 227–239.
Dvorak, J. J., and D. Dzurisin (1997), Volcano geodesy: The search formagma reservoirs and the formation of eruptive vents, Rev. Geophys., 35,343–384.
Dzurisin, D. (2003), A comprehensive approach to monitoring volcanodeformation as a window on the eruption cycle, Rev. Geophys., 41(1),1001, doi:10.1029/2001RG000107.
Dzurisin, D., J. C. Savage, and R. O. Fournier (1990), Recent crustalsubsidence at Yellowstone Caldera, Wyoming, Bull. Volcanol., 52,247–270.
Dzurisin, D., K. M. Yamashita, and J. W. Kleinman (1994), Mechanisms ofcrustal uplift and subsidence at the Yellowstone Caldera, Wyoming, Bull.Volcanol., 56, 261–270.
Dzurisin, D., C. Wicks, and W. Thatcher (1999), Renewed uplift at theYellowstone Caldera measured by leveling surveys and satellite radarinterferometry, Bull. Volcanol., 61, 349–355.
Fialko, Y., Y. Khazan, and M. Simons (2001), Deformation due to a pres-surized horizontal circular crack in an elastic half-space, with applicationsto volcano geodesy, Geophys. J. Int., 146, 181–190.
Foulger, G. R., B. R. Julian, A. M. Pitt, D. P. Hill, P. E. Malin, andE. Shalev (2003), Three-dimensional crustal structure of Long Valleycaldera, California, and evidence for the migration of CO2 underMammoth Mountain, J. Geophys. Res., 108(B3), 2147, doi:10.1029/2000JB000041.
Fournier, R. O. (1999), Hydrothermal processes related to movement offluid from plastic into brittle rock in the magmatic-epithermal environ-ment, Econ. Geol., 94, 1193–1211.
Gerlach, T. M., M. P. Doukas, K. A. McGee, and R. Kessler (1999),Airborne detection of diffuse carbon dioxide emissions at MammothMountain, California, Geophys. Res. Lett., 26, 3661–3664.
Gottsmann, J., and H. Rymer (2002), Deflation during caldera unrest:Constraints on subsurface processes and hazard prediction from gravity-height data, Bull. Volcanol., 64, 338–348.
Hanson, R. B. (1996), Hydrodynamics of magmatic and meteoric fluids inthe vicinity of granitic intrusions, Spec. Pap. Geol. Soc. Am., 315, 251–259.
Heard, H. C., and L. Page (1982), Elastic moduli, thermal expansion, andinferred permeability of two granites to 350�C and 55 megapascals,J. Geophys. Res., 87, 9340–9348.
Hill, D. P., J. O. Langbein, and S. Prejean (2003), Relations betweenseismicity and deformation during unrest in Long Valley Caldera,California, from 1995 through 1999, J. Volcanol. Geotherm. Res., 127,175–193.
Hsieh, P. A. (1996), Deformation-induced changes in hydraulic head duringground-water withdrawal, Ground Water, 34, 1082–1089.
Hurwitz, S., S. E. Ingebritsen, and M. L. Sorey (2002), Episodic thermalperturbations associated with groundwater flow: An example fromKilauea Volcano, Hawaii, J. Geophys. Res., 107(B11), 2297,doi:10.1029/2001JB001654.
Hurwitz, S., K. L. Kipp, S. E. Ingebritsen, and M. E. Reid (2003), Ground-water flow, heat transport, and water table position within volcanicedifices: Implications for volcanic processes in the Cascade Range,J. Geophys. Res., 108(B12), 2557, doi:10.1029/2003JB002565.
Kwoun, O. I., Z. Lu, C. Neal, and C. Wicks Jr. (2006), Quiescent deforma-tion of the Aniakchak Caldera, Alaska mapped by InSAR, Geology, 34,5–8.
Lachenbruch, A. H., J. H. Sass, R. J. Munroe, and T. H. Moses Jr. (1976),Geothermal setting and simple heat conduction models for the LongValley Caldera, J. Geophys. Res., 81, 769–784.
Langbein, J. O. (2003), Deformation of the Long Valley Caldera, California:Inferences from measurements from 1988 to 2001, J. Volcanol. Geotherm.Res., 127, 247–267.
Lipman, P. W. (1984), The roots of ash flow calderas in western NorthAmerica: Windows into the tops of granitic batholiths, J. Geophys. Res.,89, 8801–8841.
Lipman, P. W. (1997), Subsidence of ash-flow calderas: Relation to calderasize and magma-chamber geometry, Bull. Volcanol., 59, 198–218.
Lipman, P. W. (2000), Calderas, in Encyclopedia of Volcanoes, edited byH. Sigurdsson et al., pp. 643–662, Elsevier, New York.
Manning, C. E., and S. E. Ingebritsen (1999), Permeability of the conti-nental crust: Implications of geothermal data and metamorphic systems,Rev. Geophys., 37, 127–150.
McKee, C. O., P. L. Lowenstein, P. D. S. Ours, B. Talai, I. Itikarai, and J. J.Mori (1984), Seismic and ground deformation crisis at Rabaul Caldera:Prelude to an eruption?, Bull. Volcanol., 47, 397–411.
Mogi, K. (1958), Relations of the eruptions of various volcanoes and thedeformation of ground surfaces around them, Bull. Earthquake Res. Inst.Tokyo Univ., 36, 94–134.
Morhange, C., N. Marriner, J. Laborel, M. Todesco, and C. Oberlin (2006),Rapid sea-level movements and noneruptive crustal deformations in thePhlegrean Fields caldera, Italy, Geology, 34, 93–96.
Muffler, L. J. P., D. E. White, and A. H. Truesdell (1971), Hydrothermalexplosion craters in Yellowstone National Park, Geol. Soc. Am. Bull., 82,723–740.
Newhall, C. G., and D. Dzurisin (1988), Historical unrest at large calderasof the world, U.S. Geol. Surv. Bull., 1855, 1108 pp.
Newhall, C. G., H. Cheng, and R. L. Edwards (1998), New estimates ofuplift rates of Iwo-Jima, Japan, Eos Trans. AGU, 79(45), Fall Meet.Suppl., F950.
Newman, A. V., T. H. Dixon, G. I. Ofoegbu, and J. E. Dixon (2001),Geodetic and seismic constraints on recent activity at Long Valley Cal-dera, California: Evidence for viscoelastic rheology, J. Volcanol.Geotherm. Res., 105, 183–206.
Newman, A. V., T. H. Dixon, and N. Gourmelen (2006), A four-dimensional viscoelastic deformation model for Long Valley Caldera,California, between 1995 and 2000, J. Volcanol. Geotherm. Res., 150,244–269.
Orsi, G., L. Civetta, C. Del Gaudio, S. De Vita, M. A. Di Vito, R. Isaia,S. M. Petrazzuoli, G. P. Ricciardi, and C. Ricco (1999), Short-termground deformations and seismicity in the resurgent Campi Flegreicaldera (Italy): An example of active block-resurgence in a denselypopulated area, J. Volcanol. Geotherm. Res., 91, 415–451.
Otway, P. M., G. H. Blick, and B. J. Scott (2002), Vertical deformationat Lake Taupo, New Zealand, from lake levelling surveys, 1979–99,N. Z. J. Geol. Geophys., 45, 121–132.
Pelton, J. R., and R. B. Smith (1979), Recent crustal uplift in YellowstoneNational Park, Science, 206, 1179–1182.
Pierce, K. L., K. P. Cannon, G. A. Meyer, M. J. Trebesch, and R. Watts(2002), Post-glacial inflation-deflation cycles, tilting, and faulting in theYellowstone Caldera based on Yellowstone lake shorelines, U.S. Geol.Surv. Open File Rep., 02-0142, 62 pp.
Podladchikov, Y. Y., and S. M. Wickham (1994), Crystallization of hydrousmagmas: Calculation of associated thermal effects, volatile fluxes, andisotopic alteration, J. Geol., 102, 25–45.
Poland, M., M. Hamburger, and A. Newman (2006), The changing shapesof active volcanoes: History, evolution, and future challenges for volcanogeodesy, J. Volcanol. Geotherm. Res., 150, 1–13.
Pritchard, M. E., and M. Simons (2002), A satellite geodetic survey oflarge-scale deformation of volcanic centres in the central Andes, Nature,418, 167–171.
Pruess, K., C. Oldenburg, and G. Moridis (1999), TOUGH2 user’s guide,version 2.0, Paper LBNL-43134, Lawrence Berkeley Natl. Lab.,Berkeley, Calif.
Reid, M. E. (2004), Massive collapse of volcano edifices triggered byhydrothermal pressurization, Geology, 32, 373–376.
Roeloffs, E., M. Sneed, D. L. Galloway, M. L. Sorey, C. D. Farrar, J. F.Howle, and J. Huges (2003), Water-level changes induced by local anddistant earthquakes at Long Valley caldera, California, J. Volcanol.Geotherm. Res., 127, 269–303.
Rymer, H. (1994), Microgravity change as a precursor to volcanic activity,J. Volcanol. Geotherm. Res., 61, 311–328.
Saar, M. O., and M. Manga (2004), Depth dependence of permeability inthe Oregon Cascades inferred from hydrogeologic, thermal, seismic, andmagmatic modeling constraints, J. Geophys. Res., 109, B04204,doi:10.1029/2003JB002855.
Seward, T. M., and D. M. Kerrick (1996), Hydrothermal CO2 emissionfrom the Taupo Volcanic Zone, New Zealand, Earth Planet. Sci. Lett.,139, 105–113.
Todesco, M., J. Rutqvist, G. Chiodini, K. Pruess, and C. M. Oldenburg(2004), Modeling of recent volcanic episodes at Phlegrean Fields (Italy):Geochemical variations and ground deformation, Geothermics, 33, 531–547.
B02206 HURWITZ ET AL.: DEFORMATION IN LARGE CALDERAS
15 of 16
B02206

Turcotte, D. L., and G. Schubert (2002), Geodynamics, 2nd ed., 472 pp.,Cambridge Univ. Press, New York.
Ukawa, M., E. Fujita, H. Ueda, T. Kumagai, H. Nakajima, and H. Morita(2006), Long-term geodetic measurements of large scale deformation atIwo-jima caldera, Japan, J. Volcanol. Geotherm. Res., 150, 98–118.
Vasco, D. W., L. R. Johnson, and N. E. Goldstein (1988), Using surfacedisplacement and strain observations to determine deformation at depth,with an application to Long Valley caldera, California, J. Geophys. Res.,93, 3232–3242.
Waite, G. P., and R. B. Smith (2002), Seismic evidence for fluid migrationaccompanying subsidence of the Yellowstone caldera, J. Geophys. Res.,107(B9), 2177, doi:10.1029/2001JB000586.
Walsh, J. B., and R. W. Decker (1971), Surface deformation associated withvolcanism, J. Geophys. Res., 76, 3291–3302.
Werner, C., and S. Brantley (2003), CO2 emissions from the Yellowstonevolcanic system, Geochem. Geophys. Geosyst., 4(7), 1061, doi:10.1029/2002GC000473.
Wicks, C., W. Thatcher, and D. Dzurisin (1998), Migration of fluids be-neath Yellowstone Caldera inferred from satellite radar interferometry,Science, 282, 458–462.
Wicks, C. W., W. Thatcher, D. Dzurisin, and J. Svarc (2006), Uplift, ther-mal unrest and magma intrusion at Yellowstone Caldera, Nature, 440,72–75.
Wohletz, K., L. Civetta, and G. Orsi (1999), Thermal evolution of thePhlegraean magmatic system, J. Volcanol. Geotherm. Res., 91, 381–414.
Wong, T. F., and W. F. Brace (1979), Thermal expansion of rocks: Somemeasurements at high pressure, Tectonophysics, 57, 95–117.
Yang, X. M., P. M. Davis, and J. H. Dieterich (1988), Deformation frominflation of a dipping finite prolate spheroid in an elastic half-space as amodel for volcanic stressing, J. Geophys. Res., 93, 4249–4257.
�����������������������L. B. Christiansen, P. A. Hsieh, and S. Hurwitz, U.S. Geological Survey,
345 Middlefield Road, MS 439, Menlo Park, CA 94025, USA.([email protected])
B02206 HURWITZ ET AL.: DEFORMATION IN LARGE CALDERAS
16 of 16
B02206