Embed Size (px)
Citation preview

Andean Geology 42 (3): 166-196. May, 2016doi: 10.5027/andgeoV43n2-a02
Andean Geologywww.andeangeology.cl
Hydrothermal alteration, fumarolic deposits and fluids from Lastarria Volcanic Complex: A multidisciplinary study
*Felipe Aguilera1, Susana Layana2, Augusto Rodríguez-Díaz3, Cristóbal González2, Julio Cortés4, Manuel Inostroza2
1 Departamento de Ciencias Geológicas, Universidad Católica del Norte, Avda. Angamos 0610, Antofagasta, Chile. [email protected] Programa de Doctorado en Ciencias mención Geología, Universidad Católica del Norte, Avda. Angamos 0610, Antofagasta, Chile. [email protected]; [email protected]; [email protected] Instituto de Geofísica, Universidad Nacional Autónoma de México, Ciudad Universitaria, Delegación Coyoacán, 04150 México
D.F., México. [email protected] Consultor Independiente, Las Docas 4420, La Serena, Chile. [email protected]
* Corresponding Author: [email protected]
ABSTRACT. A multidisciplinary study that includes processing of Landsat ETM+ satellite images, chemistry of gas condensed, mineralogy and chemistry of fumarolic deposits, and fluid inclusion data from native sulphur deposits, has been carried out in the Lastarria Volcanic Complex (LVC) with the objective to determine the distribution and charac-teristics of hydrothermal alteration zones and to establish the relations between gas chemistry and fumarolic deposits. Satellite image processing shows the presence of four hydrothermal alteration zones, characterized by a mineral assem-blage constituted mainly by clay minerals, alunite, iron oxides, and more subordinated ferrous minerals and goethite. Hydrothermal alteration zones present in the Lastarria sensu stricto volcano are directly related to the recent fumarolic activity. Geochemistry of fumarolic gas condensed, obtained from two fumaroles at temperatures between 328 and 320 °C, has allowed detecting 37 diverse elements corresponding to halogens, chalcophiles, siderophiles, alkali metals, alkali earth metals and Rare Earth Elements (REE), with concentrations that vary widely between 5,620 ppm (chlorine) and 0.01 ppm (Mo, Ag, Sn, Pb, Se, Mg and Cr). Logarithm of Enrichment Factor (log EFi) for each element present values between 6.35 (iodine) and <1 (K, Na, Ca, Fe and Al). Those elements are originated primarily from a magmatic source, whereas at shallow level a hydrothermal source contributes typical rock-related elements, which are leached from the wall rock by a strong interaction with hyperacid fluids. Mostly of elements detected are transported to the surface in the fumarolic emissions as gaseous species, while very few elements (Mg, Ca and Al) are transported in silicate aerosols. A wide spectrum of minerals are present in the fumarolic deposits, which are constituted by sublimates and incrustations, and the main minerals phases are distributed in six mineral families, corresponding to sulphates, hydrated sulphates, sulphides, halides, carbonates, silicates and native element minerals. The sublimate/incrustation minerals are dominated by the presence of sulphate, sulphur, chlorine and diverse rock-related elements, which are formed by processes that include a. oxidation of gaseous phase; b. strong rock-fluid interaction; c. dissolution of silicate minerals and volcanic glass; d. gas-water interaction; e. deposition/precipitation of saline bearing minerals; f. oxidation of sublimates/incrusta-tions to form secondary minerals and g. remobilization of sulphur deposits by meteoric water. Despite that sublimate/incrustation minerals are dominated by rock-related elements, its chemistry shows high contents of high-volatile elements as As, Sb, Cd, among others. Fluid inclusions studies carried out in thin pseudobanded native sulphur from fumarolic deposits, by use of Raman and infrared spectroscopy combined with microthermometry analyses, provided evidence of H2O, CO2, H2S, SO4, COS bearing fluids, homogenization temperatures around 110 °C and salinities varying from ~11 to ~7 wt% NaCl. Fluid inclusions data show also evidences of a mixing (dilution) between hot and saline fluid with a cooler fluid (cold groundwater or a steam-heated water) as the main process.
Keywords: Satellite image processing, Gas condensate, Sublimate/incrustation minerals, Fluid inclusions, Geochemistry, Lastarria Volcanic Complex.

167Aguilera et al. / Andean Geology 43 (2): 166-196, 2016
RESUMEN. Alteración hidrotermal, depósitos fumarólicos y fluidos del Complejo Volcánico Lastarria: Un estudio multidsciplinario. Un estudio multidisciplinario que incluye el procesamiento de imágenes satelitales Landsat ETM+, geoquímica de gas condensado, mineralogía y química de depósitos fumarólicos y datos de inclusiones fluidas en azufre nativo, ha sido llevado a cabo en el Complejo Volcánico Lastarria con el objetivo de determinar la distribución y características de las zonas de alteración hidrotermal y establecer las relaciones existentes entre la química de la fase gaseosa y los depósitos fumarólicos. El procesamiento de imágenes satelitales muestra la presencia de cuatro zonas de alteración hidrotermal, caracterizadas por una asociación mineralógica constituida principalmente por minerales de arcilla, alunita, óxidos de hierro, y de forma más subordinada, minerales ferrosos y goethita. Las zonas de alteración hidrotermal presentes en el volcán Lastarria sensu stricto están directamente relacionadas con la actividad fumarólica reciente. La geoquímica del gas fumarólico condensado, obtenida desde dos fumarolas a temperaturas entre 328 y 320 ºC, ha permitido detectar 37 elementos, correspondientes a halógenos, calcófilos, siderófilos, metales alcalinos, metales alcalino térreos y tierras raras, con concentraciones que varían ampliamente entre 5.620 ppm (cloro) y 0,01 ppm (Mo, Ag, Sn, Pb, Se, Mg y Cr). El logaritmo del factor de enriquecimiento (log EFi ) para cada elemento presenta valores entre 6,35 (yodo) y <1 (K, Na, Ca, Fe y Al). Estos elementos han sido originados primariamente desde una fuente magmática, mientras que a niveles someros una fuente de tipo hidrotermal contribuye con elementos típicamente relacionados con rocas, los que son lixiviados desde la roca de caja por una fuerte interacción con fluidos hiperácidos. La mayoría de los elementos detectados son llevados a la superficie en las emisiones fumarólicas como especies gaseosas, mientras muy pocos elementos (Mg, Ca y Al) son transportados en aerosoles de composición silicatada. Una gran gama de minerales están presentes en los depósitos fumarólicos, los que están constituidos por sublimados e incrustaciones, y las principales fases mineralógicas están distribuidas en seis familias de minerales, correspondiente a sulfatos, sulfatos hidratados, haluros, carbonatos, silicatos y minerales de elementos nativos. Los minerales sublimados e incrustaciones están dominados por la presencia de sulfato, azufre, cloro y diversos elementos típicamente presentes en rocas, los que son formados por procesos que incluyen la a. oxidación de fase gaseosa; b. fuerte interacción roca-fluido; c. disolución de minerales silicatados y vidrio volcánico; d. interacción gas-agua; e. depositación/precipitación de minerales salinos; f. oxidación de sublimados/incrustaciones para la formación de minerales secundarios y g. removilización de depósitos de azufre por agua meteórica. A pesar de que los sublimados/incrustaciones están dominados por elementos relacionados con rocas, la geoquímica de estos depósitos muestra altos contenidos de elementos altamente volátiles tales como el As, Sb, Cd, entre otros. Estudios de inclusiones fluidas llevadas a cabo en azufre nativo pseudobandeado proveniente de depósitos fumarólicos, mediante el uso de Raman y espectroscopía infrarroja combinado con análisis microtermométricos, han evidenciado la presencia de fluidos dominados por H2O, CO2, H2S, SO4, COS, temperaturas de homogeneización de unos 110 ºC y salinidades que varían desde ~11 a ~7 wt% NaCl. Los datos de inclusiones fluidas también muestran evidencias de mezcla (dilución) entre un fluido salino y caliente con un fluido más frío (agua subterránea fría o agua vapor-calentada) como proceso principal.
Palabras clave: Procesamiento de imágenes satelitales, Gas condensado, Minerales sublimados/incrustaciones, Inclusiones fluidas, geoquímica, Complejo Volcánico Lastarria.
1. Introduction
The global comprehension of the fluids circulation in an active volcanic system allows determining the origin, nature and evolution of those fluids, where is especially important to detect and understand the different processes involved in the evolution of fluids from its deep original sources to the surface. Some of those processes include gas-rock, gas-water, gas-gas and gas-atmosphere interaction, condensation and sublimation of the gaseous phase, which play fundamental roles in the gaseous phase composi-tion emitted to the surface, but also in the products associated, like composition and extension of the hydrothermal alteration zones, mineralogical assem-blage related to fumarolic deposits, among others. Diverse works have been focused in a. to relate the
fluids composition with its evolutive pattern (e.g., Giggenbach, 1991, 1996, 1997); b. composition of gaseous phase condensed (e.g., Taran et al., 1995); c. composition of fumarolic deposits and sublimates (e.g., Africano and Bernard, 2000); d. relation between gaseous phase-condensates composition and sublimate mineral assemblage (e.g., Taran et al., 2001; Zelenski et al., 2013); e. distribution and composition of hydrothermal alteration both direct and remote techniques (e.g., Mia and Fujimitsu, 2012), and f. the relations between fluids composition and composition-distribution of the hydrothermal alteration (e.g., Africano and Bernard, 2000; Scher, 2012). To relate adequately and precisely fluids and its products (e.g., fumarolic deposits, hydrothermal alteration) a detailed study based on fluid compo-sition (gas and condensed phases composition),

168 HydrotHermal alteration, fumarolic deposits and fluids from lastarria Volcanic complex...
sublimated and condensed mineral assemblage, and hydrothermal alteration composition-distribution has to be carried out.
One of the active volcanic systems which pres-ent active fumarolic emissions, abundant fumarolic deposits and extensive hydrothermal alteration zones is the Lastarria Volcanic Complex (LVC), located in the southern portion of Central Andes, in the border between Chile and Argentina (Fig. 1). LVC (25.185º S-68.507º W, 5,706 m a.s.l.) is a polygenetic complex constituted by three volcanic structures corresponding to (Fig. 1; Naranjo, 1992, 2010): a. Negriales lava field, located in the SW portion of the complex and constituted by a succession of lava flows emitted from a single eruptive centre; b. Espolón Sur (or Southern Spur), a stratovolcano located in the SSW portion of the complex and oriented in a NS trend; c. Lastarria sensu stricto (Lastarria ss), is the main volcanic edifice and actu-ally active, which is linked in its southern flank with the Espolón Sur at ~5,500 m. Lastarria ss hosts four fumarolic fields (Fig. 2a, b), which present active fumarolic vents and extensive fumarolic deposits, mainly constituted by native sulphur (Naranjo, 1985,
1988). Fumarolic fluids are emitted from different types of vents, which correspond to: a. fractures (~1×0.5 cm; Fig. 2c); b. chimneys-like (15 cm high and 7 cm in diameter); c. cone-like vents so called “hornitos” (up to 2 m diameter; Fig. 2c); d. funnel-like vents (up to 2.5 m diameter) (Naranjo, 1985; 1988; Aguilera, 2008). All those vents present abundant yellow, orange, red and black sulphur deposits, related to sublimation and solidification from liquid sulphur flows and pools (Fig. 2e, f; Naranjo, 1985, 1988; Aguilera, 2008). Extensive sulphur flows have been observed from fumarolic fields 1 and 3 (Fig. 2g), characterized by a maximum length of ~350 m, and a ropy morphology type “pahoehoe” (Naranjo, 1985, 1988). LVC has been affected by an extensive ground deformation, which covers an area of ~45×37 km, including also the totally of the Cordón del Azufre volcanic complex, located im-mediately at south of LVC. Maximum inflation rate has been calculated in ~2.5 cm/yr and related to at least five probably processes, four of them developed in an over-pressured magmatic reservoir: a. magma injection; b. thermal expansion due to assimilation of wall rock; c. thermally induced volatile expansion
FIG. 1. Left image: Schematic map of the Central Volcanic Zone (CVZ) and location of Lastarria Volcanic Complex. Right image: Landsat ETM+ image in combination 742 (RGB) showing the location of the volcanic structures that constitute the LVC. The red star shows the location of sampling sites.

169Aguilera et al. / Andean Geology 43 (2): 166-196, 2016
FIG. 2 a. Schematic map of the Lastarria ss, main fumarolic fields and location of the sampling sites. Down open triangle: fumarole with Tmeas ≤96 °C; open circle: fumarole with Tmeas ≥120 °C; b. Panoramic photo of the northern side of Lastarria ss including the location of the four fumarolic fields; c. Fumarolic emission related to a fracture; d. Typical “hornitos” fumarolic emissions; e. Pale yellow to orange sulphur deposits; f. Yellow, red and grey sulphur deposits; g. Sulphur flows and its pahoehoe structures.

170 HydrotHermal alteration, fumarolic deposits and fluids from lastarria Volcanic complex...
produced by fractional crystallization; d. lateral expansion due to the intrusion of a sill-like mag-matic body (Pritchard and Simons, 2004; Froger et al., 2007; Ruch et al., 2008; Anderssohn et al., 2009); e. a fifth hypothesis is related to a pulse of heat from the magmatic system on an overlying hydrothermal aquifer without changes in magma reservoir volume (Froger et al., 2007). Additionally, a limited ground deformation (~9 mm/yr) affects an area of 6 km2, and has been related to an over-pressured source (e.g., hydrothermal aquifer) lying 1,000 m below Lastarria ss edifice (Bonvalot et al., 2006; Froger et al., 2007).
Diverse studies have been carried out in the LVC related with fumarolic fluids geochemistry (Aguilera et al., 2008, 2009, 2012), magmatic volatiles (Rodríguez et al., 2013), rock geochemistry (Naranjo, 1992, 2010; Trumbull et al., 1999), eruptive products (Naranjo, 1992, 2010), and sulphur deposits and flows (Naranjo, 1985, 1988). However, very few information exist about the mineralogy related to fumarolic deposits and characteristics of the alteration zones. In this work we present a detailed multidisciplinary study based on processing of Landsat ETM+ satellite images, chemistry of gas condensed, mineralogy and chemistry of fumarolic deposits, and fluid inclusion data from native sulphur deposits, with the objective to determine the distribution and characteristics of hydrothermal alteration zones and to establish the relations between gas chemistry and fumarolic deposits.
2. Geological Setting
LVC has been built over a basement constituted exclusively by volcanic rocks with an age that vary from Upper Miocene to Upper Pleistocene, corresponding mostly to andesitic-to-dacitic, and subordinated basaltic andesites, lava flows and domes (Naranjo and Cornejo, 1992; Naranjo, 2010). Additionally, pyroclastic rocks, corresponding mainly to dacitic ignimbrites, and more subordinated to andesitic pyroclastic cones, are also present (Naranjo and Cornejo, 1992; Naranjo, 2010).
According to Naranjo (1992, 2010), the evolution of LVC can be divided according to the distribution of its three main structures:Negriales lava field: Correspond to the oldest volcanic structure (>400-116±26 ka), built in three eruptive stages and is constituted by diverse lava flows
and a single lava dome, which compositions varies from andesite to dacite. The lavas correspond to the typical blocky lavas, and are very well preserved, being clearly observed its longitudinal flow ridges (ogives) and levees.Espolón Sur: Built contemporary to the last stage of Negriales lava field (150±50 ka), is constituted by two craters from which have been emitted diverse andesitic lava flows.Lastarria sensu stricto (ss): Is the main volcanic structure of the LVC, actually active, and its construction begins contemporary to the Negriales lava field (260±20 ka). This edifice is constituted by five craters, which have migrated from south to north. Its evolution has been divided in 10 stages, which eruptive products corresponding mainly to andesitic-to-dacitic lava flows, domes, pyroclastic flows and pyroclastic fall deposits. Additionally, two avalanche deposits have been identified in its SE flank. The youngest unit with known age has 2,460±50 ka, nevertheless, at least one younger pyroclastic deposit has been identified. There are no records of historical activity, and since the end of nineteenth century a permanent fumarolic activity is known (Casertano, 1963; González-Ferrán, 1995).
3. Sampling, analytical and processing methods
3.1. Condensates, minerals and rock sampling procedures
Fumarolic vapour condensate samples were obtained from two sites located in the lower part of fumarolic field 1 (Fig. 2a) in November 2014. Pure condensates (for the analysis of major and trace elements, and REE in water vapour) were sampled using a 1 m long titanium tube (Ø=2.5 cm) that was inserted into the fumarolic vent and connected to the quartz-glass dewar tubes. Subsequently, a glass water-cooled condenser was attached to collect aliquots (using plastic bottles 125 ml) of condensable water vapour (condensate), following the procedure reported by Montegrossi et al. (2001) and Vaselli et al. (2006).
Rocks and minerals from the fumarolic deposits were sampled in diverse parts of fumarolic field 1 (Fig. 2a). Five rock/mineral samples were taken, where the mineral samples correspond to fumarolic incrustations and/or minerals sublimated, the former produced by gas condensed and then cooled to form

171Aguilera et al. / Andean Geology 43 (2): 166-196, 2016
minerals, while the last formed directly from the gas phase by vapour deposition processes (Africano and Bernard, 2000). Two minerals samples were taken directly from fumarolic deposits (incrustations and/or minerals sublimated), without host rock fragments. The five samples were split to perform X-Ray Diffraction (XRD) and geochemistry analysis (potassium, trace elements and REE), while two samples of sulphur obtained from the fumarolic deposits were separated to perform fluid inclusions analysis.
3.2. Analytical procedure
Fumarolic vapour condensate samples were analysed for different elements. Cations (Na+, K+, Ca2+, Mg2+, Li+) were analysed using Atomic Absorption Spectroscopy (AAS), and anions (SO4
2-, Cl-, NO3
-, B-, I-) via Ionic Chromatography (IC). Analytical errors for both methods were ≤5%. Boron, a wide spectrum of trace elements (Ag, Al, As, Ba, Be, Cd, Co, Cr, Cs, Cu, Fe, Hf, Mn, Mo, Ni, P, Pb, Rb, Sb, Se, Sn, Sr, Ta, Th, U, V, Zn) and Rare Earth Elements or REE (La, Ce, Pr, Nd, Sm, Eu, Gd, Tb, Dy, Ho, Er, Tm, Yb, Lu) were analysed via Inductively Coupled Plasma Mass Spectrometry (ICP-MS). Analytical error was ≤5%.
Rocks and mineral samples were analyzed by a combination of AAS and ICP-MS methods to determine a wide spectrum of trace elements (Al, As, Ba, Co, Cr, Cs, Cu, Hf, K, Mo, Nb, Ni, Pb, Rb, Sb, Sr, Ta, Th, U, V, Y, Zn) and ICP-MS for REE (La, Ce, Pr, Nd, Sm, Eu, Gd, Tb, Dy, Ho, Er, Tm, Yb, Lu). Analytical error was ≤5%.
Mineral powder samples were analyzed via X-Ray Diffractometer (XRD). The samples were pulver-ized with an agate pestle and mortar to <75 mm, being consequently mounted in aluminum holders. Diffractometer was operated with an accelerating voltage of 40 kV and a filament current of 30 mA, using CuKα radiation and graphite monochromator. The samples were measured over a 2θ angle of 2-70° in steps of 0.02° and 2 s integration time.
Fluid inclusion analysis was performed in two doubly polished sections of native sulphur crystals from the fumarolic deposits, where the samples are laminated and murky massive. Microthermomet-ric measurements were performed on a Linkam THMSG 600 heating-freezing stage at the Centro de Geociencias (UNAM, Mexico). Only primary
fluid inclusions were studied; fluid inclusions with microscopic evidence of leakage and necking-down were not measured. Usually the necking-down process is observed in various inclusions, probably due to dissolution precipitation process. Isolated, clustered, scattered, and randomly distributed fluid inclusions are considered primary. Pseudosecondary and secondary fluid inclusions occur along a fracture that crosscuts partial and the entire crystals.
Micro-Raman spectra were obtained from liquid and gas, and gas-rich inclusions in native sulphur crystals. For that purpose, a confocal Raman microscope Almega XR Raman device (Nd: YVO 4 laser) was used for all measurements, at Centro de Ciencias Aplicadas y Desarrollo Tecnológico (UNAM, Mexico). The measurements use laser at 532 nm, 50 mW, collection time 10 s, and range 0-4,000 cm-1.
Further Fourier Transform Infrared (FT-IR) spectroscopy (e.g., Linnen et al., 2004) were used to determined analysis of volatile-bearing inclusions. The analyses were performed on a Bruker Tensor 27 coupled with a Hyperior at Centro de Geociencias (UNAM, México). The spectra shown in absorbance units and wavenumbers (cm-1), were recorded in the transmission mode with a espectral resolution of 4 cm-1 after 516 accumulations over a range of 600-4,000 cm-1, in the mid-IR region.
The Raman spectroscopy characterization of liquid and gaseous compounds, solid phases, and solute species in fluid inclusions is supported by studies and catalogs of reference spectra for main phases (Bény et al., 1982; Harvey and Butler, 1986; Dubessy et al., 1989; Rosso and Bodnar, 1995; Burke, 2001; Baumgartner and Bakker, 2009; White, 2009; Frezzotti et al., 2012; Levresse et al., 2016).
The absorption band of FTIR spectra representa-tive of components and solutes in fluid inclusions were identified through various references e.g., 900-1,500 cm-1 (for SO4
2− and HSO4−; Fortin et al.,
2002; Oppenheimer and Kyle, 2008), 1,010-1,240 and 2,440-2,780 cm-1 (for SO2; Giuliani et al., 2003; Oppenheimer and Kyle, 2008), 1800-2,850 cm-1 (for H2S; Giuliani et al., 2003), 2,020-2,400 cm-1 (for CO, CO2, and COS; Linnen et al., 2004; Oppenheimer and Kyle, 2008) and near 3,200-3,700 (for H2O; Dereppe et al., 1994; Linnen et al., 2004). The na-tive sulphur key wavebands were 550-950 cm-1, with strong bands in the range 800-950 cm-1 (Eckert and Steudel, 2003; Giuliani et al., 2003).
172 HydrotHermal alteration, fumarolic deposits and fluids from lastarria Volcanic complex...
3.3. Satellite image processing
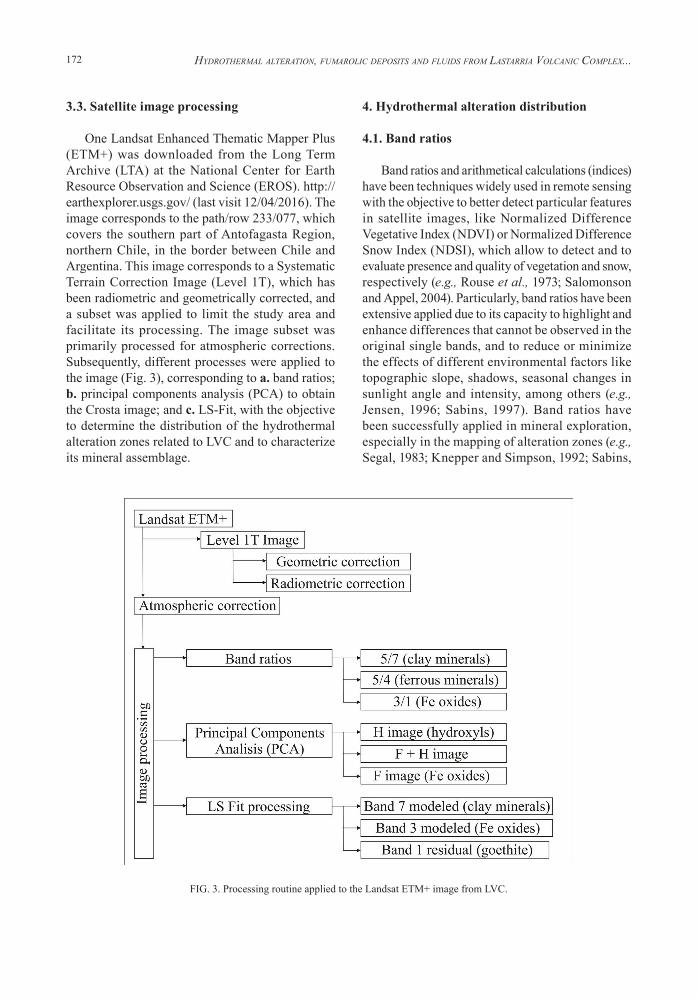
One Landsat Enhanced Thematic Mapper Plus (ETM+) was downloaded from the Long Term Archive (LTA) at the National Center for Earth Resource Observation and Science (EROS). http://earthexplorer.usgs.gov/ (last visit 12/04/2016). The image corresponds to the path/row 233/077, which covers the southern part of Antofagasta Region, northern Chile, in the border between Chile and Argentina. This image corresponds to a Systematic Terrain Correction Image (Level 1T), which has been radiometric and geometrically corrected, and a subset was applied to limit the study area and facilitate its processing. The image subset was primarily processed for atmospheric corrections. Subsequently, different processes were applied to the image (Fig. 3), corresponding to a. band ratios; b. principal components analysis (PCA) to obtain the Crosta image; and c. LS-Fit, with the objective to determine the distribution of the hydrothermal alteration zones related to LVC and to characterize its mineral assemblage.
4. Hydrothermal alteration distribution
4.1. Band ratios
Band ratios and arithmetical calculations (indices) have been techniques widely used in remote sensing with the objective to better detect particular features in satellite images, like Normalized Difference Vegetative Index (NDVI) or Normalized Difference Snow Index (NDSI), which allow to detect and to evaluate presence and quality of vegetation and snow, respectively (e.g., Rouse et al., 1973; Salomonson and Appel, 2004). Particularly, band ratios have been extensive applied due to its capacity to highlight and enhance differences that cannot be observed in the original single bands, and to reduce or minimize the effects of different environmental factors like topographic slope, shadows, seasonal changes in sunlight angle and intensity, among others (e.g., Jensen, 1996; Sabins, 1997). Band ratios have been successfully applied in mineral exploration, especially in the mapping of alteration zones (e.g., Segal, 1983; Knepper and Simpson, 1992; Sabins,
FIG. 3. Processing routine applied to the Landsat ETM+ image from LVC.

173Aguilera et al. / Andean Geology 43 (2): 166-196, 2016
1999), and have been extended to detect alteration zones in volcanic systems (e.g., Mia and Fujimitsu, 2012). The most suitable band ratios for detection of hydrothermal altered rocks correspond to (Fig. 3; Sabins, 1999): a. 5/7 ratio, which is able to distinguish altered rocks mostly containing clays, but additionally alunite; b. 3/1 ratio, high values of this ratio are measured in outcrops with iron-stained hydrothermally altered rocks, corresponding mainly to iron oxides.
The colour composite 742 (RGB) image from the study area (Fig. 4a) shows different areas related to LVC with high reflection values, which two have been previously mapped as hydrothermal altered zones (Naranjo, 2010), corresponding to Lastarria NE and Espolón sur, whereas another two zones correspond to fumarolic fields area (Lastarria ss) and Lastarria S, the last a probably altered zone previously observed during our field campaign. Despite of these evidences, the colour composite image is not able to distinguish clearly hydrothermal altered zones and/or mineral assemblage related to hydrothermal activity. Band ratio images from the study zone, specifically 5/7 ratio (Fig. 4b), indicate clearly that in the four zones are present clay minerals, being very intense anomalies, except in the Lastarria S area, where the intense of the anomaly is more limited. The second band ratio, corresponding to 3/1 ratio (Fig. 4d), shows presence of iron oxides in all zones, except in Lastarria S, where does not exist or its presence is very limited. In the Lastarria NE area the anomaly is intense and very extended, whereas in the Espolón sur is intense in the border of the anomaly, decreasing to its inner area. The fumarolic fields present an intense anomaly, especially in the NW fumarolic field, but limited in its extension. A typical band ratio used to compare and form diverse colour composite images is 5/4 ratio, which is able to detect ferrous minerals as magnetite and hematite (Fig. 3), the last a typical replacement product from the former in hydrothermal environments (e.g., Browne, 1982; Wohletz and Heiken, 1992). In the 5/4 ratio image (Fig. 4c) ferrous minerals were detected only in the Lastaria NE and Espolón sur, being the last very limited in its extension. Two colour composite images were produced using band ratios to better detect hydrothermal alteration zones and to determine its extension, corresponding to mineral and hydrothermal composite images. Mineral composite image combined as 5/7, 5/4,
3/1 (RGB; Fig 4e) shows the four interesting zones with different colour appearances according to the mineral assemblage detected with the band ratios. Almost the totally of Lastarria NE area appear as a white zone, which indicate that clay minerals, iron oxides and ferrous minerals have been extensively detected. Pale red to pink zones localized mainly in the border of the anomaly, are related to the presence of clay minerals and iron oxides, and the absence of ferrous minerals. Presence of abundant clay minerals, combined with some iron oxides, has produced an intense magenta colour anomaly in the Fumarolic fields area. Similar but less intense anomaly is observed in the Lastarria S area, where clay minerals are present, but the presence of iron oxide is doubtable. The Espolón sur anomaly area has a more heterogeneous distribution, with abundant and extensively distributed clay minerals, but with very limited presence of ferrous minerals, restricted to the central portions of the anomaly (pale yellow zones), and occurrence of iron oxides, especially in the edges of the anomaly, where is more abundant (pale pink zones). 5/7, 3/1, 4/3 RGB combination image (Fig. 4f), called as hydrothermal composite image, shows similar patterns in the anomalies like has been observed in the mineral composite. Lastarria NE hydrothermal alteration is constituted by clay minerals and iron oxides (white and pale yellow zones), clay minerals (magenta to pale pink zones) present in limited areas with±iron oxides in the Fumarolic fields (fumarolic field 1 or NW) and Espolón sur (edges), while in Lastarria S, only presence of clay minerals.
4.2. Crosta method
Crosta and Moore (1989) originally introduced the Crosta method, with the objective to mapping soils and outcrops hydrothermally altered, using the Principal Components Analysis (PCA) of spectral bands from Landsat TM images. PCA is a technique that reduces dimensionality correlated multispectral data. According to Singh and Harrison (1985), this analysis is based on a multivariate statistical technique that selects uncorrelated linear combinations (so-called eigenvectors loadings) of variables in such a way that each successively extracted linear combination (so-called principal components or PC) has a smaller variance. Consequently, PCA allow removing redundancy in multispectral

174 HydrotHermal alteration, fumarolic deposits and fluids from lastarria Volcanic complex...
data (Poormirzaee and Oskouei, 2010). Crosta technique principle is based in the analysis of the eigenvectors loadings (eigenvalues), which allow identifying the principal components that contain spectral information about specific minerals and the contribution of each of the original bands to the components in relation to the spectral response of the materials of interest, like rocks, soils, among others, where the materials are represented as bright or dark pixels according to the magnitude and sign of the eigenvalues (Poormirzaee and Oskouei, 2010). Different features can be detected and discriminated using the Crosta method, where the hydrothermally altered zones can be recognized
by detection of clays minerals and iron oxides. Clay minerals (so-called as hydroxyls) present an absorption window in band 7 of Landsat TM and ETM+ images, whereas a very high reflectance in band 5 of the same images. On the other hand, iron oxides minerals show a strong absorption in band 3 and a strong reflection in band 1. Consequently, the principal components transformation on bands 1, 4, 5 and 7 is used to detect clay minerals, where the principal component 4 (PC4) corresponds to the “hydroxyl image” or H image, whereas PCA on bands 1, 3, 4 and 5 is used for iron oxide minerals, being the PC4 called “iron oxide image” or F image (Fig. 3).
FIG. 4. a. Landsat ETM+ image in combination 742 (RGB) showing the location of the four hydrothermal alteration zones present in the LVC (white boxes); b. Band ratio 5/7 for clay minerals identification; c. Band ratio 3/1 for ferrous minerals identification; d. Band ratio 5/4 for iron oxide minerals identification; e. Mineral composite image constituted by 5/7, 5/4 and 3/1 ratios combined in RGB; f. Hydrothermal composite image constituted by 5/7, 3/1 and 4/3 ratios combined in RGB.

175Aguilera et al. / Andean Geology 43 (2): 166-196, 2016
Results of PCA in Landsat ETM+ image from LVC are shown in the Tables 1 and 2. In both cases, the PC1, PC2 and PC3 are excluded due that they reflect the albedo and topography information, vegetation and the differences between the spectral data in the VNIR and SWIR bands, respectively (Carranza and Hale, 2002). In the case of LVC images, PC2 cannot be related to vegetation, due to very dry environment that dominates the area, and consequently, vegetation is absent. In fact, loadings for PC2 on band 4 shows very low values or negative values (Table 1, 2), which could be related to the absence of vegetation. Detection of clay minerals has been based on PC4 results, which presents high loadings, especially for band 7 (0.7899835), but the same sign (positive) for band 5 (Table 1). The last imply that clay minerals will appear as bright pixels (Fig. 5a). Accordingly, two very restricted areas show presence of clay minerals, the fumarolic fields area, especially the fumarolic field 1, and scattered zones in the Lastarria NE (Fig. 5a). In the case of iron oxide minerals, similarly than clay minerals, its detection has been based in PC4 results, with high and positive loadings for band 3 (0.915859) and opposite sign (negative) for band 1 (Table 2), where the positive sign on the
loading on band 3 shows iron oxides as bright pixels (Fig. 5b). Iron oxide minerals are widely present in Lastarria NE and Espolón sur areas (Fig. 5b). Crosta image is constituted by the “hydroxyl image” or H, representing clay minerals, “iron oxide image” or F, and the mathematical arrangement formed by H+F (Fig. 3). Consequently, the image is formed by a colour composition of H, H+F, F in RGB. Crosta image of LVC (Fig. 5c) shows clay minerals zones as bright yellow pixels, which are present in fumarolic fields area and very restricted in Lastarria NE, whereas blue pixels represent iron oxides minerals, present in Lastarria NE and Espolón sur areas.
4.3. LS-Fit method
Least square fitting method (LS-Fit) performs a linear band prediction using least-squares fitting technique, which is used to find regions of anomalous spectral response in a dataset, like clay minerals and iron oxides (Poormirzaee and Oskouei, 2010; Mia and Fujimitsu, 2012). It calculates the covariance of the input data and is used to predict the selected band as a linear combination of the predictor bands plus an offset (Haroni and Lavafan, 2007). The
TABLE 1. PRINCIPAL COMPONENT ANALYSIS (PCA) FOR HYDROXYL (CLAY MINERALS) MAPPING OF LASTARRIA VOLCANIC COMPLEX.
Input bandEigenvector loading for hydroxyl mapping
Eigenvalue (%)Band 1 Band 4 Band 5 Band 7
PC1 0.859985 -0.077542 0.503807 -0.024275 78.75PC2 0.502776 0.290305 -0.809197 0.090207 19.79PC3 -0.051589 0.773614 0.177933 -0.605969 1.24PC4 -0.070557 0.5578808 0.244369 0.7899835 0.22
TABLE 2. PRINCIPAL COMPONENT ANALYSIS (PCA) FOR IRON OXIDE MINERALS MAPPING OF LASTARRIA VOLCANIC COMPLEX.
Input bandEigenvector loading for Fe oxide mapping
Eigenvalue (%)Band 1 Band 3 Band 4 Band 5
PC1 0.645351 -0.278324 0.668108 -0.244311 89.45PC2 0.656561 0.144947 -0.331864 0.661651 9.31PC3 0.390177 0.250452 -0.531720 -0.708737 0.84PC4 -0.014490 0.915859 0.400961 0.014852 0.4

176 HydrotHermal alteration, fumarolic deposits and fluids from lastarria Volcanic complex...
difference between the actual band and the modelled band (called residual) is calculated and output as an image (Mia and Fujimitsu, 2012). The images were obtained using six of the seven bands from the Landsat ETM+ image, where thermal infrared (TIR) band (band 6) was excluded. Those bands were used as an input, whereas band 7 was used as a modelled band. The resultant image corresponds to an image that highlights clay minerals (Fig. 3). When the band 3 is used as a modelled band, the resultant image is able to discriminate ferrous iron oxides, being preferred highlighted minerals as hematite (Fig. 3; Haroni and Lavafan, 2007). Finally, using residual band 1 is possible to distinguish zones with presence of goethite (Fig. 3; e.g., Poormirzaee and Oskouei, 2010; Mia and Fujimitsu, 2012).
Band 7 modelled image (Fig. 6a) shows that Lastarria NE, Fumarolic fields and Espolón sur areas present abundant clay minerals, like have been observed previously with the band ratios, mineral and hydrothermal composite images (Fig. 4b, e, f). In the case of Lastarria S, the occurrence of clay minerals seems to be more restricted, being even more poorly detected than 5/7 band ratio (Fig. 4b). Ferrous iron oxides detection using the band 3 modelled (Fig. 6b) indicates that those type of minerals are present in all areas, with the exception of Lastarria S where is absent, similarly to 5/4 and 3/1 ratios (Fig. 4c, d) used to detect ferrous and iron oxide minerals, respectively. Band 1 residual results, used to detect goethite in
hydrothermal altered zones, generated dark pixels for anomalous sites. Consequently, to improve the visualization of the results, the image was negated, showing anomalous zones as brightest pixels (Fig. 6c). Areas with presence of goethite are very restricted in its extension, appearing in the Lastarria NE area as isolated pixels mainly clustered in the central portion of the anomaly zone, whereas in Espolón sur, concentrated in the central portion of the hydrothermally altered zone. In the case of the Fumarolic fields area, only the fumarolic field 1 (NW fumarolic field) shows presence of goethite, almost in the totally of this fumarolic field area. In the composite colour image formed by band 7 modelled, band 3 modelled and band 1 residual (RGB; Fig. 6d), hydrothermally altered zones with clay minerals+ferrous iron oxides appear as pale yellow pixels, whereas clay minerals+ferrous iron oxides+goethite as white pixels, and exclusively clay minerals zones can be observed as yellow-orange pixels (e.g., Lastarria S).
5. Gas geochemistry
5.1. Condensates from fumarolic fluids
Condensates samples of high temperature fumaroles provide a first approximation of the type of species (and consequently its concentrations) released from the magma during degassing (Taran
FIG. 5. a. PC4 image (H image) showing the distribution of pixels detected as hydroxyls (clay minerals), which are presented as bright pixels; b. PC4 image (F image) showing the distribution of pixels detected as iron oxides, which are presented as bright pixels; c. Crosta image formed by H, H+F, F as RGB.

177Aguilera et al. / Andean Geology 43 (2): 166-196, 2016
FIG. 6. a. Band 7 modelled image showing the distribution of clay minerals as bright pixels; b. Band 3 modelled image showing the distribution of iron oxides as bright pixels; c. Band 1 residual image showing the distribution of goethite. The image has been negated to show the goethite distribution as bright pixels; d. LS-Fit image constituted by band 7 modelled, band 3 modelled and band 1 residual in RGB.

178 HydrotHermal alteration, fumarolic deposits and fluids from lastarria Volcanic complex...
et al., 1995). However, presence of meteoric water that circulates to a depth sufficient to be heated and then vaporized can carry solutes, which may also be incorporated to the original magmatic vapours, masking its original composition (Taran et al., 1995). Consequently, only high temperature fumaroles are chosen to perform condensates sampling and analysis, with the objective to avoid the meteoric fluids influence (Taran et al., 1995; Zelenzky et al., 2013). According to Aguilera et al. (2012), LVC present two types of fumaroles, low (≤96.1 °C) and high (≥120 ºC) temperature, where the hottest fumarolic discharged measured was 408 ºC, lower than typically presented in diverse studies, which cover a range between ~500 and ~1,100 °C (e.g., Tedesco and Toutain, 1991; Symonds et al., 1992; Zelenski et al., 2013). Nevertheless, δ18O-δD isotope data from LVC fumarolic discharges (Aguilera et al., 2012) show a very limited contribution of meteoric water, even in low temperature fumaroles, which implies that LVC condensates data can be used confidently, where the addition of solutes from external source can be assumed as negligible.
The most suitable approach to represent variations in the composition of volcanic condensates is the enrichment factor (EF), which also allows determining the contributions of the volatile and particulate fractions to the total amount of an element in a volcanic gas (Zoller et al., 1974; Lepel et al., 1978). The EF of an i element is represented as:
EFi = (Ei/R)vapour/(Ei/R)rock (1)
where Ei is the concentration of an i element present in both vapour condensate and rock hosting the fumarole, and R is a non-volatile reference element used for normalization. The most used element for non-volatile reference is Mg, due to its low-volatility, abundance, and its concentration in condensates is independent of temperature (Symonds et al., 1990, 1992; Yudovskaya et al., 2008). However, different low-volatile elements can be used as reference, like Al (e.g., Zoller et al., 1983), Ti (e.g., Symonds et al., 1987), Sc (e.g., Olmez et al., 1986), and Th (e.g., Calabrese et al., 2011). Data from LVC condensates are presented in the Table 3, and rock reference data in the Table 4. Rock reference compositions were extracted of LVC lavas and pyroclastic rocks from Naranjo (1992, 2010) and Trumbull et al. (1999). For elements absent in the previous references, specifically
TABLE 3. TEMPERATURE (ºC), PH AND CHEMICAL C O M P O S I T ION S OF F U M A RO L IC CONDENSATES (in ppm).
Sample Last_Cond_1 Last_Cond_2
Type Fumarole Fumarole
T (°C) 328 320pH 1.37 5.74
Cl- 5,620 296
SO42- 2,160 11.4
NO3- 145 5.00
Br- 2.08 0.67
Na+ 0.3 0.3
K+ 0.3 0.5
Mg2+ 0.2 0.1
Ca2+ 0.3 0.2B 0.479 b.d.l.
Rb 1.5 4.26Cs 0.08 9.41Sr 2.66 5.23Hf 0.21 b.d.l.Ta 0.06 b.d.l.Cr 0.067 0.01Mo 0.01 b.d.l.Fe 0.464 b.d.l.Ni 0.046 0.02Cu 0.196 b.d.l.Ag 0.01 b.d.l.Zn 0.532 2.2Cd 0.01 0.02Al 0.3 b.d.l.Sn 0.01 b.d.l.Pb 0.01 b.d.l.As 1,234 b.d.l.Sb 0.04 b.d.l.Se 0.01 b.d.l.I 2.05 0.07
Th 0.02 b.d.l.U 0.04 b.d.l.La 0.89 b.d.l.Ce 0.65 b.d.l.Pr 0.02 b.d.l.Nd 0.04 4.00Dy 0.04 b.d.l.Yb 0.02 b.d.l.
b.d.l.: Below detection limit.

179Aguilera et al. / Andean Geology 43 (2): 166-196, 2016
Se, Sn, Be, Sb and Tl were obtained from Láscar volcano rocks (Menard et al., 2014), while Cl, F, SO4, Br, Ag and I from convergent margin volcanic rocks world average. http://georoc.mpch-mainz.gwdg.de/georoc/ (last visit 25/11/2015).
The pure condensates samples were obtained from fumaroles which temperatures correspond to 328 and 320 °C for Last_Cond_1 and Last_Cond_2 samples, respectively (Fig. 2; Table 3). Despite of similitude in the outlet temperature, differences
are observed in the pH, elements detected and its concentrations (Table 3). Last_Cond_1 sample has a pH 1.37, 37 elements were detected, with concentrations that vary widely between 5,620 ppm for chlorine to 0.01 ppm for Mo, Ag, Sn, Pb, and Se. Six family of elements were detected in that sample, being the chalcophile elements the more abundant (10 elements), followed by REE (6 elements), alkali metals (4 elements), halogens, siderophiles and alkali earth metals (3 elements), and 8 other elements. Elements with higher concentrations correspond to Cl 5,620 ppm, I 2.05 ppm and Br 2.08 ppm (halogens), S (expressed as sulphate) 2,160 ppm and As 1,234 ppm (chalcophiles), Rb 1.5 ppm and Sr 2.66 ppm (alkaline metal and alkaline earth metal, respectively), and nitrate 145 ppm (other element). Last_Cond_2 sample has a pH 5.74, only 17 elements were detected, less than half of the other sample, pertaining to the same six elements families detected previously (4 alkali metals, 3 alkali earth metals, 3 halogens, 3 chalcophiles, 1 siderophile, 1 REE, and 2 other elements). Concentrations have more limited range from 296 ppm (Cl) to 0.1 pm (Mg and Cr). The concentrations are lower in 9 elements, one element presents the same concentration (Na), and 6 elements have higher concentrations, corresponding to alkali metals, alkali earth metals, siderophiles and REE. The differences in pH values, number of elements detected and its concentrations could be attributed to a. different volume of sample, being 125 and 30 ml of condensate for Last_Cond_1 and Last_Cond_2, respectively; b. less flow in the fumarole where Last_Cond_2 was sampled; c. secondary processes that could affect the original condensate composition in the fumarole where Last_Cond_2 was sampled, like more intense gas-rock interaction, which probably explain the higher concentrations of typical rock components as alkali metals and alkali earth metals, and dilution by gas-meteoric water interaction, probably represented by a higher pH.
According to Fig. 7a, b, log EFi values are so far >1, where in the case of Last_Cond_1 sample, 30 elements presents log EFi values >2 and a maximum of 6.35 for iodine, whereas in the Last_Cond_2 sample, 12 elements have log EFi values >1.5, with a maximum of 5.59 for caesium. Elements with log EFi values between 0 and 1 corresponding to low-volatile elements that derive from rock particles eroded from the conduit walls and subsequently incorporated to the high temperature vapour. On
TABLE 4. CHEMICAL COMPOSITIONS OF REFERENCE ROCKS (in ppm).
Lastarria lava and pyroclastic rocks
Na 33,200 Ag 14K 26,300 Zn 74Mg 33,000 Cd 0.19Ca 56,200 Tl 0.36Fe 59,900 Sn 6.43Al 160,000 Pb 16P 2,700 As 2.30Cl- 551 Sb 0.065SO4 1,000 Se 0.068Br 1.26 I 0.15Li 25 Th 25B 57 U 6.35Be 1.46 La 34Rb 127 Ce 83Cs 7.90 Pr 8.57Sr 514 Nd 32Ba 536 Sm 6.11Hf 4.63 Eu 1.35V 142 Gd 4.99Ta 1.13 Tb 0.69Cr 74 Dy 3.84Mo 4.18 Ho 0.70Mn 0.090 Er 1.88Co 17 Tm 0.27Ni 32 Yb 1.73Cu 38 Lu 0.26
All elements from Naranjo 1992, 2010 and Trumbull et al., 1999, except for Se, Sn, Be, Sb, Tl (Menard et al., 2014), and Cl, F, SO4, Br, Ag, I. http://georoc.mpch-mainz.gwdg.de/georoc/ (last visit 25/11/2015).

180 HydrotHermal alteration, fumarolic deposits and fluids from lastarria Volcanic complex...
the contrary, log EFi>1 suggesting that elements are derived from a deep source, like fluids exsolved from a magmatic source. Typical rock-derived elements K, Na, Ca, Fe and Al present log EFi<1, even with negative values for Ca and Al in Last_Cond_1 sample, which indicate that those elements have been incorporated directly from the host rock. Negative values can be attributed to the very low concentrations of these elements in the condensate, comparing with the contents of Ca and Al in the host rock (Fig. 8a; Table 3, 4). Typical high-volatile elements like Cl, I, Cd, Br, and elements groups that show highest volatilities in volcanic environments as chalcophile, highly siderophile and halogen show log EFi>1 (Fig. 7a, b), which is interpreted as derived from a deep source. However, elements normally derived from the host rock, like REE and some alkali earth metals as Sr, show log EFi values over 2 (Fig. 7a, b), a contrary behaviour as observed in other arc-related volcanoes (Taran et al., 1995,
2001; Zelenski et al., 2014). The higher enrichment of those elements in LVC condensates could be related to the incorporation of hydrothermal fluids in the high temperature fumaroles. Hydrothermal fluids are originated from the interaction of magmatic fluids with the host rock and/or shallow aquifers at reduced conditions (Giggenbach, 1996), and consequently, incorporation of solutes from the rock/meteoric sources can occur effectively in the magmatic/hydrothermal environments transition zone. In fact, Aguilera et al. (2012) have suggested that LVC fumaroles emit a mixing of hydrothermal and deep magmatic fluids, where hydrothermal fluids are mainly originated from discontinuous shallow aquifers. In the case of alkali metals, its behaviour can be considered “normal”, with decreasing of log EFi as follow Cs>Rb>K>Na, except in Last_Cond_1 where Rb>Cs. This order follows the principle that the volatilities of the elements increase with increasing atomic number in a group (Zelenski et al., 2014).
FIG. 7. Logarithms of enrichment factors (EF) for trace elements in Lastarria Volcanic Complex (LVC) fumarolic gases, corres-ponding to a. Last_Cond_1 and b. Last_Cond_2 samples. Different geochemical types of elements are shown in different colours; Weight ash fractions (WAF) for the same elements presented in the a) and b), corresponding to c. Last_Cond_1 and d. Last_Cond_2 samples.

181Aguilera et al. / Andean Geology 43 (2): 166-196, 2016
Three elements present the highest log EFi values in both samples, corresponding to iodine, chlorine and bromine, with log EFi>5 (Fig. 7a, b), which correspond to halogen elements and are character-ized by its high-volatility. According to Taran et al. (1995) Cl/Br ratio for marine sediments and/or fluids is 290, while Br/I ratio for seawater is 19.25 (Irwin and Roedder, 1995). LVC samples have Cl/Br ratios between 441 and 2,701, which is 1.5 and 9 times higher than marine ratio, whereas the Br/I ratios for LVC ranging from 1 and 9.57, values relatively closer than seawater ratio. Kudryavy volcano (Russia), an arc-related volcano in which high temperature discharges have been observed contributions of connate water from marine sedi-ments, presents Br/I ratios that range from 0.12 to 1.4, while its iodine concentration ranging 1-12 ppm (Taran et al., 1995). Considering the high Cl/Br and Br/I ratios, and iodine concentration that vary 0.07 and 2.05 ppm (Table 3), similar than Kudryavy volcano, and exceeding those in the arc-related St. Helens volcano (USA; Le Guern, 1988) condensates by more than 3 order of magnitude (0.0005 ppm), could be interpreted that LVC fumaroles pres-ent contributions from marine sediments and/or intraporal seawater, added to the original magma during the subduction process, and represented by relative high contents and high log EFi of Br and I. High contributions of sediments during the subduction process have been also observed in LVC fumaroles by Aguilera et al. (2012), represented by excess of N2, high values of CO2/
3He and δ13C-CO2 values closer to zero.
The main advantage of the use of EF parameter is to determine the origin of the elements, which is not possible directly from condensates and rock reference concentrations. In fact, only 5 elements from Last_Cond_1 and Last_Cond_2 samples, respectively, have higher concentration in comparison with rock concentrations (Fig. 8a, b). From those elements, S, Cl, Br and I correspond to high-volatile elements, and should be expected to have more concentrations in condensates samples than rock samples. Consequently, EF parameter must be used to have a better interpretation of processes related to condensates samples.
5.2. Transport of the elements
The best way to evaluate the transport of the elements in the fumarolic emission is the weight ash fractions or WAF, which has been introduced by Aiuppa et al. (2003). WAF is a measure that shows the contribution of silicate particles (ash) to the total amount of each of the elements in volcanic gas. WAF is closely related to the enrichment factor (EF) and is expressed as follow:
WAF (%)=1/EF • 100% (2)
where the WAF values vary from 0 to 100%, differently to EF which can has positive and negative values, and span from unity to infinity. A WAF value equal to 100% means that an element is transported solely with the silicate aerosol. However, WAF values give no information about the presence of
FIG. 8. Concentrations (in ppm) of trace elements in a. Last_Cond_1 and b. Last_Cond_2 samples. Concentrations of trace elements in rock reference are also shown.

182 HydrotHermal alteration, fumarolic deposits and fluids from lastarria Volcanic complex...
non-silicate aerosols in the gas (Zelensky et al., 2014). WAF values for LVC are presented in order from low to high WAF in the Fig. 7a, c. The mostly of elements have WAF values <1%, which means those are transported as a gaseous species, and include the totally of halogens, chalcophile, REE and other elements. Transported as gaseous specie are also Rb and Cs (alkali metals), Sr (alkaline earth metals), Mo and Ni (siderophiles). Mg, Ca and Al have WAF values >90% and are transported exclusively by silicate aerosol in Last_Cond_1, whereas only Mg has WAF >90% in Last_Cond_2. K, Na and Fe have WAF between 10 and 90% in Last_Cond_1, and K, Na and Ca in Last_Cond_2, which are transported mainly by silicate aerosol. In the case of Cr in Last_Cond_2 sample, which present a WAF value of 2%, this element is transported mainly as gaseous specie.
6. Fumarolic deposits mineralogy
Two types of deposits related to fumarolic activity can be found in LVC, sublimates, corresponding to minerals formed directly from the gas phase by vapour deposition, and incrustations, minerals produced by gas condensed and then cooled. In this work, both types of deposits will not be discriminated, and the mineral assemblage related to fumarolic deposits will be worked as a single deposit. Fumarolic deposits are characterized by presence mainly of native sulphur in massive and layered deposits, as well as in extensive flows (Fig. 2g). Presence of well-formed sulphur crystals is very limited. Fumarolic deposits have diverse colorations, varying from pale yellow to black, and diverse intermediate colours as orange, red and grey (Fig. 2d, e, f). One of most notable features are the liquid reddish flows that appear in the high temperature fumarolic vents (Fig. 2f), produced by a fast condensation of fumarolic gas, which after few minutes solidify, forming a massive, but very limited flow. Seven mineral families, constituted by 11 minerals were found in the fumarolic deposits of LVC, corresponding to sulphates, hydrated sul phates, sulphides, halides, carbonates, silicates and native element minerals.
6.1. Sulphates
Two sulphates were recognized by XRD analysis, corresponding to bloedite [Na2Mg(SO4)2] and
barite [BaSO4]. Barite is a typical mineral found in fumarolic deposits as incrustations and sublimates (e.g., Africano and Bernard, 2000; Distler et al., 2002; Zimbelman et al., 2005; Zaitsev and Keller, 2006), and its origin could be related to reaction of wall rock with fumarolic gases in a higher oxidized environment, probably related to surface conditions, and at very low pH (Africano and Bernard, 2000; Zaitsev and Keller, 2006). On the other hand, despite that bloedite is a typical mineral from marine and lacustrine salt deposits, normally associated with halite and polyhalite, and formed under surface conditions in arid environments (e.g., Braitsch, 1971), has been also reported in volcanic caves as stalactites (Benedetto et al., 1998; Porter, 2000; White, 2010), probably related to the remobilization of sulphur deposits by meteoric water (Heliker et al., 2003). In fact, bloedite in some volcanic caves appear associated with native sulphur (e.g., Benedetto et al., 1998). Bloedite has been also indentified in secondary deposits related to hot springs and fumaroles in geothermal fields (Adams and Lynch, 2014; Okrugin et al., 2015).
6.2. Hydrated sulphates
One of most common mineral present in acid-sulphate alteration zone related to magmatic/hydro-ther mal environment is the alunite [KAl3(SO4)2(OH)6], which is the most representative mineral of advanced argillic alteration (Heald et al., 1987). Alunite is formed between 15 and 400 ºC by the action of sulphate, which is generated from pyrite or by action of fumaroles. Al and K of Alunite can be leached from the wall rock and transported by acid solu-tions, which permeate into the surface (Hamasaki, 2002). In the magmatic/hydrothermal environment, beginning at 400 ºC, and in the presence of water, SO2 disproportionate as follow (Holland, 1965):
4SO2+4H2O ↔ H2S+3H2SO4 (3)
Subsequent alteration of andesite by acid sulphuric action produces the assemblage alunite +kaolinite+silica+pyrite (Zimbelman et al., 2005). In the case of H2S, a typical compound of the hydrothermal fluids, under oxidizing conditions may form sulphuric acid by the next reaction:
H2S+2O2 ↔ H2SO4 (4)

183Aguilera et al. / Andean Geology 43 (2): 166-196, 2016
where the alunite can be formed from the sulphuric acid, similarly then SO2 disproportion (Zimbelman et al., 2005). Low-temperature meteoric water or high-temperature magmatic fluids can produce this oxidation process, which is a source of sulphate for supergene acid-sulphate alteration (Zimbelman et al., 2005). In the case of supergene alunite formation, alunite occurs at or below the water table (Rye et al., 2000).
A chemically similar mineral than alunite corre-spond to potassium alum [KAl(SO4)•12(H2O)], which is typically formed from argillaceous rocks, nevertheless, also can be produced as fumarolic or solfataric precipitate (Anthony et al., 2003). This mineral has been observed in volcanic structures as Vesuvius and Vulcano (Anthony et al., 2003), while dehydrated variations of potassium alum like kalinite [KAl(SO4)•11H2O)] and Steklite [KAl(SO4)2] has been described in Ijen Volcanic Complex (Indonesia) and Tolbachick (Russia), respectively (Van Bergen et al., 2000; Murashko et al., 2013). Potassium alum can be artificially produced by use of metallic aluminium, acid sulphuric and water, which reaction can be summarized as follow:
K+(aq)+Al3+
(aq)+2SO42-
(aq)+12H2O(l)
KAl(SO4)2·12H2O(l) (5)
where potassium and aluminium can be repre-sented in the nature as aqueous products derived from leaching of wall rocks, by interaction with meteoric water, and sulphate in its aqueous form, which can be derived directly from the absorption of gaseous sulphur compounds as SO2 and/or H2S in water.
Similarly to bloedite, polyhalite [K2Ca2Mg(SO4)4• 2H2O] is a typical evaporitic marine and non-marine mineral, and present very scarcely in volcanic environments, as sublimated mineral (Forti, 2005). This hydrated mineral has been observed in volcanic caves and as a product of hydrothermal alteration of volcanic rocks in active volcanoes (Forti, 2005; del Moro et al., 2011). The origin of polyhalite could be attributed to a strong hydrothermal alteration of volcanic rocks by very low pH fluids (del Moro et al., 2011), sublimation from high temperature fumaroles, deposition from aerosols and vapours in low temperature fumaroles, and by alteration of volcanic rocks by oxidation and/or hydration processes (Forti, 2005).
Plumbojarosite [PbFe63+(SO4)4(OH)12] is a product
of the reaction between galena and oxidizing pyrite, especially in lead deposits (Anthony et al., 2003). This is consistent with the presence of pyrite, galena and Pb-bearing minerals in fumarolic deposits, like has been reported in diverse active volcanoes (e.g., Africano and Bernard, 2000; Africano et al., 2002; Yudovskaya et al., 2008). However, in LVC only pyrite has been detected in fumarolic deposits, and the source for Pb could be inferred from at least two processes a. supplied directly from the gas phase, which is less probable due to its low concentration (Table 3), or b. directly extracted from galena or another Pb-bearing mineral present in deeper parts of the volcanic structure. In our knowledge, there is no previous report of the presence of plumbojarosite in active fumarolic deposits.
6.3. Sulphides
Pyrite [FeS2] is a common mineral present in acid-sulphate alteration zones related to magmatic/hydrothermal systems from active volcanoes and geothermal systems (e.g., Browne, 1982; Heald et al., 1987; Ambrosio et al., 2010). The assemblage constituted by alunite-pyrite-cristobalite has been typically observed in alteration zones and sublimates/incrustations related to high temperature fumaroles in active volcanoes (e.g., Africano and Bernard, 2000; Zimbelman et al., 2005; Scher, 2012). The formation of pyrite can be attributed to diverse processes as a. interaction between fumarolic fluids, specifically by presence of H2S, with Fe, which is extracted from the wall rock, especially in presence of minerals as magnetite and pyroxene (Browne, 1982; Zimbelman et al., 2005), b. water-rock interaction and partial neutralization of acid-generating species, which may determine the precipitation of mineral phases as pyrite (Ambrosio et al., 2010). Despite that pyrite can be formed in a wide range of temperatures, Agusto et al. (2004) observed a very fast formation of pyrite crystals (<1 hour) at 100 ºC.
6.4. Halides
The only halide detected in the fumarolic de-posits corresponds to the hydrohalite [NaCl•2H2O], a mineral that normally is formed from seawater or in sediments of hypersaline lakes at near-freezing temperature (Anthony et al., 1997). According to

184 HydrotHermal alteration, fumarolic deposits and fluids from lastarria Volcanic complex...
Dutch (2011), hyper-hydrous minerals can occur in extremely wet settings such as mines and caves, fumaroles, and frozen hypersaline brines. Conse-quently, minerals as potassium alum and hydroha-lite, both considered hyper-hydrous mineral, are suitable to appear in fumarolic deposits. Aguilera et al. (2012) indicate that a partial decreasing of chlorine contents in fumarolic emissions of LVC could be related to salt deposition/precipitation with decreasing temperatures. Consequently, that process would be reflected by hydrohalite formation, being the water source a shallow aquifer related to the hydrothermal system and/or water vapour from gas fumarole.
6.5. Carbonates
Fairchildite [K2Ca(CO3)2] is a carbonate that is part of a sodium-potassium series [Na2Ca(CO3)2-K2Ca(CO3)2] constituted by nyerereite, fairchildite and bütschliite minerals, where fairchildite is the potassium end-member, and bütschliite its low temperature polymorph (Deer et al., 1998). Fairchildite was originally described in wood-ash clinkers formed during forest fires (Milton and Axlrod, 1947), however, Zhitova et al. (2009) described the presence of magmatic fairchildite in magnetite-hosted inclusion of carbonatite, whereas nyerereite, its sodium end-member, was reported in natrocarbonatites lavas from Oldoinyo Lengai volcano (Mckie and Frankis, 1976). There no reports related to the presence of carbonatite lavas in LVC, and its presence could be related to secondary processes like transformation at high temperatures of carbonate minerals as calcite and/or aragonite, nevertheless, in our XRD analysis there is no evidence to the presence of those minerals. Consequently, its origin is controversial, and only could be inferred that fairchildite in LVC is result of the transformation of carbonate minerals present in deeper parts of the volcanic structure and/or as product of interaction of CO2 from gas fumaroles with the wall rock. In our knowledge, there is no previous report of the presence of fairchildite in active fumarolic deposits.
6.6. Silicates
Cristobalite [SiO2] is a typical product of the hydrothermal alteration of volcanic rocks. Presence of cristobalite is related to the presence of strong acid fluids, at temperatures normally <100 ºC, fluid
pressures <15 bars (Hayashi, 1973; Browne, 1977), typical conditions of acid-sulphate type hydrothermal alteration. However, cristobalite also can be formed at high temperatures in fumarolic discharges (>500 ºC), like have been observed in the Kudryavy and Usu volcanoes, in Russia and Japan, respectively (Africano and Bernard, 2000; Africano et al., 2003). In a hydrothermal environment, the strong fluid-rock interaction, especially in presence of high temperature and strongly acid fluids, the initial dissolution of the rock forming silicates and volcanic glass results in silica precipitation (Papike et al., 1991; Africano and Bernard, 2000). Especially in high temperature fumarolic emissions, the silica that forms the cristobalite seems to be transported in the vapour phase (Horwell et al., 2013). The mineral assemblage formed by alunite-pyrite-cristobalite has been typically observed in strongly acid-sulphate alteration zones related to active volcanoes (e.g., Africano and Bernard, 2000; Zimbelman et al., 2005; Scher, 2012).
6.7. Native element minerals
Native sulphur, elemental sulphur or simply sulphur [S8] is the most common product of fumarolic activity in active volcanoes, by sublimation and/or condensed from fumarolic vents. At low temperature (<350 °C), elemental sulphur can be produced by the next reaction (Mitzutani and Sugiura, 1966):
SO2+2H2S ↔ 3S0+2H2O (6)
whereas at low temperatures (<200 °C) elemental sulphur can be produced as follow (Kusakabe and Komoda, 1992):
4SO2(s/l)+3H2O(g/l)↔3H2SO3(l)↔
2H2SO4(l)+S0(l/s)+2H2O(g/l) (7)
In LVC, the extensive sulphur deposits appear in different colorations, varying from pale yellow, yellow, orange, red, grey, to black, being its zonation clearly observed near to fumarolic vents, where grey/black sulphur appear in the inner parts of fumarolic vents, whereas pale yellow in the outer parts of fumarolic deposits (Fig. 2d). According to Naranjo (1985, 1988), its zonation is directly dependent of the sulphur formation temperature, where yellow/orange sulphur is related to temperatures <130 °C, and black sulphur over ~240 °C.

185Aguilera et al. / Andean Geology 43 (2): 166-196, 2016
7. Fumarolic deposit geochemistry
Chemistry of trace elements and some major elements as K and Al in fumarolic deposits was carried out (Table 5), specifically, in the same samples used for mineralogical analysis. To better understand the processes related to the chemistry of fumarolic deposits and its relations with gas chemistry, the EF was again applied, but using Al as low-volatile reference element instead. One
of most notable characteristics in all samples is the high log EF, especially if are compared with condensate samples. Sublimated/incrustations samples present log EF in a range that covers between 3.63 and 9.96 (Fig. 9a), where the highest values are present in high-volatility elements as Sb, As and Cd, similarly than condensates samples. The high log EF values can be related to strong gas contributions, like was observed previously in the condensates samples, where almost the totally of
TABLE 5. CHEMICAL COMPOSITIONS OF FUMAROLIC DEPOSITS (in ppm).
Sample LSTG 1-1 LSTG 1-2 LSTG 1-3 LSTG 2-1 LSTG 2-2
K 1,700 1,600 10,300 200 800Rb 36 29 97 1.74 18Cs 4.84 2.08 6.46 b.d.l. 1.40Sr 54 172 447 2.62 26Ba 160 306 692 24 82Hf 1.79 1.82 5.08 0.092 0.99V 9.16 32 113 b.d.l. 7.81Ta 2.53 1.45 180 0.54 0.92Cr 6.68 81 29 4.56 7.68Mo 2.05 4.01 4.46 b.d.l. 1.87Co 2.90 11 22 b.d.l. b.d.l.Ni 3.00 297 33 b.d.l. 2.67Cu 42 71 36 7.07 28Zn 88 31 87 b.d.l. 11Cd 6.72 5.61 18 0.62 3.53Al 2.23 1.47 5.64 0.26 1.13Pb 291 86 113 b.d.l. b.d.l.As 162,543 2,079 565 161 148,843Sb 41 126 b.d.l. b.d.l. 32La 6.77 9.49 29 0.10 3.01Ce 13 19 60 1.29 7.61Pr 1.66 2.26 7.33 0.21 0.84Nd 5.46 8.38 29 0.61 3.26Sm 0.99 1.44 5.46 0.081 0.50Eu 0.17 0.28 1.27 0.017 0.091Gd 0.75 1.22 4.77 0.067 0.48Tb 0.17 0.16 0.60 0.007 0.077Dy 0.60 0.88 3.21 0.074 0.46Ho 0.11 0.14 0.57 0.007 0.072Er 0.45 0.29 1.60 0.065 0.21Tm 0.050 0.040 0.23 b.d.l. 0.024Yb 0.39 0.42 1.58 0.025 0.13Lu 0.047 0.075 0.15 0.015 0.011
b.d.l.: Below detection limit.

186 HydrotHermal alteration, fumarolic deposits and fluids from lastarria Volcanic complex...
elements are transported as gaseous species (Fig. 7c, d). This could be responsible of high log EF values for typical rock-related elements like K and REE. However, diverse elements were not detected in some samples, like Sb, Cs, V, Mo, Co, Ni, Zn, Pb and Tm (Table 5), mostly of elements with high log EF in the other samples, and probably is related that those samples correspond to wall rocks with mineral incrustations, and consequently, the gas-rock interaction could be less intense. Similarly than condensate samples, only few elements present
higher concentrations in sublimated/incrustations samples than rocks from LCV, corresponding to Pb, As, Cd, Sb in all samples where were detected, whereas Ta in LSTG 1-1, Cu, Ni, Ta in LSTG 1-2, and Ba. Zn, Ta in LSTG 1-3 (Fig. 9b). As was observed previously, mostly of those elements correspond to high volatility elements (e.g., Sb, As, Cd), demonstrating the strong influence of gas-rock interaction and the incorporation of deep source or “magmatic” elements to the solid phase in the surface.
FIG. 9. a. Logarithms of enrichment factors (EF) for trace elements in Lastarria Volcanic Complex (LVC) fumarolic deposits; b. Concentrations (in ppm) of trace elements in fumarolic deposits samples. Concentrations of trace elements in rock reference are also shown.

187Aguilera et al. / Andean Geology 43 (2): 166-196, 2016
8. Fluid inclusions
Microthermometric measurements were performed on 37 fluid inclusions, with sizes ranging from 5 to 8 μm, hosted in native sulphur crystals from thin pseudobanded cloudy material and aggregate mass (Fig. 10). The sulphur has colours from bright yellow to pale yellow and grey, with grey patches and occasionally brittle greenish yellow crystalline sulphur aggregate filling voids. Inclusion shapes were typically a. elongate to rounded, oriented
parallel to host crystal axes and along fractures; b. blocky to rectangular; or c. irregular. The fluid inclusions identified was monophasic (liquid L or gas G), mainly, and biphasic liquid-rich (L+G), very little size, at room temperature with a liquid-to-gas ratio (F = VolumeLiquid phase/VolumeTotal fluid inclusion) of 0.65-0.80. Occasionally the bubbles occur in patterns of thin lamination.
The gas bubbles appear dark under the microscope and the bubble phase in L+G inclusions generally observed to have a dark periphery. The gas bubbles
FIG. 10 a. Photomicrographs showing representative fluid inclusion associations hosted in native sulphur. Laminar arrangement of fluid inclusions in sulphur banded; association of liquid-rich, gas-rich and liquid-gas fluid inclusions with subrounded, elongated and irregular morphologies; primary and pseudosecondary fluid inclusions; b. Summary of representative Raman spectra, laser spot focused on individual phases in fluid inclusions, photomicrograph inset showing the spot of measurement within the gas-rich and liquid-rich inclusions. Raman spectra of native sulphur, gaseous species and water obtained with the microprobe; c. Selected FTIR spectra of solutes in aqueous fluid, gas and water determined; liquid-rich, gas-rich and gas in liquid and gas fluid inclusions analysis. L: liquid, G: Gas, L+G: liquid and gas.

188 HydrotHermal alteration, fumarolic deposits and fluids from lastarria Volcanic complex...
show an irregular distribution in their size (from a few microns to 16 microns) and coexist spatially with liquid-rich and two-phase fluid inclusions, heterogeneously trapped fluid inclusions (Fig. 10a). Usually, the gas inclusions were affected by post mineralization events (e.g., necking-down).
The results of fluid inclusion microthermometry are summarized in Table 6. The eutectic temperature (Te) of the aqueous inclusions was observed occasionally and lies between -21.1 and -21.7 ºC, indicating the possible presence of different salt types (e.g., NaCl, Na2SO4 and Na2CO3). It is noted that regardless of which is the predominant system, the error in the calculation of salinity (assuming all salts like NaCl) is relatively small. Microthermometric data for samples yield homogenization temperatures (Th) from 99° to 114 °C. The ice-melting temperature (Tmice) ranges from -4.8° to -6.7 °C; which corresponds to a salinity range of 7.6-10.1 wt% NaCl eq.
The figure 11 illustrates temperatures of homo-genization versus salinity. Higher temperatures appear to be associated with higher salinities and lower temperatures associated with lower salinity. The distribution of microthermometric data shows a positive correlation trend, suggesting a dilution process during progressive mineralization of native sulphur. Additionally a population of fluid inclusions, the highest Th (~114 °C), has a variation in salinity from 8 to 10 wt% NaCl in a moderate vertical tendency data. This pattern suggests a possible subsurface boiling process and interaction with a steam-heated environment.
The Raman and FTIR analysis were performed in approximately 40 fluid inclusions, monophasic and biphasic, the size of the inclusions limiting in identifying components and solutes, especially biphasic fluid inclusions. Usually the native sulphur (S8) was identified in the analysis. The dominant Raman bands of sulphur are at ∼82, 150, 187, 219,
437, and 470 cm−1 (Fig. 10b). The bands in the 100 to 300 cm−1 region are due to S-S-S bending and the bands in the 400-500 cm−1 region are due to S-S stretching (Harvey and Butler, 1986; Frezzotti et al., 2012). Additionally absorption band centred at ~462, 710, 796, 836, 848, 903 and 937 cm−1 were observed in FTIR spectra characteristic of native sulphur (Eckert and Steudel, 2003) (Fig. 10c). Also, the FTIR showed the possible presence of kaolinite associated with the native sulphur (peaks 1,030, 1,000 and 940 cm−1; Bikiaris et al., 2000).
Raman and FTIR analyses indicate the presence of H2S, SO2, CO2 and CH4, mainly, and H2O, and COS, within the gas phase (Fig. 10b, c). The liquid in monophasic fluid inclusions identified is H2O, with SO4
2−, HSO4−, and possibly H2S as solutes.
Raman and FTIR analyses of the gas phase in brine-bearing fluid inclusions in native sulphur indicate the presence of H2O, mainly, and SO2, H2S and probably CO2. The liquid phase corresponds to H2O, with SO4
2-, and HSO4- as solutes.
9. Discussion and conclusions
According to condensate geochemistry, elements present in this fluid phase have two origins: a. deep source; b. shallow hydrothermal source. The deep source corresponds to a shallow and/or deep magmatic source, which supply different elements as Cl, S, As, Sb, among others, mostly of them characterized by its high-volatilities. However, a third source linked to that magmatic source can be added, which corresponds to contributions from marine sediments and/or intraporal seawater that are added to the original magma during the subduction process, by maturing/dehydration of subducted sediments and further transporting to the upper mantle melting zones. The main elements related to those sediments/seawater are bromine and iodine. Despite of the
TABLE 6. SUMMARY OF MICROTHERMOMETRY DATA OF FLUID INCLUSION IN NATIVE SULPHUR CRYSTALS FROM FUMAROLIC FIELD.
Sample n Range of Th (°C) Range of Tmice (°C) Salinity (wt% NaCl eq.)
LSTG 1-3 15 99 to111 (105.5) -4.8 to -6.0 (-5.5) 7.6 to 9.2 (8.5)
LSTG 2-1 22 106 to 114 (112) -5.1 to -6.7 (-5.9) 8.0 to 10.1 (9.1)
n: number data analyzed; Th: homogenization temperature; Tmice: ice-melting temperature. Values in parenthesis are average data.

189Aguilera et al. / Andean Geology 43 (2): 166-196, 2016
scarce supply of marine sediments in the northern Chile trench (Thornburg and Kulm, 1987), this process seems to be highly effective, as suggested by Giggenbach (1992), where >99% of subducted sediments are decomposed and incorporated to the upper mantle melt. The shallow hydrothermal source implies at least two processes, gas-rock and water-rock interaction. Gas-rock interaction seems to be the most important process, where the ascending gas interacts strongly with the wall rock, leaching and extracting typical “rock elements” as K, Na, Ca, Al, REE among others. Similarly, water-rock interaction is able to extract “rock elements”, which could produce an increase in the concentration of those elements in the condensed gas. In consequence, condensates related to “more magmatic” fumarolic emissions, are characterized by very low pH, higher number of elements present, higher values of log EF for high-volatile elements (e.g., I, Cd, Br), but also high log EF values for low-volatile elements, as “rock elements”, produced by partial incorporation of hydrothermal fluids to those emissions. Condensates related to “more hydrothermal” fumarolic emissions present low pH, lower numbers of elements present, and similar log EF values than “magmatic” emissions, both low and high-volatile elements. Mostly of elements are transported in the fumarolic emissions as gaseous
species, while very few elements (Mg, Ca and Al) are transported in silicate aerosols.
Sublimates and incrustations constitute the fumarolic deposits, which are directly related to gaseous emissions. Chemical data and microthermometric analysis from fluids discharged and deposits at the surface indicate a relatively shallow condensate layer fed by magmatic volatiles including SO2, H2S, CO2, CO, HCl and HF (Aguilera et al., 2012). A wide spectrum of minerals is present, constituted by 11 minerals distributed in seven mineral families, corresponding to sulphates, hydrated sulphates, sulphides, halides, carbonates, silicates and native element minerals. Those minerals are mostly constituted by sulphate, sulphur, chlorine and diverse “rock elements” as Na, Mg, Ba, K, Al, Ca, Fe and SiO2, which are formed by a combination of different processes, summarized as follow:
a. Oxidation of SO2 and H2S to form SO42-, where
the oxidation is favoured by entering of O2 to the fumarolic vents, and/or interaction with groundwater.
b. Rock-fluids interaction represented by leaching and remobilization of the wall rock components by hyperacid solutions.
c. Dissolution of silicate minerals and volcanic glass, which produce that SiO2 can be transported by vapour at high temperatures, and subsequently being deposited from acid fluids at low temperatures (~100 ºC by microthermometric data and the presence of amorphous and cryptocrystalline silica phases).
d. Gas-water interaction, represented by the reaction between groundwater and ascending fluids, can favour the processes to form hydrated minerals as alunite, kaolinite, potassium alum, polyhalite and plumbojarosite.
e. Deposition/precipitation of saline bearing minerals.
f. Oxidation of sublimates/incrustations to form secondary minerals, like oxidation of sulphide minerals.
g. Remobilization of sulphur deposits by meteoric water. Textures (e.g., banded) and positive trend of temperatures homogenization (<110 °C) data suggest local supergene processes.
The main characteristics of sublimates/incrusta-tions minerals is that the totally are formed by typical “rock-elements” like Na, K, Mg, and are dominated by sulphate minerals, which is consistent with high contents of sulphur in its fumarolic deposits and relative high contents of sulphur-bearing species in the gaseous phase (Aguilera et al., 2012). Those
FIG. 11 Homogenization temperature (Th in °C) versus salinity (wt% NaCl eq.) for fluid inclusions in native sulphur from fumarolic deposits.

190 HydrotHermal alteration, fumarolic deposits and fluids from lastarria Volcanic complex...
minerals present high log EF values for typical rock related elements (low-volatile elements) as alkali earth elements, REE among others, but also high log EF for high-volatile elements as As, Sb and Cd, which also present high concentrations in the sublimates/incrustations minerals (Fig. 9a, b). However, the last is not compatible with the pres-ence exclusively of minerals dominated by rock related elements. Those high contents is expected in presence of minerals dominated by high-volatile elements, like have been observed in different active volcanoes like in Kudryavy and Erta Ale (Yudovskaya et al., 2008; Zelenski et al., 2013). Consequently, could be inferred that high-volatile elements are widely fixed in the cell structure of sublimates/incrustation minerals.
The direct consequence of fluid-rock interaction is the development of hydrothermal alteration zones, being actually active that related to the fumarolic fields. The occurrence and distribution of hydrothermal alteration and thermal discharges depend on the relationship between permeability, faulting and topography that control movement of fluids, and the characteristics of the phenomena of recharge/discharge of fluids. According to the satellite image processing, hydrothermal alteration in the fumarolic fields is constituted by clay minerals, alunite, iron oxides and goethite, where the alunite and kaolinite are the only minerals identified in the sublimate/incrustation assemblage. The other minerals were not identified probably because no samples were taken from altered rocks. The assemblage clay minerals (e.g., kaolinite)-alunite is typical of the acid-sulphate alteration related to the action of acid fluids in the wall rock, like active fumaroles. The formation of subsurface hydrothermal alteration zone is believed to have formed under two different conditions: a. related to steam-heated acid sulphate water, and b. a direct contribution and/or disproportionation of volcanic gas. Lateral behaviour of alteration and deposits, and field evidences (Naranjo, 1985) indicates that the blanket acid leach zone at fumarolic deposit is formed in a steam-heated environment mainly. Moreover, the magmatic steam environment may be locally restricted in the zone, denoted by thermal anomalies targeted without substantial lateral development of its mineral assemblage (e.g., faults). The acid conditions are formed by the disproportionation of magmatic SO2 and the presence of acids (e.g., HCl and HF, Aguilera et al., 2012), subsequent to
magmatic vapours being absorbed by ground water (Hedenquist et al., 1994). Here acid sulphate alteration occurs dominantly as a stratabound blanket that caps the system, generally with opal, cristobalite, kaolinite, alunite, sulphides and native sulphur association, such as shown in volcanic geothermal systems (Henley and Ellis, 1983; Hedenquist, 1991) and epithermal deposits (Ebert and Rye, 1997; Cruz-Pérez et al., 2016). Alunite may also form as a fumarole sublimate (Zimbelman et al., 2005). The kaolinite is considered a product of magmatic hydrothermal alteration (deep source, presumably most concentrated at depth or focused in vents) overlapped by later steam-heated alteration and/or steam-heated environments (shallow hydrothermal source) (Ebert and Rye, 1997; Zimbelman et al., 2005). Consequently, at least Espolón sur and Lastarria NE alteration zones seems to be also related to an ancient intense fumarolic activity, but in very extensive zones, where similar mineral assemblage is present, but with the additional presence of ferrous minerals. Finally, in the Lastarria S zone, where the alteration is poorly developed and only limited to the presence of clay minerals, the action of fumarolic fluids seems to be very limited and low intensity.
Fluid inclusions trapped in native sulphur provide a record of the chemical and thermal evolution of the fluids. The genesis of hydrothermal alteration can be related to: deep source and shallow hydrothermal source are consistent with fluid inclusion data, which provide evidence that two different origins that involved in deposition of native sulphur and hydrothermal mineral association. Evidence of possible deep source is a. the coincidence of magmatic recent high temperature gas, SO2-rich, emanation of volcanic system (Aguilera et al., 2012) and SO2, H2S and COS content in fluid inclusions. COS is a common low-level volatile in volcanic gases (e.g., eruptions of Mount St. Helens or Galeras volcano in Colombia; Rasmussen et al., 1982; Stix et al., 1996), even geothermal systems related to volcanism (e.g., Lardarello geothermal field, Chiodini et al., 1991); b. relative high salinity of fluids (~10 wt% NaCl) (e.g., Hedenquist and Lowenstern, 1994).
The temperature of homogenization (<114 °C) is consistent with a shallow hydrothermal source and the samples are grouped in the low temperature sulphur (<130 °C) suggested by Naranjo (1985, 1988). Additionally, the content of gases such as H2O, CO2 and CH4 suggests a shallow hydrothermal

191Aguilera et al. / Andean Geology 43 (2): 166-196, 2016
source, from H2O-H2-CO2-CO-CH4 vapour system (Chiodini and Marini, 1998). The association of these gases and petrographic evidence of heterogeneously trapped fluid inclusions suggest a boiling process (e.g., Hedenquist and Henley, 1985; Canet et al., 2011) (Fig. 10).
The behaviour of microthermometric data (Th versus salinity) shows the possible processes occurring in the deposition of native sulphur: boiling and dilution (Fig 11). The positive trend data (LSTG 1-3 sample) evidences that a hot and saline fluid is mixed (diluted) with a cooler fluid. These trends are often observed in fluid inclusion data from Japanese hydrothermal deposits (Yajima, 1979). The positive and subvertical trends of data (LSTG 2-1 sample) are the combination of two processes: a. boiling of a gas-rich fluid with b. subsequent dilution. The drop in salinity from ~11 to ~8 wt% NaCl is due to the loss of dissolved gas, and the dilution trend from ~8 to ~7 wt% NaCl would be from the gas-poor (boiled) fluid. LSTG 1-3 sample data present salinity values between ~9 and ~7 wt% NaCl, would indicate dilution of a relatively gas-rich (unboiled) fluid or mixing with aquifers or steam-heated water. These processes have been verified in the Broadlands geothermal system (Hedenquist and Henley, 1985). The extrapolation of a dilution trend to 0 wt% NaCl salinity (Fig. 11) would indicate that the dilutant was cold groundwater or a steam-heated water, a phenomena typically observed in geothermal systems (Hedenquist and Henley, 1985). The extrapolation of trend show a dilute fluids at <100 °C, assuming the presence of a steam-heated water environment.
AcknowledgmentsThis article is result of the work carried out during
the 12th gas workshop, organized by the Commission on Chemistry of Volcanic Gases (CCVG), pertaining to the International Association of Volcanology and Chemistry of Earth’s Interior (IAVCEI). We thank Carles Canet Miquel for his assistance and advice. We acknowledge Leticia Alva Aldave and Marina Vega González for their support during the analysis and interpretation of Raman and FTIR analyses. We are grateful to Juan Tomás Vázquez Ramírez for making doubly polished sections. Our acknowledgments to an anonymous reviewer and the Andean Geology editor (L.E. Lara) for their valuable comments.
References
Adams, P.; Lynch, D. 2014. A Mineralogical Inventory of Geothermal Features Southeast of the Salton Sea, Imperial County, California. In Trough to trough: The Colorado River and the Salton Sea (Reynolds, R.; editor). Desert Studies Consortium-California State University-LSA Associates Inc: 39-43.
Africano, F.; Van Rompaey, G.; Bernard, A.; Le Guern, F. 2002. Deposition of trace elements from high tem-perature gases of Satsuma-Iwojima volcano. Earth Planets Space 54: 275-286.
Africano, F.; Bernard, A.; Korzhinsky, M. 2003. High temperature volcanic gas geochemistry (major and minor elements) at Kudryavy Volcano, Iturup Island, Kuril Arc, Russia. Vulcânica 1: 87-94.
Africano, F.; Bernard, A. 2000. Acid alteration in the fumarolic environment of Usu volcano, Hokkaido, Japan. Journal of Volcanology and Geothermal Research 97: 475-495.
Aguilera, F. 2008. Origen y naturaleza de los fluidos en los sistemas volcánicos, geotermales y termales de baja entalpía de la zona volcánica central (ZVC) entre los 17°43’S y 25°10’S. Tesis de Doctorado (Inédita), Universidad Católica del Norte, Chile: 393 p.
Aguilera, F.; Tassi, F.; Vaselli, O.; Medina, E.; Darrah, T. 2008. Preliminary results of a geothermical survey at Lastarria volcano (northern Chile): Magmatic vs. Hydrotermal contributions. In International Symposium on Andean Geodynamics (ISAG), No. 7, Actas: 25-28. Nice.
Aguilera, F.; Tassi, F.; Darrah, T.; Vaselli, O.; Medina, E. 2009. Geochemical survey of the fumarolic field at Lastarria volcano (Central Andes, Chile). In Congreso Geológico Chileno, No. 12, Actas: Antofagasta.
Aguilera, F.; Tassi, F.; Darrah, T.; Moune, S.; Vaselli, O. 2012. Geochemical model of a magmatic hydrothermal system at the Lastarria volcano, northern Chile. Bulletin of Volcanology 74: 119-134.
Agusto, M.; Caselli, A.; Dos Santos, M. 2004. Manifes-taciones de piritas framboidales en fumarolas de la Isla Decepción (Antártida): Implicancias genéticas. Revista de la Asociación Geológica Argentina 59: 152-157.
Aiuppa, A.; Dongarra, G.; Valenza, M.; Federico, C.; Pecoraino, G. 2003. Degassing of trace volatile metals during the 2001 eruption of Etna. In Volcanism and the Earth’s Atmosphere (Robock, A.; Oppenheimer, C.; editors). American Geophysical Union, Geophysical Monograph Series 139: 41-54.
Ambrosio, M.; Doveri, M.; Fagioli, M.; Marini, L.; Principe, C.; Brunella, R. 2010. Water-rock interaction in the

192 HydrotHermal alteration, fumarolic deposits and fluids from lastarria Volcanic complex...
magmatic-hydrothermal system of Nisyros Island (Greece). Journal of Volcanology and Geothermal Research. doi: 10.1016/j.jvolgeores.2010.02.005.
Anderssohn, J.; Motagh, M.; Walter, T.; Rosenau, M.; Kaufmann, H.; Oncken, O. 2009. Surface deformation time series and source modeling for a volcanic complex system based on satellite wide swath and image mode interferometry: The Lazufre system, central Andes. Remote Sensing of Environment 113: 2062-2075.
Anthony, J.; Bideaux, R.; Bladh, K.; Nichols, M. 1997. Handbook of Mineralogy, Volume III: Halides, hydroxides, oxides. Mineralogical Society of America: 628 p.
Anthony, J.; Bideaux, R.; Bladh, K.; Nichols, M. 2003. Hand-book of Mineralogy, Volume V: Borates, Carbonates, Sulfates. Mineralogical Society of America: 791 p.
Baumgartner, M.; Bakker, R.J. 2009. Raman spectroscopy of pure H2O and NaCl-H2O containing synthetic fluid inclusions in quartz -a study of polarization effects. Mineralogy and Petrology 95: 1-15.
Benedetto, C.; Forti, P.; Galli, E.; Rossi, A. 1998. Chemical deposits in volcanic caves of Argentina. International Journal Speleology 27B: 155-162.
Bény, C.; Guilhaumou, N.; Touray, J.C. 1982. Native-sulphur-bearing fluid inclusions in the CO2-H2S- H2O-S system-Microthermometry and Raman microprobe (MOLE) analysis-Thermochemical interpretations. Chemical Geology 37: 113-127.
Bikiaris, D.; Daniilia, S.; Sotiropoulou, S.; Katsimbiri, O.; Pavlidou, E.; Moutsatsou, A.P.; Chryssoulakis, Y. 2000. Ochre-differentiation through micro-Raman and micro-FTIR spectroscopies: application on wall paintings at Meteora and Mount Athos, Greece. Spectrochimica Acta Part A: Molecular and Biomolecular Spectroscopy 56: 3-18.
Bonvalot, S.; Froger, J.L.; Remy, D.; Bondoux, F.; Gabalda, G.; Legrand, D.; Pavez, A.; Robin, C. 2006. Results and perspectives from InSAR and geodetic surveys. In Congreso Geológico Chileno, No. 11, Actas: 417-420. Antofagasta
Braitsch, O. 1971. Salt deposits, their origin and composition. Springer-Verlag: 297 p.
Browne, P. 1977. Hydrothermal alteration in active geo thermal fields. New Zealand Geological Survey Report M58: 57 p.
Browne, P. 1982. Mapping of geothermal discharge features. In Introduction to geothermal prospecting (Hochstein, M.; editor). University of Aukland Publishing: 67-69. Aukland.
Burke, E.A.J. 2001. Raman microspectrometry of fluid inclusions. Lithos 55: 139-158.
Calabrese, S.; Aiuppa, A.; Allard, P.; Bagnato, E.; Bellomo, S.; Brusca, L.; D’Alessandro, W.; Parello, F. 2011. Atmospheric sources and sinks of volcanogenic elements in a basaltic volcano (Etna, Italy). Geochimica et Cosmochimica Acta 75: 7401-7425.
Canet, C.; Franco, S.I.; Prol-Ledesma, R.M.; González-Partida, E.; Villanueva-Estrada, R.E. 2011. A model of boiling for fluid inclusion studies: Application to the Bolaños Ag-Au-Pb-Zn epithermal deposit, Western Mexico. Journal of Geochemical Exploration 110: 118-125.
Carranza, E.; Hale, M. 2002. Mineral imaging with Landsat Thematic Mapper data for hydrothermal alteration mapping in heavily vegetated terrane. International Journal of Remote Sensing 23: 4827-4852.
Casertano, L. 1963. Catalogue of Active Volcanoes of the World, including solfatara fields. International Association of Volcanology and Chemistry of the Earth’s Interior (IAVCEI), The Chilean Continent 15.
Chiodini, G.; Cioni, R.; Raco, B.; Scandiffio, G. 1991. Carbonyl sulphide (COS) in geothermal fluids: an example from the Larderello field (Italy). Geothermics 20: 319-327.
Chiodini, G.; Marini, L. 1998 Hydrothermal gas equilibria: the H2O-H2-CO2-CO-CH4 system. Geochimica et Cosmochimica Acta 62: 2673-2687.
Crosta, A.; Moore, J. 1989. Enhancement of Landsat Thematic Mapper imagery for residual soil mapping in SW minais Gerais State, Brazil: A prospecting case history in Greenstone belt terrain. In International Proceedings of the Seventh Erim Thematic Conference: Remote Sensing for Exploration Geology, Actas: 1173-1187. Calgary.
Cruz-Pérez, M.A.; Canet, C.: Franco, S.I.; Camprubí, A.; González-Partida, E.; Rajabi, A. 2016. Boiling and depth calculations in active and fossil hydrothermal systems: A comparative approach based on fluid inclusion case studies from Mexico. Ore Geology Reviews 72: 603-611.
Deer, W.; Howie, R.; Zussman, J. 1998. An introduction to the rock-forming minerals. Mineralogical Society: 510 p.
Del Moro, S.; Renzulli, A.; Tribaudino, M. 2011. Pyro-metamorphic Processes at the Magma-Hydrothermal System Interface of Active Volcanoes: Evidence from Buchite Ejecta of Stromboli (Aeolian Island, Italy). Journal of Petrology 52: 541-564.
Dereppe, J.M.; Pironon, J.; Moreaux, C. 1994. Characterization of the composition of fluid inclusions in minerals by 1H NMR. American Mineralogist 79: 712-718.

193Aguilera et al. / Andean Geology 43 (2): 166-196, 2016
Distler, V.; Yudovskaya, M.; Chaplygin, I.; Znamensky, V. 2002. PGE in the Modern Hydrotherms of Kudryavy Volcano (Kuril Islands). In International Platinum Symposium, No. 9, Actas: 4 p. Billings.
Dubessy, J.; Poty, B.; Ramboz, C. 1989. Advances in C-O-H-N-S fluid geochemistry based on micro-Raman spectrometric analysis of fluid inclusions. European Journal of Mineralogy 1: 517-534.
Dutch, S. 2011. Musherals: Hyper-Hydrous minerals. In Geological Society of America, Annual Meeting, Actas: 47-2. Minneapolis.
Ebert, S.W.; Rye, R.O. 1997. Secondary precious metal enrichment by steam-heated fluids in the Crofoot-Lewis hot spring gold-silver deposit and relation to paleoclimate. Economic Geology 92: 578-600.
Eckert, B.; Steudel, R. 2003. Molecular spectra of sulfur molecules and solid sulfur allotropes. In Elemental Sulfur und Sulfur-Rich Compounds II: 31-98. Springer Berlin Heidelberg.
Forti, P. 2005. Genetic processes of cave minerals in volcanic environment: An overview. Journal of Cave and Karst Studies 67: 3-13.
Fortin, T.J.; Shilling, J.E.; Tolbert, M.A. 2002. Infrared spectroscopic study of the low-temperature phase behavior of ammonium sulfate. Journal of Geophysical Research: Atmospheres (1984-2012), 107(D10), AAC-4.
Frezzotti, M.L.; Tecce, F.; Casagli, A. 2012. Raman spectroscopy for fluid inclusion analysis. Journal of Geochemical Exploration 112: 1-20.
Froger, J.L.; Remy, D.; Bonvalot, S.; Legrand, D. 2007. Two scales of inf lation at Lastarria-Cordón del Azufre volcanic complex, central Andes, revealed from ASAR-ENVISAT interferometric data. Earth and Planetary Sciences Letters 255: 148-163.
Giggenbach, W.F. 1991. Chemical techniques in geothermal exploration. In Application of geochemistry in geothermal reservoir development (D’Amore, F.; editor). UNITAR: 119-144. Rome.
Giggenbach, W.F. 1992. Isotopic shifts in waters from geothermal and volcanic systems along convergent plate boundaries and their origin. Earth and Planetary Sciences Letters 113: 495-510.
Giggenbach, W. 1996. Chemical composition of volcanic gases. In Monitoring and mitigation of volcano hazards (Scarpa, R.; Tilling, R.; editors). Springer-Verlag: 222-256. Berlin.
Giggenbach, W.F. 1997. The origin and evolution of fluids in magmatic-hydrothermal systems. In Geochemistry of hydrothermal ore deposits (Barnes, H.L.; editor). John Wiley: 737-796. New York.
Giuliani, G.; Dubessy, J.; Banks, D.; Quang, V.H.; Lhomme, T.; Pironon, J.; Schwarz, D. 2003. CO2-H2S-COS-S8-AlO (OH)-bearing fluid inclusions in ruby from marble-hosted deposits in Luc Yen area, North Vietnam. Chemical Geology 194: 167-185.
González-Ferrán, O. 1995. Volcanes de Chile. Instituto Geográfico Militar: 639 p. Santiago.
Hamasaki, S. 2002. Volcanic-related alteration and geochemistry of Iwodake volcano, Satsuma-Iwojima, Kyushu, SW Japan. Earth Planets Space 54: 217-229.
Haroni, H.; Lavafan, A. 2007. Integrated analysis of ASTER and Landsat ETM data to map exploration targets In tne Muteh Gold-Mining Area, Iran. In International Symposium on Spatial Data Quality, No. 5, Actas: 4 p. Enschede.
Harvey, P.D.; Butler, I.S. 1986. Raman spectra of ortho-rhombic sulfur at 40 K. Journal of Raman Spectroscopy 17: 329-334.
Hayashi, M. 1973. Hydrothermal alteration in Otake geo-thermal area, Kyushu. Journal of Japan Geothermal Energy Association 10: 9-46.
Heald, P.; Foley, N.; Hayba, D. 1987. Comparative anatomy of volcanic-hosted epithermal deposits: acid-sulfate and adularia-sericite deposits. Economic Geology 82: 1-26.
Hedenquist, J.W. 1991. Boiling and dilution in the shallow portion of the Waiotapu geothermal system, New Zealand. Geochimica et Cosmochimica Acta 55 (10): 2753-2765.
Hedenquist, J.W.; Henley, R.W. 1985. The importance of CO2 on freezing point measurements of fluid inclusions; evidence from active geothermal systems and implications for epithermal ore deposition. Economic Geology 80: 1379-1406.
Hedenquist, J.W.; Lowenstern, J.B. 1994. The role of magmas in the formation of hydrothermal ore deposits. Nature 370 (6490): 519-527.
Hedenquist, J.W.; Matsuhisa, Y.; Izawa, E.; White, N.C.; Giggenback, W.F.; Aoki, M. 1994, Geology, geochemistry, and origin of high-sulfidation Cu-Au mineralization in the Nansatsu district, Japan. Economic Geology 89: 1-30.
Heliker, C.; Swanson, D.; Takahashi, T. 2003. The Pu’u ‘O’o-Kupaianaha eruption of Kilauea volcano, Hawai’i: The first 20 years. Unites States Geological Survey, Professional Paper 1676: 215 p.
Henley, R.W.; Ellis, A.J. 1983. Geothermal systems, ancient and modern: a geochemical review. Earth Science Review 19: 1-50.
Holland, H. 1965. Some applications of thermochemical data in problems of ore deposits II: mineral assemblages

194 HydrotHermal alteration, fumarolic deposits and fluids from lastarria Volcanic complex...
and the composition of ore-forming fluids. Economic Geology 60: 1101-1166.
Horwell, C.; Williamson, B.; Llewellin, E.; Damby, D.; Le Blond, J. 2013. The nature and formation of cris-toballite at the Soufrière Hills volcano, Montserrat: implications for the petrology and stability of silic lava domes. Bulletin of Volcanology 75: 696.
Irwin, J.; Roedder, E. 1995. Diverse origins of f luid in magmatic inclusions at Bingham (Utah, USA), Butte (Montana, USA), St Austell (Cornwall, UK), and Ascension Island (mid-Atlantic, UK), indicated by laser microprobe analysis of Cl, K, Br, I, Ba+Te, U, Ar, Kr, and Xe. Geochimica et Cosmochimica Acta 59: 295-312.
Jensen, J. 1996. Introductory digital image processing: A remote sensing perspective. Prentice Hall: 318.
Knepper, D.; Simpson, S. 1992. Remote sensing in Geology and mineral resources of the Altiplano and Cordillera Occidental, Bolivia. United States Geological Survey Bulletin 1975: 514 p.
Kusakabe, M.; Komoda, Y. 1992. Sulfur isotopic effects in the disproportionated reaction of sulfur dioxide at hydrothermal temperatures. Report of Geological Survey of Japan 279: 93-96.
Le Guern, F. 1988. Ecoulements gazeux reactifs a haute temperature: measures at modelisation. These de doctorat (Unpublished), Universite Paris 7: 314 p.
Lepel, E.; Stefansson, K.; Zoller, W. 1978. The enrichment of volatile elements in the atmosphere by volcanic activity: Agustine volcano 1976. Journal of Geophysical Research 83: 6213-6220.
Levresse, G.; Cervantes-de la Cruz, K.E.; Aranda-Gómez, J.J.; Dávalos-Elizondo, M.G.; Jiménez-Sandoval, S.; Rodríguez-Melgarejo, F.; Alba-Aldave, L.A. 2016. CO2 fluid inclusion barometry in mantle xenoliths from central Mexico: A detailed record of magma ascent. Journal of Volcanology and Geothermal Research 310: 72-88.
Linnen, R.L.; Keppler, H.; Sterner, S.M. 2004. In situ measurements of the H2O:CO2 ratio in fluid inclusions by infrared spectroscopy. The Canadian Mineralogist 42 (5): 1275-1282.
Mckie, D.; Frankis, E. 1976. Nyereite: a new volcanic carbonate mineral from Oldoinyo Lengai, Tanzania. Zeitschrift für Krisrallographie 145: 73-95.
Menard, G.; Moune, S.; Vlastélic, I.; Aguilera, F.; Valade, S.; Bontemps, M.; González, R. 2014. Gas and aerosols emissions from Láscar volcano (northern Chile): Insights into the origin of gases and their links with the volcanic activity. Journal of Volcanology and Geothermal Research 287: 51-67.
Mia, M.; Fujimitsu, Y. 2012. Mapping hydrothermal altered mineral deposits using Landsat 7 ETM+ image in and around Kuju volcano, Kyushu, Japan. Journal of Earth System Sciences 121: 1049-1057.
Milton, C.; Axlrod, J. 1947. Fused wood-ash stones: Fairchildite (n. sp.) K2CO3•CaCO3, Buetschliite (n.sp.) 3K2CO3•2CaCO3•6H2O and Calcite, CaCO3 their essential components. United States of Geological Survey 32: 607-624.
Mitzutani, Y.; Sugiura, T. 1966. The chemical equilibrium of the SO2+2H2S ↔ 3S+2H2O reaction in solfataras of the Nasudake Volcano. Bulletin of Chemical Society of Japan 39: 2411-2414.
Montegrossi, G.; Tassi, F.; Vaselli, O.; Buccianti, A.; Garofalo, K. 2001. Sulfur species in volcanic gases. Analytical Chemistry 73: 3709-3715.
Murashko, M.; Pekov, I.; Krivovichev, S.; Chernyatyeva, A.; Yapaskurt, V.; Zadov, A.; Zelensky, M. 2013. Steklite, KAl(SO4)2: A finding at the Tolbachik volcano, Kamchatka, Russia, validating its status as a mineral species and crystal structure. Geology of Ore Deposits 55: 594-600.
Naranjo, J. 1985. Sulphur flows at Lastarria volcano in the North Chilean Andes. Nature 313: 778-780.
Naranjo, J. 1988. Coladas de azufre en los volcanes Lastarria y Bayo en el norte de Chile: Reología, génesis e importancia en geología planetaria. Revista Geológica de Chile 15 (1): 3-12. doi: 10.5027/andgeoV15n1-a01.
Naranjo, J. 1992. Chemistry and petrological evolution of the Lastarria volcanic complex in north Chilean Andes. Geological Magazine 129: 723-740.
Naranjo, J. 2010. Geología del Complejo Volcánico Lastarria. Servicio Nacional de Geología y Minería, Carta Geológica de Chile, Serie Geología Básica 123: 33 p., 1 mapa escala 1:100.000.
Naranjo, J.; Cornejo, P. 1992. Hoja Salar de la Isla. Servicio Nacional de Geología y Minería, Carta Geológica de Chile, Serie Geología Básica 72, 1 mapa escala 1:250.000.
Okrugin, V.; Andreeva, E.; Okrugina, A.; Chubarov, V.; Chubarov, M.; Yablokova, D. 2015. Chemical and Mineralogy Features in Zonez of Anomalous Thermal Flows (Vilyuchinsky Hydrothermal System, South Kamchatka, Russia). In Proceedings World Geothermal Congress, Actas: 19-25.
Olmez, I.; Finnegan, D.; Zoller, W. 1986. Iridium emissions from Kilaea volcano. Journal of Geophysical Research 91: 653-663.
Oppenheimer, C.; Kyle, P.R. 2008. Probing the magma plumbing of Erebus volcano, Antarctica, by open-path FTIR spectroscopy of gas emissions. Journal of Volcanology and Geothermal Research 177: 743-754.

195Aguilera et al. / Andean Geology 43 (2): 166-196, 2016
Papike, J.; Keith, T.; Spilde, M.; Galbreath, K.; Shearer, C.; Laul, J. 1991. Geochemistry and mineralogy of fumarolic deposits, Valley of Ten Thousand Smokes, Alaska: Bulk chemical and mineralogical evolution of dacite-rich protolith. American Mineralogist 76: 1662-1673.
Poormirzaee, R.; Oskouei, M. 2010. Use of spectral analysis for detection of alterations in ETM data, Yazd, Iran. Applied Geomatics 2: 147-154
Porter, A. 2000. The initial exploration of lower Lae’apuki cave system, Hawai’I volcanoes national park. NSS News 58: 10-17.
Pritchard, M.E.; Simons, M. 2004. An InSAR-based survey of volcanic deformation in the central Andes. Geochemistry, Geophysics and Geosystems 5: Q02002.
Rasmussen, R A.; Khalil, M.A.K.; Dalluge, R.W.; Penkett, S.A.; Jones, B. 1982. Carbonyl sulfide and carbon disulfide from the eruptions of Mount St. Helens. Science 215 (4533): 665-667.
Rodríguez, I.; Moune, S.; Aguilera, F.; Campos, E.; Roche, O. 2013. Insights on degassing processes of Lastarria volcano (north Chile) via melt inclusion investigations. Bolletino de Geofisica Teorica ed Applicata, Vol. 54: 190-193.
Rosso, K.M.; Bodnar, R.J. 1995. Microthermometric and Raman spectroscopic detection limits of CO2 in fluid inclusions and the Raman spectroscopic characterization of CO2. Geochimica et Cosmochimica Acta 59: 3961-3975.
Rouse, J.; Haas, R.; Schell, J.; Deering, D. 1973. Monitoring vegetation systems in the Great Plains with ERTS. In ERTS Symposium, No. 3, Actas: 309-317. College Station.
Ruch, J.; Anderssohn, J.; Walter, T.R.; Motagh, M. 2008. Caldera-scale inflation of the Lazufre volcanic area, South America: evidence from InSAR. Journal of Volcanology and Geothermal Research 137: 337-344.
Rye, R.; Bethke, P.; Lanohere, M.; Steven, T. 2000. Neogene geomorphic and climatic evolution of the central San Juan Mountains, Colorado: K/Ar age and stable isotope data on supergene alunite and jarosite from the Creede mining district. In Ancient Lake Creede: Its volcano-tectonic setting, history of sedimentation, and relation to mineralization in the Creede mining district (Bethke, P.; Hay, R.; editors). Geological Society of America: 95-103.
Sabins, F. 1997. Remote sensing-Principles and Inter-pretation. W.H. Freeman: 494 p. New York.
Sabins, F. 1999. Remote sensing for mineral exploration. Ore Geology Reviews 14: 157-183.
Salomonson, V.; Appel, I. 2004. Estimating fractional snow cover from MODIS using the Normalized Difference Snow Index (NDSI). Remote Sensing of Environment 89: 351-360.
Scher, S. 2012. Fumarolic activity, acid-sulfate alteration and high-sulfidation epithermal precious metal mineralization in the crater of Kawah Ijen volcano (Java, Indonesia). Ph.D. Thesis (Unpublished), McGill University: 114 p.
Segal, D. 1983. Use of Landsat multispectral scanner data for definition of limonitic exposures in heavily vegetated areas, El Paso, Texas. Economic Geology 78: 711-722.
Singh, A.; Harrison, A. 1985. Standarized principal com-ponents. International Journal of Remote Sensing 6: 883-896.
Stix, J.; Morrow, W.H.; Nicholls, R.; Charland, A. 1996. Infrared remote sensing of CO and COS gas emitted by the Galeras volcano, Colombia. Canadian Journal of Remote Sensing 22: 297-304.
Symonds, R.; Rose, W.; Reed, M.; Lichte, F.; Finnegan, D. 1987. Volatilization, transport and sublimation of metallic and non-metallic elements in high temperatures gases of Merapi volcano, Indonesia. Geochimica et Cosmochimica Acta 51: 2083-2101.
Symonds, R.; Rose, W.; Gerlach, T.; Briggs, P.; Harmon, R. 1990. The evaluation of gases, condensates and SO2 emissions from Augustine volcano, Alaska: the degassing of a Cl-rich volcanic system. Bulletin of Volcanology 52: 355-374.
Symonds, R.; Reed, M.; Rose, W. 1992. Origin, speciation and fluxes of trace element gases at Augustine volcano, Alaska: Insights into magma degassing and fumarolic processes. Geochimica et Cosmochimica Acta 56: 633-657.
Taran, Y.; Hedenquist, J.; Korzhinsky, M.; Tkachenko, S.; Shmulovich, K. 1995. Geochemistry of magmatic gases from Kudryavy volcano, Iturup, Kuril Islands. Geochimica et Cosmochimica Acta 59: 1749-1761.
Taran, Y.; Bernard, A.; Gavilanes, J.; Lunezheva, E.; Cortés, A.; Armienta, M. 2001. Chemistry and mineralogy of high-temperature gas discharges from Colima volcano, Mexico. Implications for magmatic gas-atmosphere interaction. Journal of Volcanology and Geothermal Research 108: 245-264.
Tedesco, D. Toutain, J. 1991. Chemistry and emission rate of volatiles from White Island volcano (New Zealand). Geophysical Research Letters 18: 113-116.
Thornburg, T.; Kulm, L. 1987. Sedimentation in the Chile trench: Depositional morphologies, lithofacies

196 HydrotHermal alteration, fumarolic deposits and fluids from lastarria Volcanic complex...
and stratigraphy. Geological Society of American Bulletin 98: 33-52.
Trumbull, R.B.; Wittenbrink, R.; Hahne, K.; Emmermann, R.; Büsch, W.; Gerstenberger, H.; Siebel, W. 1999. Evidence for late Miocene to recent contamination of arc andesites by crustal melts in the Chilean Andes (25-26°S) and its geodynamic implications. Journal of South American Earth Sciences 12: 135-155.
Van Bergen, M.; Bernard, A.; Sumarti, S.; Sriwana, T.; Sitorus, K. 2000. Crater lakes of Java: Dieng, Kelud and Ijen. Excursion Guidebook, International Associa-tion of Volcanology of the Earth’s Interior (IAVCEI), General Assembly: 43 p. Bali.
Vaselli, O.; Tassi, F.; Montegrossi, G.; Capaccioni, B.; Giannini, L. 2006. Sampling and analysis of fumarolic gases. Acta Vulcanologica 18: 65-76.
White, S.N. 2009. Laser Raman spectroscopy as a tech-nique for identification of seafloor hydrothermal and cold seep minerals. Chemical Geology 259: 240-252.
White, W. 2010. Secondary minerals in volcanic caves: Data from Hawai’i. Journal of Caves and Karst Stud-ies 72: 75-85.
Wohletz, K.; Heiken, G. 1992. Volcanology and geothermal energy. University of California Press: 450 p. Berkeley.
Yajima, J. 1979. Neogene mineralization of the Teine-Chitose district, west Hokkaido, Japan. Bulletin of the Geological Survey of Japan 30: 645-674.
Yudovskaya, M.; Tessaline, S.; Distler, V.; Chaplygin, I.; Chugaev, A.; Dikov, Y. 2008. Behavior of highly-siderophile elements during magma degassing: A case
study at the Kudryavy volcano. Chemical Geology 248: 318-341.
Zaitsev, A.; Keller, J. 2006. Mineralogical and chemical transformation of Oldoinyo Lengai natrocarbonatites, Tanzania. Lithos 91: 191-207.
Zelenski, M.; Fischer, T.; de Moor, M.; Marty, B.; Zim-mermann, L.; Ayalew, D.; Nekrasov, A.; Karandashev, V. 2013. Trace elements in the gas emissions from the Erta Ale volcano, Afar, Ethipia. Chemical Geol-ogy 357: 95-116
Zelenski, M.; Malik, N.; Taran, Y. 2014. Emissions of trace elements during the 2012-2013 effusive eruption of Tolbachik volcano, Kamchatka: enrichment fac-tors, partition coefficients and aerosol contribution. Journal of Volcanology and Geothermal Research 285: 136-149.
Zhitova, L.; Sharygin, V.; Nigmatulina, E.; Zhitov, E. 2009. Fairchildite K2Ca(CO3)2 in carbonatites at Loolekop mine, Palabora Igneous complex. Geochemistry of Magmatic Rocks International Conference, No. 26, Actas: 1 p. Moscow.
Zimbelman, D.; Rye, R.; Brieit, G. 2005. Origin of secondary sulfate minerals on active andesitic stratovolcanoes. Chemical Geology 215: 37-60.
Zoller, W.; Gladney, E.; Duce, R. 1974. Atmospheric concentrations and sources of trace metals at the South Pole. Science 183: 198-200.
Zoller, W.; Parrington, J.; Phelan Kotra, J. 1983. Iridium enrichment in airborne particles from Kilauea volcano: January 1983. Science 222: 4-7.
Manuscript received: January 28, 2016; revised/accepted: April 01, 2016; available online: April 01, 2016.