Embed Size (px)
Citation preview

HYDROLYSIS OF TITANIC ACID IN HYDROCHLORIC ACID SOLUTION FOR
SYNTHESIS OF TIO2 POWDER WITH CONTROLLED PARTICLE SIZE:
PROCESSES, MORPHOLOGY, AND KINETICS STUDY
by
Zhe Huang
A thesis submitted to the faculty of
The University of Utah
in partial fulfillment of the requirements for the degree of
Master of Science
Department of Metallurgical Engineering
The University of Utah
December 2017

Copyright © Zhe Huang 2017
All Rights Reserved

ii
ii
T h e U n i v e r s i t y o f U t a h G r a d u a t e S c h o o l
STATEMENT OF THESIS APPROVAL
The thesis of Zhe Huang
has been approved by the following supervisory committee members:
Zhigang Zak Fang , Chair 03/10/2017
Date Approved
Michael Free , Member 03/10/2017
Date Approved
Ying Zhang , Member
Date Approved
and by Manoranjan Misra , Chair/Dean of
the Department of Metallurgical Engineering
and by David B. Kieda, Dean of The Graduate School.

ABSTRACT
A method for producing pure titanium dioxide with controlled particle size and
morphology has been developed. The TiO2 powder produced by this method can be used
as the starting material to produce pure Ti metal powder.
In this method, the upgraded Ti-slag (UGS) is used as the starting material. Upgraded
Ti-slag is first roasted with NaOH to produce sodium titanate. The roasted product is
washed by water to remove alkaline soluble impurities like Si and Al. The titanate is then
dissolved into HCl solution and filtered to prepare the solution for hydrolysis of titanic acid.
Hydrolysis of titanic acid is performed at different temperatures with varied free acid
concentration and equivalent TiO2 concentration. The titanic acid is then calcined to
remove combined water to produce TiO2 powder. The particle size and morphology of the
titanic acid particles produced by this method depend strongly on factors including
temperature, free acid concentration, equivalent TiO2 concentration, and agitation. To
optimize the parameters of the hydrolysis process, a systematic parametric study was
conducted.
TiO2 powders with different morphology and particle size were obtained. The desired
morphology of TiO2 powder is determined to be around 30µm, with a round shape and
smooth surface. Porosity was found on the surface of TiO2 particles after calcination. The
dependence of particle size and morphology of solid titanic acid particles on those process
parameters was studied.

iv
The effect of the process parameters on the kinetics of the hydrolysis process were also
studied. The mechanisms of nucleation and growth of titanic acid particles during
hydrolysis was discussed.

TABLE OF CONTENTS
ABSTRACT ....................................................................................................................... iii
LIST OF TABLES ............................................................................................................ vii
ACKNOWLEDGMENTS ............................................................................................... viii
Chapters
1 INTRODUCTION ....................................................................................................... 1
Ti and TiO2 ..................................................................................................... 1 HAMR process................................................................................................ 3
Hydrolysis of titanic acid ................................................................................ 3
2 RESEARCH SCOPE AND OBJECTIVES ................................................................. 7
Research scope ................................................................................................ 7 Research objectives ......................................................................................... 9
3 LITERATURE REVIEW .......................................................................................... 11
The synthesis of TiO2 ................................................................................... 11 Sulfate process .................................................................................. 11 Chloride process ............................................................................... 14 Others ................................................................................................ 16
Hydrolysis ..................................................................................................... 17 Nucleation and crystal growth theory ............................................... 17
Application of hydrolysis .................................................................. 19
4 PARAMETIC STUDY OF HYDROLYSIS OF TITANIC ACID ............................ 23
Introduction ................................................................................................... 23 Experimental ................................................................................................. 24
Preparation of hydrolysis solution .................................................... 24
Hydrolysis and calcination ................................................................ 26 The analysis of equivalent TiO2 and free acid concentration ........... 28
Results and discussion .................................................................................. 29
Purity ................................................................................................. 29

vi
Calcination ........................................................................................ 33 Effect of temperature ........................................................................ 35 Effect of free acid concentration ....................................................... 35
Effect of initial equivalent TiO2 concentration ................................. 39 Summary ....................................................................................................... 41
5 KINETICS AND MECHANISM .............................................................................. 66
Hydrolysis kinetics........................................................................................ 66 Effect of free acid concentration on kinetics .................................... 67 Effect of equivalent TiO2 concentration on kinetics ......................... 68
Hypothetical mechanisms of hydrolysis of titanic acid ................................ 68
6 CONCLUSIONS ....................................................................................................... 77
REFERENCES ................................................................................................................. 79

LIST OF TABLES
Tables
4.1 Chemical composition of upgraded Ti slag .......................................................... 43
4.2 Singe effect study on free acid conc. on hydrolysis at varied TiO2...................... 46
4.3 Fe content before and after hydrolysis of titanic acid ........................................... 47
4.4 Chemical composition of the dried residue and the impurity removal rates ........ 48
4.5 Chemical composition of the solution before and after hydrolysis (mg/L) .......... 48
4.6 Comparison of the impurity contents in rutile prepared by this work and in
commercial pigment grade rutile(cite), wt% .............................................................. 48
4.7 The change of crystal size of titanic acid particles before and after calcination .. 49
4.8 Experimental design of the effect of temperature on hydrolysis rate ................... 53
4.9 Particle size and standard deviation of titanic acid particles from 40g/L of equi.
TiO2 at varied free acid concentration. ....................................................................... 58
4.10 Particle size and standard deviation of titanic acid particles from 40g/L of equi.
TiO2 at varied free acid concentration. ....................................................................... 59
4.11 Particle size and standard deviation of titanic acid particles from 40g/L of equi.
TiO2 at varied free acid concentration ........................................................................ 60
4.12 The particle size distribution data of titanic acid from different TiO2 concentration
at same free acid concentration ................................................................................... 64

viii
ACKNOWLEDGMENTS
I would like to thank my supervisor, Dr. Zhigang Zak Fang, for his support and
guidance during my graduate study period. Dr. Fang’s strict academic attitude and
professional work ethics keep inspiring me to become a better researcher. I would like to
thank Dr. Ying Zhang for giving me so much valuable advice and teaching me so many
experimental skills. I would like to thank Dr. Michael L. Free for his guidance and
suggestions on my thesis.
In addition, I would like to thank my colleagues, Dr. Yang Xia, Dr. Pei Sun, Hyrum
Lefler, Tuoyang Zhang, Yanshan Lu, Huan Zhang, Matt Dunstan, Chai Ren, and Yuxuan
Zhang for their help and accompany. Also, I am thankful to my family for their support
and encouragement in the past years. Lastly, I would like to thank ARPA-E of the US
Department of Energy (DOE) for the financial support of this work.

CHAPTER 1
1 INTRODUCTION
Ti and TiO2
Titanium is known for its wonderful properties such as high strength, light weight,
corrosion resistance, and bio-compatibility[1]. Titanium has been applied in aerospace,
army, mobile cars, biomedical engineering, sports, and many other fields[2]. However, the
market for titanium is limited due to the high cost of titanium manufacture[3].
Titanium is the 9th most abundant metal on the earth. The reason for the high price of
titanium is mainly due to its difficulty of extraction which is because of its high affinity to
oxygen. In industry, titanium is produced by the Kroll process commercially. It usually
starts with Ti-slag or synthetic rutile. The feed material goes through reduction of ilmenite,
the chlorination of Ti slag, the purification of TiCl4, the Mg reduction of TiCl4, the
distillation separation of MgCl2 and Mg, and the final stage of collection of sponge Ti[4].
Many steps such as Mg reduction of TiCl4 and distillation of MgCl2 are energy intensive
which require high temperature and long amounts of time. The Kroll process is also a batch
process which makes the extraction of titanium an expensive process.
Titanium dioxide is the oxide form of Ti metal. TiO2 occurs in nature in three major
forms: anatase, rutile, and brooktite. The typical minerals for TiO2 is ilmenite which
contains around 40-50 wt% of TiO2. TiO2 also occurs in nature as rutile, which contains
more than 90% TiO2. The occurrence of nature rutile is very rare now. Titanium dioxide is

2
known for its high refractive index, negligible color, photoactivity and inertness. It has
been widely used in paints, paper plastics, ceramics, cosmetics, surface coating, photo-
catalyst and dye-sensitized solar cells[5].
Industrially, there are two major methods for producing TiO2: the sulfate process and
chloride process. For the sulfate process, ilmenite is used as the starting material. The
production of pigment grade TiO2 involves sulfuric acid dissolving, precipitation of ferrous
sulfate, filtering, hydrolysis of titanic acid, washing, calcination, and post treatment[6]. As
for the chloride process, ilmenite ore is first reduced by coke to obtain Ti-slag with 60-70%
TiO2. Ti-slag will go through some further purification to obtain upgraded Ti-slag or
synthetic rutile which contains around 90% TiO2. Then upgraded Ti-slag goes through
chlorination, purification, oxidization, calcination, and surface treatment to produce
pigment grade TiO2[7].
Many attempts have been made to reduce the cost of Ti making which can be divided
into two major categories: electrochemical reduction methods and thermal reduction
methods. FFC is an electrochemical reduction process of Ti in CaCl2 electrolyte[8] and
TiO2 cathode and carbon anode. Armstrong process is a thermal reduction method which
uses Na for the reduction of TiCl4 process. In addition, there are many other reports on
using Mg or Ca vapor to reduce TiO2 pellets directly[9].
The HAMR (hydrogen assisted magnesium reduction) process is a new method of
producing Ti metal proposed by Dr. Fang[1]. It uses Mg powder to reduce TiO2 powder in
a H2 atmosphere at an elevated temperature. The reduced TiO2 powder will go through a
second reduction step using Mg powder for deoxygenation to make Ti powder. The starting
TiO2 powder for Mg reduction is 25-40 µm, monodispersed, round particles made from

3
hydrolysis. This thesis will focus on the process of making TiO2 powder by hydrolysis in
terms of its process parameters, products characterizations, and kinetics study.
HAMR process
HAMR stands for hydrogen assisted magnesium reduction. The HAMR process is a
new method for synthesizing Ti metal powder proposed by Dr Fang. The whole process
consists of two major steps: Mg reduction of TiO2 powder in H2 atmosphere and Mg
deoxygenation of TiH2 powder. The strong ability to remove oxygen in TiO2 using the
HAMR process has been demonstrated experimentally.
In the HAMR process, TiO2 powder is reduced by Mg powder at 750℃ for 6 hr in H2
atmosphere. TiO2 will be converted to TiH2 with less than 1% oxygen. Mg will be
converted to MgO. The excess Mg and MgO formed during the reduction can be removed
by leaching using hydrochloric acid.
The oxygen content in the TiH2 is around 0.5-1 wt% after Mg reduction. To meet the
ASTM specification for sponge Ti which is 0.15%, the oxygen in TiH2 can be further
removed by a deoxygenation step using either Mg or Ca powder. The procedures of the
HAMR process are shown in Figure 1.1.
Hydrolysis of titanic acid
In this work, the production of TiO2 powder starts with upgraded Ti-slag (UGS)
provided by RTIT in Quebec. UGS is extracted from ilmenite which is the titanium-iron
oxide mineral. Ilmenite is reduced by coke to separate the iron with TiO2 and will go
through a series of purification processes to obtain upgraded-Ti slag. UGS contains around
94.5% of TiO2. The main impurities in UGS are Fe2O3, SiO2, MgO, and Al2O3[10]. UGS

4
is purified using the alkaline roasting and hydrolysis (ARH) process to produce pure TiO2
powder. The general procedures of ARH are introduced below.
UGS is mixed with NaOH pellets and roasted at 500 ℃ for 2.5 hr. The roasted UGS is
then washed by water to remove the extra sodium hydroxide. During roasting, TiO2 is
converted into Na2TiO3, and SiO2 is converted to Na2SiO3. The roasted UGS is then
washed with water to remove the alkaline soluble impurities like Na2SiO3 and NaAlO2. The
washed product is filtered and dried in air.
Roasting UGS powder with sodium hydroxide pellets at an elevated temperature will
transform TiO2 into sodium titanate, the ideal formula of which is Na2TiO3. Compared with
UGS, sodium titanate can be dissolved in HCl solution almost completely at 50℃. Alkaline
roasting serves as a very important step in the preparation of the hydrolysis solution.
Besides, impurities like Si and Al can be removed in this step.
Water washed product is dissolved in hydrochloric acid to prepare a solution with a
certain concentration of equivalent TiO2 and free acid. The solution is filtered to removed
undissolved solids. The solution is then heated up to 100C and stirred at 250rpm for 16 hr
to synthesize titanic acid. Titanic acid is filtered and then washed by 6M HCl, water, and
ethanol. The dried titanic acid is calcined to remove the combined water to make TiO2
powders.
Hydrolysis is a selective precipitation process of titanic acid as solid particles out of
the solution. Titanic acid is titanium oxide with hydrated water which is often expressed as
TiO2·xH2O. Many impurities like Fe, Mg, and Al ions will remain in the solution during
hydrolysis. Besides purification, the most important purpose of hydrolysis is to obtain
titanic acid particles with controlled morphology in terms of particle size, shape, surface
5
area, etc.
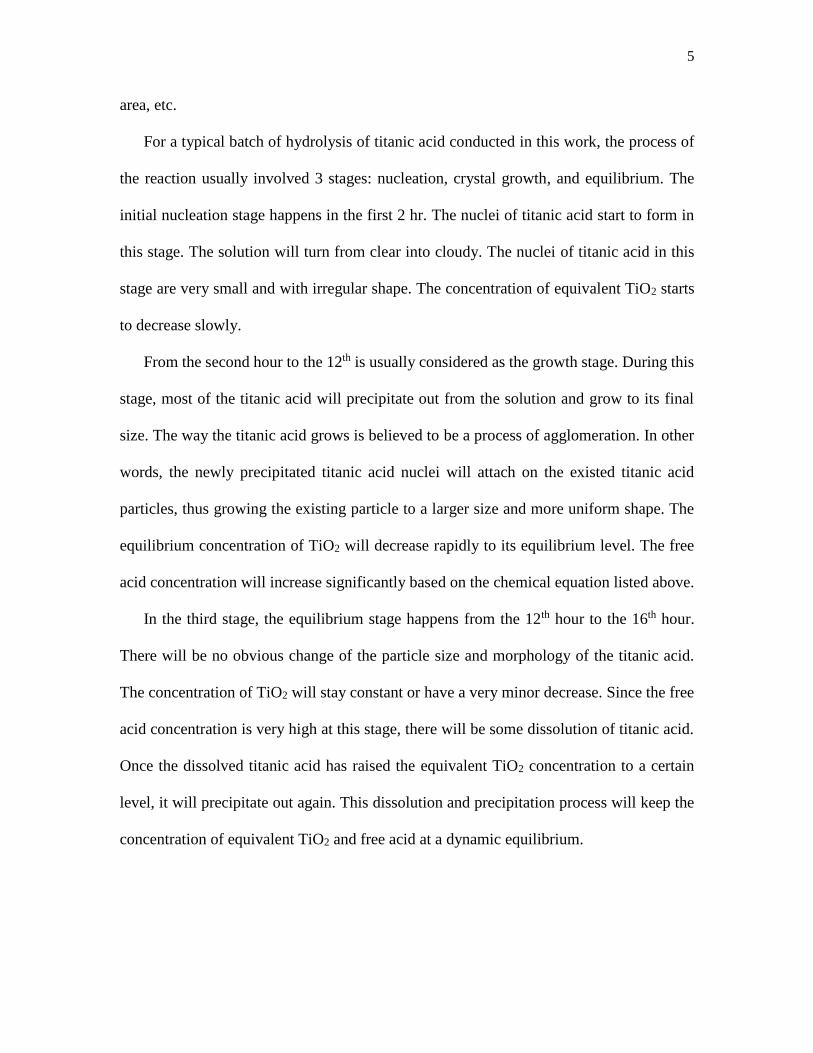
For a typical batch of hydrolysis of titanic acid conducted in this work, the process of
the reaction usually involved 3 stages: nucleation, crystal growth, and equilibrium. The
initial nucleation stage happens in the first 2 hr. The nuclei of titanic acid start to form in
this stage. The solution will turn from clear into cloudy. The nuclei of titanic acid in this
stage are very small and with irregular shape. The concentration of equivalent TiO2 starts
to decrease slowly.
From the second hour to the 12th is usually considered as the growth stage. During this
stage, most of the titanic acid will precipitate out from the solution and grow to its final
size. The way the titanic acid grows is believed to be a process of agglomeration. In other
words, the newly precipitated titanic acid nuclei will attach on the existed titanic acid
particles, thus growing the existing particle to a larger size and more uniform shape. The
equilibrium concentration of TiO2 will decrease rapidly to its equilibrium level. The free
acid concentration will increase significantly based on the chemical equation listed above.
In the third stage, the equilibrium stage happens from the 12th hour to the 16th hour.
There will be no obvious change of the particle size and morphology of the titanic acid.
The concentration of TiO2 will stay constant or have a very minor decrease. Since the free
acid concentration is very high at this stage, there will be some dissolution of titanic acid.
Once the dissolved titanic acid has raised the equivalent TiO2 concentration to a certain
level, it will precipitate out again. This dissolution and precipitation process will keep the
concentration of equivalent TiO2 and free acid at a dynamic equilibrium.

6
Figure 1.1 Flow chart of HAMR proces

CHAPTER 2
2 RESEARCH SCOPE AND OBJECTIVES
Research scope
As discussed in the previous section, to meet the specification of ASTM standard for
Ti sponge, the oxygen content of final Ti product has to be as low as 0.15 wt%. In the
HAMR process, to reduce the oxygen in TiO2 powder, the step of Mg reduction itself plays
a vital role in terms of many factors including reduction time, temperature, excess ratio,
etc. Besides, it has been found that using feeding TiO2 powder with well-controlled size
and morphology can significantly help facilitating the effect of Mg reduction. Therefore,
the goal of this work is to prepare pure TiO2 powder with suitable size and morphology
that can be used as the feed material for Ti production.
Because of titanium’s high affinity to oxygen, titanium powder with small particle size
(several microns) can easily pick up the oxygen in the air due to its large surface area which
will increase the final oxygen content[11]. On the other hand, oversized TiO2 powder can
hinder the Mg reduction by slowing down the reaction. However, on the current market,
the commercial TiO2 powder produced by either the chloride process or sulfate process has
very small particle size which is around several hundred nanometers. Meanwhile, although
there have been a great amount of investigations about the synthesis of TiO2 powder,
almost all of the products reported have nanosized particles which are usually applied in
the field such as solar cells, photo catalysts, and pigments[12, 13]. The morphology of

8
TiO2 powder also needs to be controlled. In general, irregular and complex morphology
can cause a higher surface area which increases the risk of oxygen pick-up for Ti powder
after reduction. Besides, compared with agglomerated particles, monodispersed powder is
preferred since it ensures a more complete leaching of excess Mg and by-product MgO. As
for the TiO2 powder on the market, the particles are agglomerated together and in irregular
shape.
Therefore, it is very important to find a way to prepare TiO2 powder with size and
morphology that is most efficient for Ti production. In this study, a new method for
producing TiO2 powder with controlled size and morphology through hydrolysis in HCl
solution was proposed. As mentioned earlier, most investigations in this field have been
focusing on producing nanosized TiO2 powder for traditional applications. Only a few
studies have been found that can produce TiO2 with around 15um particle size[14].
In this work, the alkaline roasted upgraded Ti-slag is first dissolved into HCl solution
to prepare hydrolysis solution. Hydrolysis of titanic acid is then performed at various
temperatures and free acid concentration. Among all the steps, hydrolysis of titanic acid is
the key step for controlling the particle size and morphology of TiO2 powder. A possible
hydrolysis reaction is expressed as:
Ti4+ + 4H2O = TiO2·xH2O + 4H+
The particle size and morphology of the titanic acid particles produced by this method
depend strongly on factors including temperature, free acid concentration, equivalent TiO2
concentration, etc.
According to the preliminary results, many different morphologies of TiO2 powder
such as needles, porosities, bumps, agglomerations, broken pieces, etc. were observed. At

9
the same time, particle size for a single particle can be varied from nanosize to nearly 60um.
To optimize the parameters of the hydrolysis process and get consistent products, a
systematic parametric study is conducted to evaluate the dependence of particle size and
morphology of solid titanic acid particles on those process parameters. The effects of the
process parameter on the kinetics and the hypothetical mechanisms of the hydrolysis
process are also studied. See Figure 2.1 for the comparison of commercial TiO2 and TiO2
produced by in this work.
Research objectives
Therefore, the research objectives in this works are:
1. To optimize the parameters for each unit process of TiO2 production including
milling, roasting, dissolving, hydrolysis, and calcination.
2. To prepare high purity TiO2 powder with controlled size and morphology using
upgraded Ti slag as raw material.
3. To investigate the effect of free acid concentration and initial equivalent TiO2
concentration on particle size, morphology, and hydrolysis rate of titanic acid
particles.
4. To determine optimized parameters for producing TiO2 powder with desired
particle size and morphology for the HAMR process.
5. To try to understand the mechanisms of hydrolysis of titanic acid.

10
Figure 2.1 A comparison of TiO2 powder produced in this work and commercial TiO2
produced by sulfate process. a) TiO2 produced in this work, b) commercial TiO2.
a) b)

CHAPTER 3
3 LITERATURE REVIEW
The synthesis of TiO2
Sulfate process
The sulfate process is the traditional process for making TiO2 powder which uses
concentrated sulfuric acid to dissolve titanium ore to convert the Ti compound in the ore
to a Ti-bearing solution[15]. After the Ti-bearing solution is purified, it goes through
hydrolysis to produce hydrated TiO2 which is then washed, calcined, and posttreated to
make final TiO2[16]. The process can vary depending on the grade of final product and the
starting material.
The sulfate process typically contains five major steps: the preparation of Ti-bearing
solutions, the hydrolysis of Ti-bearing solutions, the washing of titanic acid, the calcination
of titanic acid, and posttreatment of TiO2. The production of pigment grade TiO2 usually
has the most complicated processes.
The preparation of Ti-bearing solution includes acid dissolution, reduction of Fe3+,
settling, low temperature crystallization, filtration of ferrous sulfate, and concentration of
Ti-bearing solution. The starting material for the sulfate process can be ilmenite or Ti slag.
When ilmenite is chosen as the starting material, it is mixed with 92 to 98 wt% sulfuric
acid and a certain amount of water. The water added to the mixture will generate some heat
that can help the dissolution process. Water vapor is then applied to the mixture to trigger
12
the main reaction of dissolving. It usually takes about 5 to 10 minutes of heating before the
reaction can start. The reactions during acid dissolution are shown below,
FeTiO3 + 3H2SO4 = Ti(SO4)2 + FeSO4 + 3H2O
FeTiO3 + 2H2SO4 = TiOSO4 + FeSO4 + 2H2O
Fe2O3 + 3H2SO4 = Fe2(SO)4 + 3H2O
Other impurities like MgO, CaO, and Al2O3 also react with sulfuric acid to form their
sulfate salts.
Fe is a major impurity in ilmenite which has to be removed before hydrolysis. The
solubility of FeSO4 in Ti bearing solution decreases with the decrease of temperature. After
the temperature of the solution is cooled down to under 0 ℃, Fe will crystallize in the form
FeSO4·7H2O and precipitate out of the solution[17].
After the removal of Fe, the solution is further purified by filtering to remove the
undissolved small solid particles. These small particles have to be removed before
hydrolysis, otherwise they could become nucleation centers for titanium acid nuclei[18].
Titanic acid nuclei forming on these small particles will have poor morphology.
The composition of Ti bearing solution has to be adjusted to a certain level before
hydrolysis. Usually, the concentration of equivalent TiO2 concentration is adjusted to
200~240g/L. The Ti bearing solution is concentrated by evaporating the water under a
pressure lower than one atmosphere. It keeps the boiling point of the solution lower than
80C to prevent hydrolysis[19].
Hydrolysis is the key step to control the quality of the final TiO2 powder. Factors
including equivalent TiO2 concentration, F value, Ti/Fe ratio, and stability of the solution
can all influence the quality of titanic acid in terms of morphology, purity, and particle size.

13
The equivalent TiO2 concentration and F value are the two key factors for hydrolysis in
sulfate process which are introduced in detail below.
For pigment grade TiO2, the concentration of TiO2 is usually controlled at 200~240g/L.
For non-pigment grade TiO2, the concentration of TiO2 is around 160g/L. It is reported that
high concentration of TiO2 can increase the whiteness of TiO2 and low concentration of
TiO2 can increase the yield of hydrolysis.
F value is another important factor during the hydrolysis of sulfate process. The sulfuric
acid used for dissolving titanium ores can be divided into three parts. The first part of
sulfuric acid reacts with the Ti in titanium ores during acid dissolution. The second part of
sulfuric acid reacts with other compounds in titanium ores. The third part is excess sulfuric
acid which is referred to free acid. The sum of the first and the third parts of sulfuric acid
is called effective acid. The concentration ratio of the effective acid to TiO2 in Ti bearing
solution is the F value[20]. Different F values will result in different TiOSO4 to Ti(SO4)2
ratio in the solution which will affect the nucleation and growth of titanic acid during
hydrolysis. Besides, the F value will have a great effect on the yield of titanic acid as well
as the initial particle size of titanic acid.
The purified Ti bearing solution with proper equivalent TiO2 concentration and F value
is ready for hydrolysis. The solution is kept boiling during hydrolysis in the sulfate process.
The chemical reaction of hydrolysis of titanic acid is shown below.
TiOSO4 + nH2O = TiO2·(n-1)H2O + H2SO4
Hydrolysis is performed at a very high acid concentration. As the hydrolysis reaction
goes on, the SO42- combined with TiO2+ will be released and react with H+ in the water to
form H2SO4, thus increasing the free acid concentration in the solution. TiO2+ will react

14
with OH- in water to form titanic acid. Most impurity cations will remain in the solution
during hydrolysis at such a high acid concentration.
In the sulfate process, seeds are added into the Ti bearing solution before hydrolysis.
The presence of seeds can accelerate the hydrolysis reaction and increase the yield of titanic
acid as well as improving the quality of final TiO2 powder[21]. There are two types of
seeds which are self-generated seeds and external seeds. Self-generated seeds are produced
by adding hydrolysis solution into boiling water. The rest of hydrolysis solution is then
added gradually. External seeds are added after the hydrolysis solution is heated up to 80℃.
The hydrolysis solution is then boiled for 3 to 4 hr before the end of hydrolysis[22].
The titanic acid after hydrolysis is washed by water to remove the attached hydrolysis
solution. The titanic acid is first separated from the hydrolysis solution by a vacuum filter.
A filter cake will form on the filter cloth during filtering. Washing solution is then added
to the top of the filter cake to flush the attached hydrolysis solution away. The temperature
of washing solution is usually kept at 40℃ to increase the solubility of FeSO4. Titanic acid
is then calcined to remove hydrated water to make TiO2 powder. TiO2 powder will go
through a series of posttreatment to improve its quality.
Chloride process
Upgraded Ti slag is usually used as the starting material in the chloride process.
Upgraded Ti slag is first reacted with chlorine gas to transfer the TiO2 and other oxides
into their chlorides.
The other impurities like SiCl4, AlCl3, FeCl3, FeCl2, VOCl3, TiOCl2, Cl2, and HCl are
mixed with TiCl4 after chlorination[23]. The mixture is a cloudy solution that is red brown
in color. TiCl4 has to be separated from those impurities before the oxidization step. The

15
impurities can be divided into 3 categories according to their boiling point. High boiling
point impurities like FeCl3 have very low solubility in TiCl4 solution and stay in the
solution as suspensions. Low boiling point impurities include soluble gas and most liquid
chlorides. These impurities are removed from TiCl4 by distillation. The temperature of
distillation is controlled at around 140 to 145℃ which is a little higher than the boiling
point of TiCl4. Impurities with low boiling points will leave the distillation tower before
TiCl4. TiCl4 will evaporate next when the temperature is increased to 140 to 145℃.
Impurities with high boiling point will stay in the bottom of distillation tower.
Purified TiCl4 is then reacted with oxygen at a high temperature to produce TiO2 and
Cl2. Based on the thermodynamic calculation, from 1600 to 2400 K, the Gibbs free energy
of this reaction is negative which means it can happen spontaneously. Meanwhile, the
conversion of TiCl4 to TiO2 is most complete in this temperature range. The presence of
suboxides like TiO, Ti2O3, and Ti3O5 is very little and TiO2 is almost the only oxide product.
The phase of TiO2 produced in chloride process is rutile since it is a more stable phase than
the anatase phase. The chemical reactions are shown below.
TiCl4 (g) + O2 (g) = TiO2 (s) + 2Cl2 (g)
TiO2(s, A) = TiO2(s, R)
The reaction time is usually controlled between 0.05 to 0.08s. If the reaction time is too
long, the size of the TiO2 particles will increase and thus influence the property of TiO2
product like pigment. To produce TiO2 powder with a mean size of 0.2 µm and narrow
particle size distribution in a short time, 1-2wt% of AlCl3 is added to TiCl4 to promote
nucleation and phase transformation[24]. The chlorine gas produced in this step is collected
and reused in the chlorination step. TiO2 powder will go through a series posttreatment to

16
produce the final TiO2 product.
Others
Many investigators have prepared TiO2 powder using TiCl4 liquid as starting material.
The TiCl4 liquid is mixed with ethanol and water, acid, or other additives. The solution is
next hydrolyzed in organic media at a temperature varying from room temperature to the
boiling point of the solution[12-14, 25]. The chemical reaction is shown below.
Ti(OC2H5)4 + 4H2O = Ti(OH)4 + 4C2H5OH
Ti(OC2H5)4 can also be written as Ti(EtO)4 which is the product of the mixture of TiCl4
and ethanol. Normally, the equivalent concentration of TiO2 is around 10 to 40g/L and the
free acid concentration is 1 to 2 M. TiO2 powder synthesized by this method usually is
nanosized particles with certain morphology such as spheres, pores, rods, and hollow
structure[14, 26-29]. The product is mostly used for photonic catalyst, pigments, and
ceramic. A flow sheet of this process is shown in Figure 3.1.
Eric et al. synthesized monodispersed TiO2 powder of 300 to 600nm with spherical
shape and amorphous structure by hydrolysis of TiCl4 in dilute ethanoic solution[30]. S.
Eiden et al. synthesized TiO2 from Ti(EtO)4 with addition of salt and polymer solution[31].
The TiO2 powder is around 800 to 1000nm with spherical shape, porous surface, and
hollow structure. Wei et al. synthesized TiO2 powder with TiCl4 in hydrochloric acid and
alcohol aqueous solutions at 40-90℃[13]. Rod shaped rutile TiO2 with particle size from
100 to 800nm was produced.
Other investigators have used alkaline roasting to digest titanium feed stocks. The
compounds in Ti feed stocks are converted into their sodium metallate salts during
roasting[32, 33]. TiO2 is converted into Na2TiO3 which is a titanate intermediate that can

17
be dissolved by low-concentration acid. The solution can be used for the hydrolysis of
titanic acid. Compared to sulfate process, the use of concentrated sulfuric acid is avoided
in alkaline roasting process. Liu et al. have roasted upgrade Ti slag (>90% TiO2) using
sodium hydroxide and washed the product with water to prepare Na2TiO3[34]. It is also
reported that they can dissolve the product with sulfuric acid and making nanosized titanic
acid by hydrolysis.
Hydrolysis
Nucleation and crystal growth theory
Hydrolysis is essentially a process of soluble substances that precipitate out from the
pregnant solution. It usually experiences crystal nucleation, crystal growth, and secondary
changes in the resulting crystal suspension such as agglomeration, dissolution, and
precipitation. Depending on the reaction conditions, these processes can proceed either
consecutively or simultaneously throughout the whole hydrolysis process.
The nucleation and crystal growth of solid particles can be described by the Lamer
mechanism based on the nucleation rate and concentration of monomeric species[35-37].
It mainly goes through 3 steps: 1) prenucleation stage, 2) nucleation stage, and 3) growth
stage. The essence of mechanism was illustrated in Figure 3.2. Cs corresponds to the
solubility level of bulk solid. Cmin corresponds to the critical level for nucleation. Cmax
corresponds to the maximum supersaturation.
In a typical hydrolysis system, the monomeric species are initially accumulated in the
system through some reaction from a reservoir of the monomeric species involved in the
system. In prenucleation stage, no appreciable nucleation occurs, even if the concentration
of the monomeric species exceeds the solubility level of bulk solid. The concentration of

18
monomeric species keeps building up until it reaches the critical concentration (Cmin), then
the nucleation can be observed. The nucleation rate is still slow during this stage, but it is
the origin of the nucleation stage[38-40].
In the nucleation stage, the nucleation rate is low at first. However, as the concentration
of monomeric species continues to increase, the nucleation is drastically accelerated. The
concentration of monomeric species will reach the maximum supersaturation level(Cmax).
After the burst of monomeric species, its concentration in the hydrolysis solution starts
to decrease. The nucleation rate keeps increasing which is called a rapid self-nucleation
stage. As the concentration of monomeric species decreases, the nucleation rate will reach
a balance with the consumption rate of monomeric species. This leads us to the crystal
growth stage in which the nucleated crystals aggregate on the formerly nucleated crystals
to grow the crystals into larger particles.
Finally, the concentration of monomeric species will reach its equilibrium in the
hydrolysis solution and stop decreasing anymore. During this time, the crystals tends to
aggregate with other crystals and grow large. Besides, the crystals could be dissolved again
because of the decrease of monomeric species in the solution. The dissolved solution can
also re-precipitate out and form new crystals. This dissolution and precipitation process is
in a dynamic balance.
The behavior of nuclei during nucleation and crystal growth are also studied by many
investigators. The hydrolysis reaction is usually triggered by the high supersaturation of
the monomeric species in the solution. The reaction starts with the nucleation of small
seeds formed at the very beginning of the entire hydrolysis process. Some seeds may
simply be dissolved because they are still in unstable state. Other seeds will reach a balance

19
between generation and either dissolution or growth. The nuclei of radius less than the
critical radius r* will dissolve, while those of radius greater than r* will grow. These grown
seeds become stable nuclei and later turn into the final particles. As the nucleation proceeds,
the supersaturation level will decrease and r* will increase which will slow down the
nucleation rate. The nucleation will come to the end when r* reaches the size of a grown
particle (rp). This point is also the start of crystal growth stage.
3.2.1.1 Application of hydrolysis
Hydrolysis is a common method for synthesizing metal oxides in industry such as
Al2O3, TiO2, SiO2, etc.
Al2O3 is produced by the Bayer process using bauxite (a mixture of Al2O3, Fe2O3, and
SiO2) as raw material. The ore is first digested in a solution of about 30% NaOH at a
temperature between 150℃ and 230℃ in large pressure vessels at a pressure sufficient to
suppress boiling[41, 42]. Silica dissolves in NaOH as sodium silicate which will combine
with sodium aluminate to form an insoluble alumino-silicate. Fe2O3 will form the “red mud”
which is an insoluble material. The solution of NaAlO2 with excess NaOH is separated
from the insoluble mud by settling and filtration.
The solution is then diluted and hydrolyzed in the presence of Al(OH)3 seed to promote
the nucleation of Al(OH)3. The precipitate is next calcined to Al2O3 at 1200-1350℃. The
hydrolysis reaction is shown as follows:
NaAlO2 + H2O = Al(OH)3 + NaOH
It is reported that silica (SiO2) particles with uniform spherical shape were prepared by
hydrolysis of tetra-alkyl silicates and subsequent condensation of silicic acid in alcoholic
solutions containing water and ammonia at low temperatures around room temperature[43].

20
The reaction is as follows:
Si(OC2H5)4 + 4H2O = Si(OH)4 + 4 C2H5OH
Si(OH)4 = SiO2 + 2H2O
The mean size ranged from 0.05 to 2 µm and the mean size could be chosen from this
size range by controlling the compositions of water and the alcohols[44]. Anionic
surfactants, sodium docecyl sulfate, can also be added in the hydrolysis solution to help
control the size of silica particles[45-47].
This method of preparing SiO2 is now widely applied to the synthesis of
monodispersed particles of different metal oxides[48, 49]. Uniform acicular particles of β
-FeOOH are prepared by hydrolysis of Fe3+ ions in dilute FeCl3 solutions for several
months at room temperature[50]. Highly uniform spherical particles of chromium
hydroxide (Cr(OH)3) are formed by hydrolysis of chromium ions in acidic media at around
80℃[51]. Uniform particles of titania (TiO2)[52], and zinc oxide(ZnO)[53] have been
prepared by hydrolysis of corresponding metal alkoxides in alcohol solutions.
During these processes, most of the hydrous metal oxides particles were prepared by
heating dilute solutions of metal salts (10-4 – 10-2 mol/L) over 50 to 150℃ at low pH (1.0-
4.0) for several hours or days. The size of the metal oxide particles prepared can be varied
from nano to submicrometer size, but mostly submicrometer size. The shape of the particles
can also be different depending on the property of metal ions. Shapes such as spheres,
cubes, ellipsoids, and rods have all been reported[54, 55].

21
Figure 3.1 Flow sheet of the hydrolysis in organic media using TiCl4 liquid
TiCl4(l), ethanol, acid, addtives
Hydrolysis
Filtration and wash
Drying
Calcination
TiO2 powder

22
Figure 3.2 The Lamer mechanism of nucleation, the change of concentration of
monomeric species with time[37].

CHAPTER 4
4 PARAMETIC STUDY OF HYDROLYSIS OF TITANIC ACID
Introduction
The hydrolysis of titanic acid in HCl solution is seen as a new approach for producing
TiO2 with relatively large particle size by selectively choosing the parameters. The coarse
TiO2 powder produced by this method can be used as the starting material for Mg reduction
in the HAMR process to make Ti powder.
Hydrolysis is a method that has been used for recovering metal oxides from a pregnant
solution in the form of precipitated metal compounds. In the case of recovering TiO2, the
titanium oxide with hydrated water is precipitated out of the titanium chloride solution in
the form of solid particles. The titanium hydroxide precipitation is a combination of
titanium oxide and hydrated water which is usually referred to as titanic acid in
hydrometallurgy. Ti(OH)4 can also be written as TiO2·2H2O.
Ti4+ + 4H2O = Ti(OH)4 + 4H+
The precipitated titanic acid solids were then seperated from the solution by filtration.
Impurities like Fe, Mg, and Ca stayed in the solution and were thus seperated from TiO2.
However, impurity like silicon will precipitate out along with TiO2 during hydrolysis. Thus,
it is necessary to remove the silicon before hydrolysis. The impurity in the TiO2 will
directly go into the final Ti powder. The mechanical properties are highly dependent on the
purity content of Ti powders. Impurity removal will be discussed in detail in this chapter.

24
Once the titanic acid was washed and dryed, it was calcined at an elevated temperature
to remove the hydrated water. The crystal structures of the titanic acid were rutile which is
determined by XRD. The crystal structure stays the same through the calcination process.
As for the sulfate process, both rutile and anatase particles can be produced.
Though a lot of investigations have been done on the hydrolysis of chloride solutions
to produced TiO2 nanoparticles, there is currently no commercial pigment production using
the hydrolysis of chloride solutions. Moreover, only very limited work can be found on
using chloride solutions to produce monodispersed TiO2 with large particle size. It is
attributed to the application of TiO2 powder, such as paint, photo catalysis, and surface
coating, which demands nano-sized TiO2 powder from conventional production methods.
Our preliminary work has demonstrated that many factors including equivalent TiO2
concentration, free acid concentration, temperature, and time have great effects on the
particle size and morphology of the TiO2 powder made by hydrolysis. A parametric study
has been conducted to determine the effects of various hydrolysis parameters on the
recovery and quality of TiO2 from Ti bearing solution. The products were characterized
with respect to their particle size, morphology, crystal structure, and surface area.
Experimental
Preparation of hydrolysis solution
The starting material for this study was upgraded Ti slag provided by RTIT in Quebec.
It contains around 94.5wt% of TiO2. The main impurities were Fe2O3, SiO2, MgO, and
Al2O3. The chemical composition of upgraded Ti slag is shown in Table 4.1.
The particle size of as-received upgraded Titanium slag was around 200 to 300 µm µm
in irregular shape. The morphology of the as-received UGS is shown in Figure 4.1. To help

25
to achieve a complete conversion in the NaOH roasting step, the upgraded Ti-slag was
milled to minus 20 µm by stainless steel balls in an atritor mill. The mass ratio of ball to
UGS was 2 to 1. The milling was performed in water for 4 hr with a mass ratio of water to
UGS of 1 to 1. The milled UGS was then separated from water by filtration and dried in
air.
The milled UGS was then roasted with NaOH pellets in an Inconel crucible in a box
furnace. The milled UGS was blended with NaOH pellets at a mass ratio of 1 to 1.5 in an
agitator. The roasting was conducted at 500℃ for 6 hr. Based on the current capacity of
our lab, 1 kilogram of milled UGS can be roasted in each batch. During roasting, TiO2 was
reacted with NaOH and transformed into Na2TiO3 and H2O. After the reaction is finished,
the product was washed with water for several times to remove the excess NaOH.
Concentrated HCl solution was added dropwise during washing until the pH of the washing
solution was almost neutral. The washed product was filtrated and dried in air. The major
composition of the product after washing was H2TiO3 along with some impurities like, Na,
Fe, Mg, Ca, etc. The morphology of washed product is shown in Figure 4.2.
The washed product was then dissolved in HCl solution to prepare hydrolysis solution.
The dissolution was performed at 50℃ for 2 hr under continuous stirring. The weight of
the washed product and the concentration and volume of HCl solution were controlled to
achieve a certain composition of equivalent TiO2 and free acid in hydrolysis solution. The
solution was then filtered to remove the undissolved solids. The pregnant solution for
hydrolysis is clear and in dark yellow.

26
Hydrolysis and calcination
Hydrolysis is normally conducted between 90℃ to 100℃ in an oil bath for 16 hr with
continuous stirring. Five milliliter of hydrolysis solution was taken in every 2 hr for the
analysis of the change of equivalent TiO2 concentration with time.
The hydrolysis reactor is shown in Figure 4.3. The volume of the hydrolysis beaker is
around 1.1L. The beaker is sealed by a plastic lid with a rubber O ring inside. The four
openings on the lid were used for taking samples, stirring paddle, condensation, and
thermometer, respectively. Normally, 0.9L of hydrolysis solution is used for each
experiment.
The hydrolysis solution was heated from room temperature to the target temperature in
an oil bath. The solution started to become cloudy when the temperature reached 80℃. The
temperature will stay constant at 90℃ for about 10 minutes. The solution then became a
complete cloudy mixture when the temperature was 95℃. It took approximately 1 hr to
heat the hydrolysis solution from room temperature to 98℃.
The temperature was kept at 98℃ during the entire hydrolysis process. The solution
was stirred continuously at 250rpm using a stirring paddle. A thermometers was used to
keep track of the temperature. During the hydrolysis, a sample of 8 ml solution was taken
in every 2 hr. The samples were analyzed by ICP to determine the change of the equivalent
TiO2 concentration with time. The change of yield with time was thus calculated and
plotted in a curve.
After hydrolysis is completed, the post-hydrolysis solution is filtered to separate the
titanic acid particles from the liquid. The titanic acid was washed by 6M HCl solution for
the first several times to avoid peptization and then washed with DI water to remove the

27
hydrolysis solution attached on the surface of the titanic acid particles. The titanic acid
particles were then dried in air. The particle size of titanic acid particles was measured by
particle size analyzer. The microstructure of titanic acid particles is analyzed by scanning
electron microscopy (SEM).
Titanic acid is normally expressed as TiO2·xH2O. In order to produce TiO2, titanic
acid was calcined to remove the hydrated water. Calcination of titanic acid particles was
performed in a ceramic crucible in a box furnace. The temperature profile of calcination is
shown in Figure 4.4.
After calcination, the TiO2 powder was sieved to collect the powder with the size
favored by the Mg reduction step which is normally from 20 to 45 µm. The crystal structure
of the product from hydrolysis before and after calcination is discussed in detail in this
chapter, as well as the change of morphology of the particles during calcination.
The preliminary results showed that when the equivalent TiO2 concentration was
between 60 to 100g/L and free acid concentration was between 2 to 3M, the particle size
of the titanic acid from hydrolysis was likely to be around 20-45 µm. A series of
experiments were designed to systematically study the effect of free acid concentration on
hydrolysis rate, particle size, and morphology of titanic acid particles at 4 different
equivalent TiO2 concentrations, and the results are shown in this chapter.
The experiment design was shown in Table 4.2. In the first two series of experiments,
the equivalent TiO2 concentration was fixed at 70g/L and 100g/L to evaluate the effect of
free acid concentration on hydrolysis. Four different levels of the free acid concentrations
were chosen at 2M, 2.5M, 3M, and 3.5M. At 40g/L of equivalent TiO2, the free acid
concentrations used were 3.5M, 4M, and 4.5M due to the extremely fast reaction rate at

28
low free acid concentration.
The analysis of equivalent TiO2 and free acid concentration
Equivalent TiO2 concentration and free acid concentration are two essential parameters
for hydrolysis. The composition of hydrolysis solution samples and solid TiO2 powder was
analyzed with ICP-OES. The free acid concentration was measured by titrating the
hydrolysis solution with NaOH solution.
The compositions of solid TiO2 samples were measured to ensure that the impurity
content is low enough to meet the specification of Ti sponge after reduction. TiO2 powder
was roasted with Na2CO3 and H3BO4 (2:1 weight ratio) mixture at 950 ℃ for 10 minutes
in a platinum crucible. The roasted powder was dissolved in 50mL of 18wt% HCl. The
HCl solution was heated and kept boiling until the roasted product was dissolved
completely. The solution was then transferred to a 100ml volume metric flask for ICP
analysis.
A 5ml sample of hydrolysis solution was taken in every 2 hr for ICP analysis to measure
the change of equivalent TiO2 concentration with time. The initial concentration of
equivalent TiO2 is at around 40 to 115g/L according to the experiments’ design. The
content of Ti element that ICP can measure accurately is around 5 to 30ppm. The sample
solution was diluted 2500 times in 5 Vol. % hydrochloric acid for measurement.
The free acid concentration in the experiments design was calculated in theory. The
actual free acid concentration was measured by titration of pre-hydrolysis solution using
NaOH solution. Pre-hydrolysis solution was measured by ICP to know equivalent TiO2
concentration. Five milliliter of 150g/L NaOH solution was put into the flask with 45ml
DI water. Phenolphthalein was used as PH indicator. The burette is filled with pre-

29
hydrolysis solution. The pre-hydrolysis solution was added to the NaOH solution drop by
drop. The change of the volume of pre-hydrolysis solution was measured once the NaOH
solution turned from purple into milky. The concentration of free acid in the pre-hydrolysis
solution was calculated based on the following equation:
c(NaOH)(g/L) * 5ml /40(g/mole) = (c(TiO2) (g/L) / 80(g/mole) * 4 + c (Free acid)) *V(measured)
Results and discussion
Purity
The starting material used for producing TiO2 in this method was upgraded titanium
slag. Upgraded titanium slag is usually called UGS for short. UGS contains 94.5 wt% TiO2.
The chemical composition of UGS in terms of elements is given in Table 3.1. Impurities
like Fe, Si, Mg, and Al have relatively high content.
The impurity content in the TiO2 powder will directly determine the impurity content
in the final Ti powder since there will be no further purification steps in the following
process for Ti production. It is necessary to remove the impurities before Mg reduction of
TiO2. For the HAMR process, to produce Ti powder that can meet the ASTM standard
specification of Ti-sponge (B299-13), the starting TiO2 powder has to be as pure as
possible.
The impurities in the UGS can be classified into two categories: alkali-soluble
impurities including Si, Al, V, Mn, and Cr, and acid-soluble impurities including Fe, Al,
V, Ca, Mg, Si, Mn, and Cr. Most of the impurities do not exist as independent phases; they
form solid solutions with TiO2 in the form of rutile. In other words, most of the impurities
are locked within the lattice of rutile. It will be extremely difficult to purify the UGS by
picking up each impurity out of the lattice. Therefore, the structure of UGS has to be

30
destroyed before the impurities can be exposed.
For typical hydrometallurgical methods, such as the sulfate process, it uses
concentrated sulfuric acid to dissolve ilmenite or Ti slag which forms titanium sulfate
solution. This reaction has to be triggered by water steam. The actual temperature during
the dissolution is around 180 to 190℃. For the chloride process in the Kroll process, Ti-
slag is reacted with chlorine gas and carbon at 1100 ℃ forming TiCl4 and CO2. In these
two commercial methods, the titanium bearing materials are transformed into different
phases as well as the impurities. In other words, the original crystal structure of the titanium
slag is destroyed, so the impurities in the lattice are exposed which makes it possible to
remove them.
Similar to the two processes mentioned above, alkaline roasting of UGS and hydrolysis
of TiO2 use the same principle in terms of purification. During roasting, the TiO2 and other
impurity oxides are converted into sodium metal compound. The roasted product is readily
dissolved in HCl solution. Compared with the two methods above, this work eliminated
the use of concentrated sulfuric acid and high temperature process.
During NaOH roasting, the two categories of impurities go through different changes.
On the one hand, titanium dioxide and alkali-soluble impurities can be transformed during
roasting into their sodium metallate salts, mainly Na2TiO3 accompanied by Na2SiO3,
Na2AlO2, Na3VO4, Na2CrO4, and Na3MnO4. On the other hand, alkali-insoluble impurities
can also be hosted by their sodium metallate salts or metal hydroxide compounds, such as
Na2FeO2, Na2MgO2, and Ca(OH)2. After roasting, the reaction product can be washed by
water to dissolve the excess NaOH. Most of the sodium combined with Na2TiO3 will be
released to form water-soluble NaOH and alkaline-insoluble metatitanic acid (H2TiO3). A

31
great amount of alkali-soluble impurities will be dissolved during the water washing step,
for example, Na2SiO3, Na2AlO2, and Na3VO4. Additionally, the alkali-insoluble metals
will be retained with metatitanic acid in their metal hydroxide compounds of Fe(OH)3,
Mg(OH)2, and Ca(OH)2.
Among all these impurities, Fe and Si are the two major impurities. A high content of
Fe will make the TiO2 powder look yellow. Si is also known for being very difficult to
remove for Ti extraction. Si has very high affinity to Ti due to their similar properties. The
removal of Fe and Si are discussed in detail below.
4.3.1.1 The removal of Fe and Si
Due to the high free acid concentration, the ferrous ion will remain in the leaching
solution during the hydrolysis of titanic acid. The hydrolysis reaction of Fe3+ and H2O
forming Fe(OH)3 will not happen. The reaction of the hydrolysis of Fe3+ is shown below.
Fe3+ + 3H2O = Fe(OH)3 + 3H+
The content of Fe before and after hydrolysis was measured by ICP which is shown
in Table 4.3. It is shown that Fe content almost stays constant with a slight increase
which is because of the consumption of water during hydrolysis.
The change of Si content with time during hydrolysis is shown in the Figure 4.3. Si
content will decrease with time. The behavior of Si during hydrolysis is similar to Ti. The
silicon in the solution will react with H2O forming Si(OH)4 and releasing H+. The
reaction is shown below. With the increase of free acid concentration, the precipitation of
silicic acid becomes slower. Unlike Fe, Si has to be removed before hydrolysis, otherwise
it will co-precipitate out with Ti.
As shown in Figure 4.5, the removal rate of Si is calculated as 97.5%. Si exists in

32
UGS in the form of SiO2. It is transformed during roasting into its sodium metallate salts,
Na2SiO3, which is dissolved into the washing solution.
4.3.1.2 Summary
Generally speaking, the impurities were removed in two major steps: roasting and
hydrolysis. Roasting is a process in which impurities are transformed into their sodium
metallate salts or metal hydroxide compounds, most of which are soluble in alkaline
solution, thus being removed during the following water washing step. In addition to
roasting, many impurities can be removed during hydrolysis. Hydrolysis is essentially a
selective precipitation process. Impurities such as Fe, Mg, Al, Ca, and Mn will stay in the
solution during hydrolysis, thus separated from Ti. Other impurities like Si and V will
precipitate together with Ti which have to be removed prior to hydrolysis.
The chemical composition of the residue after roasting and washing was analyzed using
ICP and the results are shown in Table 4.4. Based on the composition, it is deduced that
the residue is primarily composed of H2TiO3. The effectiveness of the alkaline roasting
process in terms of the removal rates of the impurities was calculated and they are as high
as 97.5%, 94.5%, 88.8%, 83.0%, and 78.8%, for Si, Al, V, Mn, and Cr, respectively. Even
alkali-insoluble impurities like Mg and Fe were partially dissolved by the alkaline solution,
which may be attributed to their limited but detectable solubility in the alkaline solution.
As mentioned already, hydrolysis is another major step for purification. Fe content as
well as other compositions before and after the hydrolysis are compared in Table 4.5. It is
clearly shown that the Fe content is significantly and sufficiently minimized in TiO2.
The impurity contents in the final TiO2 powder produced in this work were analyzed
by ICP and the results are shown in Table 4.6 which is also compared to commercial rutile.

33
It is apparent that the impurity of TiO2 produced by this process is comparable to that of
commercial rutile.
Calcination
As mentioned already, titanic acid is essentially hydrated TiO2, the composition of
which is TiO2·xH2O. To make pure TiO2 powder, the hydrated water has to be removed by
calcination. Calcination was performed in a box furnace at an elevated temperature. The
titanic acid samples were put in ceramic crucibles after drying in air. The samples were
then calcined for 2 hr at 300, 600, and 900℃.
According to the weight loss during calcination, it was confirmed that the water content
in the precipitate was approximately 10%, suggesting that the precipitate was pyrotitanic
acid. The morphology of the rutile particles inherits that of the titanic acid in shape. The
microstructure on the surface of titanic acid at each holding temperature was analyzed by
scanning electron microscopy. The change of microstructure of the particles during
calcination is discussed in this chapter.
4.3.2.1 The effect of calcination on phase compositions
The XRD patterns of calcined samples at each holding temperature are shown in Figure
4.6. Before calcination, weak peaks of rutile phase were observed. As the calcination
temperature increases, the peaks sharpen, indicating an increase in the size of the
crystallites. After 300℃ , the intensity and sharpness of the rutile peaks increased
dramatically with each raise in temperature. The phase of titanic acid before and after
calcination is pure rutile. No anatase phase was found. The change of crystal size with
calcination temperature is shown in Table 4.7. The crystal size was calculated by the

34
Scherrer equation:
𝐷𝑝 =0.94λ
𝛽12⁄ cos 𝜃
Where Dp = Average Crystallite size,
β = Line broadening in radians.
θ = Bragg angle.
λ = X-ray wavelength.
4.3.2.2 The effect of calcination on morphology
The microstructure of titanic acid samples after calcination were analyzed by scanning
electron microscopy (SEM). The sample used for this study is conducted at 100g/L of
equivalent TiO2 and 2M free acid. It can be seen in Figure 4.7 that the surface of the
particles was not completely smooth. Cracks and small bumps were found on the surface
of each particle. Inside the cracks, the needle-shaped structure was observed. It might imply
that the particle consists of small needles which growing from the center to the edge of the
particles. More detailed discussion is shown later for the mechanisms of hydrolysis. It is
shown that the shape and size of the particles are identical before and after calcination.
There is no agglomeration between particles under this conditions.
Pores were found on the surface and internal sections of the particles after calcination.
The size of the pore is between 18 to 50nm. It is believed that these pores were formed
during calcination while the hydrated water was vaporizing from the particle to air. Before
calcination, the surface of the particle is smooth and no pores can be found. After being
calcined at 300℃ for 2 hr, in Figure 4.8, the morphology has no difference from the before-
calcined particles. At 600℃, in Figure 4.9, pores start to form but are still small and only

35
have a small amount. After calcining at 900℃ for 2 hr, in Figure 4.10, the porosities can
be seen clearly on the surface as well as in the cracks.
Effect of temperature
The temperature of hydrolysis can have significant effects on the hydrolysis rate of
titanic acid. The rate of the hydrolysis reaction increases with the rise of temperature since
hydrolysis is an endothermic reaction. In this section, a set of experiments were designed
to investigate the effect of temperature on hydrolysis of titanic acid. The experimental
design is shown in Table 4.8.
It can be seen from Figure 4.11 that the hydrolysis rate of titanic acid increases with
the rise of temperature. The yield of titanic acid at 90℃ is very low between 4 to 10 hr
which is due to the high free acid concentration in the initial stage of hydrolysis and low
hydrolysis rate, thus the hydrolyzed titanic acid will be re-dissolved and since the driving
force for hydrolysis at 90℃ is lower than dissolution, the solution will stay in a balance of
precipitation and dissolution. When temperature is at 100, the hydrolysis rate increases
since the driving force for hydrolysis is larger than dissolution, thus the reaction moves
forward easier. When temperature is at 105℃ and the solution is boiling, the hydrolysis
rate is too fast which will result in small particle size, agglomeration, as well as other
unpredictable morphology of titanic acids. Therefore, the optimized temperature for
hydrolysis of titanic acid is determined to be 100℃.
Effect of free acid concentration
Hydrolysis is basically a reaction of splitting H2O into H+ and OH-. In this case, Ti4+
combined with OH- to form Ti(OH)4 which precipitated out during the hydrolysis. The

36
remaining H+ become into free acid.
As we can see from the reaction formula, the concentration of free acid will increase
during hydrolysis reaction. The free acid in the hydrolysis solution comes from two parts:
one is from the excess concentrated HCl solution added during the dissolution of titanate
solids, and the other part is from H+ released during hydrolysis.
As a product of hydrolysis reaction, the free H+ in the solution will hinder the hydrolysis
reaction from moving forward which is the direction of forming Ti(OH)4 precipitation.
Generally, it is believed that the higher the free acid concentration is, the slower the rate of
hydrolysis is.
The concentration of free acid will also have an effect on the particle size and
morphology of the titanic acid by affecting the nucleation and crystal growth. As
mentioned before, when the concentration of free acid is high, the hydrolysis reaction tends
to be slow. In other words, it takes more time for the titanic acid nuclei to form. The first
few nucleated titanic acids will act as crystal grow sites. The lately nucleated titanic acids
tend to agglomerate on those initially formed nuclei and thus leads to larger particle size
of the final titanic acid powders.
4.3.4.1 Morphology
The microstructure of the titanic acid obtained from varied free acid concentration at
70g/L of equivalent TiO2 was examined by scanning electron microscopy (SEM). The
results are shown in the following figures.
For 2M free acid, the titanic acid particles have irregular shape and are agglomerated
together. The mean particle size is around 18 µm. One titanic acid particle consists of
several smaller particles (Figure 4.12 a). For 2.5M free acid, the particle is much larger and

37
less agglomerated. The mean particle size is around 26 µm. The particles are more round
but with many bumps on the surface (Figure 4.12 b). For 3M free acid, the particles are
monodispersed with a larger mean size of 32 µm. The particles become a regular round
shape and have a smoother surface (Figure 4.12 c). For 3.5M free acid, the particle size is
slightly larger. Other than that, other features are similar to 3M free acid (Figure 4.12 d).
The results show that with the increase of free acid concentration, the particle size of titanic
acid will increase. The particles become more and more regular in a round shape with a
smoother surface.
For 100g/L of equivalent TiO2, at 2M free acid, the mean particle size is around 26 µm.
The particles are not very uniform. One particle is an agglomeration of several smaller
particles (Figure 4.13 a). For 2.5M free acid, the titanic acid particles are larger which has
a mean particle size of 35 µm. The particles are more uniformly dispersed in a round shape
(Figure 4.13 b). For 3M free acid, many small particles around 10 µm or less were found.
The rest are round particles with a mean size of 30 µm (Figure 4.13 c). For 3.5M free acid,
the particle size distribution is very broad. Many large particles as well as many small
particles were found. The small particles are agglomerated with each other or attached on
larger particles. From 2M to 2.5M, the particle size increased with the free acid
concentration and the morphology became more uniform. From 3M to 3.5M, the particle
size distribution became broader. Many smaller particles were obtained and
agglomerations were found as well.
At 115g/L of equivalent TiO2, the free acid concentrations were selected at 3.5M, 4M,
and 4.5M. Though the target concentration is 130g/L, the actual concentration of equivalent
TiO2 is 115g/L since there are some undissolved solids during HCl leaching of roasted

38
product. There will always be some deviation between the target concentration and the
actual concentration which is more obvious when the targeted TiO2 concentration is high.
As shown in Figure 4.14, for 1.5 M free acid, the particles were around 20 µm in a round
shape. It can be seen that the titanic acid particles were agglomerated by smaller particles.
For 2M free acid, the particle size was larger which is around 25 µm and less agglomerated
as well. For 2.5M free acid, the particle size distribution of titanic acid is broad. The large
particles are around 35 µm and the small particles are around 15 µm. Agglomeration of
small particles was found.
At 40g/L of equivalent TiO2, the free acid concentrations were selected at 3.5M, 4M,
and 4.5M. For 3.5M free acid, the titanic acid particles have obvious agglomeration, as
shown in Figure 4.15. The size of each separate particle is around 5 µm. For 4M free acid,
the particles are still agglomerated but with a slightly larger particle size which is
approximately 9 µm. For 4.5M free acid, the agglomeration between particles is less
obvious. The size of one agglomeration is around 20 µm. It can be seen that at a lower
equivalent TiO2 concentration like 40g/L, the particles of titanic acid have a strong
tendency to be small and agglomerated together.
4.3.4.2 Particle size
It is shown in Figure 4.16 and Table 4.9 that when the equivalent TiO2 concentration
is 40g/L, the D50% of the particle size is 14.465 µm, 16.721 µm, and 18.529 µm for 3.5M,
4M, and 4.5M, respectively. D50% for these three samples is less than 20 µm. The particle
size of titanic acid particles ranges from approximately 10 to 25 µm using the above
parameters. The particle size distribution is narrow. Sample 1 has the largest standard
deviation of 0.138. The standard deviation of sample 2 and sample 3 is smaller, which is

39
0.115 and 0.117, respectively.
When the equivalent TiO2 concentration is 100g/L, as shown in Figure 4.17 and Table
4.10, the D50% of the particle size is 26.273 µm, 29.852 µm, 29.560 µm, and 34.972 for
2M, 2.5M, 3M, and 3.5M free acid, respectively. The particle size of titanic acid particles
ranges from approximately 18 to 40 µm for samples 1, 2, and 3. The particle size
distribution is narrow for sample 1, 2, and 3, which are all around 0.1. Sample 4 has the
broadest particle size distribution, with D10% of 13.548 µm and D90% of 90.368 µm.
When the equivalent TiO2 concentration is 115g/L, as shown in Figure 4.18 and Table
4.11, the D50% of the particle size is 0.046 µm, 20.052 µm, and 32.847 µm for 1.5M, 2M,
and 2.5M, respectively. Sample 3 has the largest standard deviation of 0.348, the particle
size of which ranges from 11 µm to 93 µm. The particle size distribution of sample 2 and
sample 3 is narrow with standard deviation of 0.107 and 0.104, respectively.
Effect of initial equivalent TiO2 concentration
The effect of initial equivalent TiO2 concentration on the morphology and particle size
of titanic acid during hydrolysis with same free acid concentration was investigated.
Similar to free acid concentration, the equivalent TiO2 concentration can also affect the
rate of hydrolysis. Five different levels of initial TiO2 concentration, 50g/L, 70g/L, 100g/L,
and 115g/L, are used, free acid concentration is fixed at 2.5M, temperature is controlled at
100℃, and stirring speed is 250 r/min.
When the initial TiO2 concentration is low, the hydrolysis rate is fast and the yield of
titanic acid is high. When the initial TiO2 concentration is high (100-115g/L), the
hydrolysis rate is slow and the yield of hydrolysis is low.

40
4.3.5.1 Morphology
When the initial TiO2 concentration is 50g/L, the particle size of titanic acid is very
small, mostly around 5 to 6µm. The particle is in a round shape but not entirely
monodispersed. Many agglomerations of tiny particles of several hundred nanometers can
be found on the surface of a big particle (Figure 4.19).
When the initial TiO2 concentration is 70g/L, the particle size of titanic acid increased
dramatically to a mean size of around 25µm. The particles are monodispersed but a little
amount of agglomerations made of small particles can be seen on the surface of some
monodispersed single particles. The particles are in a round shape (Figure 4.20).
When the initial TiO2 concentration is 100g/L, the mean particle size increased to
around 33µm. The particle size distribution also becomes broader. Many small particles
with size of around 10 microns can be found as well as some extent of agglomerations
between them (Figure 4.21).
When the initial TiO2 concentration is 115g/L, the particle size distribution becomes
even broader compared with lower TiO2 concentration. Particles with size smaller than
10µm have obvious agglomerations. Particles larger than 10µm are mostly monodispersed.
Some very big agglomerated particles can be found. Besides, needle-like morphology on
the surface is observed (Figure 4.22).
4.3.5.2 Particle size
The particle size distribution of titanic acid from different initial TiO2 concentrations
are shown in Table 4.12 and Figure 4.23. At 50g/L of TiO2, the particle size distribution is
broad with a standard deviation of 0.327. The particle size is small with a mean size of
5.49µm. At 70g/L of TiO2, the particles have larger mean particle size of 30.21µm and are

41
also narrowly distributed. At 100g/L, the particles grow slightly larger and with narrower
distribution. The mean particle size is 30.57µm and the standard deviation is 0.119. At
115g/L of TiO2, the particle size distribution becomes broad again with a standard
deviation of 0.367. The mean particle size is 35µm which is slightly larger than 70g/L and
100g/L.
It is shown that, when the free acid concentration is the same, the mean particle size of
titanic acid will become larger with the increase of equivalent TiO2 concentration. The
particle size increased dramatically from 5.49µm to 30.25µm as the concentration of TiO2
changed from 50g/L to 70g/L. However, no significant differences of particle size were
found as the TiO2 concentration increased from 70g/L to 115g/L. Standard deviation of
titanic acid is very broad when the equivalent TiO2 concentration is either very low or very
high. The distribution becomes narrow when the TiO2 concentrations are 70g/L and 100g/L.
Summary
The effect of free acid concentration, initial equivalent TiO2 concentration, and
temperature on hydrolysis of titanic acid was studied in this chapter.
It is shown that at a constant equivalent TiO2 concentration, with the increase of free
acid concentration, the mean size of titanic acid particles becomes larger and the particle
size distribution becomes broader. The titanic acid particles have a round shape and smooth
surface with a particle size of around 30µm which is the desired morphology for this work
when the free acid concentration is chosen appropriately. The free acid concentration
required to obtain these morphologies is between 2.5M to 3.5M which depends on the
equivalent TiO2 concentration.
When the free acid concentration is fixed at 2.5M, with the increase of TiO2

42
concentration, the mean size of titanic acid particles becomes larger in general. The particle
size will increase dramatically as the TiO2 concentration increases from 50g/L to 70g/L.
The particle size distribution is broad when TiO2 concentration is either too low (50g/L) or
too high (115g/L). The desired morphology can be obtained when the equivalent TiO2
concentrations are 70g/L and 100g/L.
The optimized parameters for the hydrolysis of titanic particles were determined to be:
70g/L of equivalent TiO2 with 3 to 3.5M free acid; 100g/L of equivalent TiO2 with 2.5 to
3M free acid. The typical morphology of titanic acid particles obtained using the optimized
parameters is shown in Figure 4.24. The titanic acid particles are monodispersed with a
mean size of around 30µm and narrow distribution. The particles are in round shape with
smooth surface.

43
Table 4.1 Chemical composition of upgraded Ti slag
Compound TiO2 Fe2O3 SiO2 MgO Al2O3 V2O5 CaO Cr2O3 MnO Total
wt% 94.5 1.4 1.8 0.7 0.5 0.4 0.12 0.07 0.04 99.53
Element Ti O Fe Mg Al Ca Si Cr Mn V
wt% 56.7 40.4 1.0 0.42 0.26 0.09 0.84 0.05 0.03 0.22
Figure 4.1 Microstructure of as-received upgraded-Ti slag

44
Figure 4.2 Morphology of roasted product a) 2k Mag, b) 5k Mag, c) 10k Mag.
a) b)
c)

45
Figure 4.3 Hydrolysis reactor and heating bath
Figure 4.4 Temperature profile of calcination of titanic acid particles

46
Table 4.2 Singe effect study on free acid conc. on hydrolysis at varied TiO2
TiO2(g/L) Free acid conc.(M) HCl(L) H2O(L) Titanate(g)
40 4 0.45 0.45
56 4.5 0.49 0.41
70
2 0.42 0.48
100 2.5 0.45 0.45
3 0.48 0.42
3.5 0.51 0.39
100
2.0 0.39 0.51
145 2.5 0.54 0.36
3 0.61 0.29
3.5 0.69 0.21
115
1.5 0.6 0.3
180 2 0.64 0.26
2.5 0.675 0.225

47
Table 4.3 Fe content before and after hydrolysis of titanic acid
Element Fe
Pre-hydrolysis 664
Post-hydrolysis 690
Figure 4.5 The change of Si content with time during hydrolysis
0.06
0.11
0.16
0.21
0.26
0 2 4 6 8 10 12 14 16 18
con
c.(g
/L)
Time(h)
Si conc. - time
2M
2.5M
3M
3.5M

48
Table 4.4 Chemical composition of the dried residue and the impurity removal rates
Element Ti Fe Mg Al Ca Si Cr Mn V
wt% 40 0.483 0.156 0.010 0.072 0.038 0.008 0.004 0.017
Removal rate % 0 31.5 47.3 94.5 0 97.5 78.8 83.0 88.8
Table 4.5 Chemical composition of the solution before and after hydrolysis (mg/L)
Element Ti Mg Fe Al Ca Si Cr Mn V
Pre-hydrolysis 49,000 222 664 7 45 18 7 4 19
Post-hydrolysis 880 231 690 8 52 4 5 5 4
Table 4.6 Comparison of the impurity contents in rutile prepared by this work and in
commercial pigment grade rutile(cite), wt%
Element Mg Al Fe Si Ca Cr V Mn C
This work 0.048 0.006 0.043 0.030 0.029 0.018 0.037 0.005 0.0035
Commercial 0.030 NA 0.0012 0.0386 0.0112 <0.0013 NA <0.0007 NA

49
Table 4.7 The change of crystal size of titanic acid particles before and after calcination
Temperature(℃) Crystal size(nm)
W/O calcination 4.2
300 5.8
600 16.8
900 39.5
Figure 4.6 X-ray diffraction patterns of titanic acid powders from hydrolysis a) before
calcination b) 300℃ for 2 hr c) 600℃ for 2 hr d) 900℃ for 2 hr

50
Figure 4.7 Microstructure of titanic acid samples before and after calcination from
100g/L equi. TiO2 and 2M free acid. left) before calcination 2000x mag, right) after
calcination 2000x mag.
Figure 4.8 Microstructure of titanic acid samples calcined at 300℃ from 100g/L equi.
TiO2 and 2M free acid. left) 8kx mag, right) 50kx mag.

51
Figure 4.9 Microstructure of titanic acid samples calcined at 600℃ from 100g/L equi.
TiO2 and 2M free acid. left) 11kx mag, right) 50kx mag.

52
a)
b)
Figure 4.10 Microstructure of titanic acid samples after calcination from 100g/L equi.
TiO2 and 2M free acid. left) 100kx mag, right) 200kx mag.

53
Table 4.8 Experimental design of the effect of temperature on hydrolysis rate
Temp (°C) TiO2
conc.(g/L)
Free acid
conc.(M) HCl(mL) H2O(mL) White mud(g)
105 70 2.9 480 420 100
98 70 2.9 480 420 100
90 70 2.9 480 420 100
Figure 4.11 Hydrolysis rate of titanic acid at 90℃, 98℃, and 105℃
0
20
40
60
80
100
0 1 2 3 4 5 6 7 8
Yie
ld%
Time(h)
Yiled vs Time
90℃
98℃
105℃

54
Figure 4.12 SEM images of titanic acid from 4 different free acid conc. at 70g/L of equi.
TiO2, a) 2M; b) 2.5M; c) 3M; d) 3.5M.
a) b)
d) c)

55
Figure 4.13 SEM images of titanic acid from 4 different free acid conc. at 100g/L of equi.
TiO2, a) 2M; b) 2.5M; c) 3M; d) 3.5M.
a) b)
c) d)

56
Figure 4.14 SEM images of titanic acid from 3 different free acid conc. at 115g/L of equi.
TiO2, a) 1.5M; b) 2M; c) 2.5M.
a) b)
c)

57
Figure 4.15 SEM images of titanic acid from 3 different free acid conc. at 40g/L of equi.
TiO2, a) 3.5M; b) 4M; c) 4.5M.
a)
c)
b)

58
Figure 4.16 Particle size distribution of titanic acid particles hydrolyzed from 40g/L of
equi. TiO2 at varied free acid concentration.
Table 4.9 Particle size and standard deviation of titanic acid particles from 40g/L of equi.
TiO2 at varied free acid concentration.
Sample# Description D10% (µm ) D50% (µm ) D90% (µm ) Std Dev
1 40g/L 3.5M 9.553 14.465 22.189 0.138
2 40g/L 4M 11.667 16.721 23.785 0.115
3 40g/L 4.5M 13.052 18.529 24.486 0.117

59
Figure 4.17 Particle size distribution of titanic acid particles hydrolyzed from 40g/L of
equi. TiO2 at varied free acid concentration.
Table 4.10 Particle size and standard deviation of titanic acid particles from 40g/L of
equi. TiO2 at varied free acid concentration.
Sample # Description D10% D50% D90% Std Dev
1 100g/L 2M 18.737 26.273 36.886 0.108
2 100g/L 2.5M 21.904 29.852 39.563 0.097
3 100g/L 3M 21.656 29.560 39.391 0.098
4 100g/L 3.5M 13.548 34.972 90.368 0.319

60
Figure 4.18 Particle size distribution of titanic acid particles hydrolyzed from 40g/L of
equi. TiO2 at varied free acid concentration.
Table 4.11 Particle size and standard deviation of titanic acid particles from 40g/L of
equi. TiO2 at varied free acid concentration
Sample name D10% D50% D90% Std Dev
115g/L 1.5M 12.402 17.342 24.388 0.114
115g/L 2M 14.410 20.052 27.910 0.104
115g/L 2.5M 11.710 32.847 92.162 0.348

61
Figure 4.19 SEM images of titanic acid from 50g/L at 2.5M of free acid
Figure 4.20 SEM images of titanic acid from 70g/L at 2.5M of free acid
2.5M 50g/L 2.5M 50g/L
2.5M 70g/L 2.5M 70g/L

62
Figure 4.21 SEM images of titanic acid from 100g/L at 2.5M of free acid
2.5M 100g/L 2.5M 100g/L

63
Figure 4.22 SEM images of titanic acid from 3 different free acid conc. at 2M of free
acid, a) 70g/L; b) 100g/L; c) 115g/L.
a) b)
c)

64
Figure 4.23 Particle size distribution of different TiO2 concentration at 2.5M free acid, 1)
50g/L; 2) 70/L; 3) 100g/L; 4) 115g/L.
Table 4.12 The particle size distribution data of titanic acid from different TiO2
concentration at same free acid concentration
TiO2 conc.
(g/L) Mean (µm) 10% D(µm) 50% D(µm) 90% D(µm) Std Dev
50 5.49 2.08 5.49 14.52 0.327
70 30.248 17.93 30.21 50 0.172
100 30.638 21.19 30.57 44.56 0.119
115 35 11.79 35 103.6 0.367

65
Figure 4.24 SEM images of titanic acid with desired morphology, a) 70g/L TiO2 conc.,
3M free acid, 2000x mag; b) 70g/L TiO2 conc., 2.5M free acid, 8500x mag.
a) b)

CHAPTER 5
5 KINETICS AND MECHANISM
Hydrolysis kinetics
In the chloride process, the dwell time of TiCl4 during oxidization at 1300℃ is only
0.05-0.08s to achieve TiO2 powders with a mean size of 0.2µm and narrow distribution.
For the sulfate process, it usually takes 2-4 hr to complete the hydrolysis of titanic acid at
a boiling point of the hydrolysis solution.
In this work, the hydrolysis of titanic acid is performed in hydrochloric acid which
usually takes 10 to 20 hr to complete one batch of hydrolysis. The time it takes to complete
a batch of hydrolysis can vary a lot depending on the parameters used for the reaction.
With the goal to obtain monodispersed TiO2 particles with relatively large particle size and
regular shape, the hydrolysis rate has to be controlled properly. The effect of free acid
concentration, and initial equivalent TiO2 concentration on the hydrolysis rate was studied
in this chapter.
The hydrolysis rate is illustrated in this work by plotting a curve of yield versus time.
The Y axis was the yield of titanic acid which was determined by the change of equivalent
TiO2 content in the solution divided by the initial equivalent TiO2 content in the solution.
The X axis is time. The equation for the calculation of yield is shown below,
Yield% =the change of equi.TiO2 concentration(g/L)
the initial equi.TiO2 concentration(g/L)

67
Effect of free acid concentration on kinetics
As shown is Figure 5.1, when the equivalent TiO2 concentration was 40g/L, the free
acid concentrations used were 3.5M and 4M. The trend of hydrolysis rate was the same as
previous results. The hydrolysis rate at 3.5M is faster than 4M. In general, the hydrolysis
rate of 40g/L equivalent TiO2 is faster than other equivalent TiO2 concentrations. The yield
of both 3.5M and 4M free acid is over 95% in 12 hr.
As shown in Figure 5.2, the hydrolysis has the fastest reaction rate at 2.0M free acid.
The yield reached around 90% within 4 hr of reaction. The reaction almost completed in 6
hr. The hydrolysis rate is the slowest when the free acid concentration is 3.5M. It takes 16
hr for the yield of titanic acid to reach 85%. The yield is just 9% in 4 hr. The trend of the
hydrolysis rate at these four free acid levels implied that with the increase of the free acid
concentration, the hydrolysis rate of titanic acid became slower.
As discussed before, in Figure 5.3, the free acid concentration was designed to be 2M,
2.5M, 3M, and 3.5M when the equivalent TiO2 concentration is 100g/L. 3.5M free acid
was the slowest in hydrolysis of titanic acid. The yield of TiO2 at 3.5M in 18 hr is around
30% which is much lower than the rest of the samples. 2M free acid has the fastest
hydrolysis rate and highest yield which is around 97.4%. The hydrolysis rate follows the
sequence of 2M>2.5M>3M>3.5M. The yield of TiO2 also followed the same sequence. To
conclude, solution with lower free acid concentration will have faster hydrolysis rate and
higher yield.
In Figure 5.4, when the equivalent TiO2 concentration is 115g/L, the free acid
concentration was designed to be 1.5M, 2M, and 2.5M. The hydrolysis rate followed the
sequence of 1.5M>2M>2.5M. 2.5M free acid had the slowest hydrolysis rate. The yield of

68
titanic acid at 1.5M and 2M was much higher than 2.5M which was over 91% in 13 hr.
Effect of equivalent TiO2 concentration on kinetics
See Figure 5.5 for the comparison of hydrolysis rate of titanic acid at different
equivalent TiO2 concentration. The hydrolysis rate follows the sequence
70g/L>100g/L>115g/L. When the equivalent TiO2 concentration was 70g/L with 2M free
acid, the hydrolysis reaction has the fastest rate. It took 4 hr for the yield of titanic acid to
reach 90%. The hydrolysis is almost completed in just 6 hr. At higher equivalent TiO2
concentration, like 100g/L and 115g/L, the hydrolysis rate is slower. It took nearly 16 hr
for the yield of hydrolysis to reach over 90%.
In Figure 5.6, when the free acid concentration is 2.5M, the hydrolysis rate follows the
same sequence: 70g/L>100g/L>115g/L. The hydrolysis rate of titanic acid at 115g/L is
much slower than the other two samples. The yield of titanic acid is only 6% in the first 8
hr. For 70g/L and 100g/L of equivalent TiO2, the yield in the first 6 hr is 73% and 27%,
respectively.
Hypothetical mechanisms of hydrolysis of titanic acid
The mechanism of hydrolysis of titanic acid was studied by evaluating the change of
particle size and morphology of titanic acid particles with time. The titanic acid sample
used in this work is obtained at 70g/L of equivalent TiO2, 3M of free acid, and hydrolyzed
at 100℃. 8 ml of hydrolysis solution was taken in every 2 hr. The liquid part of the sample
was analyzed by ICP to determine the Ti content change with time. The solid part of the
sample was dried and analyzed by SEM to examine the microstructure of the change of
titanic acid particles with time.

69
For the reaction of hydrolysis of titanic acid, the forward and backward reaction rates
have to be taken into considered. The net rate of a reaction is the difference between
forward and backward rates which can be expressed as
Rnet = Rforward - Rbackward
More specifically, it be can expressed as
Rtotal = kf ·C(equiTiO2) · C4(H2O) - kb (free acid) ·C (Free acid)
Kf is the forward reaction rate constant. kb is the backward reaction rate constant.
Based on the equation above, the concentration of each species is associated with the
reaction rate. It can be seen from the equation that the increase of equivalent TiO2
concentration can facilitate the total reaction rate of hydrolysis, which is contrary to the
experimental results shown in the previous section. This is because when the equivalent
TiO2 concentration increases, the amount of water in the solution will reduce, thus
decreasing the total reaction rate. Based on the equation, water has a 4th powder which
shows that it has greater effect on the hydrolysis rate than the equivalent TiO2 concentration.
The result of the effect of free acid concentration on the reaction rate is consistent with the
equation.
For hydrolysis performed under 70g/L of equivalent TiO2, 3M of free acid at 100℃, It
usually takes 40 minutes for the temperature of the hydrolysis solution to reach 80℃ which
is when the precipitated titanic acid particles can be observed. At this point, the titanic acid
particles are tiny and suspended in the solution. In another 20 minutes, the solution turns
from transparent to cloudy which implies that the amount of titanic acid particles has
increased. It can be said that the size of the particles is still small since they are very hard
to settle based on the observation from the sample of 1 hr hydrolysis. After the first hour,

70
the temperature will stay at 100℃ for the rest of the time of hydrolysis. The change of
microstructure of the titanic acid particles and hydrolysis rate during these times are shown
in Figure 5.7, Figure 5.8, and Figure 5.9.
After 2 hr of hydrolysis, the particles already have a mean size of around 16µm. It can
be seen that each particle is made of many smaller particles since the boundary can be
clearly observed. The shape of particles is irregular due to the random agglomeration
between particles.
From 2 to 8 hr, the morphology changed from irregular shape into a relatively round
shape. The hydrolysis rate has a dramatic increase in this stage. The newly generated titanic
acid will aggregate on the exsisting particles. Since heterogeneous nucleation requires
lower energy than homogeneous nucleation, the nucleation tends to first take place on those
irregular surfaces where heterogeneous nucleation happens. After the irregular sites for
nucleation are filled by the newly generated titanic acid, the particles grow larger and more
round.
From 8 to 16 hr, the particles will keep growing but at a slower rate. The hydrolysis
rate also becomes slower as the concentration of TiO2 in the solution decreases. The Ti4+
remaining in the solution will keep reacting with water until the equilibrium is reached.
After that, the particles will reach their final size and morphology. During this stage, the
particle size distribution becomes more obvious. Many small particles with round shapes
can be found.
The mean size of titanic acid particles in 2 hr is 16.32µm which is already very large
compared with the titanic acid particles obtained from the sulfate process. The mean size
of particles went through a dramatic increase from 2 to 6 hr from 16.32µm to 27.31µm.

71
After that, the mean size keeps a steady increase from 6 to 16 hr from 27.31µm to 35.85µm.
In stage A, the hydrolysis rate is very slow. The yield of titanic acid is 4% in 2 hr of
hydrolysis. This stage is corresponding to the nucleation of titanic acid particles. The
hydrolysis rate in this stage will affect the particle size and morphology of the initial titanic
acid particles and thus affect the property of the final TiO2 particles. In this stage,
hydrolysis should be controlled at a relatively low rate to allow the nucleation to proceed
slowly. In this way, the initial nuclei of titanic acid will become larger and uniformly
distributed.
In stage B, the hydrolysis rate increased dramatically. The yield of titanic acid increased
from 4% to 85% from 2 to 12 hr. This stage is usually corresponding to the growth of
titanic acid particles which is accompanied by the decrease of equivalent TiO2
concentration and increase of free acid concentration in the hydrolysis solution. The
hydrolysis rate with a steady increase in this stage is very important to prepare titanic acid
particles with narrow size distribution, coarse size, and controlled morphology. Either too
fast or too slow hydrolysis can lead to unexpected morphology of titanic acid particles such
as agglomerations, broad size distribution, and irregular shape. A moderate rate of
hydrolysis which takes 8-12 hr for the growth of particles is usually used for production of
titanic acid powder in this work.
In stage C, almost all the equivalent TiO2 in the solution precipitated out as titanic acid
particles and the concentration of free acid raises to the initial concentration HCl solution
used for digesting the roasted product. The reaction reaches its equilibrium and the yield
of titanic acid reaches 92% after 16 hr of hydrolysis. This stage is corresponding to the
balance stage.

72
Figure 5.1 Hydrolysis rate of titanic acid at 40g/L equi. TiO2 with varied free acid conc.
Figure 5.2 Hydrolysis rate of titanic acid at 70g/L equi. TiO2 with varied free acid conc.
0
20
40
60
80
100
120
0 2 4 6 8 10 12 14 16 18
Yie
ld %
Time(h)
Yiled vs time at 40g/L equivalent TiO2
3.5M
4M
0
20
40
60
80
100
120
0 2 4 6 8 10 12 14 16 18
Yie
ld %
Time(h)
Yield vs Time at 70g/L equivalent TiO2
2M
2.5M
3M
3.5M

73
Figure 5.3 Hydrolysis rate of titanic acid at 100g/L equi. TiO2 with varied free acid conc.
Figure 5.4 Hydrolysis rate of titanic acid at 115g/L equi. TiO2 with varied free acid conc.
0
20
40
60
80
100
120
0 2 4 6 8 10 12 14 16 18 20 22 24 26 28
Yie
ld(%
)
Time(h)
Yield vs Time at 100g/L equivalent TiO2
2M
2.5M
3M
3.5M
0
20
40
60
80
100
120
0 2 4 6 8 10 12 14 16 18 20 22
Yie
ld %
Time(h)
Yiled vs time at 115g/L equivalent TiO2
1.5M
2M
2.5M

74
Figure 5.5 Hydrolysis rate of titanic acid at 2M free acid with varied equi. TiO2 conc.
Figure 5.6 Hydrolysis rate of titanic acid at 2.5M free acid with varied equi. TiO2 conc.
0
20
40
60
80
100
120
0 2 4 6 8 10 12 14 16 18 20
Yil
ed%
Time(h)
Yield vs Time at 2M free acid
70g/L
100g/L
115g/L
0
20
40
60
80
100
120
0 5 10 15 20 25
Yie
ld%
Time(h)
Yield vs Time at 2.5M free acid
70g/L
100g/L
115g/L

75
2
Figure 5.7 The microstructure of titanic acid particles from a) 2 h, b) 4 h, c) 6 h, d) 8 h, e)
10 h, f) 12 h, g) 16 h hydrolysis.
b)
c) d)
e) f)
g)
a)

76
Figure 5.8 The change of particle size with hydrolysis time
Figure 5.9 Yield%-time curve at 70g/L equivalent TiO2 with 3M free acid.
16.32
20.175
27.31
30.12 3133
35.82
15
20
25
30
35
40
0 5 10 15 20
Par
ticl
e si
ze (
um
)
Time (h)
Particle size vs time

CHAPTER 6
6 CONCLUSIONS
The effect of free acid concentration, and initial equivalent TiO2 concentration on the
particle size, morphology, and hydrolysis rate of titanic acid were investigated. The
primary results are concluded as follows:
1. The particle size of titanic acid will increase as the concentration of free acid
increases at a constant initial TiO2 concentration. The particle size distribution of titanic
acid powder becomes broader at the same time. Meanwhile, the titanic acid particles
become more spherical with a smoother surface as the concentration of free acid increases.
2. At fixed free acid concentration, the particle size of titanic acid will increase as the
initial TiO2 concentration increases. The particle size distribution is broad when the initial
TiO2 concentration is either too low or too high. The titanic acid turns from irregular shaped
small particles to round particles with smooth surface as the initial TiO2 concentration
increases. However, particles with unpredictable morphology such as bumps, pores, and
needles on the surface were found when initial TiO2 concentration is too high, such as
115g/L.
3. At fixed initial TiO2 concentration is a constant, and the hydrolysis rate will become
slower as the concentration of free acid increases. The time it takes to reach the equilibrium
of the hydrolysis reaction under varied free acid concentration has great difference. For
example, at 70g/L of equivalent TiO2, it only takes 4 hr to complete the hydrolysis reaction

78
when free acid concentration is 2M. However, it will take more than 20 hr for the reaction
to reach the equilibrium when the concentration of free acid is 3.5M.
4. The hydrolysis rate of titanic acid will decrease as the concentration of equivalent
TiO2 increases under a constant free acid concentration. When free acid concentration is
2.5M, the hydrolysis rate is very fast when TiO2 concentration is low, such as 40g/L, which
takes less than 4 hr to reach the equilibrium of hydrolysis reaction. On the contrary, when
initial TiO2 concentration is 115g/L, the hydrolysis rate becomes extremely slow, the yield
of which is around 21% after 13 hr of hydrolysis.
5. To produce relatively coarse TiO2 powder with round shape and smooth surface, a
proper hydrolysis rate has to be used since either a too fast or a too slow hydrolysis rate
will lead to irregular particle size and morphology of the final titanic acid particles.
6. The optimized parameters for hydrolysis to produce monodispersed and round titanic
acid particles with around 30um mean size is concluded as: free acid concentration from 3
to 3.5M with 70g/L of equivalent TiO2. Free acid concentration from 2.5 to 3M with 100g/L
of equivalent TiO2. The hydrolysis is performed at 100℃ for 16 hr with continuous
agitation of 250 rpm. In fact, the initial equivalent TiO2 concentration used for the
hydrolysis can be from 70 to 100g/L and a free acid concentration corresponding to that
TiO2 concentration can be used to obtain the products with desired size and morphology
by following the processes for TiO2 production in this work; monodispersed pure TiO2
powder with particle size from 20 to 45µm and round shape can be prepared.

7 REFERENCES
[1] Z. Z. Fang, S. Middlemas, J. Guo, and P. Fan, "A New, Energy-Efficient Chemical
Pathway for Extracting Ti Metal from Ti Minerals," Journal of the American
Chemical Society, vol. 135, no. 49, pp. 18248-18251, 2013/12/11 2013.
[2] G.Lutjering;, Titanium. 2007.
[3] F. H. S. Froes, M. N. Gungor, and M. Ashraf Imam, "Cost-Affordable Titanium:
The Component Fabrication Perspective," Journal of Minerals, Metals and
Materials Society, vol. 59, no. 6, pp. 28-31, 2007.
[4] W. Kroll, "The Production of Ductile Titanium," Transactions of the
Electrochemical Society, vol. 78, no. 1, pp. 35-47, 1940.
[5] J. H. Braun, A. Baidins, and R. E. Marganski, "TiO2 Pigment Technology: A
Review," Progress in Organic Coatings, vol. 20, no. 2, pp. 105-138, 1992.
[6] K. K. Sahu, T. C. Alex, D. Mishra, and A. Agrawal, "An Overview on the
Production of Pigment Grade Titania from Titania-Rich Slag," Waste Management
& Research, vol. 24, no. 1, pp. 74-79, 2006.
[7] G. McNulty, "Production of Titanium Dioxide," in Proceedings of NORM V
International Conference, Seville, Spain, 2007, pp. 169-189: Citeseer.
[8] K. Mohandas and D. Fray, "FFC Cambridge Process and Removal of Oxygen from
Metal-Oxygen Systems by Molten Salt Electrolysis: An Overview," Transaction of
Indian Institute of Metals, vol. 57, no. 6, pp. 579-592, 2004.
[9] C. G. McCracken, C. Motchenbacher, and D. P. Barbis, "Review of Titanium-
Powder-Production Methods," International Journal of Powder Metallurgy, vol. 46,
no. 5, 2010.
[10] M. Gueguin and F. Cardarelli, "Chemistry and Mineralogy of Titania-Rich Slags
Part 1—Hemo-Ilmenite, Sulphate, and Upgraded Titania Slags," Mineral
Processing and Extractive Metallurgy Review, vol. 28, no. 1, pp. 1-58, 2007.
[11] Y. Zhang et al., "A Novel Chemical Pathway for Energy Efficient Production of Ti
Metal from Upgraded Titanium Slag," Chemical Engineering Journal, vol. 286, pp.
517-527, 2016.

80
[12] D. Reyes-Coronado, G. Rodríguez-Gattorno, M. Espinosa-Pesqueira, C. Cab, R. d.
de Coss, and G. Oskam, "Phase-Pure TiO2 Nanoparticles: Anatase, Brookite and
Rutile," Nanotechnology, vol. 19, no. 14, p. 145605, 2008.
[13] W. Wang, B. Gu, L. Liang, W. A. Hamilton, and D. J. Wesolowski, "Synthesis of
Rutile (Α-TiO2) Nanocrystals With Controlled Size and Shape by Low-
Temperature Hydrolysis: Effects of Solvent Composition," The Journal of Physical
Chemistry B, vol. 108, no. 39, pp. 14789-14792, 2004.
[14] Y. Liu et al., "Preparation of Rutile TiO2 by Hydrolysis of TiOCl2 Solution:
Experiment and Theory," RSC Advances, vol. 6, no. 64, pp. 59541-59549, 2016.
[15] L. Piccolo, A. Paolinelli, and T. Pellizzon, "Process for the Hydrolysis of Titanium
Sulphate Solutions," Google Patents, 1977.
[16] M. J. Gázquez, J. P. Bolívar, R. Garcia-Tenorio, and F. Vaca, "A Review of the
Production Cycle of Titanium Dioxide Pigment," Materials Sciences and
Applications, vol. 2014, 2014.
[17] W. Mo, G. Deng, and F. Luo, Titanium Metallurgy. Beijing, 1998.
[18] J. W. Mullin, Crystallization. Butterworth-Heinemann, 2001.
[19] H. S. Holger, "Titanium Dioxide Pigment Production," Google Patents, 1949.
[20] C.-X. Tian et al., "Influence of Hydrolysis in Sulfate Process on Titania Pigment
Producing," Transactions of Nonferrous Metals Society of China, vol. 19, pp. s829-
s833, 2009.
[21] E. R. Lawhorne, "Titanium Dioxide With High Purity and Uniform Particle Size
and Method Therefore," Google Patents, 1990.
[22] P. Run, "Sulfate Process TiO2 Pigment Production," Beijing: Chemical Industry
Press, 1991.
[23] S. J. Gerdemann, "Titanium Process Technologies," Advanced Materials &
Processes, vol. 159, no. DOE/ARC-2002-007, 2001.
[24] J. Winkler, Titanium dioxide: production, properties and effective usage. Vincentz
Network, 2013.
[25] G. Li, L. Li, J. Boerio-Goates, and B. F. Woodfield, "High Purity Anatase TiO2
Nanocrystals: Near Room-Temperature Synthesis, Grain Growth Kinetics, and
Surface Hydration Chemistry," Journal of the American Chemical Society, vol. 127,
no. 24, pp. 8659-8666, 2005.
[26] I.-S. Park, S.-R. Jang, J. S. Hong, R. Vittal, and K.-J. Kim, "Preparation of
Composite Anatase TiO2 Nanostructure by Precipitation from Hydrolyzed TiCl4

81
Solution Using Anodic Alumina Membrane," Chemistry of Materials, vol. 15, no.
24, pp. 4633-4636, 2003.
[27] J. Jean and T. Ring, "Nucleation and Growth of Monosized Titania Powders from
Alcohol Solution," Langmuir, vol. 2, no. 2, pp. 251-255, 1986.
[28] S. J. Kim, S. D. Park, Y. H. Jeong, and S. Park, "Homogeneous Precipitation of
TiO2 Ultrafine Powders from Aqueous TiOCl2 Solution," Journal of the American
Ceramic Society, vol. 82, no. 4, pp. 927-932, 1999.
[29] Y. Zhu, L. Zhang, C. Gao, and L. Cao, "The Synthesis of Nanosized TiO2 Powder
Using A Sol-Gel Method With TiCl4 as a Precursor," Journal of Materials Science,
vol. 35, no. 16, pp. 4049-4054, 2000.
[30] E. A. Barringer and H. K. Bowen, "High-Purity, Monodisperse TiO2 Powders by
Hydrolysis of Titanium Tetraethoxide. 1. Synthesis and Physical Properties,"
Langmuir, vol. 1, no. 4, pp. 414-420, 1985.
[31] S. Eiden-Assmann, J. Widoniak, and G. Maret, "Synthesis and Characterization of
Porous and Nonporous Monodisperse Colloidal TiO2 Particles," Chemistry of
Materials, vol. 16, no. 1, pp. 6-11, 2004.
[32] S. Middlemas, Z. Z. Fang, and P. Fan, "A New Method for Production of Titanium
Dioxide Pigment," Hydrometallurgy, vol. 131, pp. 107-113, 2013.
[33] Y. Zhang, T. Qi, and Y. Zhang, "A Novel Preparation of Titanium Dioxide from
Titanium Slag," Hydrometallurgy, vol. 96, no. 1, pp. 52-56, 2009.
[34] L. Yahui, M. Fancheng, F. Fuqiang, W. Weijing, C. Jinglong, and Q. Tao,
"Preparation of Rutile Titanium Dioxide Pigment from Low-Grade Titanium Slag
Pretreated by the Naoh Molten Salt Method," Dyes and Pigments, vol. 125, pp.
384-391, 2016.
[35] V. K. LaMer and R. H. Dinegar, "Theory, Production and Mechanism of Formation
of Monodispersed Hydrosols," Journal of the American Chemical Society, vol. 72,
no. 11, pp. 4847-4854, 1950.
[36] N. T. Thanh, N. Maclean, and S. Mahiddine, "Mechanisms of Nucleation and
Growth of Nanoparticles in Solution," Chemical Reviews, vol. 114, no. 15, pp.
7610-7630, 2014.
[37] T. Sugimoto, Monodispersed particles. Elsevier, 2001.
[38] T. Sugimoto, "Preparation of Monodispersed Colloidal Particles," Advances in
Colloid and Interface Science, vol. 28, pp. 65-108, 1987.
[39] T. Sugimoto, F. Shiba, T. Sekiguchi, and H. Itoh, "Spontaneous Nucleation of
Monodisperse Silver Halide Particles from Homogeneous Gelatin Solution I: Silver

82
Chloride," Colloids and Surfaces A: Physicochemical and Engineering Aspects, vol.
164, no. 2, pp. 183-203, 2000.
[40] T. Sugimoto, X. Zhou, and A. Muramatsu, "Synthesis of Uniform Anatase TiO2
Nanoparticles by Gel–Sol Method: 1. Solution Chemistry of Ti(OH)n(4−n)+
Complexes," Journal of Colloid and Interface Science, vol. 252, no. 2, pp. 339-346,
2002.
[41] J. D. Gilchrist, "Extraction Metallurgy," Pergamon Press plc, 1989, p. 431, 1989.
[42] J. Kong, B. Chao, T. Wang, and Y. Yan, "Preparation of Ultrafine Spherical
AlOOH and Al2O3 Powders by Aqueous Precipitation Method With Mixed
Surfactants," Powder Technology, vol. 229, pp. 7-16, 2012.
[43] W. Stöber, A. Fink, and E. Bohn, "Controlled Growth of Monodisperse Silica
Spheres in the Micron Size Range," Journal of Colloid and Interface Science, vol.
26, no. 1, pp. 62-69, 1968.
[44] S. Doeuff, M. Henry, C. Sanchez, and J. Livage, "Hydrolysis of Titanium
Alkoxides: Modification of the Molecular Precursor by Acetic Acid," Journal of
Non-crystalline Solids, vol. 89, no. 1-2, pp. 206-216, 1987.
[45] Y.-S. Her, S.-H. Lee, and E. Matijević, "Continuous Precipitation of
Monodispersed Colloidal Particles. II. SiO2, Al(OH)3, and BaTiO3," Journal of
materials research, vol. 11, no. 01, pp. 156-161, 1996.
[46] G. Bogush and C. Zukoski, "Studies of The Kinetics of the Precipitation of Uniform
Silica Particles Through the Hydrolysis and Condensation of Silicon Alkoxides,"
Journal of Colloid and Interface Science, vol. 142, no. 1, pp. 1-18, 1991.
[47] G. Bogush and C. Zukoski, "Uniform Silica Particle Precipitation: An Aggregative
Growth Model," Journal of Colloid and Interface Science, vol. 142, no. 1, pp. 19-
34, 1991.
[48] J. Livage, M. Henry, and C. Sanchez, "Sol-Gel Chemistry of Transition Metal
Oxides," Progress in Solid State Chemistry, vol. 18, no. 4, pp. 259-341, 1988.
[49] J. Livage, C. Sanchez, M. Henry, and S. Doeuff, "The Chemistry of the Sol-Gel
Process," Solid State Ionics, vol. 32, pp. 633-638, 1989.
[50] R. S. Sapieszko and E. Matijević, "Preparation of Well-Defined Colloidal Particles
by Thermal Decomposition of Metal Chelates. I. Iron Oxides," Journal of Colloid
and Interface Science, vol. 74, no. 2, pp. 405-422, 1980.
[51] R. Demchak and E. Matijević, "Preparation and Particle Size Analysis of
Chromium Hydroxide Hydrosols of Narrow Size Distributions," Journal of Colloid
and Interface Science, vol. 31, no. 2, pp. 257-262, 1969.

83
[52] D. Hague and M. Mayo, "The Effect of Crystallization and a Phase Transformation
on the Grain Growth of Nanocrystalline Titania," Nanostructured Materials, vol. 3,
no. 1-6, pp. 61-67, 1993.
[53] A. Chittofrati and E. Matijević, "Uniform Particles of Zinc Oxide of Different
Morphologies," Colloids and Surfaces, vol. 48, pp. 65-78, 1990.
[54] C. J. Brinker and G. W. Scherer, Sol-gel science: the physics and chemistry of sol-
gel processing. Academic press, 2013.
[55] L. L. Hench and J. K. West, "The Sol-Gel Process," Chemical Reviews, vol. 90, no.
1, pp. 33-72, 1990.