Embed Size (px)
Citation preview
Hydrology:Soil moisture, Rainfall, and Evapotranspiration
Tarendra LakhankarNOAA-CREST Center, The City University of New York
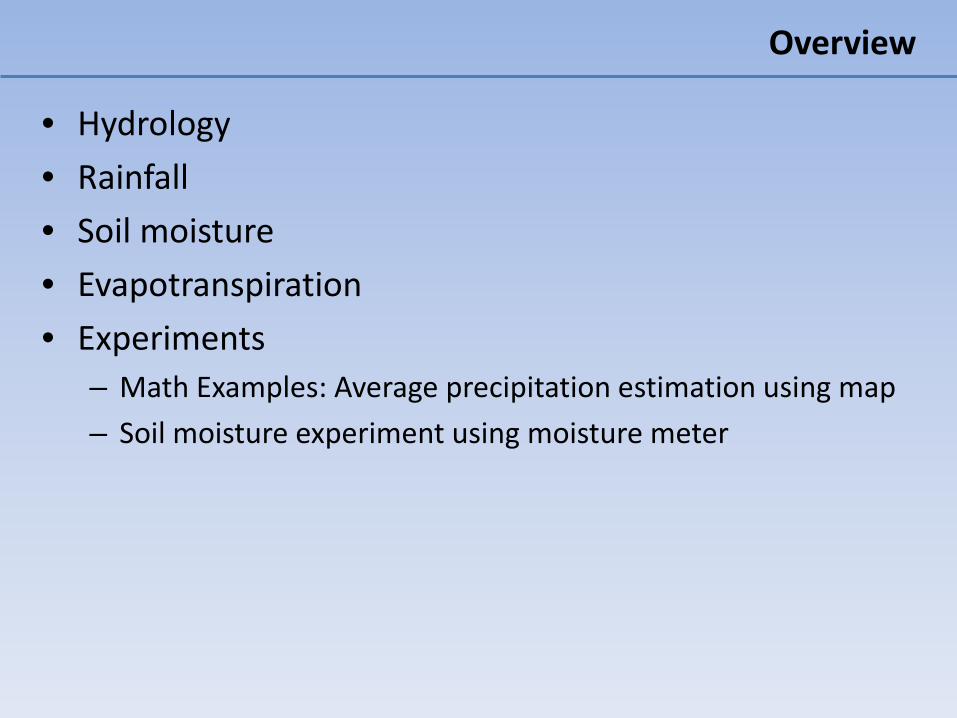
• Hydrology• Rainfall• Soil moisture• Evapotranspiration• Experiments
– Math Examples: Average precipitation estimation using map– Soil moisture experiment using moisture meter
Overview
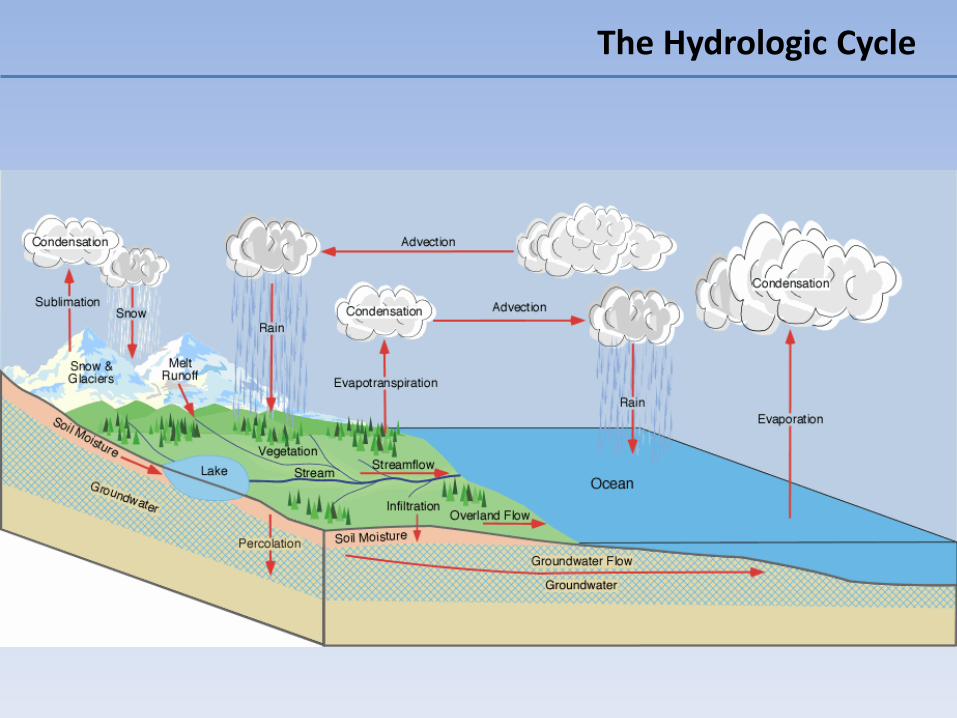
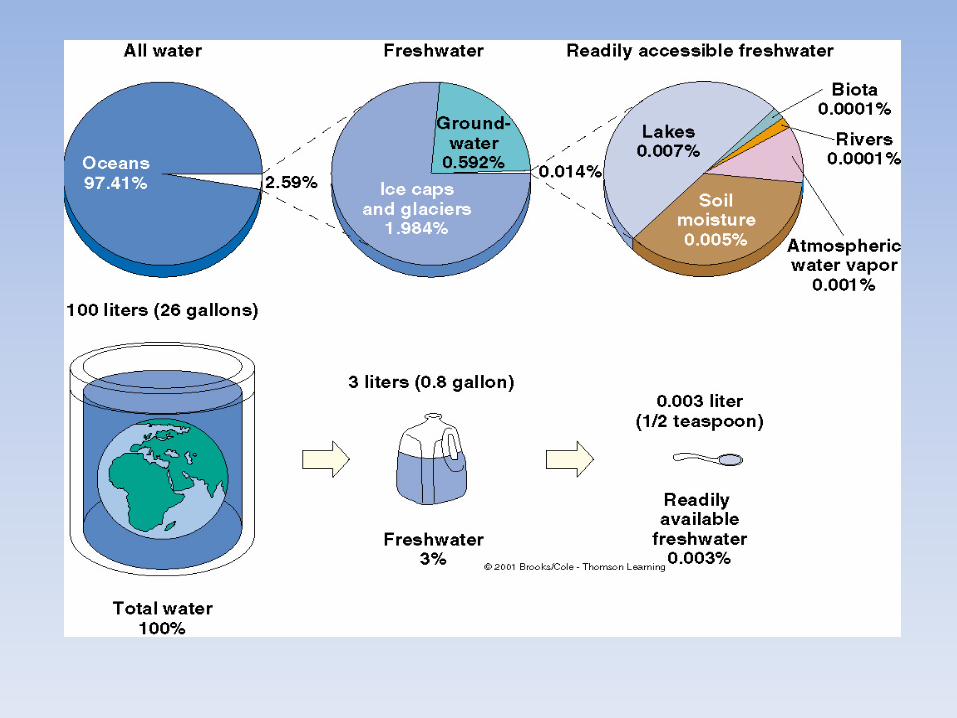
The Hydrologic Cycle
Rainfall
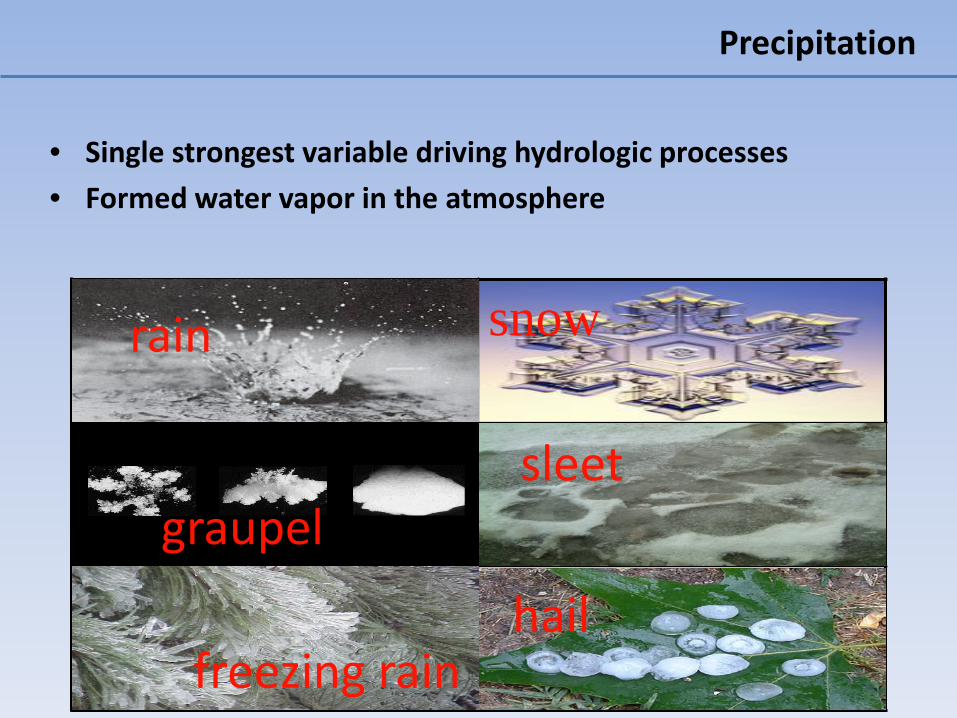
Precipitation
• Single strongest variable driving hydrologic processes• Formed water vapor in the atmosphere
snowrain
graupelsleet
freezing rainhail
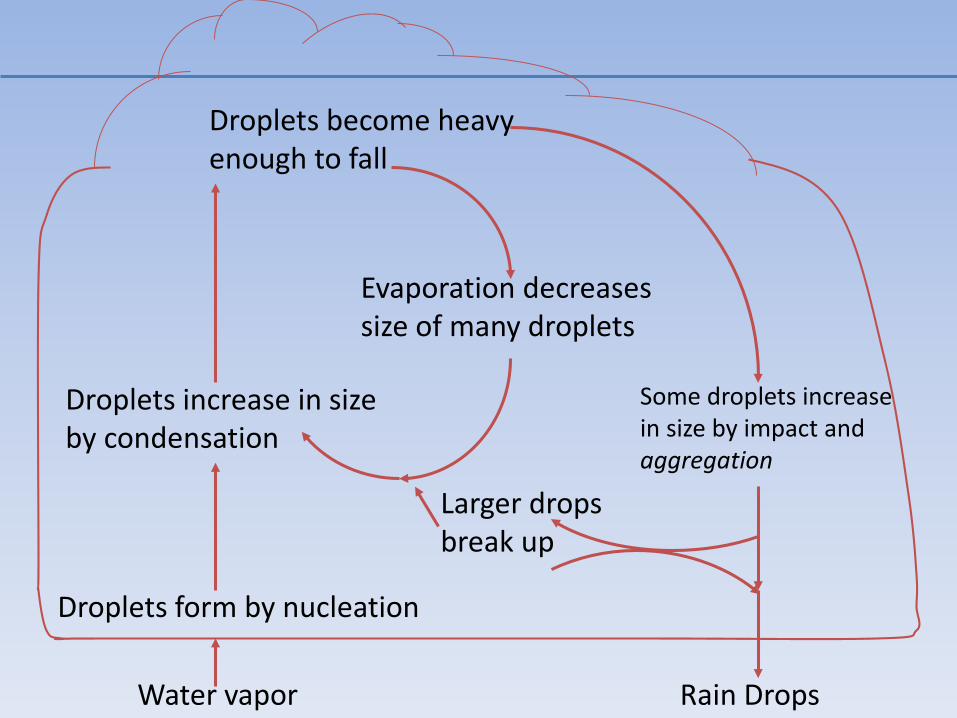
Water vapor
Droplets form by nucleation
Droplets increase in sizeby condensation
Droplets become heavyenough to fall
Evaporation decreasessize of many droplets
Some droplets increase in size by impact andaggregation
Rain Drops
Larger drops break up
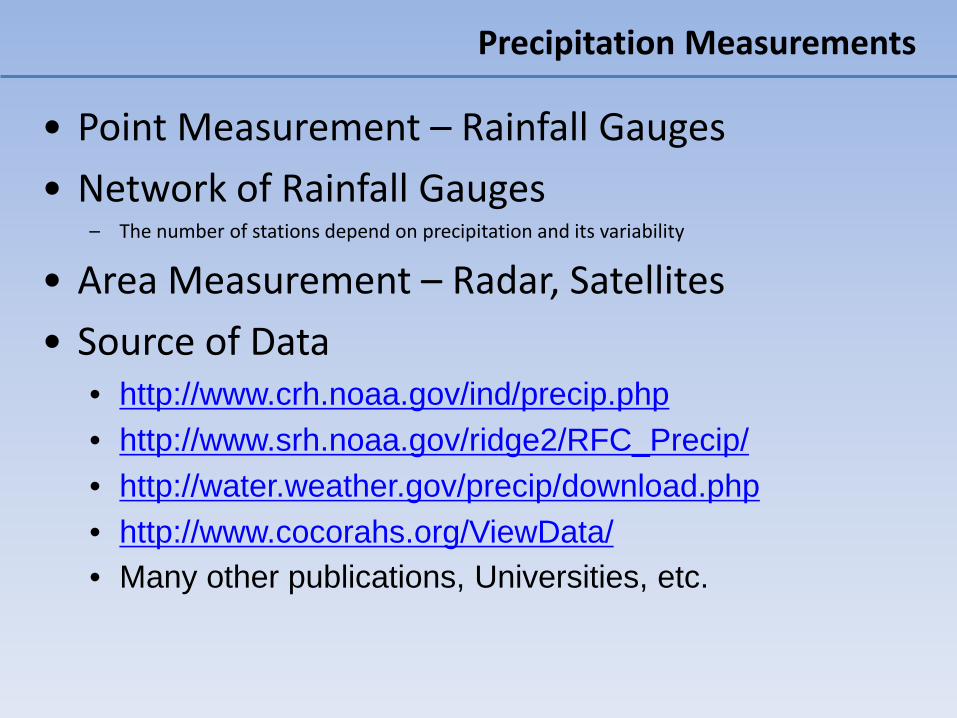
• Point Measurement – Rainfall Gauges• Network of Rainfall Gauges
– The number of stations depend on precipitation and its variability
• Area Measurement – Radar, Satellites• Source of Data
• http://www.crh.noaa.gov/ind/precip.php• http://www.srh.noaa.gov/ridge2/RFC_Precip/• http://water.weather.gov/precip/download.php• http://www.cocorahs.org/ViewData/• Many other publications, Universities, etc.
Precipitation Measurements
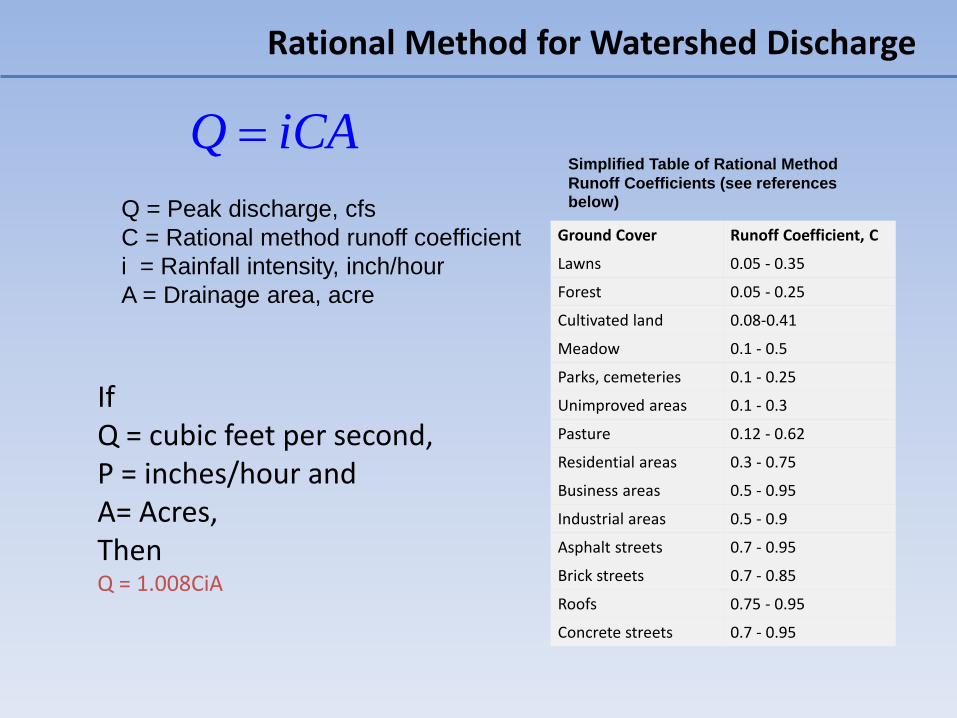
Q iCA=
If Q = cubic feet per second, P = inches/hour and A= Acres, Then Q = 1.008CiA
Q = Peak discharge, cfsC = Rational method runoff coefficienti = Rainfall intensity, inch/hourA = Drainage area, acre
Ground Cover Runoff Coefficient, C
Lawns 0.05 - 0.35
Forest 0.05 - 0.25
Cultivated land 0.08-0.41
Meadow 0.1 - 0.5
Parks, cemeteries 0.1 - 0.25
Unimproved areas 0.1 - 0.3
Pasture 0.12 - 0.62
Residential areas 0.3 - 0.75
Business areas 0.5 - 0.95
Industrial areas 0.5 - 0.9
Asphalt streets 0.7 - 0.95
Brick streets 0.7 - 0.85
Roofs 0.75 - 0.95
Concrete streets 0.7 - 0.95
Simplified Table of Rational Method Runoff Coefficients (see references below)
Rational Method for Watershed Discharge
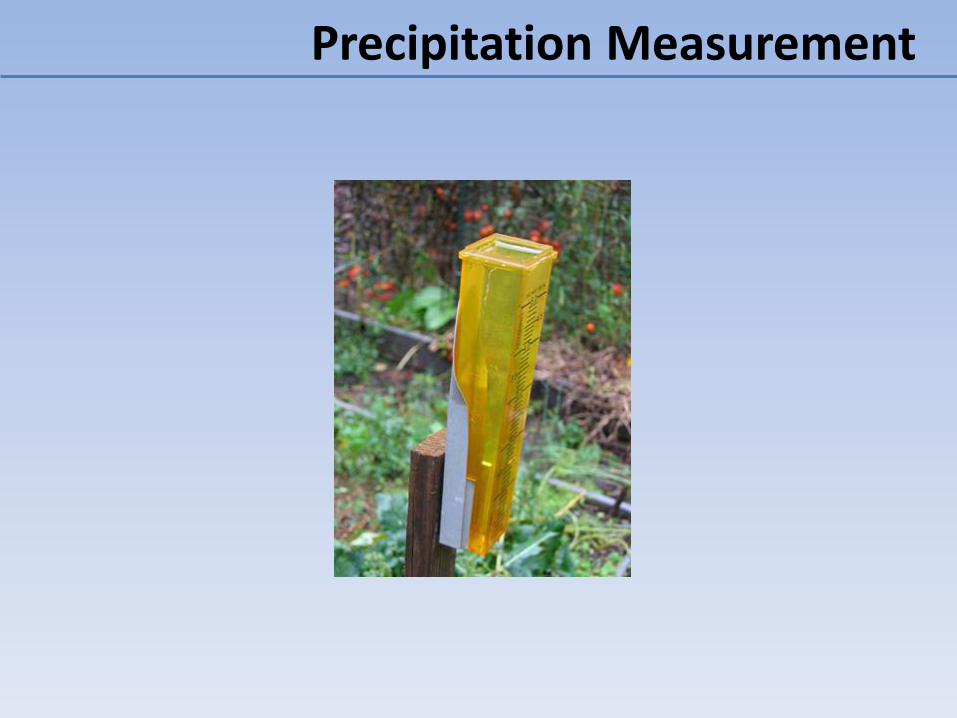
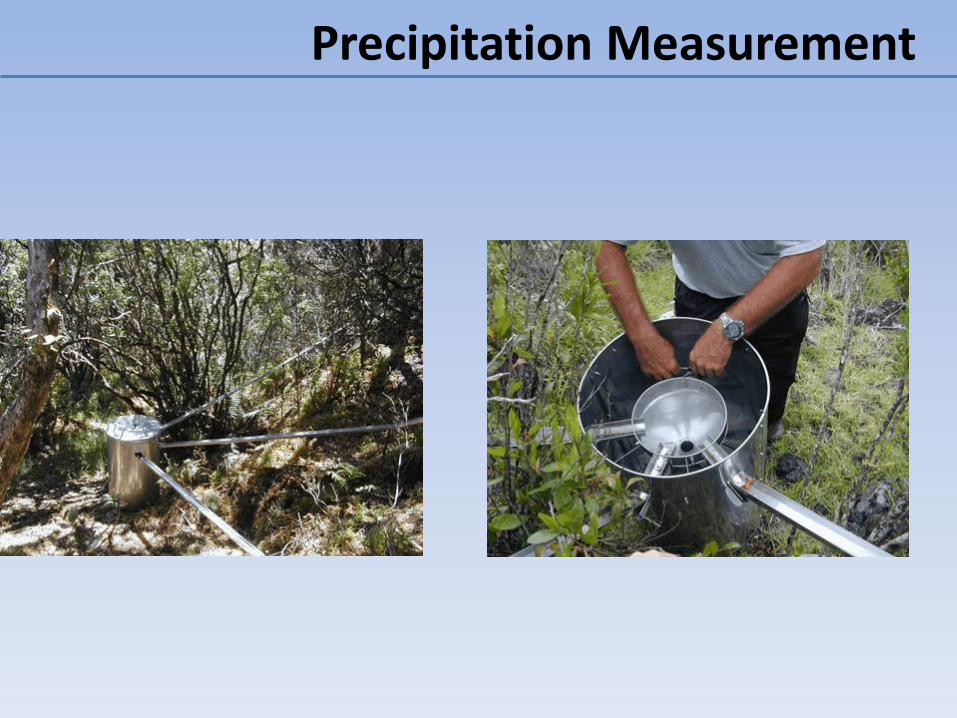
Precipitation Measurement
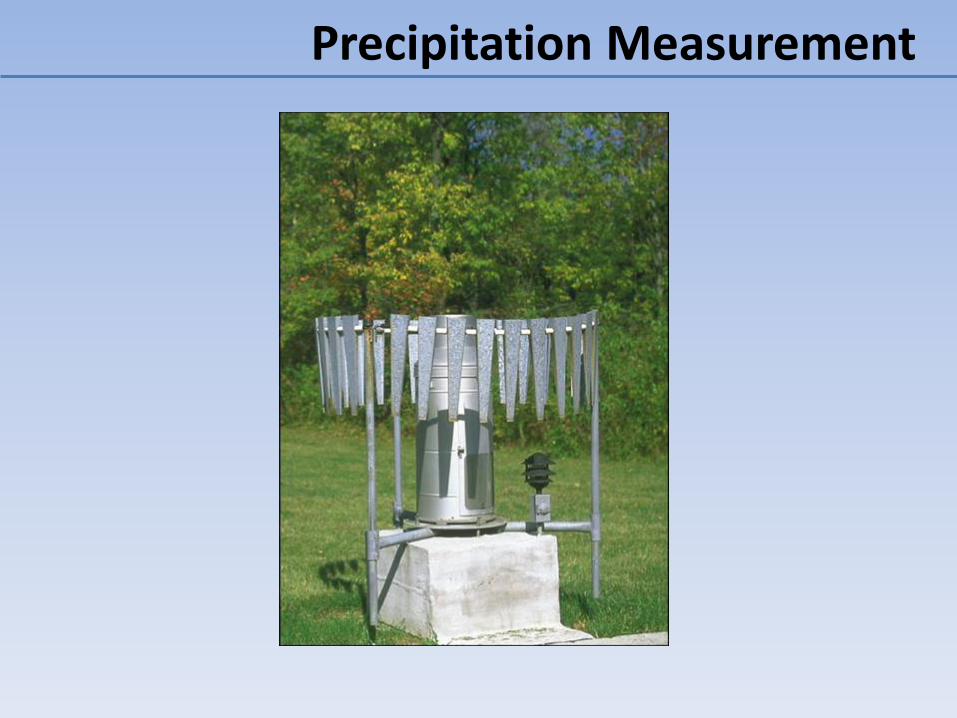
Precipitation Measurement
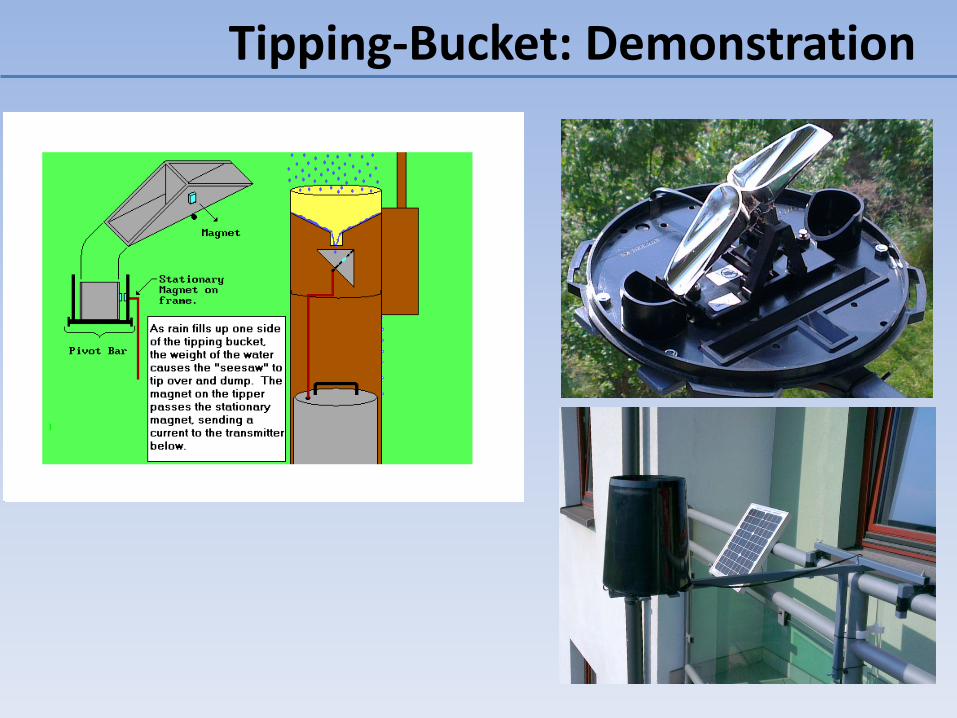
Tipping-Bucket: Demonstration
• A rain gauge (also known as an udometer, pluviometer, or an ombrometer) is a type of instrument used by meteorologists and hydrologists to gather and measure the amount of liquid precipitation over a set period of time.
Pluviometer
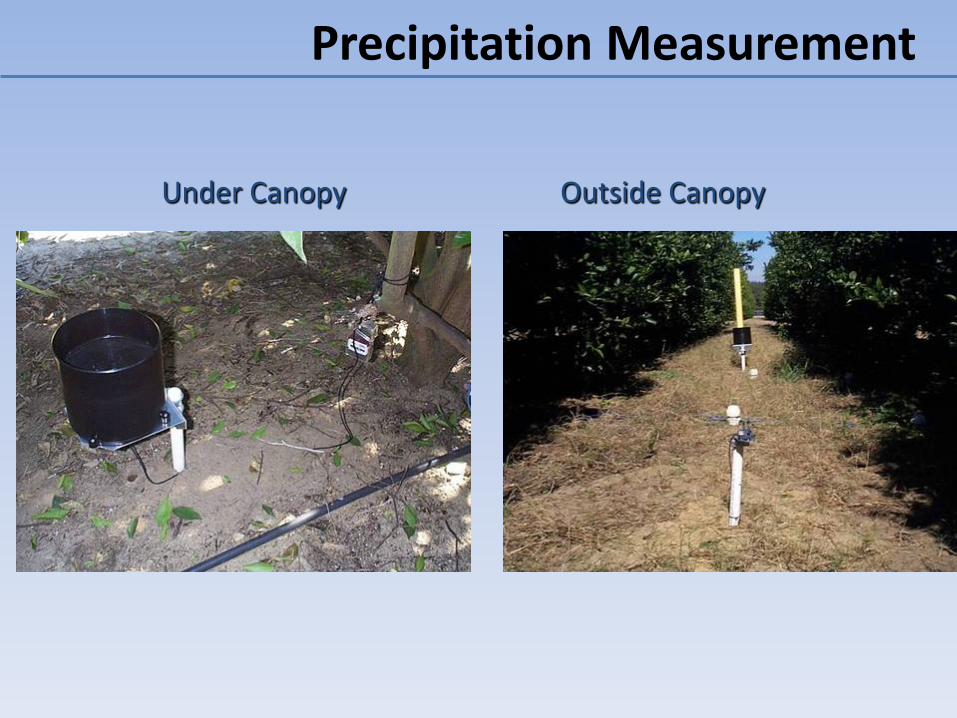
Precipitation Measurement
Outside CanopyUnder Canopy
Precipitation Measurement
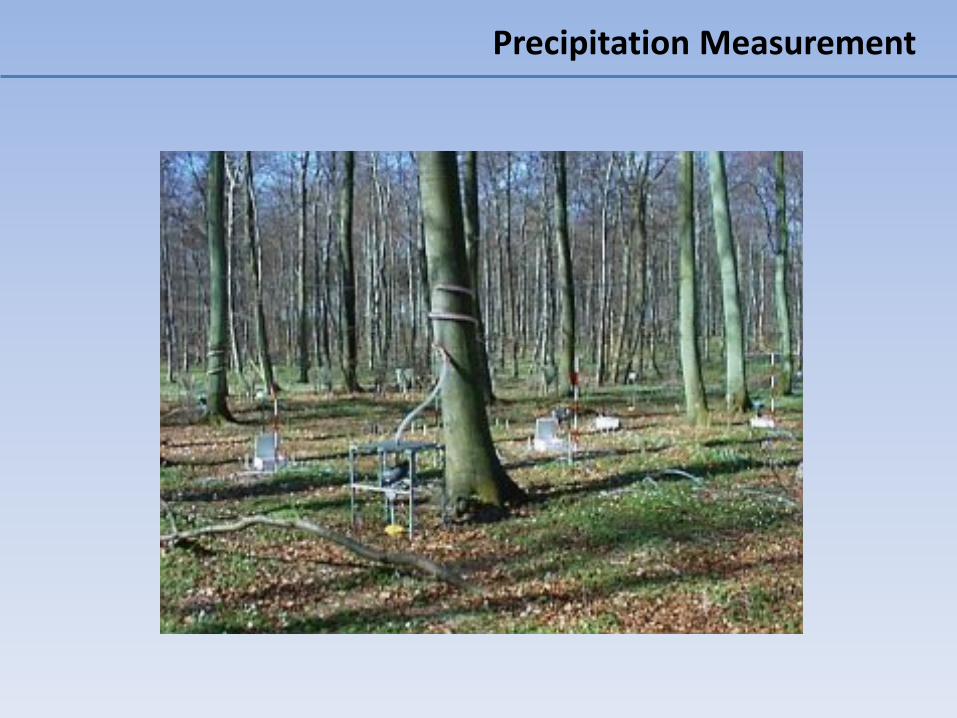
Precipitation Measurement
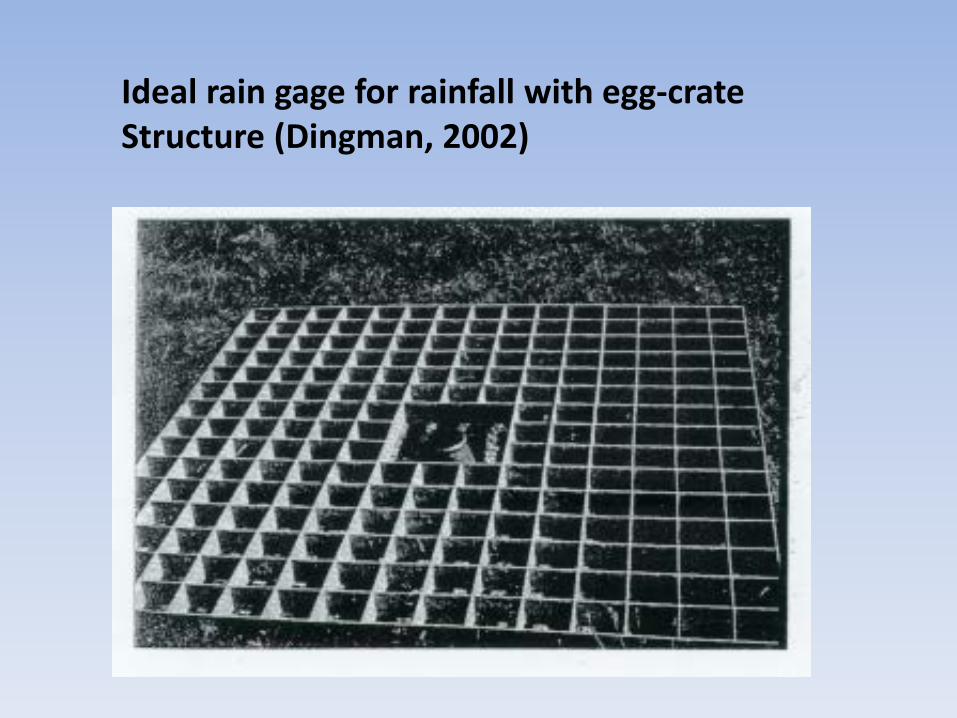
Ideal rain gage for rainfall with egg-crateStructure (Dingman, 2002)
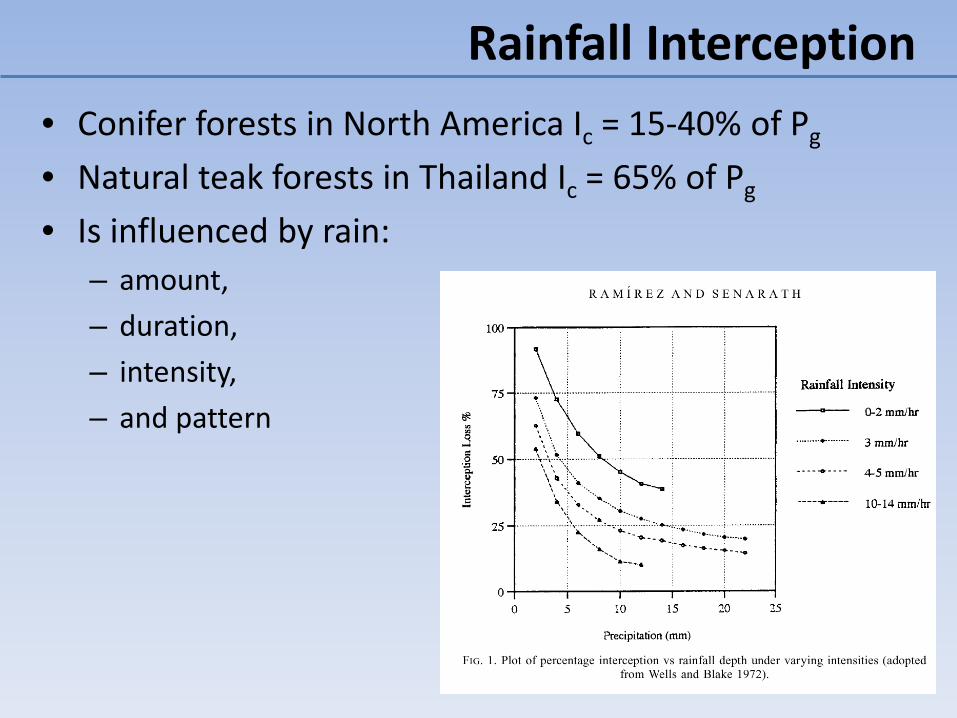
• Conifer forests in North America Ic = 15-40% of Pg
• Natural teak forests in Thailand Ic = 65% of Pg
• Is influenced by rain:– amount, – duration, – intensity, – and pattern
Rainfall Interception
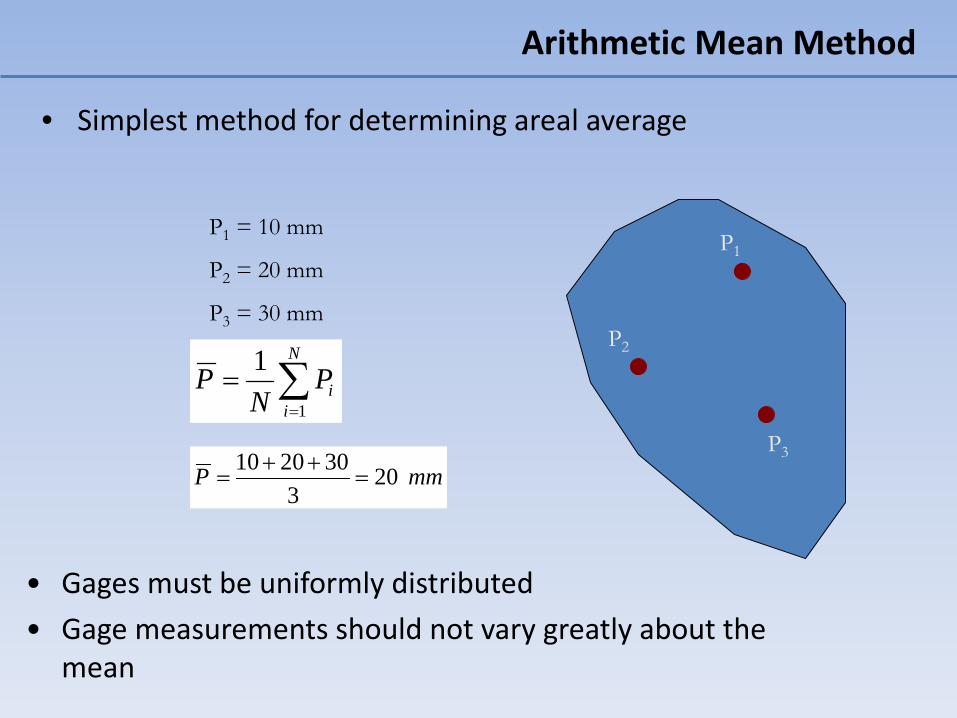
• Simplest method for determining areal average
Arithmetic Mean Method
P1
P2
P3
P1 = 10 mm
P2 = 20 mm
P3 = 30 mm
• Gages must be uniformly distributed• Gage measurements should not vary greatly about the
mean
∑=
=N
iiP
NP
1
1
mmP 203
302010=
++=
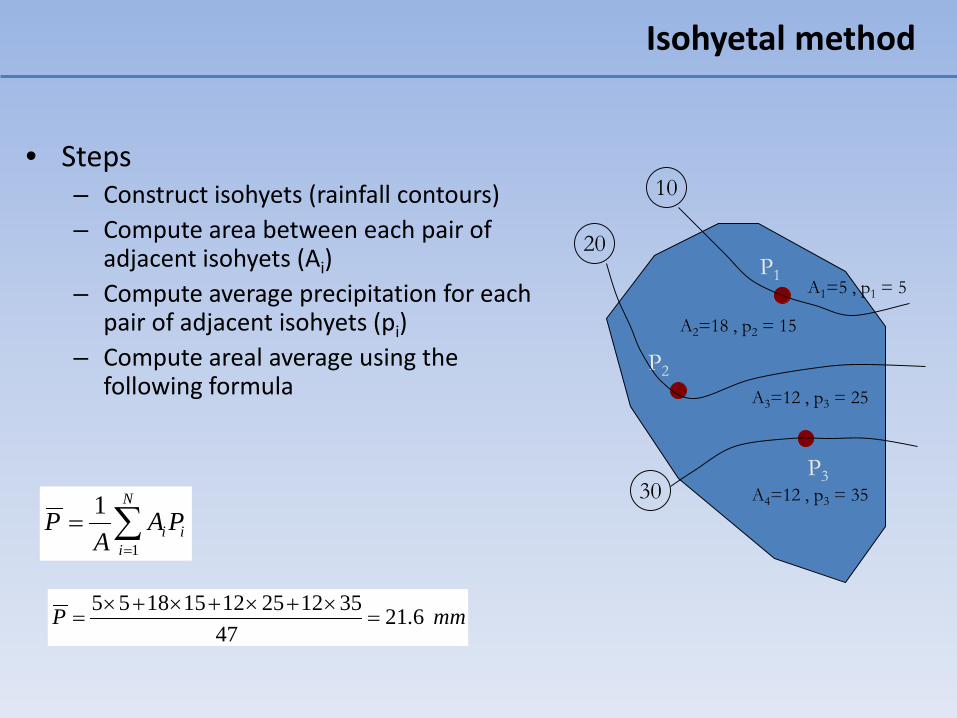
Isohyetal method
• Steps– Construct isohyets (rainfall contours)– Compute area between each pair of
adjacent isohyets (Ai)– Compute average precipitation for each
pair of adjacent isohyets (pi)– Compute areal average using the
following formula
∑=
=M
iii pAP
1
P1
P2
P3
10
20
30
A1=5 , p1 = 5
A2=18 , p2 = 15
A3=12 , p3 = 25
A4=12 , p3 = 35
mmP 6.2147
35122512151855=
×+×+×+×=
∑=
=N
iii PA
AP
1
1
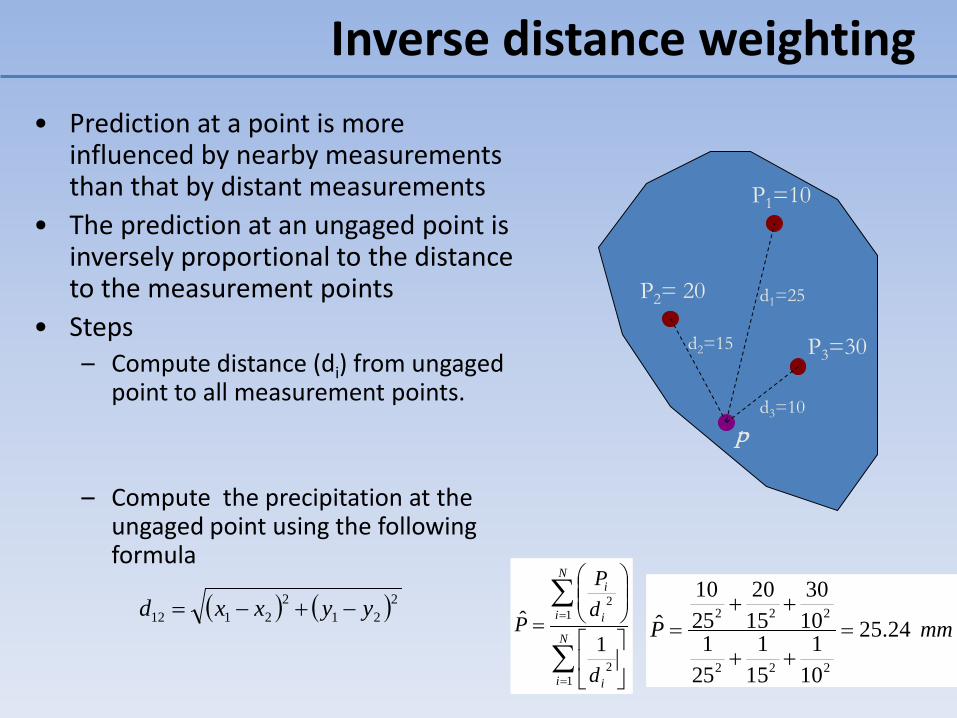
Inverse distance weighting
P1=10
P2= 20
P3=30
• Prediction at a point is more influenced by nearby measurements than that by distant measurements
• The prediction at an ungaged point is inversely proportional to the distance to the measurement points
• Steps– Compute distance (di) from ungaged
point to all measurement points.
– Compute the precipitation at the ungaged point using the following formula
∑
∑
=
=
=N
i i
N
i i
i
d
dP
P
12
12
1ˆ
d1=25
d2=15
d3=10
mmP 24.25
101
151
251
1030
1520
2510
ˆ
222
222=
++
++=
p
( ) ( )221
22112 yyxxd −+−=
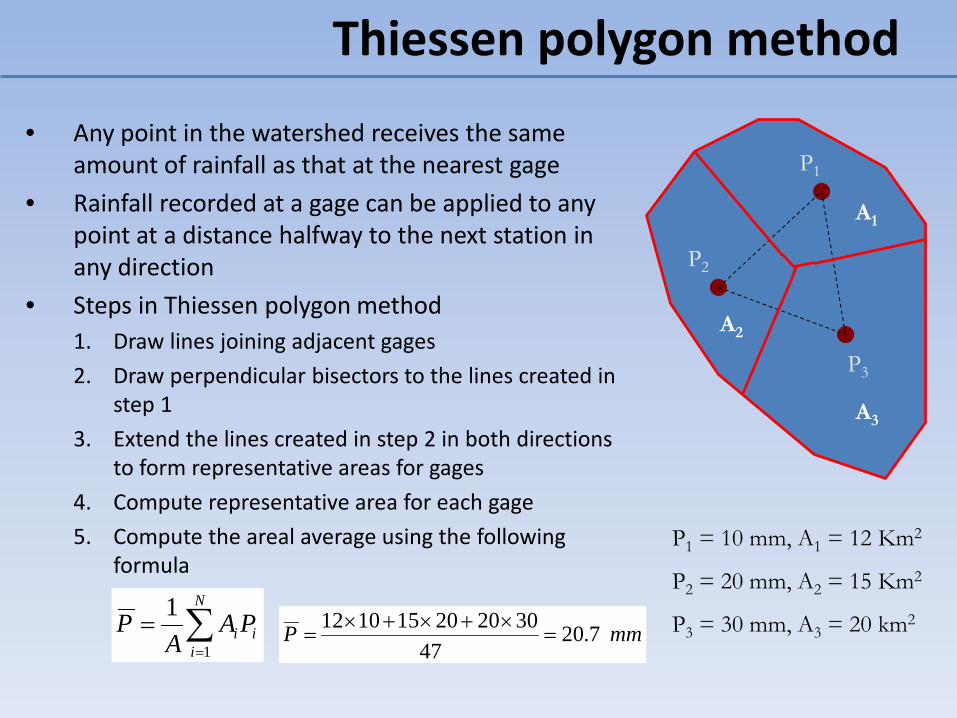
Thiessen polygon method
P1
P2
P3
A1
A2
A3
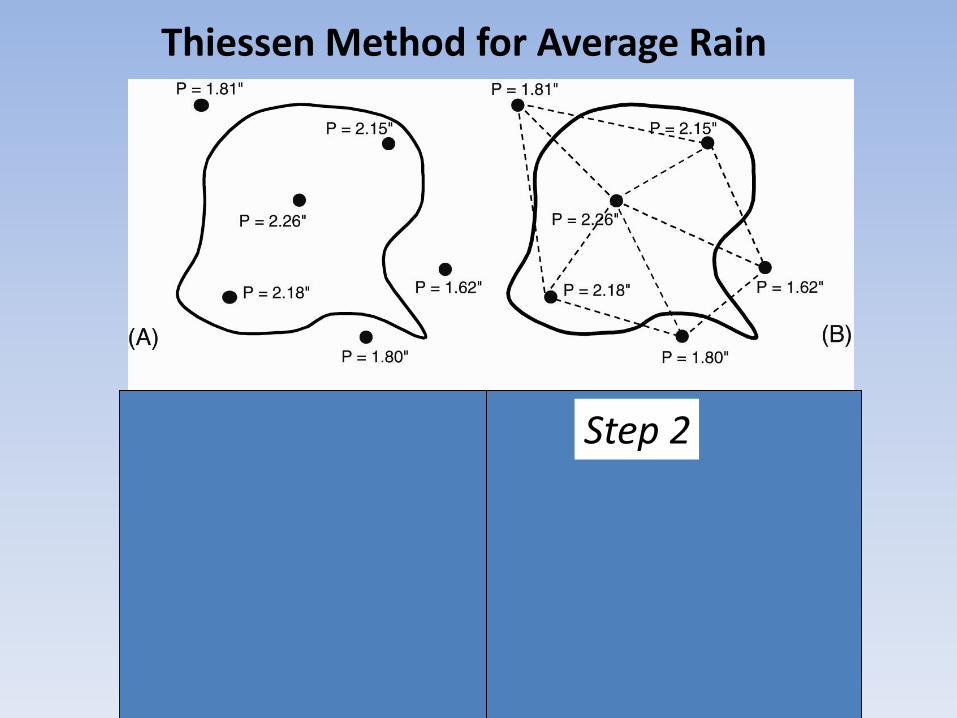
• Any point in the watershed receives the same amount of rainfall as that at the nearest gage
• Rainfall recorded at a gage can be applied to any point at a distance halfway to the next station in any direction
• Steps in Thiessen polygon method1. Draw lines joining adjacent gages 2. Draw perpendicular bisectors to the lines created in
step 13. Extend the lines created in step 2 in both directions
to form representative areas for gages4. Compute representative area for each gage5. Compute the areal average using the following
formula
∑=
=N
iii PA
AP
1
1
P1 = 10 mm, A1 = 12 Km2
P2 = 20 mm, A2 = 15 Km2
P3 = 30 mm, A3 = 20 km2mmP 7.20
47302020151012
=×+×+×
=
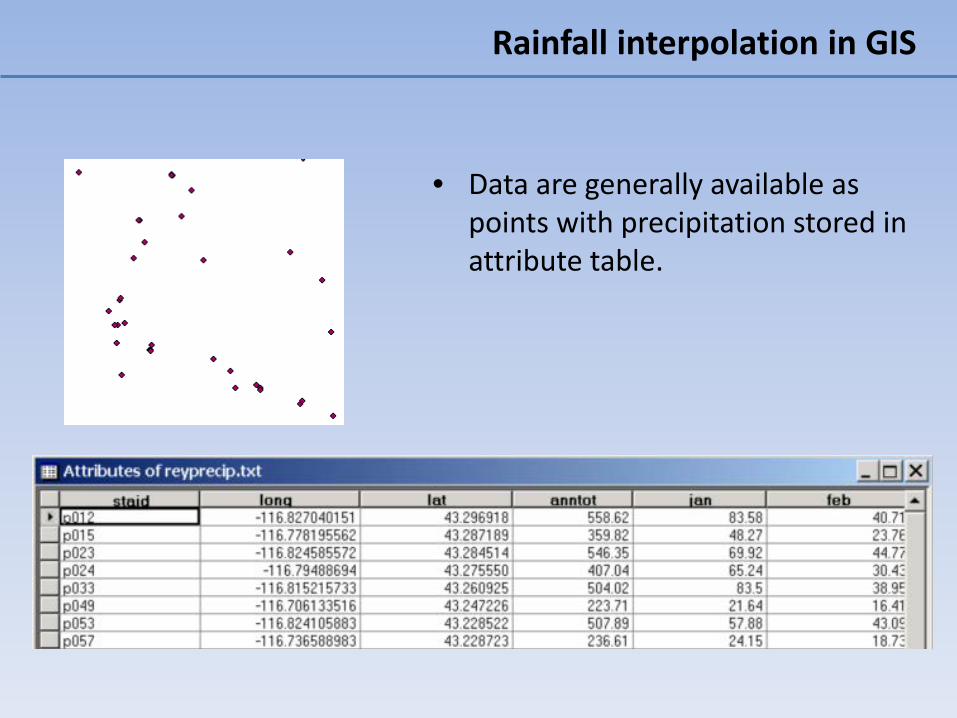
Rainfall interpolation in GIS
• Data are generally available as points with precipitation stored in attribute table.
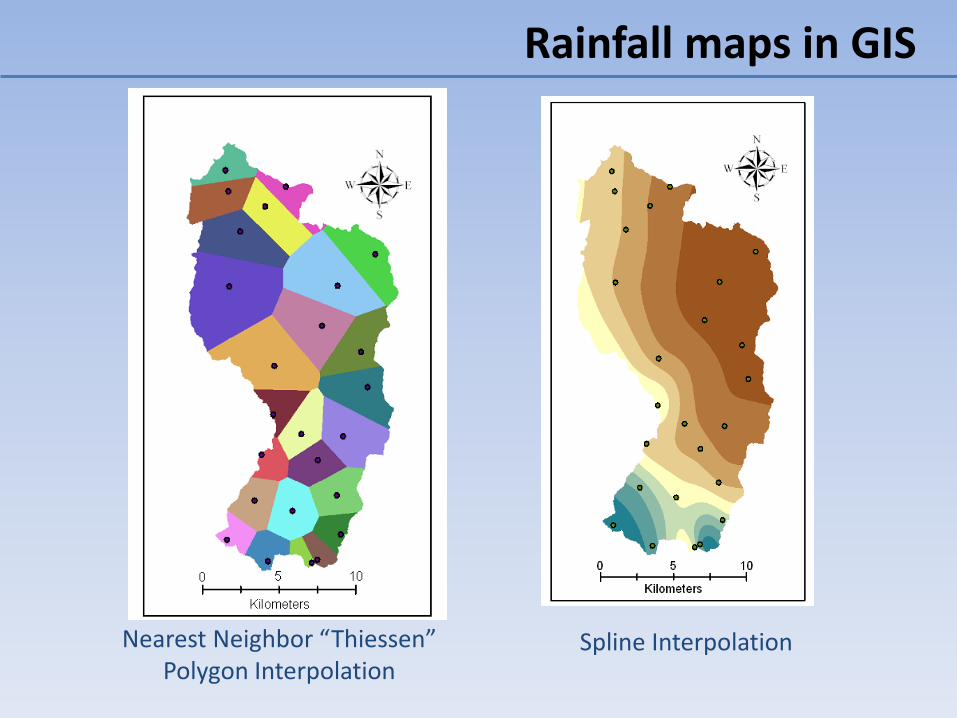
Rainfall maps in GIS
Nearest Neighbor “Thiessen” Polygon Interpolation
Spline Interpolation
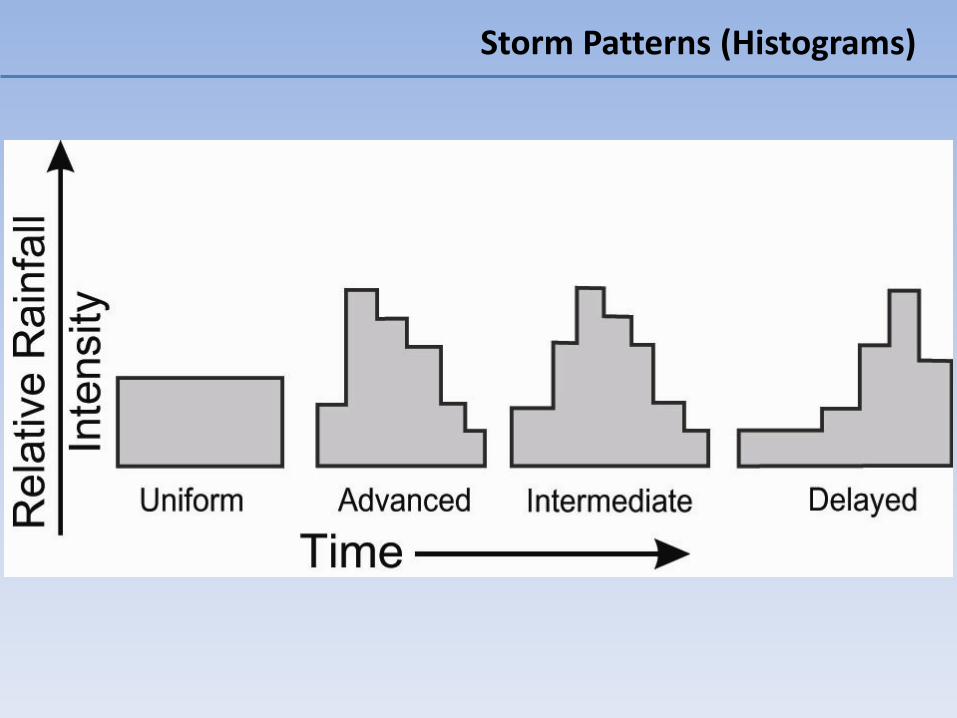
Figure 2.14
Storm Patterns (Histograms)
Lets do some calculation
Estimate Average precipitation
Soil Moisture
Soil Moisture
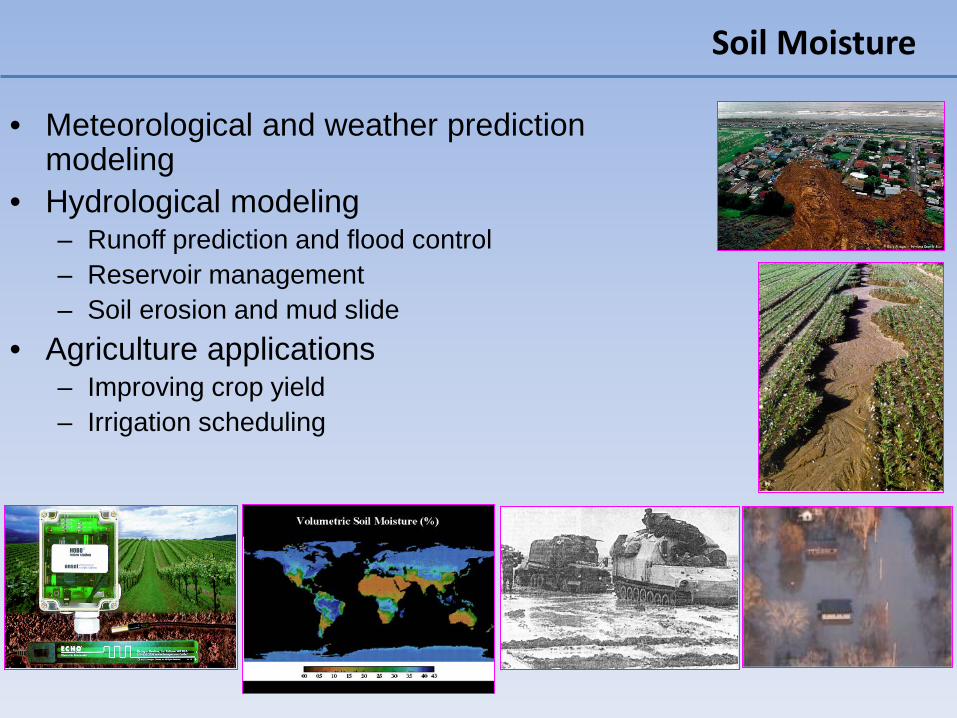
• Meteorological and weather prediction modeling
• Hydrological modeling – Runoff prediction and flood control– Reservoir management – Soil erosion and mud slide
• Agriculture applications– Improving crop yield– Irrigation scheduling
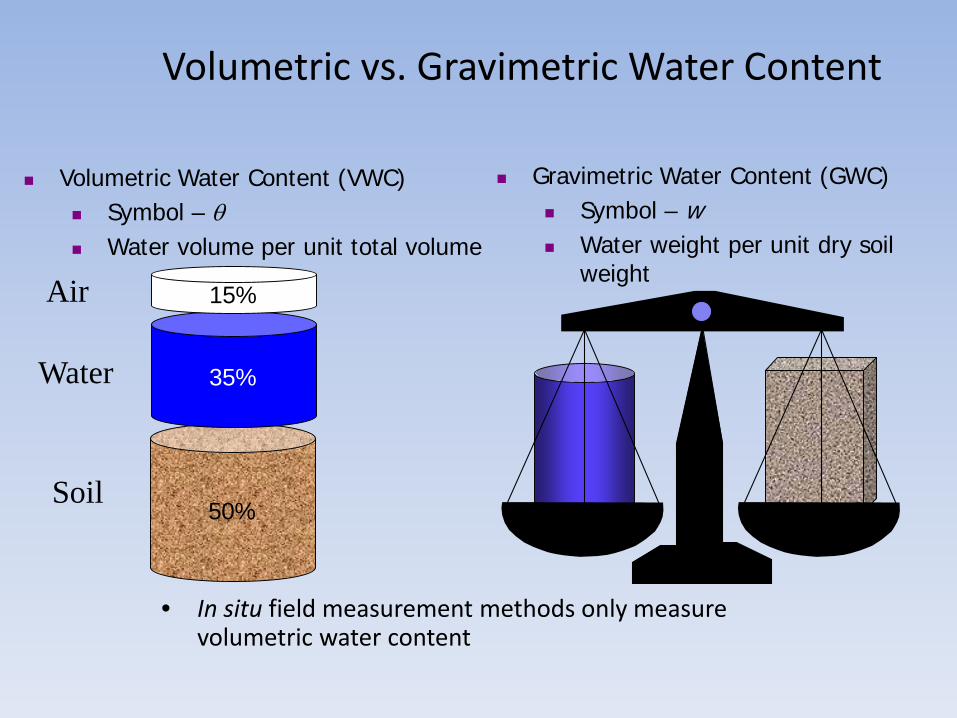
Volumetric vs. Gravimetric Water Content
• In situ field measurement methods only measure volumetric water content
Volumetric Water Content (VWC) Symbol – θ Water volume per unit total volume
Gravimetric Water Content (GWC) Symbol – w Water weight per unit dry soil
weight
50%
35%
15%Air
Water
Soil
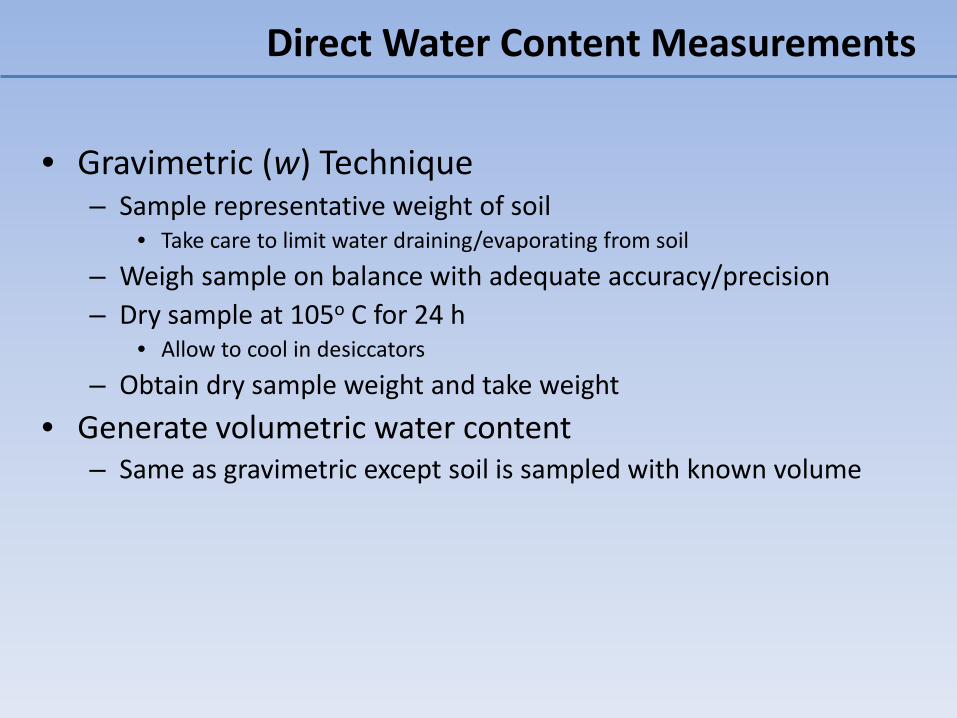
• Gravimetric (w) Technique– Sample representative weight of soil
• Take care to limit water draining/evaporating from soil– Weigh sample on balance with adequate accuracy/precision– Dry sample at 105o C for 24 h
• Allow to cool in desiccators – Obtain dry sample weight and take weight
• Generate volumetric water content– Same as gravimetric except soil is sampled with known volume
Direct Water Content Measurements
Direct Water Content Measurements
• Advantages– Simple – Direct measurement– Can be inexpensive
• Disadvantages– Destructive
• does not account for temporal variability
– Time consuming– Requires precision balance & oven
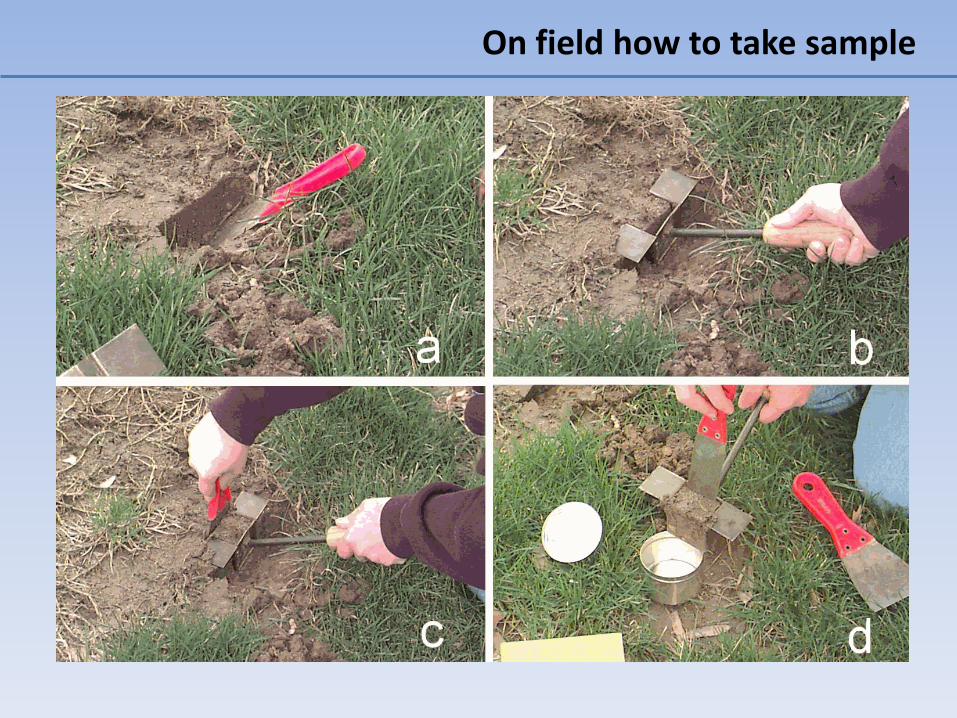
On field how to take sample
Measuring in situ Water Content (indirect)
• Neutron thermalization– Neutron probes
• Dielectric measurement– Capacitance/Frequency Domain Reflectometry (FDR)– Time Domain Reflectometry (TDR)
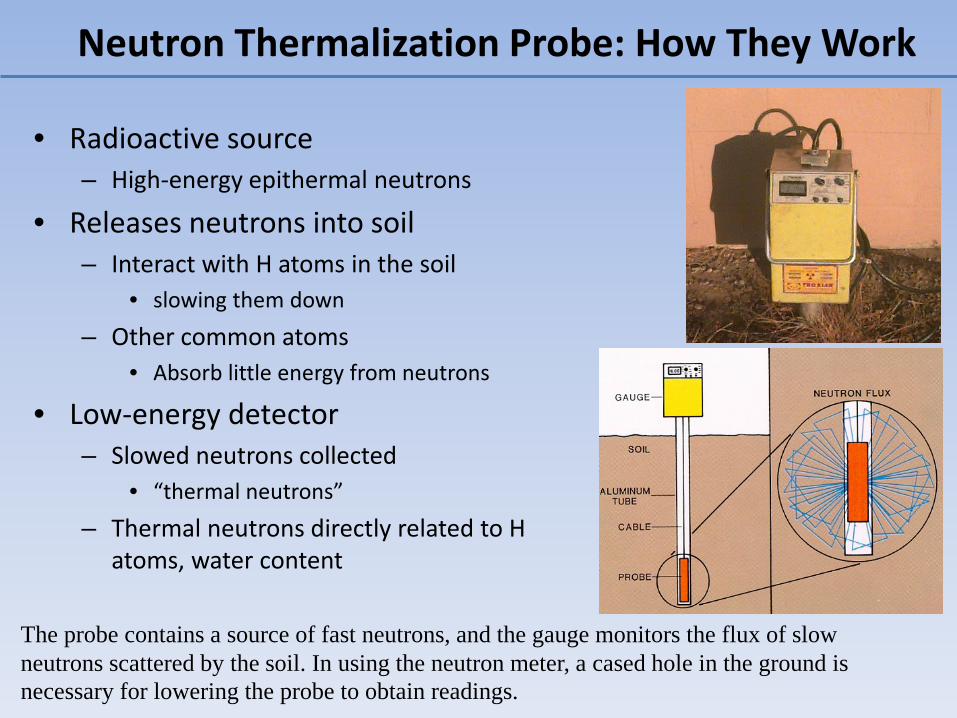
• Radioactive source– High-energy epithermal neutrons
• Releases neutrons into soil – Interact with H atoms in the soil
• slowing them down– Other common atoms
• Absorb little energy from neutrons
• Low-energy detector– Slowed neutrons collected
• “thermal neutrons”– Thermal neutrons directly related to H
atoms, water content
Neutron Thermalization Probe: How They Work
The probe contains a source of fast neutrons, and the gauge monitors the flux of slow neutrons scattered by the soil. In using the neutron meter, a cased hole in the ground is necessary for lowering the probe to obtain readings.
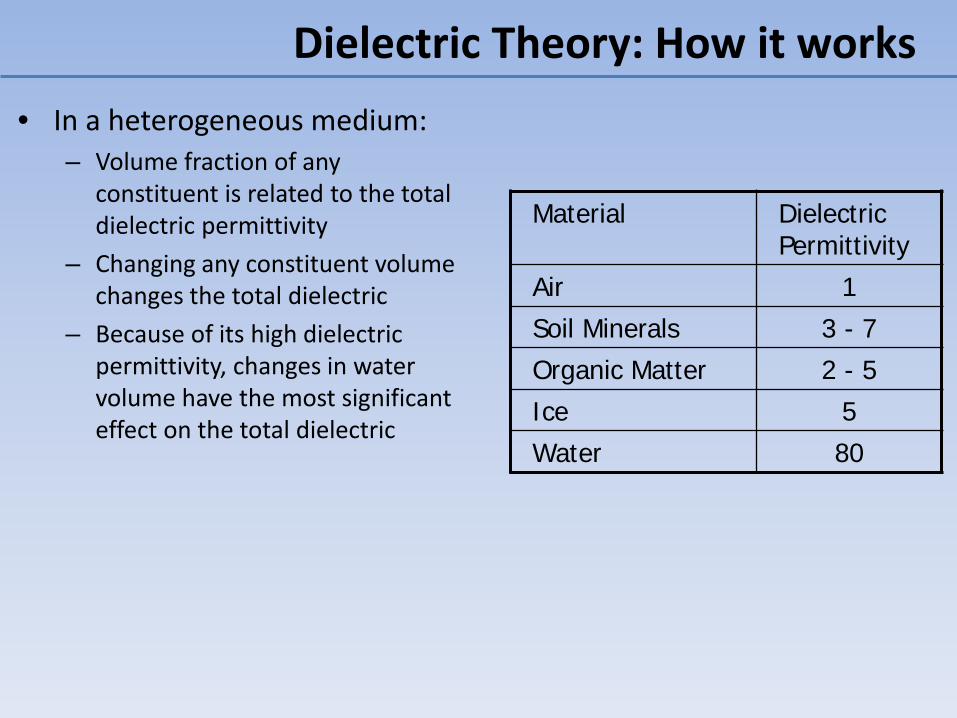
Material Dielectric Permittivity
Air 1Soil Minerals 3 - 7Organic Matter 2 - 5Ice 5 Water 80
Dielectric Theory: How it works • In a heterogeneous medium:
– Volume fraction of any constituent is related to the total dielectric permittivity
– Changing any constituent volume changes the total dielectric
– Because of its high dielectric permittivity, changes in water volume have the most significant effect on the total dielectric
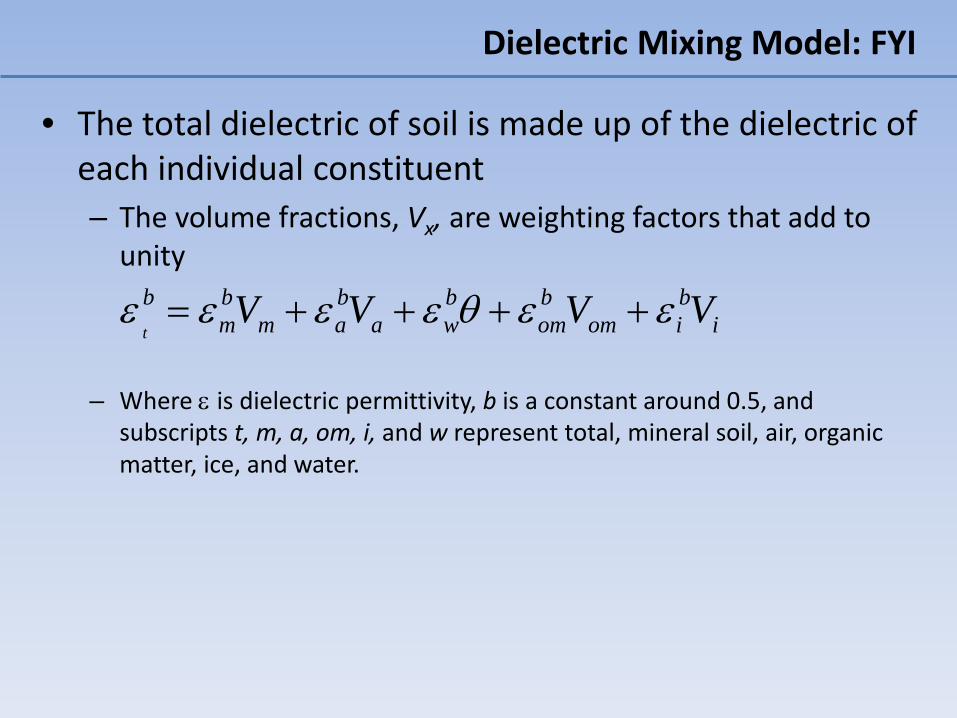
Dielectric Mixing Model: FYI
• The total dielectric of soil is made up of the dielectric of each individual constituent– The volume fractions, Vx, are weighting factors that add to
unity
– Where ε is dielectric permittivity, b is a constant around 0.5, and subscripts t, m, a, om, i, and w represent total, mineral soil, air, organic matter, ice, and water.
ibiom
bom
bwa
bam
bm
b VVVVt
εεθεεεε ++++=
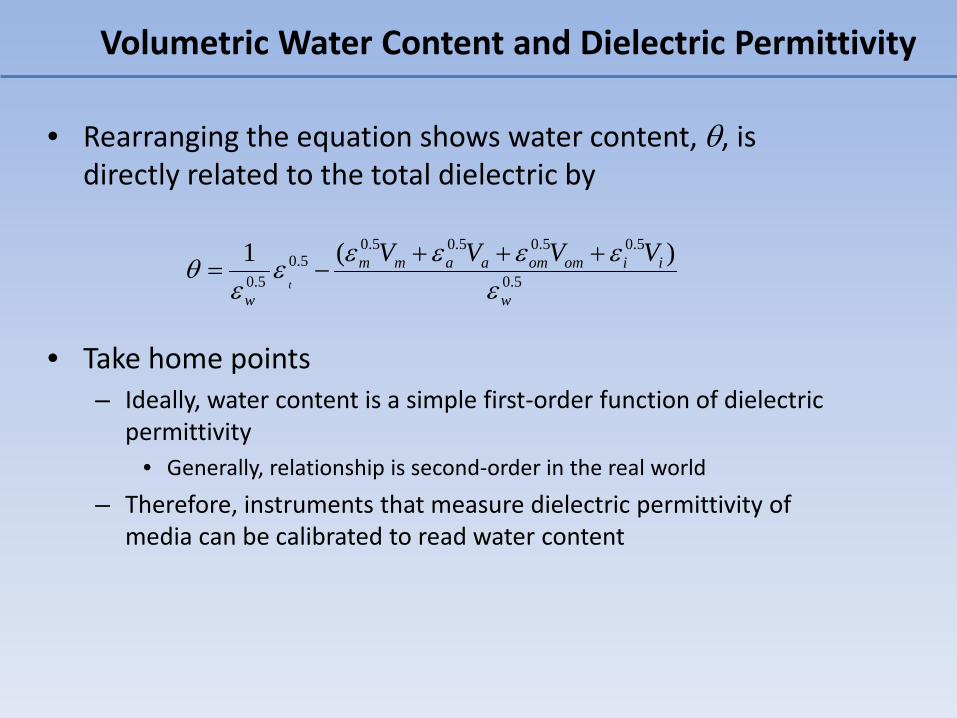
• Rearranging the equation shows water content, θ, is directly related to the total dielectric by
• Take home points– Ideally, water content is a simple first-order function of dielectric
permittivity• Generally, relationship is second-order in the real world
– Therefore, instruments that measure dielectric permittivity of media can be calibrated to read water content
5.0
5.05.05.05.05.0
5.0
)(1
w
iiomomaamm
w
VVVVt ε
εεεεεε
θ +++−=
Volumetric Water Content and Dielectric Permittivity
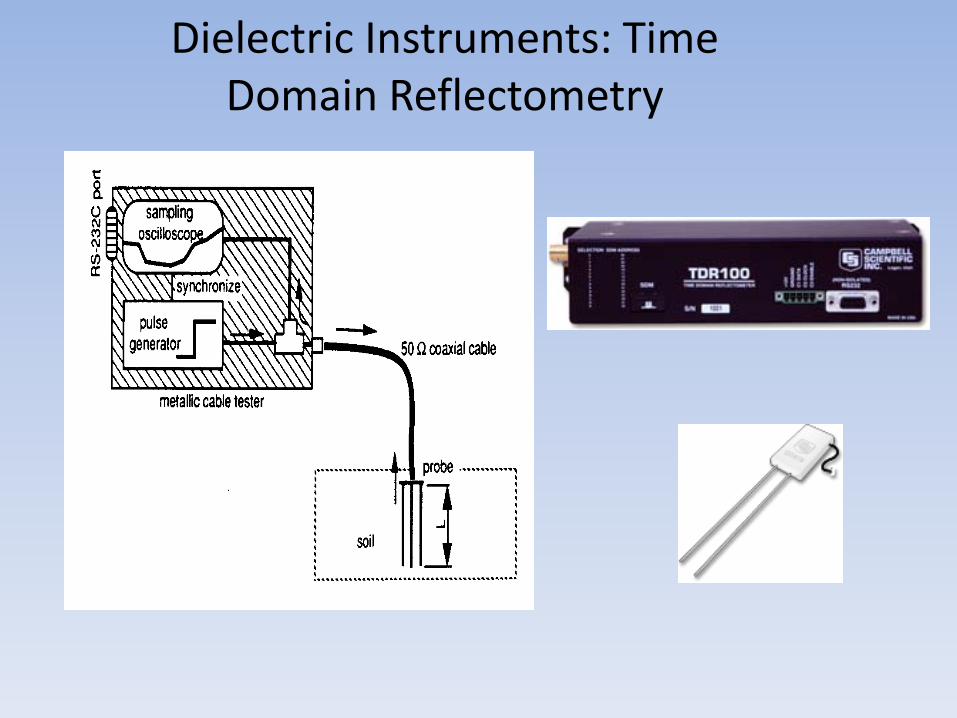
Dielectric Instruments: Time Domain Reflectometry
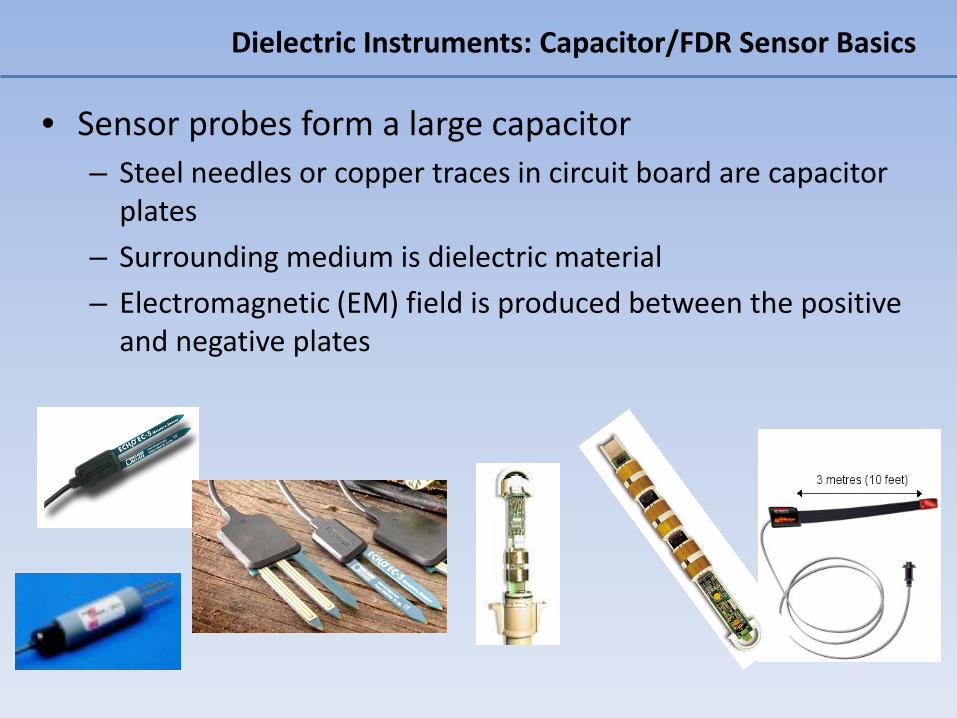
Dielectric Instruments: Capacitor/FDR Sensor Basics
• Sensor probes form a large capacitor– Steel needles or copper traces in circuit board are capacitor
plates– Surrounding medium is dielectric material– Electromagnetic (EM) field is produced between the positive
and negative plates
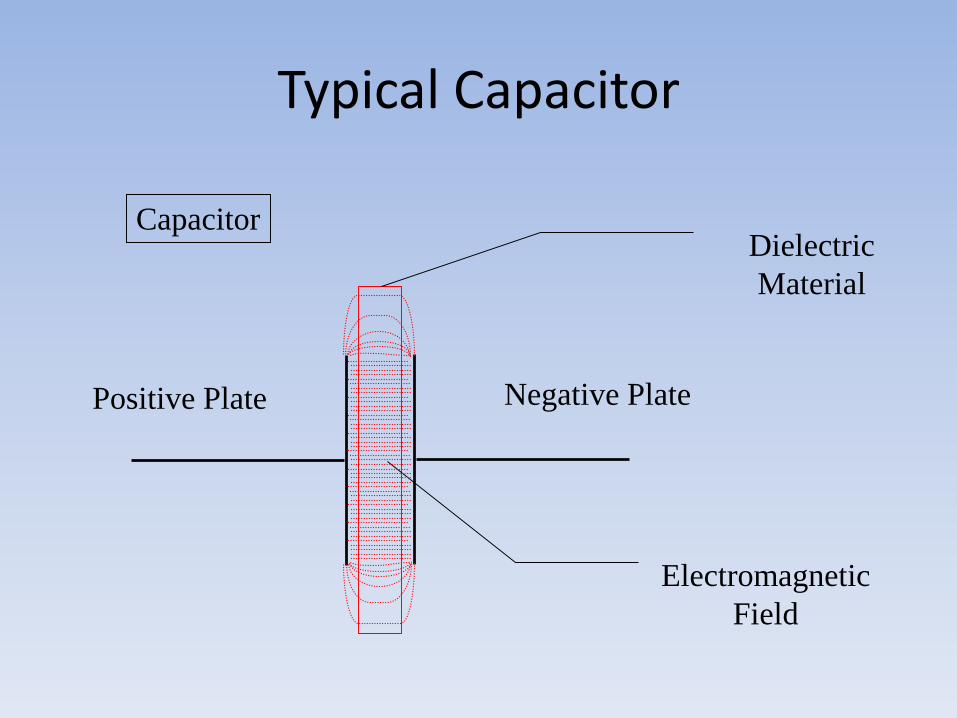
Typical Capacitor
Capacitor
Electromagnetic Field
Dielectric Material
Positive Plate Negative Plate
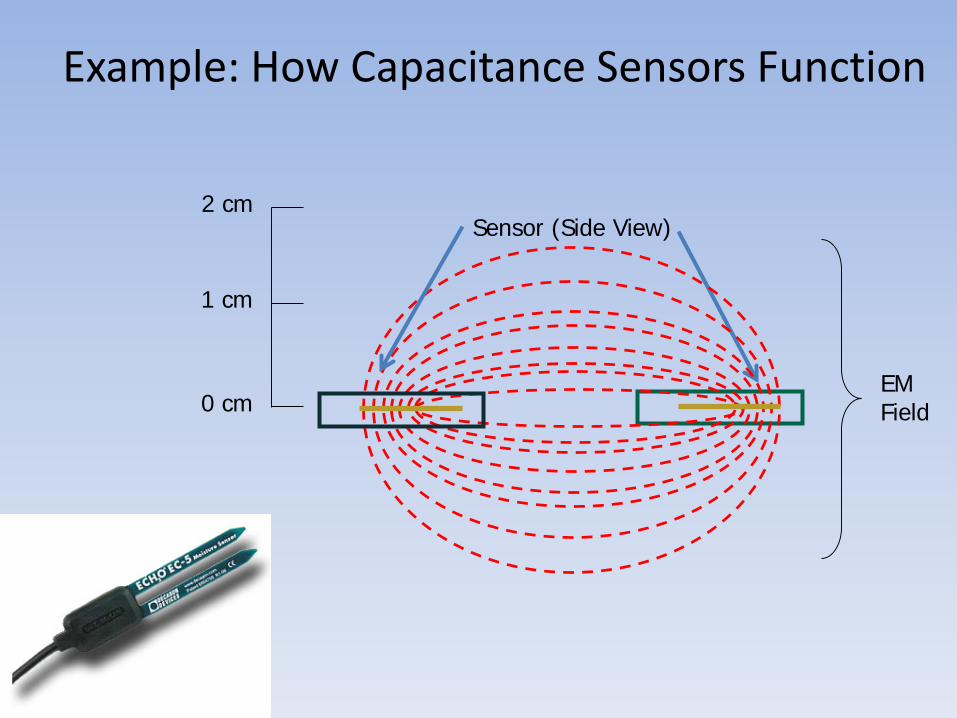
Example: How Capacitance Sensors Function
EM Field
Sensor (Side View)
0 cm
1 cm
2 cm

• Answer: It depends on what you want.– Every technique has advantages and disadvantages– All techniques will give you some information about water content
• So what are the important considerations?– Experimental needs
• How many sites? How many probes at each site? – Current inventory of equipment
• What instruments are available or can by borrowed– Budget
• How much money can be spent to get the data?– Required accuracy/precision– Manpower available to work– Certification
• People available certified to work with radioactive equipment
Question: What Technique is Best for My Research?
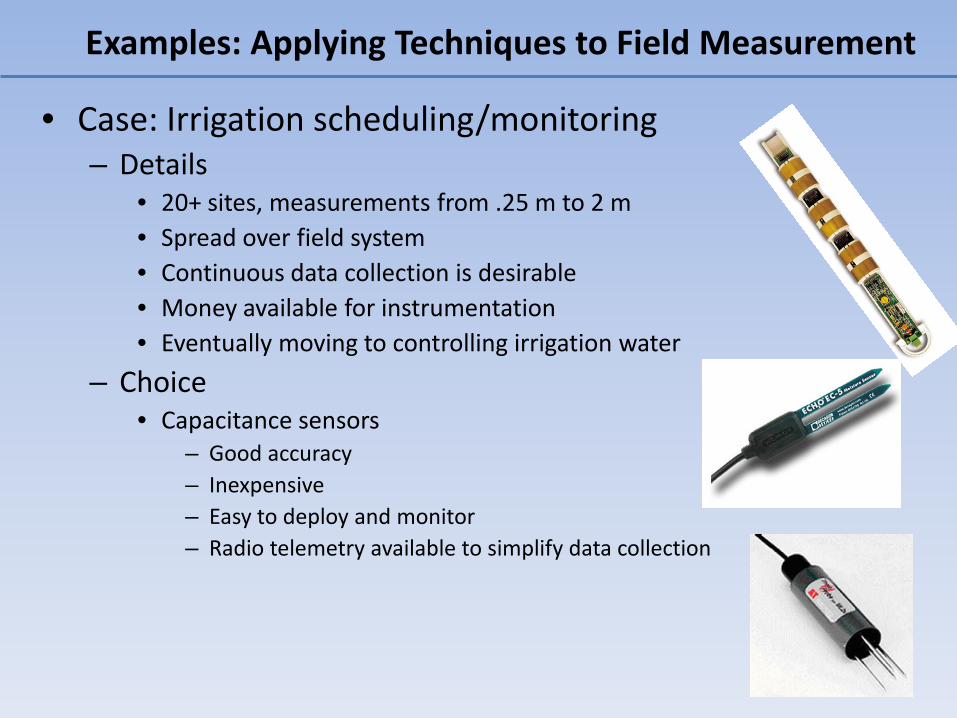
• Case: Irrigation scheduling/monitoring– Details
• 20+ sites, measurements from .25 m to 2 m• Spread over field system• Continuous data collection is desirable• Money available for instrumentation• Eventually moving to controlling irrigation water
– Choice• Capacitance sensors
– Good accuracy– Inexpensive– Easy to deploy and monitor– Radio telemetry available to simplify data collection
Examples: Applying Techniques to Field Measurement
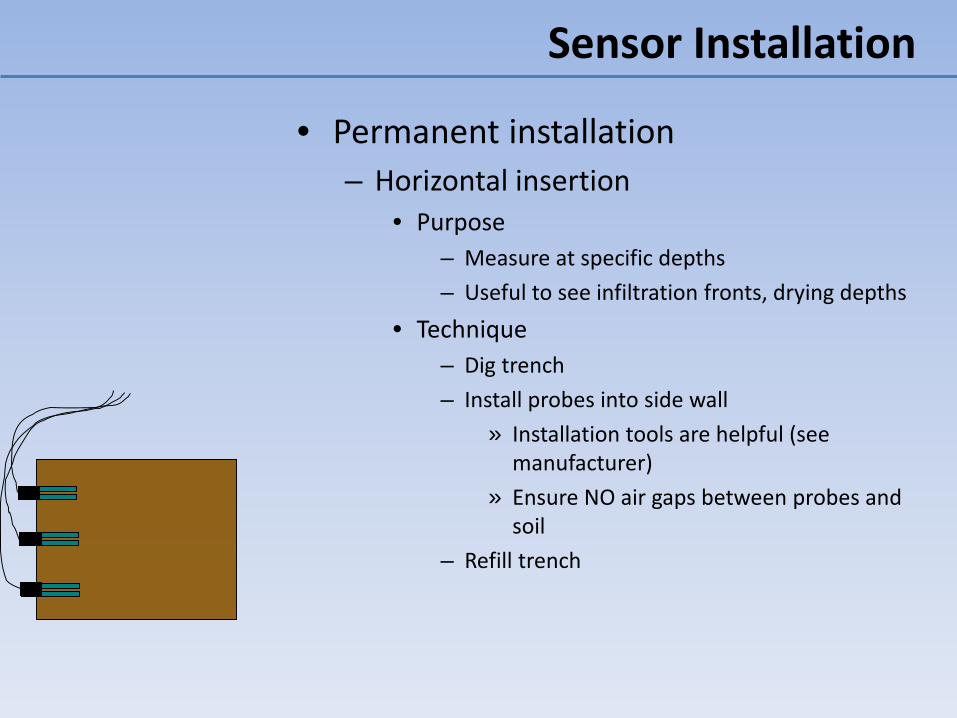
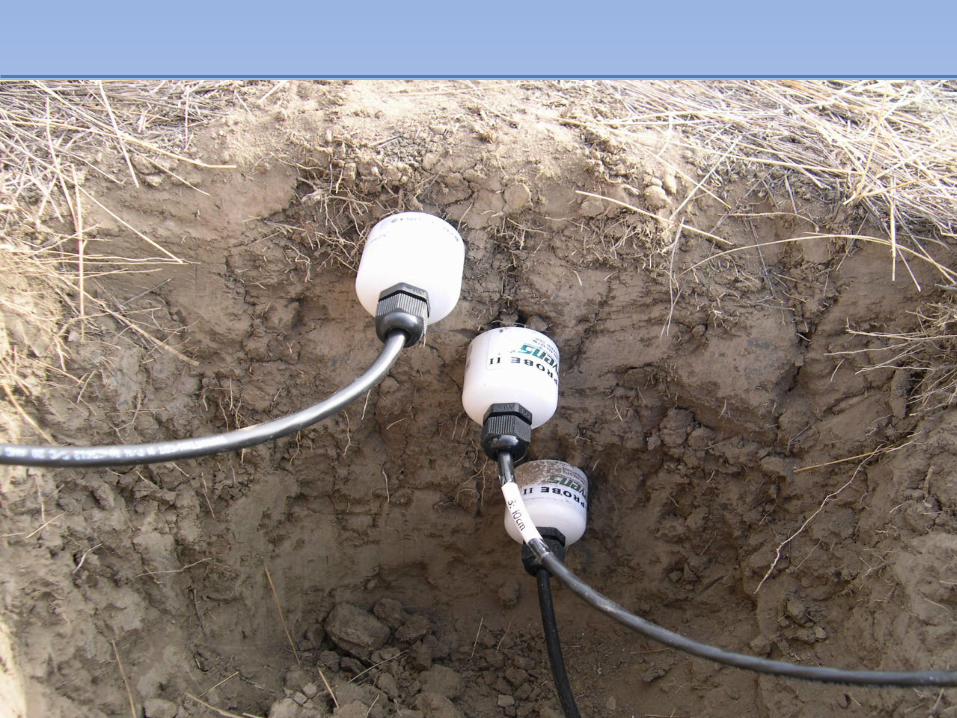
• Permanent installation– Horizontal insertion
• Purpose– Measure at specific depths– Useful to see infiltration fronts, drying depths
• Technique– Dig trench– Install probes into side wall
» Installation tools are helpful (see manufacturer)
» Ensure NO air gaps between probes and soil
– Refill trench
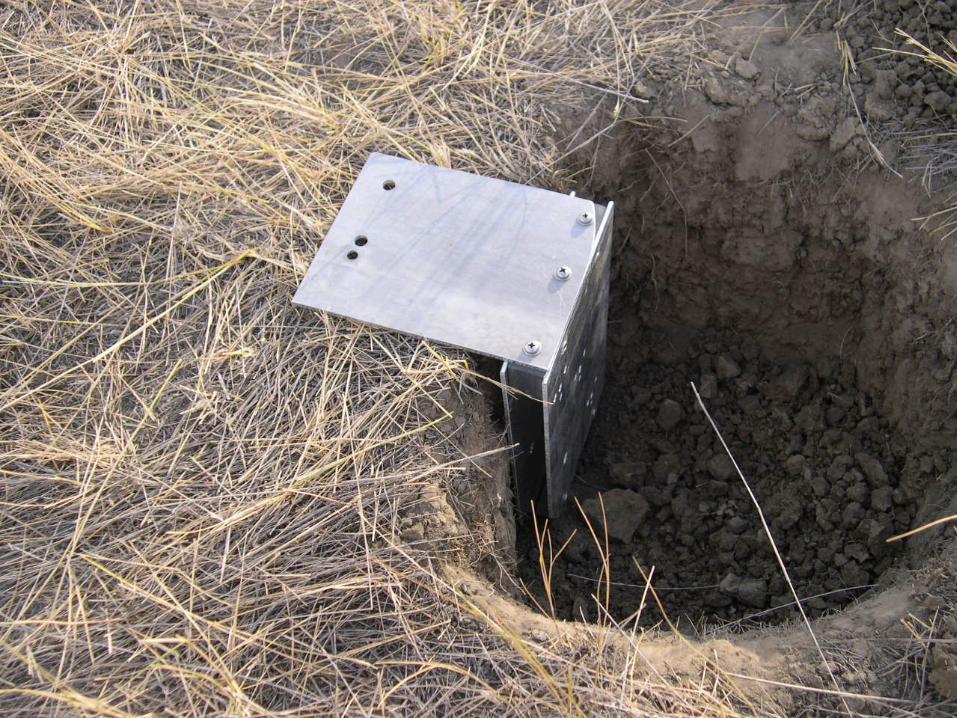
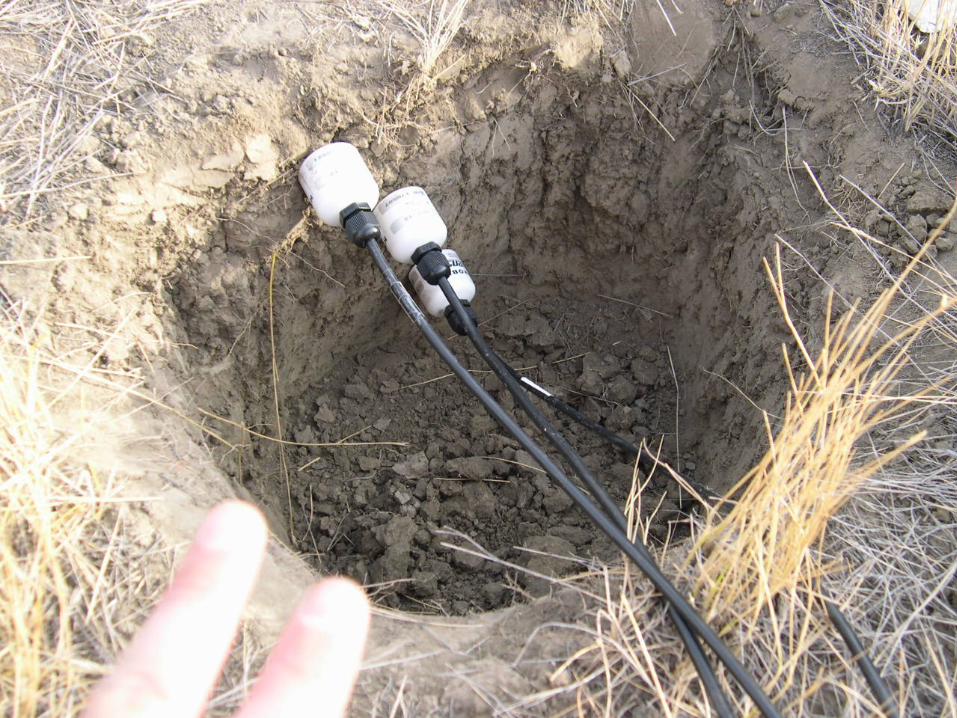
Sensor Installation
Sensor Installation
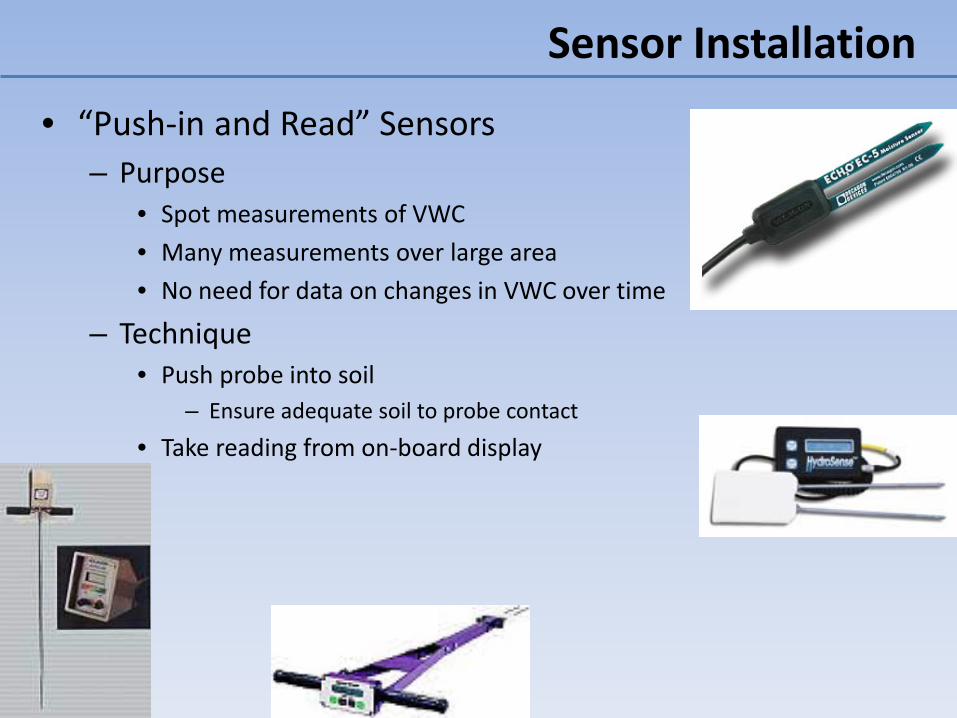
• “Push-in and Read” Sensors– Purpose
• Spot measurements of VWC• Many measurements over large area• No need for data on changes in VWC over time
– Technique• Push probe into soil
– Ensure adequate soil to probe contact• Take reading from on-board display
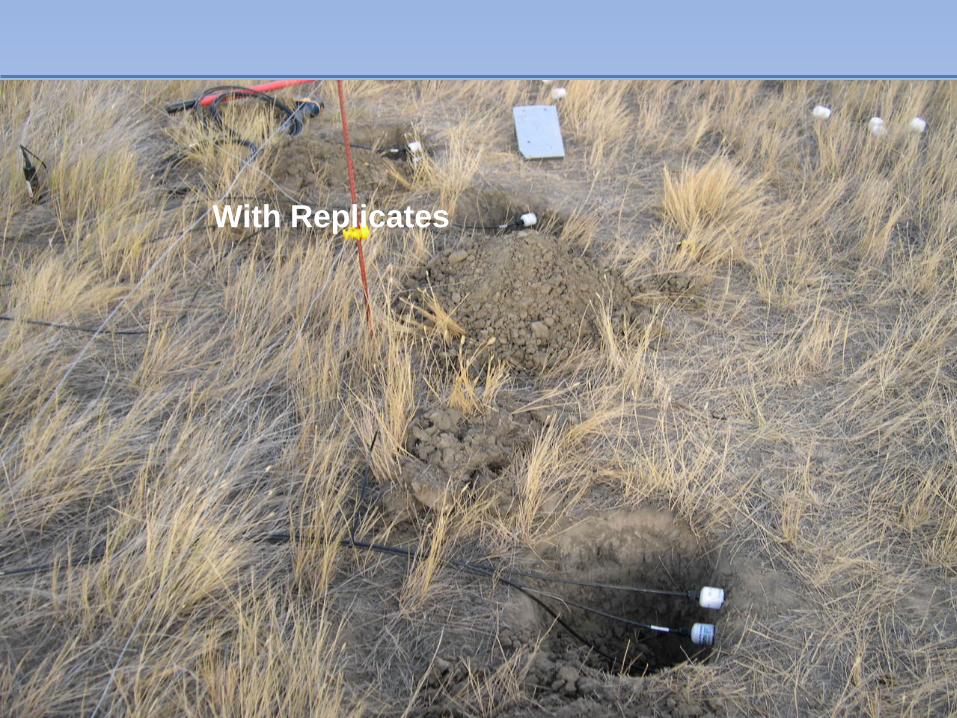
With Replicates
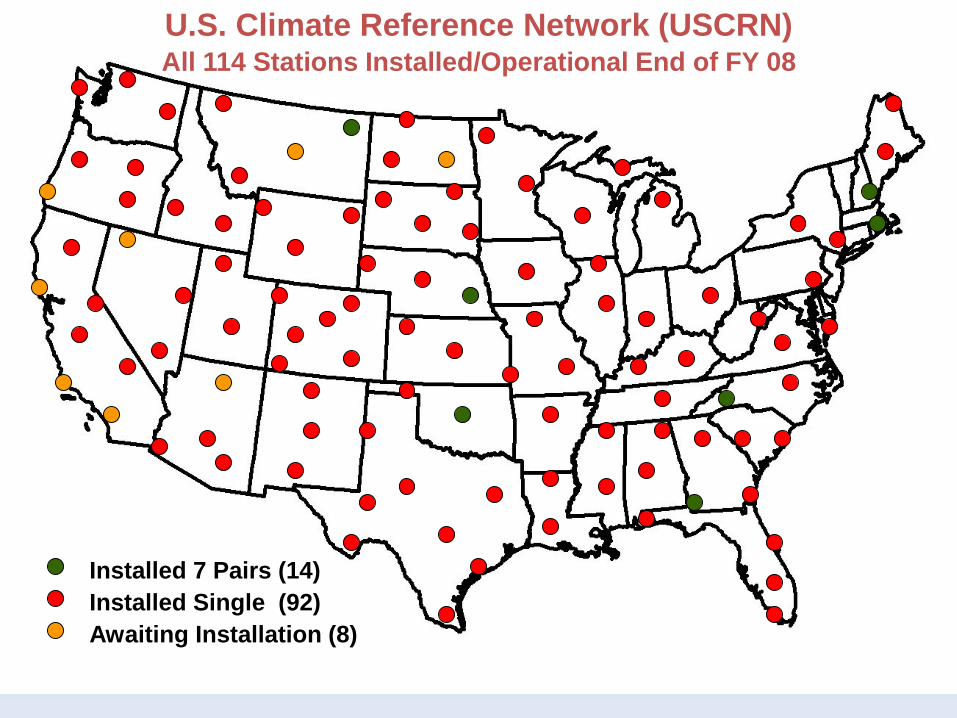
U.S. Climate Reference Network (USCRN)All 114 Stations Installed/Operational End of FY 08
Installed 7 Pairs (14)Installed Single (92)Awaiting Installation (8)
0
4
8
12
16
20
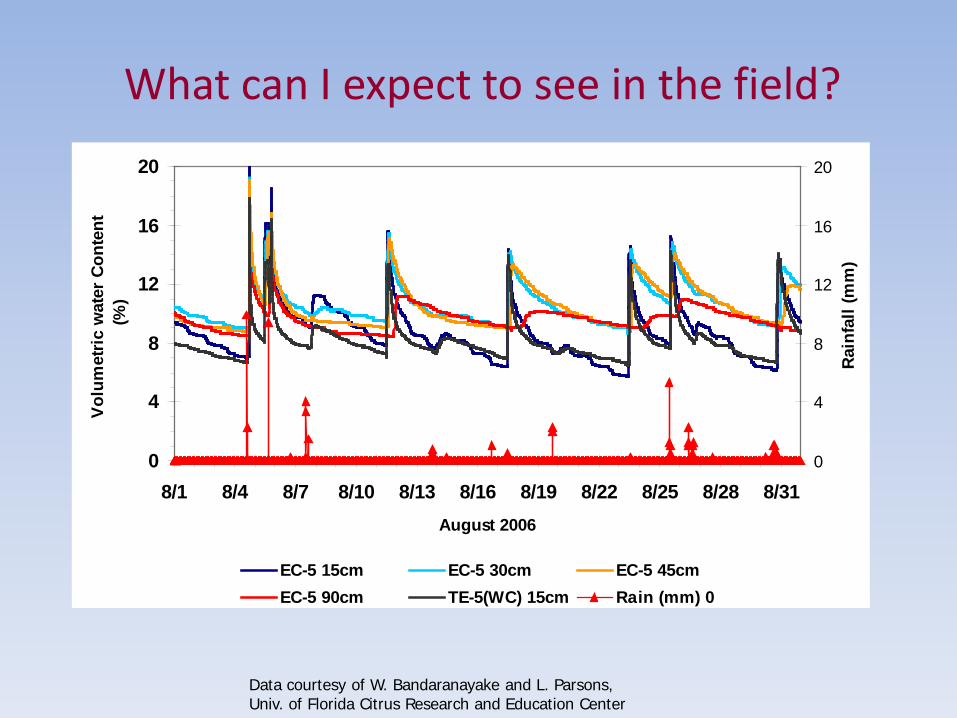
8/1 8/4 8/7 8/10 8/13 8/16 8/19 8/22 8/25 8/28 8/31August 2006
Volu
met
ric w
ater
Con
tent
(%
)
0
4
8
12
16
20
Rain
fall
(mm
)
EC-5 15cm EC-5 30cm EC-5 45cmEC-5 90cm TE-5(WC) 15cm Rain (mm) 0
Data courtesy of W. Bandaranayake and L. Parsons, Univ. of Florida Citrus Research and Education Center
What can I expect to see in the field?
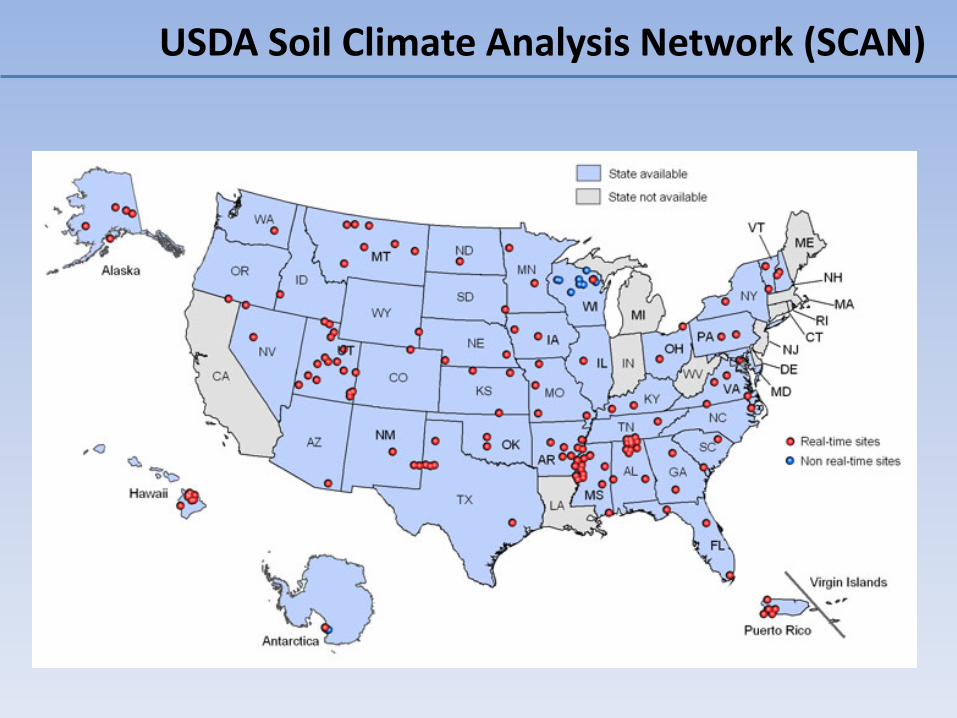
USDA Soil Climate Analysis Network (SCAN)
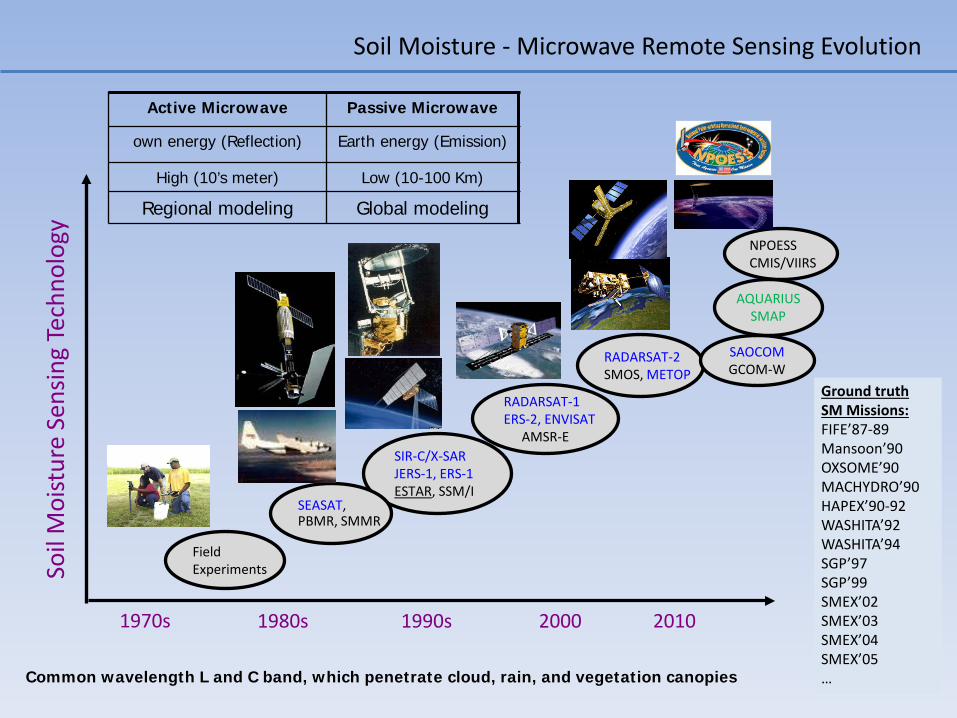
1970s 1980s 1990s 2000
FieldExperiments
RADARSAT-2SMOS, METOP
RADARSAT-1 ERS-2, ENVISAT
AMSR-ESIR-C/X-SAR JERS-1, ERS-1ESTAR, SSM/I
SEASAT, PBMR, SMMR
Soil
Moi
stur
e Se
nsin
g Te
chno
logy NPOESS
CMIS/VIIRS
2010
Soil Moisture - Microwave Remote Sensing Evolution
AQUARIUSSMAP
Ground truthSM Missions:FIFE’87-89Mansoon’90 OXSOME’90MACHYDRO’90HAPEX’90-92WASHITA’92 WASHITA’94 SGP’97SGP’99 SMEX’02SMEX’03 SMEX’04SMEX’05…Common wavelength L and C band, which penetrate cloud, rain, and vegetation canopies
Active Microwave Passive Microwave
own energy (Reflection) Earth energy (Emission)
High (10’s meter) Low (10-100 Km)
Regional modeling Global modeling
SAOCOMGCOM-W
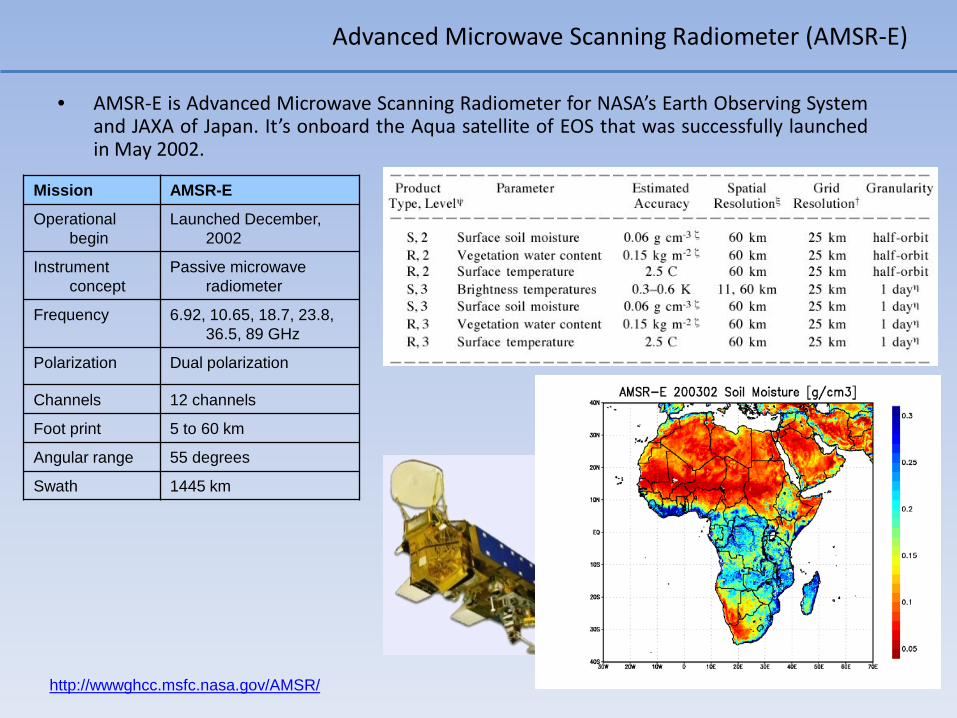
Advanced Microwave Scanning Radiometer (AMSR-E)
• AMSR-E is Advanced Microwave Scanning Radiometer for NASA’s Earth Observing Systemand JAXA of Japan. It’s onboard the Aqua satellite of EOS that was successfully launchedin May 2002.
Mission AMSR-E
Operational begin
Launched December, 2002
Instrument concept
Passive microwave radiometer
Frequency 6.92, 10.65, 18.7, 23.8, 36.5, 89 GHz
Polarization Dual polarization
Channels 12 channels
Foot print 5 to 60 km
Angular range 55 degrees
Swath 1445 km
http://wwwghcc.msfc.nasa.gov/AMSR/
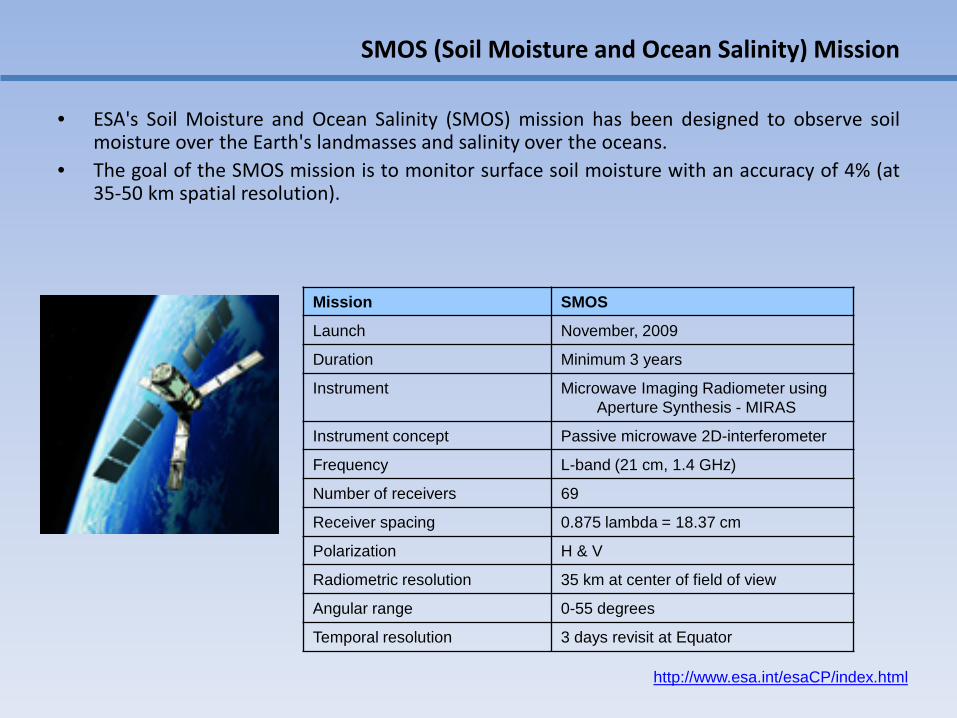
SMOS (Soil Moisture and Ocean Salinity) Mission
• ESA's Soil Moisture and Ocean Salinity (SMOS) mission has been designed to observe soilmoisture over the Earth's landmasses and salinity over the oceans.
• The goal of the SMOS mission is to monitor surface soil moisture with an accuracy of 4% (at35-50 km spatial resolution).
Mission SMOS
Launch November, 2009
Duration Minimum 3 years
Instrument Microwave Imaging Radiometer using Aperture Synthesis - MIRAS
Instrument concept Passive microwave 2D-interferometer
Frequency L-band (21 cm, 1.4 GHz)
Number of receivers 69
Receiver spacing 0.875 lambda = 18.37 cm
Polarization H & V
Radiometric resolution 35 km at center of field of view
Angular range 0-55 degrees
Temporal resolution 3 days revisit at Equator
http://www.esa.int/esaCP/index.html
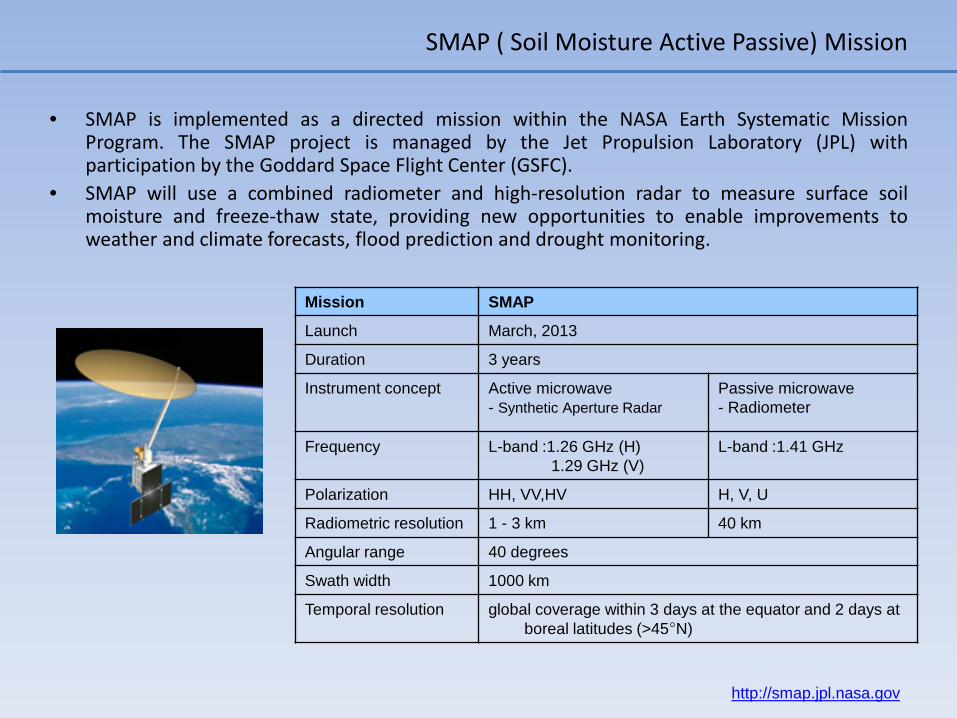
SMAP ( Soil Moisture Active Passive) Mission
• SMAP is implemented as a directed mission within the NASA Earth Systematic MissionProgram. The SMAP project is managed by the Jet Propulsion Laboratory (JPL) withparticipation by the Goddard Space Flight Center (GSFC).
• SMAP will use a combined radiometer and high-resolution radar to measure surface soilmoisture and freeze-thaw state, providing new opportunities to enable improvements toweather and climate forecasts, flood prediction and drought monitoring.
Mission SMAP
Launch March, 2013
Duration 3 years
Instrument concept Active microwave - Synthetic Aperture Radar
Passive microwave- Radiometer
Frequency L-band :1.26 GHz (H)1.29 GHz (V)
L-band :1.41 GHz
Polarization HH, VV,HV H, V, U
Radiometric resolution 1 - 3 km 40 km
Angular range 40 degrees
Swath width 1000 km
Temporal resolution global coverage within 3 days at the equator and 2 days at boreal latitudes (>45°N)
http://smap.jpl.nasa.gov
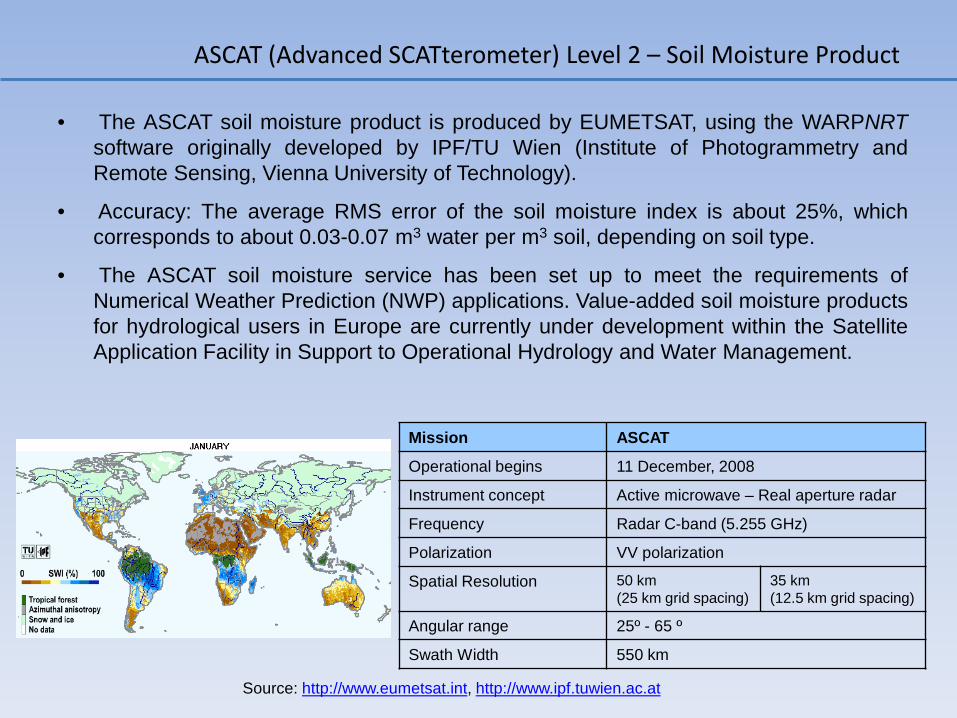
ASCAT (Advanced SCATterometer) Level 2 – Soil Moisture Product
• The ASCAT soil moisture product is produced by EUMETSAT, using the WARPNRTsoftware originally developed by IPF/TU Wien (Institute of Photogrammetry andRemote Sensing, Vienna University of Technology).
• Accuracy: The average RMS error of the soil moisture index is about 25%, whichcorresponds to about 0.03-0.07 m3 water per m3 soil, depending on soil type.
• The ASCAT soil moisture service has been set up to meet the requirements ofNumerical Weather Prediction (NWP) applications. Value-added soil moisture productsfor hydrological users in Europe are currently under development within the SatelliteApplication Facility in Support to Operational Hydrology and Water Management.
Mission ASCAT
Operational begins 11 December, 2008
Instrument concept Active microwave – Real aperture radar
Frequency Radar C-band (5.255 GHz)
Polarization VV polarization
Spatial Resolution 50 km (25 km grid spacing)
35 km(12.5 km grid spacing)
Angular range 25º - 65 º
Swath Width 550 km
Source: http://www.eumetsat.int, http://www.ipf.tuwien.ac.at
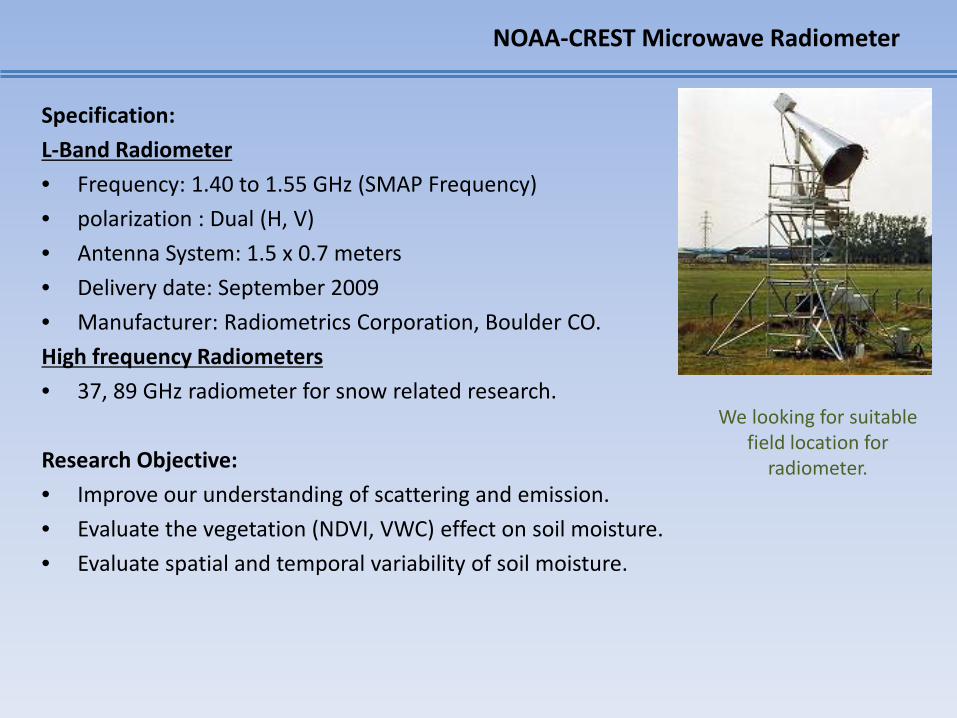
NOAA-CREST Microwave Radiometer
Specification:L-Band Radiometer• Frequency: 1.40 to 1.55 GHz (SMAP Frequency)• polarization : Dual (H, V)• Antenna System: 1.5 x 0.7 meters• Delivery date: September 2009• Manufacturer: Radiometrics Corporation, Boulder CO.High frequency Radiometers• 37, 89 GHz radiometer for snow related research.
Research Objective: • Improve our understanding of scattering and emission.• Evaluate the vegetation (NDVI, VWC) effect on soil moisture.• Evaluate spatial and temporal variability of soil moisture.
We looking for suitable field location for
radiometer.
Evaporation
• Process by which the phase of water is changed from liquid to a vapor.
• It occurs at the evaporating surface, the contact between water body and overlaying air.
Evaporation
• Evaporation rate is a function of several meteorological and environmental factorsThe two main factors from an engineering standpoint are:
– Solar energy: it provides latent heat of vapor
– Advective energy: it is the ability to transport
Evaporation
• Pan evaporation• Water budget• Correlations to climate data (empirical)
Evaporation Measures
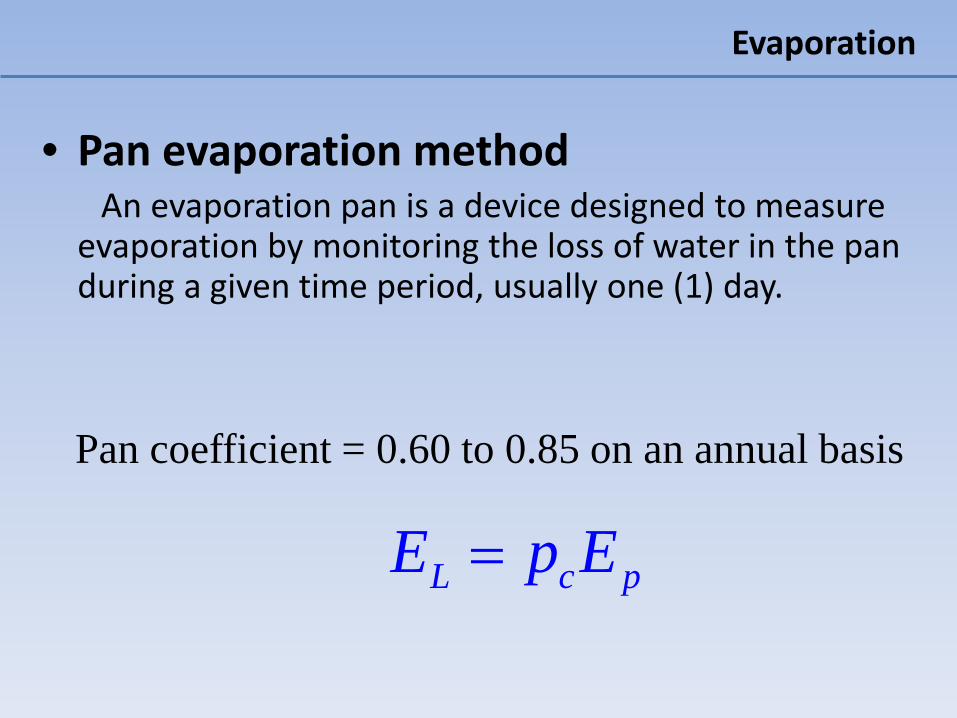
• Pan evaporation methodAn evaporation pan is a device designed to measure
evaporation by monitoring the loss of water in the pan during a given time period, usually one (1) day.
Evaporation
Pan coefficient = 0.60 to 0.85 on an annual basis
L c pE p E=
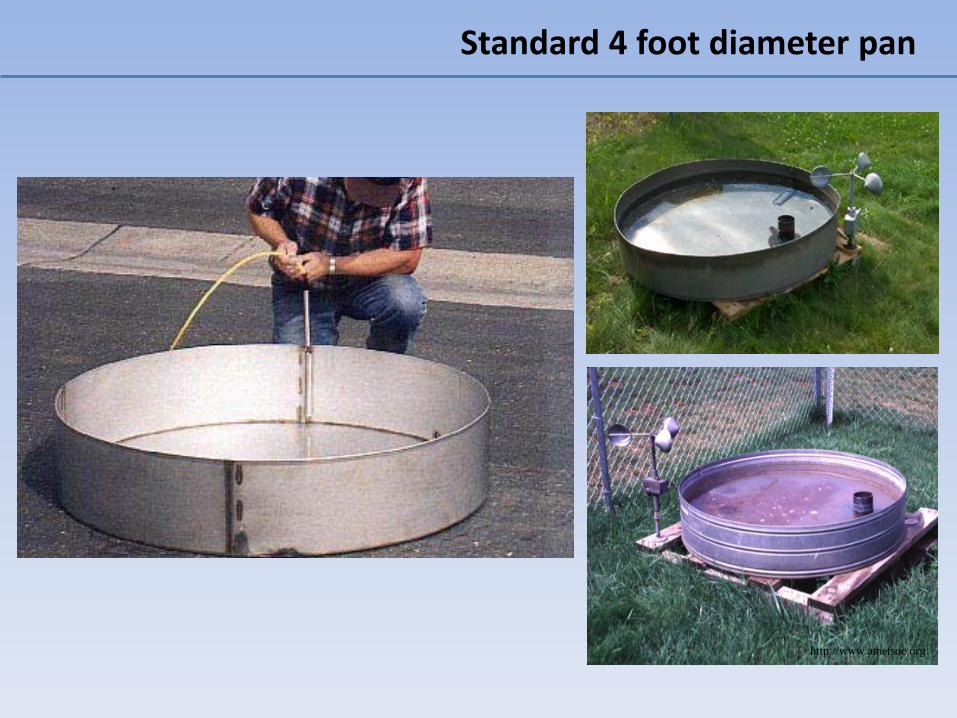
Standard 4 foot diameter pan
http://www.ametsoc.org
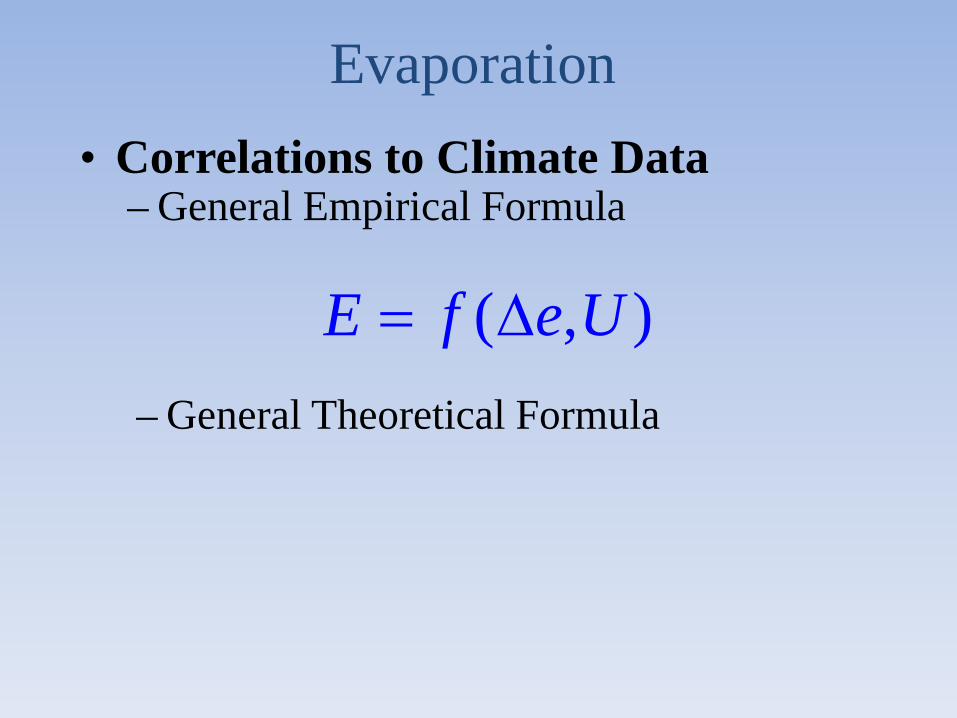
• Correlations to Climate Data– General Empirical Formula
( , )E f e U= ∆
Evaporation
– General Theoretical Formula
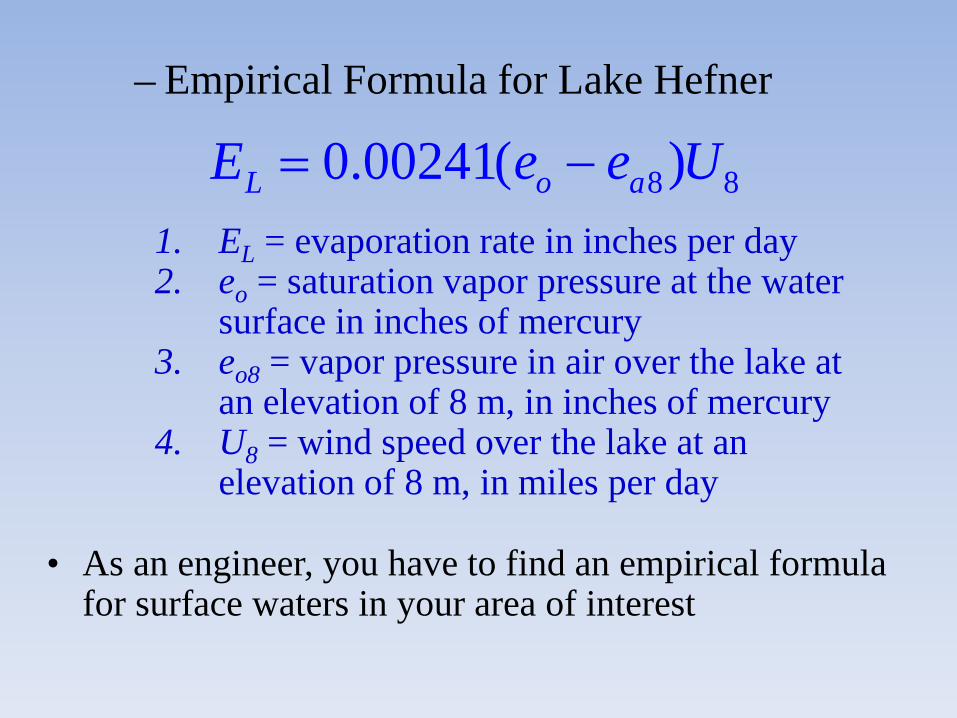
– Empirical Formula for Lake Hefner
8 80.00241( )L o aE e e U= −1. EL = evaporation rate in inches per day2. eo = saturation vapor pressure at the water
surface in inches of mercury3. eo8 = vapor pressure in air over the lake at
an elevation of 8 m, in inches of mercury4. U8 = wind speed over the lake at an
elevation of 8 m, in miles per day
• As an engineer, you have to find an empirical formula for surface waters in your area of interest
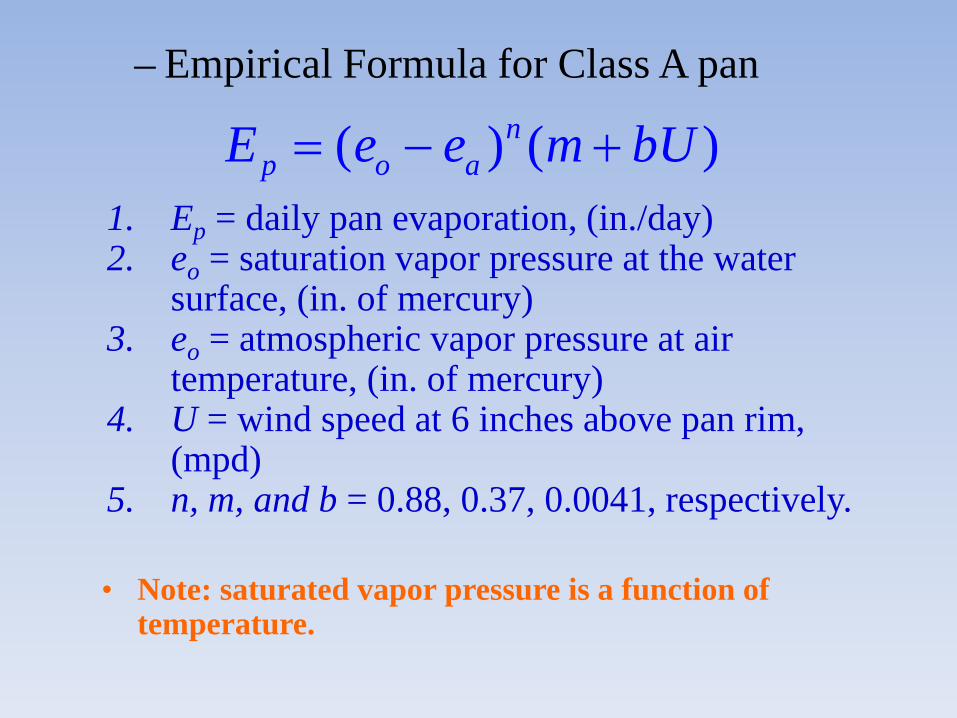
– Empirical Formula for Class A pan
( ) ( )np o aE e e m bU= − +
1. Ep = daily pan evaporation, (in./day)2. eo = saturation vapor pressure at the water
surface, (in. of mercury)3. eo = atmospheric vapor pressure at air
temperature, (in. of mercury)4. U = wind speed at 6 inches above pan rim,
(mpd)5. n, m, and b = 0.88, 0.37, 0.0041, respectively.
• Note: saturated vapor pressure is a function of temperature.
• Transpiration is the process by which plants transfer water from the root zone to the leaf surface, where it eventually evaporates into atmosphere.
• The process by which transpiration takes place can be described as follows:
– Water is extracted by a plants roots, transported upward through its stem and diffused into the atmosphere through stoma.
Transpiration
• Contributing factors:a. Moisture availableb. Vegetation typec. Vegetation densityd. Vegetation health
Transpiration
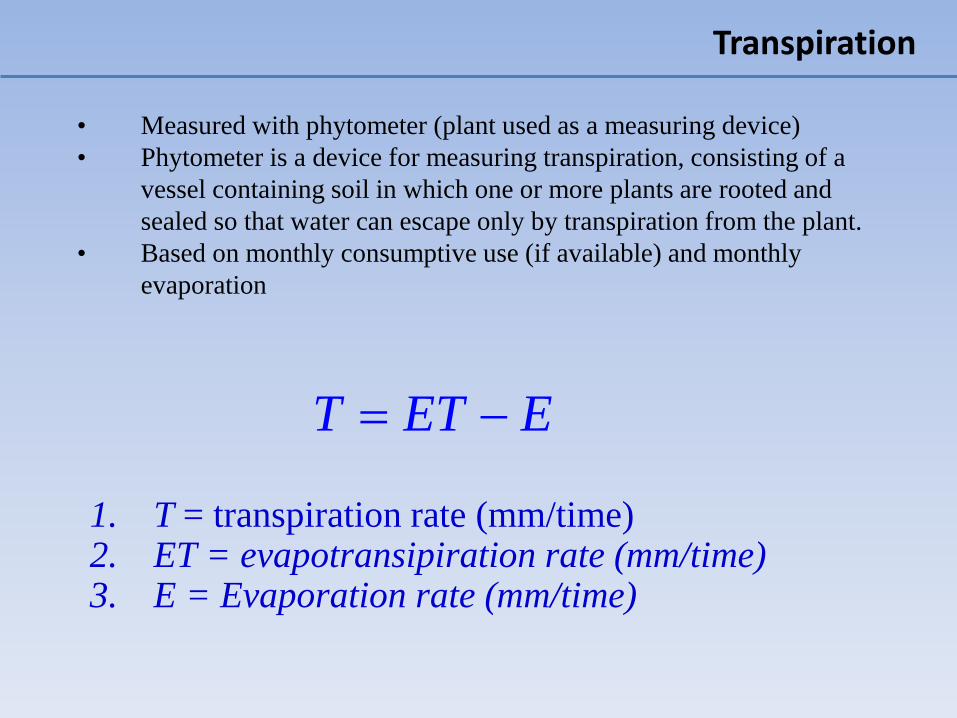
• Measured with phytometer (plant used as a measuring device)• Phytometer is a device for measuring transpiration, consisting of a
vessel containing soil in which one or more plants are rooted and sealed so that water can escape only by transpiration from the plant.
• Based on monthly consumptive use (if available) and monthly evaporation
1. T = transpiration rate (mm/time)2. ET = evapotransipiration rate (mm/time)3. E = Evaporation rate (mm/time)
T ET E= −
Transpiration
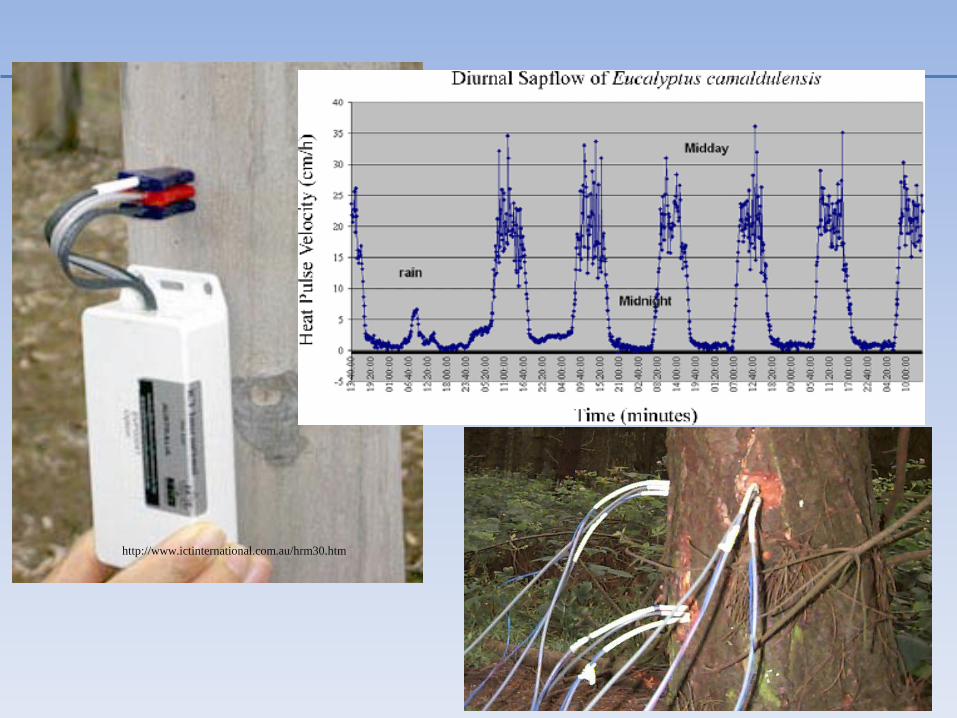
http://www.ictinternational.com.au/hrm30.htm
Evapotranspiration
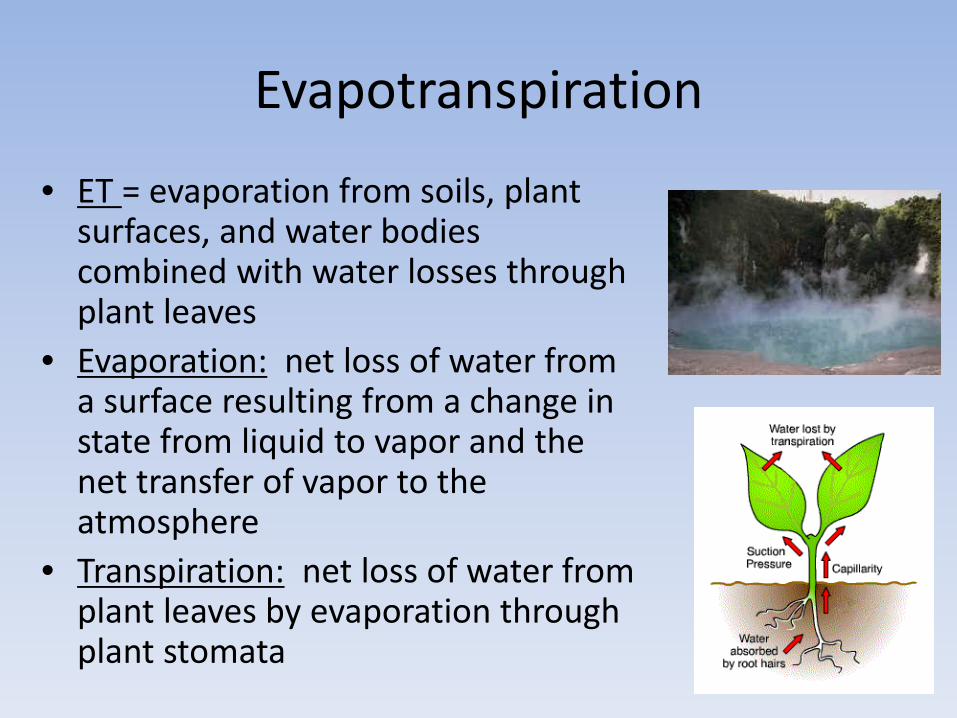
• ET = evaporation from soils, plant surfaces, and water bodies combined with water losses through plant leaves
• Evaporation: net loss of water from a surface resulting from a change in state from liquid to vapor and the net transfer of vapor to the atmosphere
• Transpiration: net loss of water from plant leaves by evaporation through plant stomata
Impacts on Hydrology
• > 70% of annual PPT in US• > 95% in semi-arid and arid regions • For dry areas, ET/P ~ 1
– Q/P is very small– ET is limited by plant water availability
• For humid areas, ET/P is smaller– Q/P is higher– ET is limited by energy
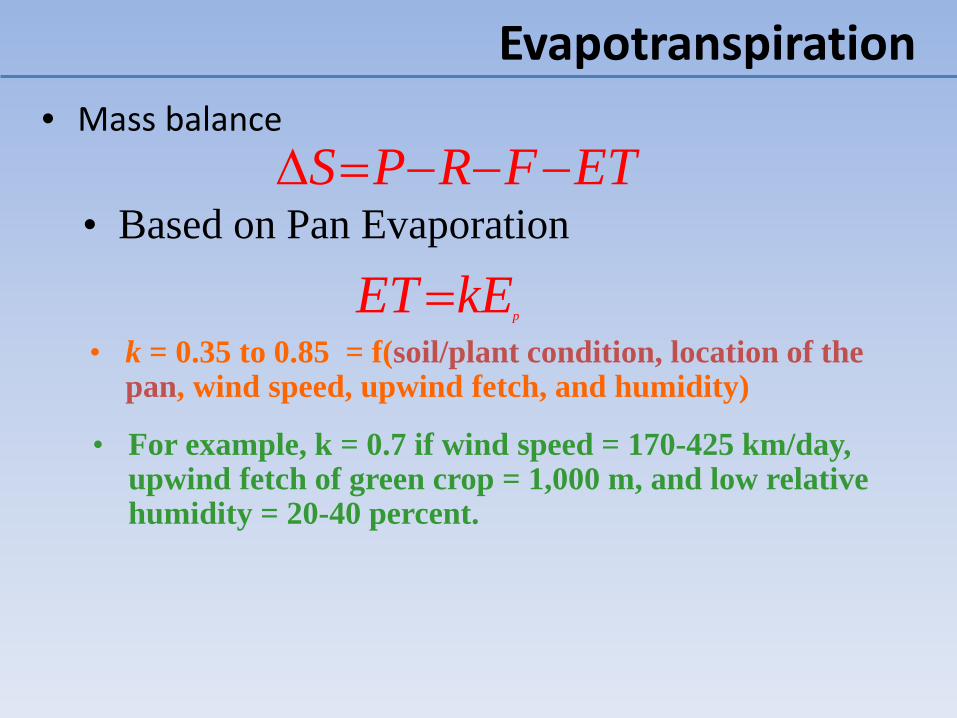
• Mass balance
Evapotranspiration
S P R F ET∆ = − − −
pET kE=• k = 0.35 to 0.85 = f(soil/plant condition, location of the
pan, wind speed, upwind fetch, and humidity)
• Based on Pan Evaporation
• For example, k = 0.7 if wind speed = 170-425 km/day, upwind fetch of green crop = 1,000 m, and low relative humidity = 20-40 percent.
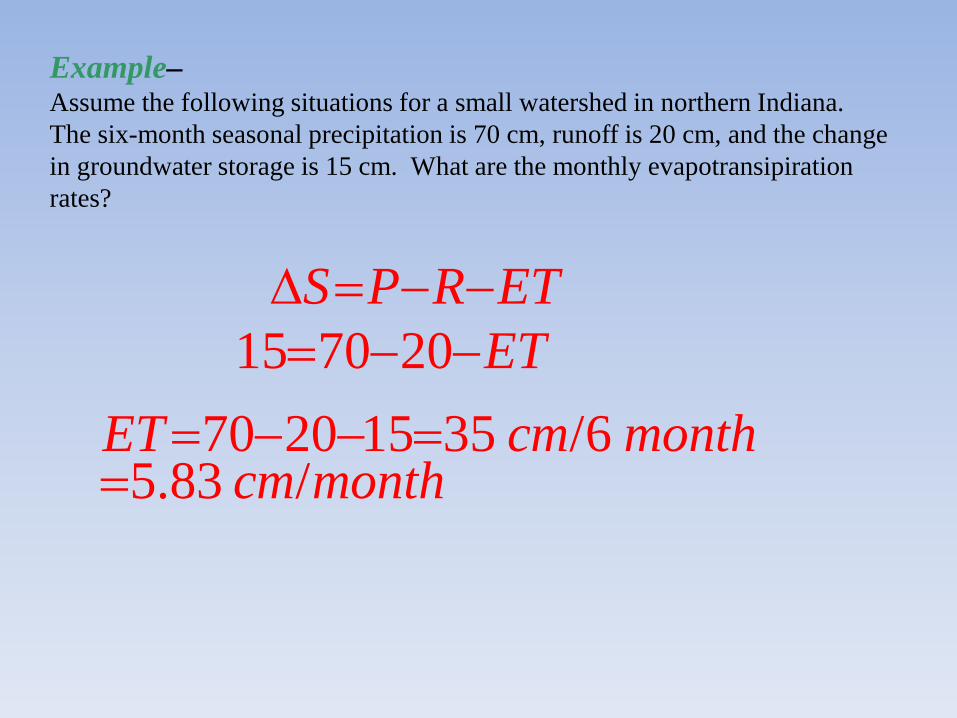
Example–Assume the following situations for a small watershed in northern Indiana. The six-month seasonal precipitation is 70 cm, runoff is 20 cm, and the change in groundwater storage is 15 cm. What are the monthly evapotransipiration rates?
S P R ET∆ = − −15 70 20 ET= − −
70 20 15 35 /6 5.83 /
ET cm monthcm month
= − − ==
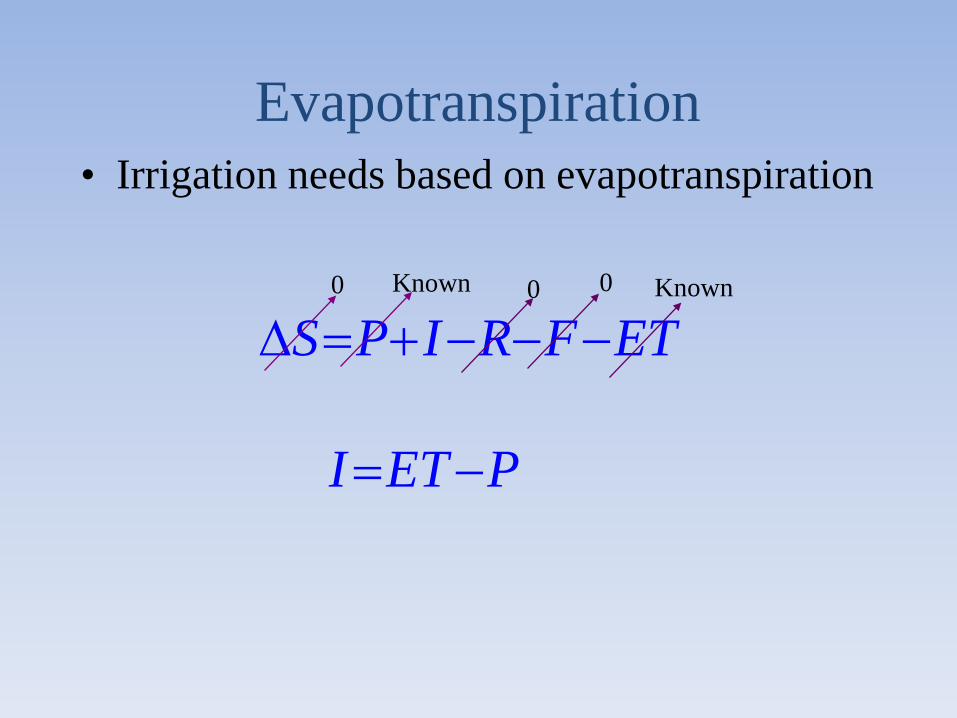
Evapotranspiration• Irrigation needs based on evapotranspiration
S P I R F ET∆ = + − − −
I ET P= −
Known Known000
Evapotranspiration
• Potential Evapotranspiration (PET) is the amount of evapotranspiration that would take place under the assumption of an ample supply of moisture at all times.
• PET is an indication of optimum crop water requirements.
Can be measured using - evaporation pan
- weighing lysimeter
Allows for estimation of E from measurements of - Global radiation- Wind speed- Air temperature- Relative humidity
Combination Approach
Evaporation and Evapotranspiration
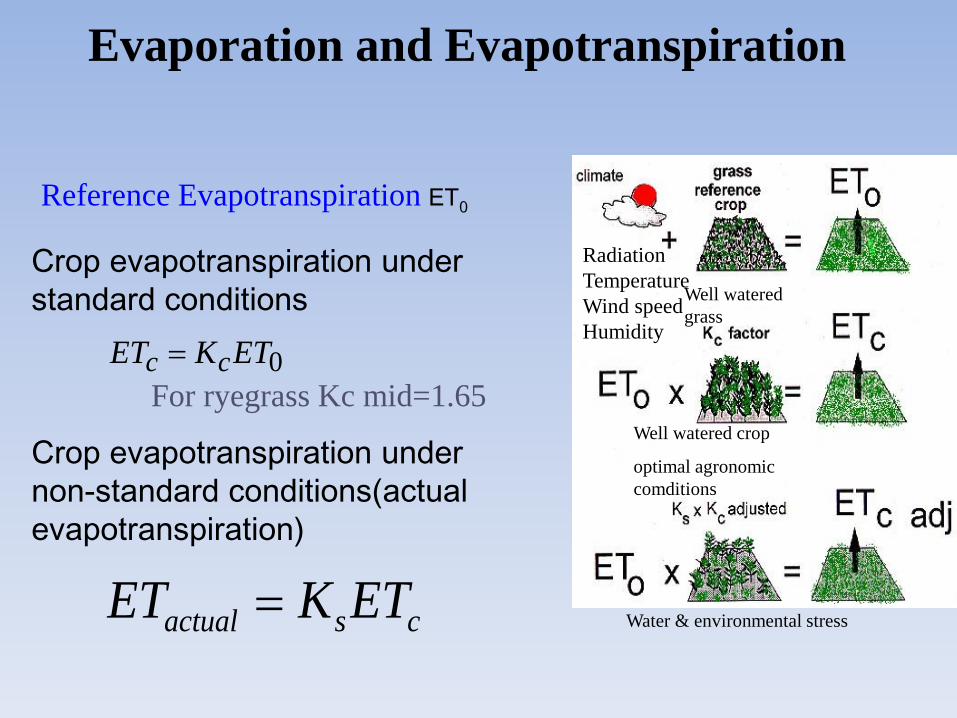
Well watered grass
Radiation TemperatureWind speed Humidity
Crop evapotranspiration under standard conditions
For ryegrass Kc mid=1.65
Crop evapotranspiration under non-standard conditions(actual evapotranspiration)
Water & environmental stress
Well watered crop
optimal agronomic comditions
Reference Evapotranspiration ET0
Evaporation and Evapotranspiration
0ETKET cc =
csactual ETKET =
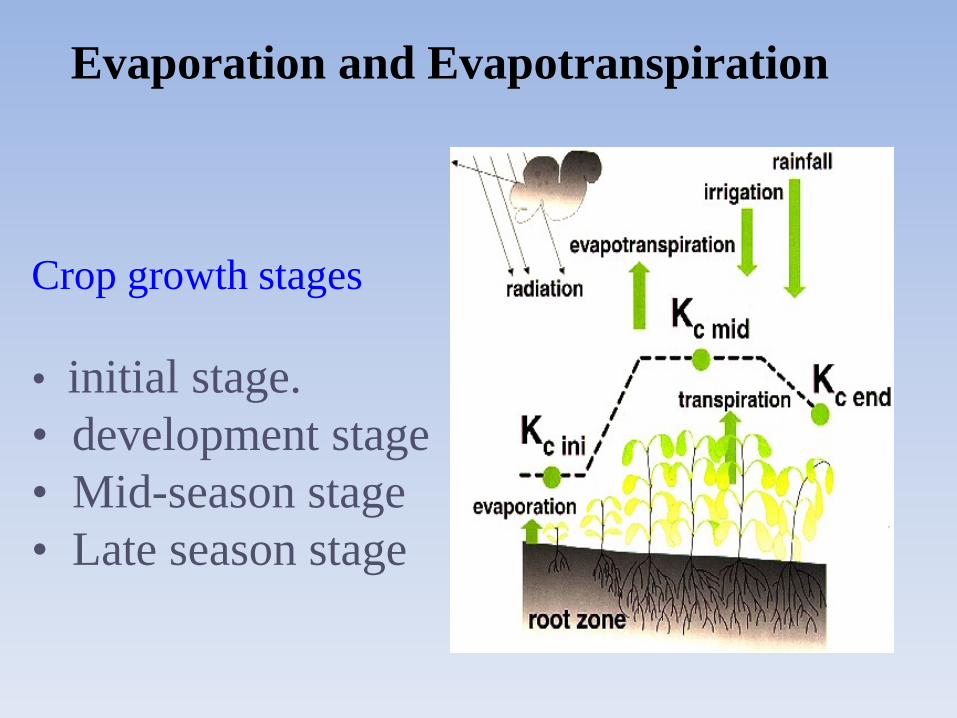
• initial stage.• development stage• Mid-season stage• Late season stage
Crop growth stages
Evaporation and Evapotranspiration
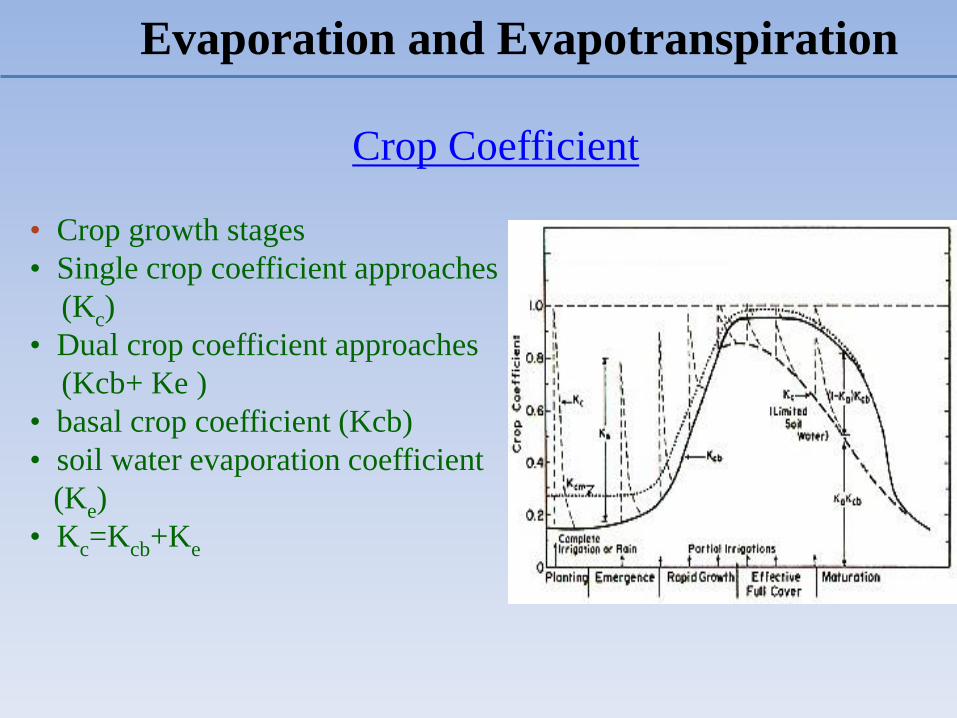
Crop Coefficient
• Crop growth stages• Single crop coefficient approaches
(Kc)• Dual crop coefficient approaches
(Kcb+ Ke )• basal crop coefficient (Kcb) • soil water evaporation coefficient
(Ke) • Kc=Kcb+Ke
Evaporation and Evapotranspiration

Drought Videos
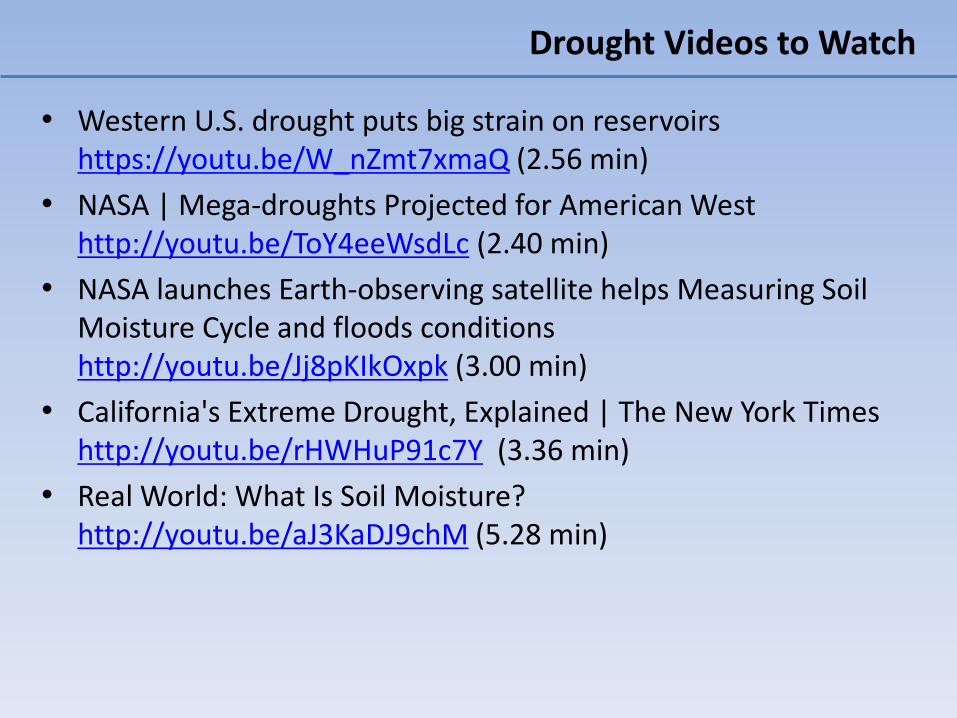
• Western U.S. drought puts big strain on reservoirshttps://youtu.be/W_nZmt7xmaQ (2.56 min)
• NASA | Mega-droughts Projected for American Westhttp://youtu.be/ToY4eeWsdLc (2.40 min)
• NASA launches Earth-observing satellite helps Measuring Soil Moisture Cycle and floods conditionshttp://youtu.be/Jj8pKIkOxpk (3.00 min)
• California's Extreme Drought, Explained | The New York Timeshttp://youtu.be/rHWHuP91c7Y (3.36 min)
• Real World: What Is Soil Moisture? http://youtu.be/aJ3KaDJ9chM (5.28 min)
Drought Videos to Watch
Experiment
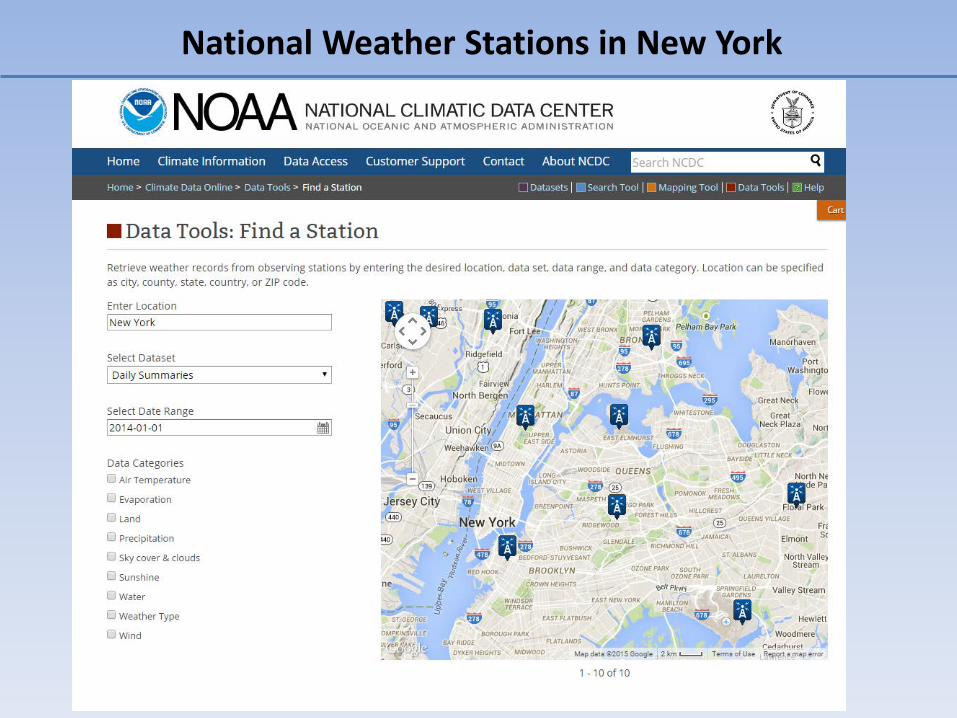
National Weather Stations in New York
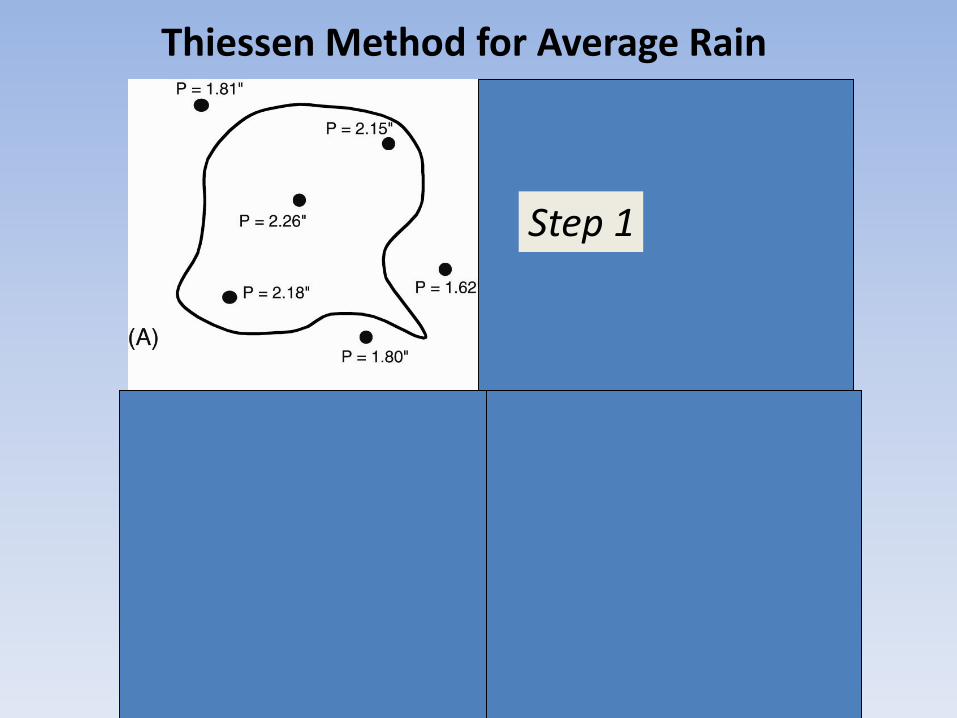
Thiessen Method for Average Rain
Step 1
Thiessen Method for Average Rain
Step 2
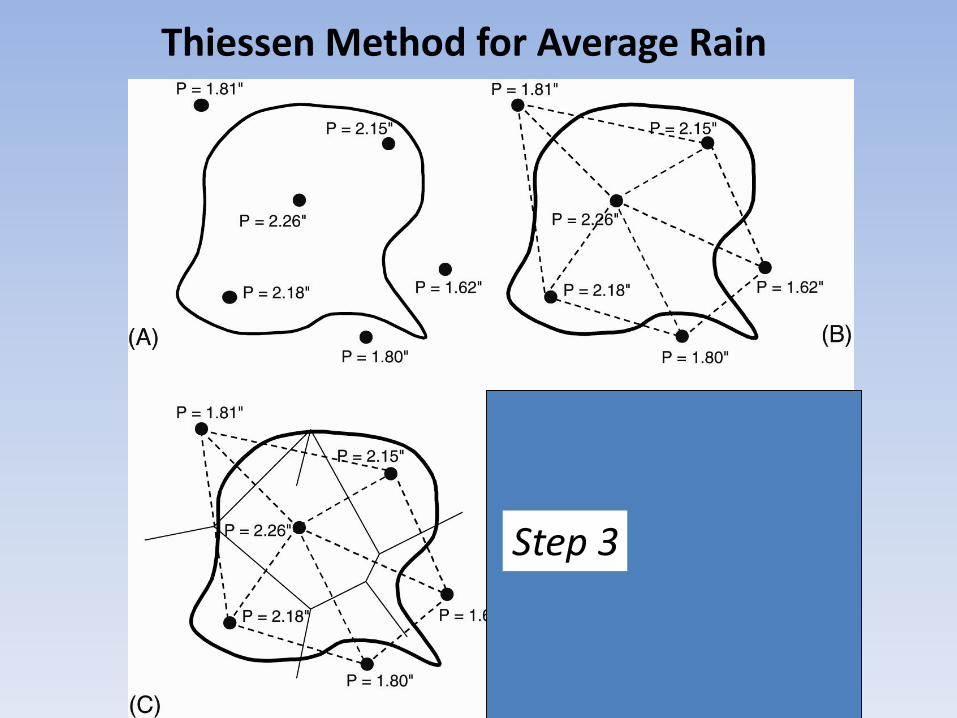
Thiessen Method for Average Rain
Step 3
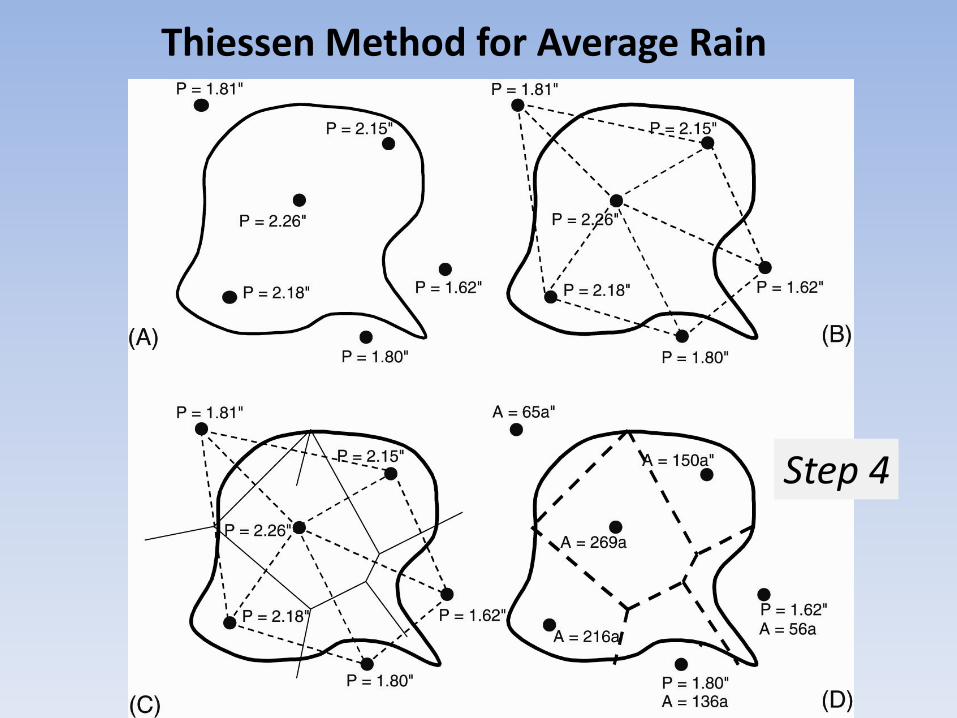
Thiessen Method for Average Rain
Step 4
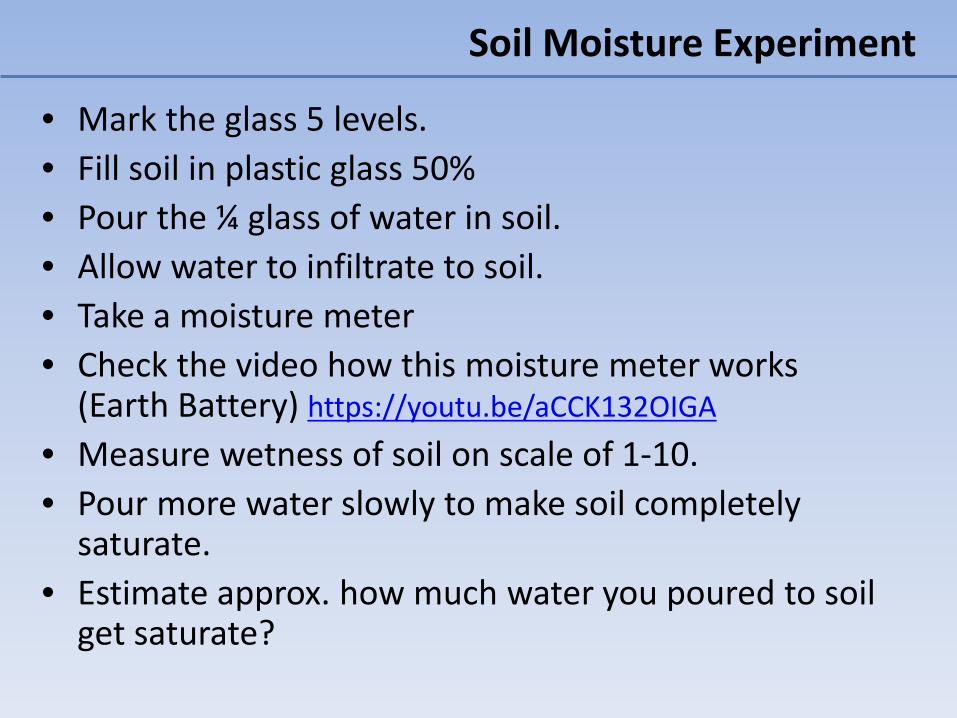
Soil Moisture Experiment
• Mark the glass 5 levels.• Fill soil in plastic glass 50%• Pour the ¼ glass of water in soil.• Allow water to infiltrate to soil.• Take a moisture meter • Check the video how this moisture meter works
(Earth Battery) https://youtu.be/aCCK132OIGA• Measure wetness of soil on scale of 1-10.• Pour more water slowly to make soil completely
saturate.• Estimate approx. how much water you poured to soil
get saturate?