Embed Size (px)
Citation preview

HYDROLOGY AND HYDRODYNAMIC MODELING OF THE
MISSISSIPPI RIVER IN SOUTHEAST LOUISIANA
– PART I
A report
Submitted to the Lake Pontchartrain Basin Foundation
by
Alex McCorquodale
Ioannis Georgiou
Mallory Davis
Joao Pereira
Pontchartrain Institute for Environmental Studies
University of New Orleans
New Orleans, LA 70148
May 2010 DRAFT
Revised September 9, 2010

ii
ACKNOWLEDGEMENTS
This study was funded by the Lake Pontchartrain Basin Foundation with support from the
McKnight Foundation. We are grateful for the assistance of Dr. John Lopez during this project.
iii
TABLE OF CONTENTS
Acknowledgements ............................................................................................................. ii
List of Figures ......................................................................................................................v
List of Tables ...................................................................................................................xxv
Abstract .......................................................................................................................... xxxi
Chapter 1: Introduction ........................................................................................................1
Objectives .......................................................................................................................4
General Approach ...........................................................................................................5
Background and Literature Review ................................................................................6
Description of Numerical Models ..............................................................................7
Potential Numerical Models ......................................................................................7
Numerical Modeling of the Lower Mississippi River .............................................10
Chapter 2: Features of the Lower Mississippi River .........................................................11
The Modeled Reach ......................................................................................................13
Existing Diversions ..................................................................................................16
Future Diversions .....................................................................................................17
Miscellaneous ..........................................................................................................18
Barataria Basin ..............................................................................................................19
Chapter 3: HEC-RAS Model .............................................................................................23
Overview .......................................................................................................................23
Chapter 4: Model Development .........................................................................................24
Geometry Data ..............................................................................................................24
Geometry Issues in HEC-RAS.................................................................................25
Geometry Issues with Available Data......................................................................33
Hydraulic Structures ................................................................................................41
Channel Roughness ..................................................................................................50
Unsteady Flow Data ......................................................................................................51
Initial Conditions .....................................................................................................51
Boundary Conditions ...............................................................................................53
Specific Model Limitations...........................................................................................55
Chapter 5: Hydrodynamic Simulations ..............................................................................56
Calibration.....................................................................................................................56
Validation ......................................................................................................................65
Model Limitations .........................................................................................................68
Chapter 6: Applications .....................................................................................................71
Modeling Schemes ........................................................................................................71

iv
Results ...........................................................................................................................73
Relative Sea Level Rise Study .................................................................................73
West Bay Closure Study ..........................................................................................84
Changes to the Delta Distributaries Study ...............................................................92
Gulf of Mexico „oil spill‟ Study...............................................................................98
Proposed Barataria Basin Diversions Study ..........................................................118
Proposed Pontchartrain Basin Diversions Study ...................................................139
Proposed Diversions Combined with Changes to the Delta Distributaries Study .164
Chapter 7: Discussion ......................................................................................................277
Relative Sea Level Rise Study ....................................................................................277
West Bay Closure Study .............................................................................................278
Changes to the Delta Distributaries Study ..................................................................278
Gulf of Mexico „oil spill‟ Study..................................................................................278
Proposed Barataria Basin Diversions Study ...............................................................278
Proposed Pontchartrain Basin Diversions Study ........................................................279
Proposed Diversions Combined with Changes to the Delta Distributaries Study ......279
Sources of Error ..........................................................................................................281
Chapter 8: Conclusions and Recommendations for Future Research ..............................283
References ........................................................................................................................287
Appendix A: Junction Data ..............................................................................................291
Appendix B: 2003 Barataria Basin LIDAR/bathymetry Image .......................................309
Appendix C: Description of HEC-RAS Model ...............................................................311
Appendix D: Initial Conditions ........................................................................................330
Appendix E: Acoustic Doppler Current Profiler Charts (Pratt, 2009) .............................345
Appendix F: Boundary Conditions ..................................................................................348
Appendix G: Manning‟s n Values ...................................................................................365
Appendix H: Passes Discharge Records ..........................................................................430
Appendix I: Flow Roughness Factors ..............................................................................445

v
LIST OF FIGURES
Figure 1-1: MODIS Satellite Image of Mississippi River Sediment Plume (Visible Earth, 2010)
..............................................................................................................................................1
Figure 1-2: Planning Units for the Multiple Lines of Defense Strategy (LPBF, 2008).......3
Figure 1-3: Proposed MR Diversions and Channel Modifications for Planning Unit 1 from the
Multiple Lines of Defense Strategy (LPBF, 2008) ..............................................................3
Figure 1-4: Proposed MR Diversions for Planning Unit 2 from the Multiple Lines of Defense
Strategy (LPBF, 2008) .........................................................................................................4
Figure 1-5: HEC-RAS Model Schematic Overlaying Satellite Imagery (Pereira et al. 2010)
..............................................................................................................................................6
Figure 2-1: Google Earth Image of Old River Control structures (2010) ..........................12
Figure 2-2: Google Earth Image of Pass a Loutré and North Pass from 2004 (2010) .......14
Figure 2-3: Google Earth Image of Pass a Loutré and North Pass from 2007 (2010) .......15
Figure 2-4: HEC-RAS Image of Mississippi River Bird‟s Foot Delta ..............................16
Figure 2-5: Google Earth Image of Cuts at Fort St. Philip (2010) ....................................17
Figure 2-6: Google Earth Image of Raccourci Island, Small Bayous, and Overland Storage Areas
(2010) .................................................................................................................................19
Figure 2-7: Google Earth Image of Barataria Basin (2010) ..............................................21
Figure 2-8: HEC-RAS Image of Barataria Basin ..............................................................22
Figure 4-1: Google Earth Image of Davis Pond Freshwater Diversion Channel (2010) ...25
Figure 4-2: Tecplot Image of Lac Des Allemands from 2003 LIDAR/bathymetry ..........27
Figure 4-3: HEC-RAS Image of Des Allemands Channels and Others ............................28
Figure 4-4: Google Earth Image of The Pen (2010) ..........................................................29
Figure 4-5: Tecplot Image of Lake Cataouatche, Lake Salvador, Bayou Rigolettes, Bayou Perot,
The Pen, Barataria Bay Waterway, ICCW, and Dixie Delta Canal from 2003 LIDAR/bathymetry
............................................................................................................................................30

vi
Figure 4-6: Tecplot Image of Bayou Perot, Bayou Rigolettes, Little Lake, Barataria Bay
Waterway, Barataria Bay, and Wilkinson Canal from 2003 LIDAR/bathymetry .............32
Figure 4-7: Tecplot Image of Barataria Bay from 2003 LIDAR/bathymetry ....................33
Figure 4-8: HEC-RAS Image of Bayou Lamoque North, Bayou Lamoque South, and Bayou
Lamoque Channels.............................................................................................................34
Figure 4-9: HEC-RAS Image of Fort St. Philip Equivalent Channel. ...............................35
Figure 4-10: HEC-RAS Image of Caernarvon Channel ....................................................36
Figure 4-11: Google Earth Image of Cubit‟s Gap with Main Pass, Avulsions, and Smaller Passes (2010) .................................................................................................................................37
Figure 4-12: HEC-RAS Image of Original Main Pass Channel ........................................38
Figure 4-13: HEC-RAS Image of Altered Main Pass Channel .........................................39
Figure 4-14: Google Earth Image of Grand Pass and Tiger Pass (2010) ...........................40
Figure 4-15: HEC-RAS Image of the West Bay Sediment Diversion Channel ................41
Figure 4-16: HEC-RAS Image of the Bonnet Carré Spillway ...........................................42
Figure 4-17: 2008 Bohemia Spillway Roadway and Culvert Breach (LPBF, 2008).........43
Figure 4-18: HEC-RAS Image of Upstream Section of Bohemia Spillway ......................44
Figure 4-19: HEC-RAS Image of Middle Section of Bohemia Spillway ..........................44
Figure 4-20: HEC-RAS Image of Downstream Section of Bohemia Spillway .................45
Figure 4-21: HEC-RAS Image of Bayou Lamoque North Gates ......................................46
Figure 4-22: HEC-RAS Image of Bayou Lamoque South Gates ......................................46
Figure 4-23: HEC-RAS Image of the Davis Pond Freshwater Diversion .........................47
Figure 4-24: HEC-RAS Image of the Caernarvon Freshwater Diversion .........................48
Figure 4-25: HEC-RAS Image of Raccourci Island Storage Area and Weir (Plan View) ....
............................................................................................................................................49
Figure 4-26: HEC-RAS Image of Raccourci Island Weir (Cross-section View) ..............49

vii
Figure 4-27: Distributary Flows between Belle Chasse and Venice given by ADCP Studies from
West Bay Investigation (Meselhe et al. 2010) ...................................................................55
Figure 5-1: Google Earth Image of the ICCW Lock at Harvey (2010) .............................57
Figure 5-2: Google Earth Image of the ICCW Lock at Chalmette (2010) ........................58
Figure 5-3: Google Earth Image of the West Bay Sediment Diversion (2010) .................59
Figure 5-4: Carrollton Stage Comparison for 2007 Calibration (Original) .......................61
Figure 5-5: Carrollton Stage Comparison for 2007 Calibration (Manning‟s n Adjusted) .62
Figure 5-6: Carrollton Stage Comparison for 2007 Calibration (Flow Roughness Factors
Included) ............................................................................................................................63
Figure 5-7: Carrollton Stage Comparison for 2007 Calibration (Tides and Salinity Included)
............................................................................................................................................64
Figure 5-8: Carrollton Stage Comparison for 2003 Validation .........................................66
Figure 5-9: Carrollton Stage Comparison for 1999-2000 Validation ................................67
Figure 5-10: Carrollton Stage Comparison for 2007-2008 Simulation .............................68
Figure 5-11: Discharge Comparison for the 2008 Bonnet Carré Spillway Opening .........69
Figure 6-1: Shear Stress Comparison at Violet for the Relative Sea Level Rise Study ....73
Figure 6-2: Shear Stress Comparison at Belle Chasse for the Relative Sea Level Rise Study
............................................................................................................................................74
Figure 6-3: Shear Stress Comparison at Myrtle Grove for the Relative Sea Level Rise Study
............................................................................................................................................75
Figure 6-4: Shear Stress Comparison at West Pointe a la Hache for the Relative Sea Level Rise
Study ..................................................................................................................................76
Figure 6-5: Bed Material Transport per Unit Width (qs) Comparison at Violet for the Relative
Sea Level Rise Study .........................................................................................................77
Figure 6-6: Bed Material Transport per Unit Width (qs) Comparison at Belle Chasse for the
Relative Sea Level Rise Study ...........................................................................................78
Figure 6-7: Bed Material Transport per Unit Width (qs) Comparison at Myrtle Grove for the
Relative Sea Level Rise Study ...........................................................................................79

viii
Figure 6-8: Bed Material Transport per Unit Width (qs) Comparison at West Pointe a la Hache
for the Relative Sea Level Rise Study ...............................................................................80
Figure 6-9: Rating Curve Comparison at Violet for the Relative Sea Level Rise Study ...81
Figure 6-10: Rating Curve Comparison at Belle Chasse for the Relative Sea Level Rise Study
............................................................................................................................................82
Figure 6-11: Rating Curve Comparison at Myrtle Grove for the Relative Sea Level Rise Study
............................................................................................................................................83
Figure 6-12: Rating Curve Comparison at West Pointe a la Hache for the Relative Sea Level Rise
Study ..................................................................................................................................84
Figure 6-13: Flow Comparison for Baptiste Collette for the West Bay Closure Study ...85
Figure 6-14: Flow Comparison for Fort St. Philip for the West Bay Closure Study .........86
Figure 6-15: Flow Comparison for Grand Pass for the West Bay Closure Study .............87
Figure 6-16: Flow Comparison for Main Pass for the West Bay Closure Study ...............88
Figure 6-17: Flow Comparison for Pass a Loutré for the West Bay Closure Study ..........89
Figure 6-18: Flow Comparison for South Pass for the West Bay Closure Study ..............90
Figure 6-19: Flow Comparison for Southwest Pass for the West Bay Closure Study ......91
Figure 6-20: HEC-RAS Image of South Pass Closure Weir for the Changes to the Delta
Distributaries Study ...........................................................................................................92
Figure 6-21: HEC-RAS Image of Southwest Pass Closure Weir for the Changes to the Delta
Distributaries Study ...........................................................................................................93
Figure 6-22: HEC-RAS Image of Pass a Loutré Cross-section Dredged to -50 ft for the Changes
to the Delta Distributaries Study ........................................................................................95
Figure 6-23: HEC-RAS Image of Pass a Loutré Cross-section Dredged to -40 ft for the Changes
to the Delta Distributaries Study ........................................................................................97
Figure 6-24: HEC-RAS Image of Pass a Loutré Cross-section for the „oil spill‟ Study ...99
Figure 6-25: Flow Comparison for Pass a Loutré due to the Alteration of Pass a Loutré to the „oil
spill‟ Dimensions for the „oil spill‟ Study........................................................................101

ix
Figure 6-26: Flow Comparison for Southwest Pass due to the Alteration of Pass a Loutré to the
„oil spill‟ Dimensions for the „oil spill‟ Study .................................................................102
Figure 6-27: Shear Stress Comparison at Pass a Loutré RS 29 due to the Alteration of Pass a
Loutré to the „oil spill‟ Dimensions for the „oil spill‟ Study ...........................................103
Figure 6-28: Shear Stress Comparison at Pass a Loutré RS 19 due to the Alteration of Pass a
Loutré to the „oil spill‟ Dimensions for the „oil spill‟ Study ...........................................104
Figure 6-29: Shear Stress Comparison at Pass a Loutré RS 10 due to the Alteration of Pass a
Loutré to the „oil spill‟ Dimensions for the „oil spill‟ Study ...........................................105
Figure 6-30: Shear Stress Comparison at Pass a Loutré RS 1 due to the Alteration of Pass a
Loutré to the „oil spill‟ Dimensions for the „oil spill‟ Study ...........................................106
Figure 6-31: Shear Stress Comparison at Southwest Pass RS 108 due to the Alteration of Pass a
Loutré to the „oil spill‟ Dimensions for the „oil spill‟ Study ...........................................107
Figure 6-32: Shear Stress Comparison at Southwest Pass RS 68 due to the Alteration of Pass a
Loutré to the „oil spill‟ Dimensions for the „oil spill‟ Study ...........................................108
Figure 6-33: Shear Stress Comparison at Southwest Pass RS 28 due to the Alteration of Pass a
Loutré to the „oil spill‟ Dimensions for the „oil spill‟ Study ...........................................109
Figure 6-34: Shear Stress Comparison at Southwest Pass RS 1 due to the Alteration of Pass a
Loutré to the „oil spill‟ Dimensions for the „oil spill‟ Study ...........................................110
Figure 6-35: Bed Material Transport (Qs) Comparison at Pass a Loutré RS 29 due to the
Alteration of Pass a Loutré to the „oil spill‟ Dimensions for the „oil spill‟ Study ...........111
Figure 6-36: Bed Material Transport (Qs) Comparison at Pass a Loutré RS 19 due to the
Alteration of Pass a Loutré to the „oil spill‟ Dimensions for the „oil spill‟ Study ...........112
Figure 6-37: Bed Material Transport (Qs) Comparison at Pass a Loutré RS 10 due to the
Alteration of Pass a Loutré to the „oil spill‟ Dimensions for the „oil spill‟ Study ...........113
Figure 6-38: Bed Material Transport (Qs) Comparison at Pass a Loutré RS 1 due to the Alteration
of Pass a Loutré to the „oil spill‟ Dimensions for the „oil spill‟ Study ............................114
Figure 6-39: Bed Material Transport (Qs) Comparison at Southwest Pass RS 108 due to the
Alteration of Pass a Loutré to the „oil spill‟ Dimensions for the „oil spill‟ Study ...........115
Figure 6-40: Bed Material Transport (Qs) Comparison at Southwest Pass RS 68 due to the
Alteration of Pass a Loutré to the „oil spill‟ Dimensions for the „oil spill‟ Study ...........116

x
Figure 6-41: Bed Material Transport (Qs) Comparison at Southwest Pass RS 28 due to the
Alteration of Pass a Loutré to the „oil spill‟ Dimensions for the „oil spill‟ Study ...........117
Figure 6-42: Bed Material Transport (Qs) Comparison at Southwest Pass RS 1 due to the
Alteration of Pass a Loutré to the „oil spill‟ Dimensions for the „oil spill‟ Study ...........118
Figure 6-43: HEC-RAS Image of a Wide Cross-section in the Buras Diversion Channel for the
Proposed Barataria Basin Diversions Study ....................................................................120
Figure 6-44: Stage Comparison at Baton Rouge due to the Addition of the Buras Diversion for
the Proposed Barataria Basin Diversions Study ..............................................................121
Figure 6-45: Stage Comparison at Carrollton due to the Addition of the Buras Diversion for the
Proposed Barataria Basin Diversions Study ....................................................................122
Figure 6-46: Stage Comparison at Venice due to the Addition of the Buras Diversion for the
Proposed Barataria Basin Diversions Study ....................................................................123
Figure 6-47: HEC-RAS Image of Jesuit Bend Diversion Structure for the Proposed Barataria
Basin Diversions Study ....................................................................................................124
Figure 6-48: Stage Comparison at Baton Rouge due to the Addition of the Jesuit Bend Diversion
for the Proposed Barataria Basin Diversions Study .........................................................125
Figure 6-49: Stage Comparison at Carrollton due to the Addition of the Jesuit Bend Diversion for
the Proposed Barataria Basin Diversions Study ..............................................................126
Figure 6-50: Stage Comparison at Venice due to the Addition of the Jesuit Bend Diversion for
the Proposed Barataria Basin Diversions Study ..............................................................127
Figure 6-51: HEC-RAS Image of the Myrtle Grove Diversion Structure for the Proposed
Barataria Basin Diversions Study ....................................................................................128
Figure 6-52: Stage Comparison at Baton Rouge due to the Addition of the Myrtle Grove
Diversion for the Proposed Barataria Basin Diversions Study ........................................129
Figure 6-53: Stage Comparison at Carrollton due to the Addition of the Myrtle Grove Diversion
for the Proposed Barataria Basin Diversions Study. ........................................................130
Figure 6-54: Stage Comparison at Venice due to the Addition of the Myrtle Grove Diversion for
the Proposed Barataria Basin Diversions Study ..............................................................131
Figure 6-55: HEC-RAS Image of the Deer Range Diversion Structure for the Proposed Barataria
Basin Diversions Study ....................................................................................................132

xi
Figure 6-56: Stage Comparison at Baton Rouge due to the Addition of the Deer Range Diversion
for the Proposed Barataria Basin Diversions Study .........................................................133
Figure 6-57: Stage Comparison at Carrollton due to the Addition of the Deer Range Diversion
for the Proposed Barataria Basin Diversions Study .........................................................134
Figure 6-58: Stage Comparison at Venice due to the Addition of the Deer Range Diversion for
the Proposed Barataria Basin Diversions Study ..............................................................135
Figure 6-59: Stage Comparison at Baton Rouge due to the Addition of the Lagan and Johnson
Diversions for the Proposed Barataria Basin Diversions Study ......................................136
Figure 6-60: Stage Comparison at Carrollton due to the Addition of the Lagan and Johnson
Diversions for the Proposed Barataria Basin Diversions Study ......................................137
Figure 6-61: Stage Comparison at Venice due to the Addition of the Lagan and Johnson
Diversions for the Proposed Barataria Basin Diversions Study ......................................138
Figure 6-62: HEC-RAS Image of the Belair Diversion Structure for the Proposed Pontchartrain
Basin Diversions Study ....................................................................................................140
Figure 6-63: Stage Comparison at Baton Rouge due to the Addition of the Belair Diversion for
the Proposed Pontchartrain Basin Diversions Study .......................................................141
Figure 6-64: Stage Comparison at Carrollton due to the Addition of the Belair Diversion for the
Proposed Pontchartrain Basin Diversions Study .............................................................142
Figure 6-65: Stage Comparison at Venice due to the Addition of the Belair Diversion for the
Proposed Pontchartrain Basin Diversions Study .............................................................143
Figure 6-66: HEC-RAS Image of the Altered Bohemia Spillway Diversion Structure for the
Proposed Pontchartrain Basin Diversions Study .............................................................144
Figure 6-67: Stage Comparison at Baton Rouge due to the Alteration of the Bohemia Spillway
Diversion for the Proposed Pontchartrain Basin Diversions Study .................................145
Figure 6-68: Stage Comparison at Carrollton due to the Alteration of the Bohemia Spillway
Diversion for the Proposed Pontchartrain Basin Diversions Study .................................146
Figure 6-69: Stage Comparison at Venice due to the Alteration of the Bohemia Spillway
Diversion for the Proposed Pontchartrain Basin Diversions Study .................................147
Figure 6-70: HEC-RAS Image of the Blind River Diversion Structure for the Proposed
Pontchartrain Basin Diversions Study .............................................................................148

xii
Figure 6-71: Stage Comparison at Baton Rouge due to the Addition of the Blind River Diversion
for the Proposed Pontchartrain Basin Diversions Study ..................................................149
Figure 6-72: Stage Comparison at Carrollton due to the Addition of the Blind River Diversion
for the Proposed Pontchartrain Basin Diversions Study ..................................................150
Figure 6-73: Stage Comparison at Venice due to the Addition of the Blind River Diversion for
the Proposed Pontchartrain Basin Diversions Study .......................................................151
Figure 6-74: HEC-RAS Image of the Garyville Diversion Structure for the Proposed
Pontchartrain Basin Diversions Study .............................................................................152
Figure 6-75: Stage Comparison at Baton Rouge due to the Addition of the Garyville Diversion
for the Proposed Pontchartrain Basin Diversions Study ..................................................153
Figure 6-76: Stage Comparison at Carrollton due to the Addition of the Garyville Diversion for
the Proposed Pontchartrain Basin Diversions Study .......................................................154
Figure 6-77: Stage Comparison at Venice due to the Addition of the Garyville Diversion for the
Proposed Pontchartrain Basin Diversions Study .............................................................155
Figure 6-78: HEC-RAS Image of the Violet Diversion Structure for the Proposed Pontchartrain
Basin Diversions Study ....................................................................................................156
Figure 6-79: Stage Comparison at Baton Rouge due to the Addition of the Violet Diversion for
the Proposed Pontchartrain Basin Diversions Study .......................................................157
Figure 6-80: Stage Comparison at Carrollton due to the Addition of the Violet Diversion for the
Proposed Pontchartrain Basin Diversions Study .............................................................158
Figure 6-81: Stage Comparison at Venice due to the Addition of the Violet Diversion for the
Proposed Pontchartrain Basin Diversions Study .............................................................159
Figure 6-82: HEC-RAS Image of the Altered Bonnet Carré Spillway Diversion Structure for the
Proposed Pontchartrain Basin Diversions Study .............................................................160
Figure 6-83: Stage Comparison at Baton Rouge due to the Alteration to the Bonnet Carré
Spillway Diversion for the Proposed Pontchartrain Basin Diversions Study ..................161
Figure 6-84: Stage Comparison at Carrollton due to the Alteration to the Bonnet Carré Spillway
Diversion for the Proposed Pontchartrain Basin Diversions Study .................................162
Figure 6-85: Stage Comparison at Venice due to the Alteration to the Bonnet Carré Spillway
Diversion for the Proposed Pontchartrain Basin Diversions Study .................................163

xiii
Figure 6-86: Stage Comparison at Baton Rouge due to the Closure of South Pass and the
Addition of the Proposed Barataria Basin Diversions for the Proposed Diversions Combined with
the Changes to the Delta Distributaries Study .................................................................165
Figure 6-87: Stage Comparison at Carrollton due to the Closure of South Pass and the Addition
of the Proposed Barataria Basin Diversions for the Proposed Diversions Combined with the
Changes to the Delta Distributaries Study .......................................................................166
Figure 6-88: Stage Comparison at Venice due to the Closure of South Pass and the Addition of
the Proposed Barataria Basin Diversions for the Proposed Diversions Combined with the
Changes to the Delta Distributaries Study .......................................................................167
Figure 6-89: Stage Comparison at Baton Rouge due to the Closure of Southwest Pass and the
Addition of the Proposed Barataria Basin Diversions for the Proposed Diversions Combined with
the Changes to the Delta Distributaries Study .................................................................169
Figure 6-90: Stage Comparison at Carrollton due to the Closure of Southwest Pass and the
Addition of the Proposed Barataria Basin Diversions for the Proposed Diversions Combined with
the Changes to the Delta Distributaries Study .................................................................170
Figure 6-91: Stage Comparison at Venice due to the Closure of Southwest Pass and the Addition
of the Proposed Barataria Basin Diversions for the Proposed Diversions Combined with the
Changes to the Delta Distributaries Study .......................................................................171
Figure 6-92: Stage Comparison at Baton Rouge due to the Addition of the Proposed Barataria
Basin Diversions; the Closure of South Pass, Southwest Pass and West Bay; and the Dredging of
Pass a Loutré to -50 ft for the Proposed Diversions Combined with the Changes to the Delta
Distributaries Study .........................................................................................................173
Figure 6-93: Stage Comparison at Carrollton due to the Addition of the Proposed Barataria Basin
Diversions; the Closure of South Pass, Southwest Pass and West Bay; and the Dredging of Pass a
Loutré to -50 ft for the Proposed Diversions Combined with the Changes to the Delta
Distributaries Study .........................................................................................................174
Figure 6-94: Stage Comparison at Venice due to the Addition of the Proposed Barataria Basin
Diversions; the Closure of South Pass, Southwest Pass and West Bay; and the Dredging of Pass a
Loutré to -50 ft for the Proposed Diversions Combined with the Changes to the Delta
Distributaries Study .........................................................................................................175
Figure 6-95: Stage Comparison at Baton Rouge due to the Addition of the Proposed Barataria
Basin Diversions; the Closure of South Pass, Southwest Pass and West Bay; and the Dredging of
Pass a Loutré to -40 ft for the Proposed Diversions Combined with the Changes to the Delta
Distributaries Study .........................................................................................................177
Figure 6-96: Stage Comparison at Carrollton due to the Addition of the Proposed Barataria Basin
Diversions; the Closure of South Pass, Southwest Pass and West Bay; and the Dredging of Pass a

xiv
Loutré to -40 ft for the Proposed Diversions Combined with the Changes to the Delta
Distributaries Study .........................................................................................................178
Figure 6-97: Stage Comparison at Venice due to the Addition of the Proposed Barataria Basin
Diversions; the Closure of South Pass, Southwest Pass and West Bay; and the Dredging of Pass a
Loutré to -40 ft for the Proposed Diversions Combined with the Changes to the Delta
Distributaries Study .........................................................................................................179
Figure 6-98: Bed Material Transport per Unit Width (qs) Comparison at Pass a Loutré RS 29 due
to the Narrowing of Pass a Loutré for the Proposed Diversions Combined with the Changes to
the Delta Distributaries Study ..........................................................................................182
Figure 6-99: Bed Material Transport per Unit Width (qs) Comparison at Pass a Loutré RS 19 due
to the Narrowing of Pass a Loutré for the Proposed Diversions Combined with the Changes to
the Delta Distributaries Study ..........................................................................................183
Figure 6-100: Bed Material Transport per Unit Width (qs) Comparison at Pass a Loutré RS 10
due to the Narrowing of Pass a Loutré for the Proposed Diversions Combined with the Changes
to the Delta Distributaries Study ......................................................................................184
Figure 6-101: Bed Material Transport per Unit Width (qs) Comparison at Pass a Loutré RS 1 due
to the Narrowing of Pass a Loutré for the Proposed Diversions Combined with the Changes to
the Delta Distributaries Study ..........................................................................................185
Figure 6-102: Bed Material Transport (Qs) Comparison at Pass a Loutré RS 29 due to the
Narrowing of Pass a Loutré for the Proposed Diversions Combined with the Changes to the
Delta Distributaries Study ................................................................................................186
Figure 6-103: Bed Material Transport (Qs) Comparison at Pass a Loutré RS 19 due to the
Narrowing of Pass a Loutré for the Proposed Diversions Combined with the Changes to the
Delta Distributaries Study ................................................................................................187
Figure 6-104: Bed Material Transport (Qs) Comparison at Pass a Loutré RS 10 due to the
Narrowing of Pass a Loutré for the Proposed Diversions Combined with the Changes to the
Delta Distributaries Study ................................................................................................188
Figure 6-105: Bed Material Transport (Qs) Comparison at Pass a Loutré RS 1 due to the
Narrowing of Pass a Loutré for the Proposed Diversions Combined with the Changes to the
Delta Distributaries Study ................................................................................................189
Figure 6-106: Updated Bed Material Transport (Qs) Comparison at Pass a Loutré RS 29 due to
the Narrowing of Pass a Loutré, Including Simulations Using a Copy of Southwest Pass RS 81
and a 1,200 ft by 40 ft Rectangular Channel for the Proposed Diversions Combined with the
Changes to the Delta Distributaries Study .......................................................................191
xv
Figure 6-107: Updated Bed Material Transport (Qs) Comparison at Pass a Loutré RS 19 due to
the Narrowing of Pass a Loutré, Including Simulations Using a Copy of Southwest Pass RS 81
and a 1,200 ft by 40 ft Rectangular Channel for the Proposed Diversions Combined with the
Changes to the Delta Distributaries Study .......................................................................192
Figure 6-108: Updated Bed Material Transport (Qs) Comparison at Pass a Loutré RS 10 due to
the Narrowing of Pass a Loutré, Including Simulations Using a Copy of Southwest Pass RS 81
and a 1,200 ft by 40 ft Rectangular Channel for the Proposed Diversions Combined with the
Changes to the Delta Distributaries Study .......................................................................193
Figure 6-109: Updated Bed Material Transport (Qs) Comparison at Pass a Loutré RS 1 due to the
Narrowing of Pass a Loutré, Including Simulations Using a Copy of Southwest Pass RS 81 and a
1,200 ft by 40 ft Rectangular Channel for the Proposed Diversions Combined with the Changes
to the Delta Distributaries Study ......................................................................................194
Figure 6-110: 2007-2008 Stage Comparison at the Bonnet Carré Spillway due to the Addition of
the Barataria and Pontchartrain Basin Diversions; the Closure of South Pass, Southwest Pass,
and West Bay; and the Dredging of Pass a Loutré to the „oil spill‟ Dimensions for the Proposed
Diversions Combined with the Changes to the Delta Distributaries Study .....................197
Figure 6-111: 2007-2008 Relative Stage Comparison at the Bonnet Carré Spillway due to the
Addition of the Barataria and Pontchartrain Basin Diversions; the Closure of South Pass,
Southwest Pass, and West Bay; and the Dredging of Pass a Loutré to the „oil spill‟ Dimensions
for the Proposed Diversions Combined with the Changes to the Delta Distributaries Study
..........................................................................................................................................198
Figure 6-112: 2007-2008 Stage Comparison at the Violet Diversion due to the Addition of the
Barataria and Pontchartrain Basin Diversions; the Closure of South Pass, Southwest Pass, and
West Bay; and the Dredging of Pass a Loutré to the „oil spill‟ Dimensions for the Proposed
Diversions Combined with the Changes to the Delta Distributaries Study .....................199
Figure 6-113: 2007-2008 Relative Stage Comparison at the Violet Diversion due to the Addition
of the Barataria and Pontchartrain Basin Diversions; the Closure of South Pass, Southwest Pass,
and West Bay; and the Dredging of Pass a Loutré to the „oil spill‟ Dimensions for the Proposed
Diversions Combined with the Changes to the Delta Distributaries Study .....................200
Figure 6-114: 2007-2008 Stage Comparison at the Belair Diversion due to the Addition of the
Barataria and Pontchartrain Basin Diversions; the Closure of South Pass, Southwest Pass, and
West Bay; and the Dredging of Pass a Loutré to the „oil spill‟ Dimensions for the Proposed
Diversions Combined with the Changes to the Delta Distributaries Study .....................201
Figure 6-115: 2007-2008 Relative Stage Comparison at the Belair Diversion due to the Addition
of the Barataria and Pontchartrain Basin Diversions; the Closure of South Pass, Southwest Pass,
and West Bay; and the Dredging of Pass a Loutré to the „oil spill‟ Dimensions for the Proposed
Diversions Combined with the Changes to the Delta Distributaries Study .....................202

xvi
Figure 6-116: 2007-2008 Stage Comparison at the Myrtle Grove Diversion due to the Addition
of the Barataria and Pontchartrain Basin Diversions; the Closure of South Pass, Southwest Pass,
and West Bay; and the Dredging of Pass a Loutré to the „oil spill‟ Dimensions for the Proposed
Diversions Combined with the Changes to the Delta Distributaries Study .....................203
Figure 6-117: 2007-2008 Relative Stage Comparison at the Myrtle Grove Diversion due to the
Addition of the Barataria and Pontchartrain Basin Diversions; the Closure of South Pass,
Southwest Pass, and West Bay; and the Dredging of Pass a Loutré to the „oil spill‟ Dimensions
for the Proposed Diversions Combined with the Changes to the Delta Distributaries Study
..........................................................................................................................................204
Figure 6-118: 2007-2008 Stage Comparison at the Deer Range Diversion due to the Addition of
the Barataria and Pontchartrain Basin Diversions; the Closure of South Pass, Southwest Pass,
and West Bay; and the Dredging of Pass a Loutré to the „oil spill‟ Dimensions for the Proposed
Diversions Combined with the Changes to the Delta Distributaries Study .....................205
Figure 6-119: 2007-2008 Relative Stage Comparison at the Deer Range Diversion due to the
Addition of the Barataria and Pontchartrain Basin Diversions; the Closure of South Pass,
Southwest Pass, and West Bay; and the Dredging of Pass a Loutré to the „oil spill‟ Dimensions
for the Proposed Diversions Combined with the Changes to the Delta Distributaries Study
..........................................................................................................................................206
Figure 6-120: 2007-2008 Stage Comparison at the Bohemia Spillway Diversion due to the
Addition of the Barataria and Pontchartrain Basin Diversions; the Closure of South Pass,
Southwest Pass, and West Bay; and the Dredging of Pass a Loutré to the „oil spill‟ Dimensions
for the Proposed Diversions Combined with the Changes to the Delta Distributaries Study
..........................................................................................................................................207
Figure 6-121: 2007-2008 Relative Stage Comparison at the Bohemia Spillway Diversion due to
the Addition of the Barataria and Pontchartrain Basin Diversions; the Closure of South Pass,
Southwest Pass, and West Bay; and the Dredging of Pass a Loutré to the „oil spill‟ Dimensions
for the Proposed Diversions Combined with the Changes to the Delta Distributaries Study
..........................................................................................................................................208
Figure 6-122: 2007-2008 Stage Comparison at the Buras Diversion due to the Addition of the
Barataria and Pontchartrain Basin Diversions; the Closure of South Pass, Southwest Pass, and
West Bay; and the Dredging of Pass a Loutré to the „oil spill‟ Dimensions for the Proposed
Diversions Combined with the Changes to the Delta Distributaries Study .....................210
Figure 6-123: 2007 Relative Stage Comparison at the Buras Diversion due to the Addition of the
Barataria and Pontchartrain Basin Diversions; the Closure of South Pass, Southwest Pass, and
West Bay; and the Dredging of Pass a Loutré to the „oil spill‟ Dimensions for the Proposed
Diversions Combined with the Changes to the Delta Distributaries Study .....................211
Figure 6-124: 2007-2008 Stage Comparison at Baton Rouge due to the Addition of the Proposed
Barataria and Pontchartrain Basin Diversions; the Closure of South Pass, Southwest Pass, and

xvii
West Bay; and the Dredging of Pass a Loutré to the „oil spill‟ Dimensions for the Proposed
Diversions Combined with the Changes to the Delta Distributaries Study .....................212
Figure 6-125: 2007-2008 Stage Comparison at Carrollton due to the Addition of the Proposed
Barataria and Pontchartrain Basin Diversions; the Closure of South Pass, Southwest Pass, and
West Bay; and the Dredging of Pass a Loutré to the „oil spill‟ Dimensions for the Proposed
Diversions Combined with the Changes to the Delta Distributaries Study .....................213
Figure 6-126: 2007-2008 Stage Comparison at Venice due to the Addition of the Proposed
Barataria and Pontchartrain Basin Diversions; the Closure of South Pass, Southwest Pass, and
West Bay; and the Dredging of Pass a Loutré to the „oil spill‟ Dimensions for the Proposed
Diversions Combined with the Changes to the Delta Distributaries Study .....................214
Figure 6-127: 2007-2008 Velocity Comparison at the Bonnet Carré Spillway due to the Addition
of the Barataria and Pontchartrain Basin Diversions; the Closure of South Pass, Southwest Pass,
and West Bay; and the Dredging of Pass a Loutré to the „oil spill‟ Dimensions for the Proposed
Diversions Combined with the Changes to the Delta Distributaries Study .....................215
Figure 6-128: 2007-2008 Relative Velocity Comparison at the Bonnet Carré Spillway due to the
Addition of the Barataria and Pontchartrain Basin Diversions; the Closure of South Pass,
Southwest Pass, and West Bay; and the Dredging of Pass a Loutré to the „oil spill‟ Dimensions
for the Proposed Diversions Combined with the Changes to the Delta Distributaries Study
..........................................................................................................................................216
Figure 6-129: 2007-2008 Velocity Comparison at the Violet Diversion due to the Addition of the
Barataria and Pontchartrain Basin Diversions; the Closure of South Pass, Southwest Pass, and
West Bay; and the Dredging of Pass a Loutré to the „oil spill‟ Dimensions for the Proposed
Diversions Combined with the Changes to the Delta Distributaries Study .....................217
Figure 6-130: 2007-2008 Relative Velocity Comparison at the Violet Diversion due to the
Addition of the Barataria and Pontchartrain Basin Diversions; the Closure of South Pass,
Southwest Pass, and West Bay; and the Dredging of Pass a Loutré to the „oil spill‟ Dimensions
for the Proposed Diversions Combined with the Changes to the Delta Distributaries Study
..........................................................................................................................................218
Figure 6-131: 2007-2008 Velocity Comparison at the Belair Diversion due to the Addition of the
Barataria and Pontchartrain Basin Diversions; the Closure of South Pass, Southwest Pass, and
West Bay; and the Dredging of Pass a Loutré to the „oil spill‟ Dimensions for the Proposed
Diversions Combined with the Changes to the Delta Distributaries Study .....................219
Figure 6-132: 2007-2008 Relative Velocity Comparison at the Belair Diversion due to the
Addition of the Barataria and Pontchartrain Basin Diversions; the Closure of South Pass,
Southwest Pass, and West Bay; and the Dredging of Pass a Loutré to the „oil spill‟ Dimensions
for the Proposed Diversions Combined with the Changes to the Delta Distributaries Study
..........................................................................................................................................220

xviii
Figure 6-133: 2007-2008 Velocity Comparison at the Myrtle Grove Diversion due to the
Addition of the Barataria and Pontchartrain Basin Diversions; the Closure of South Pass,
Southwest Pass, and West Bay; and the Dredging of Pass a Loutré to the „oil spill‟ Dimensions
for the Proposed Diversions Combined with the Changes to the Delta Distributaries Study
..........................................................................................................................................221
Figure 6-134: 2007-2008 Relative Velocity Comparison at the Myrtle Grove Diversion due to
the Addition of the Barataria and Pontchartrain Basin Diversions; the Closure of South Pass,
Southwest Pass, and West Bay; and the Dredging of Pass a Loutré to the „oil spill‟ Dimensions
for the Proposed Diversions Combined with the Changes to the Delta Distributaries Study
..........................................................................................................................................222
Figure 6-135: 2007-2008 Velocity Comparison at the Deer Range Diversion due to the Addition
of the Barataria and Pontchartrain Basin Diversions; the Closure of South Pass, Southwest Pass,
and West Bay; and the Dredging of Pass a Loutré to the „oil spill‟ Dimensions for the Proposed
Diversions Combined with the Changes to the Delta Distributaries Study .....................223
Figure 6-136: 2007-2008 Relative Velocity Comparison at the Deer Range Diversion due to the
Addition of the Barataria and Pontchartrain Basin Diversions; the Closure of South Pass,
Southwest Pass, and West Bay; and the Dredging of Pass a Loutré to the „oil spill‟ Dimensions
for the Proposed Diversions Combined with the Changes to the Delta Distributaries Study
..........................................................................................................................................224
Figure 6-137: 2007-2008 Velocity Comparison at the Bohemia Spillway Diversion due to the
Addition of the Barataria and Pontchartrain Basin Diversions; the Closure of South Pass,
Southwest Pass, and West Bay; and the Dredging of Pass a Loutré to the „oil spill‟ Dimensions
for the Proposed Diversions Combined with the Changes to the Delta Distributaries Study
..........................................................................................................................................225
Figure 6-138: 2007-2008 Relative Velocity Comparison at the Bohemia Spillway Diversion due
to the Addition of the Barataria and Pontchartrain Basin Diversions; the Closure of South Pass,
Southwest Pass, and West Bay; and the Dredging of Pass a Loutré to the „oil spill‟ Dimensions
for the Proposed Diversions Combined with the Changes to the Delta Distributaries Study
..........................................................................................................................................226
Figure 6-139: 2007-2008 Velocity Comparison at the Buras Diversion due to the Addition of the
Barataria and Pontchartrain Basin Diversions; the Closure of South Pass, Southwest Pass, and
West Bay; and the Dredging of Pass a Loutré to the „oil spill‟ Dimensions for the Proposed
Diversions Combined with the Changes to the Delta Distributaries Study .....................228
Figure 6-140: 2007 Relative Velocity Comparison at the Buras Diversion due to the Addition of
the Barataria and Pontchartrain Basin Diversions; the Closure of South Pass, Southwest Pass,
and West Bay; and the Dredging of Pass a Loutré to the „oil spill‟ Dimensions for the Proposed
Diversions Combined with the Changes to the Delta Distributaries Study .....................229

xix
Figure 6-141: 2007-2008 Velocity Comparison at Baton Rouge due to the Addition of the
Barataria and Pontchartrain Basin Diversions; the Closure of South Pass, Southwest Pass, and
West Bay; and the Dredging of Pass a Loutré to the „oil spill‟ Dimensions for the Proposed
Diversions Combined with the Changes to the Delta Distributaries Study .....................230
Figure 6-142: 2007-2008 Velocity Comparison at Carrollton due to the Addition of the Barataria
and Pontchartrain Basin Diversions; the Closure of South Pass, Southwest Pass, and West Bay;
and the Dredging of Pass a Loutré to the „oil spill‟ Dimensions for the Proposed Diversions
Combined with the Changes to the Delta Distributaries Study .......................................231
Figure 6-143: 2007-2008 Velocity Comparison at Venice due to the Addition of the Barataria
and Pontchartrain Basin Diversions; the Closure of South Pass, Southwest Pass, and West Bay;
and the Dredging of Pass a Loutré to the „oil spill‟ Dimensions for the Proposed Diversions
Combined with the Changes to the Delta Distributaries Study .......................................232
Figure 6-144: 2007-2008 Shear Stress Comparison at the Bonnet Carré Spillway due to the
Addition of the Barataria and Pontchartrain Basin Diversions; the Closure of South Pass,
Southwest Pass, and West Bay; and the Dredging of Pass a Loutré to the „oil spill‟ Dimensions
for the Proposed Diversions Combined with the Changes to the Delta Distributaries Study
..........................................................................................................................................233
Figure 6-145: 2007-2008 Relative Shear Stress Comparison at the Bonnet Carré Spillway due to
the Addition of the Barataria and Pontchartrain Basin Diversions; the Closure of South Pass,
Southwest Pass, and West Bay; and the Dredging of Pass a Loutré to the „oil spill‟ Dimensions
for the Proposed Diversions Combined with the Changes to the Delta Distributaries Study
..........................................................................................................................................234
Figure 6-146: 2007-2008 Shear Stress Comparison at the Violet Diversion due to the Addition of
the Barataria and Pontchartrain Basin Diversions; the Closure of South Pass, Southwest Pass,
and West Bay; and the Dredging of Pass a Loutré to the „oil spill‟ Dimensions for the Proposed
Diversions Combined with the Changes to the Delta Distributaries Study .....................235
Figure 6-147: 2007-2008 Relative Shear Stress Comparison at the Violet Diversion due to the
Addition of the Barataria and Pontchartrain Basin Diversions; the Closure of South Pass,
Southwest Pass, and West Bay; and the Dredging of Pass a Loutré to the „oil spill‟ Dimensions
for the Proposed Diversions Combined with the Changes to the Delta Distributaries Study
..........................................................................................................................................236
Figure 6-148: 2007-2008 Shear Stress Comparison at the Belair Diversion due to the Addition of
the Barataria and Pontchartrain Basin Diversions; the Closure of South Pass, Southwest Pass,
and West Bay; and the Dredging of Pass a Loutré to the „oil spill‟ Dimensions for the Proposed
Diversions Combined with the Changes to the Delta Distributaries Study .....................237
Figure 6-149: 2007-2008 Relative Shear Stress Comparison at the Belair Diversion due to the
Addition of the Barataria and Pontchartrain Basin Diversions; the Closure of South Pass,
Southwest Pass, and West Bay; and the Dredging of Pass a Loutré to the „oil spill‟ Dimensions

xx
for the Proposed Diversions Combined with the Changes to the Delta Distributaries Study
..........................................................................................................................................238
Figure 6-150: 2007-2008 Shear Stress Comparison at the Myrtle Grove Diversion due to the
Addition of the Barataria and Pontchartrain Basin Diversions; the Closure of South Pass,
Southwest Pass, and West Bay; and the Dredging of Pass a Loutré to the „oil spill‟ Dimensions
for the Proposed Diversions Combined with the Changes to the Delta Distributaries Study
..........................................................................................................................................239
Figure 6-151: 2007-2008 Relative Shear Stress Comparison at the Myrtle Grove Diversion due
to the Addition of the Barataria and Pontchartrain Basin Diversions; the Closure of South Pass,
Southwest Pass, and West Bay; and the Dredging of Pass a Loutré to the „oil spill‟ Dimensions
for the Proposed Diversions Combined with the Changes to the Delta Distributaries Study
..........................................................................................................................................240
Figure 6-152: 2007-2008 Shear Stress Comparison at the Deer Range Diversion due to the
Addition of the Barataria and Pontchartrain Basin Diversions; the Closure of South Pass,
Southwest Pass, and West Bay; and the Dredging of Pass a Loutré to the „oil spill‟ Dimensions
for the Proposed Diversions Combined with the Changes to the Delta Distributaries Study
..........................................................................................................................................241
Figure 6-153: 2007-2008 Relative Shear Stress Comparison at the Deer Range Diversion due to
the Addition of the Barataria and Pontchartrain Basin Diversions; the Closure of South Pass,
Southwest Pass, and West Bay; and the Dredging of Pass a Loutré to the „oil spill‟ Dimensions
for the Proposed Diversions Combined with the Changes to the Delta Distributaries Study
..........................................................................................................................................242
Figure 6-154: 2007-2008 Shear Stress Comparison at the Bohemia Spillway Diversion due to the
Addition of the Barataria and Pontchartrain Basin Diversions; the Closure of South Pass,
Southwest Pass, and West Bay; and the Dredging of Pass a Loutré to the „oil spill‟ Dimensions
for the Proposed Diversions Combined with the Changes to the Delta Distributaries Study
..........................................................................................................................................243
Figure 6-155: 2007-2008 Relative Shear Stress Comparison at the Bohemia Spillway Diversion
due to the Addition of the Barataria and Pontchartrain Basin Diversions; the Closure of South
Pass, Southwest Pass, and West Bay; and the Dredging of Pass a Loutré to the „oil spill‟
Dimensions for the Proposed Diversions Combined with the Changes to the Delta Distributaries
Study ................................................................................................................................244
Figure 6-156: 2007-2008 Shear Stress Comparison at the Buras Diversion due to the Addition of
the Barataria and Pontchartrain Basin Diversions; the Closure of South Pass, Southwest Pass,
and West Bay; and the Dredging of Pass a Loutré to the „oil spill‟ Dimensions for the Proposed
Diversions Combined with the Changes to the Delta Distributaries Study .....................246
Figure 6-157: 2007 Relative Shear Stress Comparison at the Buras Diversion due to the Addition
of the Barataria and Pontchartrain Basin Diversions; the Closure of South Pass, Southwest Pass,

xxi
and West Bay; and the Dredging of Pass a Loutré to the „oil spill‟ Dimensions for the Proposed
Diversions Combined with the Changes to the Delta Distributaries Study .....................247
Figure 6-158: 2007-2008 Shear Stress Comparison at Baton Rouge due to the Addition of the
Barataria and Pontchartrain Basin Diversions; the Closure of South Pass, Southwest Pass, and
West Bay; and the Dredging of Pass a Loutré to the „oil spill‟ Dimensions for the Proposed
Diversions Combined with the Changes to the Delta Distributaries Study .....................248
Figure 6-159: 2007-2008 Shear Stress Comparison at Carrollton due to the Addition of the
Barataria and Pontchartrain Basin Diversions; the Closure of South Pass, Southwest Pass, and
West Bay; and the Dredging of Pass a Loutré to the „oil spill‟ Dimensions for the Proposed
Diversions Combined with the Changes to the Delta Distributaries Study .....................249
Figure 6-160: 2007-2008 Shear Stress Comparison at Venice due to the Addition of the Barataria
and Pontchartrain Basin Diversions; the Closure of South Pass, Southwest Pass, and West Bay;
and the Dredging of Pass a Loutré to the „oil spill‟ Dimensions for the Proposed Diversions
Combined with the Changes to the Delta Distributaries Study .......................................250
Figure 6-161: 2007-2008 Shear Stress Comparison at Pass a Loutré RS 29 due to the Addition of
the Barataria and Pontchartrain Basin Diversions; the Closure of South Pass, Southwest Pass,
and West Bay; and the Dredging of Pass a Loutré to the „oil spill‟ Dimensions for the Proposed
Diversions Combined with the Changes to the Delta Distributaries Study .....................251
Figure 6-162: 2007-2008 Shear Stress Comparison at Pass a Loutré RS 19 due to the Addition of
the Barataria and Pontchartrain Basin Diversions; the Closure of South Pass, Southwest Pass,
and West Bay; and the Dredging of Pass a Loutré to the „oil spill‟ Dimensions for the Proposed
Diversions Combined with the Changes to the Delta Distributaries Study .....................252
Figure 6-163: 2007-2008 Shear Stress Comparison at Pass a Loutré RS 10 due to the Addition of
the Barataria and Pontchartrain Basin Diversions; the Closure of South Pass, Southwest Pass,
and West Bay; and the Dredging of Pass a Loutré to the „oil spill‟ Dimensions for the Proposed
Diversions Combined with the Changes to the Delta Distributaries Study .....................253
Figure 6-164: 2007-2008 Shear Stress Comparison at Pass a Loutré RS 1 due to the Addition of
the Barataria and Pontchartrain Basin Diversions; the Closure of South Pass, Southwest Pass,
and West Bay; and the Dredging of Pass a Loutré to the „oil spill‟ Dimensions for the Proposed
Diversions Combined with the Changes to the Delta Distributaries Study .....................254
Figure 6-165: 2007-2008 Bed Material Transport (Qs) Comparison at the Bonnet Carré Spillway
due to the Addition of the Barataria and Pontchartrain Basin Diversions; the Closure of South
Pass, Southwest Pass, and West Bay; and the Dredging of Pass a Loutré to the „oil spill‟
Dimensions for the Proposed Diversions Combined with the Changes to the Delta Distributaries
Study ................................................................................................................................255
Figure 6-166: 2007-2008 Relative Bed Material Transport (Qs) Comparison at the Bonnet Carré
Spillway due to the Addition of the Barataria and Pontchartrain Basin Diversions; the Closure of

xxii
South Pass, Southwest Pass, and West Bay; and the Dredging of Pass a Loutré to the „oil spill‟
Dimensions for the Proposed Diversions Combined with the Changes to the Delta Distributaries
Study ................................................................................................................................256
Figure 6-167: 2007-2008 Bed Material Transport (Qs) Comparison at the Violet Diversion due to
the Addition of the Barataria and Pontchartrain Basin Diversions; the Closure of South Pass,
Southwest Pass, and West Bay; and the Dredging of Pass a Loutré to the „oil spill‟ Dimensions
for the Proposed Diversions Combined with the Changes to the Delta Distributaries Study
..........................................................................................................................................257
Figure 6-168: 2007-2008 Relative Bed Material Transport (Qs) Comparison at the Violet
Diversion due to the Addition of the Barataria and Pontchartrain Basin Diversions; the Closure
of South Pass, Southwest Pass, and West Bay; and the Dredging of Pass a Loutré to the „oil spill‟
Dimensions for the Proposed Diversions Combined with the Changes to the Delta Distributaries
Study ................................................................................................................................258
Figure 6-169: 2007-2008 Bed Material Transport (Qs) Comparison at the Belair Diversion due to
the Addition of the Barataria and Pontchartrain Basin Diversions; the Closure of South Pass,
Southwest Pass, and West Bay; and the Dredging of Pass a Loutré to the „oil spill‟ Dimensions
for the Proposed Diversions Combined with the Changes to the Delta Distributaries Study
..........................................................................................................................................259
Figure 6-170: 2007-2008 Relative Bed Material Transport (Qs) Comparison at the Belair
Diversion due to the Addition of the Barataria and Pontchartrain Basin Diversions; the Closure
of South Pass, Southwest Pass, and West Bay; and the Dredging of Pass a Loutré to the „oil spill‟
Dimensions for the Proposed Diversions Combined with the Changes to the Delta Distributaries
Study ................................................................................................................................260
Figure 6-172: 2007-2008 Bed Material Transport (Qs) Comparison at the Myrtle Grove
Diversion due to the Addition of the Barataria and Pontchartrain Basin Diversions; the Closure
of South Pass, Southwest Pass, and West Bay; and the Dredging of Pass a Loutré to the „oil spill‟
Dimensions for the Proposed Diversions Combined with the Changes to the Delta Distributaries
Study ................................................................................................................................261
Figure 6-172: 2007-2008 Relative Bed Material Transport (Qs) Comparison at the Myrtle Grove
Diversion due to the Addition of the Barataria and Pontchartrain Basin Diversions; the Closure
of South Pass, Southwest Pass, and West Bay; and the Dredging of Pass a Loutré to the „oil spill‟
Dimensions for the Proposed Diversions Combined with the Changes to the Delta Distributaries
Study ................................................................................................................................262
Figure 6-173: 2007-2008 Bed Material Transport (Qs) Comparison at the Deer Range Diversion
due to the Addition of the Barataria and Pontchartrain Basin Diversions; the Closure of South
Pass, Southwest Pass, and West Bay; and the Dredging of Pass a Loutré to the „oil spill‟
Dimensions for the Proposed Diversions Combined with the Changes to the Delta Distributaries
Study ................................................................................................................................263

xxiii
Figure 6-174: 2007-2008 Relative Bed Material Transport (Qs) Comparison at the Deer Range
Diversion due to the Addition of the Barataria and Pontchartrain Basin Diversions; the Closure
of South Pass, Southwest Pass, and West Bay; and the Dredging of Pass a Loutré to the „oil spill‟
Dimensions for the Proposed Diversions Combined with the Changes to the Delta Distributaries
Study ................................................................................................................................264
Figure 6-175: 2007-2008 Bed Material Transport (Qs) Comparison at the Bohemia Spillway
Diversion due to the Addition of the Barataria and Pontchartrain Basin Diversions; the Closure
of South Pass, Southwest Pass, and West Bay; and the Dredging of Pass a Loutré to the „oil spill‟
Dimensions for the Proposed Diversions Combined with the Changes to the Delta Distributaries
Study ................................................................................................................................265
Figure 6-176: 2007-2008 Relative Bed Material Transport (Qs) Comparison at the Bohemia
Spillway Diversion due to the Addition of the Barataria and Pontchartrain Basin Diversions; the
Closure of South Pass, Southwest Pass, and West Bay; and the Dredging of Pass a Loutré to the
„oil spill‟ Dimensions for the Proposed Diversions Combined with the Changes to the Delta
Distributaries Study .........................................................................................................266
Figure 6-177: 2007-2008 Bed Material Transport (Qs) Comparison at the Buras Diversion due to
the Addition of the Barataria and Pontchartrain Basin Diversions; the Closure of South Pass,
Southwest Pass, and West Bay; and the Dredging of Pass a Loutré to the „oil spill‟ Dimensions
for the Proposed Diversions Combined with the Changes to the Delta Distributaries Study
..........................................................................................................................................268
Figure 6-178: 2007 Relative Bed Material Transport (Qs) Comparison at the Buras Diversion due
to the Addition of the Barataria and Pontchartrain Basin Diversions; the Closure of South Pass,
Southwest Pass, and West Bay; and the Dredging of Pass a Loutré to the „oil spill‟ Dimensions
for the Proposed Diversions Combined with the Changes to the Delta Distributaries Study
..........................................................................................................................................269
Figure 6-179: 2007-2008 Bed Material Transport (Qs) Comparison at Baton Rouge due to the
Addition of the Barataria and Pontchartrain Basin Diversions; the Closure of South Pass,
Southwest Pass, and West Bay; and the Dredging of Pass a Loutré to the „oil spill‟ Dimensions
for the Proposed Diversions Combined with the Changes to the Delta Distributaries Study
..........................................................................................................................................270
Figure 6-180: 2007-2008 Bed Material Transport (Qs) Comparison at Carrollton due to the
Addition of the Barataria and Pontchartrain Basin Diversions; the Closure of South Pass,
Southwest Pass, and West Bay; and the Dredging of Pass a Loutré to the „oil spill‟ Dimensions
for the Proposed Diversions Combined with the Changes to the Delta Distributaries Study
..........................................................................................................................................271
Figure 6-181: 2007-2008 Bed Material Transport (Qs) Comparison at Venice due to the Addition
of the Barataria and Pontchartrain Basin Diversions; the Closure of South Pass, Southwest Pass,
and West Bay; and the Dredging of Pass a Loutré to the „oil spill‟ Dimensions for the Proposed
Diversions Combined with the Changes to the Delta Distributaries Study .....................272

xxiv
Figure 6-182: 2007-2008 Bed Material Transport (Qs) Comparison at Pass a Loutré RS 29 due to
the Addition of the Barataria and Pontchartrain Basin Diversions; the Closure of South Pass,
Southwest Pass, and West Bay; and the Dredging of Pass a Loutré to the „oil spill‟ Dimensions
for the Proposed Diversions Combined with the Changes to the Delta Distributaries Study
..........................................................................................................................................273
Figure 6-183: 2007-2008 Bed Material Transport (Qs) Comparison at Pass a Loutré RS 19 due to
the Addition of the Barataria and Pontchartrain Basin Diversions; the Closure of South Pass,
Southwest Pass, and West Bay; and the Dredging of Pass a Loutré to the „oil spill‟ Dimensions
for the Proposed Diversions Combined with the Changes to the Delta Distributaries Study
..........................................................................................................................................274
Figure 6-184: 2007-2008 Bed Material Transport (Qs) Comparison at Pass a Loutré RS 10 due to
the Addition of the Barataria and Pontchartrain Basin Diversions; the Closure of South Pass,
Southwest Pass, and West Bay; and the Dredging of Pass a Loutré to the „oil spill‟ Dimensions
for the Proposed Diversions Combined with the Changes to the Delta Distributaries Study
..........................................................................................................................................275
Figure 6-185: 2007-2008 Bed Material Transport (Qs) Comparison at Pass a Loutré RS 1 due to
the Addition of the Barataria and Pontchartrain Basin Diversions; the Closure of South Pass,
Southwest Pass, and West Bay; and the Dredging of Pass a Loutré to the „oil spill‟ Dimensions
for the Proposed Diversions Combined with the Changes to the Delta Distributaries Study
..........................................................................................................................................276

xxv
LIST OF TABLES
Table 2-1: MLODS Proposed Diversions with Design Discharge and Diversion Type for
Planning Unit 1 ..................................................................................................................18
Table 2-2: MLODS Proposed Diversions with Design Discharge and Diversion Type for
Planning Unit 2 ..................................................................................................................18
Table 4-1: Initial Boundary Conditions for Existing Diversions and Tributaries .............52
Table 4-2: Original Flow Percentages of Venice for the Passes and West Bay ................53
Table 4-3: Optimized Flow Percentages of Venice for the Passes and West Bay .............53
Table 5-1: RMSE, Bias Error, and RMSE per Average Cross-section Depth for 2007 Calibration
Simulation at the Comparison Gages .................................................................................65
Table 5-2: RMSE, Bias Error, and RMSE per Average Cross-section Depth for 2003 Validation
Simulation at the Comparison Gages .................................................................................66
Table 5-3: RMSE, Bias Error, and RMSE per Average Cross-section Depth for 1999-2000
Validation Simulation at the Comparison Gages ...............................................................67
Table 6-1: Modeled Simulations, Deviations from the 2007 Calibration Simulation, and Target
Flow Rates for the Different Proposed Studies..................................................................71
Table 6-2: Average Percent Increase in Flow to the Passes, Fort St. Philip, Bayou Lamoque
North, and Bayou Lamoque South due to the Closure of West Bay for the West Bay Closure
Study (2007_WB vs. 2007 Calibration).............................................................................91
Table 6-3: Average Percent Increase in Flow to the Passes, Fort St. Philip, Bayou Lamoque
North, and Bayou Lamoque South due to the Closure of South Pass and West Bay for the
Changes to the Delta Distributaries Study (2007_WB_SP vs. 2007_WB) .......................93
Table 6-4: Average Percent Increase in Flow to the Passes, Fort St. Philip, Bayou Lamoque
North, and Bayou Lamoque South due to the Closure of Southwest Pass and West Bay for the
Changes to the Delta Distributaries Study (2007_WB_SWP vs. 2007_WB) ....................94
Table 6-5: Average Percent Increase in Flow to the Passes, Fort St. Philip, Bayou Lamoque
North, and Bayou Lamoque South due to the Closure of South Pass, Southwest Pass, and West
Bay and the Dredging of Pass a Loutré to -50 ft for the Changes to the Delta Distributaries Study
(2007_WB_SP_SWP_pal50 vs. 2007_WB) ......................................................................96
Table 6-6: Average Percent Increase in Flow to the Passes, Fort St. Philip, Bayou Lamoque
North, and Bayou Lamoque South due to the Closure of South Pass, Southwest Pass, and West

xxvi
Bay and the Dredging of Pass a Loutré to -40 ft for the Changes to the Delta Distributaries Study
(2007_WB_SP_SWP_pal40 vs. 2007_WB) ......................................................................98
Table 6-7: Average Percent Increase in Flow to the Passes, Fort St. Philip, Bayou Lamoque
North, and Bayou Lamoque South due to the Alteration of Pass a Loutré to the „oil spill‟
Dimensions for the „oil spill‟ Study (2007-PaL-1242x40 vs. 2007 Calibration) ............100
Table 6-8: Average Increase in Flow to the Passes, Fort St. Philip, Bayou Lamoque North, and
Bayou Lamoque South due to the Alteration of Pass a Loutré to the „oil spill‟ Dimensions for the
„oil spill‟ Study (2007-PaL-1242x40 vs. 2007 Calibration) ............................................100
Table 6-9: Mean and Maximum Difference in Stage due to the Addition of the Buras Diversion
at the Comparison Gages for the Proposed Barataria Basin Diversions Study (2007_WB_B vs.
2007_WB) ........................................................................................................................123
Table 6-10: Mean and Max Difference in Stage due to the Addition of the Jesuit Bend Diversion
at the Comparison Gages for the Proposed Barataria Basin Diversions Study (2007_WB_JB_B
vs. 2007_WB_B)..............................................................................................................127
Table 6-11: Mean and Maximum Difference in Stage due to the Addition of the Myrtle Grove
Diversion at the Comparison Gages for the Proposed Barataria Basin Diversions Study
(2007_WB_JB_MG_B vs. 2007_WB_JB_B) .................................................................131
Table 6-12: Mean and Maximum Difference in Stage due to the Addition of the Deer Range
Diversion at the Comparison Gages for the Proposed Barataria Basin Diversions Study
(2007_WB_JB_MG_DR_B vs. 2007_WB_JB_MG_B) .................................................135
Table 6-13: Mean and Maximum Difference in Stage due to the Addition of the Lagan and
Johnson Diversions at the Comparison Gages for the Proposed Barataria Basin Diversions Study
(2007_WB_JB_MG_DR_B_L_J vs. 2007_WB_JB_MG_DR_B) ..................................138
Table 6-14: Mean and Maximum Difference in Stage due to the Addition of the Lagan and
Johnson Diversions at the Comparison Gages for the Proposed Barataria Basin Diversions Study
(2007_WB_JB_MG_DR_B_L_J vs. 2007_WB).............................................................139
Table 6-15: Mean and Maximum Difference in Stage due to the Addition of the Lagan and
Johnson Diversions at the Comparison Gages for the Proposed Barataria Basin Diversions Study
(2007_WB_JB_MG_DR_B_L_J vs. 2007 Calibration) ..................................................139
Table 6-16: Mean and Maximum Difference in Stage due to the Addition of the Belair Diversion
at the Comparison Gages for the Proposed Pontchartrain Basin Diversions Study (2007_Belair
vs. 2007 Calibration) ........................................................................................................143
Table 6-17: Mean and Maximum Difference in Stage due to the Alteration of the Bohemia
Spillway Diversion at the Comparison Gages for the Proposed Pontchartrain Basin Diversions
Study (2007_Belair-Bohemia vs. 2007_Belair) ...............................................................147

xxvii
Table 6-18: Mean and Maximum Difference in Stage due to the Addition of the Blind River
Diversion at the Comparison Gages for the Proposed Pontchartrain Basin Diversions Study
(2007_Bel-Boh-Blind vs. 2007_Belair-Bohemia) ...........................................................151
Table 6-19: Mean and Maximum Difference in Stage due to the Addition of the Garyville
Diversion at the Comparison Gages for the Proposed Pontchartrain Basin Diversions Study
(2007_Bel-Boh-Bli-Gary vs. 2007_Bel-Boh-Blind) .......................................................155
Table 6-20: Mean and Maximum Difference in Stage due to the Addition of the Violet Diversion
at the Comparison Gages for the Proposed Pontchartrain Basin Diversions Study (2007_Bel-
Boh-Bli-Gary-Vio vs. 2007_Bel-Boh-Bli-Gary) .............................................................159
Table 6-21: Mean and Maximum Difference in Stage due to the Alteration to the Bonnet Carré
Spillway Diversion at the Comparison Gages for the Proposed Pontchartrain Basin Diversions
Study (2007_Bel-Boh-Bli-Gary-Vio-BC vs. 2007_Bel-Boh-Bli-Gary-Vio) ..................163
Table 6-22: Mean and Maximum Difference in Stage due to the Alteration to the Bonnet Carré
Spillway Diversion at the Comparison Gages for the Proposed Pontchartrain Basin Diversions
Study (2007_Bel-Boh-Bli-Gary-Vio-BC vs. 2007 Calibration) ......................................164
Table 6-23: Mean and Maximum Difference in Stage due to the Closure of South Pass and the
Addition of the Proposed Barataria Basin Diversions at the Comparison Gages for the Proposed
Diversions Combined with the Changes to the Delta Distributaries Study (2007_WB_Div_SP vs.
2007_WB_JB_MG_DR_B) .............................................................................................167
Table 6-24: Average Percent Increase in Flow to the Passes, Fort St. Philip, Bayou Lamoque
North, and Bayou Lamoque South due to the Closure of South Pass and the Addition of the
Proposed Barataria Basin Diversions for the Proposed Diversions Combined with the Changes to
the Delta Distributaries Study (2007_WB_Div_SP vs. 2007_WB_JB_MG_DR_B) .....168
Table 6-25: Mean and Maximum Difference in Stage due to the Closure of Southwest Pass and
the Addition of the Proposed Barataria Basin Diversions at the Comparison Gages for the
Proposed Diversions Combined with the Changes to the Delta Distributaries Study
(2007_WB_Div_SWP vs. 2007_WB_JB_MG_DR_B) ..................................................171
Table 6-26: Average Percent Increase in Flow to the Passes, Fort St. Philip, Bayou Lamoque
North, and Bayou Lamoque South due to the Closure of Southwest Pass and the Addition of the
Proposed Barataria Basin Diversions for the Proposed Diversions Combined with the Changes to
the Delta Distributaries Study (2007_WB_Div_SWP vs. 2007_WB_JB_MG_DR_B) ..172
Table 6-27: Average Percent Increase in Flow to the Passes, Fort St. Philip, Bayou Lamoque
North, and Bayou Lamoque South due to the Addition of the Proposed Barataria Basin
Diversions; the Closure of South Pass, Southwest Pass, and West Bay; and the Dredging of Pass
a Loutré to -50 ft for the Proposed Diversions Combined with the Changes to the Delta
Distributaries Study (2007_WB_Div_SP_SWP_pal50 vs. 2007_WB_JB_MG_DR_B) 175

xxviii
Table 6-28: Average Percent Increase in Flow to the Passes, Fort St. Philip, Bayou Lamoque
North, and Bayou Lamoque South due to the Addition of the Proposed Barataria Basin
Diversions; the Closure of South Pass, Southwest Pass, and West Bay; and the Dredging of Pass
a Loutré to -50 ft for the Proposed Diversions Combined with the Changes to the Delta
Distributaries Study (2007_WB_Div_SP_SWP_pal50 vs. 2007_WB) ...........................176
Table 6-29: Average Percent Increase in Flow to the Passes, Fort St. Philip, Bayou Lamoque
North, and Bayou Lamoque South due to the Addition of the Proposed Barataria Basin
Diversions; the Closure of South Pass, Southwest Pass, and West Bay; and the Dredging of Pass
a Loutré to -40 ft for the Proposed Diversions Combined with the Changes to the Delta
Distributaries Study (2007_WB_Div_SP_SWP_pal40 vs. 2007_WB_JB_MG_DR_B) 179
Table 6-30: Average Percent Increase in Flow to the Passes, Fort St. Philip, Bayou Lamoque
North, and Bayou Lamoque South due to the Addition of the Proposed Barataria Basin
Diversions; the Closure of South Pass, Southwest Pass, and West Bay; and the Dredging of Pass
a Loutré to -40 ft for the Proposed Diversions Combined with the Changes to the Delta
Distributaries Study (2007_WB_Div_SP_SWP_pal40 vs. 2007_WB) ...........................180
Table 6-31: Average Percent Increase in Flow to the Passes, Fort St. Philip, Bayou Lamoque
North, and Bayou Lamoque South due to the Addition of the Proposed Barataria Basin
Diversions; the Closure of South Pass, Southwest Pass, and West Bay; the Dredging of Pass a
Loutré to -40 ft; and the Narrowing of Pass a Loutré by 10% for the Proposed Diversions
Combined with the Changes to the Delta Distributaries Study
(2007_WB_Div_SP_SWP_pal40_10% vs. 2007_WB_JB_MG_DR_B) ........................180
Table 6-32: Average Percent Increase in Flow to the Passes, Fort St. Philip, Bayou Lamoque
North, and Bayou Lamoque South due to the Addition of the Proposed Barataria Basin
Diversions; the Closure of South Pass, Southwest Pass, and West Bay; the Dredging of Pass a
Loutré to -40 ft; and the Narrowing of Pass a Loutré by 20% for the Proposed Diversions
Combined with the Changes to the Delta Distributaries Study
(2007_WB_Div_SP_SWP_pal40_20% vs. 2007_WB_JB_MG_DR_B) ........................181
Table 6-33: Average Percent Increase in Flow to the Passes, Fort St. Philip, Bayou Lamoque
North, and Bayou Lamoque South due to the Addition of the Proposed Barataria Basin
Diversions; the Closure of South Pass, Southwest Pass, and West Bay; the Dredging of Pass a
Loutré to -40 ft; and the Narrowing of Pass a Loutré by 30% for the Proposed Diversions
Combined with the Changes to the Delta Distributaries Study
(2007_WB_Div_SP_SWP_pal40_30% vs. 2007_WB_JB_MG_DR_B) ........................181
Table 6-34: Average Percent Increase in Flow to the Passes, Fort St. Philip, Bayou Lamoque
North, and Bayou Lamoque South due to the Addition of the Proposed Barataria Basin
Diversions; the Closure of South Pass, Southwest Pass, and West Bay; and the Replacement of
the Pass a Loutré Cross-sections by Southwest Pass RS 81 for the Proposed Diversions
Combined with the Changes to the Delta Distributaries Study (2007_WB_Div_SP_SWP_pal-
Copy SWP_RS81 vs. 2007_WB_JB_MG_DR_B) .........................................................190

xxix
Table 6-35: Average Percent Increase in Flow to the Passes, Fort St. Philip, Bayou Lamoque
North, and Bayou Lamoque South due to the Addition of the Proposed Barataria Basin
Diversions; the Closure of South Pass, Southwest Pass, and West Bay; and the Replacement of
the Pass a Loutré Cross-sections by a 1,200 ft by 40 ft Rectangular Channel for the Proposed
Diversions Combined with the Changes to the Delta Distributaries Study
(2007_WB_Div_SP_SWP_pal-1200x40 vs. 2007_WB_JB_MG_DR_B) ......................190
Table 6-36: 2007-2008 Mean, Maximum, and Target Discharges for the Proposed Barataria and
Pontchartrain Basin Diversions due to the Addition of the Proposed Barataria and Pontchartrain
Basin Diversions; the Closure of South Pass, Southwest Pass, and West Bay; and the
Replacement of the Pass a Loutré Cross-sections by the „oil spill‟ Dimensions for the Proposed
Diversions Combined with the Changes to the Delta Distributaries Study (07-08-Bara-Pont-WB-
SP-SWP-Pal) ....................................................................................................................195
Table 6-37: 2007-2008 Average Percent Increase in Flow to the Passes, Fort St. Philip, Bayou
Lamoque North, and Bayou Lamoque South due to the Addition of the Proposed Barataria and
Pontchartrain Basin Diversions; the Closure of South Pass, Southwest Pass, and West Bay; and
the Replacement of Pass a Loutré by the „oil spill‟ Dimensions for the Proposed Diversions
Combined with the Changes to the Delta Distributaries Study (07-08-Bara-Pont-WB-SP-SWP-
Pal vs. 2007 Calibration/2008 Validation) .......................................................................196
Table 6-38: April 2008 Stage Values from the 2007 Calibration/2008 Validation and the 07-08-
Bara-Pont-WB-SP-SWP-Pal Simulation at the Bohemia Spillway for the Proposed Diversions
Combined with the Changes to the Delta Distributaries Study .......................................209
Table 6-39: 2007-2008 Mean and Maximum Difference in Stage due to the Addition of the
Proposed Barataria and Pontchartrain Basin Diversions; the Closure of South Pass, Southwest
Pass, and West Bay; and the Replacement of Pass a Loutré by the „oil spill‟ Dimensions at the
Comparison Gages for the Proposed Diversions Combined with the Changes to the Delta
Distributaries Study (07-08-Bara-Pont-WB-SP-SWP-Pal vs. 2007 Calibration/2008 Validation)
..........................................................................................................................................214
Table 6-40: April 2008 Velocity Values from the 2007 Calibration/2008 Validation and the 07-
08-Bara-Pont-WB-SP-SWP-Pal Simulation at the Bohemia Spillway for the Proposed Diversions
Combined with the Changes to the Delta Distributaries Study .......................................227
Table 6-41: 2007-2008 Mean and Maximum Difference in Velocity due to the Addition of the
Proposed Barataria and Pontchartrain Basin Diversions; the Closure of South Pass, Southwest
Pass, and West Bay; and the Replacement of Pass a Loutré by the „oil spill‟ Dimensions at the
Comparison Gages for the Proposed Diversions Combined with the Changes to the Delta
Distributaries Study (07-08-Bara-Pont-WB-SP-SWP-Pal vs. 2007 Calibration/2008 Validation)
..........................................................................................................................................232
Table 6-42: April 2008 Shear Stress Values from the 2007 Calibration/2008 Validation and the
07-08-Bara-Pont-WB-SP-SWP-Pal Simulation at the Bohemia Spillway for the Proposed
Diversions Combined with the Changes to the Delta Distributaries Study .....................245

xxx
Table 6-43: 2007-2008 Mean and Maximum Difference in Shear Stress due to the Addition of
the Proposed Barataria and Pontchartrain Basin Diversions; the Closure of South Pass,
Southwest Pass, and West Bay; and the Replacement of Pass a Loutré by the „oil spill‟
Dimensions at the Comparison Gages for the Proposed Diversions Combined with the Changes
to the Delta Distributaries Study (07-08-Bara-Pont-WB-SP-SWP-Pal vs. 2007 Calibration/2008
Validation) .......................................................................................................................250
Table 6-44: April 2008 Bed Material Transport (Qs) Values from the 2007 Calibration/2008
Validation and the 07-08-Bara-Pont-WB-SP-SWP-Pal Simulation at the Bohemia Spillway for
the Proposed Diversions Combined with the Changes to the Delta Distributaries Study267
Table 6-45: 2007-2008 Mean and Maximum Difference in Bed Material Transport (Qs) due to
the Addition of the Proposed Barataria and Pontchartrain Basin Diversions; the Closure of South
Pass, Southwest Pass, and West Bay; and the Replacement of Pass a Loutré by the „oil spill‟
Dimensions at the Comparison Gages for the Proposed Diversions Combined with the Changes
to the Delta Distributaries Study (07-08-Bara-Pont-WB-SP-SWP-Pal vs. 2007 Calibration/2008
Validation) .......................................................................................................................272

xxxi
ABSTRACT
Land use and engineering alterations along the Mississippi River, such as dams and levees, have
greatly reduced the amount of freshwater and sediment that reaches the Louisiana Coastal Area.
Historically, there was a closer balance between the subsidence rate and deposition rate than
exists today. Several freshwater and sediment diversions have been proposed to combat the land
loss associated with the imbalance between subsidence rates and deposition rates.
To help in this restoration effort, a 1-D numerical model was developed to predict the response
of the river to certain proposed diversions, channel closures, channel modifications, and relative
sea level rise. This study utilized HEC-RAS 4.0, a 1-D mobile-bed numerical model, which was
calibrated using a discharge hydrograph at Tarbert Landing and a stage hydrograph at the Gulf of
Mexico, to calculate the hydrodynamics of the river.
The model showed that RSLR will decrease the capacity of the Lower Mississippi River to carry
bed material.
The model showed that the stages at Carrollton and Baton Rouge are not significantly impacted
by the large scale diversions proposed under the MLODS. Below the Carrollton gage, the
MLODS options will tend to lower the stage rating curve.
The model also indicated that Pass a Loutré can be modified to accommodate the flow from the
South and Southwest Passes and to provide a shorter navigation channel than Southwest Pass.
The amount of annual dredging in Pass a Loutré with the MLODS proposal is expected to be
similar to the current volume in Southwest Pass.
The larger diversions in the MLODS will lower the downstream channel capacity to carry sand.
Since it is generally not possible to maintain the same sand concentrations in the diversion as in
the main channel, the sand concentration immediately downstream of a diversion will tend to be
higher than the carrying capacity of the channel. These two effects will probably lead to
increased shoaling. Therefore, all major water diversions should be accompanied by sediment
diversions.
Keywords: Lower Mississippi River, Unsteady Hydrodynamics, Fixed Bed, Diversions, Coastal
Restoration, HEC-RAS Model

32
CHAPTER 1: INTRODUCTION
Coastal Louisiana is in danger of being washed away and inundated by the Gulf of Mexico
(GOM). Decades of river modifications, powerful hurricanes, resource extraction, and relative
sea level rise have caused major coastal land losses. Alone, it was estimated that Hurricanes
Katrina and Rita transformed approximately 138,900 acres of wetlands into open water, which is
equivalent to 217 square miles (LPBF, 2008). Without the protection of the coastal wetlands,
southern Louisiana, including New Orleans, will be subjected to record high surges similar to or
even greater than the surge from Hurricane Katrina. Neither the community nor the economy
will be able to survive another storm surge like that of Katrina. Figure 1-1 shows the Mississippi
River sediment plume captured by the Moderate Resolution Imaging Spectroradiometer
(MODIS) on board NASA‟s Terra satellite in March of 2001 (Visible Earth, 2010).
Figure 1-1: MODIS Satellite Image of Mississippi River Sediment Plume (Visible Earth, 2010).
Dams, reservoirs, and bank protection structures along the upper Mississippi River (MR) and its
tributaries have reduced the historic sediment load in the Lower MR by more than 50%, which is
a major factor in the land loss in southeastern Louisiana (Meade, 1995). The hydraulic structures
along the Lower MR, which include levees and bank protection, also play a vital role in the
N

33
deterioration of the coast. These structures remove and/or prevent valuable water and sediment
from accumulating downriver to form the MR Delta. There needs to be enough flow in the river
to carry nutrient-rich sediment to the delta, overtop the natural levees, and combat saltwater
intrusion from the GOM, in order to create additional land mass. Other causes of sediment and
water loss include the dredging of the river‟s cross-section for navigation works and the removal
of water for irrigation and water supply systems. Some major outflows include the Bonnet Carré
Spillway, which is used for flood control when the MR stage exceeds 17 ft (NAVD 88) and has a
maximum design capacity of 250,000 cfs; and the natural levee near Bohemia at River Mile
(RM) 38.6, which acts as an overflow weir during high flows.
One way to help surrounding areas maintain or create wetlands is to introduce freshwater and
sediment via diversions. These diversions remove a pre-designed percentage of the river‟s
sediment-laden flow and direct it to specific areas in need of replenishment. Currently there are
several man-made diversions in the MR in the reach between from Tarbert Landing, MS (RM
306) to the Head of Passes (RM 0). These diversions include the Davis Pond Freshwater
Diversion, Caernarvon Freshwater Diversion, White Ditch Siphon, Naomi Siphon, Violet
Siphon, West Pointe a la Hache Siphon, West Bay Sediment Diversion, and Bayou Lamoque
North and South Diversions. Some of these structures are inoperable and need to be repaired or
replaced. Another way to increase wetlands production is to modify the „natural‟ passes. As the
flow in the river heads toward the Gulf of Mexico, it enters distributaries or passes, including
Baptiste Collette, Cubit‟s Gap (mostly Main Pass), Grand Pass and Tiger Pass, Southwest Pass,
South Pass, and Pass a Loutré. However, the amount of flow discharged into each pass is
determined by the geometry of the passes, the energy differential between the upstream and
downstream ends of the pass and to some extend the orientation of the pass with respect to the
current in the River. Southwest Pass, being the deepest and most favorably aligned with the
River, has the highest flow and is primarily used for navigational purposes. Southwest Pass has a
large cross-section, which is maintained by dredging. Since both South Pass and Pass a Loutré
have been experiencing shoaling due to insufficient sediment transport, most of the flow at the
Head of Passes (HOP) is diverted into Southwest Pass. This creates a problem because the outlet
of Southwest Pass is very deep and most of the sediment in the water is lost to the GOM. A
possible remediation for this problem is to close South and Southwest Passes and dredge Pass a
Loutré as a navigational channel, to reduce the amount of sediment that is wasted and to redirect
it into the delta (LPBF, 2008).
The Lake Pontchartrain Basin Foundation (LPBF) has put together a comprehensive report
detailing its Multiple Lines of Defense Strategy (MLODS). The MLODS is a planning
methodology for proposed projects that will help in coastal accretion while also providing flood
protection. Figure 1-2 from the MLODS report shows the areas targeted for restoration. This
study will only consider Planning Units 1 and 2. The diversions included in this study consist of
sustaining diversions (Q < 40,000 cfs), delta-building diversions (Q > 75,000 cfs), and
controlled-crevasse diversions (spillway-type structures) (LPBF, 2008). Figure 1-3 shows the
proposed diversions for Planning Unit 1, as well as the passes‟ closures and modification of Pass
a Loutré, mentioned earlier. Figure 1-4 shows the planned diversions for Planning Unit 2, which
targets the Barataria Basin for restoration.

34
Figure 1-2: Planning Units for the Multiple Lines of Defense Strategy (LPBF, 2008).
Figure 1-3: Proposed MR Diversions and Channel Modifications for Planning Unit 1 from the Multiple Lines
of Defense Strategy (LPBF, 2008).
N
N

35
Figure 1-4: Proposed MR Diversions for Planning Unit 2 from the Multiple Lines of Defense Strategy (LPBF,
2008).
1.1 Objectives and Scope
The purpose of this study is to investigate the impacts of proposed freshwater diversions and
distributary modifications on the discharge and stage along the Lower Mississippi River (MR). A
one dimensional numerical model is proposed to simulate the hydrodynamics of the river and its
existing diversions and distributaries. This model must be calibrated and validated to ensure that
it can reliably predict the present River stage and discharge dynamics. The validated model will
be used to investigate: a) the effects of relative sea level rise on the potential for sediment
transport in the MR; b) the stage and discharges changes that can be expected when the West
Bay diversion is closed; c) the stage and discharges changes that can be expected due to the
closing of South and Southwest Passes and the dredging of Pass a Loutré; d) the impact of the
future diversions, which are presented in Figures 1-3 and 1-4; and e) the impact of the combined
closing of South and Southwest Passes and the dredging of Pass a Loutré in combination with the
proposed diversions.
The following are the specific objectives for Part I of this study:
• To establish a 1-D dynamic model for the entire study area.
• To assess the Lower Mississippi River response to proposed diversions and channel
modifications in the MLODS.
N

36
1.2 General Approach
The 1-D numerical model chosen was HEC-RAS 4.0 (USACE HEC, 2008) because it is a public
domain software and has the capability to treat a large spatial domain and long-term time
predictions. Cross-sectional data from various sources, including the 2003-2004 Hydrographic
Survey (USACE NOD, 2007), were used to replicate the recent channel geometry in the model.
Equivalent channels were developed to account for sparse or missing bathymetric data at several
locations. Inline and lateral structures were inserted to imitate the existing diversion structures.
Daily discharge and stage data were used as boundary conditions. Model parameters, such as
discharge coefficients and flow roughness factors, were altered in order to calibrate the model
based on recorded data. The calibrated model was run for several calendar years to validate the
model parameters.
Relative Sea Level Rise was simulated by Stage data for the downstream boundary conditions
were increased by 1.64, 3.28, and 4.92 ft (0.5, 1.0, and 1.5 m) to predict the effects of relative sea
level rise. The West Bay reach was removed from the model to emulate the closing of that
structure. Lateral structures were added to South and Southwest Passes to stop flow from the MR
entering the channels. Cross-sectional data for Pass a Loutré were altered to imitate the dredging
of that channel. Channels and structures were added to replicate the proposed diversions. Several
scenarios of opening and closing the existing and proposed diversions were simulated. Figure 1-5
shows the schematic of the HEC-RAS model overlaying a satellite view of southern Louisiana
(Pereira et al. 2010).

37
Figure 1-5: HEC-RAS Model Schematic Overlaying Satellite Imagery (Pereira et al. 2010).
1.3 Background and Literature Review
Numerical models are becoming the standard when it comes to analyzing problems in the
hydraulics and coastal industries. Physical models are being abandoned due to geometry
constraints and lack of applicability to alternate problems (Papanicolaou et al. 2008). In 2008,
Louisiana State University‟s (LSU) Small Scale Physical Model (SSPM) of the Lower
Mississippi River (MR) was tested to examine the possibility for freshwater and sediment
diversions. One problem with the SSPM is that the scale for the vertical (1:500) is so much
smaller than the length scale (1:12,000). This represents a distorted scale of 24, which is much
too high to properly quantify mobile bed processes (Waldron, 2008). The necessary space
required for a reliable SSPM could possibly take up an entire street block. Another problem with
LSU‟s SSPM is the accuracy of the model. The gages used for measuring water surface elevation
were showing un-realistic values. Therefore, they had to be resurveyed twice over the course of
the study. It was suggested that the reason for the resurveys could be due to imprecise calibration
of the benchmark elevations and/or possible settlement of the model since its installation.
Waldron (2008) concluded the study saying that the SSPM was an adequate educational tool that
can be effectively used to represent the qualitative responses of the river to proposed diversions.
N

38
1.3.1 Description of Numerical Models
When it comes to numerical models, there are many options to choose from. Depending on the
spatial-temporal capabilities necessary, there are many 1-, 2-, and 3-D models available for use.
A 1-D numerical model has one spatial dimension either along a channel or a water column and
can simulate both steady and unsteady state flows. A 2-D numerical model has two spatial
dimensions, where one is along the channel and the other is along the water column. 2-D models
can also simulate both steady and unsteady state flows, as well as solve steady and unsteady state
mass equations. A 3-D numerical model has 3 spatial dimensions, where one is along the channel
(x), one is along the water column (z), and the other is across the channel (y). 3-D models are
advanced mechanistic models that can simulate steady and unsteady state flows and can make
steady and unsteady state mass computations. However, 3-D models are mostly used for the
unsteady conditions (McCorquodale and Georgiou, 2006).
The term “steady state” refers to a time-independent situation. For example, a river with a
constant flow rate is considered to have a steady state flow because at any point in time the flow
is still the same as it was at the beginning. The term “unsteady state” refers to a time-dependent
situation. For example, an uncontrolled diversion with a varying discharge is considered to have
an unsteady state flow because as the time elapses the flow is constantly changing. The term
“quasi-steady state” refers to a time-dependent situation, where the unsteady conditions are
isolated in time and treated as steady state “events”. For example, sediment transport into a
distributary channel involves unsteady flow, but the shear stress of the bed material can only be
calculated at individual instances in time. For this study, the Mississippi River‟s stage and
discharge were the parameters being considered; therefore, a 1-D unsteady model was sufficient
for the hydrodynamics calculations.
1.3.2 Potential Numerical Models
Numerical modeling is relatively new, but because of the modeling capabilities, such as
predicting hydrodynamics, sediment transport, deposition/scour, and bank failure, they are
becoming more and more popular (Papanicolaou et al. 2008). As a result, there are many 1-D
numerical models to choose from; therefore, to simplify the selection process only the following
models were researched for this study:
CHARIMA
HEC-6
HEC-RAS
MIKE 11
The selection process involves finding a model to best suit the project‟s needs and budget.
McCorquodale and Georgiou (2006) put together a comprehensive list of model parameters to
look for in each model, in order to make choosing a model easier. The model parameters
necessary for this study included:
Cost and Availability
Time and Space Scales

39
Data Requirements and Outputs
Ease of Use and User‟s Manual Quality
Source Code
Interfaces
Processes Included
Precedence in Related Studies
CHARIMA is a general-purpose computer code developed by Holly in 1990 (Holly et al. 1990).
The code is used to model hydrodynamics, sediment transport, and water quality under steady or
unsteady flow conditions. The source code is written in FORTRAN and needs a user-supplied
compiler. The data requirements include American Standard Code for Information Interchange
(ASCII) files for the inputs and outputs. Also, any graphical outputs must be created by the user
in a separate program. The program has a time scale on the order of years and a relatively small
spatial domain. For hydrodynamics simulations, the program solves the de St. Venant equations
of water-continuity and momentum. The model is under continuous development; therefore, it is
not commonly released to outside users, and the source code is not available for altering. There is
a user‟s manual as well as an addendum to provide the user with updated information. There
have been several recent applications using CHARIMA. One such application modeled the
sediment transport of the Mondego River in Portugal. The results of this study indicated a need
for further development of the code because of the existence of trans-critical flow (Pereira et al.
2007).
HEC-6 is a mobile-bed numerical model developed by the U.S. Army Corps of Engineers
Hydraulic Engineering Center (USACE HEC, 1993). The model is used to estimate
hydrodynamics, sediment transport, and amount of deposition/scour. It is a public-domain
model, which is available on the USACE website as a package of executable files. The source
code is written in FORTRAN and can be obtained and altered to fit the user‟s needs. The model
requires a PC-DOS operating system with at least a 640K limit (HEC-6, 2008). Inputs are
entered using a single input data file. The user has to specify what processes to simulate as well
as the level of outputs desired. The user must also provide the software to store and illustrate the
outputs. The program has a variable time scale, which is shorter for flood events and longer for
low flow periods. The spatial domain is relatively small and only allows up to 500 cross-sections
(extended memory version only) (HEC-6, 2008). The model is quasi-steady, which means it
takes continuous flow data and breaks it up into individual instances. The model then calculates
the water surface profile using the 1-D energy equation. Sediment transport and the amount of
deposition and/or scour (Exner equation) are calculated. The model changes the channel
geometry based on the new data. The next flow is then simulated and the procedure is repeated
for each time step. The USACE HEC offers a user‟s manual with a systematic procedure for
writing the input data files (USACE HEC, 1993). HEC-6 is one of the most utilized 1-D
sediment models available.
HEC-RAS River Analysis System is another numerical model developed by the USACE HEC
(2008). The model is used to predict hydrodynamics, sediment transport, and water quality. It is
also a public domain model available on the USACE website; however, it is not an open source
code. HEC-RAS provides a Windows-based graphical user interface where inputs are entered
into tables. The program operates with Microsoft Windows 98, 2000, NT, or XP. The model

40
offers many graphical and tabular outputs. It is capable of making long-term hydrodynamics
predictions and allows a large spatial domain. The model simulates steady and unsteady flow
regimes, as well as quasi-unsteady for the sediment transport module (source code from HEC-6).
For unsteady hydrodynamics calculations, the model solves the equations of continuity and
momentum. USACE HEC provides a comprehensive user‟s manual and reference manual. In
2009, Pereira et al. used HEC-RAS 4.0 to model the same section of the Mississippi River that is
considered in this study.
MIKE-11 is a general river modeling system developed by the Danish Hydraulic Institute (DHI).
The model is primarily used to simulate the hydrodynamics. The software is proprietary (non-
open source) and costs around $3000. The program provides a Windows-based interactive
graphical user interface and operates with Microsoft Windows 98, 2000, NT, or XP (DHI, 2003).
Inputs can be of various data types including ASCII files and spreadsheet programs. The model
also provides graphical and tabular outputs. It is capable of making long-term hydrodynamics
predictions and allows a large spatial domain. The model simulates unsteady and quasi-steady
flow regimes. For the unsteady hydrodynamics module, the model also solves the de St. Venant
equations. A comprehensive user‟s guide and a reference manual are available for assistance
with the purchase of the model. To get the complete experience of what MIKE-11 has to offer,
the user is recommended to purchase the other module packages, which include hydrology, water
quality, advection-dispersion, and cohesive and non-cohesive sediment transport (DHI, 2003). A
recent application of MIKE-11 involved modeling the same study area considered here (Meselhe
et al. 2005).
Two other numerical models were briefly considered for this study. The first model was
FLUVIAL-11, which is a mathematical model used for water and sediment transport routing in
channels (Chang, 1984). The model uses the continuity and momentum equations to calculate the
flow routing. For calibration of the model, Chang (1984) investigated the changes in the width
and depth of a 2-mile reach of the San Dieguito River after several floods. The second model
was MOBED, which is a mobile boundary flow model developed by Krishnappan (1985). The
model uses a generalized expression for the energy slope to determine the unsteady flows.
Validation of the model consisted of comparing laboratory and field data to model-predicted
data.
For the purpose of this study, HEC-RAS Version 4.0 was chosen as the numerical model to
simulate the 1-D unsteady hydrodynamics. Unlike CHARIMA and HEC-6, HEC-RAS and
MIKE-11 offer a graphical user interface which is easier to work with because the user can see
the inputs and spot errors in the data before running a simulation. For HEC-6 and CHARIMA, a
simulation can blow up and it would be difficult to find where the error came from. Also, the
user must provide additional software to view results when using HEC-6 or CHARIMA;
whereas, HEC-RAS and MIKE-11 provide their own graphical and tabular outputs for each
simulation. HEC-6, HEC-RAS, and MIKE-11 were used to model the same MR reach that was
considered in this study. Although MIKE-11 has several advanced capabilities that HEC-RAS
does not have, such as coupling the hydrodynamics module with the hydrology module and
differentiating between sediment transport of cohesive and non-cohesive soils, the cost was too
high for a graduate research study. In the end, HEC-RAS proved to be the best model for this
study.
41
1.3.3 Numerical Modeling of the Lower Mississippi River
Previous 1-D modeling of the MR was conducted for the reach between Tarbert Landing (RM
306) and East Jetty (RM -20) using the Waterways Experiment Station‟s (WES) TABS-1 model
(Copeland and Thomas, 1992). The study investigated the effects that diversions have on
dredging the MR. The sediment transport module was used to predict the patterns of sand
deposition downstream of a diversion by changing the concentration of sediment diverted from
the river. Several diversion site alternatives were tested to compare the river‟s response to the
location of a diversion. The results of the study indicated that the further upstream the diversion
is located, the less dredging will be required because the flow would be high enough to re-
suspend the recently deposited sediment just downstream of the diversion. The study also
showed that the amount of sediment diverted plays an even bigger role in the resulting water
surface and bed deposition because if no sediment were diverted there would not be enough flow
to entrain the deposited sediment and dredging would be increased. In 2000, a supplemental
study was developed using a HEC-6 model of the MR from Tarbert Landing to the Gulf of
Mexico (GOM) via Southwest Pass (Barbé et al. 2000). Barbé et al. (2000) found that not only
did the diversion‟s location and the amount of sediment diverted play important roles in the
deposition and scouring of the river at Southwest Pass, but the sediment transport was also
affected by the operation of the diversion structures themselves.
Another 1-D MR model developed in 2005 considered the reach between Tarbert Landing and
(RM 10.7) using the MIKE-11 numerical model (Meselhe et al. 2005). This study investigated
the hydrodynamics, salinity, water quality, and sediment transport of the river. The model was
calibrated and validated by altering the Manning‟s roughness coefficient, n, with respect to depth
(Meselhe et al. 2005). Meselhe et al. (2005) found that using stage data as both the upstream and
downstream boundary condition improved the calibration results. In 2009, Pereira et al. modeled
the same reach using HEC-RAS 4.0. The model was first used to simulate the hydrodynamics of
the river under unsteady flow conditions. The model was then used to simulate the sediment
transport under quasi-unsteady conditions. Flow roughness factors as well as Manning‟s n values
had to be adjusted for each calibration. This study also used the same datasets as Meselhe for the
calibration procedure (Pereira et al. 2009).
In 2006, a morphodynamic model was presented which tried to capture the sediment transport
processes of the Wax Lake Delta (Parker et al. 2006). The Wax Lake Outlet was a man-made
channel that was overrun by an avulsion in the Atchafalaya River during the 1973 flood. Since
then, the Wax Lake Delta has been growing because the freshwater has been supplying nutrients
to the coastal marshes. The model was tested against field data in order to validate it. The
purpose of Parker et al.‟s (2009) study was to investigate the introduction of freshwater into a
receiving body and quantify the resulting land formations. This study would provide insight for
the design of possible diversions of the MR for similar land building. The results of the study
supported this concept, but Parker et al. (2009) warned that other factors, such as costs and
environmental impacts, have to be assessed before building any diversions in the MR.

42
CHAPTER 2: FEATURES OF THE LOWER MISSISSIPPI RIVER
The Mississippi River (MR) is valuable national and regional resource because of its economic
and industrial contributions. One of the major uses of the MR Basin is navigation. Louisiana is a
major supplier of rice, sugar, salt, lime, sulfur, oil and gas, as well as seafood, beef, and
recreational sports such as fishing and hunting (LCWCRTF, 1997). As a result, the Port of New
Orleans (PNO), located near River Mile (RM) 96, is a major contributor to the economy of
southern Louisiana by exporting these locally produced goods. The PNO is responsible for
approximately 160,500 jobs, $8 billion in income, $17 billion in expenses, and $800 million in
state taxes, according to a 2004 study (Port of New Orleans, 2009).
Navigation is also the primary cause of channel modifications in the river. For years, the river
has accommodated barge traffic bringing goods from the north to the Gulf Coast. As a result, the
MR channel bed has been dredged many times in order to maintain a safe travel course for ships.
Dredging and river training have altered the natural thalweg, or meandering pattern, along the
river. Moreover, the dredge material has been disposed in the deep waters of the Gulf of Mexico
(GOM), where it is wasted or upstream of Pass a Loutré where it may have contributed to
shoaling in this Pass. Wing dikes have also been installed to maintain the channel area and to
prevent erosion of the banks; this river training helps to increase the sediment transport capacity
of the reach and reduce the shoaling in the shipping channel. Along the upper MR, there are 29
lock-and-dam structures, which were mainly constructed for navigation purposes. The depth in
the river would become too shallow to allow barge traffic to safely pass; therefore, the structures
were built to sustain a minimum depth of 9 ft (Meade, 1995). This becomes a problem for the
Lower MR because these dams retain the sediment-laden water, which would ordinarily flow to
the coast.
The river itself is a natural resource because it carries freshwater and sediment to the Louisiana
coast, which uses the nutrient-rich sediment to sustain the wetlands. Artificial levees were built
along almost the entire river in order to control the flow as well as to limit the amount of
flooding to the surrounding communities. One major downfall of trying to control the river is
that now sediment and nutrients are no longer entering the river from runoff because of these
barriers. Similarly, the adjacent areas are no longer getting the sediments and nutrients
freshwater provides during high stages and floods. This does not bode well for the Mississippi
Delta, which relies on the sediment deposition for marsh sustainability. According to Meselhe
(2005), the levees, dams, and navigation works have robbed the wetlands of about 220 million
tons of sediment per year since their installation. Without this sediment, the wetlands cannot be
sustained. It has been projected that in the year 2040 Louisiana will have lost around one million
acres of wetlands and the GOM will have moved inland approximately 33 miles, which would
inundate some communities and leave many other communities along the Lower MR without
freshwater or sources of income (LCWCRTF, 1997). One major project that prevents the course
of the MR from shifting to the Atchafalaya River is the Old River Control structure (RM 315),
which was designed to artificially distribute 30% of the flow to the Atchafalaya River and 70%
of the flow to the MR. According to Ingenierie et al. (1997), if the MR had been allowed to flow
naturally into the Atchafalaya River, then the flow at New Orleans would have been dominated
by tides and saltwater intrusion, which would ultimately deplete the availability of potable water
for the neighboring communities. Therefore, the main objective of the project was to maintain

43
the 1950 distributions of flow and sediment between the MR and Atchafalaya River (Ingenierie
et al. 1997). The project consists of three structures: the Sidney A. Murray Hydroelectric Power
Dam (HPD), the Low Sill Structure (LSS), and the Auxiliary Structure (AUX). Figure 2-1 shows
the three Old River Control structures, along with the Overbank Structure (OVB) used for flood
control, in Google Earth (2010).
Figure 2-1: Google Earth Image of Old River Control Structures (2010).
The dredging of the river is essential for the navigation industry, which helps sustain the
economy of southern Louisiana, and the levees are needed to provide flood protection to the
neighboring communities. However, the marshes are suffering from nutrient depletion because
of these alterations. To save the Louisiana coastal wetlands, several diversions have been
implemented and others have been proposed to direct the freshwater into areas of high need
(LPBF, 2008). One such diversion is the Davis Pond Freshwater Diversion. This diversion
directs much needed freshwater and some sediments to the Barataria Basin, which suffers from
the effects of saltwater intrusion from the GOM (Park, 2002).
HPD OVB
LSS
AUX
Mississippi River

44
This study focuses on the proposed diversions specified by the MLODS (LPBF, 2008). The
numerical model estimates the effects of the proposed diversions on the river‟s stage and
discharge. The ultimate goal was to develop a model to determine the response of the river to the
removal of sediment and freshwater. Based on this and other models, the negative impacts on the
river can be evaluated and minimized.
2.1 The Modeled Reach
The current study incorporated Pereira et al.‟s (2009) channel geometry of the MR from Tarbert
Landing (RM 306) to Venice (RM 10.7), and extended the MR reach to include the HOP (RM
0). Also included in the model were Baptiste Collette (RM 11.5), Cubit‟s Gap (mostly Main
Pass) (RM 3.6), Grand Pass (RM 10.4) and Tiger Pass, Southwest Pass (RM 0), South Pass (RM
0), and Pass a Loutré (RM 0), which were added as distributaries near the end of the MR reach.
In the past, the end of the Pass a Loutré channel was bifurcated by North Pass. However, Google
Earth Imagery (2010) shows that the North Pass channel and several hundred feet of the Pass a
Loutré channel have been washed out. As a result, North Pass and the extreme end of Pass a
Loutré were excluded from the model. Figure 2-2 shows the Google Earth image of the end of
Pass a Loutré in 2004 and Figure 2-3 shows the same image in 2007. The entire HEC-RAS
schematic can be found in Figure 1-5, and the MR Bird‟s Foot Delta in HEC-RAS can be found
in Figure 2-4.

45
Figure 2-2: Google Earth Image of Pass a Loutré and North Pass from 2004 (2010).
Pass a Loutré
North Pass

46
Figure 2-3: Google Earth Image of Pass a Loutré and North Pass from 2007 (2010).
Pass a Loutré
North Pass
washed out

47
Figure 2-4: HEC-RAS Image of Mississippi River Bird’s Foot Delta.
2.1.1 Existing Diversions
There are several existing freshwater and sediment diversions along the MR from Tarbert
Landing to the GOM. Some diversions along the MR include spillways, which are used for the
dissipation of high floods. There are also several man-made channels along the river, which are
primarily used for navigational purposes. For the purpose of this study, these channels are
referred to as diversions because they too provide freshwater to a receiving basin. The following
is a list of all the channels, diversions, and spillways that were included in the model:
Davis Pond Freshwater Diversion
Caernarvon Freshwater Diversion
ICCW at Harvey
ICCW at Chalmette
Bayou Lamoque North
Bayou Lamoque South
Bonnet Carré Spillway
Bohemia Spillway
Violet Siphon
White Ditch Siphon
942 of the 1992 XS's are not Geo-Referenced ( Geo-Ref user entered XS Geo-Ref interpol ated XS Non Geo-Ref user entered XS Non Geo-Ref i nterpolated XS)
Cubit‟s Gap (including
Main Pass)
Pass a Loutré
South Pass
Southwest Pass
West Bay
Sediment
Diversion
Tiger Pass
Grand Pass
Baptiste Collette
Fort St. Philip
Mississippi
River
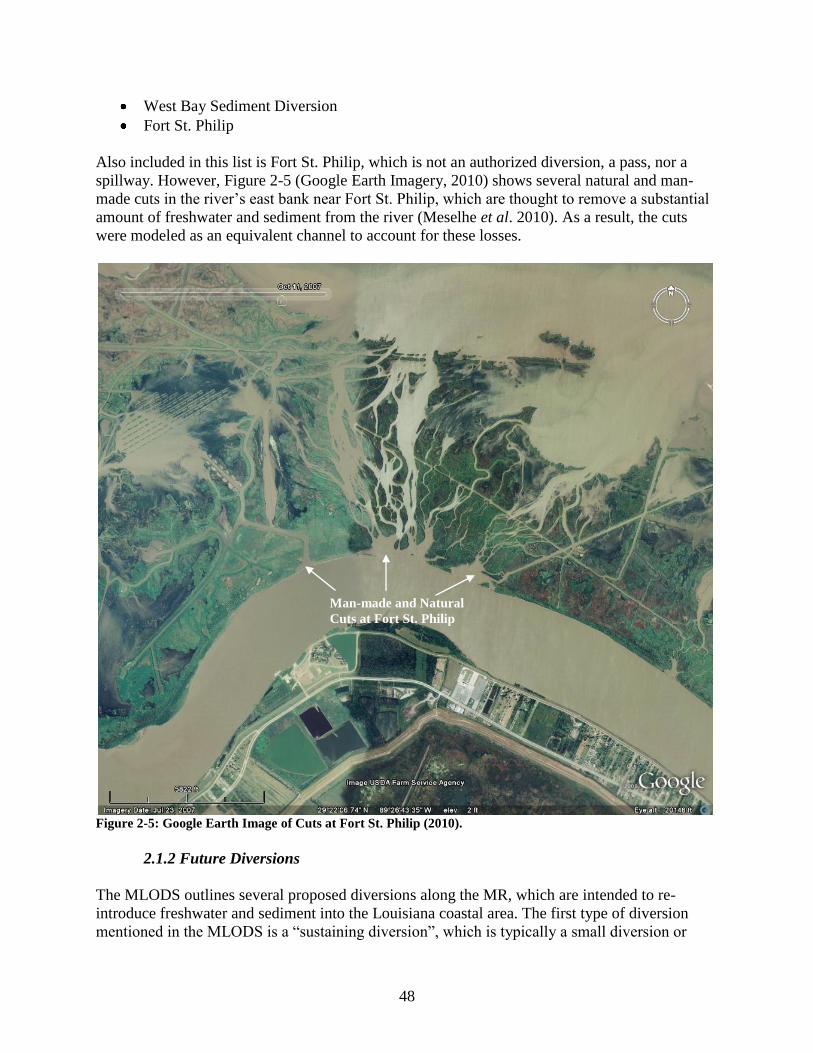
48
West Bay Sediment Diversion
Fort St. Philip
Also included in this list is Fort St. Philip, which is not an authorized diversion, a pass, nor a
spillway. However, Figure 2-5 (Google Earth Imagery, 2010) shows several natural and man-
made cuts in the river‟s east bank near Fort St. Philip, which are thought to remove a substantial
amount of freshwater and sediment from the river (Meselhe et al. 2010). As a result, the cuts
were modeled as an equivalent channel to account for these losses.
Figure 2-5: Google Earth Image of Cuts at Fort St. Philip (2010).
2.1.2 Future Diversions
The MLODS outlines several proposed diversions along the MR, which are intended to re-
introduce freshwater and sediment into the Louisiana coastal area. The first type of diversion
mentioned in the MLODS is a “sustaining diversion”, which is typically a small diversion or
Man-made and Natural
Cuts at Fort St. Philip

49
siphon used to pass water over or through the levees into the neighboring marshes in order to
encourage production and maintain salinity levels. The second type of diversion is a “delta-
building diversion or uncontrolled-crevasse”, which is typically larger than a sustaining diversion
and is used to build wetlands in areas that require flood protection. The third type of diversion is
a “controlled-crevasse diversion”, which is a larger spillway-type diversion used to flood water
and sediment into the estuary during high stage periods. The operation of these three diversion
types can be varied in order to provide the maximum restoration possible. The diversions for
each Planning Unit are designed to beneficially flood the entire basin during high flood years
(LPBF, 2008). Table 2-1 below shows the diversion name, type, and design discharge for each of
the proposed diversions that are considered in this study from Planning Unit 1. Table 2-2 lists the
diversions considered in this study for Planning Unit 2. For both Tables, the number corresponds
to the MLODS project number. Figures 1-3 and 1-4 show the locations of these project sites
along the river.
Table 2-1: MLODS Proposed Diversions with Design Discharge and Diversion Type for Planning Unit 1
(Pontchartrain Basin).
Number Name Proposed
Discharge (cfs) Type
14 Bayou Manchac 200 Sustaining
15 Bayou Braud 200 Sustaining
16 Blind River 8,000 Sustaining
17 Garyville 3,000 Sustaining
18, 19, 20 Bonnet Carré Spillway 10,000 Sustaining
21 Violet 20,000 Sustaining
23 White Ditch 1,000 Sustaining
25 Benney‟s Bay 50,000 Delta-Building
26 Belair 200,000 Delta-Building
27 Bohemia Spillway 200,000 Delta-Building
28 Channel Modifications and Pass Closures 200,000 (min) Delta-Building
Table 2-2: MLODS Proposed Diversions with Design Discharge and Diversion Type for Planning Unit 2
(Barataria Basin).
Number Name Proposed
Discharge (cfs) Type
18 Lagan 1,000 Sustaining
19 Johnson 1,000 Sustaining
21 Jesuit Bend 5,000 Sustaining
22 Myrtle Grove 20,000 Sustaining
23 Deer Range 10,000 Sustaining
24 Buras 59,900 Delta-Building
2.1.3 Miscellaneous
There are several small bayous just downstream of Tarbert Landing (RM 306), which could
support reverse flows and off-channel storage depending on the stage and limb of the MR
hydrograph. In the same vicinity there is also an abandoned oxbow, called Raccourci Island, and

50
several un-leveed areas, which could provide storage during high flows. As a result, these areas
were measured and combined into an equivalent storage area, named Raccourci Island, to
account for this extra capacity. HEC-RAS requires a lateral structure to connect a storage area to
a reach. Therefore, a small weir was designed on the west bank of the MR near RM 296.5 to
route flow from the river during high stage. Figure 2-6 shows the Raccourci Island oxbow, the
two small bayous, and some of the overland storage area from Google Earth (2010).
Figure 2-6: Google Earth Image of Raccourci Island, Small Bayous, and Overland Storage Areas (2010).
2.2 Barataria Basin
In order to ensure that the proposed diversions‟ discharges are not overdesigned, the Barataria
Basin drainage network was included in the model. Freshwater from several tributaries flows
into the Barataria Basin drainage network and is distributed, redistributed, and then reconnected
at Barataria Bay, where the flow then heads into the GOM. The following is a list of major lakes,
channels, and ponds that were included in the model:
Raccourci
Island Oxbow
Small Bayous
Overland
Storage

51
Lake Cataouatche
Lake Salvador
Bayou Rigolettes
Bayou Perot
Little Lake
The Pen
Barataria Bay Waterway
Barataria Bay
Tidal Passes between Barataria Bay and the GOM
The Barataria Basin has several conveyance systems and drainage basins, which include some
existing diversions, channels, ponds, and lakes. The following is a list of these systems (some are
repeated from the “Existing Diversions” section).
Davis Pond Freshwater Diversion
Lac Des Allemands
Petit Lac Des Allemands
Dixie Delta Canal
ICCW at Larose
ICCW at Chalmette
ICCW at Harvey
Wilkinson Canal
The Dixie Delta Canal is a pond located along the ICCW near Larose, LA and has an area of
6400 acres. Also included in this list was Wilkinson Canal, which is not a large contributor to the
Barataria Basin flow. However, the proposed diversion at Myrtle Grove was designed to divert
flow into the canal and subsequently into the basin. Therefore, the canal was included in order to
assist in the addition of the Myrtle Grove diversion. Figure 2-7 shows the Google Earth (2010)
image of the Barataria Basin. Figure 2-8 shows the Barataria Basin in the HEC-RAS model.

52
Figure 2-7: Google Earth Image of Barataria Basin (2010).

53
Figure 2-8: HEC-RAS Image of Barataria Basin.
942 of the 1992 XS's are not Geo-Referenced ( Geo-Ref user entered XS Geo-Ref interpol ated XS Non Geo-Ref user entered XS Non Geo-Ref i nterpolated XS)
Lac Des
Allemands Davis
Pond
Petit Lac Des
Allemands
ICCW
(Larose)
Dixie Delta
Canal
Bayou
Perot
Bayou
Rigolettes
The Pen
Little Lake
Lake Salvador
Lake
Cataouatche
Barataria Bay
Barataria Bay
Waterway
Wilkinson Canal
ICCW
(Harvey) ICCW
(Chalmette)

54
CHAPTER 3: HEC-RAS MODEL
3.1 Overview
In this study, HEC-RAS 4.0, a 1-D numerical model, was used to simulate the hydrodynamics of
the MR under unsteady flow and fixed-bed conditions (USACE HEC, 2008). HEC-RAS is a
public domain model developed by the Hydrologic Engineering Center (HEC) of the U.S. Army
Corps of Engineers, and is an upgrade from its predecessors, HEC-2 and HEC-6. HEC-RAS has
a user interface and graphical outputs. Some of these outputs include tables which show stages,
discharges, velocities, water surface elevations, shear stresses, and other hydrodynamic
properties for each cross-section at user-specified time intervals. Other outputs include stage and
discharge hydrographs, longitudinal flow profiles, rating curves, and cross-sectional flow
profiles. The graphical outputs can also be animated to show how the parameters change at every
user-specified time step. The user interface is organized in dialogue windows that include panels
for geometry, boundary conditions, sediment inputs and water quality inputs. The geometry input
editor can utilize geo-referenced bathymetry and can be displayed with a background map of the
study area. HEC-RAS can make long-term predictions and can handle large scale project areas.
Also, tributary and distributary systems can be modeled as a network. For example, it is possible
to include the complex loop-branch drainage system of the Barataria Basin. Unit options are U.S.
Customary and System International (SI). The model can simulate steady, unsteady and quasi-
unsteady hydrodynamics. It simulates sediment transport under quasi-steady flow regimes.
The unsteady version of HEC-RAS solves the continuity and momentum equation in the stream-
wise direction. Flow splits and confluences are solved iteratively, based on conservation of
energy principles. HEC-RAS can solve subcritical or supercritical flow. There is an option for
mixed flows; however, it must be used with caution.
Additional details of the editor and the theoretical basis for the HEC-RAS model are provided in
Appendix C.

55
CHAPTER 4: MODEL DEVELOPMENT
4.1 Geometry Data1
As stated previously, the cross-sections of the Mississippi River (MR) reach from Tarbert
Landing to Venice were taken from the 2009 HEC-RAS study (Pereira et al. 2009). The
additional cross-sections of the MR from Venice to the HOP, as well as Baptiste Collette,
Cubits‟ Gap (Main Pass), Grand Pass and Tiger Pass, Southwest Pass, South Pass, and Pass a
Loutré, were taken from the 2003-2004 Hydrographic Survey (USACE NOD, 2007). Design
cross-sectional data for the Intracoastal Waterway (ICCW) at Harvey, Chalmette, and Larose and
for the Barataria Bay Waterway were obtained from the 1985 New Orleans Area Map (USACE
MRC, 1985). Google Earth Imagery was used to measure the top widths of several representative
sections along each of these channels. For the Davis Pond channel, the design parameters, such
as bottom width, bottom elevation (NGVD 29), and length, were taken from the project fact
sheet (Project Fact Sheet, 2003), and the top widths of the cross-sections were taken from
Google Earth Imagery. Figure 4-1 shows the Davis Pond channel in Google Earth (2010). Data
for the rest of the Barataria Basin, including Lake Cataouatche, Lake Salvador, Bayou
Rigolettes, Bayou Perot, Little Lake, The Pen, Barataria Bay Waterway, Barataria Bay, Lac Des
Allemands, Petit Lac Des Allemands, and Wilkinson Canal, were extracted from the 2003
LIDAR/bathymetry dataset2 in Tecplot 10. According to Georgiou et al. (2010), this dataset was
a composite of LIDAR topography data from the Louisiana State University Atlas website and
bathymetry data from various sources.
1 A table of all the junctions and their upstream and downstream reaches is presented in Appendix A.
2 Appendix B shows the 2003 LIDAR/bathymetry image for the entire Barataria Basin in Tecplot.

56
Figure 4-1: Google Earth Image of Davis Pond Freshwater Diversion Channel (2010).
4.1.1 Geometry Issues in HEC-RAS
The 2003 LIDAR/bathymetry dataset from Georgiou et al. (2010) was used to obtain the stations
and elevations of the lakes, ponds, and channels in the Barataria Basin. In order to extract the
required information from the LIDAR/bathymetry file, a number of polylines or transects were
needed through each water body. Each polyline represents a user-specified number of data points
consisting of x, y, and z coordinates. The number of transects drawn for each channel depended
on the shape of the water body. If a lake, for example, has an odd shape where the cross-section
rapidly expands or contracts, then several transects would be needed in order to capture the
unique shape of the lake. A normal transect would slice perpendicular to the flow from right to
left. The direction of the slice is important because the USACE has adopted a method of
determining the left and right banks depending on the perspective of the viewer. This method
concludes that the left bank is always the bank that would be on a viewer‟s left side if the viewer
were looking downstream of the water body. Some channels in the LIDAR/bathymetry file are
discontinuous due to mesh constraints. This can be seen in Figure 4-2 for Lac Des Allemands.
Davis Pond Diversion
Structure
Davis Pond Guide
Channel

57
For this case, the portion of the channel near Lake Salvador looks choppy, but in reality, it is not.
Therefore, transects were only drawn through the light green sections, which represent the
channel. The same procedure was repeated for other channels with similar discontinuities.
The upstream section of Lac Des Allemands has an irregular shape, as shown in Figure 4-2.
From the legend, the darker blue color represents a negative depth or positive elevation.
Therefore, a transect across the two upstream “tips” of the lake shows a raised portion (darker
blue) in the center. This higher elevation acts as an island in between two channels and causes a
split flow in the HEC-RAS program. To fix this problem, two reaches were created at the inlet.
The transects for each reach extended from right to left and met at the center of the “island.”
These two reaches were labeled Des Allemands Reach 1 and Des Allemands Reach 2, and
connected to form a third reach called Des Allemands Reach 3. Farther down the lake, near Petit
Lac Des Allemands, the flow splits into two separate channels. As a result, Des Allemands
Reach 4 and Reach 5 were created to account for this separation. These two reaches were
combined to form Des Allemands Reach 6, which connected to Davis Pond Reach Lake
Salvador Left at junction Des Allemands 4. Figure 4-3 shows the Des Allemands reaches in
HEC-RAS.

58
Figure 4-2: Tecplot Image of Lac Des Allemands from 2003 LIDAR/bathymetry
3.
3 Some channels in the LIDAR/bathymetry file are discontinuous due to mesh constraints. This can be seen in
Figure 4-2 for Lac Des Allemands. For this case, the portion of the channel near Lake Salvador looks choppy, but in
reality, it is not. Therefore, transects were only drawn through the light green sections, which represent the channel.
The same procedure was repeated for other channels with similar discontinuities.
Lac Des
Allemands
Lake
Salvador
Petit Lac Des
Allemands

59
Figure 4-3: HEC-RAS Image of Des Allemands Channels and Others.
The Pen is a small artificial lake on the east side of the Barataria Bay Waterway, and connects to
the ICCW near Crown Point via several small canals, as shown in Figure 4-4 (Google Earth
Imagery, 2010). The Pen also connects to the Barataria Bay Waterway at two separate locations.
These two connections resemble small channels. As a result, transects were drawn across each of
them in Tecplot to create two small reaches, which were labeled The Pen Reach 1.5 (top) and
The Pen Reach 2.5 (bottom). The outlet of The Pen, labeled The Pen Reach 3, leads to a marsh
area that connects to Wilkinson Canal (to be discussed later).
942 of the 1992 XS's are not Geo-Referenced ( Geo-Ref user entered XS Geo-Ref interpol ated XS Non Geo-Ref user entered XS Non Geo-Ref i nterpolated XS)
Des Allemands
Reach 1
Des Allemands
Reach 2
Des Allemands
Reach 3
Des Allemands
Reach 4
Des Allemands
Reach 5
Des Allemands
Reach 6
Davis Pond Diversion
Reach 1
Davis Pond Diversion
Reach Lake Cataouatche
Left
Davis Pond Diversion
Reach Lake
Cataouatche Right
Davis Pond Diversion
Reach Lake Salvador
Center
Mississippi
Reach 1
Mississippi
Reach 2

60
Figure 4-4: Google Earth Image of The Pen (2010).
Figure 4-5 shows the LIDAR/bathymetry for Lake Cataouatche (top) and Lake Salvador (center).
From the figure, the downstream section of Lake Cataouatche shows two separate limbs that lead
to Lake Salvador. A single transect across these limbs illustrates an island with a channel on
either side. Therefore, each limb was given its own set of transects to create two distinct
channels. These were labeled Davis Pond Reach Lake Cataouatche Left and Davis Pond Reach
Lake Cataouatche Right, and were combined to form Davis Pond Reach Lake Salvador Center.
The figure also shows that Lake Salvador is split into two separate limbs on the right. Therefore,
Lake Salvador Center was split to form two reaches labeled Davis Pond Reach Lake Salvador
Right and Davis Pond Reach Lake Salvador Left. From the figure, Davis Pond Reach Lake
Salvador Right combines with three other channels at one location4. Two of these three channels
4 For the purpose of this study, the small channel on the immediate right of Lake Salvador (Bayou Segnette
Waterway) was not included because it is not directly connected to the MR and does not contribute a large amount
of flow to the Barataria Basin.
The Pen
Barataria Bay
Waterway
ICCW
Crown Pointe
Inlet
Top
Connection
Bottom
Connection

61
are the ICCW, and the third channel is the Barataria Bay Waterway. HEC-RAS can only
simulate channel splits from one channel into two channels, or channel combinations of two
channels into one channel. As a result, the combination of the four channels was replaced by a
combination of two reaches leading to an intermediate channel which was split into the other two
reaches. The intermediate channel was comprised of two cross-sections from the ICCW. The
upstream junction was labeled Barataria Bay Waterway 1 and connected ICCW Reach 2 and
Barataria Bay Waterway Reach 1. The intermediate reach was labeled ICCW Reach 3 and
connected to a junction labeled Lake Salvador 2. This junction connected ICCW Reach 4 with
Davis Pond Reach Lake Salvador Right. From Figure 4-5, a similar situation occurs at the
second limb of Lake Salvador, which connects with the ICCW and Bayou Perot. Therefore,
Davis Pond Reach 4 was combined with ICCW Reach 4 to form junction ICCW 1. The
intermediate reach, Davis Pond Reach 5, consisted of cross-sections from Lake Salvador, and
combined with ICCW Reach 5 to create Bayou Perot Reach 1 at junction ICCW 2.
Figure 4-5: Tecplot Image of Lake Cataouatche, Lake Salvador, Bayou Rigolettes, Bayou Perot, The Pen,
Barataria Bay Waterway, ICCW, and Dixie Delta Canal from 2003 LIDAR/bathymetry.
Lake
Cataouatche
Lake
Salvador
ICCW
Bayou
Perot
Bayou
Rigolettes
Dixie Delta
Canal
The Pen
Barataria
Bay
Waterway

62
Figure 4-5 shows a wide section of the Barataria Bay Waterway just downstream of The Pen
(Barataria Bay Waterway Reach 4). As a result, transects along this section were collected and
were inserted between the design cross-sections mentioned previously.
As seen in Figure 4-5, Bayous Perot and Rigolettes connect at two places (bottom center).
Initially, transects were taken across both bayous to create a single reach. However, the island in
between the bayous caused a split flow in the HEC-RAS program. As a result, several reaches
were created to account for this setup. The top connection between the bayous was designed as
its own channel with transects from Tecplot and was labeled Bayou Rigolettes Reach 1. Bayou
Perot Reach 1, mentioned previously, was connected to Bayou Perot Reach 2 and Bayou
Rigolettes Reach 1 at junction Bayous P&R 1. The connection from Bayou Rigolettes to the
Barataria Bay Waterway was labeled Bayou Rigolettes Reach 2 and was connected to Bayou
Rigolettes Reach 3 at junction Bayou Rigolettes. The bottom connection between the bayous was
designed as a junction, labeled Bayous P&R 2, which combined Bayou Rigolettes Reach 3 with
Bayou Perot Reach 2. A transect was also taken at the connection and copied to create a small
channel, which was called Bayous P&R Reach 1.
From Figure 4-6, both Bayou Rigolettes and Bayou Perot connect to Little Lake via individual
channels. As a result, two reaches were designed to split from Bayous P&R Reach 1 at junction
Little Lake 1. These channels were labeled Little Lake Reach 1 and Little Lake Reach 2. Due to
the presence of an island in the middle of Little Lake, these two reaches were extended to a
junction, Little Lake 2, by drawing transects through Little Lake up to the island. Downstream of
the island, transects were drawn to create a single reach, Little Lake Reach 3. The lake then splits
into two reaches, where the upper reach, Little Lake Reach 4, is well defined and connects to
Barataria Bay Waterway Reach 4 at the junction Barataria Bay 1. The lower reach, Little Lake
Reach 5, connects to Barataria Bay Reach 2 at junction Barataria Bay 3, but it is not well
defined. Therefore, an equivalent channel was created by taking many transects through that area
and obtaining an average depth and average width. This equivalent channel was added to the
transects of the well-formed portions of the channel to create Little Lake Reach 5.
Also in Figure 4-6, Wilkinson Canal is shown as the small light blue line running north to south
on the immediate left of the legend. The figure also shows shallow water bodies surrounding the
canal, which act as storage areas. An equivalent channel was designed to represent a modified
Wilkinson Canal and was given inline storage to account for this naturally occurring storage
capacity. This equivalent channel was given a depth of 15 ft and a width of 172 ft, and the inline
storage was given a depth of 2 ft and variable width ranging from 80,000 – 90,000 ft (to capture
the surrounding areas). This channel was labeled Wilkinson Canal Reach 1 and was connected to
The Pen Reach 3 at the junction Wilkinson Canal 1. This combination forms the channel
Wilkinson Canal Reach 2, which connects to Barataria Bay Reach 1 at junction Barataria Bay 2.
Figure 4-7 shows the LIDAR/bathymetry image of Barataria Bay, which does not have well-
defined boundaries. As a result, long transects were drawn to capture the full width of the Bay
and extended to the outlets or passes that lead into the GOM. Due to the irregular shape of the
Bay, a small reach was created to account for a small limb extending from the right of the Bay
that could not be accurately represented with the standard transects. This small reach was labeled
Barataria Bay Reach 4 and connected to Barataria Bay Reach 3 at junction Barataria Bay 4.
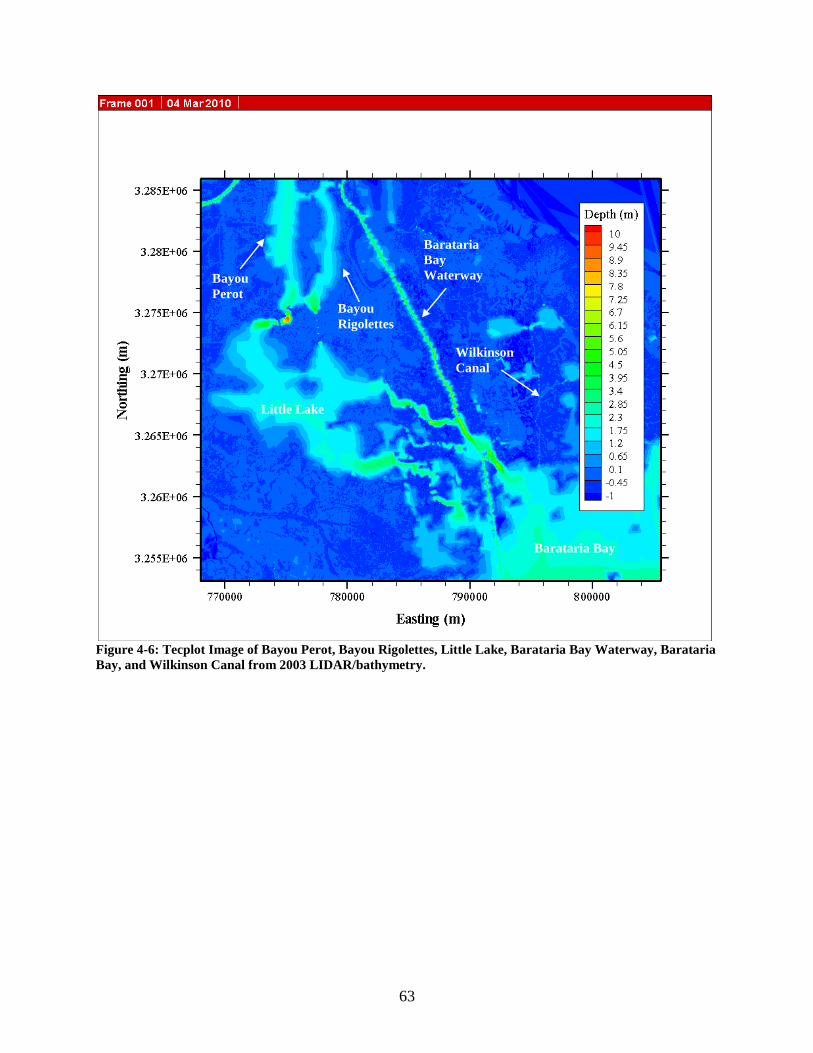
63
Figure 4-6: Tecplot Image of Bayou Perot, Bayou Rigolettes, Little Lake, Barataria Bay Waterway, Barataria
Bay, and Wilkinson Canal from 2003 LIDAR/bathymetry.
Little Lake
Barataria
Bay
Waterway Bayou
Perot Bayou
Rigolettes
Wilkinson
Canal
Barataria Bay

64
Figure 4-7: Tecplot Image of Barataria Bay from 2003 LIDAR/bathymetry.
4.1.2 Geometry Issues with Available Data
Geometry data for several of the channels was not readily available for this study. Also, closer
investigation of the channels identified areas of additional flow capacity. Therefore, alternative
methods for inputting the necessary geometry data were explored and utilized. The method
chosen was creating equivalent channels, which uses Google Earth Imagery and/or the Lacey
Regime Equations5. An equivalent channel is a representative channel that attempts to capture
the flow capacity. The depths of the equivalent channels were either based on the hydraulic
radius of the original channel, where possible, or were estimated using known relative depths in
the area, where original channel data were not available.
Due to insufficient survey data of the Bayou Lamoque channels, equivalent channels were used.
The Lacey Regime Equations, along with top widths obtained from Google Earth, were used to
5 The Lacey Regime Equations are presented in Appendix C.
Barataria
Bay
Gulf of
Mexico

65
create these equivalent channels for Bayou Lamoque North, Bayou Lamoque South, and Bayou
Lamoque. Since HEC-RAS is a 1-D model, the shape of the channels does not matter as long as
the full capacity of the channel is accounted for, including ineffective storage areas. Therefore,
the cross-sections were assumed to be rectangular. The heights of the banks were estimated using
the Google Earth elevation feature, which gives an approximate value. Figure 4-8 shows the
equivalent channels in HEC-RAS. Bayou Lamoque North Reach 1 (top) combines with Bayou
Lamoque South Reach 1 (bottom) to create Bayou Lamoque Reach 1.
Figure 4-8: HEC-RAS Image of Bayou Lamoque North, Bayou Lamoque South, and Bayou Lamoque
Channels.
For the Fort St. Philip reach (RM 19.4), an equivalent channel was created using the top widths
of the cuts from Google Earth Imagery (2010). The cuts extend along the MR from the Ostrica
Lock (RM 25.2) to Baptiste Collette (RM 11.5) and collectively equal 5455 ft wide (Meselhe et
al. 2010). The travel distance from the inlet to the outlet was estimated as 30,000 ft, using the
Google Earth ruler function. The channel depth was varied from 5 ft at the inlet to 3.5 ft at the
outlet. Inline storage was created to account for extra capacity flowing through the marsh during
high flows. Representative widths were measured using Google Earth to define the widths for the
inline areas. The channel width, including inline storage, was expanded from the inlet at 10,379
ft to the outlet at 35,000 ft. Intermediate cross-sections (orange) were calculated using HEC-RAS
RS interpolation. Figure 2-2 shows some of the cuts near Fort St. Philip. Figure 4-9 shows the
equivalent Fort St. Philip channel in HEC-RAS.
983 of the 2033 XS's are not Geo-Referenced ( Geo-Ref user entered XS Geo-Ref interpol ated XS Non Geo-Ref user entered XS Non Geo-Ref i nterpolated XS)
Bayou Lamoque
Reach 1
Bayou Lamoque North
Reach 1
Bayou Lamoque South
Reach 1
Mississippi
Reach 5
Mississippi
Reach 6
Mississippi
Reach 7
Bohemia
Spillway

66
Figure 4-9: HEC-RAS Image of Fort St. Philip Equivalent Channel.
Google Earth Imagery was also used to create an equivalent channel for the Caernarvon
Diversion by measuring the top widths near the diversion structure as well as representative
widths at locations downstream of the diversion up to Breton Sound. A representative length of
142,414 ft was also measured from the inlet at the MR to Breton Sound. The channel depth was
varied from 15 ft at the inlet to 3 ft at the outlet. Inline storage was created for extra capacity,
similar to the Fort St. Philip channel. The channel width, including inline storage, was expanded
from downstream of the diversion structure at 20,548 ft to the Breton Sound outlet at 65,255 ft.
Figure 4-10 shows the equivalent Caernarvon reach in HEC-RAS.
942 of the 1992 XS's are not Geo-Referenced ( Geo-Ref user entered XS Geo-Ref interpol ated XS Non Geo-Ref user entered XS Non Geo-Ref i nterpolated XS)
Mississippi
Reach 7
Mississippi
Reach 8
Fort St. Philip
Reach 1

67
Figure 4-10: HEC-RAS Image of Caernarvon Channel.
Looking closely at the Passes on Google Earth, several avulsions were found, which were
assumed to convey additional capacities that were not originally considered. As a result, the
widths of the avulsions were measured using Google Earth‟s ruler function and extra storage was
created using the Lacey Regime Equations. Equivalent channels were created for Baptiste
Collette, Cubit‟s Gap (including Main Pass), Pass a Loutré, South Pass, and Southwest Pass.
Figure 4-11 shows a close up of Cubit‟s Gap, including Main Pass and its many avulsions,
Octave Pass, Brant Bayou, and Raphael Pass (Google Earth Imagery, 2010). In HEC-RAS,
Cubit‟s Gap was originally designated as a single channel labeled Main Pass, which only took
into account that pass. The updated channel of Main Pass took into account the avulsions along
the pass as well as the other smaller passes. Figure 4-12 shows the original Main Pass channel in
HEC-RAS and Figure 4-13 shows the altered channel. As seen in Figure 4-13, the widths of the
cross-sections increase from the junction at the Mississippi to the end of the channel. This was
done to account for the previous avulsions‟ capacities up to that point along the channel plus the
capacity of the immediate avulsion. Grand Pass was not given an equivalent channel because
only a few small avulsions were visible and they did not appear to be significant relative to the
pass as a whole. Tiger Pass was not given an equivalent channel because the avulsions were so
large that the pass was considered open water after the first 16,000 ft of channel. Figure 4-14
shows the Google Earth image of Grand Pass and Tiger Pass.
942 of the 1992 XS's are not Geo-Referenced ( Geo-Ref user entered XS Geo-Ref interpol ated XS Non Geo-Ref user entered XS Non Geo-Ref i nterpolated XS)
Caernarvon Diversion
Reach 1
Mississippi
Reach 4
Mississippi
Reach 5
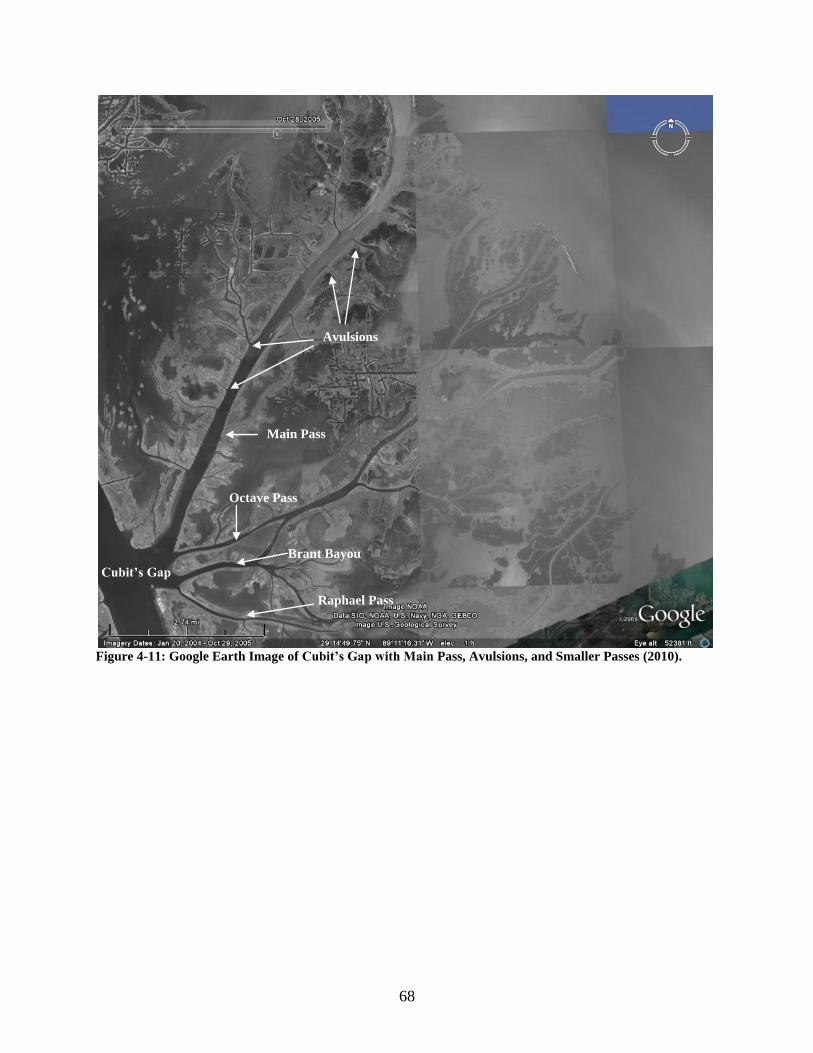
68
Figure 4-11: Google Earth Image of Cubit’s Gap with Main Pass, Avulsions, and Smaller Passes (2010).
Main Pass
Octave Pass
Raphael Pass
Brant Bayou
Cubit’s Gap
Avulsions

69
Figure 4-12: HEC-RAS Image of Original Main Pass Channel.
833 of the 1883 XS's are not Geo-Referenced ( Geo-Ref user entered XS Geo-Ref interpol ated XS Non Geo-Ref user entered XS Non Geo-Ref i nterpolated XS)
Main Pass
Reach 1
Mississippi
Reach 9

70
Figure 4-13: HEC-RAS Image of Altered Main Pass Channel.
942 of the 1992 XS's are not Geo-Referenced ( Geo-Ref user entered XS Geo-Ref interpol ated XS Non Geo-Ref user entered XS Non Geo-Ref i nterpolated XS)
Main Pass
Reach 1
Mississippi
Reach 9

71
Figure 4-14: Google Earth Image of Grand Pass and Tiger Pass (2010).
The West Bay Sediment Diversion (RM 4.9) was drawn as a reach connecting the MR to West
Bay. The actual diversion consists of a deep crevasse extending from the center of the MR
channel to 2600 ft into West Bay (Miller, 2008). Cross-sectional data for the diversion channel
were obtained from USACE NOD (2009) survey data. The diversion channel was cut at an angle
of diversion of 120° in order to create a separation between high-velocity water and low-velocity
water. The purpose was to divert the low-velocity water containing high concentrations of
sediment, which can be found near the bed, into the receiving bay; and to retain the high-velocity
water, which can be found near the surface and near the thalweg, in the river (Andrus, 2007). In
HEC-RAS, West Bay Reach 1 was extended beyond the design length, using wide equivalent
cross-sections, to help the flow transition into open water. The equivalent cross-sections were
created using widths of the Bay from Google Earth and a set depth of -30 ft. Figure 4-15 shows
an image of the West Bay reach in HEC-RAS.
Small Avulsions in
Grand Pass
Large Avulsions in
Tiger Pass

72
Figure 4-15: HEC-RAS Image of the West Bay Sediment Diversion Channel.
4.1.3 Hydraulic Structures
Several hydraulic structures were added to the HEC-RAS model to take into account the effects
of the actual hydraulic structures. Lateral structures were added to route flow out of the system
or into storage areas. Inline structures were added to control the amount of flow entering the
diversions and channels. These hydraulic structures include weirs, gates, and gated spillways.
Lateral structures were added to the model to represent the Bonnet Carré and Bohemia Spillways
(RM 128.6 and RM 38.6, respectively). The Bonnet Carré Spillway structure has 350 gates with
20 ft wide bays. There are 176 bays at a sill elevation of 17 ft and 174 bays with a sill elevation
of 15 ft (McCorquodale et al. 2008). The structure was inputted as sixteen gate groups. A gate
group consists of a maximum of 25 gates. Fourteen of these gate groups contained 348 gates.
The two remaining gate groups were used for leakage purposes (#8 and #16). To stay consistent
with the actual structure, 176 of the gates were inputted with a sill elevation of 17 ft and a gate
height of 10 ft. These gate groups included #1 through #8. The other 174 gates were given a sill
elevation of 15 ft and a gate height of 12 ft. These gate groups included #9 through #16. Gate
group #15 was given only 23 gates to account for the leakage gate in gate group #16. All of the
gates were given a width of 20 ft except for gate groups #8 and #16, which were given widths of
50 ft and 40 ft, respectively. To account for the actual spillway piers, a width of 2 ft was added
between each gate. The weir was designed with an elevation of 30 ft (NAVD 88) to prevent
833 of the 1883 XS's are not Geo-Referenced ( Geo-Ref user entered XS Geo-Ref interpol ated XS Non Geo-Ref user entered XS Non Geo-Ref i nterpolated XS)
West Bay
Reach 1
Mississippi
Reach 9
Grand Pass
Reach 2
Tiger Pass
Reach 1
Mississippi
Reach 11
Mississippi
Reach 10
Main Pass
Reach 1

73
overflow and a length of 7728 ft. Figure 4-16 shows an image of the Bonnet Carré structure in
the HEC-RAS model. The grey area represents the weir and the black and white stripes represent
the gates.
Figure 4-16: HEC-RAS Image of the Bonnet Carré Spillway.
The gates of the Bonnet Carré Spillway were defined as sluice gates and were given a sluice
discharge coefficient of 0.55, which is reasonable (USACE HEC, 2008). The model requires a
weir shape and a weir discharge coefficient. As a result, the ogee weir shape was chosen because
it was most similar to the actual spillway shape, and a weir coefficient of 4.2 was used because it
was near the recommended range (USACE HEC, 2008).
The actual Bohemia structure consists of an elevated road built on a natural levee along the east
bank of the MR from Bohemia at RM 38.6 to the Ostrica Lock at RM 25.2 (LPBF, 2008). In
2005, Hurricane Katrina damaged several sections of the road and breached several culverts,
which allowed excess water to pass through during high flows (LPBF, 2008). Figure 4-17 shows
a breach in the road and metal culverts due to high flows in 2008.
0 2000 4000 6000 8000-120
-100
-80
-60
-40
-20
0
20
40
2007 West Bay Closed Plan: Uns teady_2007_WB_SWP_Closed 3/17/2010
Station (ft)
Ele
va
tion
(ft)
Legend
Ground
Bank Sta

74
Figure 4-17: 2008 Bohemia Spillway Roadway and Culvert Breach (LPBF, 2008).
In the model, the Bohemia structure was depicted by an overflow weir with a constant elevation
of 4 ft (based on calibration of the structure). The structure was inputted as a broad crested weir
with a weir coefficient of 1.8. Bayou Lamoque North and South intersect the Bohemia structure
at RM 32.7 and 32.4, respectively. However, HEC-RAS does not allow a lateral structure to
cross a junction. As a result, three separate lateral structures were developed to operate on either
side of the two Bayous. Because the distance between the Bayous was small, there were no MR
cross-sections to define a reach. As a result, the two cross-sections immediately upstream and
downstream of the Bayous were copied to create a small reach for the lateral structure. A 600 ft
long and 4 ft deep breach was removed from the section of weir in this small reach between the
Bayous to account for losses from the culverts and roadway breaches. Figure 4-18 shows the
image of the upstream Bohemia weir in HEC-RAS. Figure 4-19 shows the image of the middle
Bohemia weir with the missing section in HEC-RAS. Figure 4-20 shows the image of the
downstream Bohemia weir in HEC-RAS.

75
Figure 4-18: HEC-RAS Image of Upstream Section of Bohemia Spillway.
Figure 4-19: HEC-RAS Image of Middle Section of Bohemia Spillway.
0 5000 10000 15000 20000 25000 30000
-150
-100
-50
0
2007 West Bay Closed Plan: Uns teady_2007_WB_SWP_Closed 3/17/2010
Station (ft)
Ele
va
tion
(ft)
Legend
Ground
Bank Sta
0 200 400 600 800 1000 1200 1400
-150
-100
-50
0
2007 West Bay Closed Plan: Uns teady_2007_WB_SWP_Closed 3/17/2010
Station (ft)
Ele
va
tion
(ft)
Legend
Ground
Bank Sta

76
Figure 4-20: HEC-RAS Image of Downstream Section of Bohemia Spillway.
Bayou Lamoque North and South each have their own reach and corresponding gated structure.
For Bayou Lamoque North (RM 32.7), an inline structure was inputted as four gate groups each
with a 10 ft x10 ft sluice gate at a sill elevation of -10 ft (NAVD 88). A distance of 2 ft was
inputted for the width of the structure‟s piers. The sluice discharge coefficient was taken as 0.5
for sluice gate flow. The orifice coefficient for submerged orifice flow was set as 0.8, which is
typical (USACE HEC, 2008). For weir flow, the broad crested weir shape was chosen with a
weir coefficient of 3. The deck of the structure was inputted as a broad crested weir with a length
of 85 ft, an elevation of 8 ft, a width of 73.2 ft, and a weir coefficient of 2.6. For Bayou Lamoque
South (RM 32.4), an inline structure was inputted as four gate groups with a single 12 ft x 12 ft
sluice gate for each having a sill elevation of -12 ft (NAVD 88). A distance of 2 ft was also
inputted for the width of the structure‟s piers. The sluice discharge coefficient, orifice
coefficient, weir shape, and weir coefficient for the gates were the same as Bayou Lamoque
North. The deck of the Bayou Lamoque South structure was given a length of 85 ft, an elevation
of 7 ft, a width of 93.5 ft, and a weir coefficient of 2.6. Figures 4-21 and 4-22 show the Bayou
Lamoque North and South structures in HEC-RAS, respectively.
0 2000 4000 6000 8000 10000-160
-140
-120
-100
-80
-60
-40
-20
0
20
2007 West Bay Closed Plan: Uns teady_2007_WB_SWP_Closed 3/17/2010
Station (ft)
Ele
va
tion
(ft)
Legend
Ground
Bank Sta

77
Figure 4-21: HEC-RAS Image of Bayou Lamoque North Gates.
Figure 4-22: HEC-RAS Image of Bayou Lamoque South Gates.
0 10 20 30 40 50 60 70 80-10
-8
-6
-4
-2
0
2
4
6
2007 West Bay Closed Plan: Uns teady_2007_WB_SWP_Closed 3/17/2010
Station (ft)
Ele
vation
(ft)
Legend
Ground
Bank Sta
0 20 40 60 80 100-12
-10
-8
-6
-4
-2
0
2
4
6
2007 West Bay Closed Plan: Uns teady_2007_WB_SWP_Closed 3/17/2010
Station (ft)
Ele
vation
(ft)
Legend
Ground
Bank Sta

78
For the Davis Pond Freshwater Diversion, an inline structure was entered to represent the actual
gated structure, which consists of four gate groups each with a 14 ft x14 ft sluice gate at a sill
elevation of -12.69 ft (NAVD 88). A distance of 3 ft was designated for the width of the piers
between each gate. The inline structure consisted of four gate groups each with one gate for
operational variability. The sluice discharge coefficient and orifice coefficient were chosen as
0.55 and 0.8, respectively. For weir flow, a broad crested weir shape with a weir coefficient of 3
was chosen. The deck of the actual structure was modeled as a broad crested weir and was given
a length of 356 ft, an elevation of 22 ft, a width of 830 ft, and a weir coefficient of 2.6. The
Davis Pond reach connected to the GOM via Lake Salvador, Lake Cataouatche, Bayou Perot,
Bayou Rigolettes, Little Lake, and Barataria Bay. Figure 4-23 shows the image of the Davis
Pond gated structure in HEC-RAS.
Figure 4-23: HEC-RAS Image of the Davis Pond Freshwater Diversion.
Another inline structure was added to represent the Caernarvon Freshwater Diversion. The
structure included five gate groups each consisting of a single 15 ft x 15 ft sluice gate at a sill
elevation of -15 ft (NAVD 88). A distance of 2 ft was designated for the width of the piers
between each gate. The sluice discharge coefficient and orifice coefficient were set as 0.5 and
0.8, respectively. For weir flow through the gates, a broad crested weir shape with a weir
coefficient of 3 was chosen. The deck of the actual structure was modeled as a broad crested weir
and was given a length of 375 ft, an elevation of 17 ft, a width of 87 ft, and a weir coefficient of
2.6. Figure 4-24 shows the Caernarvon Diversion in HEC-RAS.
0 200 400 600 800 1000-15
-10
-5
0
5
10
15
20
25
2007 West Bay Closed Plan: Uns teady_2007_WB_SWP_Closed 3/17/2010
Station (ft)
Ele
vation
(ft)
Legend
Ground
Bank Sta

79
Figure 4-24: HEC-RAS Image of the Caernarvon Freshwater Diversion.
As mentioned previously, a storage area was added near RM 296.5 to account for additional
storage capacity from the abandoned oxbow at Raccourci Island and from several small bayous
and overland storage areas in the vicinity. The Google Earth Imagery ruler function was used to
measure the top widths of the small bayous connecting to the MR and to measure the surface
areas of the overland storage areas, including the oxbow at Raccourci Island. A cumulative
storage area of 31,050 acres was calculated using the capacities of the bayous found with the
Lacey Regime Equations and the surface areas of the oxbow and overland areas. The HEC-RAS
storage area was given a minimum depth of 0 ft (NAVD 88) to allow it to fill up without
overtopping during high flows. A lateral structure was added to direct the flow from the MR into
the storage area. The structure was inputted as a broad crested weir with an overflow weir
coefficient of 3.1. The weir dimensions were specified as a length of 800 ft, a width of 10 ft, and
an elevation of 47 ft. Figure 4-25 shows the plan view of the storage area and weir for Raccourci
Island in HEC-RAS. Figure 4-26 shows the cross-sectional view of the weir for Raccourci Island
in HEC-RAS.
0 20 40 60 80 100-15
-10
-5
0
5
10
15
20
2007 West Bay Closed Plan: Uns teady_2007_WB_SWP_Closed 3/17/2010
Station (ft)
Ele
vation
(ft)
Legend
Ground
Bank Sta

80
Figure 4-25: HEC-RAS Image of Raccourci Island Storage Area and Weir (Plan View).
Figure 4-26: HEC-RAS Image of Raccourci Island Weir (Cross-section View).
942 of the 1992 XS's are not Geo-Referenced ( Geo-Ref user entered XS Geo-Ref interpol ated XS Non Geo-Ref user entered XS Non Geo-Ref i nterpolated XS)
-200 0 200 400 600 800 1000 1200 1400 1600 1800-40
-20
0
20
40
60
2007 West Bay Closed Plan: Uns teady_2007_WB_SWP_Closed 3/17/2010
Station (ft)
Ele
va
tion
(ft)
Legend
Ground
Bank Sta
Raccourci
Island Storage
Area
Mississippi
Reach 1
Raccourci
Island Weir

81
4.1.4 Channel Roughness
According to Manning‟s Equation (4-1), the flow in a channel is dependent on the roughness of
the channel. Manning defined this roughness with a coefficient, n. The Manning‟s Equation is
written as:
SRAn
cQ 2132'
(4-1)
where:
Q = discharge [cfs or cms]
c’ = conversion factor (= 1.486 for U.S.; = 1.0 for S.I.)
A = cross-sectional area [ft2 or m
2]
R = hydraulic radius ( PA ) [ft or m]
Pw = wetted perimeter [ft or m]
S = bed slope
n = roughness coefficient
It has been established that the roughness is a function of many factors relating to the channel at
hand (Chow, 1959). Chow described the following factors:
Surface Roughness
Vegetation
Channel Irregularities
Channel Alignment
Silting and Scouring
Obstructions
Size and Shape of Channel
Stage and Discharge
Seasonal Change
Suspended Material and Bed Load
According to Chow (1959), the channel surface roughness depends on the grain material of the
wetted perimeter, or the part of the channel under water. It was determined that fine grains result
in a lower n value, and coarse grains result in a higher n value. The contribution of the bed
material grain size to n is proportional to D501/6
, where D50 is the median grain size. The presence
of vegetation in a channel retards the flow through the channel by varying degrees, depending on
height, density, distribution, and type of vegetation. Smaller water depths give higher n values
because the main flow is distributed through the vegetation. High flow depths tend to bend and
submerge the vegetation, which reduces the n value. A lower flow rate produces a high n value
because it requires more energy to pass through or over the vegetation. The steeper the channel
side slopes, the faster the velocity becomes, which in turn compresses the vegetation and lowers
the n value. Other irregularities in the channel bed, such as sand bars and/or deep holes, cause
additional resistance to the flow. Severe meandering also causes additional resistance. Silting or
depositing can fix the channel irregularities and reduce the n value, but scouring does the

82
opposite and can increase the n value. The type of bed material also determines how the bed will
scour. Finer material, like clay, scours non-uniformly and can cause pits or holes, which
increases the n value. Coarser material, like sand or gravel, scours uniformly, which reduces the
n value. Obstructions, such as bridge piers and debris, can increase the value of n, depending on
their nature, size, shape, number, and distribution. Chow (1959) indicated that the size and shape
of the channel were minor factors affecting the channel roughness. As the stage increases during
high flows, inundation of the floodplains takes place, which increases the composite n value
because floodplains typically have a higher n value than the channel. The n value can also
change depending on the season because of the seasonal growth of the vegetation. Lastly,
sediment transport of the suspended material and bed load requires additional energy, which
increases the value of n. Chow (1959) also presented a comprehensive table of Manning‟s n
values for several man-made conduit and channel materials, natural channel materials, vegetation
requirements, and meandering patterns.
The lower MR channel has many meanders, several bridges and groins, bars, deep holes, and
islands, as well as some vegetation (at high flow); in addition, it transports a range of sediment
from coarse sand to fine clays, which altogether causes additional resistance to the flow.
However, it also becomes narrower as it nears the GOM; is for the most part controlled by the
flood protection levees on both sides; has relatively cohesive banks; and has a large depth in
most places, which altogether reduces the amount of resistance to the flow. The n in the MR is
also complicated by the presence of bed forms or sand dunes that vary in height and wave length
as the bed shear in the channel changes. The distribution of bed forms in the channel is both
spatial and temporal. Altogether, these bed forms tend to increase the effective roughness. As a
result, the value of Manning‟s n cannot be accurately measured for the MR. For this study,
values of Manning‟s n ranging from 0.026 to 0.019 were determined by calibration based on
measured flows and stage data.
4.2 Unsteady Flow Data
4.2.1 Initial Conditions6
The initial boundary condition for Mississippi River Reach 1 was a single recorded discharge at
Tarbert Landing for the simulation period of interest. Initial boundary conditions for the existing
diversions in the MR and existing tributaries for the Barataria Basin were estimated based on
recorded discharge data and design discharge capacities. Table 4-1 shows the estimated initial
boundary conditions for these channels for the 2007 calibration period. The flow rates in the
subsequent MR reaches were calculated by subtracting the existing diversions‟ capacities from
the upstream MR reach discharge. HEC-RAS can use the initial flow to compute a steady state
initial stage along the entire river.
6 The initial boundary conditions of all the channels in HEC-RAS for every simulation are presented in Appendix D.

83
Table 4-1: Initial Boundary Conditions for Existing Diversions and Tributaries.
Reach Initial Flow (cfs)
Davis Pond Diversion Reach 1 4,000
Des Allemands Reach 1 250
Des Allemands Reach 2 250
ICCW Harvey Reach 1 100
ICCW Chalmette Reach 1 100
ICCW Reach 5 200
Bayou Lamoque N Reach 1 4,000
Bayou Lamoque S Reach 1 8,000
Wilkinson Canal Reach 1 0 (20,000) 7
Barataria Bay Reach 4 100
Caernarvon Diversion Reach 1 3,000
White Ditch Siphon8 500
Violet Diversion 100 (20,000) 9
The discharges for Des Allemands Reaches 1 and 2 were determined by the hydrology of the
area. The discharges for the ICCW at Harvey and Chalmette were determined based on the lock
operations. For the ICCW at Larose (Reach 5), the discharge was determined based on lock
operations and the flow from Terrebonne via the Gulf Intracoastal Waterway (GIWW). The
discharges for the diversions, including Davis Pond, Caernarvon, White Ditch, and Violet, were
determined based on their nominal flow. Distribution of flow through the Barataria Basin
network was estimated using the ratio of the cross-sectional areas of the two receiving reaches of
a junction. Flow distribution to the passes and West Bay was originally estimated using Acoustic
Doppler Current Profiler (ADCP) values, which were recorded as percentages of the flow at
Venice (Pratt, 2009)10
. These values were then altered using flow optimization in the model. The
original flow distribution for the 2007 calibration is shown in Table 4-2.
7 Wilkinson Canal was originally given an initial boundary discharge of 0 cfs because it was not connected to the
MR; however, the value was changed to 20,000 cfs for the simulations where it was connected to the MR via the
Myrtle Grove Diversion. 8 The White Ditch Siphon was modeled as a lateral inflow hydrograph with a constant daily discharge of 500 cfs
leaving the MR. 9 The Violet Diversion was originally modeled as a lateral inflow hydrograph with a constant daily discharge of 100
cfs leaving the MR to represent the existing siphon; however, the value was changed to 20,000 cfs for the
simulations where a new gated structure was designed. 10
The ADCP charts from Pratt (2009) are shown in Appendix E.

84
Table 4-2: Original Flow Percentages of Venice for the Passes and West Bay.
Reach Flow Percentage of Venice11
Baptiste Collette 12%
Grand Pass 11%
Main Pass 13%
Pass a Loutré 10%
South Pass 10%
Southwest Pass 38%
West Bay 6%
Fort St. Philip12
2%
The flow optimization option in HEC-RAS is an iterative process that attempts to adjust the user-
specified flow for each junction and hydraulic structure (USACE HEC, 2008) in order to satisfy
the need for a unique energy head on the upstream side of the junction. With the optimization
turned on, the discharges calculated in the passes and in the MR (Reaches 7 and 8) were copied
to an external spreadsheet and were compared to the assumed values, which were based on the
initial flow distribution. Based on the percent of MR flow from the HEC-RAS simulation, an
average percentage was retrieved and was used as the new initial flow percentage. Table 4-3
shows the optimized flow percentages for the passes, Fort St. Philip, and West Bay during the
2007 calibration period.
Table 4-3: Optimized Flow Percentages of Venice for the Passes and West Bay.
Reach Flow Percentage of Venice11
Baptiste Collette 15.45%
Grand Pass 10.98%
Main Pass 11.01%
Pass a Loutré 7.78%
South Pass 15.12%
Southwest Pass 34.56%
West Bay 5.10%
Fort St. Philip12
1.39%
4.2.2 Boundary Conditions13
Daily discharges measured at Tarbert Landing were used as the upstream boundary condition for
the MR reach for each of the periods simulated. A single daily stage hydrograph, which included
the 2007 stage and influence of the salinity wedge profile at the GOM, was used as the
downstream boundary condition for Barataria Bay, the passes, the Caernarvon Freshwater
Diversion, Bayou Lamoque, Fort St. Philip, and the West Bay Sediment Diversion for all
simulations except for the relative sea level rise study and the 2007-2008 simulation. For the
11
The station for Venice is located in Mississippi Reach 8, which is used to determine the flow for the passes and
West Bay only. 12
The Fort St. Philip channel was added to Table 4-2 because the amount of flow entering the channel is unknown
and is therefore set as a function of the flow in the MR, specifically in Mississippi Reach 7. 13
The boundary conditions of all the channels and structures in HEC-RAS for every simulation are presented in
Appendix F

85
relative sea level rise study, the stage hydrograph was altered by adding a constant 1.64, 3.28,
and 4.92 ft (0.5, 1.0, and 1.5 m, respectively) for three separate simulations. For the 2007-2008
simulation, the stage hydrograph included the end of the 2007 stage and salinity wedge profile
for the GOM as well as the 2008 stage and salinity profile.
An estimated constant discharge of 500 cfs was assigned to Lac Des Allemands, with 250 cfs for
Lac Des Allemands Reach 1 and 250 cfs for Lac Des Allemands Reach 2. The boundary
condition for the ICCW at Larose (Reach 5) was set as a constant inflow of 200 cfs. The
Raccourci Island storage area was given a constant lateral inflow of 100 cfs to account for inflow
into the river from the neighboring bayous during low stage. Based on operational data for the
White Ditch Siphon and the Violet Diversion, constant lateral outflows of 500 cfs and 100 cfs
were set along the MR at RM 64.5 and 83.9, respectively. The boundary condition for Wilkinson
Canal Reach 1 was set as a constant flow hydrograph of 0 cfs because it was not connected to the
MR. For Barataria Bay Reach 4, the boundary condition was set as a constant flow hydrograph
of 0 cfs because it resembles a still pond.
The Bonnet Carré Spillway gated structure was given a time-series of gate openings boundary
condition. For the simulation periods where the spillway was closed (1999-2000, 2003, and
2007), all of the gate groups were given a height of 0 ft (closed) except for gate group numbers 8
and 16, which were given gate heights of 10 ft and 12 ft (open), respectively, for leakage. For the
2008 opening of the spillway (2007-2008 simulation), gate group numbers 1, 3, 5, 7, 10, 12, 13,
and 14 were opened and closed based on recorded operational data (USACE NOD, 2010). Gate
group #8 was left open for the entire simulation to account for leakage of the unopened gates
during high flows, and gate group #16 was left open for the entire simulation, except during the
actual opening of the spillway, to account for leakage of the opened gates before and after they
were opened.
The elevation controlled gates option was chosen as the boundary condition for both the Davis
Pond Freshwater Diversion and the Caernarvon Freshwater Diversion structures. For the Davis
Pond structure, gate group #2 was left closed for all simulations, based on observed field
operations of the diversion. Gate group numbers 1, 3, and 4 were operated based on trial and
error (see Calibration). For the Caernarvon Diversion, the gate operations were designed by trial
and error (see Calibration) to maintain a discharge in the channel below 8000 cfs, which is the
maximum discharge that is normally allowed.
Both the Bayou Lamoque North and South gated structures were given a time-series of gate
openings boundary condition. For all simulations, the Bayou Lamoque North structure was given
the following operations: gate group #1 was left completely open at 10 ft, gate group #2 was kept
partially open at 6 ft, and gate group numbers 3 and 4 were left fully closed, which coincided
with observed gate operations. Similarly, for Bayou Lamoque South the following gate
operations were inputted for all simulations: gate group #1 was left partially open at 8 ft, and
gate group numbers 2, 3, and 4 were left fully closed, which was based on field observations.

86
4.3 Specific Model Limitations
The model requires an initial discharge for each reach, but for the passes, West Bay, and Fort St.
Philip, the amount of flow diverted by each is unknown. Several studies give approximate
percentages of flow based on upstream known flow data such as, Venice or Tarbert Landing.
Due to the constraints with surveying equipment, it is next to impossible to measure the flow in
each reach at one specific time. Even if all the flows in the passes are measured in a single day,
the change in tide or upstream flow throughout the day could have a large affect on the
subsequent discharges in the passes (Meselhe et al. 2010). Figure 4-27 from Meselhe et al.
(2010) shows a typical study that was used to predict the amount of flow leaving the river.
Approximate values based on this type of study are used, and the optimization feature in the
model is then used to correct these estimates (see Initial Conditions).
Figure 4-27: Distributary Flows between Belle Chasse and Venice for 2003 – 2009 given by ADCP Studies
from West Bay Investigation (Meselhe et al. 2010).
For the 2008 opening of the Bonnet Carré Spillway, the model estimates a peak in the river stage
just before the first gates open, followed by a dip during which all the gates are opened, and then
another peak after the gates are closed. The observed data, however, show a smooth curve with
no peaks or dips for the period when the gates are opened and closed. This discrepancy in the
stage can be seen at locations just upstream of the spillway, and it is carried throughout the river
downstream of the structure. As a result, the actual operation of the structure was disregarded
and the gates were operated to obtain a total discharge leaving the structure equal to the actual
discharge.
y = 6E-06x2 - 0.0123x + 606.12
R2 = 0.7536
0
1000
2000
3000
4000
5000
6000
7000
8000
9000
0 5000 10000 15000 20000 25000 30000 35000 40000
Belle Chasse Q (cms)
Be
lle
Ch
as
se
-Ve
nic
e O
utf
low
Q (
cm
s)

87
CHAPTER 5: HYDODYNAMIC SIMULATIONS
In order to utilize any results from the model simulations, the model had to be calibrated using a
known dataset for one period, and it had to be validated using a dataset from a different period.
After validation and calibration, the model was considered to be serviceable for other
applications. Channel geometry is constantly changing due to natural and man-made factors,
including channel maintenance, sediment transport, floods, and relative sea level rise (Raphelt et
al. 2008). Therefore, the volume or capacity of the channels changes on a seasonal and annual
basis. To minimize the effect of these changes on the calibration and validation, all simulations
were performed for single year events. More than 1000 cross-sections were included in the
model; the available survey data were limited to certain years; therefore, the channel geometry
was kept constant for all simulations and the channel roughness was altered to match the model
output with the recorded data.
5.1 Calibration14
For the calibration procedure, the model was given boundary conditions for the calendar year of
2007, which was a median flow year. The model included the existing diversions at Bonnet
Carré, Bohemia, Davis Pond, Caernarvon, Bayou Lamoque North and South, White Ditch,
Violet, and West Bay. Also included were the passes and the Barataria Basin drainage network.
The boundary condition for the channels leading to the GOM was set at mean sea level (MSL)
(NAVD 88). The Bonnet Carré gates were left closed except for gate group numbers 8 & 16,
which were designed for leakage during high stages.
For the ICCW at Harvey and Chalmette, the flow entering the channel from the MR is small
because of the navigation locks at each. HEC-RAS, however, does not have a lock structure
feature, and therefore, removes more water than it should from the MR at Harvey and Chalmette.
The following procedure was developed to compensate for this: (i) the first three cross-sections
of each were designed as rectangular sections with a depth of 10 ft and a width of 20 ft to
contract the flow entering the channel; (ii) the friction of the channels had to be exaggerated in
order to reduce the amount of flow entering the channels. The first three rectangular cross-
sections of each channel were given an exaggerated Manning‟s n of 0.7, and the rest of the cross-
sections were designated with a Manning‟s n of 0.03, which is typical (USACE HEC, 2008).
Figures 5-1 and 5-2 show the navigation locks at Harvey and Chalmette, respectively.
14
The Manning‟s n value for every reach and cross-section are presented in Appendix G.

88
Figure 5-1: Google Earth Image of the ICCW Lock at Harvey (2010).

89
Figure 5-2: Google Earth Image of the ICCW Lock at Chalmette (2010).
Similarly, the modeled flow diverted from the MR was too high compared to the measured flow
at the Davis Pond Freshwater Diversion and the West Bay Sediment Diversion. To match the
measured flows at these diversions, the Manning‟s n value for Davis Pond was set to an
exaggerated 0.2 for the inflow channel, which included the cross-sections upstream of the gated
structure, and for the first two cross-sections of the guide channel immediately downstream of
the gated structure. This increased friction corrected for the energy loss in the hydraulic jump
downstream of the structure. Figure 4-1 shows the Davis Pond Freshwater Diversion in Google
Earth (2010). For West Bay, the original channel cross-sections were assigned a Manning‟s n of
0.2 to account for the loss due to the angle of diversion which retarded the incoming flow. The
wide equivalent cross-sections were given n values of 0.021 for the banks and 0.023 for the main
channel to account for the deep channel invert. Figure 5-3 shows the West Bay Sediment
Diversion in Google Earth (2010).

90
Figure 5-3: Google Earth Image of the West Bay Sediment Diversion (2010).
The cross-sections of the equivalent channel at Fort St. Philip are representative of the
accumulated individual cuts. As a result, a Manning‟s n of 0.2 was applied to the entire reach to
maintain a low flow throughout the channel, which would be seen in the field. Discharge
records15
from the major passes indicate that up to 30% of the flow in the MR is lost between
Bohemia and Baptiste Collette. According to Meselhe et al. (2010), the amount of flow leaving
the MR at Fort St. Philip is unknown. Therefore, for this model, it was originally estimated that
an average of 2% of this deficit is removed by the cuts at Fort St. Philip on a daily basis. Figure
2-4 shows the cuts at Fort St. Philip in Google Earth (2010).
The Caernarvon Diversion structure was modeled by the “elevation controlled gates” option,
which means the gate opening height depends on the difference in stage of two user specified
cross-sections. Mississippi Reach 4 (RS 81.5) and Caernarvon Reach 1 (RS 20) were chosen as
the two cross-sections to dictate the gate operations. The program requires a stage difference to
15
The passes discharge records are presented in Appendix H.
West Bay Sediment
Diversion Crevasse

91
open the gates and a stage difference to close the gates. For the calibration procedure, these stage
difference values were altered to keep the channel from drying up or overflowing. For the
Caernarvon Diversion, the stage difference values were set at 2 ft to open the gates and 4 ft to
close the gates. Both the gate opening and gate closing speeds were set at 0.1 ft/min. The actual
value of the opening and closing speeds did not matter because the output interval specified was
1 day; therefore, the gates would have opened or closed before the next day. All five gate groups
were given an initial and maximum height of 5 ft to keep the discharge in the channel below
8000 cfs, and the gates were given a minimum gate opening of 2 ft to keep the channel from
drying up. Similarly, the gate operations for gate group numbers 2, 3, and 4 for the Davis Pond
structure were determined based on keeping the peak discharge in the channel below 10,000 cfs,
which is close to the design maximum of 10,650 cfs.
Stage results in the MR were compared to known data from the USACE River Gages website
(Mississippi River & Passes, 2010) at the following locations: Baton Rouge (RM 228.4),
Donaldsonville (RM 175.4), North of Bonnet Carré (RM 129.2), Bonnet Carré Spillway (RM
127.1), Carrollton (RM 102.8), West Pointe a la Hache (RM 48.7), and Venice (RM 10.7). The
computed discharge hydrographs for the passes, Fort St. Philip, and West Bay were collected and
divided by the flow in the MR at Venice to obtain a daily flow percentage. These daily values
were then averaged to find an average flow percentage for each channel. The new average was
multiplied to the initial flow at Venice to obtain the new initial flow at each. These initial flows
were then set as the initial boundary conditions. The amount of flow leaving the MR at the three
Bohemia Spillway structures was collected and summed to get a total flow leaving curve. Also
included on this curve were the total upstream and downstream flow rates in the MR. Figure 5-4
shows the original stage comparison for Carrollton.

92
Figure 5-4: Carrollton Stage Comparison for 2007 Calibration (Original).
The Manning‟s n value was altered along several reaches of the MR to achieve better agreement
between the calculated and the known data. After changing the n values for a particular reach,
the model was run and the results were analyzed. For reaches with a calculated stage (HEC-
RAS) less than the observed stage, the n values were reduced; and for reaches with a calculated
stage above the observed stage, the n values were increased. The range of n values used for the
MR was from 0.026 to 0.019. Appendix G shows the n values for all of the Mississippi reaches,
as well as for the other reaches in the model. Figure 5-5 shows the stage calibration at Carrollton
using the adjusted n values.
0
2
4
6
8
10
12
14
16
10/10/2006 1/18/2007 4/28/2007 8/6/2007 11/14/2007 2/22/2008
Sta
ge
(ft)
Date
Carrollton (Mile 102.8)
Observed Stage (ft)
HEC-RAS Stage (ft)

93
Figure 5-5: Carrollton Stage Comparison for 2007 Calibration (Manning’s n Adjusted).
As previously stated, the roughness of the channels changes with respect to the velocity in the
channel; therefore, the roughness was also altered using flow rated roughness factors16
, which
are multiplied to the Manning‟s n for a specific range of flow values. After analyzing the stage
values, a higher flow roughness factor was applied to reduce the stage values and a lower factor
was applied to increase the stage values. Figure 5-6 shows the stage comparison for Carrollton,
based on the flow roughness factors that were applied throughout the MR.
16
The flow roughness factors are presented in Appendix I.
0
2
4
6
8
10
12
14
10/10/2006 1/18/2007 4/28/2007 8/6/2007 11/14/2007 2/22/2008
Sta
ge
(ft)
Date
Carrollton (Mile 102.8)
Observed Stage (ft)
HEC-RAS Stage (ft)

94
Figure 5-6: Carrollton Stage Comparison for 2007 Calibration (Flow Roughness Factors Included).
This new figure (Figure 5-6) shows a closer agreement to the observed values, but there is a
slight disparity for median to low flows. This difference was assumed to be an effect of the
downstream boundary condition set for the channels leading to the GOM. The initial downstream
boundary condition for these reaches did not account for tides or saltwater intrusion from the
GOM. During high flows, the stage in the Delta is high enough to dampen the effects of the
GOM tides. However, during low flows, the stage in the Delta drops, which causes a more
pronounced tidal affect from the GOM because there is insufficient momentum to counteract the
tide. Also, during high flows, the salt water wedge is forced downstream due to shear stress of
the water heading downstream. However, during low flows, the salt water wedge advances
upstream and ultimately increases the stage in the river due to the differential density effect. For
example, a minimum of 300,000 cfs passing New Orleans is required to keep the saltwater
wedge from infiltrating the water supply intakes (LPBF, 2008). In order to account for these
effects, three steps were taken: (i) three-hour stage data measurements from the GOM for the
calendar year of 2007 were collected and averaged to obtain daily average stage values to
account for the tidal contribution; (ii) hourly surface salinity data from Southwest Pass for the
calendar year of 2007 were obtained and averaged to get a daily surface salinity value. This
value was then depth-averaged based on a diffusive coefficient of 3; (iii) the following equation
was used to calculate the total stage, considering both tidal and salinity influences:
0
2
4
6
8
10
12
14
10/10/2006 1/18/2007 4/28/2007 8/6/2007 11/14/2007 2/22/2008
Sta
ge
(ft)
Date
Carrollton (Mile 102.8)
Observed Stage (ft)
HEC-RAS Stage (ft)

95
1000
s
reftideT
CdSS (5-1)
where:
ST = total stage [ft]
Stide = stage due to tidal influences [ft]
dref = reference depth (= 40 ft)
sC = depth-averaged salinity [ppt]
These new stage values were then entered as the downstream boundary condition for all channels
leading to the GOM. Figure 5-7 shows the new stage comparison at Carrollton, using the new
total daily stage values as the GOM boundary condition.
Figure 5-7: Carrollton Stage Comparison for 2007 Calibration (Tides and Salinity Included).
Figure 5-7 shows a better agreement throughout, especially during March through May. During
those periods on the previous graphs (Figures 5-4, 5-5, and 5-6), the measured stage did not
capture the peaks and troughs. As a result, the new stage values were set as the downstream
boundary condition for all simulations for the calendar year of 2007. The new stage hydrograph
is presented in Appendix F with the boundary conditions.
0
2
4
6
8
10
12
14
10/10/2006 1/18/2007 4/28/2007 8/6/2007 11/14/2007 2/22/2008
Sta
ge
(ft)
Date
Carrollton (Mile 102.8)
Observed Stage (ft)
HEC-RAS Stage (ft)

96
To determine the accuracy or validity of the model, the root mean square error (RMSE) and bias
error between the calculated and observed data were measured. The equations for the RMSE and
the bias error are as follows:
N
zzRMSE dobsel
2
'mod (5-2)
N
zzBiasError dobsel 'mod (5-3)
where:
z model = stage value calculated by the model
zobs’d = stage value observed in the field
N = number of observations
The RMSE, bias error, and RMSE per average cross-section depth were calculated for the 2007
calibration. Table 5-1 shows these errors for each comparison gage.
Table 5-1: RMSE, Bias Error, and RMSE per Average Cross-section Depth for 2007 Calibration Simulation
at the Comparison Gages.
Parameter
/ Gage
Baton
Rouge Donaldsonville
North of
Bonnet
Carré
Bonnet
Carré Carrollton
West
Pointe a
la Hache
Venice
RMSE (ft) 1.19 0.81 0.70 0.75 0.46 0.46 1.00
Bias Error
(ft) -0.80 0.36 0.49 0.42 0.08 0.13 -0.89
RMSE/Avg
Depth 2.73% 1.74% 0.92% 1.34% 0.73% 0.71% 2.03%
The average RMSE was 0.75 ft or 1.5% of the average depth; the average bias error was zero for
the calibration record.
5.2 Validation
For the validation procedure, the model was given boundary conditions for the calendar years of
2003, which was a high flow year, and 1999-2000, which had both high and low flows. The 2003
validation included all the major passes, the Barataria Basin drainage network, and the existing
diversions similar to the calibration procedure except for the White Ditch Siphon, which was
inoperable at the time (BS-12, n.d.). Also, the West Bay Sediment Diversion was given an inline
structure to prevent flow from being diverted from the MR until November of 2003, which was
when the construction was completed and the diversion was officially opened (Guilbeau, n.d.).
The boundary condition for the channels leading to the GOM was set as the 2007 calibration
GOM stage, including the tidal and salinity effects, because GOM stage and salinity data were
not readily available for the calendar year of 2003. Figure 5-8 shows the stage comparison at
Carrollton for the 2003 validation. Table 5-2 shows the RMSE, bias error, and RMSE per
average cross-section depth for the 2003 validation.

97
Figure 5-8: Carrollton Stage Comparison for 2003 Validation.
Table 5-2: RMSE, Bias Error, and RMSE per Average Cross-section Depth for 2003 Validation Simulation at
the Comparison Gages.
Parameter
/ Gage
Baton
Rouge Donaldsonville
North of
Bonnet
Carré
Bonnet
Carré Carrollton
West
Pointe a
la Hache
Venice
RMSE (ft) 1.76 1.36 N/A 0.98 0.78 0.52 1.06
Bias Error
(ft) -0.25 0.31 N/A 0.46 0.19 -0.12 -0.97
RMSE/Avg
Depth 4.02% 2.88% N/A 1.77% 1.22% 0.81% 2.16%
The 1999-2000 validation included all the major passes, the Barataria Basin drainage network,
and the existing diversions except for the following: (i) the West Bay Sediment Diversion was
not constructed yet (Guilbeau, n.d.); (ii) the Davis Pond Freshwater Diversion was not
constructed yet (DPFDP, 2002); (iii) the White Ditch Siphon was inoperable (BS-12, n.d.). Since
the Davis Pond Diversion was not open, the cross-sections for the inflow and guide channels and
the ponding area were removed up to Lake Cataouatche, and a local runoff daily flow
hydrograph of 150 cfs was set as the upstream boundary condition. The West Bay Diversion
channel was completely removed from the model. The inflow hydrograph at White Ditch was
0
2
4
6
8
10
12
14
16
12/10/2002 3/20/2003 6/28/2003 10/6/2003 1/14/2004 4/23/2004
Sta
ge
(ft)
Date
Carrollton (Mile 102.8)
Observed Stage (ft)
HEC-RAS Stage (ft)

98
also removed from the boundary conditions. Figure 5-9 show the stage comparison at Carrollton
for the 1999-2000 validation.
Figure 5-9: Carrollton Stage Comparison for 1999-2000 Validation.
Figures 5-8 and 5-9 show good agreement between the observed and calculated stage; therefore,
the Manning‟s n values and flow roughness factors did not have to be re-evaluated. Table 5-3
shows the RMSE, bias error, and RMSE per average cross-section depth for the 1999-2000
validation. The average RMSE was 0.9 ft or 2% of the average depth; the average bias error was
zero for the validation runs.
Table 5-3: RMSE, Bias Error, and RMSE per Average Cross-section Depth for 1999-2000 Validation
Simulation at the Comparison Gages.
Parameter
/ Gage
Baton
Rouge Donaldsonville
North of
Bonnet
Carré
Bonnet
Carré Carrollton
West
Pointe a
la Hache
Venice
RMSE (ft) 0.93 0.90 N/A 0.94 0.71 0.53 0.72
Bias Error
(ft) -0.09 0.44 N/A 0.58 0.25 0.26 -0.52
RMSE/Avg
Depth 2.29% 2.05% N/A 1.67% 1.16% 0.80% 1.46%
0
2
4
6
8
10
12
14
16
18
7/24/1998 2/9/1999 8/28/1999 3/15/2000 10/1/2000 4/19/2001
Sta
ge
(ft)
Date
Carrollton (Mile 102.8)
Observed Stage (ft)
HEC-RAS Stage (ft)

99
5.3 Model Limitations
The original calibration simulation was set up for the 2007-2008 high flood year. The daily stage
hydrograph at Tarbert Landing (RM 306) was used as the upstream boundary condition for the
MR. The GOM daily salinity stage hydrograph for the period of December 19, 2007 to June 27,
2008 was used as the downstream boundary condition. All other boundary conditions were the
same as the 2007 calibration. In 2008, 160 of the bays of the Bonnet Carré Spillway were opened
due to high stage in the river (USACE NOD, 2010). The gates in the model were given a time-
series gate opening boundary condition, and the actual daily operations were replicated in the
model for the period from April 11, 2008 to May 8, 2008. Figure 5-10 shows the stage
comparison at Carrollton for the observed spillway opening and the calculated spillway opening.
Figure 5-10: Carrollton Stage Comparison for 2007-2008 Simulation.
The disparity at peak flow was consistently observed throughout the MR starting at the gage at
North of Bonnet Carré (RM 129.2) and continuing to the gage at Venice (10.7). Also, the
original operation of the gates in HEC-RAS involved increasing the gate height from 0 ft at day
zero to the recommended gate height at day 1. Gate heights were calculated based on the number
of gates actually opened per day. For days where twenty five or more gates were opened, an
entire gate group, which consists of twenty five gates, was given its respective gate height (10 or
12 ft). To account for days with less than or more than twenty five gates opened, the gate height
0
2
4
6
8
10
12
14
16
18
20
11/14/2007 1/3/2008 2/22/2008 4/12/2008 6/1/2008 7/21/2008
Sta
ge
(ft)
Date
Carrollton (Mile 102.8)
Observed Stage (ft)
HEC-RAS Stage (ft)

100
for one gate group was proportioned to allow the same cross-sectional area that was provided by
the actual gates. The following equation was used to calculate the recommended gate heights.
GG
AG
PN
HNH (5-4)
where:
HP = proportioned gate height [ft]
NAG = number of gates actually opened
H = height of gate group gates (10 or 12 ft)
NGG = number of gates per gate group
From the discharge hydrograph, the closing of the actual gates began on April 26, 2008 and
ended on May 8, 2008. Therefore, the gates in the model were closed using a linear series in
Microsoft Excel for those dates. The discharge hydrograph comparison for the flow leaving the
gates was not agreeable using these gate operations. Therefore, the model gates were operated by
trial and error to achieve a total discharge leaving the river during the opening similar to that of
the actual discharge leaving. The trial and error process consisted of increasing the proportioned
gate heights to allow more flow to leave the system. Also, the closing of the model gates was
altered to have several gate groups fully closed before May 8. Figure 5-11 shows the daily
discharge hydrograph comparison for the 2008 gate opening using the new gate operations.
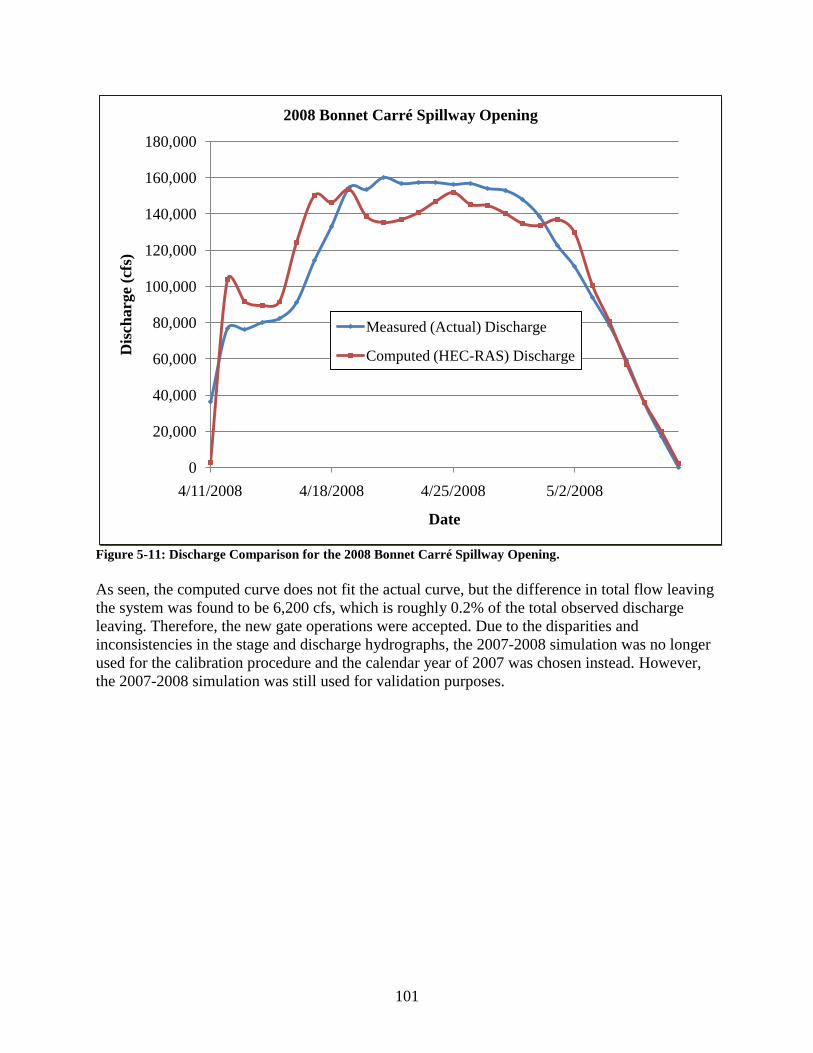
101
Figure 5-11: Discharge Comparison for the 2008 Bonnet Carré Spillway Opening.
As seen, the computed curve does not fit the actual curve, but the difference in total flow leaving
the system was found to be 6,200 cfs, which is roughly 0.2% of the total observed discharge
leaving. Therefore, the new gate operations were accepted. Due to the disparities and
inconsistencies in the stage and discharge hydrographs, the 2007-2008 simulation was no longer
used for the calibration procedure and the calendar year of 2007 was chosen instead. However,
the 2007-2008 simulation was still used for validation purposes.
0
20,000
40,000
60,000
80,000
100,000
120,000
140,000
160,000
180,000
4/11/2008 4/18/2008 4/25/2008 5/2/2008
Dis
charg
e (c
fs)
Date
2008 Bonnet Carré Spillway Opening
Measured (Actual) Discharge
Computed (HEC-RAS) Discharge

102
CHAPTER 6: APPLICATIONS
6.1 Modeling Schemes
The purpose of this study was to create a river response model that would help in the estimation
of the impacts that coastal restoration and management efforts would have on the lower
Mississippi River (MR). Therefore, several cases were simulated using the existing diversions,
proposed distributary closures, possible channel modifications, and proposed diversions. In
Chapter 2, Tables 2-1 and 2-2 show the MLODS proposed diversions and channel modifications.
Table 6-1 is a list of the modeled studies along with any deviations from the 2007 calibration and
the target flow rates for the proposed diversions.
Table 6-1: Modeled Simulations, Deviations from the 2007 Calibration Simulation, and Target Flow Rates for
the Different Proposed Studies.
Simulation Deviations from 2007 Calibration
Simulation
Target
Flow
Rate, cfs
2007_RSLR_0.5 GOM stage boundary condition raised by
1.64 ft (0.5 m) -
2007_RSLR_1.0 GOM stage boundary condition raised by
3.28 ft (1.0 m) -
2007_RSLR_1.5 GOM stage boundary condition raised by
4.92 ft (1.5 m) -
2007_WB West Bay channel removed -
2007_WB_SP Same as 2007_WB with South Pass
channel closed -
2007_WB_SWP Same as 2007_WB with Southwest Pass
channel closed -
2007_WB_SP_SWP_pal50
Same as 2007_WB with South and
Southwest Passes closed and Pass a Loutré
dredged to -50 ft
-
2007_WB_SP_SWP_pal40 Same as 2007_WB_SP_SWP_pal50 with
Pass a Loutré dredged to -40 ft -
2007-PaL-1242x40
Pass a Loutré replaced by 1,242 ft (top
width) by 40 ft (depth) trapezoidal channel
with 1:6 side slopes
-
2007_WB_B Same as 2007_WB with Buras channel
included 59,900
2007_WB_JB_B Same as 2007_WB_B with Jesuit Bend
channel and gated structure included 5,000
2007_WB_JB_MG_B
Same as 2007_WB_JB_B with Myrtle
Grove channel and gated structure
included
20,000
2007_WB_JB_MG_DR_B
Same as 2007_WB_JB_MG_B with Deer
Range channel and gated structure
included
10,000

103
Table 6-1 Continued.
2007_WB_JB_MG_DR_B_L_J
Same as 2007_WB_JB_MG_DR_B with
inflow hydrographs at Lagan and Johnson
included
2,000
2007_Belair Overflow weir at Belair included 200,000
2007_Belair-Bohemia Same as 2007_Belair with 4,150 ft by 3 ft
cut in Bohemia Spillway 200,000
2007_Bel-Boh-Blind Same as 2007_Belair-Bohemia with Blind
River gated structure included 8,000
2007_Bel-Boh-Bli-Gary Same as 2007_Bel-Boh-Blind with
Garyville gated structure included 3,000
2007_Bel-Boh-Bli-Gary-Vio Same as 2007_Bel-Boh-Bli-Gary with new
Violet gated structure 20,000
2007_Bel-Boh-Bli-Gary-Vio-BC
Same as 2007_Bel-Boh-Bli-Gary-Vio with
longer gate heights at Bonnet Carré
Spillway
10,000
2007_WB_Div_SP Same as 2007_WB_JB_MG_DR_B with
South Pass closed -
2007_WB_Div_SWP Same as 2007_WB_ JB_MG_DR_B with
Southwest Pass closed -
2007_WB_Div_SP_SWP_pal50
Same as 2007_WB_ JB_MG_DR_B with
South and Southwest Passes closed and
Pass a Loutré dredged to -50 ft
-
2007_WB_Div_SP_SWP_pal40 Same as 2007_WB_Div_SP_SWP_pal50
with Pass a Loutré dredged to -40 ft -
2007_WB_Div_SP_SWP_pal40_10% Same as 2007_WB_Div_SP_SWP_pal40
with Pass a Loutré narrowed by 10% -
2007_WB_Div_SP_SWP_pal40_20% Same as 2007_WB_Div_SP_SWP_pal40
with Pass a Loutré narrowed by 20% -
2007_WB_Div_SP_SWP_pal40_30% Same as 2007_WB_Div_SP_SWP_pal40
with Pass a Loutré narrowed by 30% -
2007_WB_Div_SP_SWP_pal-Copy
SWP_RS81
Same as 2007_WB_Div_SP_SWP_pal40
with Pass a Loutré replaced by Southwest
Pass RS 81
-
2007_WB_Div_SP_SWP_pal-
1200x40
Same as 2007_WB_Div_SP_SWP_pal40
with Pass a Loutré replaced by 1,200 ft by
40 ft rectangular channel
-
07-08-Bara-Pont-WB-SP-SWP-Pal
All MLODS diversions included with
West Bay, South Pass, and Southwest Pass
closed, Pass a Loutré replaced by 1,242 ft
(top width) by 40 ft (depth) trapezoidal
channel with 1V:6H side slopes, and
boundary conditions from the entire 2007
flow record and the 2008 flow record from
January 1 through June 27
~540,000
(max)

104
6.2 Results
6.2.1 Relative Sea Level Rise Study
This study was performed to predict the effects of relative sea level rise from the Gulf of Mexico
(GOM) on the Mississippi River (MR). The 2007 GOM boundary condition was raised by 1.64,
3.28, and 4.92 ft (0.5, 1.0, and 1.5 m). The parameters under consideration were shear stress, to
determine the sediment transport potential, and the discharge and water surface elevation, to
create a rating curve. These parameters were checked at the following locations along the MR:
Violet (RM 83.9), Belle Chasse (RM 76), Myrtle Grove (RM 59.3), and West Pointe a la Hache
(RM 48.7). Figures 6-1, 6-2, 6-3, and 6-4 show the shear stress results for each of these locations
for the existing River geometry.
Figure 6-1: Shear Stress Comparison at Violet for the Relative Sea Level Rise Study.
0
0.01
0.02
0.03
0.04
0.05
0.06
0.07
0.08
0.09
0.1
1/1/2007 3/1/2007 5/1/2007 7/1/2007 9/1/2007 11/1/2007
Sh
ear
Str
ess
(psf
)
Date
Violet (Mile 83.9)
Original
RSLR + 0.5m
RSLR + 1.0m
RSLR + 1.5m

105
Figure 6-2: Shear Stress Comparison at Belle Chasse for the Relative Sea Level Rise Study.
0
0.01
0.02
0.03
0.04
0.05
0.06
0.07
0.08
0.09
0.1
1/1/2007 3/1/2007 5/1/2007 7/1/2007 9/1/2007 11/1/2007
Sh
ear
Str
ess
(psf
)
Date
Belle Chasse (Mile 76)
Original
RSLR + 0.5m
RSLR + 1.0m
RSLR + 1.5m

106
Figure 6-3: Shear Stress Comparison at Myrtle Grove for the Relative Sea Level Rise Study.
0
0.01
0.02
0.03
0.04
0.05
0.06
0.07
0.08
0.09
0.1
1/1/2007 3/1/2007 5/1/2007 7/1/2007 9/1/2007 11/1/2007
Sh
ear
Str
ess
( p
sf)
Date
Myrtle Grove (Mile 59.3)
Original
RSLR + 0.5m
RSLR + 1.0m
RSLR + 1.5m

107
Figure 6-4: Shear Stress Comparison at West Pointe a la Hache for the Relative Sea Level Rise Study.
Using the shear stress results, the bed material transport was then calculated using the DuBoys-
Straub Equation17
below:
cooss Cq (6-1)
where:
qs = bed material transport per unit length [= ft3/sec/ft]
Cs = Straub coefficient
τo = bed shear stress [= lb/ft2]
τc = critical shear stress [= lb/ft2]
For a median grain size in the MR of 0.25 mm (typical), the Straub table yields a Straub
coefficient of 0.48 and a critical shear stress of 0.017 psf. Figures 6-5, 6-6, 6-7, and 6-8 show the
bed material transport per unit width comparison of the same four locations for the different
cases of relative sea level rise.
17
Equation 6-1 has not been calibrated and is intended to present the relative effects of RSLR on bed material
transport rates.
0
0.01
0.02
0.03
0.04
0.05
0.06
0.07
0.08
0.09
0.1
1/1/2007 3/1/2007 5/1/2007 7/1/2007 9/1/2007 11/1/2007
Sh
ear
Str
ess
(psf
)
Date
West Pointe a la Hache (Mile 48.7)
Original
RSLR + 0.5m
RSLR + 1.0m
RSLR + 1.5m

108
Figure 6-5: Bed Material Transport per Unit Width (qs) Comparison at Violet for the Relative Sea Level Rise
Study.
-0.0005
0
0.0005
0.001
0.0015
0.002
0.0025
0.003
0.0035
0.004
1/1/2007 3/1/2007 5/1/2007 7/1/2007 9/1/2007 11/1/2007
qs(f
t3/s
/ft)
Date
Violet (Mile 83.9)
Original
RSLR + 0.5m
RSLR + 1.0m
RSLR + 1.5m

109
Figure 6-6: Bed Material Transport per Unit Width (qs) Comparison at Belle Chasse for the Relative Sea
Level Rise Study.
-0.0005
0
0.0005
0.001
0.0015
0.002
0.0025
0.003
0.0035
1/1/2007 3/1/2007 5/1/2007 7/1/2007 9/1/2007 11/1/2007
qs(f
t3/s
/ft)
Date
Belle Chasse (Mile 76)
Original
RSLR + 0.5m
RSLR + 1.0m
RSLR + 1.5m

110
Figure 6-7: Bed Material Transport per Unit Width (qs) Comparison at Myrtle Grove for the Relative Sea
Level Rise Study.
-0.0002
0
0.0002
0.0004
0.0006
0.0008
0.001
0.0012
0.0014
0.0016
0.0018
1/1/2007 3/1/2007 5/1/2007 7/1/2007 9/1/2007 11/1/2007
qs(f
t3/s
/ft)
Date
Myrtle Grove (Mile 59.3)
Original
RSLR + 0.5m
RSLR + 1.0m
RSLR + 1.5m

111
Figure 6-8: Bed Material Transport per Unit Width (qs) Comparison at West Pointe a la Hache for the
Relative Sea Level Rise Study.
From Figures 6-5, 6-6, 6-7, and 6-8, the bed material transport per unit width reduces as the stage
in the river increases. Figures 6-9, 6-10, 6-11, and 6-12 show the alternative rating curves for the
four cases at the four locations.
-0.0005
0
0.0005
0.001
0.0015
0.002
0.0025
1/1/2007 3/1/2007 5/1/2007 7/1/2007 9/1/2007 11/1/2007
qs(f
t3/s
/ft)
Date
West Pointe a la Hache (Mile 48.7)
Original
RSLR + 0.5m
RSLR + 1.0m
RSLR + 1.5m

112
Figure 6-9: Rating Curve Comparison at Violet for the Relative Sea Level Rise Study.
0
2
4
6
8
10
12
0 200000 400000 600000 800000 1000000
Sta
ge
(ft)
Flow Rate (cfs)
Violet (Mile 83.9)
Original
RSLR + 0.5m
RSLR + 1.0m
RSLR + 1.5m

113
Figure 6-10: Rating Curve Comparison at Belle Chasse for the Relative Sea Level Rise Study.
0
2
4
6
8
10
12
0 200000 400000 600000 800000 1000000
Sta
ge
(ft)
Flow Rate (cfs)
Belle Chasse (Mile 76)
Original
RSLR + 0.5m
RSLR + 1.0m
RSLR + 1.5m

114
Figure 6-11: Rating Curve Comparison at Myrtle Grove for the Relative Sea Level Rise Study.
0
2
4
6
8
10
12
0 200000 400000 600000 800000 1000000
Sta
ge
(ft)
Flow Rate (cfs)
Myrtle Grove (Mile 59.3)
Original
RSLR + 0.5m
RSLR + 1.0m
RSLR + 1.5m

115
Figure 6-12: Rating Curve Comparison at West Pointe a la Hache for the Relative Sea Level Rise Study.
From Figures 6-9, 6-10, 6-11, and 6-12, the effects of relative sea level rise on the stage and flow
become less prominent the further upstream they are. For example, the rating curves for Violet
(Figure 6-9) are relatively close together and are converging at peak flows. However, the rating
curves for West Pointe a la Hache (Figure 6-12) are more widely spread out and do not converge
at peak flows.
6.2.2 West Bay Closure Study
This study was performed to estimate the effects of closing the West Bay Sediment Diversion.
The West Bay channel in the model was completely removed and the flow distribution to the
passes was assumed. Figures 6-13 through 6-19 show the change in flow rate from the original
2007 calibration and the 2007_WB simulation for Baptiste Collette, Fort St. Philip, Grand Pass,
Main Pass, Pass a Loutré, South Pass, and Southwest Pass, respectively.
0
2
4
6
8
10
12
0 200000 400000 600000 800000 1000000
Sta
ge
(ft)
Flow Rate (cfs)
West Pointe a la Hache (Mile 48.7)
Original
RSLR + 0.5m
RSLR + 1.0m
RSLR + 1.5m

116
Figure 6-13: Flow Comparison for Baptiste Collette for the West Bay Closure Study.
0
20000
40000
60000
80000
100000
120000
140000
1/1/2007 3/1/2007 5/1/2007 7/1/2007 9/1/2007 11/1/2007
Flo
w R
ate
(cf
s)
Date
Baptiste Collette
Original
WB Closed

117
Figure 6-14: Flow Comparison for Fort St. Philip for the West Bay Closure Study.
0
2000
4000
6000
8000
10000
12000
14000
16000
1/1/2007 3/1/2007 5/1/2007 7/1/2007 9/1/2007 11/1/2007
Flo
w R
ate
(cf
s)
Date
Fort St. Philip
Original
WB Closed

118
Figure 6-15: Flow Comparison for Grand Pass for the West Bay Closure Study.
0
10000
20000
30000
40000
50000
60000
70000
80000
90000
100000
1/1/2007 3/1/2007 5/1/2007 7/1/2007 9/1/2007 11/1/2007
Flo
w R
ate
(cf
s)
Date
Grand Pass
Original
WB Closed

119
Figure 6-16: Flow Comparison for Main Pass for the West Bay Closure Study.
0
10000
20000
30000
40000
50000
60000
70000
80000
90000
100000
1/1/2007 3/1/2007 5/1/2007 7/1/2007 9/1/2007 11/1/2007
Flo
w R
ate
(cf
s)
Date
Main Pass
Original
WB Closed
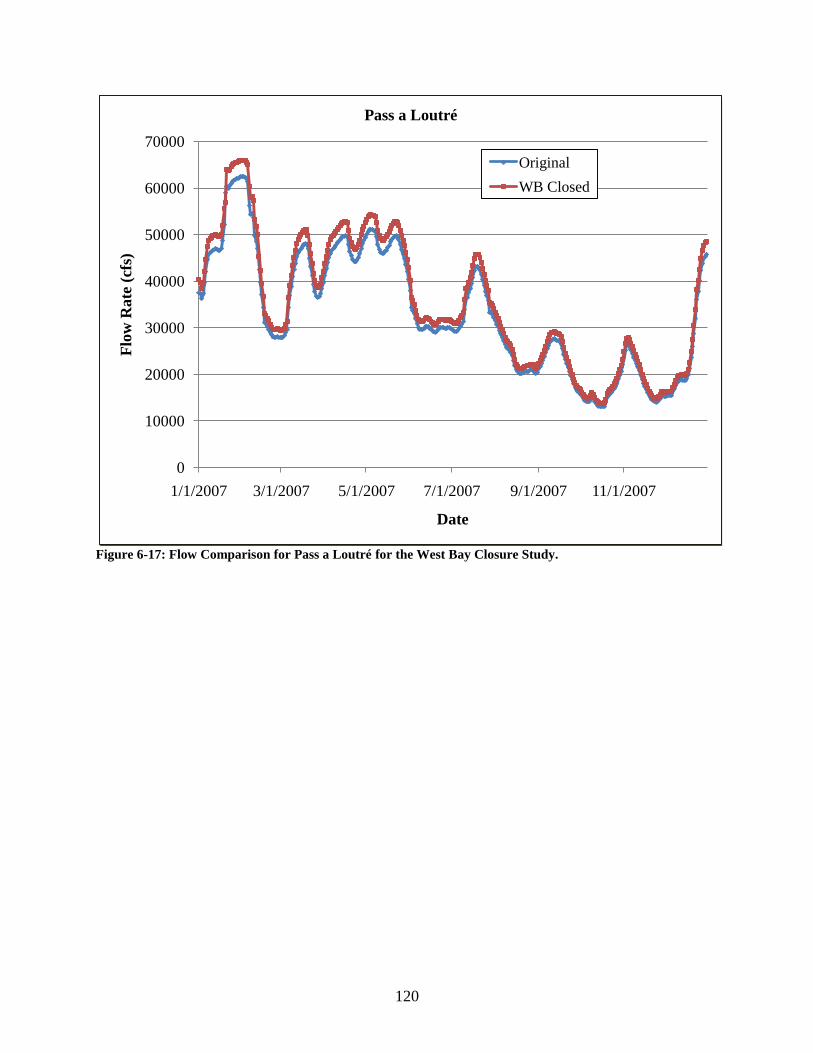
120
Figure 6-17: Flow Comparison for Pass a Loutré for the West Bay Closure Study.
0
10000
20000
30000
40000
50000
60000
70000
1/1/2007 3/1/2007 5/1/2007 7/1/2007 9/1/2007 11/1/2007
Flo
w R
ate
(cf
s)
Date
Pass a Loutré
Original
WB Closed

121
Figure 6-18: Flow Comparison for South Pass for the West Bay Closure Study.
0
20000
40000
60000
80000
100000
120000
140000
1/1/2007 3/1/2007 5/1/2007 7/1/2007 9/1/2007 11/1/2007
Flo
w R
ate
(cf
s)
Date
South Pass
Original
WB Closed

122
Figure 6-19: Flow Comparison for Southwest Pass for the West Bay Closure Study.
The closure of West Bay caused the water that would ordinarily flow through West Bay to
disperse amongst the passes, Fort St. Philip, and Bayou Lamoque North and South. Table 6-2
shows the average percent increase in flow that each channel received and the respective
standard deviation as compared to the 2007 calibration.
Table 6-2: Average Percent Increase in Flow to the Passes, Fort St. Philip, Bayou Lamoque North, and Bayou
Lamoque South due to the Closure of West Bay for the West Bay Closure Study (2007_WB vs. 2007
Calibration).
Pass/Channel Average Percent Flow Increase Standard Deviation
Baptiste Collette 4.00% 0.35%
Fort St. Philip 4.03% 0.86%
Grand Pass 4.12% 0.35%
Main Pass 5.85% 0.39%
Pass a Loutré 5.98% 0.56%
South Pass 5.57% 1.16%
Southwest Pass 5.55% 0.35%
Bayou Lamoque North 1.97% 0.36%
Bayou Lamoque South 2.21% 0.30%
0
50000
100000
150000
200000
250000
300000
350000
1/1/2007 3/1/2007 5/1/2007 7/1/2007 9/1/2007 11/1/2007
Flo
w R
ate
(cf
s)
Date
Southwest Pass
Original
WB Closed

123
6.2.3 Changes to the Delta Distributaries Study
The Multiple Lines of Defense Strategy (MLODS) identifies several channel modifications to the
passes. The three alternatives simulated were the closing of South Pass, the closing of Southwest
Pass, and the closing of South and Southwest Passes and the dredging of Pass a Loutré. The
West Bay channel was also removed for each of these simulations. For the closing of South Pass,
a weir was added to the channel to prevent flow from entering. The weir was 50 ft long, 1500 ft
wide, and was given an elevation of 1 ft (NAVD 88) and a weir coefficient of 2.6. Figure 6-20
shows the weir in South Pass. Table 6-3 shows the average percent increase in flow that each of
the other passes and local channels received and the respective standard deviation of the closure
of South Pass as compared to just having West Bay closed.
Figure 6-20: HEC-RAS Image of South Pass Closure Weir for the Changes to the Delta Distributaries Study.
0 200 400 600 800 1000 1200 1400-35
-30
-25
-20
-15
-10
-5
0
5
2007 West Bay Closed Plan: Uns teady_2007_WB_SP_Closed 3/16/2010
Station (ft)
Ele
vation
(ft)
Legend
Ground
Bank Sta

124
Table 6-3: Average Percent Increase in Flow to the Passes, Fort St. Philip, Bayou Lamoque North, and Bayou
Lamoque South due to the Closure of South Pass and West Bay for the Changes to the Delta Distributaries
Study (2007_WB_SP vs. 2007_WB).
Pass/Channel Average Percent Flow Increase Standard Deviation
Baptiste Collette 11.76% 0.84%
Fort St. Philip 12.61% 3.07%
Grand Pass 12.05% 0.86%
Main Pass 19.52% 0.74%
Pass a Loutré 24.08% 1.26%
South Pass - -
Southwest Pass 21.79% 1.13%
Bayou Lamoque North 6.17% 1.00%
Bayou Lamoque South 7.19% 1.83%
Similar to the South Pass closure simulation, a weir was added to the Southwest Pass channel to
prevent flow from entering. The weir was 20 ft long, 3000 ft wide, and was given an elevation of
1 ft (NAVD 88) and a weir coefficient of 2.6. Figure 6-21 shows the weir in Southwest Pass.
Table 6-4 shows the average percent increase in flow that each of the other passes and local
channels received and the respective standard deviation for the closure of Southwest Pass as
compared to just having West Bay closed.
Figure 6-21: HEC-RAS Image of Southwest Pass Closure Weir for the Changes to the Delta Distributaries
Study.
0 500 1000 1500 2000 2500 3000-60
-50
-40
-30
-20
-10
0
10
2007 West Bay Closed Plan: Uns teady_2007_WB_SWP_Closed 3/17/2010
Station (ft)
Ele
vation
(ft)
Legend
Ground
Bank Sta

125
Table 6-4: Average Percent Increase in Flow to the Passes, Fort St. Philip, Bayou Lamoque North, and Bayou
Lamoque South due to the Closure of Southwest Pass and West Bay for the Changes to the Delta
Distributaries Study (2007_WB_SWP vs. 2007_WB).
Pass/Channel Average Percent Flow Increase Standard Deviation
Baptiste Collette 38.24% 3.85%
Fort St. Philip 45.17% 9.53%
Grand Pass 39.08% 3.91%
Main Pass 61.45% 3.19%
Pass a Loutré 74.65% 4.20%
South Pass 65.85% 4.87%
Southwest Pass - -
Bayou Lamoque North 20.69% 2.27%
Bayou Lamoque South 24.03% 3.17%
For the last two simulations with South and Southwest Passes closed, the Pass a Loutré channel
was dredged to -50 ft and -40 ft (NAVD 88). Figure 6-22 shows a representative cross-section of
the Pass a Loutré channel dredged to -50 ft. Table 6-5 shows the average percent increase in flow
that each of the other passes and local channels received and the respective standard deviation
for the closure of South and Southwest Passes and the dredging of Pass a Loutré to -50 ft as
compared to just having West Bay closed.

126
Figure 6-22: HEC-RAS Image of Pass a Loutré Cross-section Dredged to -50 ft for the Changes to the Delta
Distributaries Study.
0 1000 2000 3000 4000 5000-50
-40
-30
-20
-10
0
10
2007 West Bay Closed Plan: 1) 2007_WB_JB_MG_B 8/20/2010
Pass a Loutre 5
Station (ft)
Ele
vation
(ft)
Legend
EG Max WS
WS Max WS
Ground
Bank Sta
.02
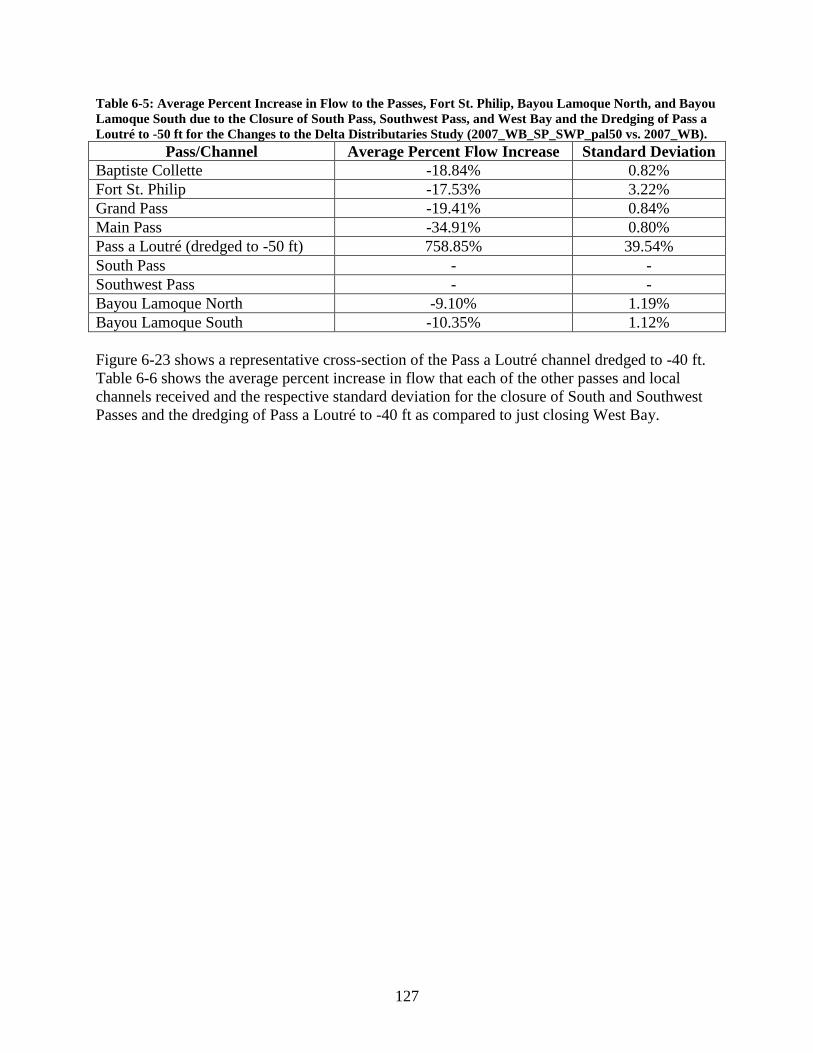
127
Table 6-5: Average Percent Increase in Flow to the Passes, Fort St. Philip, Bayou Lamoque North, and Bayou
Lamoque South due to the Closure of South Pass, Southwest Pass, and West Bay and the Dredging of Pass a
Loutré to -50 ft for the Changes to the Delta Distributaries Study (2007_WB_SP_SWP_pal50 vs. 2007_WB).
Pass/Channel Average Percent Flow Increase Standard Deviation
Baptiste Collette -18.84% 0.82%
Fort St. Philip -17.53% 3.22%
Grand Pass -19.41% 0.84%
Main Pass -34.91% 0.80%
Pass a Loutré (dredged to -50 ft) 758.85% 39.54%
South Pass - -
Southwest Pass - -
Bayou Lamoque North -9.10% 1.19%
Bayou Lamoque South -10.35% 1.12%
Figure 6-23 shows a representative cross-section of the Pass a Loutré channel dredged to -40 ft.
Table 6-6 shows the average percent increase in flow that each of the other passes and local
channels received and the respective standard deviation for the closure of South and Southwest
Passes and the dredging of Pass a Loutré to -40 ft as compared to just closing West Bay.

128
Figure 6-23: HEC-RAS Image of Pass a Loutré Cross-section Dredged to -40 ft for the Changes to the Delta
Distributaries Study.
0 1000 2000 3000 4000 5000-40
-30
-20
-10
0
10
2007 West Bay Closed Plan: 1) 2007_WB_JB_MG_B 8/20/2010
Pass a Loutre 5
Station (ft)
Ele
vation
(ft)
Legend
EG Max WS
WS Max WS
Ground
Bank Sta
.02

129
Table 6-6: Average Percent Increase in Flow to the Passes, Fort St. Philip, Bayou Lamoque North, and Bayou
Lamoque South due to the Closure of South Pass, Southwest Pass, and West Bay and the Dredging of Pass a
Loutré to -40 ft for the Changes to the Delta Distributaries Study (2007_WB_SP_SWP_pal40 vs. 2007_WB).
Pass/Channel Average Percent Flow Increase Standard Deviation
Baptiste Collette -10.21% 0.61%
Fort St. Philip -9.90% 1.98%
Grand Pass -10.50% 0.63%
Main Pass -18.06% 0.66%
Pass a Loutré (dredged to -40 ft) 702.34% 35.95%
South Pass - -
Southwest Pass - -
Bayou Lamoque North -5.00% 0.92%
Bayou Lamoque South -5.54% 1.13%
6.2.4 Gulf of Mexico ‘oil spill’ Study
In April 2010, the British Petroleum (BP) oil drilling rig, Deepwater Horizon, exploded off the
coast of Louisiana and dispensed approximately 4.9 million barrels (275 x 105 ft
3) of crude oil
into the GOM for over 100 days (Deepwater Horizon oil spill, 2010). As a remediation effort, the
state proposed to line the barrier islands of Louisiana with dredged material in order to protect
the islands from the oil sheen that covered miles of the GOM‟s water surface. From this
proposal, Pass a Loutré was considered as a possible channel for dredging. As a result, another
simulation was performed using state requested channel dimensions in order to estimate the
impacts on the shear stress in Southwest Pass and Pass a Loutré and on the flow re-distribution
through the local passes and tributaries. The proposed channel dimensions are a depth of 40 ft, a
bottom width of 750 ft, a top width of 1,242 ft, and side slopes of 1:6. These dimensions were
copied for each of the cross-sections along the channel and are shown in Figure 6-24. This
section will be called PAL-OS.

130
Figure 6-24: HEC-RAS Image of Pass a Loutré Cross-section for the ‘oil spill’ Study. Section ‘PAL-OS’.
This simulation was run using the 2007 calibration boundary conditions. West Bay, along with
the other passes, was left open. All existing diversion structures were operated with the same
conditions as the 2007 calibration simulation. Table 6-7 shows the average percent increase in
flow that each of the other passes and local channels received and the respective standard
deviation for the alteration of Pass a Loutré compared to the 2007 calibration simulation. Table
6-8 shows the average increase in flow and standard deviation for the same channels. Figures 6-
25 and 6-26 show the flow comparison of the two simulations for Pass a Loutré and Southwest
Pass, respectively.
0 200 400 600 800 1000 1200 1400-40
-30
-20
-10
0
10
Lower_Mississippi_Engli sh_Units -Mallory Pl an: Unsteady_2007_PaL-1242x40 6/21/2010
Pass a Loutre 19 (MILE 7)
Station (ft)
Ele
vation
(ft)
Legend
EG Max WS
WS Max WS
Ground
Bank Sta
.02

131
Table 6-7: Average Percent Increase in Flow to the Passes, Fort St. Philip, Bayou Lamoque North, and Bayou
Lamoque South due to the Alteration of Pass a Loutré to the ‘oil spill’ Dimensions (2007-PaL-1242x40 vs.
2007 Calibration).
Pass/Channel Average Percent Flow Increase Standard Deviation
Baptiste Collette -5.09% 0.42%
Fort St. Philip -4.84% 1.32%
Grand Pass -5.25% 0.43%
Main Pass -9.22% 0.59%
Pass a Loutré („oil spill‟ channel
PAL-OS) 111.60% 10.11%
South Pass -11.12% 0.48%
Southwest Pass -11.10% 0.48%
Bayou Lamoque North -8.45% -8.36%
Bayou Lamoque South -2.50% -2.40%
Table 6-8: Average Increase in Flow to the Passes, Fort St. Philip, Bayou Lamoque North, and Bayou
Lamoque South due to the Alteration of Pass a Loutré to the ‘oil spill’ Dimensions for the ‘oil spill’ Study
(2007-PaL-1242x40 vs. 2007 Calibration).
Pass/Channel Average Flow Increase (cfs) Standard Deviation (cfs)
Baptiste Collette -3,375 1,380
Fort St. Philip -327 242
Grand Pass -2,477 1,018
Main Pass -4,426 1,955
Pass a Loutré („oil spill‟ channel
PAL-OS) 37,849 16,897
South Pass -7,270 3,010
Southwest Pass -16,629 6,972
Bayou Lamoque North -1,867 -781
Bayou Lamoque South -21 -7

132
Figure 6-25: Flow Comparison for Pass a Loutré due to the Alteration of Pass a Loutré to the ‘oil spill’
Dimensions for the ‘oil spill’ Study.
0
20,000
40,000
60,000
80,000
100,000
120,000
140,000
160,000
1/1/2007 3/1/2007 5/1/2007 7/1/2007 9/1/2007 11/1/2007
Flo
w R
ate
(cf
s)
Date
Pass a Loutré Flow Comparison
2007 Calibration
PaL1242x40

133
Figure 6-26: Flow Comparison for Southwest Pass due to the Alteration of Pass a Loutré to the ‘oil spill’
Dimensions for the ‘oil spill’ Study.
Tables 6-7 and 6-8 and Figures 6-25 and 6-26 show that the new Pass a Loutré channel diverts
almost twice the original flow throughout the entire simulation. This additional flow in Pass a
Loutré is not just taken from Southwest Pass, but is taken from all of the local passes and
channels, as seen in the tables. The shear stress results were also analyzed for Pass a Loutré and
Southwest Pass. Figures 6-27 through 6-34 show the shear stress results for Pass a Loutré RS 29,
19, 10, and 1and Southwest Pass RS 108, 68, 28, and 1, respectively.
0
50,000
100,000
150,000
200,000
250,000
300,000
350,000
1/1/2007 3/1/2007 5/1/2007 7/1/2007 9/1/2007 11/1/2007
Flo
w R
ate
(cf
s)
Date
Southwest Pass Flow Comparison
2007 Calibration
PaL1242x40

134
Figure 6-27: Shear Stress Comparison at Pass a Loutré RS 29 due to the Alteration of Pass a Loutré to the
‘oil spill’ Dimensions for the ‘oil spill’ Study.
0
0.005
0.01
0.015
0.02
0.025
0.03
0.035
0.04
0.045
1/1/2007 3/1/2007 5/1/2007 7/1/2007 9/1/2007 11/1/2007
Sh
ear
Str
ess
(psf
)
Date
Pass a Loutré (RS 29)
2007 Calibration
2007_PaL-1242x40

135
Figure 6-28: Shear Stress Comparison at Pass a Loutré RS 19 due to the Alteration of Pass a Loutré to the
‘oil spill’ Dimensions for the ‘oil spill’ Study.
0
0.005
0.01
0.015
0.02
0.025
0.03
0.035
0.04
0.045
1/1/2007 3/1/2007 5/1/2007 7/1/2007 9/1/2007 11/1/2007
Sh
ear
Str
ess
(psf
)
Date
Pass a Loutré (RS 19)
2007 Calibration
2007_PaL-1242x40

136
Figure 6-29: Shear Stress Comparison at Pass a Loutré RS 10 due to the Alteration of Pass a Loutré to the
‘oil spill’ Dimensions for the ‘oil spill’ Study.
0
0.005
0.01
0.015
0.02
0.025
0.03
0.035
0.04
0.045
0.05
1/1/2007 3/1/2007 5/1/2007 7/1/2007 9/1/2007 11/1/2007
Sh
ear
Str
ess
(psf
)
Date
Pass a Loutré (RS 10)
2007 Calibration
2007_PaL-1242x40

137
Figure 6-30: Shear Stress Comparison at Pass a Loutré RS 1 due to the Alteration of Pass a Loutré to the ‘oil
spill’ Dimensions for the ‘oil spill’ Study.
0
0.005
0.01
0.015
0.02
0.025
0.03
0.035
0.04
0.045
0.05
1/1/2007 3/1/2007 5/1/2007 7/1/2007 9/1/2007 11/1/2007
Sh
ear
Str
ess
(psf
)
Date
Pass a Loutré (RS 1)
2007 Calibration
2007_PaL-1242x40

138
Figure 6-31: Shear Stress Comparison at Southwest Pass RS 108 due to the Alteration of Pass a Loutré to the
‘oil spill’ Dimensions for the ‘oil spill’ Study.
0
0.005
0.01
0.015
0.02
0.025
1/1/2007 3/1/2007 5/1/2007 7/1/2007 9/1/2007 11/1/2007
Sh
ear
Str
ess
(psf
)
Date
Southwest Pass (RS 108)
2007 Calibration
2007_PaL-1242x40

139
Figure 6-32: Shear Stress Comparison at Southwest Pass RS 68 due to the Alteration of Pass a Loutré to the
‘oil spill’ Dimensions for the ‘oil spill’ Study.
0
0.005
0.01
0.015
0.02
0.025
0.03
0.035
0.04
0.045
0.05
1/1/2007 3/1/2007 5/1/2007 7/1/2007 9/1/2007 11/1/2007
Sh
ear
Str
ess
(psf
)
Date
Southwest Pass (RS 68)
2007 Calibration
2007_PaL-1242x40

140
Figure 6-33: Shear Stress Comparison at Southwest Pass RS 28 due to the Alteration of Pass a Loutré to the
‘oil spill’ Dimensions for the ‘oil spill’ Study.
0
0.01
0.02
0.03
0.04
0.05
0.06
1/1/2007 3/1/2007 5/1/2007 7/1/2007 9/1/2007 11/1/2007
Sh
ear
Str
ess
(psf
)
Date
Southwest Pass (RS 28)
2007 Calibration
2007_PaL-1242x40

141
Figure 6-34: Shear Stress Comparison at Southwest Pass RS 1 due to the Alteration of Pass a Loutré to the
‘oil spill’ Dimensions for the ‘oil spill’ Study.
Figures 6-27 through 6-30 show that the shear stress increases along the Pass a Loutré channel
due to the new „oil spill‟ cross-sections. Inversely, Figures 6-31 through 6-34 show that the shear
stress decreases throughout the Southwest Pass channel with the new Pass a Loutré cross-
sections, which could be expected due to the reduction in flow though Southwest Pass. The bed
material transport was then computed at the same river stations along each of the channels.
Figures 6-35 through 6-42 show the bed material transport results for Pass a Loutré RS 29, 19,
10, and 1and Southwest Pass RS 108, 68, 28, and 1, respectively. It is important to note that one
cubic foot per second is approximately 900,000 cubic meters per year. Also, since the DuBoys-
Straub equation (Equation 6-1) has not been calibrated, the sand discharge values presented
below should only be considered as indicators of the River response rather than exact estimates.
0
0.002
0.004
0.006
0.008
0.01
0.012
0.014
1/1/2007 3/1/2007 5/1/2007 7/1/2007 9/1/2007 11/1/2007
Sh
ear
Str
ess
(psf
)
Date
Southwest Pass (RS 1)
2007 Calibration
2007_PaL-1242x40

142
Figure 6-35: Bed Material Transport (Qs) Comparison at Pass a Loutré RS 29 due to the Alteration of Pass a
Loutré to the ‘oil spill’ Dimensions for the ‘oil spill’ Study.
-0.2
-0.1
0
0.1
0.2
0.3
0.4
0.5
0.6
0.7
1/1/2007 3/1/2007 5/1/2007 7/1/2007 9/1/2007 11/1/2007
Qs
(ft3
/s)
Date
Pass a Loutré (RS 29)
2007 Calibration
2007_PaL-1242x40

143
Figure 6-36: Bed Material Transport (Qs) Comparison at Pass a Loutré RS 19 due to the Alteration of Pass a
Loutré to the ‘oil spill’ Dimensions for the ‘oil spill’ Study.
-0.2
-0.1
0
0.1
0.2
0.3
0.4
0.5
0.6
0.7
1/1/2007 3/1/2007 5/1/2007 7/1/2007 9/1/2007 11/1/2007
Qs
(ft3
/s)
Date
Pass a Loutré (RS 19)
2007 Calibration
2007_PaL-1242x40

144
Figure 6-37: Bed Material Transport (Qs) Comparison at Pass a Loutré RS 10 due to the Alteration of Pass a
Loutré to the ‘oil spill’ Dimensions for the ‘oil spill’ Study.
-0.4
-0.2
0
0.2
0.4
0.6
0.8
1/1/2007 3/1/2007 5/1/2007 7/1/2007 9/1/2007 11/1/2007
Qs
(ft3
/s)
Date
Pass a Loutré (RS 10)
2007 Calibration
2007_PaL-1242x40

145
Figure 6-38: Bed Material Transport (Qs) Comparison at Pass a Loutré RS 1 due to the Alteration of Pass a
Loutré to the ‘oil spill’ Dimensions for the ‘oil spill’ Study.
-1
-0.8
-0.6
-0.4
-0.2
0
0.2
0.4
0.6
0.8
1
1/1/2007 3/1/2007 5/1/2007 7/1/2007 9/1/2007 11/1/2007
Qs
(ft3
/s)
Date
Pass a Loutré (RS 1)
2007 Calibration
2007_PaL-1242x40

146
Figure 6-39: Bed Material Transport (Qs) Comparison at Southwest Pass RS 108 due to the Alteration of Pass
a Loutré to the ‘oil spill’ Dimensions for the ‘oil spill’ Study.
-0.15
-0.1
-0.05
0
0.05
0.1
0.15
0.2
1/1/2007 3/1/2007 5/1/2007 7/1/2007 9/1/2007 11/1/2007
Qs
(ft3
/s)
Date
Southwest Pass (RS 108)
2007 Calibration
2007_PaL-1242x40

147
Figure 6-40: Bed Material Transport (Qs) Comparison at Southwest Pass RS 68 due to the Alteration of Pass
a Loutré to the ‘oil spill’ Dimensions for the ‘oil spill’ Study.
-0.2
0
0.2
0.4
0.6
0.8
1
1.2
1.4
1/1/2007 3/1/2007 5/1/2007 7/1/2007 9/1/2007 11/1/2007
Qs
(ft3
/s)
Date
Southwest Pass (RS 68)
2007 Calibration
2007_PaL-1242x40

148
Figure 6-41: Bed Material Transport (Qs) Comparison at Southwest Pass RS 28 due to the Alteration of Pass
a Loutré to the ‘oil spill’ Dimensions for the ‘oil spill’ Study.
-0.5
0
0.5
1
1.5
2
2.5
1/1/2007 3/1/2007 5/1/2007 7/1/2007 9/1/2007 11/1/2007
Qs
(ft3
/s)
Date
Southwest Pass (RS 28)
2007 Calibration
2007_PaL-1242x40

149
Figure 6-42: Bed Material Transport (Qs) Comparison at Southwest Pass RS 1 due to the Alteration of Pass a
Loutré to the ‘oil spill’ Dimensions for the ‘oil spill’ Study.
From Figures 6-35 through 6-38, it can be seen that the dredged Pass a Loutré channel generally
increases the potential for bed material transport especially at high flows. The opposite can be
seen for Southwest Pass (Figures 6-39 through 6-41). Figure 6-42 is different, however, because
the potential bed material transport slightly increases. This could be due to the imposed GOM
boundary condition or the local geometry of this section.
6.2.5 Proposed Barataria Basin Diversions Study
As shown in Chapter 2, the MLODS has proposed several diversions for the Barataria and
Pontchartrain Basins. For the Barataria Basin, the proposed diversions include the following:
Buras (RM 24.9), Jesuit Bend (RM 68), Myrtle Grove (RM 59.3), Deer Range (RM 53.9), Lagan
(RM 156.1), and Johnson (RM 142.1). These diversions, except for Lagan and Johnson, were
designed using the 2007 calibration simulation boundary conditions (it is assumed the de-
authorized West Bay Sediment Diversion will be closed). For the Pontchartrain Basin, the
proposed diversions include: Belair (RM 64.9), Bohemia Spillway (RM 38.6), Blind River (RM
152.7), Garyville (RM 140.6), Violet (RM 83.8), and Bonnet Carré Spillway (RM 128.6). These
diversions were designed using the 2007-2008 validation simulation because this record included
a normal and a high flow year. Several of these diversions have target discharges over 100,000
cfs.
-0.2
-0.18
-0.16
-0.14
-0.12
-0.1
-0.08
-0.06
-0.04
-0.02
0
1/1/2007 3/1/2007 5/1/2007 7/1/2007 9/1/2007 11/1/2007
Qs
(ft3
/s)
Date
Southwest Pass (RS 1)
2007 Calibration
2007_PaL-1242x40

150
The first simulation for the MLODS proposed diversions in the Barataria Basin was
2007_WB_B, which includes a channel at Buras (RM 24.9). The proposed diversion is an
uncontrolled crevasse-type diversion similar to the West Bay Sediment Diversion. Therefore, the
West Bay channel cross-sections were copied and widened to a width of 2,000 cfs because the
target discharge of 59,900 cfs is over twice the amount of the West Bay Sediment Diversion
design discharge of 25,000 cfs. Also, a wide cross-section with inline storage was designed and
copied to capture and transmit the target flow along a length of 45,000 ft, which is the distance
from Buras to Barataria Bay. Figure 6-43 shows the wide cross-section for the Buras channel.
The diversion was kept open for the entire calendar year of 2007. Figures 6-44, 6-45, and 6-46
compare the stage at Baton Rouge (RM 228.4), Carrollton (RM 102.8), and Venice (RM 10.7),
respectively. Table 6-9 shows the mean and max differences in stage from the previous
simulation (2007_WB) at the comparison gages for the addition of the Buras Diversion.

151
Figure 6-43: HEC-RAS Image of a Wide Cross-section in the Buras Diversion Channel for the Proposed
Barataria Basin Diversions Study.
0 5000 10000 15000 20000-10
-8
-6
-4
-2
0
2
4
6
2007 West Bay Closed Plan: Uns teady_2007_WB_B 4/8/2010
BURAS DIVERSION 10
Station (ft)
Ele
vation
(ft)
Legend
EG Max WS
WS Max WS
Ground
Bank Sta
.06 .03 .06

152
Figure 6-44: Stage Comparison at Baton Rouge due to the Addition of the Buras Diversion for the Proposed
Barataria Basin Diversions Study.
0
5
10
15
20
25
30
35
10/10/2006 1/18/2007 4/28/2007 8/6/2007 11/14/2007 2/22/2008
Sta
ge
(ft)
Date
Baton Rouge (Mile 228.4)
2007_WB
2007_WB_B

153
Figure 6-45: Stage Comparison at Carrollton due to the Addition of the Buras Diversion for the Proposed
Barataria Basin Diversions Study.
0
2
4
6
8
10
12
14
10/10/2006 1/18/2007 4/28/2007 8/6/2007 11/14/2007 2/22/2008
Sta
ge
(ft)
Date
Carrollton (Mile 102.8)
2007_WB
2007_WB_B

154
Figure 6-46: Stage Comparison at Venice due to the Addition of the Buras Diversion for the Proposed
Barataria Basin Diversions Study.
Table 6-9: Mean and Maximum Difference in Stage due to the Addition of the Buras Diversion at the
Comparison Gages for the Proposed Barataria Basin Diversions Study (2007_WB_B vs. 2007_WB).
Parameter /
Gage
Baton
Rouge Donaldsonville
North of
Bonnet
Carré
Bonnet
Carré Carrollton
West
Pointe a
la
Hache
Venice
Mean Stage
Difference
(ft)
-0.12 -0.18 -0.21 -0.21 -0.23 -0.26 -0.17
Max Stage
Difference
(ft)
-1.08 -1.13 -0.48 -0.49 -0.54 -0.63 -0.49
The second simulation for the MLODS proposed diversions in the Barataria Basin was
2007_WB_JB_B, which includes a channel at Buras (RM 24.9), and a channel and gated
structure at Jesuit Bend (RM 68). The proposed diversion at Jesuit Bend is a gated spillway
similar to the diversion at Davis Pond. Therefore, the Davis Pond channel cross-sections were
copied. Also, a weir was designed with a width of 830 ft, an elevation of 14 ft (NAVD 88), a
length of 50 ft, and a weir coefficient of 2.6. Two gates with a width of 20 ft, a height of 14 ft, an
0
0.5
1
1.5
2
2.5
3
10/10/2006 1/18/2007 4/28/2007 8/6/2007 11/14/2007 2/22/2008
Sta
ge
(ft)
Date
Venice (Mile 10.7)
2007_WB
2007_WB_B

155
invert of -14 ft (NAVD 88), a sluice discharge coefficient of 0.5, a submerged orifice coefficient
of 0.8 (typical), and an overflow weir coefficient of 3 were entered to capture the target
discharge of 5,000 cfs. The pier width between the gates was set at 2 ft. Figure 6-47 shows the
gated structure for the Jesuit Bend Diversion. The gates were given an opening height of 14 ft
(open) from January 2007 to July 2007 and a gate height of 0 ft (closed) from July 2007 to
January 2008, according to design specifications. Figures 6-48, 6-49, and 6-50 compare the stage
at Baton Rouge, Carrollton, and Venice, respectively. Table 6-10 shows the mean and maximum
difference in stage from the previous simulation (2007_WB_B) at the comparison gages for the
addition of the Jesuit Bend Diversion.
Figure 6-47: HEC-RAS Image of the Jesuit Bend Diversion Structure for the Proposed Barataria Basin
Diversions Study.
0 200 400 600 800 1000-15
-10
-5
0
5
10
15
2007 West Bay Closed Plan: Uns teady_2007_WB_JB_MG_B 4/8/2010
Station (ft)
Ele
vation
(ft)
Legend
Ground
Bank Sta

156
Figure 6-48: Stage Comparison at Baton Rouge due to the Addition of the Jesuit Bend Diversion for the
Proposed Barataria Basin Diversions Study.
0
5
10
15
20
25
30
35
10/10/2006 1/18/2007 4/28/2007 8/6/2007 11/14/2007 2/22/2008
Sta
ge
(ft)
Date
Baton Rouge (Mile 228.4)
2007_WB
2007_WB_B
2007_WB_JB_B

157
Figure 6-49: Stage Comparison at Carrollton due to the Addition of the Jesuit Bend Diversion for the
Proposed Barataria Basin Diversions Study.
0
2
4
6
8
10
12
14
10/10/2006 1/18/2007 4/28/2007 8/6/2007 11/14/2007 2/22/2008
Sta
ge
(ft)
Date
Carrollton (Mile 102.8)
2007_WB
2007_WB_B
2007_WB_JB_B

158
Figure 6-50: Stage Comparison at Venice due to the Addition of the Jesuit Bend Diversion for the Proposed
Barataria Basin Diversions Study.
Table 6-10: Mean and Max Difference in Stage due to the Addition of the Jesuit Bend Diversion at the
Comparison Gages for the Proposed Barataria Basin Diversions Study (2007_WB_JB_B vs. 2007_WB_B).
Parameter /
Gage
Baton
Rouge Donaldsonville
North of
Bonnet
Carré
Bonnet
Carré Carrollton
West
Pointe a
la
Hache
Venice
Mean Stage
Difference
(ft)
-0.02 -0.03 -0.04 -0.04 -0.05 -0.02 -0.01
Max Stage
Difference
(ft)
0.73 -0.14 -0.11 -0.11 -0.15 -0.37 -0.23
The third simulation for the MLODS proposed diversions in the Barataria Basin was
2007_WB_JB_MG_B, which includes a channel at Buras (RM 24.9), and channels and gated
structures at Jesuit Bend (RM 68) and Myrtle Grove (RM 59.3). The proposed diversion at
Myrtle Grove is a gated spillway which is also similar to the diversion at Davis Pond. Therefore,
the Davis Pond channel cross-sections were copied and multiplied by a factor of 3.5 to increase
the channel capacity. These cross-sections replaced the original cross-sections of Wilkinson
0
0.5
1
1.5
2
2.5
3
10/10/2006 1/18/2007 4/28/2007 8/6/2007 11/14/2007 2/22/2008
Sta
ge
(ft)
Date
Venice (Mile 10.7)
2007_WB
2007_WB_B
2007_WB_JB_B

159
Canal Reaches 1 and 2. Also, a weir was designed with a width of 2,905 ft, an elevation of 12 ft
(NAVD 88), a length of 50 ft, and a weir coefficient of 2.6. Six gates with a width of 40 ft, a
height of 15 ft, an invert of -15 ft (NAVD 88), a sluice discharge coefficient of 0.5, a submerged
orifice coefficient of 0.8 (typical), and an overflow weir coefficient of 3 were entered to capture
the target discharge of 20,000 cfs. The pier width between the gates was set at 2 ft. Figure 6-51
shows the gated structure for the Myrtle Grove Diversion. The gates were given an opening
height of 15 ft (open) from January 2007 to July 2007 and a gate height of 0 ft (closed) from July
2007 to January 2008, according to design specifications. Figures 6-52, 6-53, and 6-54 compare
the stage at Baton Rouge, Carrollton, and Venice, respectively. Table 6-11 shows the mean and
maximum difference in stage from the previous simulation (2007_WB_JB_B) at the comparison
gages for the addition of the Myrtle Grove Diversion.
Figure 6-51: HEC-RAS Image of the Myrtle Grove Diversion Structure for the Proposed Barataria Basin
Diversions Study.
0 500 1000 1500 2000 2500 3000-15
-10
-5
0
5
10
15
2007 West Bay Closed Plan: Uns teady_2007_WB_JB_MG_B 4/8/2010
Station (ft)
Ele
vation
(ft)
Legend
Ground
Bank Sta

160
Figure 6-52: Stage Comparison at Baton Rouge due to the Addition of the Myrtle Grove Diversion for the
Proposed Barataria Basin Diversions Study.
0
5
10
15
20
25
30
35
10/10/2006 1/18/2007 4/28/2007 8/6/2007 11/14/2007 2/22/2008
Sta
ge
(ft)
Date
Baton Rouge (Mile 228.4)
2007_WB
2007_WB_B
2007_WB_JB_B
2007_WB_JB_MG_B

161
Figure 6-53: Stage Comparison at Carrollton due to the Addition of the Myrtle Grove Diversion for the
Proposed Barataria Basin Diversions Study.
0
2
4
6
8
10
12
14
10/10/2006 1/18/2007 4/28/2007 8/6/2007 11/14/2007 2/22/2008
Sta
ge
(ft)
Date
Carrollton (Mile 102.8)
2007_WB
2007_WB_B
2007_WB_JB_B
2007_WB_JB_MG_B

162
Figure 6-54: Stage Comparison at Venice due to the Addition of the Myrtle Grove Diversion for the Proposed
Barataria Basin Diversions Study.
Table 6-11: Mean and Maximum Difference in Stage due to the Addition of the Myrtle Grove Diversion at the
Comparison Gages for the Proposed Barataria Basin Diversions Study (2007_WB_JB_MG_B vs.
2007_WB_JB_B).
Parameter /
Gage
Baton
Rouge Donaldsonville
North of
Bonnet
Carré
Bonnet
Carré Carrollton
West
Pointe a
la
Hache
Venice
Mean Stage
Difference
(ft)
-0.03 -0.05 -0.06 -0.06 -0.07 -0.08 -0.03
Max Stage
Difference
(ft)
0.66 -0.27 -0.26 -0.27 -0.35 -0.58 -0.15
The fourth simulation for the MLODS proposed diversions in the Barataria Basin was
2007_WB_JB_MG_DR_B, which includes a channel at Buras (RM 24.9), and channels and
gated structures at Jesuit Bend (RM 68), Myrtle Grove (RM 59.3), and Deer Range (RM 53.9).
The proposed diversion at Deer Range is a gated spillway similar to the diversion at Davis Pond.
Therefore, the Davis Pond channel cross-sections were copied and multiplied by a factor of 2.5
to increase the channel capacity. Also, a weir was designed with a width of 2,075 ft, an elevation
0
0.5
1
1.5
2
2.5
3
10/10/2006 1/18/2007 4/28/2007 8/6/2007 11/14/2007 2/22/2008
Sta
ge
(ft)
Date
Venice (Mile 10.7)
2007_WB
2007_WB_B
2007_WB_JB_B
2007_WB_JB_MG_B

163
of 10 ft (NAVD 88), a length of 50 ft, and a weir coefficient of 2.6. Five gates with a width of 30
ft, a height of 14 ft, an invert of -14 ft (NAVD 88), a sluice discharge coefficient of 0.5, a
submerged orifice coefficient of 0.8 (typical), and an overflow weir coefficient of 3 were entered
to capture the target discharge of 10,000 cfs. The pier width between the gates was set at 2 ft.
Figure 6-55 shows the gated structure for the Deer Range Diversion. The gates were given an
opening height of 14 ft (open) from January 2007 to July 2007 and a gate height of 0 ft (closed)
from July 2007 to January 2008, according to design specifications. Figures 6-55, 6-57, and 6-58
compare the stage at Baton Rouge, Carrollton, and Venice, respectively. Table 6-12 shows the
mean and maximum difference in stage from the previous simulation (2007_WB_JB_MG_B) at
the comparison gages for the addition of the Deer Range Diversion.
Figure 6-55: HEC-RAS Image of the Deer Range Diversion Structure for the Proposed Barataria Basin
Diversions Study.
0 500 1000 1500 2000 2500-15
-10
-5
0
5
10
15
2007 West Bay Closed Plan:
Station (ft)
Ele
vation
(ft)
Legend
Ground
Bank Sta

164
Figure 6-56: Stage Comparison at Baton Rouge due to the Addition of the Deer Range Diversion for the
Proposed Barataria Basin Diversions Study.
0
5
10
15
20
25
30
35
10/10/2006 1/18/2007 4/28/2007 8/6/2007 11/14/2007 2/22/2008
Sta
ge
(ft)
Date
Baton Rouge (Mile 228.4)
2007_WB
2007_WB_B
2007_WB_JB_B
2007_WB_JB_MG_B
2007_WB_JB_MG_DR_B
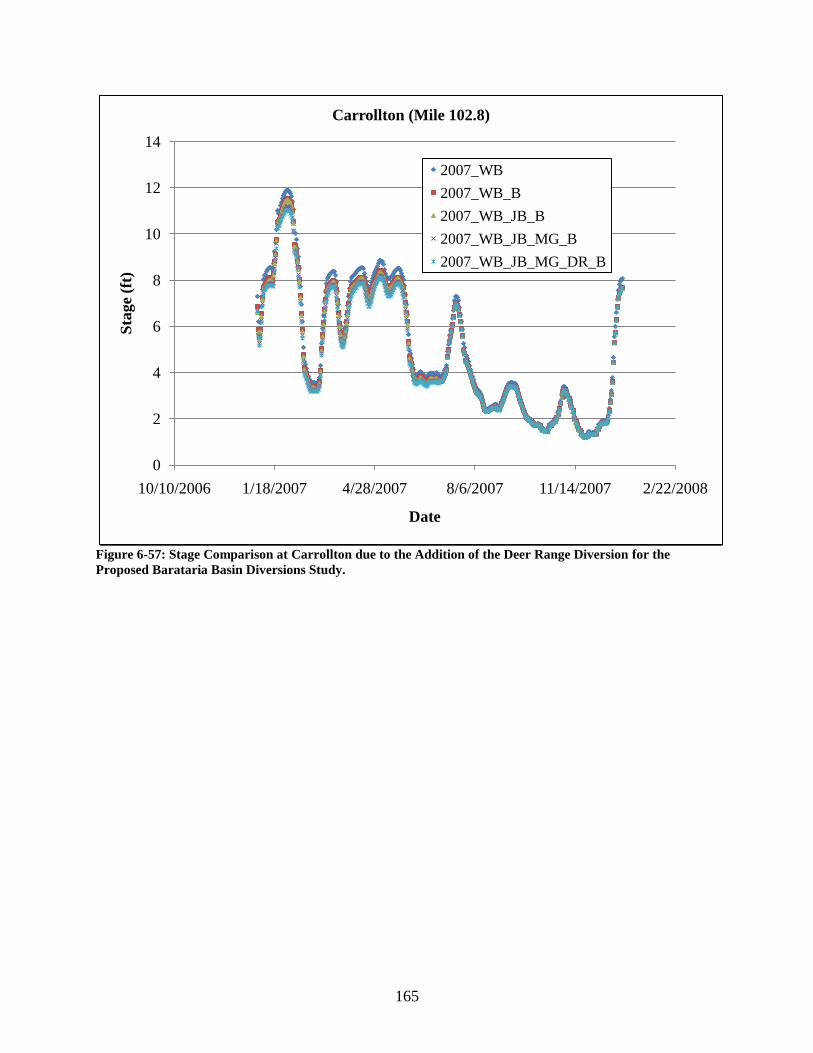
165
Figure 6-57: Stage Comparison at Carrollton due to the Addition of the Deer Range Diversion for the
Proposed Barataria Basin Diversions Study.
0
2
4
6
8
10
12
14
10/10/2006 1/18/2007 4/28/2007 8/6/2007 11/14/2007 2/22/2008
Sta
ge
(ft)
Date
Carrollton (Mile 102.8)
2007_WB
2007_WB_B
2007_WB_JB_B
2007_WB_JB_MG_B
2007_WB_JB_MG_DR_B

166
Figure 6-58: Stage Comparison at Venice due to the Addition of the Deer Range Diversion for the Proposed
Barataria Basin Diversions Study.
Table 6-12: Mean and Maximum Difference in Stage due to the Addition of the Deer Range Diversion at the
Comparison Gages for the Proposed Barataria Basin Diversions Study (2007_WB_JB_MG_DR_B vs.
2007_WB_JB_MG_B).
Parameter /
Gage
Baton
Rouge Donaldsonville
North of
Bonnet
Carré
Bonnet
Carré Carrollton
West
Pointe a
la
Hache
Venice
Mean Stage
Difference
(ft)
-0.03 -0.04 -0.05 -0.05 -0.05 -0.03 -0.01
Max Stage
Difference
(ft)
-0.84 -1.07 -0.15 -0.16 -0.18 0.45 0.18
The fifth simulation for the MLODS proposed diversions in the Barataria Basin was
2007_WB_JB_MG_DR_B_L_J, which includes lateral inflow hydrographs at Lagan (RM 156.1)
and Johnson (RM 142.1). The target discharge is 1,000 cfs for both diversions. Figures 6-59, 6-
60, and 6-61 compare the stage at Baton Rouge, Carrollton, and Venice, respectively. Table 6-13
shows the mean and maximum difference in stage from the previous simulation
0
0.5
1
1.5
2
2.5
3
10/10/2006 1/18/2007 4/28/2007 8/6/2007 11/14/2007 2/22/2008
Sta
ge
(ft)
Date
Venice (Mile 10.7)
2007_WB
2007_WB_B
2007_WB_JB_B
2007_WB_JB_MG_B
2007_WB_JB_MG_DR_B

167
(2007_WB_JB_MG_DR_B) at the comparison gages for the addition of the Lagan and Johnson
Diversions.
Figure 6-59: Stage Comparison at Baton Rouge due to the Addition of the Lagan and Johnson Diversions for
the Proposed Barataria Basin Diversions Study.
0
5
10
15
20
25
30
35
10/10/2006 1/18/2007 4/28/2007 8/6/2007 11/14/2007 2/22/2008
Sta
ge
(ft)
Date
Baton Rouge (Mile 228.4)
2007_WB
2007_WB_B
2007_WB_JB_B
2007_WB_JB_MG_B
2007_WB_JB_MG_DR_B
2007_WB_JB_MG_DR_B_L_J

168
Figure 6-60: Stage Comparison at Carrollton due to the Addition of the Lagan and Johnson Diversions for
the Proposed Barataria Basin Diversions Study.
0
2
4
6
8
10
12
14
10/10/2006 1/18/2007 4/28/2007 8/6/2007 11/14/2007 2/22/2008
Sta
ge
(ft)
Date
Carrollton (Mile 102.8)
2007_WB
2007_WB_B
2007_WB_JB_B
2007_WB_JB_MG_B
2007_WB_JB_MG_DR_B
2007_WB_JB_MG_DR_B_L_J

169
Figure 6-61: Stage Comparison at Venice due to the Addition of the Lagan and Johnson Diversions for the
Proposed Barataria Basin Diversions Study.
Table 6-13: Mean and Maximum Difference in Stage due to the Addition of the Lagan and Johnson
Diversions at the Comparison Gages for the Proposed Barataria Basin Diversions Study
(2007_WB_JB_MG_DR_B_L_J vs. 2007_WB_JB_MG_DR_B).
Parameter /
Gage
Baton
Rouge Donaldsonville
North of
Bonnet
Carré
Bonnet
Carré Carrollton
West
Pointe a
la
Hache
Venice
Mean Stage
Difference
(ft)
-0.03 -0.04 -0.03 -0.03 -0.03 -0.01 -0.01
Max Stage
Difference
(ft)
-0.07 0.29 0.09 0.11 0.20 0.07 -0.03
The stage results for the simulation with all of the Barataria diversions in operation and with
West Bay closed were compared to the simulation with just West Bay closed and to the 2007
calibration simulation. Table 6-14 shows the mean and maximum difference in stage between the
2007_WB and 2007_WB_JB_MG_DR_B and Table 6-15 shows the mean and maximum
difference in stage between the 2007 calibration and 2007_WB_JB_MG_DR_B.
0
0.5
1
1.5
2
2.5
3
10/10/2006 1/18/2007 4/28/2007 8/6/2007 11/14/2007 2/22/2008
Sta
ge
(ft)
Date
Venice (Mile 10.7)
2007_WB
2007_WB_B
2007_WB_JB_B
2007_WB_JB_MG_B
2007_WB_JB_MG_DR_B
2007_WB_JB_MG_DR_B_L_J

170
Table 6-14: Mean and Maximum Difference in Stage due to the Addition of the Lagan and Johnson
Diversions at the Comparison Gages for the Proposed Barataria Basin Diversions Study
(2007_WB_JB_MG_DR_B_L_J vs. 2007_WB).
Parameter /
Gage
Baton
Rouge Donaldsonville
North of
Bonnet
Carré
Bonnet
Carré Carrollton
West
Pointe a
la
Hache
Venice
Mean Stage
Difference
(ft)
-0.23 -0.34 -0.39 -0.40 -0.42 -0.41 -0.23
Max Stage
Difference
(ft)
-0.50 -1.73 -0.95 -0.95 -0.98 -0.98 -0.63
Table 6-15: Mean and Maximum Difference in Stage due to the Addition of the Lagan and Johnson
Diversions at the Comparison Gages for the Proposed Barataria Basin Diversions Study
(2007_WB_JB_MG_DR_B_L_J vs. 2007 Calibration).
Parameter /
Gage
Baton
Rouge Donaldsonville
North of
Bonnet
Carré
Bonnet
Carré Carrollton
West
Pointe a
la
Hache
Venice
Mean Stage
Difference
(ft)
-0.20 -0.30 -0.35 -0.35 -0.37 -0.35 -0.17
Max Stage
Difference
(ft)
0.47 -1.76 -0.84 -0.84 -0.87 -1.01 -0.63
6.2.6 Proposed Pontchartrain Basin Diversions Study
The first simulation for the MLODS proposed diversions in the Pontchartrain Basin was
2007_Belair, which includes a lateral structure at Belair (RM 64.9). The proposed diversion is a
controlled crevasse-type diversion on the east bank of the MR. The length of the structure was
designed using a target discharge of 200,000 cfs during the 2007-2008 high flood period. The
dimensions of the structure are 4,150 ft long, 20 ft wide, and a sill at 2 ft (NAVD 88). The flow
was diverted out of the system and the weir coefficient was set to 3. After the structure was
designed, it was tested using the 2007 calibration simulation. Figure 6-62 shows the lateral
structure. Figures 6-63, 6-64, and 6-65 show the stage results at Baton Rouge, Carrollton, and
Venice, respectively. Table 6-16 shows the mean and maximum stage differences at the
comparison gages for the addition of the Belair diversion.

171
Figure 6-62: HEC-RAS Image of the Belair Diversion Structure for the Proposed Pontchartrain Basin
Diversions Study.
0 1000 2000 3000 4000-120
-100
-80
-60
-40
-20
0
20
Lower_Mississippi_Engl ish_Units -Mallory Pl an: Unst_07_Bara-Pont-WB-SP-SWP-Pal 7/30/2010
Station (ft)
Ele
va
tion
(ft)
Legend
Ground
Bank Sta

172
Figure 6-63: Stage Comparison at Baton Rouge due to the Addition of the Belair Diversion for the Proposed
Pontchartrain Basin Diversions Study.
0
5
10
15
20
25
30
35
10/10/2006 1/18/2007 4/28/2007 8/6/2007 11/14/2007 2/22/2008
Sta
ge
(ft)
Date
Baton Rouge (Mile 228.4)
2007 Calibration
2007_Belair

173
Figure 6-64: Stage Comparison at Carrollton due to the Addition of the Belair Diversion for the Proposed
Pontchartrain Basin Diversions Study.
0
2
4
6
8
10
12
14
10/10/2006 1/18/2007 4/28/2007 8/6/2007 11/14/2007 2/22/2008
Sta
ge
(ft)
Date
Carrollton (Mile 102.8)
2007 Calibration
2007_Belair

174
Figure 6-65: Stage Comparison at Venice due to the Addition of the Belair Diversion for the Proposed
Pontchartrain Basin Diversions Study.
Table 6-16: Mean and Maximum Difference in Stage due to the Addition of the Belair Diversion at the
Comparison Gages for the Proposed Pontchartrain Basin Diversions Study (2007_Belair vs. 2007
Calibration).
Parameter /
Gage
Baton
Rouge Donaldsonville
North of
Bonnet
Carré
Bonnet
Carré Carrollton
West
Pointe a
la
Hache
Venice
Mean Stage
Difference
(ft)
-0.15 -0.22 -0.27 -0.27 -0.30 -0.25 -0.11
Max Stage
Difference
(ft)
-0.73 -1.96 -1.08 -1.07 -1.12 -1.06 -0.69
The second simulation for the MLODS proposed diversions in the Pontchartrain Basin was
2007_Belair-Bohemia, which includes the diversion at Belair (RM 64.9) and a cut in the pre-
existing lateral structure at Bohemia (RM 38.6). The proposed alteration to the Bohemia
Spillway diversion is expected to make the natural levee a controlled crevasse-type diversion that
can divert a maximum of 200,000 cfs during high flows. For the model, a cut in the natural levee
of the first section of the structure was designed using the 2007-2008 high flood year. The
0
0.5
1
1.5
2
2.5
10/10/2006 1/18/2007 4/28/2007 8/6/2007 11/14/2007 2/22/2008
Sta
ge
(ft)
Date
Venice (Mile 10.7)
2007 Calibration
2007_Belair

175
dimensions of the cut are 5,280 ft long, 20 ft wide, and a sill at 1 ft (NAVD 88). The flow was
diverted out of the system and the weir coefficient was set to 3. After the cut was designed, it
was tested using the 2007 calibration simulation. Figure 6-66 shows the new lateral structure.
Figures 6-67, 6-68, and 6-69 show the stage results at Baton Rouge, Carrollton, and Venice,
respectively. Table 6-17 shows the mean and max stage differences at the comparison gages for
the alteration to the Bohemia Spillway diversion.
Figure 6-66: HEC-RAS Image of the Altered Bohemia Spillway Diversion Structure for the Proposed
Pontchartrain Basin Diversions Study.
0 5000 10000 15000 20000 25000 30000
-150
-100
-50
0
Lower_Mississippi_Engl ish_Units -Mallory Pl an: Unst_07_Bara-Pont-WB-SP-SWP-Pal 7/30/2010
Station (ft)
Ele
va
tion
(ft)
Legend
Ground
Bank Sta

176
Figure 6-67: Stage Comparison at Baton Rouge due to the Alteration of the Bohemia Spillway Diversion for
the Proposed Pontchartrain Basin Diversions Study.
0
5
10
15
20
25
30
35
10/10/2006 1/18/2007 4/28/2007 8/6/2007 11/14/2007 2/22/2008
Sta
ge
(ft)
Date
Baton Rouge (Mile 228.4)
2007 Calibration
2007_Belair
2007_Belair-Bohemia

177
Figure 6-68: Stage Comparison at Carrollton due to the Alteration of the Bohemia Spillway Diversion for the
Proposed Pontchartrain Basin Diversions Study.
0
2
4
6
8
10
12
10/10/2006 1/18/2007 4/28/2007 8/6/2007 11/14/2007 2/22/2008
Sta
ge
(ft)
Date
Carrollton (Mile 102.8)
2007 Calibration
2007_Belair
2007_Belair-Bohemia

178
Figure 6-69: Stage Comparison at Venice due to the Alteration of the Bohemia Spillway Diversion for the
Proposed Pontchartrain Basin Diversions Study.
Table 6-17: Mean and Maximum Difference in Stage due to the Alteration of the Bohemia Spillway Diversion
at the Comparison Gages for the Proposed Pontchartrain Basin Diversions Study (2007_Belair-Bohemia vs.
2007_Belair).
Parameter /
Gage
Baton
Rouge Donaldsonville
North of
Bonnet
Carré
Bonnet
Carré Carrollton
West
Pointe a
la
Hache
Venice
Mean Stage
Difference
(ft)
0.03 -0.04 -0.05 -0.05 -0.06 -0.07 -0.04
Max Stage
Difference
(ft)
-0.33 -0.27 -0.32 -0.32 -0.30 -0.43 -0.21
The third simulation for the MLODS proposed diversions in the Pontchartrain Basin was
2007_Bel-Boh-Blind, which includes the diversion at Belair (RM 64.9), the alteration at
Bohemia (RM 38.6), and a lateral gated structure at Blind River (RM 152.7). The structure was
designed using a target discharge of 8,000 cfs during the 2007-2008 high flood period. The
dimensions of the weir are 42 feet long, 20 feet wide, and a crest at 30 feet (NAVD 88). The
flow was diverted out of the system and the weir coefficient was set to 3. The design called for
0
0.5
1
1.5
2
2.5
10/10/2006 1/18/2007 4/28/2007 8/6/2007 11/14/2007 2/22/2008
Sta
ge
(ft)
Date
Venice (Mile 10.7)
2007 Calibration
2007_Belair
2007_Belair-Bohemia

179
two 15 ft wide gates with a gate height of 20 ft, an invert of 5 ft (NAVD 88), a pier width of 2 ft
between the gates, a sluice discharge coefficient of 0.5 (typical), a submerged orifice coefficient
of 0.8 (typical), and an overflow weir coefficient of 3. After the structure was designed, it was
tested using the 2007 calibration simulation, and the gates were kept open for the entire
simulation. Figure 6-70 shows the lateral structure. Figures 6-71, 6-72, and 6-73 show the stage
results at Baton Rouge, Carrollton, and Venice, respectively. Table 6-18 shows the mean and
maximum stage differences at the comparison gages for the addition of the Blind River
diversion.
Figure 6-70: HEC-RAS Image of the Blind River Diversion Structure for the Proposed Pontchartrain Basin
Diversions Study.
0 100 200 300-80
-60
-40
-20
0
20
40
Lower_Mississippi_Engl ish_Units -Mallory Pl an: Unst_07_Bara-Pont-WB-SP-SWP-Pal 7/30/2010
Station (ft)
Ele
va
tion
(ft)
Legend
Ground
Bank Sta

180
Figure 6-71: Stage Comparison at Baton Rouge due to the Addition of the Blind River Diversion for the
Proposed Pontchartrain Basin Diversions Study.
0
5
10
15
20
25
30
35
10/10/2006 1/18/2007 4/28/2007 8/6/2007 11/14/2007 2/22/2008
Sta
ge
(ft)
Date
Baton Rouge (Mile 228.4)
2007 Calibration
2007_Belair
2007_Belair-Bohemia
2007_Bel-Boh-Blind

181
Figure 6-72: Stage Comparison at Carrollton due to the Addition of the Blind River Diversion for the
Proposed Pontchartrain Basin Diversions Study.
0
2
4
6
8
10
12
14
10/10/2006 1/18/2007 4/28/2007 8/6/2007 11/14/2007 2/22/2008
Sta
ge
(ft)
Date
Carrollton (Mile 102.8)
2007 Calibration
2007_Belair
2007_Belair-Bohemia
2007_Bel-Boh-Blind
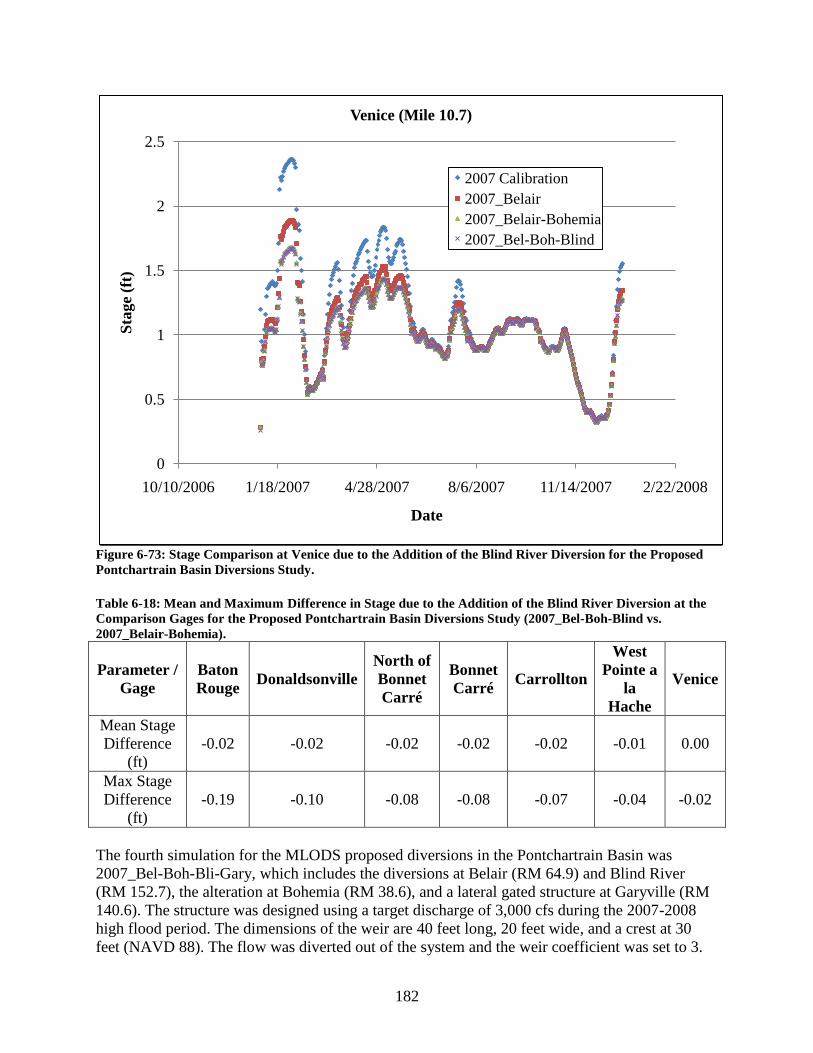
182
Figure 6-73: Stage Comparison at Venice due to the Addition of the Blind River Diversion for the Proposed
Pontchartrain Basin Diversions Study.
Table 6-18: Mean and Maximum Difference in Stage due to the Addition of the Blind River Diversion at the
Comparison Gages for the Proposed Pontchartrain Basin Diversions Study (2007_Bel-Boh-Blind vs.
2007_Belair-Bohemia).
Parameter /
Gage
Baton
Rouge Donaldsonville
North of
Bonnet
Carré
Bonnet
Carré Carrollton
West
Pointe a
la
Hache
Venice
Mean Stage
Difference
(ft)
-0.02 -0.02 -0.02 -0.02 -0.02 -0.01 0.00
Max Stage
Difference
(ft)
-0.19 -0.10 -0.08 -0.08 -0.07 -0.04 -0.02
The fourth simulation for the MLODS proposed diversions in the Pontchartrain Basin was
2007_Bel-Boh-Bli-Gary, which includes the diversions at Belair (RM 64.9) and Blind River
(RM 152.7), the alteration at Bohemia (RM 38.6), and a lateral gated structure at Garyville (RM
140.6). The structure was designed using a target discharge of 3,000 cfs during the 2007-2008
high flood period. The dimensions of the weir are 40 feet long, 20 feet wide, and a crest at 30
feet (NAVD 88). The flow was diverted out of the system and the weir coefficient was set to 3.
0
0.5
1
1.5
2
2.5
10/10/2006 1/18/2007 4/28/2007 8/6/2007 11/14/2007 2/22/2008
Sta
ge
(ft)
Date
Venice (Mile 10.7)
2007 Calibration
2007_Belair
2007_Belair-Bohemia
2007_Bel-Boh-Blind

183
The design called for one 15 ft wide gate with a gate height of 20 ft, an invert of 5 ft (NAVD 88),
a sluice discharge coefficient of 0.5 (typical), a submerged orifice coefficient of 0.8 (typical), and
an overflow weir coefficient of 3. After the structure was designed, it was tested using the 2007
calibration simulation, and the gate was kept open for the entire simulation. Figure 6-74 shows
the lateral structure. Figures 6-75, 6-76, and 6-77 show the stage results at Baton Rouge,
Carrollton, and Venice, respectively. Table 6-19 shows the mean and maximum stage differences
at the comparison gages for the addition of the Garyville diversion.
Figure 6-74: HEC-RAS Image of the Garyville Diversion Structure for the Proposed Pontchartrain Basin
Diversions Study.
0 100 200 300 400-120
-100
-80
-60
-40
-20
0
20
40
Lower_Mississippi_Engl ish_Units -Mallory Pl an: Unst_07_Bara-Pont-WB-SP-SWP-Pal 7/30/2010
Station (ft)
Ele
va
tion
(ft)
Legend
Ground
Bank Sta

184
Figure 6-75: Stage Comparison at Baton Rouge due to the Addition of the Garyville Diversion for the
Proposed Pontchartrain Basin Diversions Study.
0
5
10
15
20
25
30
35
10/10/2006 1/18/2007 4/28/2007 8/6/2007 11/14/2007 2/22/2008
Sta
ge
(ft)
Date
Baton Rouge (Mile 228.4)
2007 Calibration
2007_Belair
2007_Belair-Bohemia
2007_Bel-Boh-Blind
2007_Bel-Boh-Bli-Gary

185
Figure 6-76: Stage Comparison at Carrollton due to the Addition of the Garyville Diversion for the Proposed
Pontchartrain Basin Diversions Study.
0
2
4
6
8
10
12
14
10/10/2006 1/18/2007 4/28/2007 8/6/2007 11/14/2007 2/22/2008
Sta
ge
(ft)
Date
Carrollton (Mile 102.8)
2007 Calibration
2007_Belair
2007_Belair-Bohemia
2007_Bel-Boh-Blind
2007_Bel-Boh-Bli-Gary
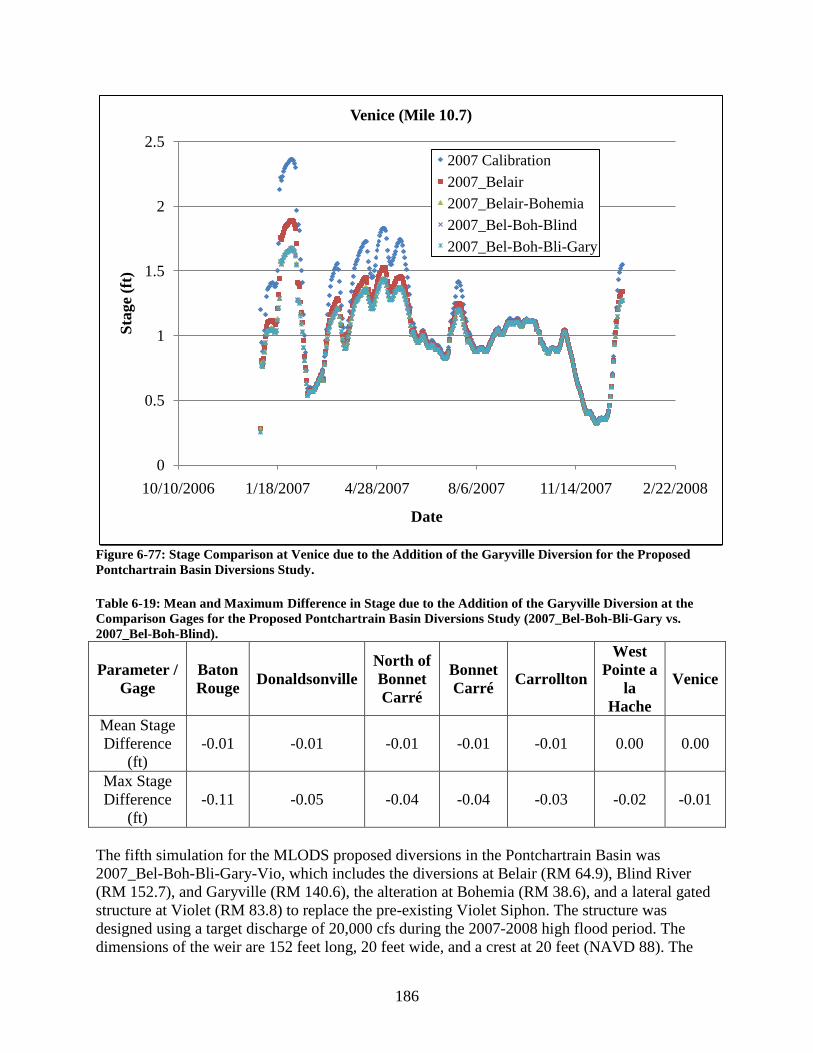
186
Figure 6-77: Stage Comparison at Venice due to the Addition of the Garyville Diversion for the Proposed
Pontchartrain Basin Diversions Study.
Table 6-19: Mean and Maximum Difference in Stage due to the Addition of the Garyville Diversion at the
Comparison Gages for the Proposed Pontchartrain Basin Diversions Study (2007_Bel-Boh-Bli-Gary vs.
2007_Bel-Boh-Blind).
Parameter /
Gage
Baton
Rouge Donaldsonville
North of
Bonnet
Carré
Bonnet
Carré Carrollton
West
Pointe a
la
Hache
Venice
Mean Stage
Difference
(ft)
-0.01 -0.01 -0.01 -0.01 -0.01 0.00 0.00
Max Stage
Difference
(ft)
-0.11 -0.05 -0.04 -0.04 -0.03 -0.02 -0.01
The fifth simulation for the MLODS proposed diversions in the Pontchartrain Basin was
2007_Bel-Boh-Bli-Gary-Vio, which includes the diversions at Belair (RM 64.9), Blind River
(RM 152.7), and Garyville (RM 140.6), the alteration at Bohemia (RM 38.6), and a lateral gated
structure at Violet (RM 83.8) to replace the pre-existing Violet Siphon. The structure was
designed using a target discharge of 20,000 cfs during the 2007-2008 high flood period. The
dimensions of the weir are 152 feet long, 20 feet wide, and a crest at 20 feet (NAVD 88). The
0
0.5
1
1.5
2
2.5
10/10/2006 1/18/2007 4/28/2007 8/6/2007 11/14/2007 2/22/2008
Sta
ge
(ft)
Date
Venice (Mile 10.7)
2007 Calibration
2007_Belair
2007_Belair-Bohemia
2007_Bel-Boh-Blind
2007_Bel-Boh-Bli-Gary

187
flow was diverted out of the system and the weir coefficient was set to 3. The design called for
seven 20 ft wide gates with a gate height of 20 ft, an invert of -2 ft (NAVD 88), a pier width of 2
ft between the gates, a sluice discharge coefficient of 0.5 (typical), a submerged orifice
coefficient of 0.8 (typical), and an overflow weir coefficient of 3. After the structure was
designed, it was tested using the 2007 calibration simulation, and the gates were kept open for
the entire simulation. Figure 6-78 shows the lateral structure. Figures 6-79, 6-80, and 6-81 show
the stage results at Baton Rouge, Carrollton, and Venice, respectively. Table 6-20 shows the
mean and maximum stage differences at the comparison gages for the addition of the Violet
diversion.
Figure 6-78: HEC-RAS Image of the Violet Diversion Structure for the Proposed Pontchartrain Basin
Diversions Study.
0 100 200 300 400 500 600-100
-80
-60
-40
-20
0
20
Lower_Mississippi_Engl ish_Units -Mallory Pl an: Unst_07_Bara-Pont-WB-SP-SWP-Pal 7/30/2010
Station (ft)
Ele
va
tion
(ft)
Legend
Ground
Bank Sta

188
Figure 6-79: Stage Comparison at Baton Rouge due to the Addition of the Violet Diversion for the Proposed
Pontchartrain Basin Diversions Study.
0
5
10
15
20
25
30
35
10/10/2006 1/18/2007 4/28/2007 8/6/2007 11/14/2007 2/22/2008
Sta
ge
(ft)
Date
Baton Rouge (Mile 228.4)
2007 Calibration
2007_Belair
2007_Belair-Bohemia
2007_Bel-Boh-Blind
2007_Bel-Boh-Bli-Gary
2007_Bel-Boh-Bli-Gary-Vio
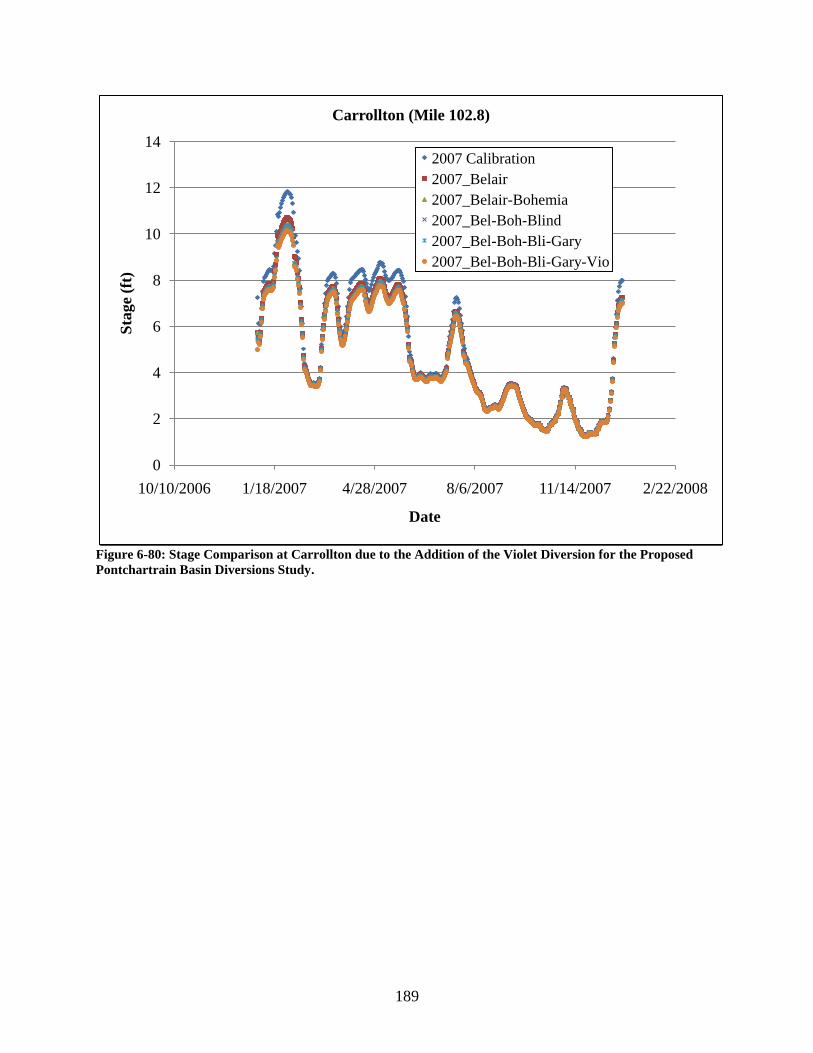
189
Figure 6-80: Stage Comparison at Carrollton due to the Addition of the Violet Diversion for the Proposed
Pontchartrain Basin Diversions Study.
0
2
4
6
8
10
12
14
10/10/2006 1/18/2007 4/28/2007 8/6/2007 11/14/2007 2/22/2008
Sta
ge
(ft)
Date
Carrollton (Mile 102.8)
2007 Calibration
2007_Belair
2007_Belair-Bohemia
2007_Bel-Boh-Blind
2007_Bel-Boh-Bli-Gary
2007_Bel-Boh-Bli-Gary-Vio

190
Figure 6-81: Stage Comparison at Venice due to the Addition of the Violet Diversion for the Proposed
Pontchartrain Basin Diversions Study.
Table 6-20: Mean and Maximum Difference in Stage due to the Addition of the Violet Diversion at the
Comparison Gages for the Proposed Pontchartrain Basin Diversions Study (2007_Bel-Boh-Bli-Gary-Vio vs.
2007_Bel-Boh-Bli-Gary).
Parameter /
Gage
Baton
Rouge Donaldsonville
North of
Bonnet
Carré
Bonnet
Carré Carrollton
West
Pointe a
la
Hache
Venice
Mean Stage
Difference
(ft)
-0.04 -0.05 -0.06 -0.06 -0.07 -0.04 -0.01
Max Stage
Difference
(ft)
-0.33 -0.22 -0.16 -0.16 -0.18 -0.08 -0.09
The sixth simulation for the MLODS proposed diversions in the Pontchartrain Basin was
2007_Bel-Boh-Bli-Gary-Vio-BC, which includes the diversions at Belair (RM 64.9), Blind River
(RM 152.7), Garyville (RM 140.6) and Violet (RM 83.8), the alteration at Bohemia (RM 38.6),
and an alteration at the Bonnet Carré Spillway (RM 128.6). The two leakage gates (#8 and #16)
were chosen to be altered because they stay open at all times during average flow years. These
gates were given a larger gate height in order to divert a target flow 10,000 cfs. The heights of
0
0.5
1
1.5
2
2.5
10/10/2006 1/18/2007 4/28/2007 8/6/2007 11/14/2007 2/22/2008
Sta
ge
(ft)
Date
Venice (Mile 10.7)
2007 Calibration
2007_Belair
2007_Belair-Bohemia
2007_Bel-Boh-Blind
2007_Bel-Boh-Bli-Gary
2007_Bel-Boh-Bli-Gary-Vio

191
the gates were designed using the 2007-2008 high flood record and were each set at 18 ft
(NAVD 88). After the gate heights were designed, they were tested using the 2007 calibration
simulation. Figure 6-82 shows the new lateral structure. Figures 6-83, 6-84, and 6-85 show the
stage results at Baton Rouge, Carrollton, and Venice, respectively. Table 6-21 shows the mean
and maximum stage differences at the comparison gages for the alteration to the Bonnet Carré
Spillway diversion.
Figure 6-82: HEC-RAS Image of the Altered Bonnet Carré Spillway Diversion Structure for the Proposed
Pontchartrain Basin Diversions Study.
0 2000 4000 6000-120
-100
-80
-60
-40
-20
0
20
40
Lower_Mississippi_Engl ish_Units -Mallory Pl an: Unst_07_Bara-Pont-WB-SP-SWP-Pal 7/30/2010
Station (ft)
Ele
va
tion
(ft)
Legend
Ground
Bank Sta

192
Figure 6-83: Stage Comparison at Baton Rouge due to the Alteration to the Bonnet Carré Spillway Diversion
for the Proposed Pontchartrain Basin Diversions Study.
0
5
10
15
20
25
30
35
10/10/2006 1/18/2007 4/28/2007 8/6/2007 11/14/2007 2/22/2008
Sta
ge
(ft)
Date
Baton Rouge (Mile 228.4)
2007 Calibration
2007_Belair
2007_Belair-Bohemia
2007_Bel-Boh-Blind
2007_Bel-Boh-Bli-Gary
2007_Bel-Boh-Bli-Gary-Vio
2007_Bel-Boh-Bli-Gary-Vio-BC

193
Figure 6-84: Stage Comparison at Carrollton due to the Alteration to the Bonnet Carré Spillway Diversion
for the Proposed Pontchartrain Basin Diversions Study.
0
2
4
6
8
10
12
14
10/10/2006 1/18/2007 4/28/2007 8/6/2007 11/14/2007 2/22/2008
Sta
ge
(ft)
Date
Carrollton (Mile 102.8)
2007 Calibration
2007_Belair
2007_Belair-Bohemia
2007_Bel-Boh-Blind
2007_Bel-Boh-Bli-Gary
2007_Bel-Boh-Bli-Gary-Vio
2007_Bel-Boh-Bli-Gary-Vio-BC

194
Figure 6-85: Stage Comparison at Venice due to the Alteration to the Bonnet Carré Spillway Diversion for
the Proposed Pontchartrain Basin Diversions Study.
Table 6-21: Mean and Maximum Difference in Stage due to the Alteration to the Bonnet Carré Spillway
Diversion at the Comparison Gages for the Proposed Pontchartrain Basin Diversions Study (2007_Bel-Boh-
Bli-Gary-Vio-BC vs. 2007_Bel-Boh-Bli-Gary-Vio).
Parameter /
Gage
Baton
Rouge Donaldsonville
North of
Bonnet
Carré
Bonnet
Carré Carrollton
West
Pointe a
la
Hache
Venice
Mean Stage
Difference
(ft)
0.00 0.00 0.00 0.00 0.00 0.00 0.00
Max Stage
Difference
(ft)
0.05 -0.06 -0.07 -0.07 -0.05 -0.02 -0.02
The stage results for the simulation with all of the Pontchartrain diversions in operation were
compared to the 2007 calibration simulation results. Table 6-22 shows the mean and maximum
difference in stage between the 2007 calibration and 2007_Bel-Boh-Bli-Gary-Vio-BC.
0
0.5
1
1.5
2
2.5
10/10/2006 1/18/2007 4/28/2007 8/6/2007 11/14/2007 2/22/2008
Sta
ge
(ft)
Date
Venice (Mile 10.7)
2007 Calibration
2007_Belair
2007_Belair-Bohemia
2007_Bel-Boh-Blind
2007_Bel-Boh-Bli-Gary
2007_Bel-Boh-Bli-Gary-Vio
2007_Bel-Boh-Bli-Gary-Vio-BC

195
Table 6-22: Mean and Maximum Difference in Stage due to the Alteration to the Bonnet Carré Spillway
Diversion at the Comparison Gages for the Proposed Pontchartrain Basin Diversions Study (2007_Bel-Boh-
Bli-Gary-Vio-BC vs. 2007 Calibration).
Parameter /
Gage
Baton
Rouge Donaldsonville
North of
Bonnet
Carré
Bonnet
Carré Carrollton
West
Pointe a
la
Hache
Venice
Mean Stage
Difference
(ft)
-0.24 -0.36 -0.42 -0.43 -0.45 -0.38 -0.16
Max Stage
Difference
(ft)
-1.22 -2.40 -1.61 -1.63 -1.73 -1.47 -0.86
6.2.7 Proposed Diversions Combined with Changes to the Delta Distributaries Study
The next step for the model was to combine the proposed diversions with the proposed channel
modifications in order to estimate the effects on the river‟s stage and on the flow distribution in
the passes and local channels. The first set of simulations that were performed included the
proposed diversions in the Barataria Basin combined with the pass modifications. These pass
modifications included closing South Pass by itself, closing Southwest Pass by itself, and closing
South and Southwest Passes and dredging Pass a Loutré. Several simulations were performed to
optimize the extent to which Pass a Loutré should be dredged. For these simulations, the West
Bay Sediment Diversion was closed and the 2007 calibration boundary conditions were used.
The second set of simulations that were performed included the proposed diversions in both the
Barataria and Pontchartrain Basins combined with the pass modifications. These pass
modifications included closing both South and Southwest Passes and dredging Pass a Loutré to
the „oil spill‟ dimensions mentioned previously. For these simulations, the West Bay Sediment
Diversion was closed and the 2007 calibration boundary conditions were used.
The first simulation with the MLODS proposed diversions and channel modifications was
2007_WB_Div_SP, which includes the diversions at Buras, Jesuit Bend, Myrtle Grove, and Deer
Range, and the weir in South Pass to close off the flow to that channel. Figures 6-86, 6-87, and
6-88 compare the stage at Baton Rouge, Carrollton, and Venice, respectively, for
2007_WB_JB_MG_DR_B vs. 2007_WB_Div_SP, which is a comparison of the simulation with
South Pass open and the simulation with South Pass closed off. Table 6-23 shows the mean and
maximum difference in stage at the comparison gages for the closure of South Pass and the
addition of the proposed Barataria Basin diversions. Table 6-24 shows the average percent
increase in flow to the passes, Fort St. Philip, Bayou Lamoque North, and Bayou Lamoque South
at the comparison gages as compared to just having the proposed Barataria Basin diversions.

196
Figure 6-86: Stage Comparison at Baton Rouge due to the Closure of South Pass and the Addition of the
Proposed Barataria Basin Diversions for the Proposed Diversions Combined with the Changes to the Delta
Distributaries Study.
0
5
10
15
20
25
30
35
10/10/2006 1/18/2007 4/28/2007 8/6/2007 11/14/2007 2/22/2008
Sta
ge
(ft)
Date
Baton Rouge (Mile 228.4)
2007_WB_JB_MG_DR_B
2007_WB_Div_SP
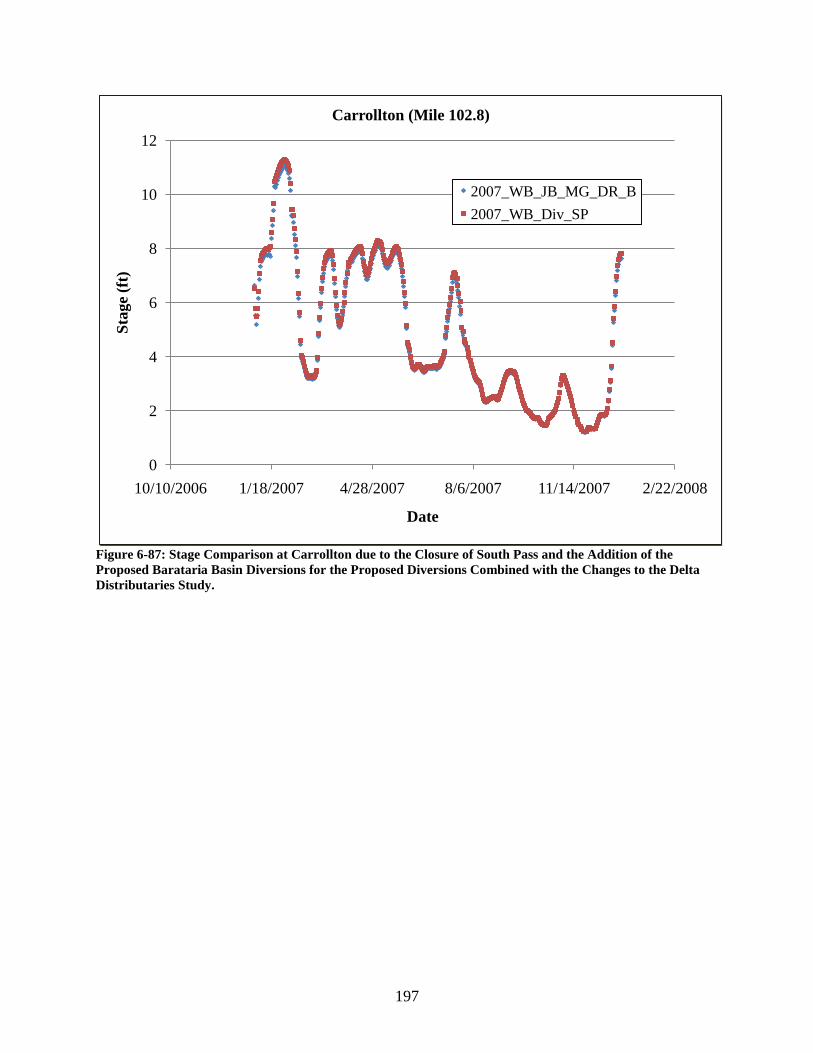
197
Figure 6-87: Stage Comparison at Carrollton due to the Closure of South Pass and the Addition of the
Proposed Barataria Basin Diversions for the Proposed Diversions Combined with the Changes to the Delta
Distributaries Study.
0
2
4
6
8
10
12
10/10/2006 1/18/2007 4/28/2007 8/6/2007 11/14/2007 2/22/2008
Sta
ge
(ft)
Date
Carrollton (Mile 102.8)
2007_WB_JB_MG_DR_B
2007_WB_Div_SP

198
Figure 6-88: Stage Comparison at Venice due to the Closure of South Pass and the Addition of the Proposed
Barataria Basin Diversions for the Proposed Diversions Combined with the Changes to the Delta
Distributaries Study.
Table 6-23: Mean and Maximum Difference in Stage due to the Closure of South Pass and the Addition of the
Proposed Barataria Basin Diversions at the Comparison Gages for the Proposed Diversions Combined with
the Changes to the Delta Distributaries Study (2007_WB_Div_SP vs. 2007_WB_JB_MG_DR_B).
Parameter /
Gage
Baton
Rouge Donaldsonville
North of
Bonnet
Carré
Bonnet
Carré Carrollton
West
Pointe a
la
Hache
Venice
Mean Stage
Difference
(ft)
0.06 0.09 0.11 0.11 0.12 0.13 0.15
Max Stage
Difference
(ft)
0.45 1.31 0.35 0.35 0.36 0.37 0.43
0
0.5
1
1.5
2
2.5
10/10/2006 1/18/2007 4/28/2007 8/6/2007 11/14/2007 2/22/2008
Sta
ge
(ft)
Date
Venice (Mile 10.7)
2007_WB_JB_MG_DR_B
2007_WB_Div_SP

199
Table 6-24: Average Percent Increase in Flow to the Passes, Fort St. Philip, Bayou Lamoque North, and
Bayou Lamoque South due to the Closure of South Pass and the Addition of the Proposed Barataria Basin
Diversions for the Proposed Diversions Combined with the Changes to the Delta Distributaries Study
(2007_WB_Div_SP vs. 2007_WB_JB_MG_DR_B).
Pass/Channel Average Percent Increase Standard Deviation
Baptiste Collette 10.88% 0.59%
Fort St. Philip 10.50% 2.00%
Grand Pass 11.18% 0.60%
Main Pass 18.29% 0.52%
Pass a Loutré 22.59% 0.95%
South Pass - -
Southwest Pass 20.91% 0.83%
Bayou Lamoque North 4.96% 0.95%
Bayou Lamoque South 6.06% 0.59%
The second simulation with the MLODS proposed diversions and channel modifications was
similar to the first except Southwest Pass included the closure weir instead of South Pass
(2007_WB_Div_SWP). Figures 6-89, 6-90, and 6-91 compare the stage at Baton Rouge,
Carrollton, and Venice, respectively, for 2007_WB_JB_MG_DR_B vs. 2007_WB_Div_SWP.
Table 6-25 shows the mean and maximum difference at the comparison gages for the closure of
Southwest Pass and the addition of the proposed Barataria Basin diversions. Table 6-26 shows
the average percent increase in flow to the passes, Fort St. Philip, Bayou Lamoque North, and
Bayou Lamoque South at the comparison gages as compared to just having the Barataria Basin
diversions.

200
Figure 6-89: Stage Comparison at Baton Rouge due to the Closure of Southwest Pass and the Addition of the
Proposed Barataria Basin Diversions for the Proposed Diversions Combined with the Changes to the Delta
Distributaries Study.
0
5
10
15
20
25
30
35
10/10/2006 1/18/2007 4/28/2007 8/6/2007 11/14/2007 2/22/2008
Sta
ge
(ft)
Date
Baton Rouge (Mile 228.4)
2007_WB_JB_MG_DR_B
2007_WB_Div_SWP

201
Figure 6-90: Stage Comparison at Carrollton due to the Closure of Southwest Pass and the Addition of the
Proposed Barataria Basin Diversions for the Proposed Diversions Combined with the Changes to the Delta
Distributaries Study.
0
2
4
6
8
10
12
14
10/10/2006 1/18/2007 4/28/2007 8/6/2007 11/14/2007 2/22/2008
Sta
ge
(ft)
Date
Carrollton (Mile 102.8)
2007_WB_JB_MG_DR_B
2007_WB_Div_SWP

202
Figure 6-91: Stage Comparison at Venice due to the Closure of Southwest Pass and the Addition of the
Proposed Barataria Basin Diversions for the Proposed Diversions Combined with the Changes to the Delta
Distributaries Study.
Table 6-25: Mean and Maximum Difference in Stage due to the Closure of Southwest Pass and the Addition
of the Proposed Barataria Basin Diversions at the Comparison Gages for the Proposed Diversions Combined
with the Changes to the Delta Distributaries Study (2007_WB_Div_SWP vs. 2007_WB_JB_MG_DR_B).
Parameter /
Gage
Baton
Rouge Donaldsonville
North of
Bonnet
Carré
Bonnet
Carré Carrollton
West
Pointe a
la
Hache
Venice
Mean Stage
Difference
(ft)
0.20 0.30 0.36 0.36 0.39 0.45 0.51
Max Stage
Difference
(ft)
-0.52 1.67 0.85 0.86 0.95 1.25 1.39
0
0.5
1
1.5
2
2.5
3
3.5
10/10/2006 1/18/2007 4/28/2007 8/6/2007 11/14/2007 2/22/2008
Sta
ge
(ft)
Date
Venice (Mile 10.7)
2007_WB_JB_MG_DR_B
2007_WB_Div_SWP

203
Table 6-26: Average Percent Increase in Flow to the Passes, Fort St. Philip, Bayou Lamoque North, and
Bayou Lamoque South due to the Closure of Southwest Pass and the Addition of the Proposed Barataria
Basin Diversions for the Proposed Diversions Combined with the Changes to the Delta Distributaries Study
(2007_WB_Div_SWP vs. 2007_WB_JB_MG_DR_B).
Pass/Channel Average Percent Increase Standard Deviation
Baptiste Collette 35.16% 2.32%
Fort St. Philip 37.22% 7.46%
Grand Pass 36.01% 2.39%
Main Pass 56.70% 1.86%
Pass a Loutré (dredged to -50 ft) 68.73% 3.39%
South Pass 61.92% 3.25%
Southwest Pass - -
Bayou Lamoque North 17.04% 2.28%
Bayou Lamoque South 20.25% 2.35%
The third simulation for the MLODS proposed diversions and channel modifications was similar
to the previous two except both South and Southwest Passes included the closure weirs and Pass
a Loutré was dredged to -50 ft (NAVD 88). Figures 6-92, 6-93, and 6-94 compare the stage at
Baton Rouge, Carrollton, and Venice, respectively, for 2007_WB_JB_MG_DR_B vs.
2007_WB_Div_SP_SWP_pal50. Table 6-27 shows the average percent increase in flow to the
passes, Fort St. Philip, Bayou Lamoque North, and Bayou Lamoque South at the comparison
gages as compared to just having the Barataria Basin diversions in operation
(2007_WB_JB_MG_DR_B). Table 6-28 shows the average percent increase in flow as
compared to just closing West Bay (2007_WB). To understand the changes in the flow
distribution due to adding the diversions, Table 6-28 can be compared to Table 6-5, which shows
the average percent increase in flow from 2007_WB to 2007_WB_SP_SWP_pal50.

204
Figure 6-92: Stage Comparison at Baton Rouge due to the Addition of the Proposed Barataria Basin
Diversions; the Closure of South Pass, Southwest Pass and West Bay; and the Dredging of Pass a Loutré to -
50 ft for the Proposed Diversions Combined with the Changes to the Delta Distributaries Study.
0
5
10
15
20
25
30
35
10/10/2006 1/18/2007 4/28/2007 8/6/2007 11/14/2007 2/22/2008
Sta
ge
(ft)
Date
Baton Rouge (Mile 228.4)
2007_WB_JB_MG_DR_B
2007_WB_Div_SP_SWP_pal50

205
Figure 6-93: Stage Comparison at Carrollton due to the Addition of the Proposed Barataria Basin
Diversions; the Closure of South Pass, Southwest Pass and West Bay; and the Dredging of Pass a Loutré to -
50 ft for the Proposed Diversions Combined with the Changes to the Delta Distributaries Study.
0
2
4
6
8
10
12
10/10/2006 1/18/2007 4/28/2007 8/6/2007 11/14/2007 2/22/2008
Sta
ge
(ft)
Date
Carrollton (Mile 102.8)
2007_WB_JB_MG_DR_B
2007_WB_Div_SP_SWP_pal50

206
Figure 6-94: Stage Comparison at Venice due to the Addition of the Proposed Barataria Basin Diversions; the
Closure of South Pass, Southwest Pass and West Bay; and the Dredging of Pass a Loutré to -50 ft for the
Proposed Diversions Combined with the Changes to the Delta Distributaries Study.
Table 6-27: Average Percent Increase in Flow to the Passes, Fort St. Philip, Bayou Lamoque North, and
Bayou Lamoque South due to the Addition of the Proposed Barataria Basin Diversions; the Closure of South
Pass, Southwest Pass, and West Bay; and the Dredging of Pass a Loutré to -50 ft for the Proposed Diversions
Combined with the Changes to the Delta Distributaries Study (2007_WB_Div_SP_SWP_pal50 vs.
2007_WB_JB_MG_DR_B).
Pass/Channel Average Percent Flow Increase Standard Deviation
Baptiste Collette -17.87% 0.37%
Fort St. Philip -15.40% 2.67%
Grand Pass -18.47% 0.39%
Main Pass -33.93% 0.70%
Pass a Loutré (dredged to -50 ft) 777.80% 43.18%
South Pass - -
Southwest Pass - -
Bayou Lamoque North -7.96% 1.31%
Bayou Lamoque South -9.18% 0.57%
0
0.5
1
1.5
2
2.5
10/10/2006 1/18/2007 4/28/2007 8/6/2007 11/14/2007 2/22/2008
Sta
ge
(ft)
Date
Venice (Mile 10.7)
2007_WB_JB_MG_DR_B
2007_WB_Div_SP_SWP_pal50

207
Table 6-28: Average Percent Increase in Flow to the Passes, Fort St. Philip, Bayou Lamoque North, and
Bayou Lamoque South due to the Addition of the Proposed Barataria Basin Diversions; the Closure of South
Pass, Southwest Pass, and West Bay; and the Dredging of Pass a Loutré to -50 ft for the Proposed Diversions
Combined with the Changes to the Delta Distributaries Study (2007_WB_Div_SP_SWP_pal50 vs. 2007_WB).
Pass/Channel Average Percent Flow Increase Standard Deviation
Baptiste Collette -28.49% 1.85%
Fort St. Philip -29.84% 6.32%
Grand Pass -29.01% 1.86%
Main Pass -42.77% 1.97%
Pass a Loutré (dredged to -50 ft) 657.27% 32.24%
South Pass - -
Southwest Pass - -
Bayou Lamoque North -17.81% 2.17%
Bayou Lamoque South -20.49% 2.72%
The fourth simulation for the MLODS proposed diversions and channel modifications was
similar to the previous simulation except Pass a Loutré was dredged to -40 ft (NAVD 88).
Figures 6-95, 6-96, and 6-97 show the stage comparisons for 2007_WB_JB_MG_DR_B vs.
2007_WB_Div_SP_SWP_pal40. Table 6-29 shows the average percent increase in flow to the
passes, Fort St. Philip, Bayou Lamoque North, and Bayou Lamoque South at the comparison
gages for this simulation as compared to just having the Barataria Basin diversion in operation
(2007_WB_JB_MG_DR_B). Table 6-30 shows the average percent increase in flow as
compared to just closing West Bay (2007_WB). To understand the changes in the flow
distribution due to adding the diversions, Table 6-30 can be compared to Table 6-6, which shows
the average percent increase in flow from 2007_WB to 2007_WB_SP_SWP_pal40.

208
Figure 6-95: Stage Comparison at Baton Rouge due to the Addition of the Proposed Barataria Basin
Diversions; the Closure of South Pass, Southwest Pass and West Bay; and the Dredging of Pass a Loutré to -
40 ft for the Proposed Diversions Combined with the Changes to the Delta Distributaries Study.
0
5
10
15
20
25
30
35
10/10/2006 1/18/2007 4/28/2007 8/6/2007 11/14/2007 2/22/2008
Sta
ge
(ft)
Date
Baton Rouge (Mile 228.4)
2007_WB_JB_MG_DR_B
2007_WB_Div_SP_SWP_pal40

209
Figure 6-96: Stage Comparison at Carrollton due to the Addition of the Proposed Barataria Basin
Diversions; the Closure of South Pass, Southwest Pass and West Bay; and the Dredging of Pass a Loutré to -
40 ft for the Proposed Diversions Combined with the Changes to the Delta Distributaries Study.
0
2
4
6
8
10
12
10/10/2006 1/18/2007 4/28/2007 8/6/2007 11/14/2007 2/22/2008
Sta
ge
(ft)
Date
Carrollton (Mile 102.8)
2007_WB_JB_MG_DR_B
2007_WB_Div_SP_SWP_pal40

210
Figure 6-97: Stage Comparison at Venice due to the Addition of the Proposed Barataria Basin Diversions; the
Closure of South Pass, Southwest Pass and West Bay; and the Dredging of Pass a Loutré to -40 ft for the
Proposed Diversions Combined with the Changes to the Delta Distributaries Study.
Table 6-29: Average Percent Increase in Flow to the Passes, Fort St. Philip, Bayou Lamoque North, and
Bayou Lamoque South due to the Addition of the Proposed Barataria Basin Diversions; the Closure of South
Pass, Southwest Pass, and West Bay; and the Dredging of Pass a Loutré to -40 ft for the Proposed Diversions
Combined with the Changes to the Delta Distributaries Study (2007_WB_Div_SP_SWP_pal40 vs.
2007_WB_JB_MG_DR_B).
Pass/Channel Average Percent Flow Increase Standard Deviation
Baptiste Collette -9.65% 0.28%
Fort St. Philip -8.62% 1.62%
Grand Pass -9.95% 0.30%
Main Pass -17.43% 0.54%
Pass a Loutré (dredged to -40 ft) 715.38% 39.60%
South Pass - -
Southwest Pass - -
Bayou Lamoque North -4.33% 0.79%
Bayou Lamoque South -5.09% 0.35%
0
0.5
1
1.5
2
2.5
10/10/2006 1/18/2007 4/28/2007 8/6/2007 11/14/2007 2/22/2008
Sta
ge
(ft)
Date
Venice (Mile 10.7)
2007_WB_JB_MG_DR_B
2007_WB_Div_SP_SWP_pal40

211
Table 6-30: Average Percent Increase in Flow to the Passes, Fort St. Philip, Bayou Lamoque North, and
Bayou Lamoque South due to the Addition of the Proposed Barataria Basin Diversions; the Closure of South
Pass, Southwest Pass, and West Bay; and the Dredging of Pass a Loutré to -40 ft for the Proposed Diversions
Combined with the Changes to the Delta Distributaries Study (2007_WB_Div_SP_SWP_pal40 vs. 2007_WB).
Pass/Channel Average Percent Flow Increase Standard Deviation
Baptiste Collette -21.33% 2.02%
Fort St. Philip -24.27% 5.91%
Grand Pass -21.59% 2.04%
Main Pass -28.48% 2.27%
Pass a Loutré (dredged to -40 ft) 603.44% 29.91%
South Pass - -
Southwest Pass - -
Bayou Lamoque North -14.57% 2.15%
Bayou Lamoque South -16.91% 2.71%
From Table 6-29, the amount of flow going to Pass a Loutré decreased from the previous
simulation with Pass a Loutré dredged to -50 ft at 770.80% to 715.38% with Pass a Loutré
dredged to -40 ft. As a result, the depth of Pass a Loutré was kept at -40 ft and three other
simulations were performed to balance out the flow distribution. These new simulations
considered the Pass a Loutré channel with 10, 20, and 30% reductions in width. This narrowing
was done by multiplying the channel width by 90, 80, and 70%, respectively. Tables 6-31, 6-32,
and 6-33 show the average percent increase in flow to the passes, Fort St. Philip, Bayou
Lamoque North, and Bayou Lamoque South at the comparison gages for the narrowed Pass a
Loutré channel as compared to just having the Barataria Basin diversions.
Table 6-31: Average Percent Increase in Flow to the Passes, Fort St. Philip, Bayou Lamoque North, and
Bayou Lamoque South due to the Addition of the Proposed Barataria Basin Diversions; the Closure of South
Pass, Southwest Pass, and West Bay; the Dredging of Pass a Loutré to -40 ft; and the Narrowing of Pass a
Loutré by 10% for the Proposed Diversions Combined with the Changes to the Delta Distributaries Study
(2007_WB_Div_SP_SWP_pal40_10% vs. 2007_WB_JB_MG_DR_B).
Pass/Channel Average Percent Flow Increase Standard Deviation
Baptiste Collette -6.89% 0.27%
Fort St. Philip -6.23% 1.26%
Grand Pass -7.10% 0.28%
Main Pass -12.28% 0.50%
Pass a Loutré (10% reduction) 694.88% 38.43%
South Pass - -
Southwest Pass - -
Bayou Lamoque North -3.10% 0.60%
Bayou Lamoque South -3.66% 0.29%

212
Table 6-32: Average Percent Increase in Flow to the Passes, Fort St. Philip, Bayou Lamoque North, and
Bayou Lamoque South due to the Addition of the Proposed Barataria Basin Diversions; the Closure of South
Pass, Southwest Pass, and West Bay; the Dredging of Pass a Loutré to -40 ft; and the Narrowing of Pass a
Loutré by 20% for the Proposed Diversions Combined with the Changes to the Delta Distributaries Study
(2007_WB_Div_SP_SWP_pal40_20% vs. 2007_WB_JB_MG_DR_B).
Pass/Channel Average Percent Flow Increase Standard Deviation
Baptiste Collette -3.45% 0.24%
Fort St. Philip -3.17% 0.69%
Grand Pass -3.56% 0.25%
Main Pass -6.08% 0.43%
Pass a Loutré (20% reduction) 669.62% 37.00%
South Pass - -
Southwest Pass - -
Bayou Lamoque North -1.55% 0.33%
Bayou Lamoque South -1.85% 0.20%
Table 6-33: Average Percent Increase in Flow to the Passes, Fort St. Philip, Bayou Lamoque North, and
Bayou Lamoque South due to the Addition of the Proposed Barataria Basin Diversions; the Closure of South
Pass, Southwest Pass, and West Bay; the Dredging of Pass a Loutré to -40 ft; and the Narrowing of Pass a
Loutré by 30% for the Proposed Diversions Combined with the Changes to the Delta Distributaries Study
(2007_WB_Div_SP_SWP_pal40_30% vs. 2007_WB_JB_MG_DR_B).
Pass/Channel Average Percent Flow Increase Standard Deviation
Baptiste Collette 0.85% 0.24%
Fort St. Philip 0.78% 0.27%
Grand Pass 0.87% 0.24%
Main Pass 1.45% 0.37%
Pass a Loutré (30% reduction) 638.09% 35.15%
South Pass - -
Southwest Pass - -
Bayou Lamoque North 0.39% 0.16%
Bayou Lamoque South 0.46% 0.16%
Table 6-33 shows positive flow changes for all of the passes and channels. Therefore, there is no
need to continue narrowing the channel.
Figures 6-98, 6-99, 6-100, and 6-101 show the bed material transport per unit width comparison
(similar to that for the relative sea level rise study) for RS 29, 19, 10, and 1 of the Pass a Loutré
channel, respectively. It is noted that negative bed material transport infers deposition and occurs
because the shear stress is less than the critical shear stress.

213
Figure 6-98: Bed Material Transport per Unit Width (qs) Comparison at Pass a Loutré RS 29 due to the
Narrowing of Pass a Loutré for the Proposed Diversions Combined with the Changes to the Delta
Distributaries Study.
-0.001
0
0.001
0.002
0.003
0.004
0.005
0.006
1/1/2007 3/1/2007 5/1/2007 7/1/2007 9/1/2007 11/1/2007
qs(f
t3/s
/ft)
Date
Pass a Loutré (RS 29)
2007_WB_Div_SP_SWP_pal40
2007_WB_Div_SP_SWP_pal40_10%
2007_WB_Div_SP_SWP_pal40_20%
2007_WB_Div_SP_SWP_pal40_30%

214
Figure 6-99: Bed Material Transport per Unit Width (qs) Comparison at Pass a Loutré RS 19 due to the
Narrowing of Pass a Loutré for the Proposed Diversions Combined with the Changes to the Delta
Distributaries Study.
-0.0005
0
0.0005
0.001
0.0015
0.002
0.0025
1/1/2007 3/1/2007 5/1/2007 7/1/2007 9/1/2007 11/1/2007
qs(f
t3/s
/ft)
Date
Pass a Loutré (RS 19)
2007_WB_Div_SP_SWP_pal40
2007_WB_Div_SP_SWP_pal40_10%
2007_WB_Div_SP_SWP_pal40_20%
2007_WB_Div_SP_SWP_pal40_30%

215
Figure 6-100: Bed Material Transport per Unit Width (qs) Comparison at Pass a Loutré RS 10 due to the
Narrowing of Pass a Loutré for the Proposed Diversions Combined with the Changes to the Delta
Distributaries Study.
-0.0002
0
0.0002
0.0004
0.0006
0.0008
0.001
0.0012
0.0014
1/1/2007 3/1/2007 5/1/2007 7/1/2007 9/1/2007 11/1/2007
qs(f
t3/s
/ft)
Date
Pass a Loutré (RS 10)
2007_WB_Div_SP_SWP_pal40
2007_WB_Div_SP_SWP_pal40_10%
2007_WB_Div_SP_SWP_pal40_20%
2007_WB_Div_SP_SWP_pal40_30%

216
Figure 6-101: Bed Material Transport per Unit Width (qs) Comparison at Pass a Loutré RS 1 due to the
Narrowing of Pass a Loutré for the Proposed Diversions Combined with the Changes to the Delta
Distributaries Study.
From Figures 6-98, 6-99, 6-100, and 6-101, the bed material transport per unit width reduces as
you get closer to the outlet (from RS 29 to RS 1), but it increases as the channel narrows (except
for the 10% reduction). Because each of these reduction simulations involves different cross-
sectional widths, the bed material transport per unit width of each RS was multiplied by its
respective width. Figures 6-102, 6-103, 6-104, and 6-105 show the bed material transport of the
channel at RS 29, 19, 10, and 1, respectively.
-0.000016
-0.000014
-0.000012
-0.00001
-0.000008
-0.000006
-0.000004
-0.000002
0
1/1/2007 3/1/2007 5/1/2007 7/1/2007 9/1/2007 11/1/2007
qs(f
t3/s
/ft)
Date
Pass a Loutré (RS 1)
2007_WB_Div_SP_SWP_pal40
2007_WB_Div_SP_SWP_pal40_10%
2007_WB_Div_SP_SWP_pal40_20%
2007_WB_Div_SP_SWP_pal40_30%

217
Figure 6-102: Bed Material Transport (Qs) Comparison at Pass a Loutré RS 29 due to the Narrowing of Pass
a Loutré for the Proposed Diversions Combined with the Changes to the Delta Distributaries Study.
-2
0
2
4
6
8
10
12
1/1/2007 3/1/2007 5/1/2007 7/1/2007 9/1/2007 11/1/2007
Qs
(ft3
/s)
Date
Pass a Loutré (RS 29)
2007_WB_Div_SP_SWP_pal40
2007_WB_Div_SP_SWP_pal40_10%
2007_WB_Div_SP_SWP_pal40_20%
2007_WB_Div_SP_SWP_pal40_30%
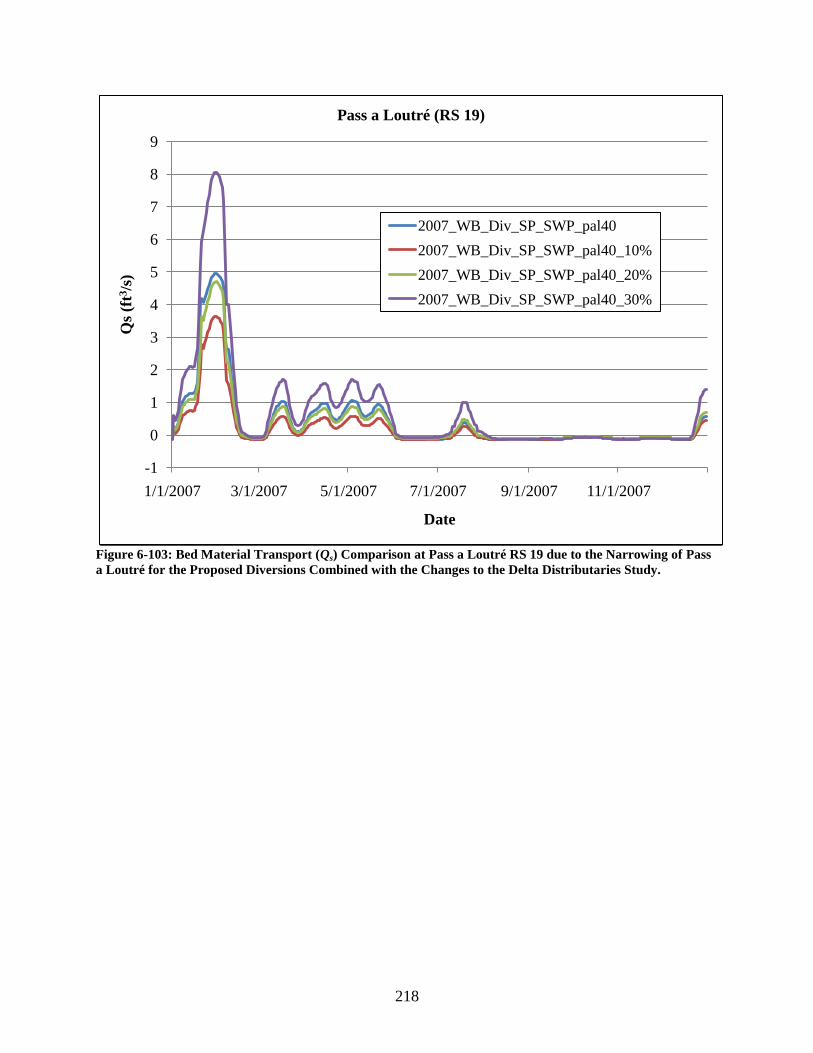
218
Figure 6-103: Bed Material Transport (Qs) Comparison at Pass a Loutré RS 19 due to the Narrowing of Pass
a Loutré for the Proposed Diversions Combined with the Changes to the Delta Distributaries Study.
-1
0
1
2
3
4
5
6
7
8
9
1/1/2007 3/1/2007 5/1/2007 7/1/2007 9/1/2007 11/1/2007
Qs
(ft3
/s)
Date
Pass a Loutré (RS 19)
2007_WB_Div_SP_SWP_pal40
2007_WB_Div_SP_SWP_pal40_10%
2007_WB_Div_SP_SWP_pal40_20%
2007_WB_Div_SP_SWP_pal40_30%

219
Figure 6-104: Bed Material Transport (Qs) Comparison at Pass a Loutré RS 10 due to the Narrowing of Pass
a Loutré for the Proposed Diversions Combined with the Changes to the Delta Distributaries Study.
-1
0
1
2
3
4
5
6
1/1/2007 3/1/2007 5/1/2007 7/1/2007 9/1/2007 11/1/2007
Qs
(ft3
/s)
Date
Pass a Loutré (RS 10)
2007_WB_Div_SP_SWP_pal40
2007_WB_Div_SP_SWP_pal40_10%
2007_WB_Div_SP_SWP_pal40_20%
2007_WB_Div_SP_SWP_pal40_30%

220
Figure 6-105: Bed Material Transport (Qs) Comparison at Pass a Loutré RS 1 due to the Narrowing of Pass a
Loutré for the Proposed Diversions Combined with the Changes to the Delta Distributaries Study.
From Figures 6-102, 6-103, 6-104 and 6-105, the bed material transport reduces as you get closer
to the outlet (from RS 29 to RS 1). Also, RS 1 which is the last cross-section for the channel,
contains all negative values for the bed material transport (Figure 6-105), which indicates
possible shoaling.
Two other simulations were performed to test smaller channel cross-sections to reduce the
amount of shoaling. The first simulation involved copying Southwest Pass RS 81 and applying it
throughout the Pass a Loutré channel. This cross-section was chosen because it is a
representative cross-section of the dredged channel. The second simulation involved creating a
rectangular cross-section 1,200 ft wide by 40 ft deep to replace the Pass a Loutré channel. Tables
6-34 and 6-35 show the average percent increase in flow to the passes, Fort St. Philip, Bayou
Lamoque North, and Bayou Lamoque South at the comparison gages for these two simulations
as compared to just having the Barataria Basin diversions.
-0.3
-0.25
-0.2
-0.15
-0.1
-0.05
0
1/1/2007 3/1/2007 5/1/2007 7/1/2007 9/1/2007 11/1/2007
Qs
(ft3
/s)
Date
Pass a Loutré (RS 1)
2007_WB_Div_SP_SWP_pal40
2007_WB_Div_SP_SWP_pal40_10%
2007_WB_Div_SP_SWP_pal40_20%
2007_WB_Div_SP_SWP_pal40_30%

221
Table 6-34: Average Percent Increase in Flow to the Passes, Fort St. Philip, Bayou Lamoque North, and
Bayou Lamoque South due to the Addition of the Proposed Barataria Basin Diversions; the Closure of South
Pass, Southwest Pass, and West Bay; and the Replacement of the Pass a Loutré Cross-sections by Southwest
Pass RS 81 for the Proposed Diversions Combined with the Changes to the Delta Distributaries Study
(2007_WB_Div_SP_SWP_pal-Copy SWP_RS81 vs. 2007_WB_JB_MG_DR_B).
Pass/Channel Average Percent Flow Increase Standard Deviation
Baptiste Collette 10.68% 0.71%
Fort St. Philip 10.25% 1.78%
Grand Pass 10.97% 0.72%
Main Pass 17.95% 0.69%
Pass a Loutré (Copy of SWP RS 81) 565.85% 32.26%
South Pass - -
Southwest Pass - -
Bayou Lamoque North 4.86% 0.95%
Bayou Lamoque South 5.93% 0.52%
Table 6-35: Average Percent Increase in Flow to the Passes, Fort St. Philip, Bayou Lamoque North, and
Bayou Lamoque South due to the Addition of the Proposed Barataria Basin Diversions; the Closure of South
Pass, Southwest Pass, and West Bay; and the Replacement of the Pass a Loutré Cross-sections by a 1,200 ft
by 40 ft Rectangular Channel for the Proposed Diversions Combined with the Changes to the Delta
Distributaries Study (2007_WB_Div_SP_SWP_pal-1200x40 vs. 2007_WB_JB_MG_DR_B).
Pass/Channel Average Percent Flow Increase Standard Deviation
Baptiste Collette 32.40% 2.21%
Fort St. Philip 33.85% 6.32%
Grand Pass 33.19% 2.26%
Main Pass 52.39% 1.36%
Pass a Loutré (1200 ft x 40 ft channel) 404.23% 23.10%
South Pass - -
Southwest Pass - -
Bayou Lamoque North 15.60% 2.17%
Bayou Lamoque South 18.59% 2.04%
When compared to the 30% reduced Pass a Loutré channel (flow increase of 638%), Tables 6-34
and 6-35 show that the narrower Pass a Loutré channels had a decrease in the amount of flow
(566% and 404%, respectively). This reduction in flow capacity in Pass a Loutré caused the flow
to increase in the other nearby channels and passes. Figures 6-106, 6-107, 6-108, and 6-109 show
the updated bed material transport results, including these two simulations.

222
Figure 6-106: Updated Bed Material Transport (Qs) Comparison at Pass a Loutré RS 29 due to the
Narrowing of Pass a Loutré, Including Simulations Using a Copy of Southwest Pass RS 81 and a 1,200 ft by
40 ft Rectangular Channel for the Proposed Diversions Combined with the Changes to the Delta
Distributaries Study.
-2
0
2
4
6
8
10
12
1/1/2007 3/1/2007 5/1/2007 7/1/2007 9/1/2007 11/1/2007
Qs
(ft3
/s)
Date
Pass a Loutré (RS 29)
2007_WB_Div_SP_SWP_pal40
2007_WB_Div_SP_SWP_pal40_10%
2007_WB_Div_SP_SWP_pal40_20%
2007_WB_Div_SP_SWP_pal40_30%
2007_WB_Div_SP_SWP_pal-CopySWP_RS81
2007_WB_Div_SP_SWP_pal-1200x40
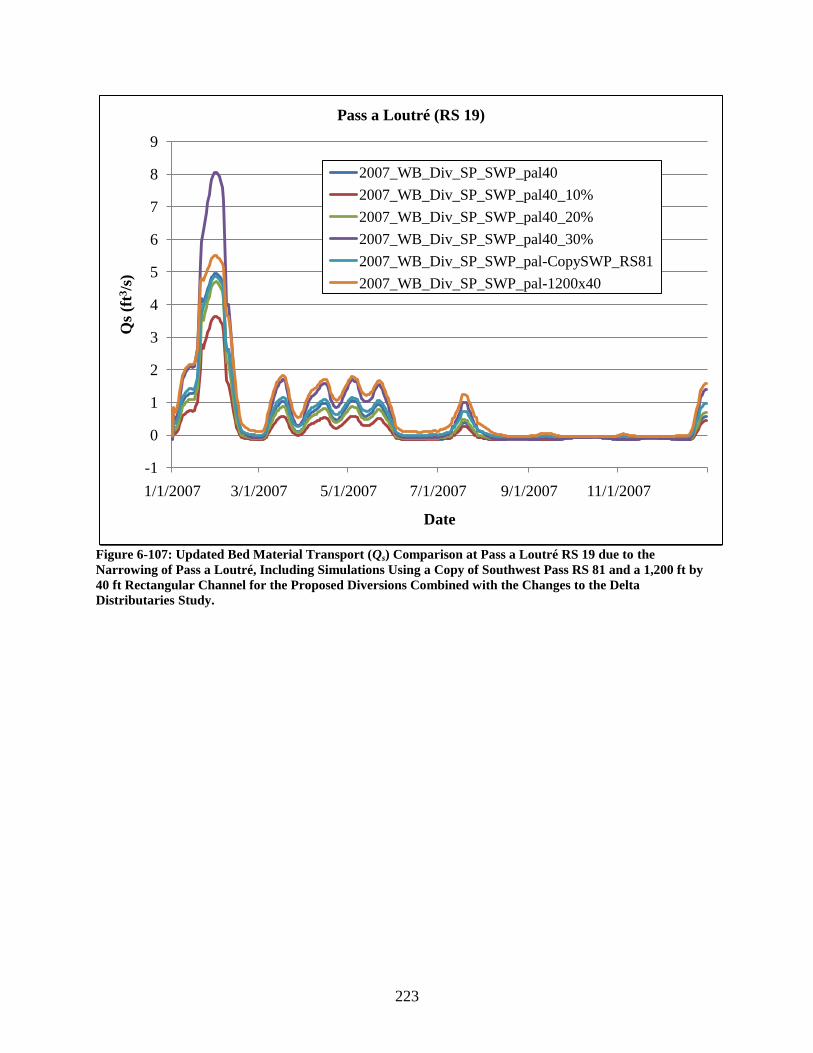
223
Figure 6-107: Updated Bed Material Transport (Qs) Comparison at Pass a Loutré RS 19 due to the
Narrowing of Pass a Loutré, Including Simulations Using a Copy of Southwest Pass RS 81 and a 1,200 ft by
40 ft Rectangular Channel for the Proposed Diversions Combined with the Changes to the Delta
Distributaries Study.
-1
0
1
2
3
4
5
6
7
8
9
1/1/2007 3/1/2007 5/1/2007 7/1/2007 9/1/2007 11/1/2007
Qs
(ft3
/s)
Date
Pass a Loutré (RS 19)
2007_WB_Div_SP_SWP_pal40
2007_WB_Div_SP_SWP_pal40_10%
2007_WB_Div_SP_SWP_pal40_20%
2007_WB_Div_SP_SWP_pal40_30%
2007_WB_Div_SP_SWP_pal-CopySWP_RS81
2007_WB_Div_SP_SWP_pal-1200x40

224
Figure 6-108: Updated Bed Material Transport (Qs) Comparison at Pass a Loutré RS 10 due to the
Narrowing of Pass a Loutré, Including Simulations Using a Copy of Southwest Pass RS 81 and a 1,200 ft by
40 ft Rectangular Channel for the Proposed Diversions Combined with the Changes to the Delta
Distributaries Study.
-1
0
1
2
3
4
5
6
7
1/1/2007 3/1/2007 5/1/2007 7/1/2007 9/1/2007 11/1/2007
Qs
(ft3
/s)
Date
Pass a Loutré (RS 10)
2007_WB_Div_SP_SWP_pal40
2007_WB_Div_SP_SWP_pal40_10%
2007_WB_Div_SP_SWP_pal40_20%
2007_WB_Div_SP_SWP_pal40_30%
2007_WB_Div_SP_SWP_pal-CopySWP_RS81
2007_WB_Div_SP_SWP_pal-1200x40

225
Figure 6-109: Updated Bed Material Transport (Qs) Comparison at Pass a Loutré RS 1 due to the Narrowing
of Pass a Loutré, Including Simulations Using a Copy of Southwest Pass RS 81 and a 1,200 ft by 40 ft
Rectangular Channel for the Proposed Diversions Combined with the Changes to the Delta Distributaries
Study.
From Figures 6-108 and 6-109, it can be seen that the narrower cross-sections increased the shear
stress and ultimately increased the potential for bed material transport. This is shown most
effectively for RS 1 (Figure 6-109), where the bed material transport was negative throughout
the previous simulations. Negative bed material transport infers deposition and occurs because
the shear stress is less than the critical shear stress. For the upstream cross-sections (Figures 6-
106 and 6-107), the bed material transport for the two narrow simulations was not the highest,
which is due to the smaller cross-sectional widths of those two RS‟s.
The preceding analyses indicated that the so called „oil spill‟ channel for Pass a Loutré is a
reasonable design to use in combination with the MLODS proposal. Therefore, the combined
effects were modeled with a Pass a Loutré channel with a bottom width of 1,242 ft, dredged
depth of 40 ft, and side slopes of 1V:6H. This analysis included the proposed diversions in both
the Barataria and Pontchartrain Basins, the closing of the West Bay Sediment Diversion, and the
closing of both South and Southwest Passes. For this simulation, the 2007 calibration boundary
conditions and the 2007-2008 validation boundary conditions were used (specifically January 1,
2008 through June 27, 2008). The gated structures at Jesuit Bend, Myrtle Grove, and Deer Range
were opened from January to July in 2007 and from January to June 27 in 2008. The gated
structures for Blind River, Garyville, and Violet were kept open for the entire simulation. The
-1
0
1
2
3
4
5
6
7
8
1/1/2007 3/1/2007 5/1/2007 7/1/2007 9/1/2007 11/1/2007
Qs
(ft3
/s)
Date
Pass a Loutré (RS 1)
2007_WB_Div_SP_SWP_pal40
2007_WB_Div_SP_SWP_pal40_10%
2007_WB_Div_SP_SWP_pal40_20%
2007_WB_Div_SP_SWP_pal40_30%
2007_WB_Div_SP_SWP_pal-CopySWP_RS81
2007_WB_Div_SP_SWP_pal-1200x40

226
Bonnet Carré Spillway was operated based on the 2007-2008 validation conditions and the two
leakage gates for the spillway were also kept open for the entire simulation. The inflow
hydrographs for the Lagan and Johnson diversions were kept at a constant 1,000 cfs each for the
entire simulation. This analysis focused on the following hydraulic indicators:
1. Changes in the stages at selected RM‟s for representative River flows (2007-2008),
2. Changes in the currents at selected RM‟s for representative River flows (2007-2008),
3. Changes in the shear stresses at selected RM‟s for representative River flows (2007-
2008),
4. Changes in the indicator of bed material transport capacity at selected RM‟s upstream
and downstream of the large diversion for representative River flows (2007-2008).
Table 6-36 shows the mean, maximum, and target discharges for each of the proposed
diversions. Table 6-37 shows the average percent increase in flow that each of the other passes
and local channels received and the respective standard deviation.
Table 6-36: 2007-2008 Mean, Maximum, and Target Discharges for the Proposed Barataria and
Pontchartrain Basin Diversions due to the Addition of the Proposed Barataria and Pontchartrain Basin
Diversions; the Closure of South Pass, Southwest Pass, and West Bay; and the Replacement of the Pass a
Loutré Cross-sections by the ‘oil spill’ Dimensions for the Proposed Diversions Combined with the Changes
to the Delta Distributaries Study (07-08-Bara-Pont-WB-SP-SWP-Pal).
Proposed Diversion (RM) Mean (cfs) Maximum (cfs) Target (cfs)
Lagan (156.1) 999 1,387 1,000
Blind River (152.7) 1,855 7,984 8,000
Johnson (142.1) 997 1,503 1,000
Garyville (140.6) 694 3,225 3,000
Bonnet Carré (128.6) 962 13,176 10,000
Violet (83.8) 8,442 19,996 20,000
Jesuit Bend (68) 3,399 7,142 5,000
Belair (64.9) 44,464 173,270 200,000 (max)
Myrtle Grove (59.3) 12,997 29,436 20,000
Deer Range (53.9) 6,800 15,167 10,000
Bohemia (38.6-32.3) 35,013 180,346 200,000 (max)
Buras (24.9) 84,068 142,571 59,900
Totals 200,690 595,203 537,900

227
Table 6-37: 2007-2008 Average Percent Increase in Flow to the Passes, Fort St. Philip, Bayou Lamoque
North, and Bayou Lamoque South due to the Addition of the Proposed Barataria and Pontchartrain Basin
Diversions; the Closure of South Pass, Southwest Pass, and West Bay; and the Replacement of Pass a Loutré
by the ‘oil spill’ Dimensions for the Proposed Diversions Combined with the Changes to the Delta
Distributaries Study (07-08-Bara-Pont-WB-SP-SWP-Pal vs. 2007 Calibration/2008 Validation).
Pass/Channel Average Percent Flow Increase Standard Deviation
Baptiste Collette 11.78% 9.82%
Fort St. Philip 0.51% 12.70%
Grand Pass 12.72% 9.89%
Main Pass 32.65% 10.76%
Pass a Loutré („oil spill‟ channel) 226.65% 33.65%
South Pass - -
Southwest Pass - -
Bayou Lamoque North -3.63% 8.72%
Bayou Lamoque South -3.47% 8.79%
Several of the proposed MLODS diversions are quite large and could have direct impacts on the
energy and sediment transport of the river. Therefore, the first parameter under investigation was
the stage, which was compared to the 2007 calibration and 2008 validation values. The
diversions under consideration were the alteration at Bonnet Carré (RM 128.6), Violet (RM
83.8), Belair (RM 64.9), Myrtle Grove (RM 59.3), Deer Range (RM 53.9), the alteration at
Bohemia (RM 38.6), and Buras (RM 24.9). For each of these diversions, cross-sections were
selected upstream and downstream of the diversions in order to identify the local changes caused
by the diversions. Some diversions, such as Bohemia, required a closer look at several mid-
stream cross-sections. For example, the Bohemia diversion is over 7 miles long and the proposed
alteration is located within the first section of the diversion. To obtain a more comprehensive
look at the effects of the alteration, two additional cross-sections were selected mid-stream of the
diversion. Also, the Myrtle Grove diversion is located in a bend of the river near RM 59.3. This
bend is thought to have some of the deepest bathymetry in the river. Therefore, cross-sections
from the nearest “straight” sections upstream and downstream of the diversions were also
selected. Figure 6-110 shows the stage comparison at the Bonnet Carré Spillway. The relative
difference in stage from the 2007 calibration and 2008 validation values was calculated for the
upstream and downstream cross-sections. Figure 6-111 shows this relative difference. It is
important to note that a diversion is expected to have higher stage upstream of the diversion than
downstream of the diversion because the energy is typically higher upstream of a diversion.
Also, a positive relative stage curve indicates an increase from the calibration to the present
simulation and vice versa for a negative relative stage curve.

228
Figure 6-110: 2007-2008 Stage Comparison at the Bonnet Carré Spillway due to the Addition of the Barataria
and Pontchartrain Basin Diversions; the Closure of South Pass, Southwest Pass, and West Bay; and the
Dredging of Pass a Loutré to the ‘oil spill’ Dimensions for the Proposed Diversions Combined with the
Changes to the Delta Distributaries Study.
0
5
10
15
20
25
1/1/2007 4/1/2007 7/1/2007 10/1/2007 1/1/2008 4/1/2008
Sta
ge
(ft)
Date
Bonnet Carré (Mile 128.6)
07 Calibration/08 Validation (Upstream)
07-08-Bara-Pont-WB-SP-SWP-Pal (Upstream)
07 Calibration/08 Validation (Downstream)
07-08-Bara-Pont-WB-SP-SWP-Pal (Downstream)

229
Figure 6-111: 2007-2008 Relative Stage Comparison at the Bonnet Carré Spillway due to the Addition of the
Barataria and Pontchartrain Basin Diversions; the Closure of South Pass, Southwest Pass, and West Bay;
and the Dredging of Pass a Loutré to the ‘oil spill’ Dimensions for the Proposed Diversions Combined with
the Changes to the Delta Distributaries Study.
Figure 6-112 shows the stage comparison at the Violet Diversion. Figure 6-113 shows the
relative difference in the stage for cross-sections upstream and downstream of the diversion.
-3.0
-2.5
-2.0
-1.5
-1.0
-0.5
0.0
0.5
1/1/2007 4/1/2007 7/1/2007 10/1/2007 1/1/2008 4/1/2008
Rel
ati
ve
Sta
ge
(ft)
Date
Bonnet Carré (Mile 128.6)
Upstream
Downstream

230
Figure 6-112: 2007-2008 Stage Comparison at the Violet Diversion due to the Addition of the Barataria and
Pontchartrain Basin Diversions; the Closure of South Pass, Southwest Pass, and West Bay; and the Dredging
of Pass a Loutré to the ‘oil spill’ Dimensions for the Proposed Diversions Combined with the Changes to the
Delta Distributaries Study.
0
2
4
6
8
10
12
14
16
1/1/2007 4/1/2007 7/1/2007 10/1/2007 1/1/2008 4/1/2008
Sta
ge
(ft)
Date
Violet (Mile 83.8)
07 Calibration/08 Validation (Upstream)
07-08-Bara-Pont-WB-SP-SWP-Pal (Upstream)
07 Calibration/08 Validation (Downstream)
07-08-Bara-Pont-WB-SP-SWP-Pal (Downstream)

231
Figure 6-113: 2007-2008 Relative Stage Comparison at the Violet Diversion due to the Addition of the
Barataria and Pontchartrain Basin Diversions; the Closure of South Pass, Southwest Pass, and West Bay;
and the Dredging of Pass a Loutré to the ‘oil spill’ Dimensions for the Proposed Diversions Combined with
the Changes to the Delta Distributaries Study.
Figure 6-114 shows the stage comparison at the Belair Diversion. Figure 6-115 shows the
relative difference in the stage for cross-sections upstream and downstream of the diversion.
-3.5
-3.0
-2.5
-2.0
-1.5
-1.0
-0.5
0.0
0.5
1/1/2007 4/1/2007 7/1/2007 10/1/2007 1/1/2008 4/1/2008
Rel
ati
ve
Sta
ge
(ft)
Date
Violet (Mile 83.8)
Upstream
Downstream

232
Figure 6-114: 2007-2008 Stage Comparison at the Belair Diversion due to the Addition of the Barataria and
Pontchartrain Basin Diversions; the Closure of South Pass, Southwest Pass, and West Bay; and the Dredging
of Pass a Loutré to the ‘oil spill’ Dimensions for the Proposed Diversions Combined with the Changes to the
Delta Distributaries Study.
0
2
4
6
8
10
12
1/1/2007 4/1/2007 7/1/2007 10/1/2007 1/1/2008 4/1/2008
Sta
ge
(ft)
Date
Belair (Mile 64.9)
07 Calibration/08 Validation (Upstream)
07-08-Bara-Pont-WB-SP-SWP-Pal (Upstream)
07 Calibration/08 Validation (Downstream)
07-08-Bara-Pont-WB-SP-SWP-Pal (Downstream)

233
Figure 6-115: 2007-2008 Relative Stage Comparison at the Belair Diversion due to the Addition of the
Barataria and Pontchartrain Basin Diversions; the Closure of South Pass, Southwest Pass, and West Bay;
and the Dredging of Pass a Loutré to the ‘oil spill’ Dimensions for the Proposed Diversions Combined with
the Changes to the Delta Distributaries Study.
Figure 6-116 shows the stage comparison at the Myrtle Grove Diversion. Figure 6-117 shows the
relative difference in the stage for cross-sections upstream and downstream of the diversion.
-3.5
-3.0
-2.5
-2.0
-1.5
-1.0
-0.5
0.0
0.5
1/1/2007 4/1/2007 7/1/2007 10/1/2007 1/1/2008 4/1/2008
Rel
ati
ve
Sta
ge
(ft)
Date
Belair (Mile 64.9)
Upstream
Downstream

234
Figure 6-116: 2007-2008 Stage Comparison at the Myrtle Grove Diversion due to the Addition of the
Barataria and Pontchartrain Basin Diversions; the Closure of South Pass, Southwest Pass, and West Bay;
and the Dredging of Pass a Loutré to the ‘oil spill’ Dimensions for the Proposed Diversions Combined with
the Changes to the Delta Distributaries Study.
0
2
4
6
8
10
12
1/1/2007 4/1/2007 7/1/2007 10/1/2007 1/1/2008 4/1/2008
Sta
ge
(ft)
Date
Myrtle Grove (Mile 59.3)
07 Calibration/08 Validation (Upstream)
07-08-Bara-Pont-WB-SP-SWP-Pal (Upstream)
07 Calibration/08 Validation (Downstream)
07-08-Bara-Pont-WB-SP-SWP-Pal (Downstream)

235
Figure 6-117: 2007-2008 Relative Stage Comparison at the Myrtle Grove Diversion due to the Addition of the
Barataria and Pontchartrain Basin Diversions; the Closure of South Pass, Southwest Pass, and West Bay;
and the Dredging of Pass a Loutré to the ‘oil spill’ Dimensions for the Proposed Diversions Combined with
the Changes to the Delta Distributaries Study.
Figure 6-118 shows the stage comparison at the Deer Range Diversion. Figure 6-119 shows the
relative difference in the stage for cross-sections upstream and downstream of the diversion.
-3.0
-2.5
-2.0
-1.5
-1.0
-0.5
0.0
0.5
1/1/2007 4/1/2007 7/1/2007 10/1/2007 1/1/2008 4/1/2008
Rel
ati
ve
Sta
ge
(ft)
Date
Myrtle Grove (Mile 59.3)
Upstream
Downstream

236
Figure 6-118: 2007-2008 Stage Comparison at the Deer Range Diversion due to the Addition of the Barataria
and Pontchartrain Basin Diversions; the Closure of South Pass, Southwest Pass, and West Bay; and the
Dredging of Pass a Loutré to the ‘oil spill’ Dimensions for the Proposed Diversions Combined with the
Changes to the Delta Distributaries Study.
0
1
2
3
4
5
6
7
8
9
10
1/1/2007 4/1/2007 7/1/2007 10/1/2007 1/1/2008 4/1/2008
Sta
ge
(ft)
Date
Deer Range (Mile 53.9)
07 Calibration/08 Validation (Upstream)
07-08-Bara-Pont-WB-SP-SWP-Pal (Upstream)
07 Calibration/08 Validation (Downstream)
07-08-Bara-Pont-WB-SP-SWP-Pal (Downstream)

237
Figure 6-119: 2007-2008 Relative Stage Comparison at the Deer Range Diversion due to the Addition of the
Barataria and Pontchartrain Basin Diversions; the Closure of South Pass, Southwest Pass, and West Bay;
and the Dredging of Pass a Loutré to the ‘oil spill’ Dimensions for the Proposed Diversions Combined with
the Changes to the Delta Distributaries Study.
Figure 6-120 shows the stage comparison at the Bohemia Spillway. Figure 6-121 shows the
relative difference in the stage for arbitrary cross-sections upstream, mid-stream, and
downstream of the diversion. Table 6-38 shows the stage values for the different cross-sections
for April 1, 2008 to April 15, 2008 to show the changes from the 2007 calibration/2008
validation simulation to the proposed MLODS simulation.
-3.0
-2.5
-2.0
-1.5
-1.0
-0.5
0.0
0.5
1/1/2007 4/1/2007 7/1/2007 10/1/2007 1/1/2008 4/1/2008
Rel
ati
ve
Sta
ge
(ft)
Date
Deer Range (Mile 53.9)
Upstream
Downstream
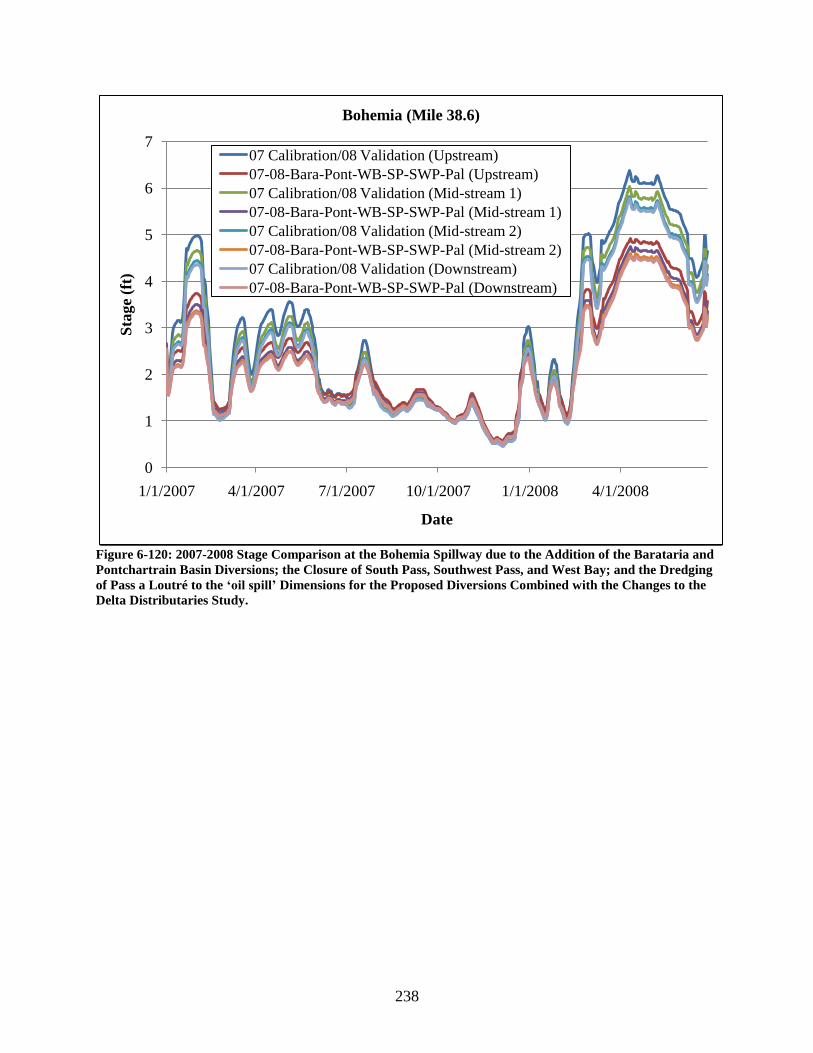
238
Figure 6-120: 2007-2008 Stage Comparison at the Bohemia Spillway due to the Addition of the Barataria and
Pontchartrain Basin Diversions; the Closure of South Pass, Southwest Pass, and West Bay; and the Dredging
of Pass a Loutré to the ‘oil spill’ Dimensions for the Proposed Diversions Combined with the Changes to the
Delta Distributaries Study.
0
1
2
3
4
5
6
7
1/1/2007 4/1/2007 7/1/2007 10/1/2007 1/1/2008 4/1/2008
Sta
ge
(ft)
Date
Bohemia (Mile 38.6)
07 Calibration/08 Validation (Upstream)
07-08-Bara-Pont-WB-SP-SWP-Pal (Upstream)
07 Calibration/08 Validation (Mid-stream 1)
07-08-Bara-Pont-WB-SP-SWP-Pal (Mid-stream 1)
07 Calibration/08 Validation (Mid-stream 2)
07-08-Bara-Pont-WB-SP-SWP-Pal (Mid-stream 2)
07 Calibration/08 Validation (Downstream)
07-08-Bara-Pont-WB-SP-SWP-Pal (Downstream)
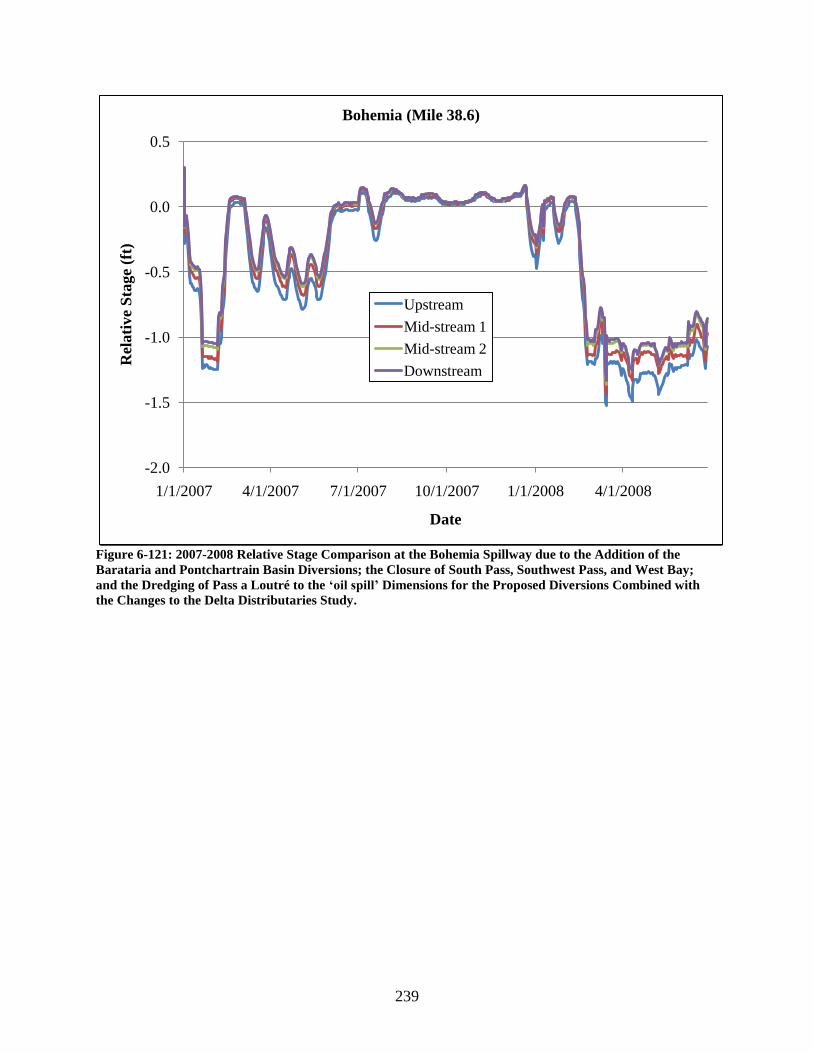
239
Figure 6-121: 2007-2008 Relative Stage Comparison at the Bohemia Spillway due to the Addition of the
Barataria and Pontchartrain Basin Diversions; the Closure of South Pass, Southwest Pass, and West Bay;
and the Dredging of Pass a Loutré to the ‘oil spill’ Dimensions for the Proposed Diversions Combined with
the Changes to the Delta Distributaries Study.
-2.0
-1.5
-1.0
-0.5
0.0
0.5
1/1/2007 4/1/2007 7/1/2007 10/1/2007 1/1/2008 4/1/2008
Rel
ati
ve
Sta
ge
(ft)
Date
Bohemia (Mile 38.6)
Upstream
Mid-stream 1
Mid-stream 2
Downstream

240
Table 6-38: April 2008 Stage Values from the 2007 Calibration/2008 Validation and the 07-08-Bara-Pont-
WB-SP-SWP-Pal Simulation at the Bohemia Spillway for the Proposed Diversions Combined with the
Changes to the Delta Distributaries Study.
Date / Cross-
section
Upstream (ft) Mid-stream 1
(ft)
Mid-stream 2
(ft)
Downstream
(ft)
Cal. MLODS Cal. MLODS Cal. MLODS Cal. MLODS
4/1/2008 5.75 4.5 5.42 4.30 5.22 4.16 5.15 4.10
4/2/2008 5.81 4.54 5.48 4.35 5.28 4.21 5.21 4.15
4/3/2008 5.88 4.58 5.55 4.39 5.34 4.26 5.27 4.20
4/4/2008 5.96 4.63 5.63 4.45 5.43 4.31 5.36 4.25
4/5/2008 6.03 4.68 5.70 4.50 5.50 4.36 5.43 4.30
4/6/2008 6.1 4.72 5.76 4.54 5.56 4.40 5.5 4.34
4/7/2008 6.17 4.76 5.83 4.58 5.63 4.44 5.56 4.38
4/8/2008 6.25 4.8 5.91 4.62 5.71 4.48 5.65 4.42
4/9/2008 6.31 4.84 5.97 4.66 5.77 4.53 5.71 4.47
4/10/2008 6.37 4.88 6.03 4.70 5.83 4.57 5.77 4.51
4/11/2008 6.31 4.92 5.97 4.74 5.78 4.60 5.71 4.54
4/12/2008 6.19 4.86 5.86 4.68 5.66 4.54 5.59 4.48
4/13/2008 6.15 4.83 5.82 4.65 5.62 4.52 5.55 4.46
4/14/2007 6.15 4.83 5.81 4.65 5.61 4.51 5.55 4.45
4/15/2007 6.15 4.83 5.81 4.65 5.22 4.51 5.55 4.45
Figure 6-122 shows the stage comparison at the Buras Diversion. Figure 6-123 shows the
relative difference in the stage for cross-sections upstream and downstream of the diversion.

241
Figure 6-122: 2007-2008 Stage Comparison at the Buras Diversion due to the Addition of the Barataria and
Pontchartrain Basin Diversions; the Closure of South Pass, Southwest Pass, and West Bay; and the Dredging
of Pass a Loutré to the ‘oil spill’ Dimensions for the Proposed Diversions Combined with the Changes to the
Delta Distributaries Study.
0
1
2
3
4
5
6
1/1/2007 4/1/2007 7/1/2007 10/1/2007 1/1/2008 4/1/2008
Sta
ge
(ft)
Date
Buras (Mile 24.9)
07 Calibration/08 Validation (Upstream)
07-08-Bara-Pont-WB-SP-SWP-Pal (Upstream)
07 Calibration/08 Validation (Downstream)
07-08-Bara-Pont-WB-SP-SWP-Pal (Downstream)

242
Figure 6-123: 2007-2008 Relative Stage Comparison at the Buras Diversion due to the Addition of the
Barataria and Pontchartrain Basin Diversions; the Closure of South Pass, Southwest Pass, and West Bay;
and the Dredging of Pass a Loutré to the ‘oil spill’ Dimensions for the Proposed Diversions Combined with
the Changes to the Delta Distributaries Study.
To estimate how the stage changes along the MR, Figures 6-124, 6-125, and 6-126 show the
stage comparison at Baton Rouge, Carrollton, and Venice, respectively. Table 6-39 shows the
mean and maximum difference in stage from the 2007 calibration and 2008 validation
simulations at the comparison gages.
-1.2
-1.0
-0.8
-0.6
-0.4
-0.2
0.0
0.2
0.4
0.6
0.8
1/1/2007 4/1/2007 7/1/2007 10/1/2007 1/1/2008 4/1/2008
Rel
ati
ve
Sta
ge
(ft)
Date
Buras (Mile 24.9)
Upstream
Downstream

243
Figure 6-124: 2007-2008 Stage Comparison at Baton Rouge due to the Addition of the Barataria and
Pontchartrain Basin Diversions; the Closure of South Pass, Southwest Pass, and West Bay; and the Dredging
of Pass a Loutré to the ‘oil spill’ Dimensions for the Proposed Diversions Combined with the Changes to the
Delta Distributaries Study.
0
5
10
15
20
25
30
35
40
45
10/10/2006 1/18/2007 4/28/2007 8/6/2007 11/14/2007 2/22/2008 6/1/2008 9/9/2008
Sta
ge
(ft)
Date
Baton Rouge (Mile 228.4)
07 Calibration/08 Validation
07-08-Bara-Pont-WB-SP-SWP-Pal

244
Figure 6-125: 2007-2008 Stage Comparison at Carrollton due to the Addition of the Barataria and
Pontchartrain Basin Diversions; the Closure of South Pass, Southwest Pass, and West Bay; and the Dredging
of Pass a Loutré to the ‘oil spill’ Dimensions for the Proposed Diversions Combined with the Changes to the
Delta Distributaries Study.
0
2
4
6
8
10
12
14
16
18
20
10/10/2006 1/18/2007 4/28/2007 8/6/2007 11/14/2007 2/22/2008 6/1/2008 9/9/2008
Sta
ge
(ft)
Date
Carrollton (Mile 102.8)
07 Calibration/08 Validation
07-08-Bara-Pont-WB-SP-SWP-Pal

245
Figure 6-126: 2007-2008 Stage Comparison at Venice due to the Addition of the Barataria and Pontchartrain
Basin Diversions; the Closure of South Pass, Southwest Pass, and West Bay; and the Dredging of Pass a
Loutré to the ‘oil spill’ Dimensions for the Proposed Diversions Combined with the Changes to the Delta
Distributaries Study.
Table 6-39: 2007-2008 Mean and Maximum Difference in Stage due to the Addition of the Barataria and
Pontchartrain Basin Diversions; the Closure of South Pass, Southwest Pass, and West Bay; and the
Replacement of Pass a Loutré by the ‘oil spill’ Dimensions for the Proposed Diversions Combined with the
Changes to the Delta Distributaries Study (07-08-Bara-Pont-WB-SP-SWP-Pal vs. 2007 Calibration/2008
Validation).
Parameter /
Gage
Baton
Rouge Donaldsonville
North of
Bonnet
Carré
Bonnet
Carré Carrollton
West
Pointe a
la
Hache
Venice
Mean Stage
Difference
(ft)
-0.39 -0.57 -0.52 -0.53 -0.61 -0.43 0.25
Max Stage
Difference
(ft)
-1.27 -2.12 -2.70 -2.73 -2.93 -2.10 1.02
0
0.5
1
1.5
2
2.5
3
3.5
4
10/10/2006 1/18/2007 4/28/2007 8/6/2007 11/14/2007 2/22/2008 6/1/2008 9/9/2008
Sta
ge
(ft)
Date
Venice (Mile 10.7)
07 Calibration/08 Validation
07-08-Bara-Pont-WB-SP-SWP-Pal

246
Figure 6-126 and Table 6-39 show that the stage near the Head of Passes (HOP) increases at low
flows due to the addition of the MLODS diversions and pass modifications, which could increase
the shear stress in the delta.
The next parameter under investigation was the change in the currents in the river due to the
proposed diversions. Figure 6-127 shows the velocity comparison at the Bonnet Carré Spillway.
Figure 6-128 shows the relative difference in the velocity for cross-sections upstream and
downstream of the diversion.
Figure 6-127: 2007-2008 Velocity Comparison at the Bonnet Carré Spillway due to the Addition of the
Barataria and Pontchartrain Basin Diversions; the Closure of South Pass, Southwest Pass, and West Bay;
and the Dredging of Pass a Loutré to the ‘oil spill’ Dimensions for the Proposed Diversions Combined with
the Changes to the Delta Distributaries Study.
0
1
2
3
4
5
6
7
8
9
1/1/2007 4/1/2007 7/1/2007 10/1/2007 1/1/2008 4/1/2008
Vel
oci
ty (
ft/s
)
Date
Bonnet Carré (Mile 128.6)
07 Calibration/08 Validation (Upstream)
07-08-Bara-Pont-WB-SP-SWP-Pal (Upstream)
07 Calibration/08 Validation (Downstream)
07-08-Bara-Pont-WB-SP-SWP-Pal (Downstream)

247
Figure 6-128: 2007-2008 Relative Velocity Comparison at the Bonnet Carré Spillway due to the Addition of
the Barataria and Pontchartrain Basin Diversions; the Closure of South Pass, Southwest Pass, and West Bay;
and the Dredging of Pass a Loutré to the ‘oil spill’ Dimensions for the Proposed Diversions Combined with
the Changes to the Delta Distributaries Study.
Figure 6-129 shows the velocity comparison at the Violet Diversion. Figure 6-130 shows the
relative difference in the velocity for cross-sections upstream and downstream of the diversion.
-0.3
-0.2
-0.1
0.0
0.1
0.2
0.3
0.4
1/1/2007 4/1/2007 7/1/2007 10/1/2007 1/1/2008 4/1/2008
Rel
ati
ve
Vel
oci
ty (
ft/s
)
Date
Bonnet Carré (Mile 128.6)
Upstream
Downstream

248
Figure 6-129: 2007-2008 Velocity Comparison at the Violet Diversion due to the Addition of the Barataria
and Pontchartrain Basin Diversions; the Closure of South Pass, Southwest Pass, and West Bay; and the
Dredging of Pass a Loutré to the ‘oil spill’ Dimensions for the Proposed Diversions Combined with the
Changes to the Delta Distributaries Study.
0
1
2
3
4
5
6
7
1/1/2007 4/1/2007 7/1/2007 10/1/2007 1/1/2008 4/1/2008
Vel
oci
ty (
ft/s
)
Date
Violet (Mile 83.8)
07 Calibration/08 Validation (Upstream)
07-08-Bara-Pont-WB-SP-SWP-Pal (Upstream)
07 Calibration/08 Validation (Downstream)
07-08-Bara-Pont-WB-SP-SWP-Pal (Downstream)

249
Figure 6-130: 2007-2008 Relative Velocity Comparison at the Violet Diversion due to the Addition of the
Barataria and Pontchartrain Basin Diversions; the Closure of South Pass, Southwest Pass, and West Bay;
and the Dredging of Pass a Loutré to the ‘oil spill’ Dimensions for the Proposed Diversions Combined with
the Changes to the Delta Distributaries Study.
Figure 6-131 shows the velocity comparison at the Belair Diversion. Figure 6-132 shows the
relative difference in the velocity for cross-sections upstream and downstream of the diversion.
-0.3
-0.2
-0.1
0.0
0.1
0.2
0.3
0.4
0.5
1/1/2007 4/1/2007 7/1/2007 10/1/2007 1/1/2008 4/1/2008
Rel
ati
ve
Vel
oci
ty (
ft/s
)
Date
Violet (Mile 83.8)
Upstream
Downstream

250
Figure 6-131: 2007-2008 Velocity Comparison at the Belair Diversion due to the Addition of the Barataria
and Pontchartrain Basin Diversions; the Closure of South Pass, Southwest Pass, and West Bay; and the
Dredging of Pass a Loutré to the ‘oil spill’ Dimensions for the Proposed Diversions Combined with the
Changes to the Delta Distributaries Study.
0
1
2
3
4
5
6
7
1/1/2007 4/1/2007 7/1/2007 10/1/2007 1/1/2008 4/1/2008
Vel
oci
ty (
ft/s
)
Date
Belair (Mile 64.9)
07 Calibration/08 Validation (Upstream)
07-08-Bara-Pont-WB-SP-SWP-Pal (Upstream)
07 Calibration/08 Validation (Downstream)
07-08-Bara-Pont-WB-SP-SWP-Pal (Downstream)
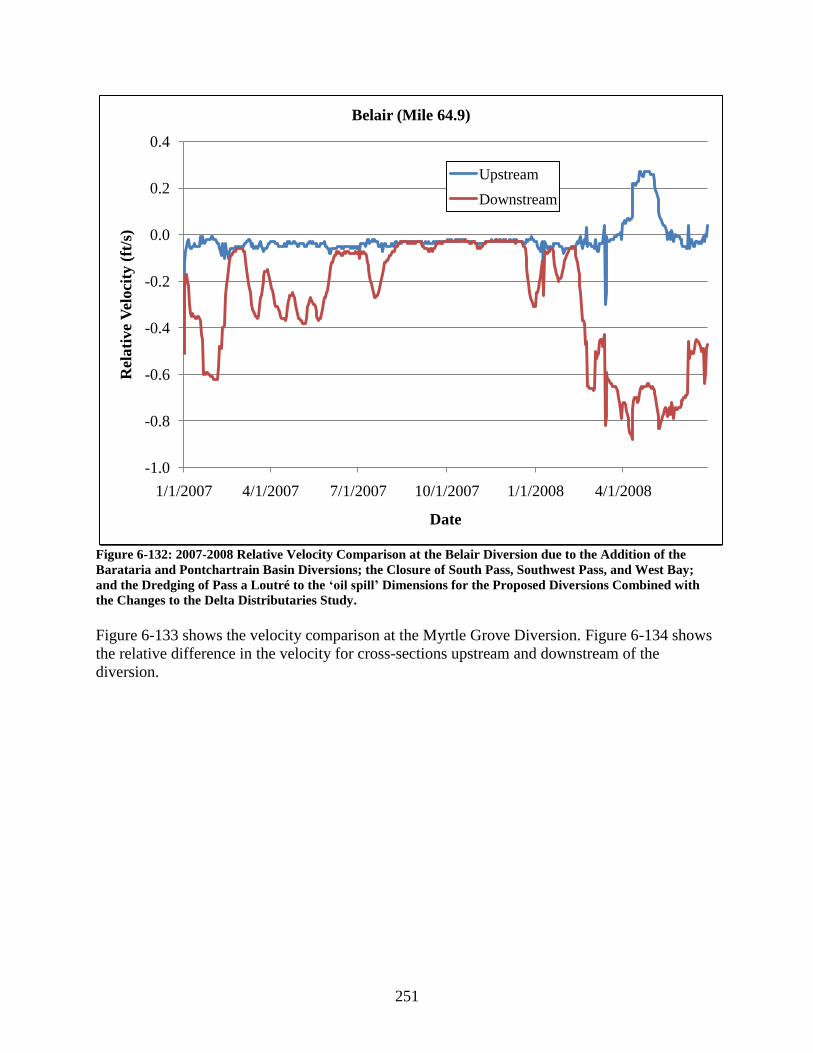
251
Figure 6-132: 2007-2008 Relative Velocity Comparison at the Belair Diversion due to the Addition of the
Barataria and Pontchartrain Basin Diversions; the Closure of South Pass, Southwest Pass, and West Bay;
and the Dredging of Pass a Loutré to the ‘oil spill’ Dimensions for the Proposed Diversions Combined with
the Changes to the Delta Distributaries Study.
Figure 6-133 shows the velocity comparison at the Myrtle Grove Diversion. Figure 6-134 shows
the relative difference in the velocity for cross-sections upstream and downstream of the
diversion.
-1.0
-0.8
-0.6
-0.4
-0.2
0.0
0.2
0.4
1/1/2007 4/1/2007 7/1/2007 10/1/2007 1/1/2008 4/1/2008
Rel
ati
ve
Vel
oci
ty (
ft/s
)
Date
Belair (Mile 64.9)
Upstream
Downstream

252
Figure 6-133: 2007-2008 Velocity Comparison at the Myrtle Grove Diversion due to the Addition of the
Barataria and Pontchartrain Basin Diversions; the Closure of South Pass, Southwest Pass, and West Bay;
and the Dredging of Pass a Loutré to the ‘oil spill’ Dimensions for the Proposed Diversions Combined with
the Changes to the Delta Distributaries Study.
0
1
2
3
4
5
6
7
1/1/2007 4/1/2007 7/1/2007 10/1/2007 1/1/2008 4/1/2008
Vel
oci
ty (
ft/s
)
Date
Myrtle Grove (Mile 59.3)
07 Calibration/08 Validation (Upstream)
07-08-Bara-Pont-WB-SP-SWP-Pal (Upstream)
07 Calibration/08 Validation (Downstream)
07-08-Bara-Pont-WB-SP-SWP-Pal (Downstream)

253
Figure 6-134: 2007-2008 Relative Velocity Comparison at the Myrtle Grove Diversion due to the Addition of
the Barataria and Pontchartrain Basin Diversions; the Closure of South Pass, Southwest Pass, and West Bay;
and the Dredging of Pass a Loutré to the ‘oil spill’ Dimensions for the Proposed Diversions Combined with
the Changes to the Delta Distributaries Study.
Figure 6-135 shows the velocity comparison at the Deer Range Diversion. Figure 6-136 shows
the relative difference in the velocity for cross-sections upstream and downstream of the
diversion.
-1.4
-1.2
-1.0
-0.8
-0.6
-0.4
-0.2
0.0
1/1/2007 4/1/2007 7/1/2007 10/1/2007 1/1/2008 4/1/2008
Rel
ati
ve
Vel
oci
ty (
ft/s
)
Date
Myrtle Grove (Mile 59.3)
Upstream
Downstream

254
Figure 6-135: 2007-2008 Velocity Comparison at the Deer Range Diversion due to the Addition of the
Barataria and Pontchartrain Basin Diversions; the Closure of South Pass, Southwest Pass, and West Bay;
and the Dredging of Pass a Loutré to the ‘oil spill’ Dimensions for the Proposed Diversions Combined with
the Changes to the Delta Distributaries Study.
0
1
2
3
4
5
6
7
1/1/2007 4/1/2007 7/1/2007 10/1/2007 1/1/2008 4/1/2008
Vel
oic
ty (
ft/s
)
Date
Deer Range (Mile 53.9)
07 Calibration/08 Validation (Upstream)
07-08-Bara-Pont-WB-SP-SWP-Pal (Upstream)
07 Calibration/08 Validation (Downstream)
07-08-Bara-Pont-WB-SP-SWP-Pal (Downstream)

255
Figure 6-136: 2007-2008 Relative Velocity Comparison at the Deer Range Diversion due to the Addition of
the Barataria and Pontchartrain Basin Diversions; the Closure of South Pass, Southwest Pass, and West Bay;
and the Dredging of Pass a Loutré to the ‘oil spill’ Dimensions for the Proposed Diversions Combined with
the Changes to the Delta Distributaries Study.
Figure 6-137 shows the velocity comparison at the Bohemia Spillway. Figure 6-138 shows the
relative difference in the velocity for arbitrary cross-sections upstream, mid-stream, and
downstream of the diversion. Table 6-40 shows the velocity values for the different cross-
sections for April 1, 2008 to April 15, 2008 to show the changes from the 2007 calibration/2008
validation simulation to the proposed MLODS simulation.
-1.6
-1.4
-1.2
-1.0
-0.8
-0.6
-0.4
-0.2
0.0
1/1/2007 4/1/2007 7/1/2007 10/1/2007 1/1/2008 4/1/2008
Rel
ati
ve
Vel
oci
ty (
ft/s
)
Date
Deer Range (Mile 53.9)
Upstream
Downstream

256
Figure 6-137: 2007-2008 Velocity Comparison at the Bohemia Spillway due to the Addition of the Barataria
and Pontchartrain Basin Diversions; the Closure of South Pass, Southwest Pass, and West Bay; and the
Dredging of Pass a Loutré to the ‘oil spill’ Dimensions for the Proposed Diversions Combined with the
Changes to the Delta Distributaries Study.
0
1
2
3
4
5
6
7
1/1/2007 4/1/2007 7/1/2007 10/1/2007 1/1/2008 4/1/2008
Vel
oci
ty (
ft/s
)
Date
Bohemia (Mile 38.6)
07 Calibration/08 Validation (Upstream)
07-08-Bara-Pont-WB-SP-SWP-Pal (Upstream)
07 Calibration/08 Validation (Mid-stream 1)
07-08-Bara-Pont-WB-SP-SWP-Pal (Mid-stream 1)
07 Calibration/08 Validation (Mid-stream 2)
07-08-Bara-Pont-WB-SP-SWP-Pal (Mid-stream 2)
07 Calibration/08 Validation (Downstream)
07-08-Bara-Pont-WB-SP-SWP-Pal (Downstream)

257
Figure 6-138: 2007-2008 Relative Velocity Comparison at the Bohemia Spillway due to the Addition of the
Barataria and Pontchartrain Basin Diversions; the Closure of South Pass, Southwest Pass, and West Bay;
and the Dredging of Pass a Loutré to the ‘oil spill’ Dimensions for the Proposed Diversions Combined with
the Changes to the Delta Distributaries Study.
-2.0
-1.8
-1.6
-1.4
-1.2
-1.0
-0.8
-0.6
-0.4
-0.2
0.0
1/1/2007 4/1/2007 7/1/2007 10/1/2007 1/1/2008 4/1/2008
Rel
ati
ve
Vel
oci
ty (
ft/s
)
Date
Bohemia (Mile 38.6)
Upstream
Mid-stream 1
Mid-stream 2
Downstream

258
Table 6-40: April 2008 Velocity Values from the 2007 Calibration/2008 Validation and the 07-08-Bara-Pont-
WB-SP-SWP-Pal Simulation at the Bohemia Spillway for the Proposed Diversions Combined with the
Changes to the Delta Distributaries Study.
Date / Cross-
section
Upstream
(ft/s)
Mid-stream 1
(ft/s)
Mid-stream 2
(ft/s)
Downstream
(ft/s)
Cal. MLODS Cal. MLODS Cal. MLODS Cal. MLODS
4/1/2008 5.62 4.58 5.46 4.25 4.71 3.74 4.59 3.70
4/2/2008 5.69 4.64 5.51 4.29 4.75 3.76 4.61 3.72
4/3/2008 5.77 4.7 5.57 4.33 4.78 3.79 4.64 3.75
4/4/2008 5.87 4.77 5.65 4.38 4.83 3.82 4.68 3.78
4/5/2008 5.95 4.84 5.71 4.43 4.87 3.85 4.71 3.80
4/6/2008 6.04 4.89 5.77 4.46 4.91 3.87 4.74 3.82
4/7/2008 6.12 4.94 5.84 4.50 4.95 3.89 4.77 3.84
4/8/2008 6.22 5 5.92 4.54 4.99 3.92 4.81 3.86
4/9/2008 6.31 5.07 5.98 4.59 5.03 3.94 4.84 3.89
4/10/2008 6.38 5.12 6.03 4.63 5.07 3.97 4.86 3.91
4/11/2008 6.31 5.17 5.98 4.66 5.03 3.99 4.84 3.93
4/12/2008 6.15 5.08 5.86 4.60 4.96 3.95 4.78 3.89
4/13/2008 6.11 5.05 5.83 4.58 4.94 3.94 4.77 3.88
4/14/2007 6.1 5.04 5.82 4.57 4.94 3.94 4.77 3.88
4/15/2007 6.1 5.05 5.83 4.57 4.94 3.94 4.77 3.88
Figure 6-139 shows the velocity comparison at the Buras Diversion. Figure 6-140 shows the
relative difference in the velocity for cross-sections upstream and downstream of the diversion.
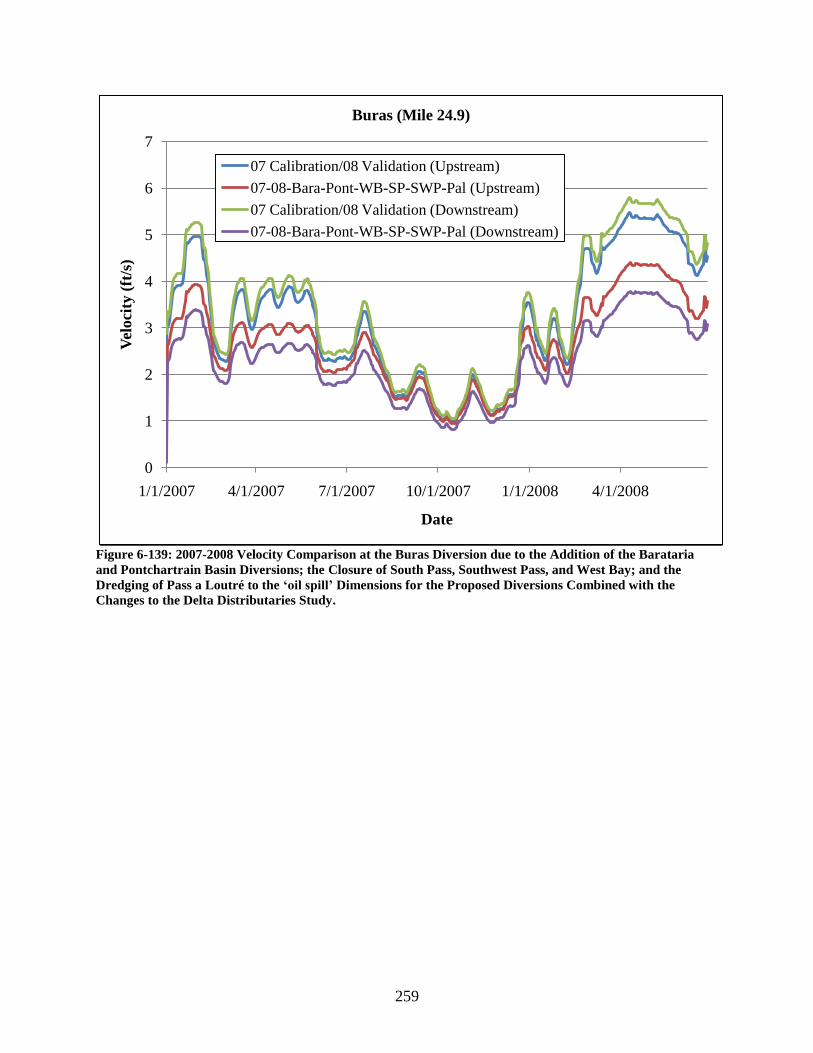
259
Figure 6-139: 2007-2008 Velocity Comparison at the Buras Diversion due to the Addition of the Barataria
and Pontchartrain Basin Diversions; the Closure of South Pass, Southwest Pass, and West Bay; and the
Dredging of Pass a Loutré to the ‘oil spill’ Dimensions for the Proposed Diversions Combined with the
Changes to the Delta Distributaries Study.
0
1
2
3
4
5
6
7
1/1/2007 4/1/2007 7/1/2007 10/1/2007 1/1/2008 4/1/2008
Vel
oci
ty (
ft/s
)
Date
Buras (Mile 24.9)
07 Calibration/08 Validation (Upstream)
07-08-Bara-Pont-WB-SP-SWP-Pal (Upstream)
07 Calibration/08 Validation (Downstream)
07-08-Bara-Pont-WB-SP-SWP-Pal (Downstream)
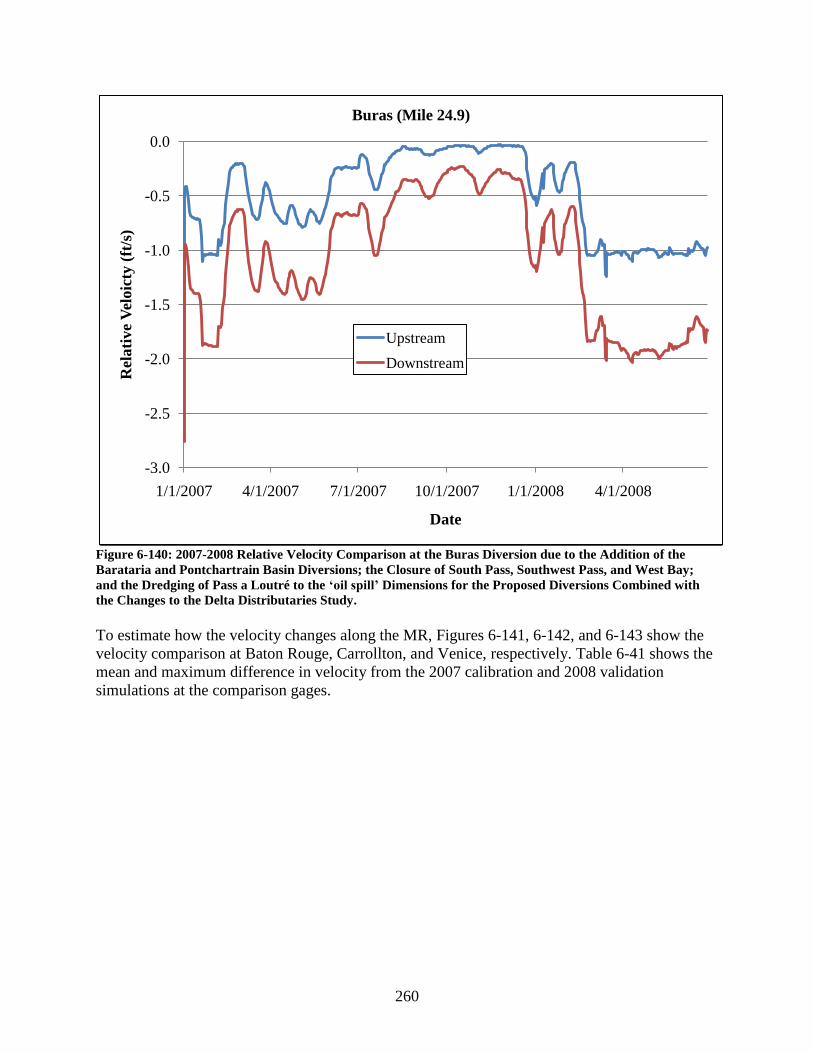
260
Figure 6-140: 2007-2008 Relative Velocity Comparison at the Buras Diversion due to the Addition of the
Barataria and Pontchartrain Basin Diversions; the Closure of South Pass, Southwest Pass, and West Bay;
and the Dredging of Pass a Loutré to the ‘oil spill’ Dimensions for the Proposed Diversions Combined with
the Changes to the Delta Distributaries Study.
To estimate how the velocity changes along the MR, Figures 6-141, 6-142, and 6-143 show the
velocity comparison at Baton Rouge, Carrollton, and Venice, respectively. Table 6-41 shows the
mean and maximum difference in velocity from the 2007 calibration and 2008 validation
simulations at the comparison gages.
-3.0
-2.5
-2.0
-1.5
-1.0
-0.5
0.0
1/1/2007 4/1/2007 7/1/2007 10/1/2007 1/1/2008 4/1/2008
Rel
ati
ve
Vel
oic
ty (
ft/s
)
Date
Buras (Mile 24.9)
Upstream
Downstream

261
Figure 6-141: 2007-2008 Velocity Comparison at Baton Rouge due to the Addition of the Barataria and
Pontchartrain Basin Diversions; the Closure of South Pass, Southwest Pass, and West Bay; and the Dredging
of Pass a Loutré to the ‘oil spill’ Dimensions for the Proposed Diversions Combined with the Changes to the
Delta Distributaries Study.
0
1
2
3
4
5
6
10/10/2006 1/18/2007 4/28/2007 8/6/2007 11/14/2007 2/22/2008 6/1/2008 9/9/2008
Vel
oci
ty (
ft/s
)
Date
Baton Rouge (Mile 228.4)
07 Calibration/08 Validation
07-08-Bara-Pont-WB-SP-SWP-Pal

262
Figure 6-142: 2007-2008 Velocity Comparison at Carrollton due to the Addition of the Barataria and
Pontchartrain Basin Diversions; the Closure of South Pass, Southwest Pass, and West Bay; and the Dredging
of Pass a Loutré to the ‘oil spill’ Dimensions for the Proposed Diversions Combined with the Changes to the
Delta Distributaries Study.
0
1
2
3
4
5
6
7
10/10/2006 1/18/2007 4/28/2007 8/6/2007 11/14/2007 2/22/2008 6/1/2008 9/9/2008
Vel
oci
ty (
ft/s
)
Date
Carrollton (Mile 102.8)
07 Calibration/08 Validation
07-08-Bara-Pont-WB-SP-SWP-Pal

263
Figure 6-143: 2007-2008 Velocity Comparison at Venice due to the Addition of the Barataria and
Pontchartrain Basin Diversions; the Closure of South Pass, Southwest Pass, and West Bay; and the Dredging
of Pass a Loutré to the ‘oil spill’ Dimensions for the Proposed Diversions Combined with the Changes to the
Delta Distributaries Study.
Table 6-41: 2007-2008 Mean and Maximum Difference in Velocity due to the Addition of the Barataria and
Pontchartrain Basin Diversions; the Closure of South Pass, Southwest Pass, and West Bay; and the
Replacement of Pass a Loutré by the ‘oil spill’ Dimensions for the Proposed Diversions Combined with the
Changes to the Delta Distributaries Study (07-08-Bara-Pont-WB-SP-SWP-Pal vs. 2007 Calibration/2008
Validation).
Parameter /
Gage
Baton
Rouge Donaldsonville
North of
Bonnet
Carré
Bonnet
Carré Carrollton
West
Pointe a
la
Hache
Venice
Mean
Velocity
Difference
(ft/s)
0.04 0.06 0.02 0.05 0.03 -0.42 -1.01
Max Velocity
Difference
(ft/s)
1.00 0.69 0.28 0.35 0.32 -1.24 -1.88
0
0.5
1
1.5
2
2.5
3
3.5
4
4.5
5
10/10/2006 1/18/2007 4/28/2007 8/6/2007 11/14/2007 2/22/2008 6/1/2008 9/9/2008
Vel
oci
ty (
ft/s
)
Date
Venice (Mile 10.7)
07 Calibration/08 Validation
07-08-Bara-Pont-WB-SP-SWP-Pal

264
The next parameter under investigation was the change in the shear stress in the river due to the
proposed diversions. Figure 6-144 shows the shear stress comparison at the Bonnet Carré
Spillway. Figure 6-145 shows the relative difference in the shear stress for cross-sections
upstream and downstream of the diversion.
Figure 6-144: 2007-2008 Shear Stress Comparison at the Bonnet Carré Spillway due to the Addition of the
Barataria and Pontchartrain Basin Diversions; the Closure of South Pass, Southwest Pass, and West Bay;
and the Dredging of Pass a Loutré to the ‘oil spill’ Dimensions for the Proposed Diversions Combined with
the Changes to the Delta Distributaries Study.
0.00
0.02
0.04
0.06
0.08
0.10
0.12
0.14
0.16
0.18
1/1/2007 4/1/2007 7/1/2007 10/1/2007 1/1/2008 4/1/2008
Sh
ear
Str
ess
(psf
)
Date
Bonnet Carré (Mile 128.6)
07 Calibration/08 Validation (Upstream)
07-08-Bara-Pont-WB-SP-SWP-Pal (Upstream)
07 Calibration/08 Validation (Downstream)
07-08-Bara-Pont-WB-SP-SWP-Pal (Downstream)

265
Figure 6-145: 2007-2008 Relative Shear Stress Comparison at the Bonnet Carré Spillway due to the Addition
of the Barataria and Pontchartrain Basin Diversions; the Closure of South Pass, Southwest Pass, and West
Bay; and the Dredging of Pass a Loutré to the ‘oil spill’ Dimensions for the Proposed Diversions Combined
with the Changes to the Delta Distributaries Study.
Figure 6-146 shows the shear stress comparison for the Violet Diversion. Figure 6-147 shows the
relative difference in the shear stress for cross-sections upstream and downstream of the
diversion.
-0.01
-0.01
0.00
0.01
0.01
0.02
0.02
0.03
0.03
1/1/2007 4/1/2007 7/1/2007 10/1/2007 1/1/2008 4/1/2008
Rel
ati
ve
Sh
ear
Str
ess
(psf
)
Date
Bonnet Carré (Mile 128.6)
Upstream
Downstream

266
Figure 6-146: 2007-2008 Shear Stress Comparison at the Violet Diversion due to the Addition of the
Barataria and Pontchartrain Basin Diversions; the Closure of South Pass, Southwest Pass, and West Bay;
and the Dredging of Pass a Loutré to the ‘oil spill’ Dimensions for the Proposed Diversions Combined with
the Changes to the Delta Distributaries Study.
0.00
0.02
0.04
0.06
0.08
0.10
0.12
0.14
0.16
0.18
1/1/2007 4/1/2007 7/1/2007 10/1/2007 1/1/2008 4/1/2008
Sh
ear
Str
ess
(psf
)
Date
Violet (Mile 83.8)
07 Calibration/08 Validation (Upstream)
07-08-Bara-Pont-WB-SP-SWP-Pal (Upstream)
07 Calibration/08 Validation (Downstream)
07-08-Bara-Pont-WB-SP-SWP-Pal (Downstream)
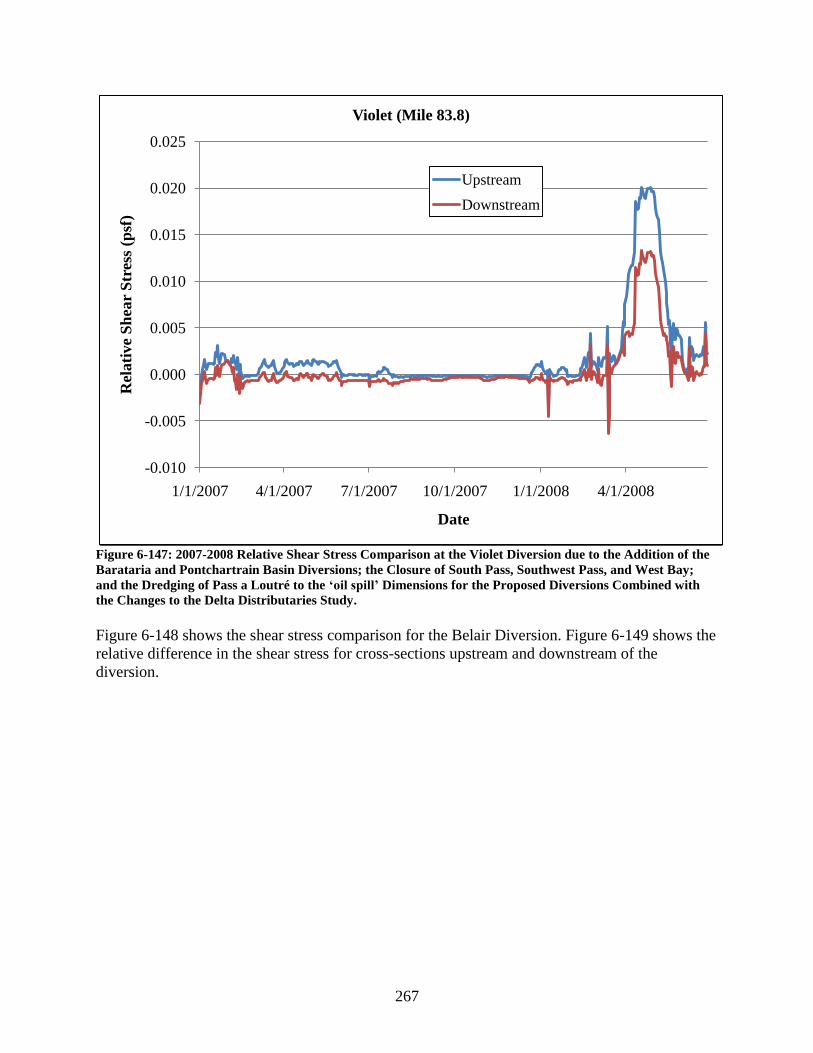
267
Figure 6-147: 2007-2008 Relative Shear Stress Comparison at the Violet Diversion due to the Addition of the
Barataria and Pontchartrain Basin Diversions; the Closure of South Pass, Southwest Pass, and West Bay;
and the Dredging of Pass a Loutré to the ‘oil spill’ Dimensions for the Proposed Diversions Combined with
the Changes to the Delta Distributaries Study.
Figure 6-148 shows the shear stress comparison for the Belair Diversion. Figure 6-149 shows the
relative difference in the shear stress for cross-sections upstream and downstream of the
diversion.
-0.010
-0.005
0.000
0.005
0.010
0.015
0.020
0.025
1/1/2007 4/1/2007 7/1/2007 10/1/2007 1/1/2008 4/1/2008
Rel
ati
ve
Sh
ear
Str
ess
(psf
)
Date
Violet (Mile 83.8)
Upstream
Downstream

268
Figure 6-148: 2007-2008 Shear Stress Comparison at the Belair Diversion due to the Addition of the
Barataria and Pontchartrain Basin Diversions; the Closure of South Pass, Southwest Pass, and West Bay;
and the Dredging of Pass a Loutré to the ‘oil spill’ Dimensions for the Proposed Diversions Combined with
the Changes to the Delta Distributaries Study.
0.00
0.02
0.04
0.06
0.08
0.10
0.12
0.14
0.16
1/1/2007 4/1/2007 7/1/2007 10/1/2007 1/1/2008 4/1/2008
Sh
ear
Str
ess
(psf
)
Date
Belair (Mile 64.9)
07 Calibration/08 Validation (Upstream)
07-08-Bara-Pont-WB-SP-SWP-Pal (Upstream)
07 Calibration/08 Validation (Downstream)
07-08-Bara-Pont-WB-SP-SWP-Pal (Downstream)

269
Figure 6-149: 2007-2008 Relative Shear Stress Comparison at the Belair Diversion due to the Addition of the
Barataria and Pontchartrain Basin Diversions; the Closure of South Pass, Southwest Pass, and West Bay;
and the Dredging of Pass a Loutré to the ‘oil spill’ Dimensions for the Proposed Diversions Combined with
the Changes to the Delta Distributaries Study.
Figure 6-150 shows the shear stress comparison for the Myrtle Grove Diversion. Figure 6-151
shows the relative difference in the shear stress for cross-sections upstream and downstream of
the diversion.
-0.040
-0.035
-0.030
-0.025
-0.020
-0.015
-0.010
-0.005
0.000
0.005
0.010
0.015
1/1/2007 4/1/2007 7/1/2007 10/1/2007 1/1/2008 4/1/2008
Rel
ati
ve
Sh
ear
Str
ess
(psf
)
Date
Belair (Mile 64.9)
Upstream
Downstream

270
Figure 6-150: 2007-2008 Shear Stress Comparison at the Myrtle Grove Diversion due to the Addition of the
Barataria and Pontchartrain Basin Diversions; the Closure of South Pass, Southwest Pass, and West Bay;
and the Dredging of Pass a Loutré to the ‘oil spill’ Dimensions for the Proposed Diversions Combined with
the Changes to the Delta Distributaries Study.
0.00
0.02
0.04
0.06
0.08
0.10
0.12
0.14
0.16
1/1/2007 4/1/2007 7/1/2007 10/1/2007 1/1/2008 4/1/2008
Sh
ear
Str
ess
(psf
)
Date
Myrtle Grove (Mile 59.3)
07 Calibration/08 Validation (Upstream)
07-08-Bara-Pont-WB-SP-SWP-Pal (Upstream)
07 Calibration/08 Validation (Downstream)
07-08-Bara-Pont-WB-SP-SWP-Pal (Downstream)

271
Figure 6-151: 2007-2008 Relative Shear Stress Comparison at the Myrtle Grove Diversion due to the Addition
of the Barataria and Pontchartrain Basin Diversions; the Closure of South Pass, Southwest Pass, and West
Bay; and the Dredging of Pass a Loutré to the ‘oil spill’ Dimensions for the Proposed Diversions Combined
with the Changes to the Delta Distributaries Study.
Figure 6-152 shows the shear stress comparison for the Deer Range Diversion. Figure 6-153
shows the relative difference in the shear stress for cross-sections upstream and downstream of
the diversion.
-0.040
-0.035
-0.030
-0.025
-0.020
-0.015
-0.010
-0.005
0.000
0.005
0.010
1/1/2007 4/1/2007 7/1/2007 10/1/2007 1/1/2008 4/1/2008
Rel
ati
ve
Sh
ear
Str
ess
(psf
)
Date
Myrtle Grove (Mile 59.3)
Upstream
Downstream

272
Figure 6-152: 2007-2008 Shear Stress Comparison at the Deer Range Diversion due to the Addition of the
Barataria and Pontchartrain Basin Diversions; the Closure of South Pass, Southwest Pass, and West Bay;
and the Dredging of Pass a Loutré to the ‘oil spill’ Dimensions for the Proposed Diversions Combined with
the Changes to the Delta Distributaries Study.
0.00
0.02
0.04
0.06
0.08
0.10
0.12
0.14
1/1/2007 4/1/2007 7/1/2007 10/1/2007 1/1/2008 4/1/2008
Sh
ear
Str
ess
(psf
)
Date
Deer Range (Mile 53.9)
07 Calibration/08 Validation (Upstream)
07-08-Bara-Pont-WB-SP-SWP-Pal (Upstream)
07 Calibration/08 Validation (Downstream)
07-08-Bara-Pont-WB-SP-SWP-Pal (Downstream)
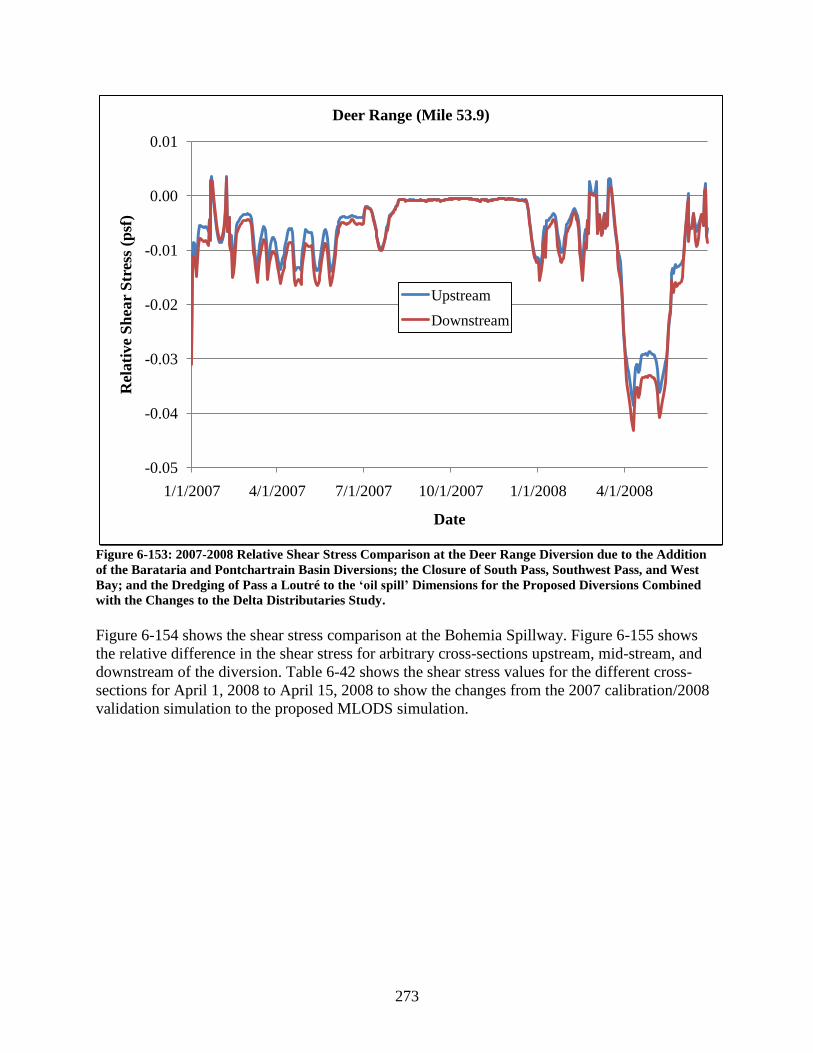
273
Figure 6-153: 2007-2008 Relative Shear Stress Comparison at the Deer Range Diversion due to the Addition
of the Barataria and Pontchartrain Basin Diversions; the Closure of South Pass, Southwest Pass, and West
Bay; and the Dredging of Pass a Loutré to the ‘oil spill’ Dimensions for the Proposed Diversions Combined
with the Changes to the Delta Distributaries Study.
Figure 6-154 shows the shear stress comparison at the Bohemia Spillway. Figure 6-155 shows
the relative difference in the shear stress for arbitrary cross-sections upstream, mid-stream, and
downstream of the diversion. Table 6-42 shows the shear stress values for the different cross-
sections for April 1, 2008 to April 15, 2008 to show the changes from the 2007 calibration/2008
validation simulation to the proposed MLODS simulation.
-0.05
-0.04
-0.03
-0.02
-0.01
0.00
0.01
1/1/2007 4/1/2007 7/1/2007 10/1/2007 1/1/2008 4/1/2008
Rel
ati
ve
Sh
ear
Str
ess
(psf
)
Date
Deer Range (Mile 53.9)
Upstream
Downstream

274
Figure 6-154: 2007-2008 Shear Stress Comparison at the Bohemia Spillway due to the Addition of the
Barataria and Pontchartrain Basin Diversions; the Closure of South Pass, Southwest Pass, and West Bay;
and the Dredging of Pass a Loutré to the ‘oil spill’ Dimensions for the Proposed Diversions Combined with
the Changes to the Delta Distributaries Study.
0.00
0.02
0.04
0.06
0.08
0.10
0.12
1/1/2007 4/1/2007 7/1/2007 10/1/2007 1/1/2008 4/1/2008
Sh
ear
Str
ess
(psf
)
Date
Bohemia (Mile 38.6)
07 Calibration/08 Validation (Upstream)
07-08-Bara-Pont-WB-SP-SWP-Pal (Upstream)
07 Calibration/08 Validation (Mid-stream 1)
07-08-Bara-Pont-WB-SP-SWP-Pal (Mid-stream 1)
07 Calibration/08 Validation (Mid-stream 2)
07-08-Bara-Pont-WB-SP-SWP-Pal (Mid-stream 2)
07 Calibration/08 Validation (Downstream)
07-08-Bara-Pont-WB-SP-SWP-Pal (Downstream)

275
Figure 6-155: 2007-2008 Relative Shear Stress Comparison at the Bohemia Spillway due to the Addition of
the Barataria and Pontchartrain Basin Diversions; the Closure of South Pass, Southwest Pass, and West Bay;
and the Dredging of Pass a Loutré to the ‘oil spill’ Dimensions for the Proposed Diversions Combined with
the Changes to the Delta Distributaries Study.
-0.045
-0.040
-0.035
-0.030
-0.025
-0.020
-0.015
-0.010
-0.005
0.000
0.005
1/1/2007 4/1/2007 7/1/2007 10/1/2007 1/1/2008 4/1/2008
Rel
ati
ve
Sh
ear
Str
ess
(psf
)
Date
Bohemia (Mile 38.6)
Upstream
Mid-stream 1
Mid-stream 2
Downstream

276
Table 6-42: April 2008 Shear Stress Values from the 2007 Calibration/2008 Validation and the 07-08-Bara-
Pont-WB-SP-SWP-Pal Simulation at the Bohemia Spillway for the Proposed Diversions Combined with the
Changes to the Delta Distributaries Study.
Date / Cross-
section
Upstream (psf) Mid-stream 1
(psf)
Mid-stream 2
(psf)
Downstream
(psf)
Cal. MLODS Cal. MLODS Cal. MLODS Cal. MLODS
4/1/2008 0.0816 0.0585 0.0755 0.057 0.0540 0.0340 0.0603 0.0377
4/2/2008 0.0837 0.0572 0.0769 0.058 0.0547 0.0345 0.061 0.0382
4/3/2008 0.0861 0.0567 0.0786 0.059 0.0556 0.0350 0.0617 0.0387
4/4/2008 0.0892 0.0584 0.0809 0.060 0.0567 0.0356 0.0627 0.0393
4/5/2008 0.0918 0.0599 0.0828 0.061 0.0576 0.0361 0.0635 0.0399
4/6/2008 0.0944 0.0612 0.0846 0.062 0.0585 0.0365 0.0643 0.0403
4/7/2008 0.0971 0.0626 0.0865 0.063 0.0594 0.0369 0.0651 0.0408
4/8/2008 0.1004 0.0641 0.0888 0.064 0.0605 0.0374 0.0661 0.0412
4/9/2008 0.103 0.0657 0.0907 0.063 0.0614 0.0379 0.0668 0.0417
4/10/2008 0.1055 0.0672 0.0924 0.062 0.0622 0.0383 0.0675 0.0422
4/11/2008 0.103 0.0685 0.0907 0.062 0.0614 0.0387 0.0668 0.0426
4/12/2008 0.0981 0.0661 0.0872 0.063 0.0598 0.0380 0.0654 0.0419
4/13/2008 0.0966 0.0652 0.0862 0.064 0.0593 0.0378 0.065 0.0416
4/14/2007 0.0964 0.0651 0.0860 0.064 0.0592 0.0377 0.065 0.0416
4/15/2007 0.0965 0.0652 0.0861 0.064 0.0593 0.0378 0.065 0.0416
Figure 6-156 shows the shear stress comparison for the Buras Diversion. Figure 6-157 shows the
relative difference in the shear stress for cross-sections upstream and downstream of the
diversion.

277
Figure 6-156: 2007-2008 Shear Stress Comparison at the Buras Diversion due to the Addition of the
Barataria and Pontchartrain Basin Diversions; the Closure of South Pass, Southwest Pass, and West Bay;
and the Dredging of Pass a Loutré to the ‘oil spill’ Dimensions for the Proposed Diversions Combined with
the Changes to the Delta Distributaries Study.
0.00
0.02
0.04
0.06
0.08
0.10
0.12
1/1/2007 4/1/2007 7/1/2007 10/1/2007 1/1/2008 4/1/2008
Sh
ear
Str
ess
(psf
)
Date
Buras (Mile 24.9)
07 Calibration/08 Validation (Upstream)
07-08-Bara-Pont-WB-SP-SWP-Pal (Upstream)
07 Calibration/08 Validation (Downstream)
07-08-Bara-Pont-WB-SP-SWP-Pal (Downstream)

278
Figure 6-157: 2007-2008 Relative Shear Stress Comparison at the Buras Diversion due to the Addition of the
Barataria and Pontchartrain Basin Diversions; the Closure of South Pass, Southwest Pass, and West Bay;
and the Dredging of Pass a Loutré to the ‘oil spill’ Dimensions for the Proposed Diversions Combined with
the Changes to the Delta Distributaries Study.
To estimate how the shear stress changes along the MR, Figures 6-158, 6-159, and 6-160 show
the shear stress comparison at Baton Rouge, Carrollton, and Venice, respectively. Table 6-43
shows the mean and maximum difference in shear stress from the 2007 calibration and 2008
validation simulations at the comparison gages.
-0.07
-0.06
-0.05
-0.04
-0.03
-0.02
-0.01
0.00
1/1/2007 4/1/2007 7/1/2007 10/1/2007 1/1/2008 4/1/2008
Rel
ati
ve
Sh
ear
Str
ess
(psf
)
Date
Buras (Mile 24.9)
Upstream
Downstream

279
Figure 6-158: 2007-2008 Shear Stress Comparison at Baton Rouge due to the Addition of the Barataria and
Pontchartrain Basin Diversions; the Closure of South Pass, Southwest Pass, and West Bay; and the Dredging
of Pass a Loutré to the ‘oil spill’ Dimensions for the Proposed Diversions Combined with the Changes to the
Delta Distributaries Study.
0
0.02
0.04
0.06
0.08
0.1
0.12
0.14
10/10/2006 1/18/2007 4/28/2007 8/6/2007 11/14/2007 2/22/2008 6/1/2008 9/9/2008
Sh
ear
Str
ess
(psf
)
Date
Baton Rouge (Mile 228.4)
07 Calibration/08 Validation
07-08-Bara-Pont-WB-SP-SWP-Pal

280
Figure 6-159: 2007-2008 Shear Stress Comparison at Carrollton due to the Addition of the Barataria and
Pontchartrain Basin Diversions; the Closure of South Pass, Southwest Pass, and West Bay; and the Dredging
of Pass a Loutré to the ‘oil spill’ Dimensions for the Proposed Diversions Combined with the Changes to the
Delta Distributaries Study.
0
0.02
0.04
0.06
0.08
0.1
0.12
0.14
0.16
10/10/2006 1/18/2007 4/28/2007 8/6/2007 11/14/2007 2/22/2008 6/1/2008 9/9/2008
Sh
ear
Str
ess
(psf
)
Date
Carrollton (Mile 102.8)
07 Calibration/08 Validation
07-08-Bara-Pont-WB-SP-SWP-Pal

281
Figure 6-160: 2007-2008 Shear Stress Comparison at Venice due to the Addition of the Barataria and
Pontchartrain Basin Diversions; the Closure of South Pass, Southwest Pass, and West Bay; and the Dredging
of Pass a Loutré to the ‘oil spill’ Dimensions for the Proposed Diversions Combined with the Changes to the
Delta Distributaries Study.
Table 6-43: 2007-2008 Mean and Maximum Difference in Shear Stress due to the Addition of the Barataria
and Pontchartrain Basin Diversions; the Closure of South Pass, Southwest Pass, and West Bay; and the
Replacement of Pass a Loutré by the ‘oil spill’ Dimensions for the Proposed Diversions Combined with the
Changes to the Delta Distributaries Study (07-08-Bara-Pont-WB-SP-SWP-Pal vs. 2007 Calibration/2008
Validation).
Parameter /
Gage
Baton
Rouge Donaldsonville
North of
Bonnet
Carré
Bonnet
Carré Carrollton
West
Pointe a
la
Hache
Venice
Mean Shear
Stress
Difference
(psf)
0.0015 0.0019 0.0009 0.002 0.0018 -0.0085 -0.016
Max Shear
Stress
Difference
(psf)
0.0317 0.0199 0.0177 0.0247 0.024 -0.043 -0.037
0
0.01
0.02
0.03
0.04
0.05
0.06
10/10/2006 1/18/2007 4/28/2007 8/6/2007 11/14/2007 2/22/2008 6/1/2008 9/9/2008
Sh
ear
Str
ess
(psf
)
Date
Venice (Mile 10.7)
07 Calibration/08 Validation
07-08-Bara-Pont-WB-SP-SWP-Pal

282
Figures 6-161 through 6-164 show the shear stress results for Pass a Loutré River Stations (RS)
29, 19, 10, and 1, respectively. On each of these four graphs, the blue line represents the
corresponding Pass a Loutré cross-section from the 2007 calibration/2008 validation; the red line
represents the corresponding Pass a Loutré cross-section from the proposed MLODS simulation
(07-08-Bara-Pont-WB-SP-SWP-Pal); and the green line represents a Southwest Pass cross-
section from the 2007 calibration/2008 validation. The cross-sections from Southwest Pass were
included to show a before-and-after comparison of the shear stress in the Delta‟s most dominant
pass, which was Southwest Pass in the calibration/validation simulation and was Pass a Loutré in
the MLODS proposal.
Figure 6-161: 2007-2008 Shear Stress Comparison at Pass a Loutré RS 29 due to the Addition of the
Barataria and Pontchartrain Basin Diversions; the Closure of South Pass, Southwest Pass, and West Bay;
and the Dredging of Pass a Loutré to the ‘oil spill’ Dimensions for the Proposed Diversions Combined with
the Changes to the Delta Distributaries Study.
0
0.01
0.02
0.03
0.04
0.05
0.06
0.07
0.08
0.09
1/1/2007 4/1/2007 7/1/2007 10/1/2007 1/1/2008 4/1/2008
Sh
ear
Str
ess
(psf
)
Date
Pass a Loutré (RS 29)
07 Calibration/08 Validation
07-08-Bara-Pont-WB-SP-SWP-Pal
Southwest Pass RS 108 (07 Cal./08 Val.)

283
Figure 6-162: 2007-2008 Shear Stress Comparison at Pass a Loutré RS 19 due to the Addition of the
Barataria and Pontchartrain Basin Diversions; the Closure of South Pass, Southwest Pass, and West Bay;
and the Dredging of Pass a Loutré to the ‘oil spill’ Dimensions for the Proposed Diversions Combined with
the Changes to the Delta Distributaries Study.
0
0.01
0.02
0.03
0.04
0.05
0.06
0.07
0.08
0.09
0.1
1/1/2007 4/1/2007 7/1/2007 10/1/2007 1/1/2008 4/1/2008
Sh
ear
Str
ess
(psf
)
Date
Pass a Loutré (RS 19)
07 Calibration/08 Validation
07-08-Bara-Pont-WB-SP-SWP-Pal
Southwest Pass RS 68 (07 Cal./08 Val.)
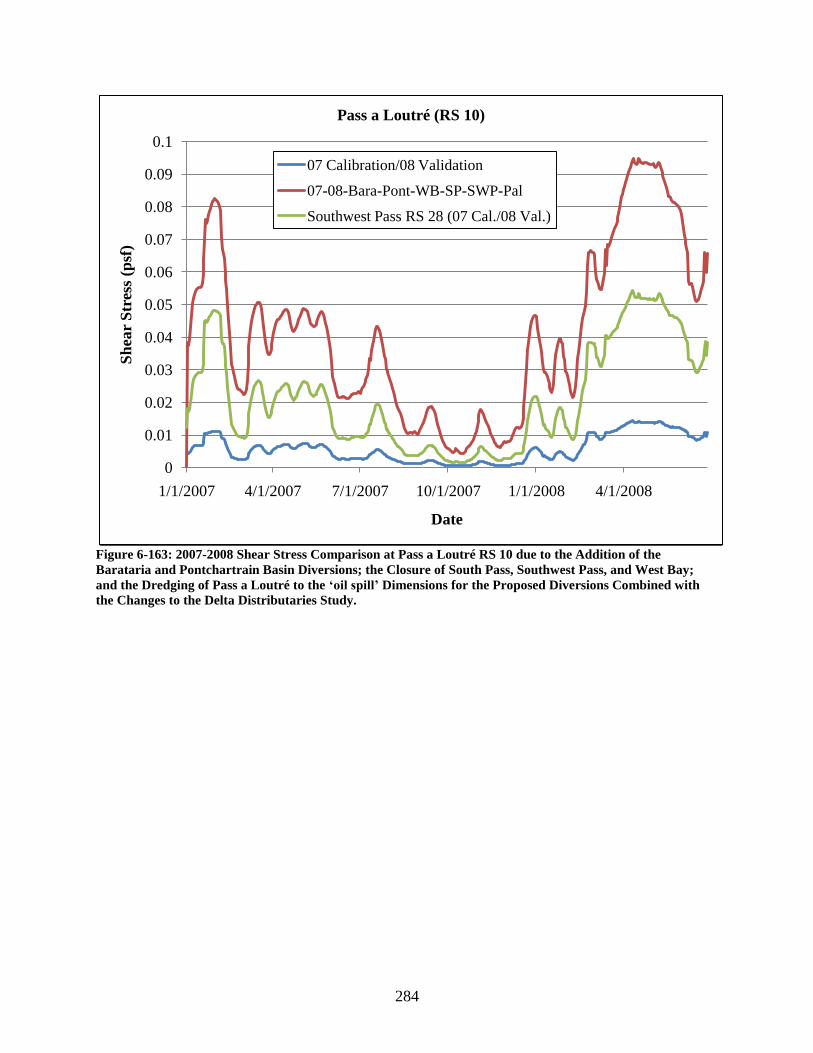
284
Figure 6-163: 2007-2008 Shear Stress Comparison at Pass a Loutré RS 10 due to the Addition of the
Barataria and Pontchartrain Basin Diversions; the Closure of South Pass, Southwest Pass, and West Bay;
and the Dredging of Pass a Loutré to the ‘oil spill’ Dimensions for the Proposed Diversions Combined with
the Changes to the Delta Distributaries Study.
0
0.01
0.02
0.03
0.04
0.05
0.06
0.07
0.08
0.09
0.1
1/1/2007 4/1/2007 7/1/2007 10/1/2007 1/1/2008 4/1/2008
Sh
ear
Str
ess
(psf
)
Date
Pass a Loutré (RS 10)
07 Calibration/08 Validation
07-08-Bara-Pont-WB-SP-SWP-Pal
Southwest Pass RS 28 (07 Cal./08 Val.)

285
Figure 6-164: 2007-2008 Shear Stress Comparison at Pass a Loutré RS 1 due to the Addition of the Barataria
and Pontchartrain Basin Diversions; the Closure of South Pass, Southwest Pass, and West Bay; and the
Dredging of Pass a Loutré to the ‘oil spill’ Dimensions for the Proposed Diversions Combined with the
Changes to the Delta Distributaries Study.
The final parameter under investigation was the change in the bed material transport in the river
due to the proposed diversions. Figure 6-165 shows the bed material transport comparison at the
Bonnet Carré Spillway. Figure 6-166 shows the relative difference in the bed material transport
for cross-sections upstream and downstream of the diversion.
0
0.02
0.04
0.06
0.08
0.1
0.12
1/1/2007 4/1/2007 7/1/2007 10/1/2007 1/1/2008 4/1/2008
Sh
ear
Str
ess
(psf
)
Date
Pass a Loutré (RS 1)
07 Calibration/08 Validation
07-08-Bara-Pont-WB-SP-SWP-Pal
Southwest Pass RS 1 (07 Cal./08 Val.)

286
Figure 6-165: 2007-2008 Bed Material Transport (Qs) Comparison at the Bonnet Carré Spillway due to the
Addition of the Barataria and Pontchartrain Basin Diversions; the Closure of South Pass, Southwest Pass,
and West Bay; and the Dredging of Pass a Loutré to the ‘oil spill’ Dimensions for the Proposed Diversions
Combined with the Changes to the Delta Distributaries Study.
-5
0
5
10
15
20
25
30
35
1/1/2007 4/1/2007 7/1/2007 10/1/2007 1/1/2008 4/1/2008
Qs(f
t3/s
)
Date
Bonnet Carré (Mile 128.6)
07 Calibration/08 Validation (Upstream)
07-08-Bara-Pont-WB-SP-SWP-Pal (Upstream)
07 Calibration/08 Validation (Downstream)
07-08-Bara-Pont-WB-SP-SWP-Pal (Downstream)

287
Figure 6-166: 2007-2008 Relative Bed Material Transport (Qs) Comparison at the Bonnet Carré Spillway due
to the Addition of the Barataria and Pontchartrain Basin Diversions; the Closure of South Pass, Southwest
Pass, and West Bay; and the Dredging of Pass a Loutré to the ‘oil spill’ Dimensions for the Proposed
Diversions Combined with the Changes to the Delta Distributaries Study.
Figure 6-167 shows the bed material transport comparison for the Violet Diversion. Figure 6-168
shows the relative difference in the bed material transport for cross-sections upstream and
downstream of the diversion.
-2
0
2
4
6
8
10
12
1/1/2007 4/1/2007 7/1/2007 10/1/2007 1/1/2008 4/1/2008
Rel
ati
ve
Qs
(ft3
/s)
Date
Bonnet Carré (Mile 128.6)
Upstream
Downstream

288
Figure 6-167: 2007-2008 Bed Material Transport (Qs) Comparison at the Violet Diversion due to the Addition
of the Barataria and Pontchartrain Basin Diversions; the Closure of South Pass, Southwest Pass, and West
Bay; and the Dredging of Pass a Loutré to the ‘oil spill’ Dimensions for the Proposed Diversions Combined
with the Changes to the Delta Distributaries Study.
-5
0
5
10
15
20
25
30
35
40
1/1/2007 4/1/2007 7/1/2007 10/1/2007 1/1/2008 4/1/2008
Qs(f
t3/s
)
Date
Violet (Mile 83.8)
07 Calibration/08 Validation (Upstream)
07-08-Bara-Pont-WB-SP-SWP-Pal (Upstream)
07 Calibration/08 Validation (Downstream)
07-08-Bara-Pont-WB-SP-SWP-Pal (Downstream)

289
Figure 6-168: 2007-2008 Relative Bed Material Transport (Qs) Comparison at the Violet Diversion due to the
Addition of the Barataria and Pontchartrain Basin Diversions; the Closure of South Pass, Southwest Pass,
and West Bay; and the Dredging of Pass a Loutré to the ‘oil spill’ Dimensions for the Proposed Diversions
Combined with the Changes to the Delta Distributaries Study.
Figure 6-169 shows the bed material transport comparison for the Belair Diversion. Figure 6-170
shows the relative difference in the bed material transport for cross-sections upstream and
downstream of the diversion.
-2
0
2
4
6
8
10
1/1/2007 4/1/2007 7/1/2007 10/1/2007 1/1/2008 4/1/2008
Rel
ati
ve
Qs
(ft3
/s)
Date
Violet (Mile 83.8)
Upstream
Downstream

290
Figure 6-169: 2007-2008 Bed Material Transport (Qs) Comparison at the Belair Diversion due to the Addition
of the Barataria and Pontchartrain Basin Diversions; the Closure of South Pass, Southwest Pass, and West
Bay; and the Dredging of Pass a Loutré to the ‘oil spill’ Dimensions for the Proposed Diversions Combined
with the Changes to the Delta Distributaries Study.
-5
0
5
10
15
20
25
30
1/1/2007 4/1/2007 7/1/2007 10/1/2007 1/1/2008 4/1/2008
Qs(f
t3/s
)
Date
Belair (Mile 64.9)
07 Calibration/08 Validation (Upstream)
07-08-Bara-Pont-WB-SP-SWP-Pal (Upstream)
07 Calibration/08 Validation (Downstream)
07-08-Bara-Pont-WB-SP-SWP-Pal (Downstream)

291
Figure 6-170: 2007-2008 Relative Bed Material Transport (Qs) Comparison at the Belair Diversion due to the
Addition of the Barataria and Pontchartrain Basin Diversions; the Closure of South Pass, Southwest Pass,
and West Bay; and the Dredging of Pass a Loutré to the ‘oil spill’ Dimensions for the Proposed Diversions
Combined with the Changes to the Delta Distributaries Study.
Figure 6-171 shows the bed material transport comparison for the Myrtle Grove Diversion.
Figure 6-172 shows the relative difference in the bed material transport for cross-sections
upstream and downstream of the diversion.
-14
-12
-10
-8
-6
-4
-2
0
2
4
6
1/1/2007 4/1/2007 7/1/2007 10/1/2007 1/1/2008 4/1/2008
Rel
ati
ve
Qs
(ft3
/s)
Date
Belair (Mile 64.9)
Upstream
Downstream

292
Figure 6-171: 2007-2008 Bed Material Transport (Qs) Comparison at the Myrtle Grove Diversion due to the
Addition of the Barataria and Pontchartrain Basin Diversions; the Closure of South Pass, Southwest Pass,
and West Bay; and the Dredging of Pass a Loutré to the ‘oil spill’ Dimensions for the Proposed Diversions
Combined with the Changes to the Delta Distributaries Study.
-5
0
5
10
15
20
25
30
1/1/2007 4/1/2007 7/1/2007 10/1/2007 1/1/2008 4/1/2008
Qs(f
t3/s
)
Date
Myrtle Grove (Mile 59.3)
07 Calibration/08 Validation (Upstream)
07-08-Bara-Pont-WB-SP-SWP-Pal (Upstream)
07 Calibration/08 Validation (Downstream)
07-08-Bara-Pont-WB-SP-SWP-Pal (Downstream)

293
Figure 6-172: 2007-2008 Relative Bed Material Transport (Qs) Comparison at the Myrtle Grove Diversion
due to the Addition of the Barataria and Pontchartrain Basin Diversions; the Closure of South Pass,
Southwest Pass, and West Bay; and the Dredging of Pass a Loutré to the ‘oil spill’ Dimensions for the
Proposed Diversions Combined with the Changes to the Delta Distributaries Study.
Figure 6-173 shows the bed material transport comparison for the Deer Range Diversion. Figure
6-174 shows the relative difference in the bed material transport for cross-sections upstream and
downstream of the diversion.
-14
-12
-10
-8
-6
-4
-2
0
2
1/1/2007 4/1/2007 7/1/2007 10/1/2007 1/1/2008 4/1/2008
Rel
ati
ve
Qs
(ft3
/s)
Date
Myrtle Grove (Mile 59.3)
Upstream
Downstream

294
Figure 6-173: 2007-2008 Bed Material Transport (Qs) Comparison at the Deer Range Diversion due to the
Addition of the Barataria and Pontchartrain Basin Diversions; the Closure of South Pass, Southwest Pass,
and West Bay; and the Dredging of Pass a Loutré to the ‘oil spill’ Dimensions for the Proposed Diversions
Combined with the Changes to the Delta Distributaries Study.
-5
0
5
10
15
20
25
30
1/1/2007 4/1/2007 7/1/2007 10/1/2007 1/1/2008 4/1/2008
Qs(f
t3/s
)
Date
Deer Range (Mile 53.9)
07 Calibration/08 Validation (Upstream)
07-08-Bara-Pont-WB-SP-SWP-Pal (Upstream)
07 Calibration/08 Validation (Downstream)
07-08-Bara-Pont-WB-SP-SWP-Pal (Downstream)

295
Figure 6-174: 2007-2008 Relative Bed Material Transport (Qs) Comparison at the Deer Range Diversion due
to the Addition of the Barataria and Pontchartrain Basin Diversions; the Closure of South Pass, Southwest
Pass, and West Bay; and the Dredging of Pass a Loutré to the ‘oil spill’ Dimensions for the Proposed
Diversions Combined with the Changes to the Delta Distributaries Study.
Figure 6-175 shows the bed material transport comparison at the Bohemia Spillway. Figure 6-
176 shows the relative difference in the bed material transport for arbitrary cross-sections
upstream, mid-stream, and downstream of the diversion. Table 6-44 shows the bed material
transport values for the different cross-sections for April 1, 2008 to April 15, 2008 to show the
changes from the 2007 calibration/2008 validation simulation to the proposed MLODS
simulation.
-16
-14
-12
-10
-8
-6
-4
-2
0
2
1/1/2007 4/1/2007 7/1/2007 10/1/2007 1/1/2008 4/1/2008
Rel
ati
ve
Qs
(ft3
/s)
Date
Deer Range (Mile 53.9)
Upstream
Downstream

296
Figure 6-175: 2007-2008 Bed Material Transport (Qs) Comparison at the Bohemia Spillway due to the
Addition of the Barataria and Pontchartrain Basin Diversions; the Closure of South Pass, Southwest Pass,
and West Bay; and the Dredging of Pass a Loutré to the ‘oil spill’ Dimensions for the Proposed Diversions
Combined with the Changes to the Delta Distributaries Study.
-2
0
2
4
6
8
10
12
14
16
1/1/2007 4/1/2007 7/1/2007 10/1/2007 1/1/2008 4/1/2008
Qs(f
t3/s
)
Date
Bohemia (Mile 38.6)
07 Calibration/08 Validation (Upstream)
07-08-Bara-Pont-WB-SP-SWP-Pal (Upstream)
07 Calibration/08 Validation (Mid-stream 1)
07-08-Bara-Pont-WB-SP-SWP-Pal (Mid-stream 1)
07 Calibration/08 Validation (Mid-stream 2)
07-08-Bara-Pont-WB-SP-SWP-Pal (Mid-stream 2)
07 Calibration/08 Validation (Downstream)
07-08-Bara-Pont-WB-SP-SWP-Pal (Downstream)
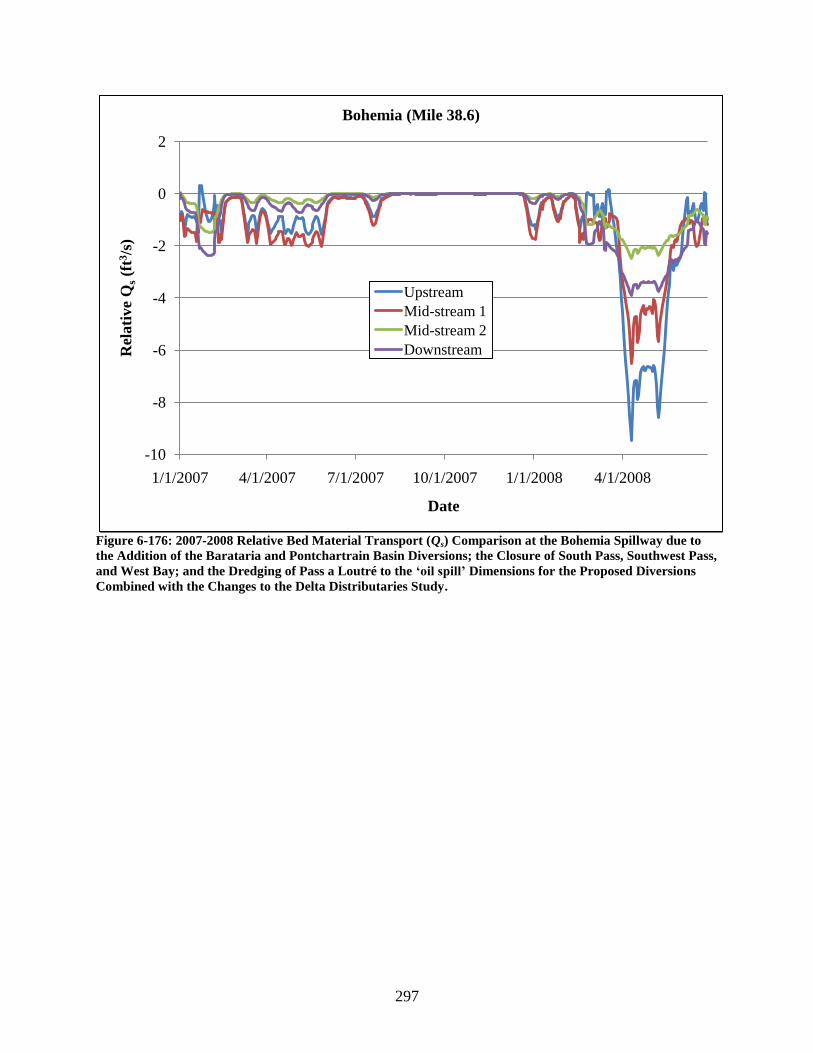
297
Figure 6-176: 2007-2008 Relative Bed Material Transport (Qs) Comparison at the Bohemia Spillway due to
the Addition of the Barataria and Pontchartrain Basin Diversions; the Closure of South Pass, Southwest Pass,
and West Bay; and the Dredging of Pass a Loutré to the ‘oil spill’ Dimensions for the Proposed Diversions
Combined with the Changes to the Delta Distributaries Study.
-10
-8
-6
-4
-2
0
2
1/1/2007 4/1/2007 7/1/2007 10/1/2007 1/1/2008 4/1/2008
Rel
ati
ve
Qs
(ft3
/s)
Date
Bohemia (Mile 38.6)
Upstream
Mid-stream 1
Mid-stream 2
Downstream

298
Table 6-44: April 2008 Bed Material Transport (Qs) Values from the 2007 Calibration/2008 Validation and
the 07-08-Bara-Pont-WB-SP-SWP-Pal Simulation at the Bohemia Spillway for the Proposed Diversions
Combined with the Changes to the Delta Distributaries Study.
Date / Cross-section Upstream Mid-stream 1 Mid-stream 2 Downstream
Cal. MLODS Cal. MLODS Cal. MLODS Cal. MLODS
4/1/2008 8.36 3.85 6.96 3.64 2.50 0.72 4.36 1.30
4/2/2008 8.85 3.65 7.26 3.67 2.58 0.76 4.48 1.35
4/3/2008 9.44 3.57 7.63 3.84 2.69 0.79 4.60 1.40
4/4/2008 10.21 3.83 8.14 4.06 2.82 0.83 4.78 1.46
4/5/2008 10.89 4.08 8.58 4.26 2.93 0.86 4.93 1.52
4/6/2008 11.59 4.29 9.01 4.45 3.04 0.89 5.08 1.57
4/7/2008 12.33 4.53 9.47 4.63 3.15 0.92 5.23 1.62
4/8/2008 13.28 4.79 10.04 4.76 3.29 0.95 5.42 1.66
4/9/2008 14.05 5.07 10.53 4.60 3.41 0.99 5.55 1.72
4/10/2008 14.81 5.35 10.98 4.46 3.52 1.02 5.69 1.77
4/11/2008 14.05 5.59 10.53 4.33 3.41 1.05 5.55 1.82
4/12/2008 12.62 5.15 9.64 4.57 3.20 1.00 5.28 1.74
4/13/2008 12.19 4.98 9.40 4.65 3.14 0.98 5.21 1.71
4/14/2007 12.14 4.97 9.35 4.65 3.13 0.98 5.21 1.71
4/15/2007 12.17 4.98 9.37 4.65 3.14 0.98 5.21 1.71
Figure 6-177 shows the bed material transport comparison for the Buras Diversion. Figure 6-178
shows the relative difference in the bed material transport for cross-sections upstream and
downstream of the diversion.

299
Figure 6-177: 2007-2008 Bed Material Transport (Qs) Comparison at the Buras Diversion due to the Addition
of the Barataria and Pontchartrain Basin Diversions; the Closure of South Pass, Southwest Pass, and West
Bay; and the Dredging of Pass a Loutré to the ‘oil spill’ Dimensions for the Proposed Diversions Combined
with the Changes to the Delta Distributaries Study.
-2
0
2
4
6
8
10
12
14
16
1/1/2007 4/1/2007 7/1/2007 10/1/2007 1/1/2008 4/1/2008
Qs(f
t3/s
)
Date
Buras (Mile 24.9)
07 Calibration/08 Validation (Upstream)
07-08-Bara-Pont-WB-SP-SWP-Pal (Upstream)
07 Calibration/08 Validation (Downstream)
07-08-Bara-Pont-WB-SP-SWP-Pal (Downstream)

300
Figure 6-178: 2007-2008 Relative Bed Material Transport (Qs) Comparison at the Buras Diversion due to the
Addition of the Barataria and Pontchartrain Basin Diversions; the Closure of South Pass, Southwest Pass,
and West Bay; and the Dredging of Pass a Loutré to the ‘oil spill’ Dimensions for the Proposed Diversions
Combined with the Changes to the Delta Distributaries Study.
To estimate how the bed material transport changes along the MR, Figures 6-179, 6-180, and 6-
181 show the bed material transport comparison at Baton Rouge, Carrollton, and Venice,
respectively. Table 6-45 shows the mean and maximum difference in bed material transport from
the 2007 calibration and 2008 validation simulations at the comparison gages.
-14
-12
-10
-8
-6
-4
-2
0
2
1/1/2007 4/1/2007 7/1/2007 10/1/2007 1/1/2008 4/1/2008
Rel
ati
ve
Qs
(ft3
/s)
Date
Buras (Mile 24.9)
Upstream
Downstream

301
Figure 6-179: 2007-2008 Bed Material Transport (Qs) Comparison at Baton Rouge due to the Addition of the
Barataria and Pontchartrain Basin Diversions; the Closure of South Pass, Southwest Pass, and West Bay;
and the Dredging of Pass a Loutré to the ‘oil spill’ Dimensions for the Proposed Diversions Combined with
the Changes to the Delta Distributaries Study.
-5
0
5
10
15
20
25
10/10/2006 1/18/2007 4/28/2007 8/6/2007 11/14/2007 2/22/2008 6/1/2008 9/9/2008
Qs(f
t3/s
)
Date
Baton Rouge (Mile 228.4)
07 Calibration/08 Validation
07-08-Bara-Pont-WB-SP-SWP-Pal

302
Figure 6-180: 2007-2008 Bed Material Transport (Qs) Comparison at Carrollton due to the Addition of the
Barataria and Pontchartrain Basin Diversions; the Closure of South Pass, Southwest Pass, and West Bay;
and the Dredging of Pass a Loutré to the ‘oil spill’ Dimensions for the Proposed Diversions Combined with
the Changes to the Delta Distributaries Study.
-5
0
5
10
15
20
25
30
10/10/2006 1/18/2007 4/28/2007 8/6/2007 11/14/2007 2/22/2008 6/1/2008 9/9/2008
Qs(f
t3/s
)
Date
Carrollton (Mile 102.8)
07 Calibration/08 Validation
07-08-Bara-Pont-WB-SP-SWP-Pal

303
Figure 6-181: 2007-2008 Bed Material Transport (Qs) Comparison at Venice due to the Addition of the
Barataria and Pontchartrain Basin Diversions; the Closure of South Pass, Southwest Pass, and West Bay;
and the Dredging of Pass a Loutré to the ‘oil spill’ Dimensions for the Proposed Diversions Combined with
the Changes to the Delta Distributaries Study.
Table 6-45: 2007-2008 Mean and Maximum Difference in Bed Material Transport (Qs) due to the Addition of
the Barataria and Pontchartrain Basin Diversions; the Closure of South Pass, Southwest Pass, and West Bay;
and the Replacement of Pass a Loutré by the ‘oil spill’ Dimensions for the Proposed Diversions Combined
with the Changes to the Delta Distributaries Study (07-08-Bara-Pont-WB-SP-SWP-Pal vs. 2007
Calibration/2008 Validation).
Parameter /
Gage
Baton
Rouge Donaldsonville
North of
Bonnet
Carré
Bonnet
Carré Carrollton
West
Pointe a
la
Hache
Venice
Mean Qs
Difference
(ft3/s)
0.42 0.58 0.27 0.79 0.47 -1.55 -0.94
Max Qs
Difference
(ft3/s)
9.48 5.09 5.27 10.36 7.59 -12.44 -3.07
The bed material transport was calculated based on the shear stress results mentioned previously
(Figures 6-161 through 6-164). Figures 6-182 through 6-185 show the bed material transport
-0.5
0
0.5
1
1.5
2
2.5
3
3.5
10/10/2006 1/18/2007 4/28/2007 8/6/2007 11/14/2007 2/22/2008 6/1/2008 9/9/2008
Qs(f
t3/s
)
Date
Venice (Mile 10.7)
07 Calibration/08 Validation
07-08-Bara-Pont-WB-SP-SWP-Pal

304
results for Pass a Loutré RS 29, 19, 10, and 1, respectively. Again on each of these four graphs,
the blue line represents the corresponding Pass a Loutré cross-section from the 2007
calibration/2008 validation; the red line represents the corresponding Pass a Loutré cross-section
from the proposed MLODS simulation (07-08-Bara-Pont-WB-SP-SWP-Pal); and the green line
represents a Southwest Pass cross-section from the 2007 calibration/2008 validation. The cross-
sections from Southwest Pass were included to show a before-and-after comparison of the bed
material transport in the Delta‟s most dominant pass, which was Southwest Pass in the
calibration/validation simulation and was Pass a Loutré in the MLODS proposal.
Figure 6-182: 2007-2008 Bed Material Transport (Qs) Comparison at Pass a Loutré RS 29 due to the Addition
of the Barataria and Pontchartrain Basin Diversions; the Closure of South Pass, Southwest Pass, and West
Bay; and the Dredging of Pass a Loutré to the ‘oil spill’ Dimensions for the Proposed Diversions Combined
with the Changes to the Delta Distributaries Study.
-0.5
0
0.5
1
1.5
2
2.5
3
3.5
4
1/1/2007 4/1/2007 7/1/2007 10/1/2007 1/1/2008 4/1/2008
Qs(f
t3/s
)
Date
Pass a Loutré (RS 29)
07 Calibration/08 Validation
07-08-Bara-Pont-WB-SP-SWP-Pal
Southwest Pass RS 108 (07 Cal./08 Val.)

305
Figure 6-183: 2007-2008 Bed Material Transport (Qs) Comparison at Pass a Loutré RS 19 due to the Addition
of the Barataria and Pontchartrain Basin Diversions; the Closure of South Pass, Southwest Pass, and West
Bay; and the Dredging of Pass a Loutré to the ‘oil spill’ Dimensions for the Proposed Diversions Combined
with the Changes to the Delta Distributaries Study.
-0.5
0
0.5
1
1.5
2
2.5
3
3.5
4
1/1/2007 4/1/2007 7/1/2007 10/1/2007 1/1/2008 4/1/2008
Qs(f
t3/s
)
Date
Pass a Loutré (RS 19)
07 Calibration/08 Validation
07-08-Bara-Pont-WB-SP-SWP-Pal
Southwest Pass RS 68 (07 Cal./08 Val.)

306
Figure 6-184: 2007-2008 Bed Material Transport (Qs) Comparison at Pass a Loutré RS 10 due to the Addition
of the Barataria and Pontchartrain Basin Diversions; the Closure of South Pass, Southwest Pass, and West
Bay; and the Dredging of Pass a Loutré to the ‘oil spill’ Dimensions for the Proposed Diversions Combined
with the Changes to the Delta Distributaries Study.
-1
0
1
2
3
4
5
1/1/2007 4/1/2007 7/1/2007 10/1/2007 1/1/2008 4/1/2008
Qs(f
t3/s
)
Date
Pass a Loutré (RS 10)
07 Calibration/08 Validation
07-08-Bara-Pont-WB-SP-SWP-Pal
Southwest Pass RS 28 (07 Cal./08 Val.)

307
Figure 6-185: 2007-2008 Bed Material Transport (Qs) Comparison at Pass a Loutré RS 1 due to the Addition
of the Barataria and Pontchartrain Basin Diversions; the Closure of South Pass, Southwest Pass, and West
Bay; and the Dredging of Pass a Loutré to the ‘oil spill’ Dimensions for the Proposed Diversions Combined
with the Changes to the Delta Distributaries Study.
-2
-1
0
1
2
3
4
5
6
1/1/2007 4/1/2007 7/1/2007 10/1/2007 1/1/2008 4/1/2008
Qs(f
t3/s
)
Date
Pass a Loutré (RS 1)
07 Calibration/08 Validation
07-08-Bara-Pont-WB-SP-SWP-Pal
Southwest Pass RS 1 (07 Cal./08 Val.)

308
CHAPTER 7: DISCUSSION
A 1-D numerical model was developed, to predict the response of the Mississippi River (MR) to
natural and man-made changes. This model was unique in that it extended from Tarbert Landing,
MS (RM 306) to the Gulf of Mexico (GOM) and included the Barataria Basin drainage network
and the existing passes and diversions. The model was calibrated, using 2007 discharge and stage
data, and validated, using 2003 and 1999-2000 discharge and stage data. The 2007 mean stage
calibration root mean square error (RMSE) was approximately 0.77 ft, the mean bias error was
less than 0.5 ft, and the mean RMSE per average depth was 1.46%. The 2003 mean stage
validation RMSE was approximately 1.08 ft, the mean bias error was less than 0.5 ft, and the
mean RMSE per average depth was 2.14%. The 1999-2000 mean stage validation RMSE was
approximately 0.79 ft, the mean bias error was less than 0.5 ft, and the RMSE per average depth
was 1.57%. These relatively small errors indicate that the model can be used for various
applications involving changes to the river channels and/or the introduction of new diversions.
7.1 Relative Sea Level Rise Study
For the relative sea level rise study (RSLR), the values of 1.64, 3.28, and 4.92 ft are used to
represent the possible change over the next 50 years in the GOM stage relative to the present
(2010) datum where the Lower MR enters the GOM. The values are quite high, but are
consistent with annual RSLR rates of 9 to 200 mm/year between New Orleans and Lower
Plaquemines Parish. The term “relative” takes into account the effects of land subsidence and sea
level rise from the GOM.
The rating curves were also analyzed for the three cases of relative sea level rise. The results
indicated that as the flow rate and stage increased, the four curves (c 2010, RSLR 0.5, RSLR 1.0,
and RSLR 1.5) converged at the at the Carrollton gage, which suggests that at peak flows the
stage in the river above New Orleans will not be greatly affected by RSLR. For example, at
Violet (Figure 6-9) the maximum increase in stage at high flood is approximately 1.5 ft while at
low River flow the increase is about 5 ft. The increase in River stage with the increase in RSLR
decreased asymptotically upstream from the GOM in a similar way to the backwater curve
upstream of a dam. The head available for distributary flows will decrease with increasing
RSLR.
Initially the rise in the stage will increase the cross-sectional area and this will reduce the
velocity and lower the energy gradient of the channel, which will reduce the energy slope of the
channel. Therefore, the bed shear stress, which is directly proportional to the energy slope, will
be decreased; this effect was observed in the shear stress results. The decrease in shear stress
directly affects the sediment transport potential of the river because if there is not enough shear
stress near the bed, then less sand will be transported. Therefore, the bed material transport
capacity will be reduced as the water surface level rises. Thus, sea level rise is expected to result
in shoaling in the Lower Mississippi River. This effect will diminish with increasing River
Mileage and should be restricted to the reach below New Orleans. If dredging is not
implemented, the channel will tend to silt in and the hydraulic grade line will start to increase.

309
7.2 West Bay Closure Study
For the West Bay closure study, the West Bay channel was removed entirely from the model to
coincide with the decommissioning of the diversion. The flow rates in the passes and other
nearby channels were analyzed to determine the distribution of flow. Table 6-2 summarizes the
predicted re-distribution of flow due to the closure of the West Bay Diversion with the present
(2010) River morphology. On average, the passes and Fort St. Philip received approximately 5%
more flow capacity than the original flow distribution. Also, the effects of the diversion closure
were observed all the way up to Bayou Lamoque North and South (RM 32.7 and 32.4,
respectively), which received an average of 2.1% increase in flow.
7.3 Changes to the Delta Distributaries Study
This study was made to determine the sensitivity of the flows in the present distributaries to
changes in the passes down river from the HOP. Simulations were performed for scenarios of
closing the South and Southwest Passes, and dredging Pass a Loutré to various extents. For
example, closing Southwest Pass along with West Bay would increase the amount of flow
entering the other Lower River distributaries by 20 to 75% with the large increase in Pass a
Loutré. Closing South Pass, Southwest Pass, and West Bay and dredging the Pass a Loutré
channel to (i) -50 ft and (ii) -40 ft at its present width resulted in over 700% increase in the flow
in Pass a Loutré compared to its present flow. However, as shown in Table 6-5, the flows in the
other distributaries were reduced below their original flows.
These high flows in Pass a Loutré, led to the decision to model a smaller dredged channel for
Pass a Loutré. The suggested dimensions of the future Pass a Loutré channel were presented by
the LACPR during the planning of the sand dredging for the „sand‟ berms project during the BP
oil spill. The dimensions were: top width of 1,242 ft, dredged depth of 40 ft, and side slopes of
1V:6H; this resulted in about 100% increase in the mean flow in Pass a Loutré with present
River morphology (Table 6-7).
7.4 Gulf of Mexico ‘oil spill’ Study
For this study, the „oil spill‟ channel dimensions were applied to the Pass a Loutré channel with
the existing dimensions at the other distributaries. With the existing River geometry, the flow
distribution (Table 6-7) showed that the enlarged Pass a Loutré channel diverted flow from the
remaining passes and channels. The shear stress results showed that the more flow that Pass a
Loutré receives, the higher the shear stress becomes and the lower the potential for shoaling.
Southwest Pass showed an inverse relationship to that of Pass a Loutré, i.e. the dredging would
increase the potential for shoaling.
7.5 Proposed Barataria Basin Diversions Study
The impact of the proposed Multiple Lines of Defense Strategy (MLODS) diversions for
Barataria Basin were modeled individually and combined. Diversion channels and structures
were created to simulate the MLODS diversions‟ flow targets at Buras, Jesuit Bend, Myrtle
Grove, and Deer Range. Assigned hydrographs were used to simulate the proposed diversions at

310
Lagan and Johnson. The diversion at Buras was designed as a crevasse-type diversion with
uncontrolled discharge at all times. The diversions at Jesuit Bend, Myrtle Grove, and Deer Range
were designed as channels with gated structures, which were opened for 6 months at a time. The
stage results showed that the removal of flow from the Mississippi River reduces the stage in the
river as shown in Table 6-9 for the Buras Diversion. However, the extent of this reduction
depends on the location of the diversions. For example, the mean stage difference, as shown in
Table 6-15, for all of the Barataria Basin diversions was found to be -0.35 ft at Carrollton and -
0.20 ft at Baton Rouge.
7.6 Proposed Pontchartrain Basin Diversions Study
The impact of the proposed Multiple Lines of Defense Strategy (MLODS) diversion for the
Pontchartrain Basin were modeled individually and combined. Diversion channels and structures
were created to simulate the MLODS diversions at Belair, Bohemia, Blind River, Garyville,
Violet, and Bonnet Carré. The diversions at Belair and Bohemia were designed as crevasse-type
diversions with uncontrolled discharge at all times. The diversions at Blind River, Garyville,
Violet, and Bonnet Carré were designed as lateral gated structures, which were opened at all
times. The stage results showed that the removal of flow from the Mississippi River reduces the
stage during high flows, but the impact decreased as the river flow decreased. When the stage in
the river becomes lower than the diversion crest, there is no flow diverted at that site. Therefore,
at low flows some of the controlled diversions will have zero flow.
The MLODS had proposed a 50,000 cfs diversion at Benny‟s Bay. Since this site is almost
opposite to the West Bay Diversion and because the West Bay Diversion has been slated for
closure, it was thought to be unwise to locate a major diversion at this location. In addition, the
Benny‟s Bay site is very close to Pass a Loutré and as such could induce shoaling at the entrance
to Pass a Loutré.
7.7 Proposed Diversions Combined with Changes to the Delta Distributaries Study
This study included the proposed diversions from the MLODS along with the proposed pass
modifications from the MLODS. The first of these simulations involved operating all of the
Barataria diversions and closing off either South or Southwest Pass. The stage results showed
that, when compared to just having the diversions along the river, closing either South Pass or
Southwest Pass increases the stage in the river from Venice up to Baton Rouge. The discharge
results showed that closing either pass would also increase the amount of flow entering the other
passes and local channels. In addition, the results showed that the diversions would remove some
of the additional flow in the river that the closure of the two passes would cause. For example,
the flow in Pass a Loutré was increased by 24% when South Pass was closed without the
diversions present. With the diversions present, Pass a Loutré was only increased by 23%, which
indicates that the proposed diversions would remove the water that would otherwise go to the
passes and local channels. It also indicated that the closure of the Southwest and South Passes
and the dredging of Pass a Loutré combined with the other MLODS diversions would not result
in an excessive increase in the flow to Pass a Loutré.
311
With only the proposed MLODS Barataria Basin diversions; the closing of South Pass and
Southwest Pass and the dredging of the Pass a Loutré channel to (i) -50 ft and (ii) -40 ft, the
discharge in the larger Pass a Loutré channel was increased by over 700% of its original flow
because of its extra capacity while the other distributaries experienced a decrease in their normal
discharge. A 30% reduction in the width of Pass a Loutré and a dredged depth of 40 ft was
needed to prevent a decrease in the normal flows to the other distributaries and essentially the
entire flow of the South and Southwest Passes was diverted to Pass a Loutré. This condition
would greatly reduce the current shoaling in Pass a Loutré.
The final simulation included: all of the proposed MLODS Barataria and Pontchartrain Basin
diversions; the closing of West Bay, South Pass, and Southwest Pass and the dredging of Pass a
Loutré to the „oil spill‟ dimensions (depth = 40 ft; top width = 1,242 ft; and side slopes 1:6). The
simulation was run from January 1, 2007 to June 27, 2008 (07-08-Bara-Pont-WB-SP-SWP-Pal).
Tables 6-36 and 6-37 summarize these results. The diversions at Blind River, Garyville, Bonnet
Carré, Violet, Jesuit Bend, Myrtle Grove, Deer Range, and Buras provided their target discharges
in the MLODS Report. The maximum diversion flows at Belair and Bohemia were
approximately 10% less that the target of 200,000 cfs. These are very large diversions and were
sized for 2008 high stages without the cumulative effects of all of the other diversions. Buras on
the other hand could have been reduced in size, which would permit greater flow to the other
diversions. Table 6-37 shows that Baptiste Collette and Grand Pass will experience about a 12 %
increase in flow and the „oil spill‟ Pass a Loutré channel with have more than double its present
flow. Main Pass will have about a 30% increase in its flow. The flow at Bayou Lamoque may be
slightly reduced.
In general, the hydraulic grade lines downstream of diversions are reduced due to the reduction
in the friction losses which depend on the square of the discharge. From Baton Rouge to
upstream of Venice, the river stages are generally lower than the existing stages at similar flows.
From Venice and downstream the stages are generally higher than the corresponding present
stages. This indicates that, from Baton Rouge down to Venice, the proposed diversions will
control the river stage; and, from Venice down to the HOP, the pass closures will control the
stage in the river. The stage results also show that immediately upstream of a diversion, there
will be a reduction in stage as a result of the downstream change; the increase in the friction
slope will gradually restore the normal stage as we move upstream from a diversion. At high and
mean River flows, the following stage changes may occur:
1. Baton Rouge stages are not significantly increased;
2. Carrollton stages are lowered by 2 to 3 ft at high flood stages;
3. Venice stages are raised by about 1 ft at high flood.
At low River flows, the following stage changes can be expected:
1. Baton Rouge stages are not significantly changed;
2. Carrollton stages are slightly decreased;
3. Venice stages are increased by about 0.2 ft.
Since a large fraction of the flow area is below sea level in the reaches between New Orleans and
Venice, the currents are very sensitive to the local flow and therefore to diversions; in general,
the currents in this reach are expected to decrease as a result of the diversions. At high and mean

312
River flows the following changes in the currents may occur: Baton Rouge currents are not
significantly affected; Carrollton currents are not significantly affected; but Venice currents are
reduced by about 44% at high flood and are reduced by about 42% at mean flows. At low River
flows, the following changes in currents can be expected: Baton Rouge currents are not
significantly changed; Carrollton currents are not significantly changed; and Venice currents are
reduced by about 32%. Increased shoaling can be expected in the reaches downstream of the
large diversions. This will occur because the diversions cannot capture 100% of the bed material
load associated with the diverted flow and because the energy slope is reduced; this reduces the
downstream bed material transport capacity. This reduced bed material capacity is insufficient to
move the bed material that remains in the River. The shear stresses in the proposed Pass a Loutré
channel are higher than the shear stresses in the present Southwest Pass. Also, the bed material
transport capacity of the proposed Pass a Loutré channel is higher compared to the present
Southwest Pass.
7.8 Sources of Error
This model is an unsteady hydrodynamic model in that the boundary conditions change over
time and the continuity and momentum equations are solved at each time step. It is not, however,
a true unsteady model because the channel bed does not change over time. The U.S. Army Corps
of Engineers (USACE) surveys the MR and its tributaries once every 10 years with the most
recent survey being the 2003-2004 Hydrographic Survey (USACE NOD, 2007). Therefore, it
was not possible to update the channels‟ bathymetry on a yearly or daily basis and constant
channel data were used for every simulation. Also, information on the hydrology of the modeled
reach, such as precipitation, surface runoff, infiltration, groundwater table elevation, and
evaporation, were not taken into account in the model. This may account for some of the
differences in the observed and modeled river stages. For example, a heavy rain event could
increase the stage by a few inches. Also, the effective roughness in the model varies with the bed
forms, which change dynamically with the flow and bed shear stress; the model does not capture
this process. Although HEC-RAS has a sediment transport sub-model, it operates in a quasi-
unsteady mode and therefore fails to capture the full dynamic wave in the river.
The low flow period for the 2007 calibration showed some differences between the observed and
calculated stage values at the downstream gages. The magnitude of these differences indicates
that the problem is related to the specification of the downstream boundary conditions, i.e. the
Gulf of Mexico stage and salinity. The calculated stage was lower than the observed stage, which
could be due to unaccounted for tropical surges or wind shear effects or an underestimation of
the influence of saltwater intrusion from the GOM. Some of the gages report stage once per day,
e.g. at 8 am, thus these stages do not reflect the tidal variation.
For the 2003 and 1999-2000 validation simulations, the downstream boundary condition was set
as the 2007 GOM salinity corrected stage hydrograph because of the lack of stage and salinity
data for those periods. The stage comparison for the 1999-2000 simulation had good agreement
between the observed and calculated values with a mean RMSE of 0.79 ft. However, the mean
RMSE of 1.08 ft for the 2003 validation was caused by the boundary conditions. The HEC-RAS
program is not capable of creating oscillations or abrupt changes during the simulations because
the calculations of momentum and continuity rely on the user-inputted boundary conditions.

313
Therefore, if the upstream or downstream boundary condition does not specify a change in the
hydrograph, then the model would not know to consider it. For the 2003 validation, the resulting
stage hydrographs along the MR did not agree with the observed values near the end of the year,
but the results did retain the curve-shape of the upstream discharge hydrograph and the
downstream GOM stage hydrograph. One possible reason for the disagreement between the
observed and calculated stage values could be the use of the 2007 GOM stage hydrograph as the
default downstream boundary condition.
The discontinuities between the observed stage and the calculated stage for the 2007-2008
simulation are due to the time interval of the input data. The boundary condition of the time-
series of gate openings was given daily values from the USACE website. However, the unsteady
hydrodynamics were computed every 10 minutes. Therefore, there is a “shock” to the system,
which appears as an unrealistic transient spike in the river stage when the gates are initially
opened or closed. The actual field operations of the spillway involved opening the gates over the
course of several minutes to hours, which smoothed out any shock that the stage witnessed. Also,
the HEC-RAS model‟s method of transitioning from orifice flow to surface weir flow is not
continuous and could also cause a shock to the system because the equations for the flow rate
include exponents on the energy head that change from 0.5 (orifice flow) to 1.5 (weir flow).
One of the problems with the 2003 LIDAR/bathymetry file was the mesh constraints mentioned
earlier. Another problem with the 2003 file was that the Louisiana coastal area underwent
tremendous land loss (~ 217 square miles) from Hurricanes Katrina and Rita in 2005 (LPBF,
2008), which was not taken into account in the 2003 data. Therefore, the 2003 bathymetry in the
passes and diversion receiving areas is not fully representative of the current channel bathymetry.
The model can be used as a guide for future projects, but should not be considered a highly
precise representation of the MR and its tributaries.
One issue with modeling the Barataria Basin in HEC-RAS is that the program lacks certain
structural options, such as locks. For the ICCW at Harvey and Chalmette, the amount of flow
entering the channels is entirely dependent on the operations and schedule of the navigation
locks. The flow in these channels varies on an hourly to daily basis. To remedy this in the model,
the Manning‟s n values were increased near the channel intakes to maintain a constant of 100 cfs
each, which is an average flow based on lock operational data. Another issue with the Barataria
Basin in HEC-RAS is the limit on the number of channels allowed in confluences and splits. For
example, the model only allows two channels to combine to form a third channel, or one channel
to split into two channels. However, in the Barataria Basin there are several locations where four
channels are connected at one location. To remedy this problem, short intermediate channels
were created to connect one confluence to one split.
Another issue with the channel bathymetry, besides the lack of available data, is that several
gages are referenced to different datums. For instance, the West Pointe a la Hache river gage was
updated to NAVD 88 in 2006 (Mississippi River & Passes, 2010); however, the other
comparison gages at Baton Rouge, Donaldsonville, North of Bonnet Carré, Bonnet Carré,
Carrollton, and Venice are referenced to NGVD 29. Therefore, the observed stage data had to be
adjusted to the NAVD 88 datum by subtracting a certain height, which was provided by the
website (Mississippi River & Passes, 2010).

314
CHAPTER 8: CONCLUSIONS AND RECOMMENDATIONS FOR
FUTURE RESEARCH
A 1-D numerical model was developed to simulate the hydrodynamics of the Lower Mississippi
River and its existing diversions and distributaries. This river response model was needed to
investigate the impacts of proposed freshwater diversions, as well as proposed distributary
channel modifications. The model was calibrated using recorded stage data for the calendar year
of 2007. The average 2007 calibration RMSE, bias error, and RMSE per average depth were
0.77 ft, less than 0.5 ft, and 1.46%, respectively. The model was then validated using recorded
stage data for the calendar year of 2003. The average 2003 validation RMSE, bias error, and
RMSE per average depth were 1.08 ft, less than 0.5 ft, and 2.14%, respectively, which are also
relatively small errors. Next, the model was validated for the calendar years of 1999-2000, using
recorded stage data. The average 1999-2000 validation RMSE, bias error, and RMSE per
average depth were 0.79 ft, less than 0.5 ft, and 1.57%, respectively, which are relatively small
errors. Therefore, the model was considered suitable for other applications, such as channel
modifications, proposed diversions, and relative sea level rise studies. These differences between
the model output and the field measurements are a good indication of model uncertainty.
The first application of the model involved experimenting with relative sea level rise to
determine the potential effects on the bed material transport capacity of the river. The RSLR was
varied from 0 to 4.9 ft. The model indicated that a RSLR of 4.9 ft would result in a 2 ft rise in the
stage at West Pointe a la Hache and 1.5 ft rise at Violet at high river flows. However, this change
in the stage results in a decrease in the bed shear and mean velocity. The model showed that
there would be a decrease in this sand transport capacity with increasing RSLR; this would lead
to increased shoaling in the Mississippi River below New Orleans. In order to expand this
research on the sediment transport capacity, it is recommended that the model be used with the
sediment transport module in HEC-RAS 4.1.0, which was released in 2010.
The second application of the model addressed the decommissioning of the West Bay Sediment
Diversion, which was officially announced in 2010. The channel was removed from the model
and the flow that would normally have entered that channel was automatically re-distributed by
the model to the remaining passes and local distributaries. Southwest Pass was the major
recipient of the re-directed flow from West Bay but all of the Passes received a portion of the
flow.
The third application focused on the channel modifications at the Head of Passes as described in
the Lake Pontchartrain Basin Foundation‟s (LPBF) Multiple Lines of Defense Strategy
(MLODS). These modifications included closing South Pass and Southwest Pass individually
and together along with dredging Pass a Loutré. Similar to the West Bay Study, the model was
capable of re-distributing the flow to the remaining passes and channels as South Pass or
Southwest Pass were closed. For the dredging of Pass a Loutré, several alternatives were
investigated. The first involved dredging the channel to: (1) -50 ft at its present width, (2) -40 ft
at its current width, (3) -40 ft at 90% of its current width, (4) -40 ft at 80% of its current width,
(5) -40 ft at 70% of its current width, (6) a copy of Southwest Pass RS 81, (7) a rectangular
channel with invert at -40 ft and width of 1,200 ft. Each of these alternatives greatly increased
the flow in Pass a Loutré and reduced the discharge in the other remaining passes and channels.

315
Therefore, options (1) and (2) were thought to be unacceptable because the potential to divert
sediment to the coastal area would be greatly diminished. This potential for beneficial use of the
water and sediment loads was improved by making the channel of Pass a Loutré narrower.
The fourth application was similar to the previous one, but it concentrated on altering Pass a
Loutré to the „oil spill‟ dimensions [(8) a trapezoidal channel with invert at -40 ft, top width of
1,242 ft and 1:6 side slopes]. Similar to the previous application, the flow of the channel was
increased and the flows in the other local channels were decreased. This option (8) appears to be
the best option for dredging Pass a Loutré. In order to maintain Pass a Loutré at a suitable depth
for navigation purposes, jetties could be added along the banks, which would allow a narrowing
of the channel that would decrease its capacity.
The next series of applications included the evaluation of several of the proposed MLODS
diversions. The types of diversions considered were:
1. Uncontrolled crevasse-type diversions at: Buras, Belair, and Bohemia;
2. Controlled or gated diversions at: Jesuit Bend, Myrtle Grove, Deer Range, Blind
River, Garyville, Violet, Bonnet Carré; Lagan and Johnson.
The model was capable of diverting flow through these channels and structures, and continuity
was maintained. Also, the results indicated that the gage at Carrollton, which is important for
New Orleans, would not be significantly affected by the combined operation of several of these
diversions with the existing Passes and with or without the West Bay Diversion. These
simulations were used to obtain preliminary dimensions for the proposed diversions.
The final application of the model involved introducing the proposed MLODS diversions along
with the proposed modifications to the Delta distributaries. The model was capable of predicting
the re-distribution of flow to the remaining passes and distributaries as well as predicting the
changes in the currents and sand transport capacities in the vicinity of the diversions. The general
effect of the multiple diversions was to reduce the flow, the currents, and the bed shear stresses
in the Mississippi River from the Bonnet Carré Spillway to the HOP. The consequence of this is
likely to be increased shoaling in this reach. The shoaling would be most pronounced just
downstream from the large diversions, e.g. Belair, Bohemia and Buras. Sediment diversions with
beneficial disposal should be investigated at these locations. The results indicated that the stage
at Carrollton on average would only be slightly decreased by the combined operation of the
MLODS diversions in conjunction with the Pass modifications. At low flows, the stage would
slightly increase. Also, a similar situation to the third study arose with the dredging of Pass a
Loutré, where that channel‟s capacity removed flow from the remaining passes and
distributaries. One alternative would be to increase the capacity of the proposed diversions in
order to reduce the stage in the river and thereby reducing the capacity of Pass a Loutré. A
second alternative would be to add jetties along Pass a Loutré to create a narrower cross-section,
which would reduce the capacity and increase the bed material transport. This method would
require dredging of Pass a Loutré to maintain a necessary depth for navigation, where the
dredged material could be transported to the nearby marsh to help sustain the delta formation. A
third alternative would be to leave Southwest Pass slightly open, because it is very large and
would take an excessive amount of sediment to fill in. This method would alleviate the pressure
at Pass a Loutré by taking a portion of the high flows and would prevent saltwater intrusion from

316
the GOM. Also, the low flows in the channel could provide possible shoaling and land
construction. These alternatives could be utilized individually or in combination in order to
maintain a balance of flow in the delta and to create additional land for the protection of the
coast. Also, the dredging and beneficial use of the material in the shoaling areas should be part of
each large diversion plan.
If the Pass a Loutré (PAL) channel is under-sized, there will be an increase in upriver stage,
which provides more energy for diversions. Upstream of the Head of Passes (HOP), there will be
a reduction in channel velocity due to the increased backwater effect of the PAL channel. More
of the sand load will tend to settle out, which causes shoaling in the River. Downstream of the
HOP, the velocity will increase as the water flows through the PAL channel. This higher velocity
will increase the shear stress along the bed and could initiate scouring of the pass. Also, this high
velocity creates high currents, which may be less acceptable for navigation.
If the PAL channel is over-sized, there will be a reduction in the upriver stage, which reduces the
amount of energy available for diversions. This change could extend as far upstream as Bayou
Lamoque. Upstream of the HOP, there will be a slight increase in channel velocity, because the
flow is reaching a large PAL channel, and the sand will not settle as much because this high
velocity will keep them in transit. Downstream of the HOP, the velocity will decrease due to the
enlarged channel. This lower velocity will reduce the shear stress along the bed and could create
shoaling of the pass. Also, the increased concentration of sand in the water column caused by the
higher velocity upstream of the HOP will transport sand into the PAL channel where it will
eventually settle due to the low velocity in the pass. This increase in shoaling in the pass is
undesirable for navigation.
A balanced design of the Pass a Loutré channel requires a design that is larger than the current
channel dimensions but smaller than the channel dimensions that would result in excessive
shoaling. This stage will allow enough energy so that the upstream diversions and distributaries
will not be starved. As a starting point for the final design, the new channel should have similar
velocities, shear stress and sand transport potential to the existing Southwest Pass. There will be
a slight decrease in channel velocity upstream of the HOP because PAL would be the only outlet
to the GOM; and therefore, all of the discharge that is typically distributed to the three passes
would then be directed through PAL alone. This decrease in velocity will decrease the shear
stress and cause a slight increase of shoaling in the River. This will be advantageous in that the
further upstream that the shoaling occurs the more effective beneficial dredging will be. Dredged
material cannot economically be pumped more than a distance of 10 miles due to the head loss
associated with the slurry mixture. As a result, booster pumps are required every 4 – 5 miles to
ensure that the slurry keeps moving. Approximately 18% of the slurry mix is sand, which is very
difficult to re-entrain if a pump in the series should fail. Another concern with dredging is that
the structural supports for the pumps have to be designed and positioned properly so that they
cause the least amount of damage to the marsh. Therefore, the further upstream the shoaling
occurs from the HOP, the more likely the dredged material will be pumped to the necessary
areas. Downstream of the HOP, the velocity will increase slightly due to the larger channel
dimensions, which will increase the shear stress and create slight scouring of the channel. This
natural scouring would be beneficial for navigation as long as it is maintained and as long as the
currents in the pass do not produce excessive turbulence.

317
Overall, this model is a good tool for understanding the hydrodynamics of the Lower Mississippi
River and predicting the relative changes that can be expected due to the construction of
diversions or the closure of existing passes or future sea levels.

318
REFERENCES
Andrus, T.M. (2007). “Sediment Flux and Fate in the Mississippi River Diversion at West Bay:
Observation Study.” Thesis, Louisiana State University and Agricultural and Mechanical
College, Baton Rouge, LA.
Barbé, D.E., Fagot, K., & McCorquodale, J.A. (2000). Effects on Dredging Due to Diversions
from the Lower Mississippi River. Journal of Waterway, Port, Coastal, and Ocean
Engineering, ASCE, Vol. 126(3), 121-129.
BS-12 White Ditch Diversion Restoration and Outfall Management- General Factsheet. (n.d.).
LaCoast.gov - The Louisiana Coastal Wetlands Conservation and Restoration Task
Force Web site. Retrieved March 31, 2010, from
http://www.lacoast.gov/reports/display.asp?projectNumber=BS-12&reportType=general
Chang, H.H. (1984). Modeling of River Channel Changes. Journal of Hydraulic Engineering,
ASCE, Vol. 110(2), 157-172.
Chow, V.T. (1959). Open-Channel Hydraulics. New York: The Blackburn Press.
Copeland, R.R., & Thomas, W.A. (1992). “Lower Mississippi River Tarbert Landing to East
Jetty Sedimentation Study”. Technical Report HL-92-6, U.S. Army Corps of Engineers,
New Orleans District.
Danish Hydraulic Institute (DHI). (2003). MIKE 11: A Modelling System for Rivers and
Channels, Short Introduction Tutorial. April 2003. Danish Hydraulic Institute.
Davis Pond Freshwater Diversion Project (DPFDP). (2002, March 26). LaCoast.gov – The
Louisiana Coastal Wetlands Conservation and Restoration Task Force Web site.
Retrieved March 31, 2010, from http://www.lacoast.gov/Programs/DavisPond/Index.htm
Deepwater Horizon oil spill - Wikipedia, the free encyclopedia. (2010, August 6). Wikipedia, the
free encyclopedia. Retrieved August 6, 2010, from
http://en.wikipedia.org/wiki/Deepwater_Horizon_oil_spill
Georgiou, I.Y., McCorquodale, J.A., Neupane, J., Howes, N., Hughes, Z., FitzGerald, D., &
Schindler, J.K. (2010). “Modeling the Hydrodynamics of Diversions into Barataria
Basin.” Final Report submitted to the Lake Pontchartrain Basin Foundation.
Guilbeau, D. (n.d.). West Bay Sediment Diversion (MR-03). LaCoast.gov - The Louisiana
Coastal Wetlands Conservation and Restoration Task Force Web site. Retrieved March
31, 2010, from lacoast.gov/reports/gpfs/MR-03.pdf
HEC-6. (2008, October 21). Hydrologic Engineering Center Home Page. Retrieved February 15,
2010, from http://www.hec.usace.army.mil/software/legacysoftware/hec6/hec6.htm

319
Holly, F.M. Jr., Yang, J.C., Schovarz, P., Scheefer, J., Hsu, S.H., & Einhellig, R. (1990).
CHARIMA: Numerical Simulation of Unsteady Water and Sediment Movement in
Multiply Connected Networks of Mobile-Bed Channels. Iowa Institute of Hydraulic
Research, Report No. 343, University of Iowa, Iowa City, IA.
Ingenierie, S., Department of Civil & Environmental Engineering University of New Orleans, &
Coastal Restoration Consultants. (1997). Feasibility Study and Report for the Department
of Natural Resources State of Louisiana on the Transport of Sediment by Gravity for
Coastal Restoration and Wetland Rehabilitation in Louisiana.
Krishnappan, B.G. (1985). Modeling of Unsteady Flows in Alluvial Streams. Journal of
Hydraulic Engineering. ASCE, Vol. 111(2), 257-266.
Lake Pontchartrain Basin Foundation (LPBF). (2008). “Comprehensive Recommendations
Supporting the Use of the Multiple Lines of Defense Strategy to Sustain Coastal
Louisiana 2008 Report (Version 1)”, Lake Pontchartrain Basin Foundation. Metairie, LA.
Louisiana Coastal Wetlands Conservation and Restoration Task Force (LCWCRTF). The 1997
Evaluation Report to the U.S. Congress on the Effectiveness of Louisiana Coastal
Wetland Restoration Projects. (1997). Baton Rouge: Bourque Printing, Inc.
Mahmood, K., & Yevjevich, V. (1975). Unsteady Flow in Open Channels, Volume I. Fort
Collins: Water Resources Publications.
McCorquodale, J.A., & Georgiou, I.Y. (2006). Evaluation of Water Quality Models for Ontario
Receiving Waters. University of New Orleans, New Orleans, LA. March 27, 2006.
McCorquodale, J.A., Georgiou, I.Y., Roblin, R., & Retana, G. (2008). “Assessment of Integrated
Hydrodynamic and Transport for Long-term Predictions: Volume II, Water Quality
Modeling of the Pontchartrain Estuary.” June 30, 2008. FMI Center for Environmental
Modeling and Pontchartrain Institute for Environmental Studies.
Meade, R.H. (1995). “Contaminants in the Mississippi River 1987-92.” U.S. Geological Survey
Circular 1133.
Meselhe, E.A., Habib, E., Griborio, A.G., Gautman, S., McCorquodale, J.A., & Georgiou, I.Y.
(2005). Hydro-Ecological Modeling of Lower Mississippi River. Proceedings of the 14th
Biennial Coastal Zone Conference, New Orleans, LA.
Meselhe, E.A., Pereira, J.F, Georgiou, I.Y., Allison, M.A., McCorquodale, J.A., & Davis, M.A.
(2010). Numerical Modeling of Mobile-Bed Hydrodynamics in the Lower Mississippi
River, Proc. of World Environmental & Water Resources Congress (EWRI) 2010,
A.S.C.E., Providence, RI. (To be published).

320
Miller, G. (2008, February 11). West Bay Diversion. U.S. Army Corps of Engineers New
Orleans District. Retrieved March 31, 2010, from
http://www.mvn.usace.army.mil/west_bay_diversion.htm
Mississippi River & Passes. (2010, March 31). RiverGages.com: Water Levels of Rivers and
Lakes. Retrieved March 31, 2010, from
www2.mvr.usace.army.mil/WaterControl/new/layout.cfm
Park, D. (2002). “Hydrodynamics and Freshwater Diversion within Barataria Basin.”
Dissertation, Louisiana State University and Agricultural and Mechanical College, Baton
Rouge, LA.
Parker, G., Sequeiros, O., & River Morphodynamics Class of Spring 2006. (2006). Large Scale
River Morphodynamics: Application to the Mississippi Delta. Proceedings, River Flow
2006 Conference. September 6 – 8, 2006.
Papanicolaou, A.N., Elhakeem, M., Krallis, G., Prakash, S., & Edinger, J. (2008). Sediment
Transport Modeling Review – Current and Future Developments. Journal of Hydraulic
Engineering. ASCE. January 2008.
Pereira, J.F., McCorquodale, J.A., Meselhe, E.A., Georgiou, I.Y. & Allison, M.A. (2009).
Numerical Simulation of Bed Material Transport in the Lower Mississippi River. Journal
of Coastal Research, Proceedings of the 10th
International Coastal Symposium (SI 56),
1449-1453. Lisbon, Portugal.
Pereira, J.F., Silva, J.M., & Holly, F.M.. (2007). Numerical Simulation of Unsteady Mobile-Bed
Hydrodynamics, with Application to Mondego River. International Association for
Hydraulic Research, Proceedings from the 32nd
Congress. Spain.
Port of New Orleans – Louisiana, USA. (2009, December 21). Port of New Orleans –Louisiana,
USA. Retrieved February 1, 2010, from
http://www.portno.com/pno_pages/about_overview.htm
Pratt, T. (2009). “West Bay Sediment Diversion Work Plan, Task 1: Data Collection and
Analysis.” U.S. Army Corps of Engineers, Engineer Research and Development Center,
Vicksburg, MS.
Project Fact Sheet: Mississippi Delta Region, LA, Davis Pond Freshwater Diversion Project.
(2003, April). U.S. Army Corps of Engineers, New Orleans District & Louisiana
Department of Natural Resources (USACE NOD & LA DNR). Retrieved February 1,
2010, from http://www.mvn.usace.army.mil/PRJ/davispond/davispond.htm
Raphelt, N.K., Martin, S.K., & Little, Jr., C.D. (2008). “Desktop Study of Hydrodynamic and
Sediment Processes in the Pass a Loutré Channel of the Lower Mississippi River.” U.S.
Army Engineer Research & Development Center, Coastal & Hydraulics Laboratory.

321
Roberson, J.A., Cassidy, J.J., & Chaudhry, M.H. (1988). Hydraulic Engineering. Boston:
Houghton Mifflin Company.
U.S. Army Corps of Engineers, Hydraulic Engineering Center (USACE HEC). (1993). HEC-6,
Scour and Deposition in Rivers and Reservoirs, User’s Manual Version 4.1. U.S. Army
Corps of Engineers, Hydrologic Engineering Center (HEC) Publication.
U.S. Army Corps of Engineers, Hydrologic Engineering Center (USACE HEC). (2008). HEC-
RAS River Analysis System, User’s Manual Version 4.0. U.S. Army Corps of Engineers,
Hydrologic Engineering Center (HEC) Publication.
U.S. Army Corps of Engineers, Mississippi River Commission (USACE MRC). (1985). “New
Orleans Area Map.” Mississippi River Commission, Vicksburg, MS.
U.S. Army Corps of Engineers, New Orleans District (USACE NOD), 1993. Mississippi River
Hydrographic Survey: 1991 – 1992; Black Hawk, LA to Head of Passes, LA and South
and Southwest Passes and Pass a Loutré. Mississippi River Commission, Vicksburg, MS.
U.S. Army Corps of Engineers, New Orleans District (USACE NOD). (2007). “Mississippi
River Hydrographic Survey: 2003 – 2004; Black Hawk, LA to Gulf of Mexico.”
Mississippi River Commission, Vicksburg, MS.
U.S. Army Corps of Engineers, New Orleans District (USACE NOD). (2009). “West Bay
Survey Data.” Mississippi River Commission, Vicksburg, MS.
U.S. Army Corps of Engineers New Orleans District (USACE NOD): Spillway Opening and
Closing Pace. (2010, March 17). U.S. Army Corps of Engineers New Orleans District.
Retrieved March 17, 2010, from
http://www.mvn.usace.army.mil/bcarre/2008%20operation.asp
Visible Earth: Mississippi River Sediment Plume. (2001, March 15). Visible Earth: Home.
Retrieved March 17, 2010, from http://visibleearth.nasa.gov/view_rec.php?id=1650
Waldron, R. (2008). “Physical Modeling of Flow and Sediment Transport Using Distorted Scale
Modeling.” Thesis, Louisiana State University and Agricultural and Mechanical College,
Baton Rouge, LA