Embed Size (px)
Citation preview

HYDROGEOLOGIC INVESTIGATION OF THEFLORIDAN AQUIFER SYSTEM AT THE
I-75 CANAL SITECOLLIER COUNTY, FLORIDA
Technical Publication WS-7
Michael W. Bennett, P.G.December 2001
South Florida Water Management District
3301 Gun Club Road
West Palm Beach, FL 33306
(561) 686-8800
www.sfwmd.gov


Hydrogeologic Investigation - I-75 Canal Site Executive Summary
EXECUTIVE SUMMARY
The Lower West Coast Planning Area includes Collier and Lee counties andportions of Hendry, Charlotte, and Glades counties. A combination of natural drainagebasins and political boundaries defines the extent of this planning area. Water supply plansdeveloped for the Lower West Coast Planning Area have identified the Floridan AquiferSystem (FAS) as a possible water supply alternative. Based on these plans, the SouthFlorida Water Management District (SFWMD) initiated a program of exploratory wellconstruction, aquifer testing, and long-term monitoring to provide data needed to assessthe FAS underlying this area. The long-term monitoring includes water quality andpotentiometric heads monitoring.
This report documents the results of two Floridan aquifer wells constructed andtested under the direction of the SFWMD. These wells are located east of the city ofNaples, near the SFWMD’s D2-7 water control structure on the I-75 Canal in CollierCounty, Florida. This site was selected to augment existing data and provide broad, spatialcoverage within the SFWMD’s Lower West Coast Planning Area.
The scope of the investigation consisted of constructing and testing two FAS wells.The first well, I75-TW, was drilled to a total depth of 2,694 feet below land surface (bls),just northeast of the D2-7 water control structure. It was completed into three distincthydrogeologic zones within the upper and lower Floridan aquifer. The second well, I75-PW, is located 283 feet southeast of the monitor well (I75-TW) and constructed tofacilitate aquifer testing of two productive horizons within the upper Floridan aquifer.This well was drilled to a total depth of 1,050 bls.
The main findings of the exploratory drilling and testing program at this site wereas follows:
• The top of the Floridan aquifer, as defined by the SoutheasternGeological Society Ad Hoc Committee on FloridaHydrostratigraphic Unit Definition (1986), was identified at adepth of approximately 690 feet bls.
• Lithologic and geophysical logs, specific capacity and packer testresults, and petrophysical data indicate moderate to goodproduction capacity of the upper Floridan aquifer.
• Water quality data from reverse air returns and straddle-packertests indicate that chloride and total dissolved solids (TDS) in theupper Floridan aquifer waters exceed potable drinking waterstandards. Chloride and total dissolved solids concentrationsrange from 1,530 to 4,020 milligrams per liter (mg/L) and 3,410to 7,150 mg/L, respectively.
i

Executive Summary Hydrogeologic Investigation - I-75 Canal Site
• The first productive horizon in the upper Floridan aquifer, from690 to 780 feet bls, yielded a transmissivity value of 116,640gallons per day per foot (gpd/ft), a storage coefficient of1.7 x 10-5, a leakage factor (r/B) value of 0.04, with a calculatedleakance value of 2.33 x 10⁻³ gpd/cubic foot (gpd/ft3).
• The second productive interval in the upper Floridan aquifer,from 890 to 1,050 feet bls, yielded a transmissivity value of52,500 gpd/ft, a storage coefficient of 2.3 x 10⁻⁵, an (r/B) value of0.05, with a calculated leakance value of 1.64 x 10⁻³ gpd/ft3.
• The base of the underground source of drinking water, thosewaters having TDS concentrations less than 10,000 mg/L, occursat an approximate depth of 1,090 feet bls.
• Fluid-type (flowmeter and temperature) geophysical logs showlittle natural flow below the base of the underground source ofdrinking water, at a depth of 1,090 feet bls.
• The average measured potentiometric heads for the Floridanaquifer monitoring intervals are as follows:
• 34.6 feet above NGVD, 1929: +0.41 feet for the 690 to760 feet bls monitor interval
• 34.5 feet above NGVD, 1929: +0.39 feet for the 905 to1,050 feet bls monitor interval
• 9.1 feet above NGVD, 1929: +0.44 feet for the 2,300 to2,350 feet bls monitor interval
• Water levels in the Floridan aquifer respond to external stressessuch as tidal loading and barometric pressure variations.
ii

Hydrogeologic Investigation - I-75 Canal Site Acknowledgements
ACKNOWLEDGEMENTS
The author gratefully acknowledge the many people that aided in the successfulcompletion of this project. I would like to thank those outside the SFWMD who reviewedthe manuscript or lent technical expertise to the writing of the report. They include RonaldReese of the United States Geological Survey and Daniel Acquaviva of Water ResourceSolutions.
Appreciation is also extended to the technical and professional staff of theSFWMD who assisted in the compilation and analysis of data and the production of thisreport. They include Richard Bower, Linda Lindstrom, John Lukasiewicz, RichardNevulis, Robert Verrastro, and E. Edward Rectenwald. I appreciate Janet Wise for hergraphic capabilities. I thank Sorrel Hoover from Orion Consulting, Inc. and Kim Jacobs atSFWMD for their editorial assistance and expertise in bringing this document topublication. I would also like to thank David Demonstranti of Electronic Support andData Acquistion at the SFWMD for the excellent field support during testing operations.
iii

Acknowledgements Hydrogeologic Investigation - I-75 Canal Site
iv

Hydrogeologic Investigation - I-75 Canal Site Table of Contents
TABLE OF CONTENTS
Introduction 1
Exploratory Drilling and Well Construction 2
Hydrogeologic Testing 10
Aquifer Performance Testing 24
Hydrogeologic Framework 37
Summary 45
References 46
Appendix A: Geophysical Logs A-1
Appendix B: Lithologic Description B-1
Appendix C: Core Descriptions for I75-PW C-1
Appendix D: Photomicrographs D-1
v

Table of Contents Hydrogeologic Investigation - I-75 Canal Site
vi

Hydrogeologic Investigation - I-75 Canal Site List of Tables
LIST OF TABLES
Table 1. Tri-Zone FAS Monitor Well Intervals and Methods........................................7
Table 2. Summary of Geophysical Logging Operations for the I-75 Canal Site..........13
Table 3. Summary of Packer Test Results for the IAS for I75-TW .............................15
Table 4. Summary of Packer Test Results for the FAS for I75-TW ............................17
Table 5. Summary of Stable Isotope and Carbon 14 Analyses ....................................18
Table 6. Summary of Net Overburden Pressure Effects on Porosity ...........................21
Table 7. Summary of Petrophysical Analyses ..............................................................22
Table 8. Summary of Petrologic Analyses ...................................................................23
Table 9. Summary of Leaky Analytical Model Results for Aquifer PerformanceTest 1. .............................................................................................................29
Table 10. Summary of Leaky Analytical Model Results for Aquifer PerformanceTest 2 ..............................................................................................................34
Table 11. Water Quality Data from Aquifer Performance Tests....................................35
Table 12. Background Water Quality Data from the Tri-Zone Monitor Well ...............36
Table 13. Average FAS Potentiometric Head Data from I75-TW for the Period ofRecord, November 1997 to August 1998 .......................................................37
Table 14. Summary of Stratigraphic Units Identified in the Subsurface........................45
Table C-1. Core Descriptions .........................................................................................C-9
vii

List of Tables Hydrogeologic Investigation - I-75 Canal Site
viii
Hydrogeologic Investigation - I-75 Canal Site List of Figures
LIST OF FIGURES
Figure 1. I-75 Canal Site Project Location Map and Site Plan.......................................1
Figure 2. Well Completion Diagram for the Tri-Zone Monitor Well, I75-TW..............3
Figure 3. Well Completion Diagram for the Dual-Zone Test Production Well,I75-PW ...........................................................................................................8
Figure 4. Lithostratigraphic Column.............................................................................11
Figure 5. Water Quality Data from Reverse Air Returns for I75-TW..........................12
Figure 6. Relationship between Stable Isotopes Deuterium and Oxygen 18................19
Figure 7. Cross-Plot of Permeability versus Porosity for I75-PW at 910.8and 1,020.5 feet bls .......................................................................................21
Figure 8. Well Configuration during Aquifer Performance Test 1...............................25
Figure 9. Semi-Log Plot of Drawdown Data from I75-MZ 1 during AquiferPerformance Test 1........................................................................................26
Figure 10. Time Series Plot of Water Levels from I75-MZ 2 and I75-MZ 3 duringthe Pumping Phase of Aquifer Performance Test 1......................................26
Figure 11. Pumping Phase Manometer Readings for Discharge Orfice Weir duringAquifer Performance Test 1 ..........................................................................27
Figure 12. Semi-Log Plot of Recovery Data from I75-MZ 1 during AquiferPerformance Test 1 .......................................................................................27
Figure 13. Time Series Plot of Water Levels Responses for I75-MZ 2 and I75-MZ 3during the Recovery Phase of Aquifer Performance Test 1 ..........................28
Figure 14. Log-Log Plot of Drawdown versus Time for Monitor Well I75-MZ 1during Aquifer Performance Test 1 ...............................................................29
Figure 15. Well Configuration for Aquifer Performance Test 2. ...................................30
Figure 16. Semi-Log Plot of Drawdown Data from Aquifer Performance Test 2 forI75-MZ 2 .......................................................................................................31
Figure 17. Pumping Phase Responses for I75-MZ 1 and I75-MZ 3 during AquiferPerformance Test 2........................................................................................32
Figure 18. Pumping Phase Manometer Readings for Discharge Orfice Weir duringAquifer Performance Test 2 ..........................................................................32
Figure 19. Semi-Log Plot of Recovery Data from I75-MZ 2 during AquiferPerfomance Test 2 at depths of 905 to 1,050 feet bls ...................................33
Figure 20. Time Series Plot of Water Levels Responses for I75-MZ 1 and I75-MZ 3during the Recovery Phase of Aquifer Performance Test 2 ..........................33
ix

List of Figures Hydrogeologic Investigation - I-75 Canal Site
Figure 21. Log-Log Plot of Drawdown versus Time for Monitor Well I75-MZ 2during Aquifer Performance Test 2 ...............................................................34
Figure 22. Long-Term Hydrograph of I75-MZ 1 and I75-MZ 2....................................36
Figure 23. Long-Term Hydrograph of I75-MZ 3 ...........................................................37
Figure 24. Hydrostratigraphic Column...........................................................................38
Figure 25. Calculated Formation Water Total Dissolved Solid Concentrations forI75-TW at Depths of 900 to 2,350 feet bls ...................................................43
Figure A-1. Log Traces from I75-TW Geophysical Log Run 1 .................................... A-4
Figure A-2. Log Traces from I75-TW Geophysical Log Run 2 .................................... A-5
Figure A-3. Log Traces from I75-TW Geophysical Log Run 3 .................................... A-6
Figure C-1. Core Slabs from Depths of 910 to 930 bls for I75-PW ...............................C-5
Figure C-2. Core Slabs from Depths of 945 to 930 bls for I75-PW ...............................C-6
Figure C-3. Core Slabs from Depths of 955 to 1,023.5 bls for I75-PW .........................C-7
Figure D-1. Photomicrograph for Well I75-PW at a Depth of 910.5 feet bls................ D-3
Figure D-2. Photomicrograph for Well I75-PW at a Depth of 947.2 feet bls................ D-4
Figure D-3. Photomicrograph for Well I75-PW at a Depth of 947.3 feet bls................ D-5
Figure D-4. Photmicrograph for Well I75-PW at a Depth of 950 feet bls..................... D-6
Figure D-5. Photomicrograph for Well I75-PW at a Depth of 951.4 feet bls................ D-7
Figure D-6. Photomicrograph for Well I75-PW at a Depth of 952.2 feet bls................ D-8
Figure D-7. Photomicrograph for Well I75-PW at a Depth of 1,020.3 feet bls............. D-9
Figure D-8. Photmicrograph for Well I75-PW at a Depth of 1,021 feet bls................ D-10
x

Hydrogeologic Investigation - I-75 Canal Site Introduction
INTRODUCTION
Background
The Lower West Coast Planning Area includes Collier and Lee counties andportions of Hendry, Charlotte, and Glades counties in South Florida. A combination ofnatural drainage basins and political boundaries defines the extent of this planning area.Water supply plans developed for the Lower West Coast Planning Area have identified theFloridan Aquifer System (FAS) as a possible water supply alternative. Based on theseplans, the South Florida Water Management District (SFWMD) initiated a program ofexploratory well construction, aquifer testing, and long-term monitoring (water qualityand potentiometric heads) to provide data needed to assess the FAS underlying this area.These wells will supply information needed to characterize the water supply potential ofthe FAS and support the development of a groundwater flow model that will be used tosupport future planning and regulatory decisions. The first FAS test site completed underthis program was located near the SFWMD’s G-150 water control structure on the L-2Canal in eastern Hendry County, Florida (Bennett, 2001). The second site, the focus ofthis report, is located in the Golden Gate Estates Area of western Collier County. Thesewells are located on Florida Department of Transportation property adjacent to the BigCypress Basin’s D2-7 water control structure on the I-75 Canal in the northwestern quarterof Section 29, Township 49 South, Range 26 East (Figure 1).
Figure 1. I-75 Canal Site Project Location Map and Site Plan
1

Exploratory Drilling and Well Construction Hydrogeologic Investigation - I-75 Canal Site
Purpose
The purpose of this report is to document the hydrogeologic data collected duringthe SFWMD-initiated Floridan aquifer well drilling, aquifer testing, and monitoringprogram at the I-75 Canal site. The information includes a summary of 1) well drilling andconstruction details, 2) hydrogeology, 3) water quality and productive capacity, 4) stableisotope and carbon 14 (14C) data, 5) petrophysical and petrologic data, 6) aquiferperformance test data and analyses, and 7) long-term potentiometric-head data.
Project Description
Two Floridan aquifer wells were constructed at the I-75 Canal site. The final depthof the test production well (I75-PW) is 1,050 feet below land surface (bls) with casing setat 890 feet in depth. A tri-zone FAS monitor well (I75-TW) is located 283 feet northwestof the test production well. It was completed in three distinct zones constructed to varyingdepths for aquifer testing and long-term monitoring of distinct hydrogeologic units. Theoriginal total depth of the monitor well was 2,694 feet bls.
The original drilling contractor, Youngquist Brothers, Inc. (YBI) for SFWMDContract C-4172, withdrew from the project on April 1, 1994. After YBI withdrew, RSTCompany was assigned the drilling, well construction, and testing services underAmendment 1 to the contract. A Notice to Proceed was issued on April 6, 1994, to RSTCompany. Construction of the Floridan aquifer monitor well at the I-75 Canal site beganon June 1, 1994.
EXPLORATORY DRILLING AND WELL CONSTRUCTION
I-75 Canal Tri-Zone Monitor Well
On June 1, 1994, drilling and support equipment was delivered to the I-75 Canaldrill site to begin drilling and construction of the FAS monitor well (I75-TW). Afterclearing and rough grading the site, the ground surface beneath the drill rig and settlingtanks was lined with a high-density polyethylene (HDPE) membrane. A 2-foot thicktemporary drilling pad was then constructed using crushed limestone. An earthen berm, 2-feet high, was constructed around the perimeter of the rig and settling tanks to containdrilling fluids and/or formation waters produced during well drilling, testing, andconstruction activities.
Mud rotary and reverse air techniques were used during drilling operations. Mudrotary drilling was used during the initial pilot hole drilling from land surface to 737 feetbls. The pilot hole from 737 to 2,694 feet bls was drilled using the reverse air, opencirculation method.
2

Hydrogeologic Investigation - I-75 Canal Site Exploratory Drilling and Well Construction
Data from formation samples (well cuttings), packer tests, and geophysical logswere used to determine the actual casing setting depths. The pilot hole was then reamed tospecified diameters for the selected casing setting. Three concentric steel casings (24-,18-, and 12-inch diameter) were used in the construction of the FAS tri-zone monitor well.Small diameter, fiberglass casings were used to construct the uppermost Floridan andlower Floridan aquifer monitor wells. A completion diagram of the I-75 Canal tri-zoneFAS monitor well, I75-TW, is shown in Figure 2.
Figure 2. Well Completion Diagram for the Tri-Zone Monitor Well, I75-TW
3

Exploratory Drilling and Well Construction Hydrogeologic Investigation - I-75 Canal Site
On June 28, 1994, drilling began by advancing a 30-inch diameter borehole to adepth of 35 feet bls. Nominal 24-inch diameter, steel pit casing was installed in thenominal 30-inch diameter borehole. The steel pit casing was American Society of TestingMaterials (ASTM) A53, Grade B, with 0.375-inch wall thickness. The annulus wasgrouted to land surface using 53 cubic feet (ft3) of ASTM Type II, neat cement (15.6pounds per gallon).
The pilot hole was drilled by the mud rotary method using a 77/8-inch diameterdrill bit to a depth of 230 feet bls. Using well cuttings, the base of the Surficial AquiferSystem (SAS) was identified at approximately 205 feet bls. The pilot hole was thenreamed to 210 feet bls using a nominal 24-inch diameter staged bit reamer. An 18-inchdiameter, steel surface pipe (ASTM A53, Grade B, 0.375-inch wall thickness) wasinstalled in the nominal 24-inch diameter reamed hole at a depth of 210 feet bls. Theannulus was grouted to land surface using 250 ft3 of ASTM Type II, neat cement. Thepurpose of the surface casing was to 1) prevent unconsolidated surface sediments fromcollapsing into the drilled hole, 2) isolate the surficial aquifer from brackish watercontamination, and 3) provide drill rig stability during continued drilling operations.
With the surface casing installed, the pilot hole was continued using the closedcirculation mud rotary drilling method through the unconsolidated to semiconsolidatedPliocene-Miocene age sediments. Large volumes of drilling fluids were lost downholewhile drilling through a high permeability dolostone unit encountered at a depth of 737feet bls. On August 24, 1994, mud rotary drilling operations ceased (based on cost andtime considerations). Drilling operations were continued using the reverse air opencirculation drilling method to a depth of 925 feet bls.
The Big Cypress Basin Board provided additional funding (Amendment 2 toContract C-4172) to perform geophysical logging, and conduct hydraulic and waterquality tests on the lower portion of the Intermediate Aquifer System (IAS) at this site.This information was to be used in conjunction with other site-specific aquifer storage andrecovery (ASR) assessments being conducted within the basin. Consequently, the nominal8-inch diameter pilot hole was reamed from the base of the 18-inch diameter surfacecasing at 210 to 492 feet bls. Nominal 12-inch diameter steel pipe was temporarilyinstalled at 490 feet bls to facilitate testing operations on the lower portion of the IAS. Thetemporary casing isolated the overlying unconsolidated to poorly consolidated silts andclays of the Peace River Formation of the Hawthorn Group from sloughing into theborehole during logging and testing operations.
A SFWMD-owned slim line geophysical unit was used to geophysically log theopen hole section from 490 to 925 feet bls on August 27, 1994. Geophysical logs includeda 3-arm caliper, natural gamma ray, spontaneous potential (SP), a 16/64-inch normalresistivity, and a 6-foot lateral resistivity. Production evaluation logs included a flowmeterrun under dynamic conditions (artesian flow), temperature, and fluid resistivity. Theindividual log traces from I75-TW Geophysical Log Run 1 are provided in Appendix A,Figure A-1.
4

Hydrogeologic Investigation - I-75 Canal Site Exploratory Drilling and Well Construction
Based on the lithologic and geophysical log data, two formation evaluation testswere conducted using downhole inflatable packers to assess the water quality andproduction capacity of two potential ASR horizons within the IAS - primarily the ArcadiaFormation of the Hawthorn Group. (Refer to the Packer Tests section of this report forfurther details and results of these two straddle-packer tests).
Upon completing the two straddle-packer tests, reverse air drilling operationsresumed on September 23, 1994. Drilling operations continued to a depth of 1,361 feetbls, through the upper Floridan aquifer brackish-saline water interface, which wasdetermined based on water quality results from reverse air returns. On September 28,1994, a second suite of geophysical logs, also conducted by the SFWMD, was run in theopen hole interval from 490 to 1,361 feet bls. The geophysical logging suite consisted of a3-arm caliper, natural gamma ray, SP, a 16/64-inch normal resistivity, and a 6-foot lateralresistivity. Production-type logs included a flowmeter (dynamic run), temperature, andfluid resistivity. The individual log traces from I75-TW Geophysical Log Run 2 arepresented in Appendix A, Figure A-2. A borehole video log was also conducted withinthis interval and is available for review at the SFWMD Headquarters in West Palm Beach,Florida.
The geophysical and lithologic data collected to this point were used to makedesign changes to the monitor well. To start, the temporary 12-inch diameter steel pipe(previously set at 490 feet bls) was removed. After reaming the borehole to a nominal18-inch diameter, the pipe was permanently installed at a depth of 905 feet bls. Based onfavorable water quality and productivity data, an interval from 690 to 760 feet bls wasidentified for further hydraulic testing and long-term monitoring. To isolate this zone, the12-inch diameter casing (set at 905 feet bls) was cement grouted to 760 feet bls. Then, acombination of 2-inch diameter reinforced fiberglass pipe and stainless steel well screen(slot size 20) was installed between the 18-inch diameter surface casing and the 12-inchdiameter intermediate casing. The gravel pack for the 2-inch stainless steel screenconsisted of 3/8-inch diameter crushed limestone that was tremied into place from 690 to760 feet bls. The remaining portion of the annulus was cement grouted from the top ofgravel pack (at 690 feet bls) to land surface, completing the uppermost FAS monitor well(690 to 760 feet bls). This FAS monitor interval is referred to as I75-MZ 1.
After completing the second phase of monitor well construction, reverse airdrilling operations resumed on November 19, 1994. Drilling continued through the poorlyto well indurated limestone and dolostone units of the Ocala Limestone and Avon ParkFormation to a depth of 2,694 feet bls. Once drilling operations were completed, the openhole section (905 to 2,694 feet bls) was reverse air developed, before conducting the thirdstage of geophysical logging operations.
On December 13, 1994, Florida Geophysical Logging Service ran the third suite oflogs in the open hole section of the well bore from 905 to 2,374 feet bls. This geophysicallogging suite consisted of the following logs: a 4-arm caliper, natural gamma ray, SP, dualinduction with a laterolog (LL3), compensated density-neutron, and a boreholecompensated (BHC) sonic log. Water production evaluation logs included a flowmeterconducted under static and dynamic conditions, a high-resolution temperature log, and a
5

Exploratory Drilling and Well Construction Hydrogeologic Investigation - I-75 Canal Site
borehole video log. The individual log traces from I75-TW Geophysical Run 3 arepresented in Appendix A, Figure A-3.
None of the geophysical probes were able to log the entire open hole section (905to 2,694 feet bls) of the pilot hole because of an obstruction near its base. Several attemptswere made to clear the obstruction by running drill pipe back to the bottom of the pilothole. Second and third geophysical logging trips met with decreasing success withblockages occurring higher in the borehole. A borehole video camera was used to identifythe obstruction and evaluate borehole stability. The borehole camera showed a highlyfracture dolostone unit from 2,340 to 2,374 feet bls. At a depth of 2,374 feet bls, a series oflarge dolostone boulders from the borehole wall fell into and obstructed the borehole.Based on the images provided by the borehole camera, a fourth attempt to clear theborehole was not made, limiting geophysical logging operations to the interval above2,374 feet bls.
Straddle-packer test intervals were selected using the information provided byanalysis of the geophysical logs and well cuttings. The first of five tests within the FASbegan on December 19, 1994. The purpose of these tests was to characterize the waterquality and production capacities of specific intervals within the larger open hole interval(905 to 2,374 feet bls). From a water resource perspective, intervals having TDSconcentrations greater than 10,000 milligrams per liter (mg/L) were not considered forfurther aquifer hydraulic characterization, since they are not considered potential sourcesof drinking water. An underground source of drinking water (USDW) is defined inChapter 62-520 of the Florida Administrative Code as an aquifer containing water with aTDS concentration of less than 10,000 mg/L.
A set of five packer tests within the FAS was completed on January 26, 1995. Thewater quality data obtained from the straddle-packer tests were used in tandem with thegeophysical logs to identify the base of the USDW at approximately 1,090 feet bls. Theproduction and water quality results for the various packer tests are presented in the nextsection.
On February 3, 1995, the final stage of well construction began by setting apermanent cement plug within the pilot hole at the top of the obstruction at 2,374 feet bls.Backplugging operations then continued to a depth 2,350 feet bls using hydrated Type IIPortland cement. Threaded 2-inch diameter, reinforced fiberglass plastic tubing (SmithFiberglass, Series 1500) was used to construct the lower Floridan monitor well. Thistubing, along with three steel cement baskets, were installed to a depth of 2,300 feet blsand cement grouted to 1,050 feet bls using multiple stages of neat cement (ASTM TypeII). The open hole interval for the lower FAS monitor well is 2,300 to 2,350 feet bls(I75-MZ 3). Cement grouting of the 2–inch diameter reinforced fiberglass plastic tubing to1,050 feet bls formed the base of the monitor interval for the second upper FAS monitorwell. The open hole interval for the second FAS monitor zone is 905 to 1,050 feet bls(I75-MZ 2).
Three, 2-inch diameter, stainless steel piezometers, equipped with 2-inch innerdiameter ball valves, were used to complete the wellhead for the tri-zone FAS monitor
6

Hydrogeologic Investigation - I-75 Canal Site Exploratory Drilling and Well Construction
well. The piezometers monitor water levels in three intervals of the telescoped nestedmonitor well. The uppermost monitor well, I75-MZ 1, is constructed using 2-inchdiameter fiberglass tubing and well screen installed between the 12- and 18-inch diameter,steel casings and monitors water levels between 690 to 760 feet bls. The intermediatewell, I75-MZ 2, monitors water levels within a 145-foot section of the upper FAS between905 to 1,050 feet bls. The lowermost well, I75-MZ 3, is constructed using 2-inch diameterthreaded reinforced fiberglass tubing and monitors water levels in the lower FAS between2,300 to 2,350 feet bls. Table 1 lists the monitor intervals and completion methods for thetri-zone FAS monitor well.
A 4-foot by 4-foot reinforced concrete pad was constructed at the surface of themonitor wellhead on April 20, 1995. This completed well construction operations in theTri-Zone FAS monitor well.
I-75 Dual-Zone Test Production Well
Drilling and support equipment for the test production well was mobilized to theI -75 Canal site on August 12, 1996. After clearing and rough grading the site, the groundsurface beneath the drill rig and settling tanks was lined with a HDPE membrane. A 2-footthick temporary drilling pad was then constructed using crushed limestone. An earthenberm, two feet in height, was also constructed. The berm surrounded the perimeter of therig and settling tanks and was used to contain drilling fluids and/or formation watersproduced during well drilling, testing, and well construction.
Construction of the dual-zone test production well began during the third week ofAugust 1996. This well was constructed to facilitate aquifer testing of two separateproductive horizons in the upper Floridan aquifer between 690 to 1,050 feet bls. Figure 3is a completion diagram of the I-75 Canal Floridan aquifer dual-zone test production wellidentified as I75-PW.
Four concentric steel casings (24-, 18-, 12-, and 8-inch diameter) were used in theconstruction of the dual-zone Floridan aquifer test production well. Steel pit casing, 24inches in diameter, was installed to 30 feet bls. Mud rotary drilling was used to advancethe 24-inch diameter borehole to the top of the first FAS production interval at 690 feetbls. A caliper log was run to evaluate borehole stability and to calculate cement volumesfor grouting operations. Eighteen-inch diameter steel pipe (ASTM A53, Grade B, and0.375-inch wall thickness) was installed in the nominal 24-inch diameter borehole. Once
Table 1. Tri-Zone FAS Monitor Well Intervals and Methods
IdentifierMonitor Interval
(feet bls)Completion
MethodI75-MZ 1 690 to 760 Well Screen
I75-MZ 2 905 to 1,050 Annular Zone
I75-MZ 3 2,300 to 2,350 Open Hole
7

Exploratory Drilling and Well Construction Hydrogeologic Investigation - I-75 Canal Site
installed, the 18-inch diameter casing was pressure grouted using 400 ft3 of ASTM Type IIneat cement. Additional stages of neat cement were placed using the tremie method witheach stage being hard tagged after allowing sufficient time for the cement to harden.Successive cement stages were used to complete the cement grouting of the 18-inchdiameter casing annulus back to land surface. Installation of the 18-inch diameter steelcasing was completed on October 25, 1996.
Figure 3. Well Completion Diagram for the Dual-Zone Test Production Well, I75-PW
8
Hydrogeologic Investigation - I-75 Canal Site Exploratory Drilling and Well Construction
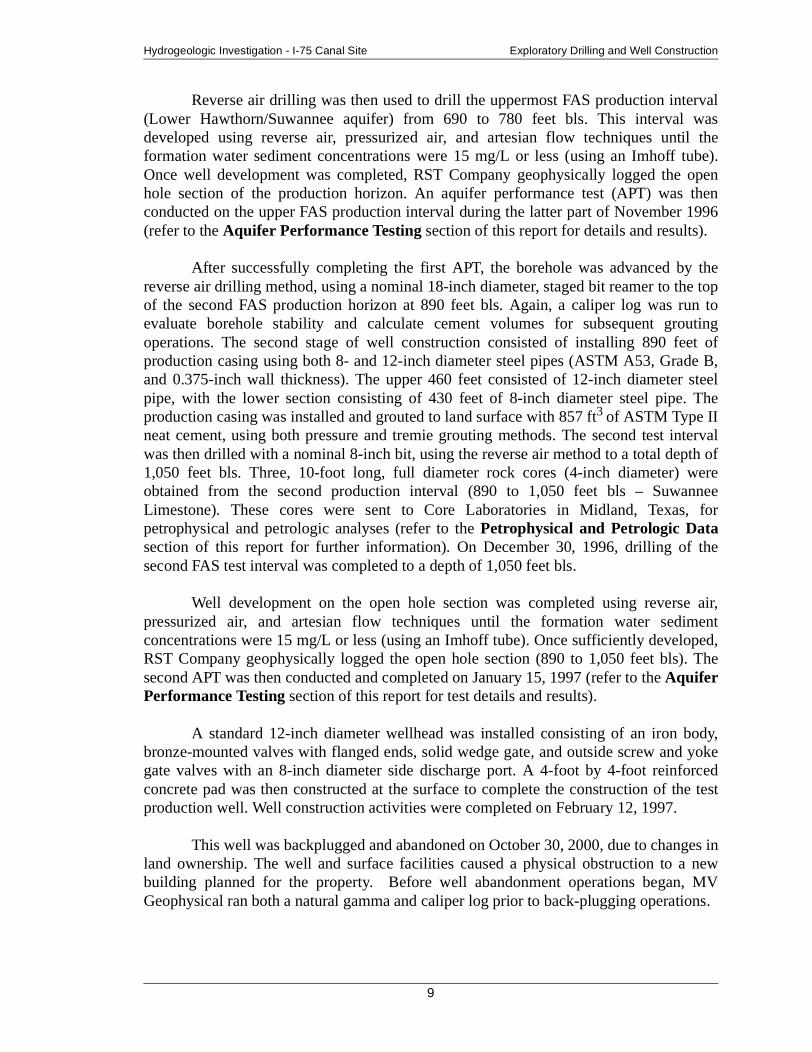
Reverse air drilling was then used to drill the uppermost FAS production interval(Lower Hawthorn/Suwannee aquifer) from 690 to 780 feet bls. This interval wasdeveloped using reverse air, pressurized air, and artesian flow techniques until theformation water sediment concentrations were 15 mg/L or less (using an Imhoff tube).Once well development was completed, RST Company geophysically logged the openhole section of the production horizon. An aquifer performance test (APT) was thenconducted on the upper FAS production interval during the latter part of November 1996(refer to the Aquifer Performance Testing section of this report for details and results).
After successfully completing the first APT, the borehole was advanced by thereverse air drilling method, using a nominal 18-inch diameter, staged bit reamer to the topof the second FAS production horizon at 890 feet bls. Again, a caliper log was run toevaluate borehole stability and calculate cement volumes for subsequent groutingoperations. The second stage of well construction consisted of installing 890 feet ofproduction casing using both 8- and 12-inch diameter steel pipes (ASTM A53, Grade B,and 0.375-inch wall thickness). The upper 460 feet consisted of 12-inch diameter steelpipe, with the lower section consisting of 430 feet of 8-inch diameter steel pipe. Theproduction casing was installed and grouted to land surface with 857 ft3 of ASTM Type IIneat cement, using both pressure and tremie grouting methods. The second test intervalwas then drilled with a nominal 8-inch bit, using the reverse air method to a total depth of1,050 feet bls. Three, 10-foot long, full diameter rock cores (4-inch diameter) wereobtained from the second production interval (890 to 1,050 feet bls – SuwanneeLimestone). These cores were sent to Core Laboratories in Midland, Texas, forpetrophysical and petrologic analyses (refer to the Petrophysical and Petrologic Datasection of this report for further information). On December 30, 1996, drilling of thesecond FAS test interval was completed to a depth of 1,050 feet bls.
Well development on the open hole section was completed using reverse air,pressurized air, and artesian flow techniques until the formation water sedimentconcentrations were 15 mg/L or less (using an Imhoff tube). Once sufficiently developed,RST Company geophysically logged the open hole section (890 to 1,050 feet bls). Thesecond APT was then conducted and completed on January 15, 1997 (refer to the AquiferPerformance Testing section of this report for test details and results).
A standard 12-inch diameter wellhead was installed consisting of an iron body,bronze-mounted valves with flanged ends, solid wedge gate, and outside screw and yokegate valves with an 8-inch diameter side discharge port. A 4-foot by 4-foot reinforcedconcrete pad was then constructed at the surface to complete the construction of the testproduction well. Well construction activities were completed on February 12, 1997.
This well was backplugged and abandoned on October 30, 2000, due to changes inland ownership. The well and surface facilities caused a physical obstruction to a newbuilding planned for the property. Before well abandonment operations began, MVGeophysical ran both a natural gamma and caliper log prior to back-plugging operations.
9

Hydrogeologic Testing Hydrogeologic Investigation - I-75 Canal Site
HYDROGEOLOGIC TESTING
Specific information was collected during the drilling program to determine thelithologic, hydraulic, and water quality characteristics of the FAS at this site. These datawere to be used to design both the Floridan aquifer monitor and test production wells forsite specific aquifer tests and a long-term water level and water quality monitoringprogram.
Formation Sampling
Geologic formation samples (well cuttings) were collected, washed, and described(using the Dunham, 1962, classification scheme) on site during the drilling of the pilothole for the tri-zone monitor well (I75-TW). Formation samples were collectedcontinuously and separated based on their dominant lithologic or textural characteristics,and to a lesser extent, color. If a massively bedded unit was encountered, compositesamples were taken at 5-foot intervals. The representative formation samples were splitinto two sets and distributed to the SFWMD and the Florida Geological Survey (FGS).
The lithostratigraphic column, shown in Figure 4, was constructed using both theSFWMD’s on-site drilling log and lithologic descriptions provided by the FGS. The FGS’sdetailed lithologic description for the pilot hole/monitor well (FGS Reference W-17405)is provided in Appendix B. Copies of the original on-site drillers log (lithologicdescription) are archived and available for review at the SFWMD’s headquarters in WestPalm Beach, Florida.
Formation Fluid Sampling
During reverse air drilling of the tri-zone monitor well (I75-TW), samples weretaken from circulated return fluids (composite formation water) at 30-foot intervals(average length of drill rod) from 1,209 feet bls to the total depth of the pilot hole at 2,694feet bls. Field parameters, including temperature, specific conductance, and pH weredetermined on each sample using a Hydrolab multiparameter probe. Chlorideconcentrations were also determined using a field titration method (Hach Kit). Figure 5shows the field chloride concentrations and the specific conductance values with respectto depth. As shown in this figure, between 1,209 to 1,267 feet bls, specific conductancevalues and chloride concentrations average 12,000 micromhos per centimeter (µmhos/cm)and 4,500 mg/L, respectively. Between 1,267 and 1,392 feet bls, specific conductance, andchloride concentrations increase to about 17,000 µmhos/cm and 7,000 mg/L, respectively.At 1,392 feet bls, conductance and chloride values show marked increases; brackish tosaline waters (chloride concentrations in excess of 10,000 mg/L) occur from this depth tothe total depth of the well at 2,694 feet bls.
10

Hydrogeologic Investigation - I-75 Canal Site Hydrogeologic Testing
Figure 4. Lithostratigraphic Column
11

Hydrogeologic Testing Hydrogeologic Investigation - I-75 Canal Site
Geophysical Logging
Geophysical logging was conducted in the pilot hole after each stage of drillingand before reaming of the borehole for casing installations. The resulting logs provide acontinuous record of the physical properties of the subsurface formations and theircontained fluids (Hallenburg, 1998). These logs were later used to assist in theinterpretation of lithology; provide estimates of permeability, porosity, bulk density, andresistivity of the aquifer; and determine the salinity profile of the groundwater (usingArchie’s equation, Archie, 1942). In addition, the extent of confinement of discreteintervals can be discerned from the individual logs. All geophysical log data weredownloaded directly from the on-site logging processor in log American Standard Codefor Information Interchange (ASCII) Version 1.2 or 2.0 format. The SFWMD and local
1,000
1,200
1,400
1,600
1,800
2,000
2,200
2,400
2,600
2,800
0 10,000 20,000 30,000 40,000 50,000
Dep
th(f
eetb
ls)
Conduct. umohs/cm
Chloride mg/LConductance µmhos/cmChloride mg/L
Figure 5. Water Quality Data from Reverse Air Returns for I75-TW
12

Hydrogeologic Investigation - I-75 Canal Site Hydrogeologic Testing
slim line logging firms provided supplemental geophysical logging services. Thegeophysical log traces from Log Runs 1, 2, and 3 for Well I75-TW are presented inAppendix A, Figures A-1, A-2, and A-3, respectively. The original geophysical logs andvideo surveys are archived and available for review at the SFWMD’s headquarters in WestPalm Beach, Florida.
A summary of the geophysical logging program conducted at this site is listed inTable 2. The neutron and density porosities for Geophysical Log Run 3 for Well I75-TWwere derived using a limestone matrix with a density of 2.71 grams per cubic centimeter(g/cm3).
Packer Tests
The first set of straddle-packer tests was limited to the open hole sectiontransecting the lower portion of the IAS. The second set of straddle-packer tests wasconducted within the FAS (1,158 to 2,251 feet bls). The purpose of these tests was to 1)gain water quality and production capacity data on discrete intervals (25 to 75 feet inlength) and 2) establish the depth of the 10,000 mg/L TDS interface.
The procedures listed below were used to conduct individual packer tests in WellI75-TW at the I-75 Canal site:
1. The packer assembly was lowered to the interval selected for testingbased on geophysical and lithologic logs.
2. The packers were set and inflated, and the ports opened between thepackers to the test interval.
3. A 4-inch diameter submersible pump was installed to depth of 60 to120 feet below the drill floor with a pumping capacity of 120 gallonsper minute (gpm).
Table 2. Summary of Geophysical Logging Operations for the I-75 Canal Site
DateRunNo.
LoggingCompany
Elevation(feet NGVD)
LoggedInterval
(feet bls) Cal
iper
Nat
ura
lGam
ma
Sp
on
tan
eou
sP
ote
ntia
l
Res
isti
vity
16"/
64”
6'L
ater
al
Ind
uct
ion
Den
sity
Neu
tro
n
So
nic
Flo
wm
eter
Tem
per
atu
re
Flu
idR
esis
tivi
ty
Vid
eo
I75-TW
08/27/94 1 SFWMD 9.87 490-925 x x x x x x x x
9/28/94 2 SFWMD 9.87 490-1361 x x x x x x x x
12/13/94 3 Florida Geophysical 9.87 905-2374 x x x x x x x x x x
I75-PW
11/22/96 RST Enterprises 10.5 5-780 x x x x x x
10/26/00 MV Geophysical 10.5 0-1050 x x
13

Hydrogeologic Testing Hydrogeologic Investigation - I-75 Canal Site
4. Two 100-pounds per square inch (psi) pressure transducers wereinstalled inside the drill pipe and one 30-psi transducer was installed inthe annulus.
5. A minimum of three drill-stem volumes were purged.
6. Pressure transducer readings and field water quality parameters (e.g.,temperature, specific conductance, and pH) from the purged formationwater were monitored until stable. These parameters were used todetermine the quality of isolation of the packed off interval.
7. Once the interval was effectively isolated, a constant rate drawdownand recovery test was performed.
8. Representative formation water samples were collected for laboratorywater quality analyses following the SFWMD’s quality assurance/quality control sampling protocol.
9. Recovery data was recorded until water levels returned to staticconditions.
Before groundwater sampling commenced, the packer intervals were purged untilthree drill-stem volumes were evacuated or until field parameters of samples collectedfrom the discharge pipe had stabilized. A limit of +5 percent variation in consecutive fieldparameter readings was used to determine chemical stability. In each sample, fieldparameters, including temperature, specific conductance, and pH were measured using aHydrolab multiparameter probe. Chloride concentrations were also determined using afield titration method (Hach Kit). The flow of water from the discharge point was adjustedto minimize the aeration and disturbance of the samples. Unfiltered and filtered sampleswere collected directly from the discharge point into a Teflon bailer. The bailer was thenplaced on a bailer stand where the sample bottles were filled slowly to minimize aeration.Duplicate samples were collected from consecutive bailers. Sample splits were collectedfrom the same bailer.
Once samples were collected, the bottles were preserved and immediately placedon ice in a closed container and transported to the SFWMD’s water quality laboratory. Thesamples were then analyzed for major cation and anions using United StatesEnvironmental Protection Agency and/or standard method procedures from SFWMD’sCompQAP (SFWMD, 1994).
The Hazen-Williams equation was used to calculate the friction (head) losses forall drawdown data because of induced flow up the drill pipe. These head losses were thenused to correct the drawdown data for specific capacity determinations. Curve matchingtechniques were not used to determine transmissivity values because the drawdown andrecovery data from the individual packer tests were lost during the downloading of theHermit 1000 data recorder as result of an internal memory error.
14

Hydrogeologic Investigation - I-75 Canal Site Hydrogeologic Testing
P
abc
)
1
8
Intermediate Aquifer System
Packer Test 1 (495 to 550 feet bls)
The purpose of Packer Test 1 was to obtain water samples for inorganic analysesand determine the interval’s production capacity. The main intent of this packer test was togather pertinent information to complement future ASR feasibility studies focusing on theIAS. This test was conducted on September 19, 1994, and consisted of pumping aninterval between 495 and 550 feet bls (part of the Arcadia Formation). This interval waspumped for two hours at an average discharge rate of 20 gpm. The maximum measureddrawdown while pumping was 59.40 feet (minimal friction loss), and the specific capacitywas calculated as 0.34 gpm per foot of drawdown (gpm/ft/dd). The static water level afterrecovery was measured as 31.64 feet above the National Geodetic Vertical Datum of 1929(feet NGVD) and was density corrected to 32.77 feet NGVD. The land surface at the sitewas surveyed at 10.25 feet NGVD. Water quality results indicated that the producedformation water had 3,640 mg/L of TDS, exceeding the potable drinking water standard of500 mg/L TDS. The results of the complete anion/cation analyses are listed in Table 3.
Packer Test 2 (654 to 710 feet bls)
The purpose of Packer Test 2 was to gather hydraulic and water quality data fromthe lowermost section of the IAS. The main intent of this packer test was also to gatherpertinent information to complement future regional ASR feasibility studies in the IAS.This test, conducted on September 20, 1994, consisted of pumping an interval between654 and 710 feet bls (lower portion of the Arcadia Formation). This interval was pumpedfor one hour at an average discharge rate of 94 gpm. The maximum measured drawdownwhile pumping was 62.60 feet with a friction loss of 3.64 feet. Using a correcteddrawdown of 58.96 feet, the specific capacity was calculated as 1.59 gpm/ft/dd. The staticwater level was measured at 32.41 feet NGVD (density corrected to 34.01 feet NGVD).Water quality results indicated that the produced formation water also exceeded thepotable drinking water standard of 500 mg/L TDS with a measured concentration of 3,890mg/L. The results of the complete anion/cation analyses are also listed in Table 3.
Table 3. Summary of Packer Test Results for the IAS for I75-TW
ackerTest
SampleDate
DepthInterval
(feetbls)
SpecificCapacity(gpm/ft/
dd)
MeasuredStaticHead(feet
NGVD)
Cations (mg/L)a
. Na = sodium; K = potassium; Ca = calcium, Mg = magnesium
Anions (mg/L)b
. Cl = chloride; CaCo3 = calcium carbonate; SO4 = sulfate
TDS
Field Parametersc
. Spec Cond = specific conductance; Temp (oC) = temperature (degrees Celsius); s.u. = standard units
Na+ K+ Ca2+ Mg2+ Cl-
Alkalinityas
CaCO3 SO42-
SpecCond
(µmhos/cm)
Temp(oC)
pH(s.u.
1 09/19/94 495-550 0.34 31.64 1,035 40 140 170 1,630 195 532 3,640 6,230 28.62 7.0
2 09/20/94 654-710 1.59 32.41 1,092 41 190 171 1,754 160 558 3,890 7,150 28.29 7.1
15

Hydrogeologic Testing Hydrogeologic Investigation - I-75 Canal Site
Floridan Aquifer System
Packer Test 1 (2,195 to 2,251 feet bls)
The purpose of Packer Test 1 was to measure the potentiometric head and obtain awater quality sample for inorganic and stable isotope analysis from the lower Floridanaquifer. An interval between 2,195 and 2,251 feet bls was selected, and a drawdown/recovery test was conducted on December 19, 1994. This interval was pumped for 1.7hours at an average rate of 100 gpm. Maximum drawdown measured while pumping was24.52 feet. The specific capacity was calculated as 9.38 gpm/ft/dd using a drawdowncorrected for friction loss of 10.66 feet. The static water level was measured at 9.81 feetNGVD, which was density corrected to a freshwater equivalent head of 68.83 feet NGVD.Chloride and TDS concentrations from samples collected from the zone were 19,262 and34,600 mg/L, respectively. The complete results of the anion/cation analyses are reportedin Table 4.
Packer Test 2 (1,851 to 1,901 feet bls)
Packer Test 2 was conducted to determine the hydraulic properties and waterquality characteristics of a productive interval within the middle Floridan aquifer. Thedual packers isolated an interval between 1,851 and 1,901 feet bls. A drawdown test wasconducted on December 20, 1994, by pumping this interval for 100 minutes at an averagerate of 102 gpm. The maximum drawdown was 19.21 feet and the specific capacity wascalculated as 13.49 gpm/ft/dd, correcting for friction loss of 11.65 feet. The static waterlevel was measured at 10.46 feet NGVD, which was density corrected to a freshwaterequivalent head of 60.28 feet NGVD. Chloride and TDS concentrations from the zonewere comparable to seawater with values of 19,281 and 34,900 mg/L, respectively. Thecomplete results of the anion/cation analyses are reported in Table 4.
Packer Test 3 (1,469 to 1,524 feet bls)
The purpose of Packer Test 3 was to evaluate the hydraulic and water qualitycharacteristics of a flow zone (based on lithologic and geophysical log data) in the middleFAS confining unit. The dual packer configuration isolated an interval between 1,469 and1,524 feet bls. A drawdown test was conducted on December 21, 1994, by pumping thisinterval for 62 minutes at an average rate of 102 gpm. The maximum measured drawdownwas 16 feet, with a corrected drawdown for friction loss of 6.74 feet. The specific capacitywas calculated as 15.13 gpm/ft/dd. The static water level was measured at 10.51 feetNGVD, which was density corrected to 49.54 feet NGVD. Chloride and TDSconcentrations from samples collected from the zone were 19,037 and 35,100 mg/L,respectively. The complete results of the anion/cation analyses are reported in Table 4.
16

Hydrogeologic Investigation - I-75 Canal Site Hydrogeologic Testing
PaT .)
1
1
4
9
1
Packer Test 4 (1,158 to 1,185 feet bls)
Packer Test 4 was conducted to help approximate the base of the USDW at thissite. The dual packer configuration isolated an interval within the brackish water zone ofthe upper Floridan between 1,158 and 1,185 feet bls. A drawdown test was conducted onDecember 30, 1994, by pumping this interval for 76 minutes. The average pumping rateduring the test was 67 gpm, with a maximum recorded drawdown of 62.26 feet. Thedrawdown was corrected for friction loss and the specific capacity was calculated as 1.45gpm/ft/dd. The static water level was measured at 16.26 feet NGVD, which was densitycorrected to 32.67 feet NGVD. Water quality results from this zone yielded chloride andTDS concentrations of 10,151 and 17,600 mg/L, respectively. The results of the completeanion/cation analyses are reported in Table 4.
Packer Test 5 (1,287 to 1,318 feet bls)
The purpose of Packer Test 5 was to evaluate the hydraulic and water qualitycharacteristics of a proposed long-term monitor interval in the middle FAS confining unitat this site. However, a permanent, long-term monitor zone was never established due towell construction problems. The dual packer setup isolated an interval between 1,287 and1,318 feet bls. A drawdown test was conducted on January 25, 1995, by pumping thisinterval for 63 minutes. The average pumping rate during the test was 48 gpm with amaximum recorded drawdown of 41.74 feet. The drawdown was corrected for frictionloss, and the specific capacity was calculated as 1.21 gpm/ft. The static water level wasmeasured at 14.55 feet NGVD (density corrected to 40.29 feet NGVD). Water qualityresults from this zone yielded chloride and TDS concentrations of 14,330 and27,300 mg/L, respectively. The results of the complete anion/cation analyses are reportedin Table 4.
Table 4. Summary of Packer Test Results for the FAS for I75-TW
ckerest
DepthInterval
(feetbls)
SpecificCapacity(gpm/ft/
dd)
MeasuredStaticHead(feet
NGVD)Sample
Date
Cations (mg/L) Anions (mg/L)
TDS
Field Parameters
Na+ K+ Ca2+ Mg2+ Cl-Alkalinityas CaCO3 SO4
2-
SpecCond
(µmhos/cm)
Temp(oC)
pH(s.u
1 2,195-2,251
9.38 9.81 12/19/94 11,520 428 620 1,354 19,262 108 2,511 34,600 46,610 29.56 6.9
2 1,851-1,901
13.49 10.46 12/20/94 11,260 418 600 1,334 19,281 108 2,136 34,900 45,080 30.16 6.8
3 1,469-1,524
15.13 10.51 12/21/94 11,460 432 620 1,368 19,037 110 2,259 35,100 45,050 30.00 6.8
4 1,158-1,185
1.45 16.26 12/30/94 6,050 200 400 638 10,151 165 1,336 17,600 25,390 29.67 6.8
5 1,287-1,318
1.21 14.55 01/25/95 9,780 321 491 994 14,330 154 1,745 27,300 35,650 29.42 6.9
17

Hydrogeologic Testing Hydrogeologic Investigation - I-75 Canal Site
Stable Isotope and Carbon 14 Data
The acquisition of isotopic data can complement inorganic geochemistry andphysical hydrogeology investigations. Therefore, water samples were also collectedduring packer tests and monitor well development and sent to the University of Waterloofor stable isotope determination. The analytical services included the determination of thestable isotope compositions for the following parameters: oxygen 18 (18O), hydrogen (2H)or deuterium (D), carbon 13 (13C), and sulfur 34 (34S). The 18O values were determinedby carbon dioxide (CO2) equilibration using standard procedures outlined by Epstein andMayeda (1953) and Drimmie (1993). The D compositions were determined using themethods of Coleman et al. (1982) and Drimmie et al. (1991). The 13C values wereperformed on CO2 produced from dissolved inorganic carbon treated with phosphoric acidusing methods described by Drimmie et al. (1990). An accelerator mass spectrometer atthe Rafter Radiocarbon Laboratory, located at the Institute of Geological and NuclearSciences in New Zealand, was used to determine radiocarbon age, delta 14C, and percentof modern carbon (pmC) using procedures outlined in Stuiver and Polach (1977).
The data collected at this site will be used in a regional investigation currentlybeing conducted by the author to better understand the groundwater circulation patterns(Kohout, 1965, 1967) and identify recharge and discharge areas within the FAS. If aninterval has a particular isotopic signature, it may help to identify and assist in themapping of ASR and reverse osmosis horizons within the upper Floridan aquifer. Carbon-14 dating of groundwater can be used to determine regional flow velocity estimates withinthe Floridan aquifer (Hanshaw et al., 1964).
The stable isotopic results from the I-75 Canal site (Table 5) show that the upperFloridan waters are depleted in both 18O and D, as compared to standard mean oceanwater (SMOW), δ18O = 0 per mil (0/00) and δD = 0 0/00. Figure 6 shows that the isotopiccomposition of the upper Floridan aquifer waters deviate slightly from the global meteoricwater line (GMWL) (Craig, 1961) and mean isotopic composition of recent Everglades
Table 5. Summary of Stable Isotope and Carbon 14 Analyses for the FAS
Identifiera
a. PT = Packer Test; MZ = Monitor Zone
Depth(feet bls)
SampleDate
δ18O0/00
SMOW
δ2H0/00
SMOW
δ37Cl0/00
SMOCb
b. SMOC = Standard Mean Ocean Chloride Standard
δ13C0/00
PDBc
c. PDB = Pee Dee Belemnitella Standard
δ34S0/00
CDTd
d. CDT = Canon Diablo Meteorite Standard
δ14C0/00
14C(pmc)
14C Age(yearBP)
I75-MZ 1 690-760 04/13/95 -1.05 -6.51 0.11 -3.97 23.08 -993.3 0.67 40,130
I75-MZ 2 905-1050 04/13/95 -1.05 -6.45 0.24 -2.64 21.99
I75-PT 4 1158-1185 12/30/94 0.57 2.61 0.19 -1.87 20.44
I75-PT 3 1469-1524 12/21/94 0.67 2.97 0.15 -1.42 20.81
I75-PT 2 1851-1901 12/20/94 0.54 4.28 -0.01 -1.59 20.86
I75-PT 1 2195-2251 12/19/94 0.60 2.46 0.19 -1.35 20.86
I-75-MZ 3 2300-2350 04/13/95 0.65 1.16 0.01 -1.78 21.11 -809.3 19.70 13,429
18

Hydrogeologic Investigation - I-75 Canal Site Hydrogeologic Testing
rainfall, which is δ18O=-2.20/00 and δD=-7.6 0/00 (Meyers et al., 1993). This may indicatethat climatic conditions and recharge of meteoric water into the upper Floridan aquiferwere slightly different than present. In addition, evaporation may have been minimalbefore meteoric recharge, which caused the upper Floridan aquifer waters to plot near theGMWL. The stable isotopic results from the I-75 Canal site show that the middle andlower Floridan aquifer waters are slightly enriched in both δ18O and δD, as compared toSMOW. The inorganic water quality results from intervals below 1,158 feet bls arebrackish to saline in composition and the δ18O and δD values are similar, plotting aboveSMOW (Figure 6). These results suggest that the middle and lower portions of theFloridan aquifer have been intruded by seawater.
The 14C activities or pmC values listed in this report are absolute percent ofmodern relative to the National Bureau of Standards oxalic acid (HOxI) standard correctedfor decay since 1950. The 14C activity of a groundwater sample from the upper Floridan(690 to 760 feet bls) produced a value of 0.67 pmC. The apparent radiocarbon age for thisinterval is approximately 40,130 years before present (BP). The apparent radiocarbon agewas not corrected for chemical or isotopic dilution methods and other factors (Tamers,1967; Mook, 1976). If the apparent radiocarbon age is considered an absolute age,assuming a closed system and little or no chemical or isotopic dilution, meteoric rechargeto the Floridan occurred during the late Pleistocene. However, this age may not beaccurate as the δ13C data suggest rock-water interactions. The 14C activities ofgroundwater samples from the lower Floridan aquifer (2,300 to 2,350 feet bls) intervalgenerated an average value of 19.7 pmC. The apparent radiocarbon age for this intervalwas approximately 13,400 years BP. The significant differences in the δ18O and δDvalues, 14C activities, and reported radiocarbon ages between the upper and lower
-20
-15
-10
-5
0
5
10
15
20
-3.0 -2.5 -2.0 -1.5 -1.0 -0.5 0.0 0.5 1.0 1.5 2.0
Oxygen 18 (0/00)
Deu
teri
um
(0 / 00)
I75 MZ#1
I75 MZ#2
I75 PT #4
I75 PT #3
I75 PT #2
I75 PT #1
I75 MZ#4
Everglades Rainfall(Meyers et al., 1993)
Global Meteoric Water Line(Craig, 1961)
Standard MeanOcean Water
I75 Monitor Zone 1
I75 Monitor Zone 2
I75 Packer Test 4
I75 Packer Test 3
I75 Packer Test 1
I75 Monitor Zone 3
Figure 6. Relationship between Stable Isotopes Deuterium and Oxygen 18
19

Hydrogeologic Testing Hydrogeologic Investigation - I-75 Canal Site
Floridan aquifers suggest two different water masses may be present. Similar variationswith depth have been reported from a FAS well constructed in western Broward County,Florida (Meyer, 1989). The upper Floridan waters may be a combination of meteoric andintruded seawater. The lower Floridan waters appear to be younger intruded seawater thatmay have entered somewhere along the Florida Straits. That water may have movedinland through the “Boulder Zone” or other highly permeability rock units of the lowerFloridan to its present position some 13,000 or less years BP. Unfortunately, 14C activitiesof groundwater samples were not determined between 780 and 2,300 feet bls and,therefore, the validity of Kohout’s (1965, 1967) cyclic flow theory could not bedetermined and the presence of an upward flow component from the lower Floridan wasnot discerned.
Petrophysical and Petrologic Data
During drilling of the test production well (I75-PW), conventional coring methodswere employed using a 4-inch diameter, 10-foot long, diamond-tipped core barrel. Threerock cores of various lengths were recovered from the Suwannee Limestone between 910to 1,030 feet bls, with core recoveries of 20 to 50 percent. The three vertically orientedcores were then sent to Core Laboratories, Midland, Texas, to determine the followingparameters: horizontal and vertical permeability, porosity, grain density, and lithologiccharacter.
Upon arrival at Core Laboratories, a core spectral gamma log was recorded on thecores for downhole correlation. Full diameter and plug samples (when core conditionsnecessitated) were then selected for further core analyses, and fluid removal was achievedby convection oven drying.
Full diameter porosity was determined by direct pore volume measurement usingBoyle’s law of helium expansion. Once the samples were cleaned and dried, bulk volumewas measured by Archimedes Principle. Grain density was calculated from the dryweight, bulk volume, and pore volume measurements using Equation 1 (AmericanPetroleum Institute, 1998). Porosity was calculated using bulk volume and grain volumemeasurements using Equation 2.
Grain Density = Dry Weight/(Bulk Volume - Pore Volume) (1)
Porosity = (Bulk Volume - Grain Volume)/Bulk Volume x 100 (2)
The 1-inch diameter plugs had direct grain volume measurements using Boyle’shelium expansion law. After cleaning, bulk volume was measured by ArchimedesPrinciple on the individual plug samples. The bulk volume and grain volumemeasurements were used in Equation 2 to calculate porosity. Two plug samples from acore obtained from 910 to 911 feet bls were selected for stress pore volume measurements,at 400-psi net confining pressure, to determine net overburden effects on porosity. Thestress pore volume data indicate minimal-to-no pore volume reductions (Table 6).
20

Hydrogeologic Investigation - I-75 Canal Site Hydrogeologic Testing
Steady state air permeability was measured on full diameter samples in twohorizontal directions and vertically while the core was confined in a Hassler rubber sleeveat 400-psi net confining stress. Permeability for plug samples was measured in thehorizontal direction and confined at 400-psi net stress.
The cores were double slabbed and boxed after analysis, and photographed undernatural and ultraviolet light. Negatives of the slabbed cores were scanned and stored on acompact disc and reproduced in Appendix C. The results of the petrophysical analyses arelisted in Table 7.
Horizontal to vertical permeability and horizontal permeability (K90/Kmax)anisotropy ratios were not calculated due to the limited number of values. A semi-logcross-plot of laboratory determined horizontal permeability versus (helium) porosity for910.8 and 1,020.5 feet bls is shown in Figure 7. The widely scattered data points suggestno linear relationship between horizontal permeability and porosity.
Table 6. Summary of Net Overburden Pressure Effects on Porosity
Sample
Depth(feetbls) Data Source
HorizontalPermeability(millidarcies)
PorosityHelium
(percent)
GrainDensity(g/cm3) Description
1 910.8 Original ambient porosity 33.5 2.69 Limestone, vuggy fossils
1 910.8 Second ambient porosity 33.7 2.69
1 910.8 400-psi net overburden porosity 3.24 33.8 2.69
2 911.3 Original ambient porosity 39.7 2.70 Limestone, vuggy fossils
2 911.3 Second ambient porosity 39.7 2.70
2 911.3 400-psi net overburden porosity 380 39.7 2.70
1
10
100
1,000
10,000
0 10 20 30 40 50
Helium Porosity (percent)
Ho
rizo
nta
lPer
mea
bili
ty(m
illid
arci
es)
Figure 7. Cross-Plot of Permeability versus Porosity for I75-PW at 910.8 and 1,020.5 feet bls
21
Hydrogeologic Testing Hydrogeologic Investigation - I-75 Canal Site
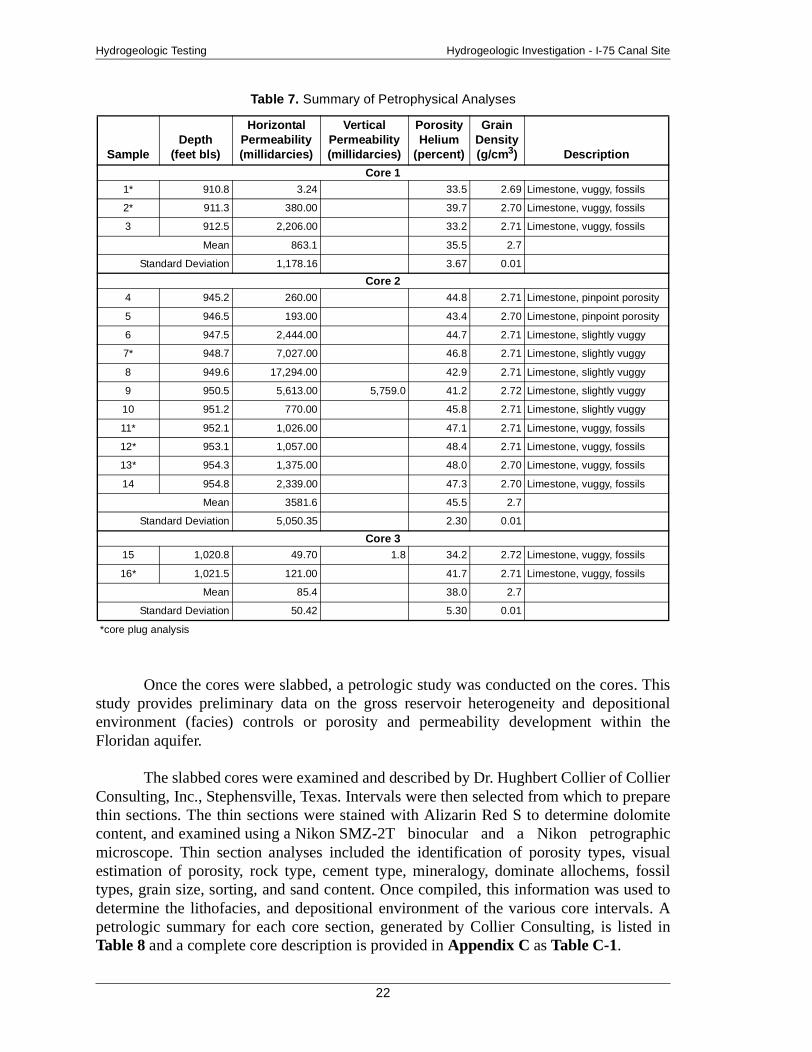
Once the cores were slabbed, a petrologic study was conducted on the cores. Thisstudy provides preliminary data on the gross reservoir heterogeneity and depositionalenvironment (facies) controls or porosity and permeability development within theFloridan aquifer.
The slabbed cores were examined and described by Dr. Hughbert Collier of CollierConsulting, Inc., Stephensville, Texas. Intervals were then selected from which to preparethin sections. The thin sections were stained with Alizarin Red S to determine dolomitecontent, and examined using a Nikon SMZ-2T binocular and a Nikon petrographicmicroscope. Thin section analyses included the identification of porosity types, visualestimation of porosity, rock type, cement type, mineralogy, dominate allochems, fossiltypes, grain size, sorting, and sand content. Once compiled, this information was used todetermine the lithofacies, and depositional environment of the various core intervals. Apetrologic summary for each core section, generated by Collier Consulting, is listed inTable 8 and a complete core description is provided in Appendix C as Table C-1.
Table 7. Summary of Petrophysical Analyses
SampleDepth
(feet bls)
HorizontalPermeability(millidarcies)
VerticalPermeability(millidarcies)
PorosityHelium
(percent)
GrainDensity(g/cm3) Description
Core 11* 910.8 3.24 33.5 2.69 Limestone, vuggy, fossils
2* 911.3 380.00 39.7 2.70 Limestone, vuggy, fossils
3 912.5 2,206.00 33.2 2.71 Limestone, vuggy, fossils
Mean 863.1 35.5 2.7
Standard Deviation 1,178.16 3.67 0.01
Core 24 945.2 260.00 44.8 2.71 Limestone, pinpoint porosity
5 946.5 193.00 43.4 2.70 Limestone, pinpoint porosity
6 947.5 2,444.00 44.7 2.71 Limestone, slightly vuggy
7* 948.7 7,027.00 46.8 2.71 Limestone, slightly vuggy
8 949.6 17,294.00 42.9 2.71 Limestone, slightly vuggy
9 950.5 5,613.00 5,759.0 41.2 2.72 Limestone, slightly vuggy
10 951.2 770.00 45.8 2.71 Limestone, slightly vuggy
11* 952.1 1,026.00 47.1 2.71 Limestone, vuggy, fossils
12* 953.1 1,057.00 48.4 2.71 Limestone, vuggy, fossils
13* 954.3 1,375.00 48.0 2.70 Limestone, vuggy, fossils
14 954.8 2,339.00 47.3 2.70 Limestone, vuggy, fossils
Mean 3581.6 45.5 2.7
Standard Deviation 5,050.35 2.30 0.01
Core 315 1,020.8 49.70 1.8 34.2 2.72 Limestone, vuggy, fossils
16* 1,021.5 121.00 41.7 2.71 Limestone, vuggy, fossils
Mean 85.4 38.0 2.7
Standard Deviation 50.42 5.30 0.01
*core plug analysis
22

Hydrogeologic Investigation - I-75 Canal Site Hydrogeologic Testing
Table 8. Summary of Petrologic Analyses
Sample
Depth(feetbls) Lithofacies
DepositionalEnvironment
HorizontalPermeability(millidarcies)
VerticalPermeability(millidarcies)
PorosityHelium
(percent)
GrainDensity(g/cm3)
Core 11H 910.8 Foram-peloidal
packstoneOpen Lagoon Shoal 3 33.5 2.69
2H 911.3 Foram-peloidalpackstone
Open Lagoon Shoal 380 39.7 2.70
3H 912.5 Pelecypod coquina Shoal 2,206 33.2 2.71
Mean 863 35.5 2.70
Median 380 33.5 2.70
Core 24H 945.2 Ostracod-foram-peloidal
packstoneOpen Lagoon Shoal 260 44.8 2.71
5H 946.5 Ostracod-foram-peloidalpackstone
Open Lagoon Shoal 193 43.4 2.70
6H 947.5 Intraalgal-foram-peloidpackstone
Restrict. Lagoon Shoal 2,444 44.7 2.71
7H 948.7 Intraalgal-foram-peloidpackstone
Open Lagoon Shoal 7,027 46.8 2.71
8H 949.6 Intraalgal-foram-peloidpackstone
Open Lagoon Shoal 17,294 42.9 2.71
9H 950.5 Intraalgal-foram-peloidpackstone
Open Lagoon Shoal 5,613 5,759.0 41.2 2.72
10H 951.2 Foram-pellet packstone Open Lagoon Shoal 770 45.8 2.71
Mean 4,800 44.2 2.71
Median 2,444 44.7 2.71
Core 311H 952.1 Bryzoan-pelecypod
wackestone packstoneBryzoan Mound 1,026 47.1 2.71
12H 953.1 Bryzoan-pelecypodwackestone packstone
Bryzoan Mound 1,057 48.4 2.71
13H 954.3 Bryzoan-pelecypodwackestone packstone
Bryzoan Mound 1,375 48.0 2.70
14H 954.8 Bryzoan-pelecypodwackestone packstone
Bryzoan Mound 2,339 47.3 2.70
Mean 1,449 47.7 2.71
Median 1,216 47.7 2.71
Core 415H 1020.8 Peloidal skeletal
packstoneMound Flank 50 1.8 34.2 2.72
16H 1021.5 Peloidal skeletalpackstone
Mound Flank 121 41.7 2.71
Mean 85 38.0 2.72
Median 85 38.0 2.72
23

Aquifer Performance Testing Hydrogeologic Investigation - I-75 Canal Site
Individual photomicrographs of selected cores are provided in Appendix D. Thepetrologic analysis, combined with the petrophysical data, indicate variations in horizontalpermeability and porosity, based on lithofacies and corresponding depositionalenvironment. The highest mean horizontal permeability (4,800 millidarcies) correspondsto a cored section at approximately 950 feet bls consisting of intraalgal, foraminiferal,peloidal packstone likely deposited in an open lagoonal shoal environment. Petrologicanalyses of a Floridan well in eastern Hendry County (L2-TW) had similar results with thehighest mean horizontal permeability occurring in a foraminiferal-peloidal packstonethought to be deposited in an open lagoonal shoal environment (Bennett, 2001).
AQUIFER PERFORMANCE TESTING
Aquifer Performance Test 1 (690 to 780 feet bls)
The first of two aquifer performance tests (APTs) was conducted to determine thehydraulic performance of a section (690 to 780 feet bls) of the upper Floridan aquifer(Lower Hawthorn/Suwannee) at the I-75 Canal site. The principle factors of aquiferperformance, such as transmissivity and storage coefficients, can be calculated from thedrawdown and/or recovery data obtained from the proximal monitor well completed in thesame interval. If the aquifer tested is semiconfined, the hydraulic parameter of leakance ofthe semipervious layer(s) can also be determined.
A 55.25-hour constant rate discharge (1,472 gpm) test was conducted on aninterval from 690 to 780 feet bls. Figure 8 shows the well configuration of the tri-zonemonitor well (I75-TW) and test production well (I75-PW) used in the APT. The 55.25-hour drawdown phase was followed by a 41.5-hour recovery period, where water levelswere allowed to return to background condition.
A 10-inch diameter submersible pump was installed in the test production well onNovember 23, 1996, with the pumping bowl set at 120 feet bls. This depth was chosenbased on preliminary data, indicating moderate drawdowns would occur. The wellheadwas reinstalled with appurtenances consisting of a shutoff valve, discharge pressuregauge, and wellhead pressure gauge. A 12-inch diameter PVC discharge line wasconnected to the wellhead. A 12-inch diameter circular orifice weir with an 8-inchdiameter orifice plate was used to measure discharge rates during pumping, verified by anin-line flowmeter. A pressure transducer was installed on the orifice weir to recorddischarge rates during the pump test at 5-minute intervals. Additional pressure transducerswere installed on/in both the test production and monitor wells and connected to a Hermit2000 (Insitu, Inc.), data logger with electronic cables. The transducers and data loggerwere used to measure and record water level changes at predetermined intervals duringtesting operations.
On November 24, 1996, a specific-capacity test was conducted to determine themost efficient pump rate for the planned 60-hour drawdown test. A specific capacity of16.72 gpm/ft/dd at 1,472 gpm was calculated for the test production well. Oncecompleted, water levels were allowed to recover to static condition. The next morning,
24

Hydrogeologic Investigation - I-75 Canal Site Aquifer Performance Testing
November 25, 1996, the drawdown phase of the APT started by initiating pumping of thetest production well (I75-PW), located 283 feet south of the monitor well (I75-TW), at1,472 gpm. During the drawdown phase, water levels and pump rates were continuouslymeasured and recorded by the installed electronic instruments. Pumping continueduninterrupted for the next 55.25 hours, completing the drawdown phase on November 27,1996. A semi-log plot of the drawdown data for pumped monitor well (I75-MZ 1) isshown in Figure 9. Time series plots of water level fluctuations during the drawdownphase of the APT for the lower monitor zones, I75-MZ 2 and I75-MZ 3 are included inFigure 10.
Discharge data from the 12-inch diameter, circular orifice weir acquired during thepumping phase of the APT are shown in Figure 11. Minor fluctuations in pump ratesoccurred during the course of the APT, but were not substantial enough (less than +1percent) to effect the overall test results.
In addition, water samples were taken from the test production well I75-PW,during the drawdown phase. The field parameters measured include temperature, pH,specific conductance, and chlorides. These parameters fluctuated less than 3 percent withno discernible trend during the course of the test. Specific conductance values andchloride concentrations ranged from 6,339 to 6,490 µmhos/cm and 1,818 to 1,884 mg/L,respectively.
Figure 8. Well Configuration during Aquifer Performance Test 1
25

Aquifer Performance Testing Hydrogeologic Investigation - I-75 Canal Site
0
2
4
6
8
10
12
0 0 1 10 100 1,000 10,000
Time Since Pumping Started (minutes)
Dra
wd
ow
n(f
eet)
Figure 9. Semi-Log Plot of Drawdown Data from I75-MZ 1 during Aquifer Performance Test 1
-1.4
-1.2
-1
-0.8
-0.6
-0.4
-0.2
0
0.2
0.4
0 500 1,000 1,500 2,000 2,500 3,000 3,500 4,000
Time Since Pumping Started (minutes)
Wat
erL
evel
Ch
ang
e(f
eet) I75-MZ 2 (905-1,050 feet bls)
I75-MZ 3 (2,300-2,350 feet bls)
Figure 10. Time Series Plot of Water Levels from I75-MZ 2 and I75-MZ 3 during the PumpingPhase of Aquifer Performance Test 1
26

Hydrogeologic Investigation - I-75 Canal Site Aquifer Performance Testing
Before pumping stopped, the data loggers were reconfigured to record therecovery data. The pump was then manually stopped and water levels were allowed torecover to static condition. The recovery phase of the APT continued for 41.5 hours,ending on November 29, 1996. A semi-log plot of the recovery data for the pumpedmonitor zone (I75-MZ 1) is shown in Figure 12. A time series plot of the lower monitorintervals (I75-MZ 2 and I75-MZ 3) is shown in Figure 13. Electronic copies of theoriginal drawdown, recovery, and manometer data for APT 1 are archived and availablefor review at the SFWMD’s headquarters in West Palm Beach, Florida.
1.5
1.7
1.9
2.1
2.3
2.5
2.7
2.9
3.1
3.3
3.5
0 500 1,000 1,500 2,000 2,500 3,000 3,500
Time Since Pumping Started (minutes)
Man
om
eter
Rea
din
gs
(fee
t)
Figure 11. Pumping Phase Manometer Readings for Discharge Orfice Weir during AquiferPerformance Test 1 (average pump rate was 1,472 gpm)
0
2
4
6
8
10
12
0 0 1 10 100 1,000 10,000
Time Since Pumping Stopped (minutes)
Rec
ove
ry(f
eet)
Figure 12. Semi-Log Plot of Recovery Data from I75-MZ 1 during Aquifer Performance Test 1
27

Aquifer Performance Testing Hydrogeologic Investigation - I-75 Canal Site
A log-log plot of drawdown versus time is shown in Figure 14. The shape of thedrawdown curve is indicative of a leaky-type aquifer, defined as an aquifer that loses orgains water (depending on the pressure gradients) through an adjacent semiconfining unit(aquitard). The relatively flat portion of the drawdown curve indicates steady stateconditions, whereby a linear gradient is established across the aquitard, and the pumpedwater is derived from the unpumped aquifer. The overlying and underlying semiconfiningunits are composed of porous (25 to 45 percent porosity) mudstones to wackestones thathave the potential to transmit water through them and supply additional water releasedfrom storage to the pumping well. A proximal FAS monitor well completed above the testinterval of 690 to 780 feet bls was not available for monitoring during the APT to quantifythe relative contribution of the overlying semiconfining unit. However, the FAS monitorwell identified as I75-MZ 2 was completed below the test interval from 905 to 1,050 feetbls. During the pump phase of the APT, water levels in I75-MZ 2 declined a maximum of1.2 feet (Figure 10).
Based on the site-specific hydrogeology and well construction, three differentsemiconfined analytical models were applied to the drawdown data collected during theAPT to determine the hydraulic properties of the aquifer and aquitard(s). The analyticalmodels included those developed by Hantush-Jacob (1955), Hantush (1960), and Moench(1985). The results were obtained from each method and are based on variousassumptions. These assumptions are listed in Table 9. In general, drawdown data from asingle observation well only provides an estimate of aquifer and aquitard properties. Manyof the curves are similar in shape to one another and do not necessarily provide a uniquematch to a given data set.
Moench (1985) derived an analytical solution for predicting water leveldisplacements in response to pumping a large diameter well (well bore storage in a leaky
-0.6
-0.4
-0.2
0
0.2
0.4
0.6
0.8
1
1.2
0 500 1,000 1,500 2,000 2,500 3,000
Time Since Pumping Stopped (minutes)
Wat
erL
evel
Ch
ang
e(f
eet)
I75-MZ 2 (905-1,050 feet bls) I75-MZ 3 (2,300-2,350 feet bls)
Figure 13. Time Series Plot of Water Levels Responses for I75-MZ 2 and I75-MZ 3 during theRecovery Phase of Aquifer Performance Test 1
28

Hydrogeologic Investigation - I-75 Canal Site Aquifer Performance Testing
confined aquifer assuming storage in the aquitard(s) and well bore skin. Moench (1985)also builds on several previously establish analytical solutions, such as Hantush (1960),Papadopulos and Copper (1967), Agarwal et al. (1970), and Sandal et al. (1978). Based onthese considerations and the site specific hydrogeologic data collected during drilling andaquifer testing, the Moench analytical model appears to best represent the conditionspresent at this site. The results of this solution yielded a transmissivity value of 116,400gpd/ft, a storage coefficient of 1.664 x 10⁻⁵, and an r/B value of 0.04. The dimensionlessparameter r/B characterizes the leakage across the aquitard(s) to the pumped aquifer. Fromthis value, a leakance value of 2.33 x 10⁻³ gpd/ft3 was calculated (Walton, 1960).
Table 9. Summary of Leaky Analytical Model Results for Aquifer Performance Test 1.
Analytical MethodTransmissivity
(gpd/ft) Storativity r/Ba
a. r/B = Leakance Factor
βb
b. β = Aquitard Storage Factor
Hantush-Jacob, 1955 (Leaky) 72,200 1.9E-05 0.14 NA
Hantush, 1960 (Leaky) 118,800 1.4E-05 NAc
c. N/A = Not Applicable
0.03
Moench, 1985 (Leaky) 116,400 1.7E-05 0.04 0.02
Figure 14. Log-Log Plot of Drawdown versus Time for Monitor Well I75-MZ 1 duringAquifer Performance Test 1
29

Aquifer Performance Testing Hydrogeologic Investigation - I-75 Canal Site
Aquifer Performance Test 2 (890 to 1,050 feet bls)
The second APT was conducted to determine in situ hydraulic characteristics of asection from 890 to 1,050 feet bls in the upper Floridan aquifer (Suwannee Limestone). A72.9-hour constant rate discharge (743-gpm) test was conducted on an interval from 890to 1,050 feet bls. Figure 15 shows the well configuration of the tri-zone monitor well(I75-TW) and test production well (I75-PW) used in the APT. The 72.9-hour drawdownphase was followed by a 73.5-hour recovery period, where water levels were allowed toreturn to background condition.
A 10-inch diameter submersible pump was installed in the test production well onJanuary 20, 1997, with the pumping bowl set at 100 feet bls. This depth was chosen, basedon preliminary data, indicating moderate drawdowns would occur. The wellhead wasreinstalled with appurtenances consisting of a shutoff valve, discharge pressure gauge, andwellhead pressure gauge. A 12-inch diameter PVC discharge line was connected to thewellhead. A 12-inch diameter, circular orifice weir with a 6-inch diameter orifice platewas used to measure discharge rates during pumping, verified by an in-line flowmeter. Apressure transducer was installed on the orifice weir to record discharge rates during thepump test at 2-minute intervals. Additional pressure transducers were again installed on/inboth the test production and monitor wells and connected to a Hermit 2000 (Insitu, Inc.)data logger with electronic cables. The transducers and data logger were used to measureand record water level changes at predetermined intervals during testing operations.
Figure 15. Well Configuration for Aquifer Performance Test 2
30

Hydrogeologic Investigation - I-75 Canal Site Aquifer Performance Testing
On January 20, 1997, a specific capacity test was conducted to determine the mostefficient pump rate for the planned 72-hour drawdown test. Once completed, water levelswere allowed to recover to static condition. The next morning (January 21, 1997), thedrawdown phase of the APT started by initiating pumping of the test production well(I75-PW) at 743 gpm. During the drawdown phase, water levels and pump rates werecontinuously measured and recorded by the installed electronic instruments. Pumpingcontinued uninterrupted for the next 72.9 hours, completing the drawdown phase onJanuary 24, 1997. A semi-log plot of the drawdown data for the pumped monitor zoneI75-MZ 2 is shown in Figure 16. Time series plots of water level fluctuations during thedrawdown phase of the APT for the other two monitor zones I75-MZ 1 and I75-MZ 3 areincluded in Figure 17.
The discharge data from the 12-inch diameter, circular orifice weir acquiredduring the pumping phase of the APT are shown in Figure 18. Minor fluctuations in pumprates occurred during the course of the APT, but were not substantial enough (less than +1percent) to effect the overall test results.
Similar to the first APT, water samples were taken from the test production well,I75-PW, and field parameters including temperature, pH, specific conductance, andchlorides were measured. These parameters fluctuated less than 5 percent with nodiscernible trend during the withdrawal period. Specific conductance values and chlorideconcentrations ranged from 11,710 to 12,210 µmhos/cm and 3,910 to 4,190 mg/L,respectively.
0
4
8
12
0 1 10 100 1,000 10,000
Time Since Pumping Started (minutes)
Dra
wd
ow
n(f
eet)
Figure 16. Semi-Log Plot of Drawdown Data from Aquifer Performance Test 2 for I75-MZ 2
31

Aquifer Performance Testing Hydrogeologic Investigation - I-75 Canal Site
-0.8
-0.4
0
0.4
0.8
0 1,000 2,000 3,000 4,000 5,000
Time Since Pumping Started (minutes)
Wat
erL
evel
Ch
ang
e(f
eet) I75-MZ 1 (690-780 feet bls) I75-MZ 3 (2,300-2,350 feet bls)
Figure 17. Pumping Phase Responses for I75-MZ 1 and I75-MZ 3 during Aquifer PerformanceTest 2
1.5
1.7
1.9
2.1
2.3
2.5
2.7
2.9
3.1
3.3
3.5
0 500 1,000 1,500 2,000 2,500 3,000 3,500 4,000 4,500 5,000
Time Since Pumping Started (minutes)
Man
om
eter
Rea
din
gs
(fee
t)
Figure 18. Pumping Phase Manometer Readings for Discharge Orfice Weir during AquiferPerformance Test 2 (average pump rate 743 gpm)
32

Hydrogeologic Investigation - I-75 Canal Site Aquifer Performance Testing
Before pumping stopped, the data loggers were reconfigured to record therecovery data. The pump was then manually stopped and water levels were allowed torecover to static condition. The recovery phase of the APT continued for 73.5 hours,ending on January 27, 1997. A time series, semi-log plot of the recovery data for thepumped monitor zone (I75-MZ 2) is shown in Figure 19. A time series plot of waterlevels acquired during the recovery phase of the APT for the upper and lower monitorzones (I75-MZ 1 and I75-MZ 3) are shown in Figure 20. Electronic copies of the originaldrawdown, recovery, and manometer data for APT 2 are also archived and available forreview at the SFWMD’s headquarters in West Palm Beach, Florida.
0
4
8
12
0 1 10 100 1,000 10,000
Time Since Pumping Stopped (minutes)
Rec
ove
ry(f
eet)
Figure 19. Semi-Log Plot of Recovery Data from I75-MZ 2 during Aquifer Perfomance Test 2at depths of 905 to 1,050 feet bls
-0.5
0
0.5
1
0 1,000 2,000 3,000 4,000 5,000
Time Since Pumping Stopped (minutes)
Wat
erL
evel
Ch
ang
e(f
eet)
I75-MZ 1 (690-780 feet bls) I75-MZ 3 (2,300-2,350 feet bls)
Figure 20. Time Series Plot of Water Levels Responses for I75-MZ 1 and I75-MZ 3 during theRecovery Phase of Aquifer Performance Test 2
33

Aquifer Performance Testing Hydrogeologic Investigation - I-75 Canal Site
Again, three different “leaky” type analytical solutions were applied to thedrawdown data collected during the second APT to determine the aquifer and aquitard(s)hydraulic properties. The solutions used were Hantush-Jacob (1955), Hantush (1960), andMoench (1985). The results from each analytical method are listed in Table 10.
A log-log plot of drawdown versus time is shown in Figure 21. The shape of thedrawdown curve is indicative of a leaky-type aquifer where the late-time drawdownremains relatively flat similar to drawdowns from the first APT at this site. Thetelescoping-type FAS monitor well (I75-TW) had monitor intervals completed above andbelow the test interval (905 to 1,050 feet bls). Water levels were monitored during the APTto determine if there was any contribution from or through the overlying and underlyingsemiconfining units. During the APT, water levels in I75-MZ 1 (690 to 760 feet bls)
Table 10. Summary of Leaky Analytical Model Results for Aquifer Performance Test 2
Analytical MethodTransmissivity
(gpd/ft) Storativity r/B βα
a. β = aquitard storage factor
Hantush-Jacob, 1955 (Leaky) 54,280 2.800E-05 0.05 NAb
b. NA = not applicable
Hantush, 1960 (Leaky) 58,480 1.000E-05 NA 0.02
Moench, 1985 (Leaky) 52,500 2.300E-05 0.05 0.02
Figure 21. Log-Log Plot of Drawdown versus Time for Monitor Well I75-MZ 2 during AquiferPerformance Test 2
34
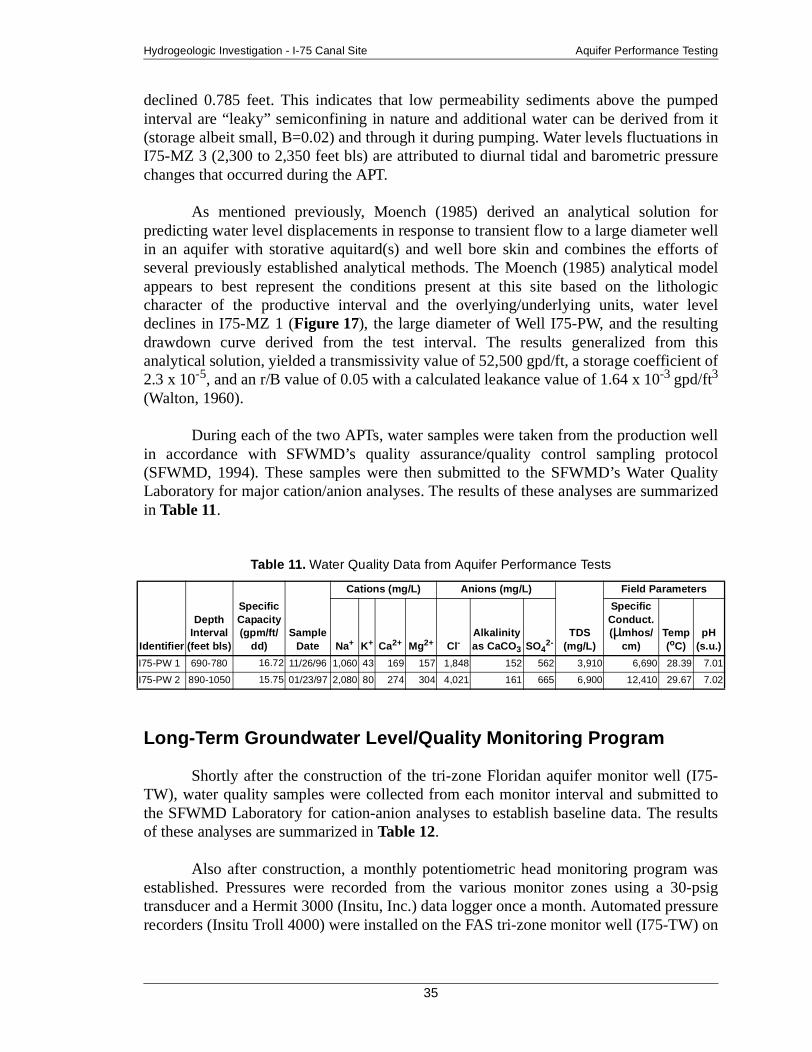
Hydrogeologic Investigation - I-75 Canal Site Aquifer Performance Testing
declined 0.785 feet. This indicates that low permeability sediments above the pumpedinterval are “leaky” semiconfining in nature and additional water can be derived from it(storage albeit small, B=0.02) and through it during pumping. Water levels fluctuations inI75-MZ 3 (2,300 to 2,350 feet bls) are attributed to diurnal tidal and barometric pressurechanges that occurred during the APT.
As mentioned previously, Moench (1985) derived an analytical solution forpredicting water level displacements in response to transient flow to a large diameter wellin an aquifer with storative aquitard(s) and well bore skin and combines the efforts ofseveral previously established analytical methods. The Moench (1985) analytical modelappears to best represent the conditions present at this site based on the lithologiccharacter of the productive interval and the overlying/underlying units, water leveldeclines in I75-MZ 1 (Figure 17), the large diameter of Well I75-PW, and the resultingdrawdown curve derived from the test interval. The results generalized from thisanalytical solution, yielded a transmissivity value of 52,500 gpd/ft, a storage coefficient of2.3 x 10-5, and an r/B value of 0.05 with a calculated leakance value of 1.64 x 10⁻³ gpd/ft3
(Walton, 1960).
During each of the two APTs, water samples were taken from the production wellin accordance with SFWMD’s quality assurance/quality control sampling protocol(SFWMD, 1994). These samples were then submitted to the SFWMD’s Water QualityLaboratory for major cation/anion analyses. The results of these analyses are summarizedin Table 11.
Long-Term Groundwater Level/Quality Monitoring Program
Shortly after the construction of the tri-zone Floridan aquifer monitor well (I75-TW), water quality samples were collected from each monitor interval and submitted tothe SFWMD Laboratory for cation-anion analyses to establish baseline data. The resultsof these analyses are summarized in Table 12.
Also after construction, a monthly potentiometric head monitoring program wasestablished. Pressures were recorded from the various monitor zones using a 30-psigtransducer and a Hermit 3000 (Insitu, Inc.) data logger once a month. Automated pressurerecorders (Insitu Troll 4000) were installed on the FAS tri-zone monitor well (I75-TW) on
Table 11. Water Quality Data from Aquifer Performance Tests
Identifier
DepthInterval
(feet bls)
SpecificCapacity(gpm/ft/
dd)Sample
Date
Cations (mg/L) Anions (mg/L)
TDS(mg/L)
Field Parameters
Na+ K+ Ca2+ Mg2+ Cl-Alkalinityas CaCO3 SO4
2-
SpecificConduct.(µmhos/
cm)Temp(oC)
pH(s.u.)
I75-PW 1 690-780 16.72 11/26/96 1,060 43 169 157 1,848 152 562 3,910 6,690 28.39 7.01
I75-PW 2 890-1050 15.75 01/23/97 2,080 80 274 304 4,021 161 665 6,900 12,410 29.67 7.02
35
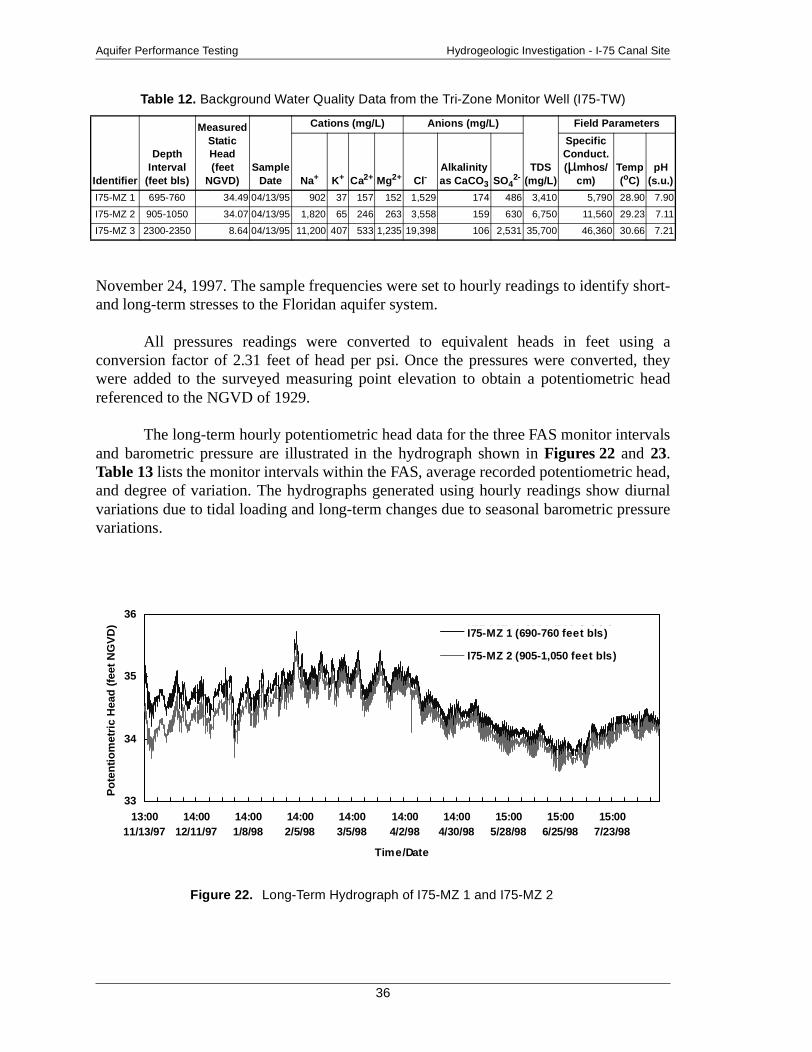
Aquifer Performance Testing Hydrogeologic Investigation - I-75 Canal Site
November 24, 1997. The sample frequencies were set to hourly readings to identify short-and long-term stresses to the Floridan aquifer system.
All pressures readings were converted to equivalent heads in feet using aconversion factor of 2.31 feet of head per psi. Once the pressures were converted, theywere added to the surveyed measuring point elevation to obtain a potentiometric headreferenced to the NGVD of 1929.
The long-term hourly potentiometric head data for the three FAS monitor intervalsand barometric pressure are illustrated in the hydrograph shown in Figures 22 and 23.Table 13 lists the monitor intervals within the FAS, average recorded potentiometric head,and degree of variation. The hydrographs generated using hourly readings show diurnalvariations due to tidal loading and long-term changes due to seasonal barometric pressurevariations.
Table 12. Background Water Quality Data from the Tri-Zone Monitor Well (I75-TW)
Identifier
DepthInterval
(feet bls)
MeasuredStaticHead(feet
NGVD)Sample
Date
Cations (mg/L) Anions (mg/L)
TDS(mg/L)
Field Parameters
Na+ K+ Ca2+ Mg2+ Cl-Alkalinityas CaCO3 SO4
2-
SpecificConduct.(µmhos/
cm)Temp(oC)
pH(s.u.)
I75-MZ 1 695-760 34.49 04/13/95 902 37 157 152 1,529 174 486 3,410 5,790 28.90 7.90
I75-MZ 2 905-1050 34.07 04/13/95 1,820 65 246 263 3,558 159 630 6,750 11,560 29.23 7.11
I75-MZ 3 2300-2350 8.64 04/13/95 11,200 407 533 1,235 19,398 106 2,531 35,700 46,360 30.66 7.21
33
34
35
36
13:0011/13/97
14:0012/11/97
14:001/8/98
14:002/5/98
14:003/5/98
14:004/2/98
14:004/30/98
15:005/28/98
15:006/25/98
15:007/23/98
Time/Date
Po
ten
tio
met
ric
Hea
d(f
eet
NG
VD
) I75-MZ#1 (690-760 ft bls)
I75-MZ#2 (905-1,050 ft bls)
I75-MZ 1 (690-760 feet bls)
I75-MZ 2 (905-1,050 feet bls)
Figure 22. Long-Term Hydrograph of I75-MZ 1 and I75-MZ 2
36

Hydrogeologic Investigation - I-75 Canal Site Hydrogeologic Framework
HYDROGEOLOGIC FRAMEWORK
Three major aquifer systems underlie this site: the Surficial Aquifer System (SAS),the IAS, and the FAS, with the FAS being the focus of this test well program. Theseaquifer systems are composed of multiple, discrete aquifers separated by low permeability“confining” units that occur throughout this Tertiary/Quaternary age sequence. Figure 24shows a hydrogeologic section underlying the I-75 Canal site.
Surficial Aquifer System
The SAS extends from land surface to a depth of 205 feet bls. It consists ofHolocene and Miocene to Pleistocene age (agcor aged?) sediments. The undifferentiatedHolocene sediments occur from land surface to a depth of 10 feet bls, and consist ofunconsolidated orange to light gray, very fine to coarse grained quartz sands, and shellfragments within a calcilutite matrix. The sediments from 10 to 90 feet bls consistprimarily of light gray to medium gray, moderate to well indurated biogenic limestone,with minor fine-grained sands (moderate to good permeability). This interval is identifiedas the Pliocene age Tamiami Formation (Ochopee Limestone member), which forms thebulk of the productive capacity of this system. Low permeability arenaceous calcilutite
Table 13. Average FAS Potentiometric Head Data from I75-TW for the Period of Record,November 1997 to August 1998
IdentifierMonitor Interval
(feet bls)
Average MeasuredPotentiometric Head
(feet NGVD)
StandardDeviation
(feet)
I75-MZ 1 690 to 760 34.6 0.41
I75-MZ 2 905 to 1,050 34.5 0.39
I75-MZ 3 2,300 to 2,350 9.1 0.44
4
6
8
10
12
13:0011/13/97
14:0012/11/97
14:001/8/98
14:002/5/98
14:003/5/98
14:004/2/98
14:004/30/98
15:005/28/98
15:006/25/98
15:007/23/98
Time/Date
Po
ten
tio
met
ric
Hea
d(f
eet
NG
VD
)
I75-MZ#3 (2,300 - 2,350 ft bls)I75-MZ 3 (2,300-2,350 feet bls)
Figure 23. Long-Term Hydrograph of I75-MZ 3
37

Hydrogeologic Framework Hydrogeologic Investigation - I-75 Canal Site
Figure 24. Hydrostratigraphic Column
38

Hydrogeologic Investigation - I-75 Canal Site Hydrogeologic Framework
(marl) underlies the productive biogenic limestones at 90 feet bls and extends to 118 feetbls. This low permeability unit forms an interaquifer confining unit. Moderate to wellindurated limestone units occur from 118 to 176 feet bls with quartz sand contentincreasing 10 to 35 percent with depth. The limestone and quartz sand units from 90 to195 feet bls are part of the “Unnamed Formation” (Edward et al., 1998). An interval offine to coarse grained quartz sand (Miocene Coarse Clastics? [Knapp et al., 1986]) withina carbonate matrix occurs from 176 to 205 feet. A low permeability poorly induratedolive green, silty clay unit of the Peace River Formation at 206 feet bls forms the base ofthe SAS at this site.
Intermediate Aquifer System
Below the SAS lies the IAS, which extends from 206 to 690 feet bls. The PeaceRiver and Arcadia Formations of Miocene-Pliocene age Hawthorn Group (Scott, 1988)act as semiconfining units separating the Floridan aquifer from the SAS. The IAS containsmultiple productive horizons, separated by low permeability interaquifer confining units.The low permeability siliciclastic sediments of the Peace River Formation from 206 to220 feet bls form the top of this system. A moderately productive unit occurs from 220 to280 feet bls and consists of moderately indurated biogenic limestone with up to 5 percentphosphatic sands, identified as the carbonate facies of the Sandstone aquifer (Smith andAdams, 1988). Below this productive interval is a low permeability, gray to olive greencolored, clayey-silt and mudstone unit that extents to a depth of 322 feet bls (base of thePeace River Formation). A second productive horizon occurs from 322 to 370 feet bls(identified based primarily on well cuttings), composed of a moderately induratedwackestone containing 30 to 40 percent allochems consisting of mollusks and bryozoans.This unit was correlated to the mid-Hawthorn aquifer, that underlies this area (Knapp etal., 1986). A relatively thick, low permeability carbonate unit extends from 370 to 490 feetbls, consisting of poorly indurated mudstones. A moderately indurated wackestone withevidence of minor secondary porosity development is present below 490 feet bls.
Formation evaluation tests were conducted on productive intervals below a depthof 490 bls as part of the ASR evaluation of the lower portion of the IAS, requested by theBig Cypress Basin. Therefore, the 12-inch diameter casing was temporarily installed at490 bls to facilitate geophysical logging and packer testing from 490 to 925 feet bls. Thegeophysical logs and lithologic data were used to identify a moderately permeability unitfrom 490 to 550 feet bls. Lithologically, this interval is composed of moderately induratedwackestones with minor stringers of well indurated packstones. The flowmeter andborehole video logs indicate an increase in water flow near the base of this unit at 545 feetbls with diffuse flow over its extent (see geophysical logs from I75-TW Run 2, inAppendix A). A low permeability unit consisting of micrite and poorly induratedmudstones are present in the subsurface from 550 to 690 feet bls. A portion of this interval(550 to 620 feet bls) correlates to the Marker Unit, as identified by Reese (2000). Thenatural gamma log signature that was used to identify the Marker Unit produces thin,intermittent, high-gamma radiation peaks, associated primarily with intervals of highphosphatic sand/silt content below a depth of 550 feet bls. The Marker Unit and other lowpermeability sediments form the lower boundary of the IAS at 690 feet bls.
39

Hydrogeologic Framework Hydrogeologic Investigation - I-75 Canal Site
Floridan Aquifer System
The FAS consists of a series Tertiary age limestone and dolostone units. Thesystem includes the lower Arcadia Formation, Suwannee and Ocala Limestones, AvonPark Formation, and the Oldsmar Formation. The Paleocene age Cedar Keys Formationwith evaporitic gypsum and anhydrite forms the lower boundary of the FAS (Miller,1986).
Upper Floridan Aquifer
The top of the FAS, as defined by the Southeastern Geological Society Ad HocCommittee on Florida Hydrostratigraphic Unit Definition (1986), coincides with the topof a vertically continuous permeable carbonate sequence at Miocene to Oligocene Age.The upper Floridan aquifer consists of thin, high permeability water bearing horizonsinterspersed within thick, low permeability units of early Miocene to middle-Eocene agesediments, including the basal Arcadia Formation, Suwannee and Ocala Limestones, andthe Avon Park Formation. At this site, the top of the FAS occurs at a depth of 690 feet bls,which coincides with the lower portion of the Arcadia Formation (Basal Hawthorn Unit,Reese, 2000).
Generally, two predominant permeability zones exist within the upper Floridanaquifer. The uppermost permeable zone typically lies between 700 and 1,300 feet bls. Themost transmissive part of this upper zone usually occurs near the top, coincident with anunconformity at the top of the Oligocene or Eocene age formations (Miller, 1986). Thefirst transmissive horizon at the I-75 site includes the lower portion of the Basal HawthornUnit (Reese and Memberg, 2000), and occurs from 690 to 780 feet bls. The top of this unitis composed of light to pale orange, moderate to well indurated mudstones towackestones. Light gray to medium brown, well indurated dolostones (surcosic in nature)extend from 705 to 742 feet bls. Through this interval, the caliper log indicates a relativelygauged borehole (similar to bit diameter), the 16/64-inch resistivity readings increase to20 to 30 ohm-m, and the neutron porosity readings (single detector tool) increase-lowporosity (see geophysical logs from I75-TW Run 2 in Appendix A), all of which areindicative of a well indurated (fractured) low porosity horizon. However, the flowmeterlog indicates increased upward water flow at 745 feet bls, the fluid resistivity trace showsa sharp deflection at 735 feet bls, and combined with the lost circulation encountered from725 to 737 feet bls during mud rotary drilling, suggests a highly transmissive horizon.Lithologically, moderate to well indurated wackestones to packstones with goodsecondary (moldic) porosity development continues from 742 to 777 feet bls.
At a depth of 768 feet bls, the upper boundary of the Suwannee Limestone wasidentified by a gradual change from an olive gray to medium brown, slightly phosphaticlimestone and dolostone to a tan to light gray, phosphate free packstone. This formationboundary is also characterized by an attenuation of both the natural gamma activity andmeasured resistivity (see geophysical log traces from I75-TW Run 2 in Appendix A).Therefore, the base of this productive horizon terminates within the upper portion of theSuwannee Limestone at a depth of 780 bls. The base is identified by a positive deflectionin both the flowmeter and temperature gradient logs and negative deflection in the fluid
40

Hydrogeologic Investigation - I-75 Canal Site Hydrogeologic Framework
resistivity log trace. This productive horizon, located at 690 to 780 feet bls, correlates withthe lower Hawthorn-Suwannee aquifer (Knapp et al., 1986) present within this area and isidentified as the uppermost portion of the Floridan aquifer at this site.
Below the lower Hawthorn/Suwannee aquifer is a relatively thick, lowpermeability interaquifer, semiconfining carbonate unit that extends from 780 to 905 feetbls, consisting of poorly to moderately indurated mudstones and wackestones. A secondproductive interval within the upper Floridan aquifer was identified from 905 to 1,050 feetbls. This interval consists of moderately indurated packstone and grainstone units withminor to moderate secondary porosity development (e.g., pinhole and moldic porosity).The flowmeter log was of limited use in identifying this productive horizon due to theenlarged borehole muting evidence of water production. However, the signature of thetemperature log trace from Geophysical Log Run 2, and the results of the borehole videosurvey (evidence of vuggy porosity) were invaluable in identifying this productiveinterval. This productive interval terminates in a low permeability, moderately induratedwackestones of the Suwannee Limestone at depth of 1,050 feet bls. The inorganic waterquality, stable isotopes (e.g., 2H and 18O), and potentiometric heads, summarized in theprevious section, suggest that the two productive horizons identified in the upper Floridanaquifer, 690 to 780 and 890 to 1,050 feet bls, are hydraulically connected.
Middle Confining Unit
Low permeable, poorly to moderately-indurated mudstones to packstones of theSuwannee Limestone occur from 1,050 to 1,100 bls. The resistivity log trace show apositive deflection, suggesting lower porosities and/or lower formation water TDSconcentrations from 1,050 to 1,090 feet bls. The deep induction log values below 1,090feet bls decrease to 2 to 2.5 ohm-meters (ohm-m) with very little change in lithology orporosity. The low resistivity log readings, less than 5 ohm-m (Reese, 2000), coupled withthe water quality results from straddle-packer tests, were used to identify the base of theUSDW (10,000 mg/L TDS) at approximately 1,090 feet bls. Archie’s equation (1942) wasalso used to estimate the resistivity of formation waters over the portion of the well borefrom 900 to 2,374 feet bls. The calculated conductivity was then used to estimate TDSconcentrations using the linear regression equations developed by Reese (1994). Theresults of these calculations also indicated the base of the USDW occurs at approximately1,090 feet bls. Figure 25 shows derived TDS concentrations using Archie’s equation(Archie, 1942) and linear regression equations developed by Reese (1994) compared tomeasured TDS values from water samples taken from packer tests.
From 1,110 to 1,121 feet bls, a medium gray colored, fine grained, unconsolidatedquartz sand with minor organic material (subaerial exposure) was found. The boreholewas enlarged through this interval (as shown on the caliper log from Geophysical Log Run1 and 2, Appendix A), due to the unconsolidated nature of the sediments being evacuatedduring reverse air drilling operations. Below this sand interval, poorly to moderatelyindurated mudstones and packstones continue to approximately 1,204 feet bls, where awell indurated dolostone unit was found. This olive to light gray, well induratedcrystalline (anhedral to euhedral) dolostone unit continues to a depth of 1,231 feet bls.This dolostone unit was easily identified on the geophysical logs by a gauged caliper and
41

Hydrogeologic Framework Hydrogeologic Investigation - I-75 Canal Site
deflections in both the resistivity and sonic log traces. Minor water production primarilyabove and below this dolostone unit was indicated by deflections in the temperaturedifferential log trace (Figures A-2 and A-3 in Appendix A).
The upper boundary of the Ocala Limestone is difficult to distinguish at this sitebecause of similar lithologic character to the overlying Suwannee Limestone. Reese(2000) identified the top to the Ocala Limestone at 1,231 feet bls. In this report, it wasidentified at a depth 1,299 feet bls, marked by a slight change in lithology from ayellowish gray, peliodal packstone with 1 to 2 percent phosphate to light gray to tancolored, moderately indurated, mudstone-wackestone with no visible phosphate asindicated in the on-site lithologic log. A slight attenuation of the natural gamma response(see geophysical log traces from I75-TW Run 2 in Appendix A) also helped to identifythe top of this lithostratigraphic unit.
The lithologic character of the upper portion of the Avon Park Formation is alsovery similar to the light orange to beige chalky limestones of the lower Ocala Limestone,as shown in the well cuttings and geophysical log responses. The top of the Avon ParkFormation was identified by the Florida Geological Society (FGS) at a depth of 1,785 feetbls, based on the absence of a diagnostic Ocala Limestone microfossil Lepidocyclina sp.,(Applin and Applin, 1944). The matrix becomes finer and abundantly higher alteredechnoid fragments are present (Rick Green, Florida Geological Survey, personalcommunication). Reese (2000) identified the top of the Avon Park Formation at a depth of1,485 feet bls, based on a regional correlation of formations underlying the lower westcoast region of Florida. In this report, this change in lithology at 1,785 feet bls wasdesignated as the top of the Avon Park Formation. This slight change in lithology at 1,785feet bls is noted on the geophysical logs by a slight increase in natural gamma activity andsonic travel times and decrease in derived density/neutron porosities (Figure A-3 inAppendix A). The minor lithologic differences between the two stratigraphic units mayreflect continuous and/or similar depositional environments across the middle to lateEocene time stratigraphic boundary.
The Ocala Limestone from 1,299 to 1,690 feet bls forms in large part aninteraquifer confining unit within the FAS at this site. This interval consists of lowpermeability mudstones and wackestones. Formation samples from this interval do notshow evidence of large-scale secondary porosity development. In addition, the productiontype geophysical logs traces (e.g., temperature and flowmeter logs) indicate limitedproduction horizons, supporting the overall confining nature of this interval.
Intervals with high permeability have been documented within the middleconfining unit ranging in depth from 1,400 to 1,600 feet bls (Miller, 1986). Within thisinteraquifer confining unit, a minor flow zone is present within a medium brown to olivegray crystalline dolomite unit at a depth of 1,481 to 1,500 feet bls. Through this interval,the induction, sonic and density/neutron log traces indicate a well indurated, low porosityunit. Near the center of this dolostone unit, the caliper log identifies an enlarged boreholewith a diameter exceeding 20 inches, and deflections in the temperature and flowmeterlogs indicate minor water production (see Geophysical Log Run 3 in Appendix A). Apacker test was conducted within this interval yielded a specific capacity of 15.13 gpm/ft
42
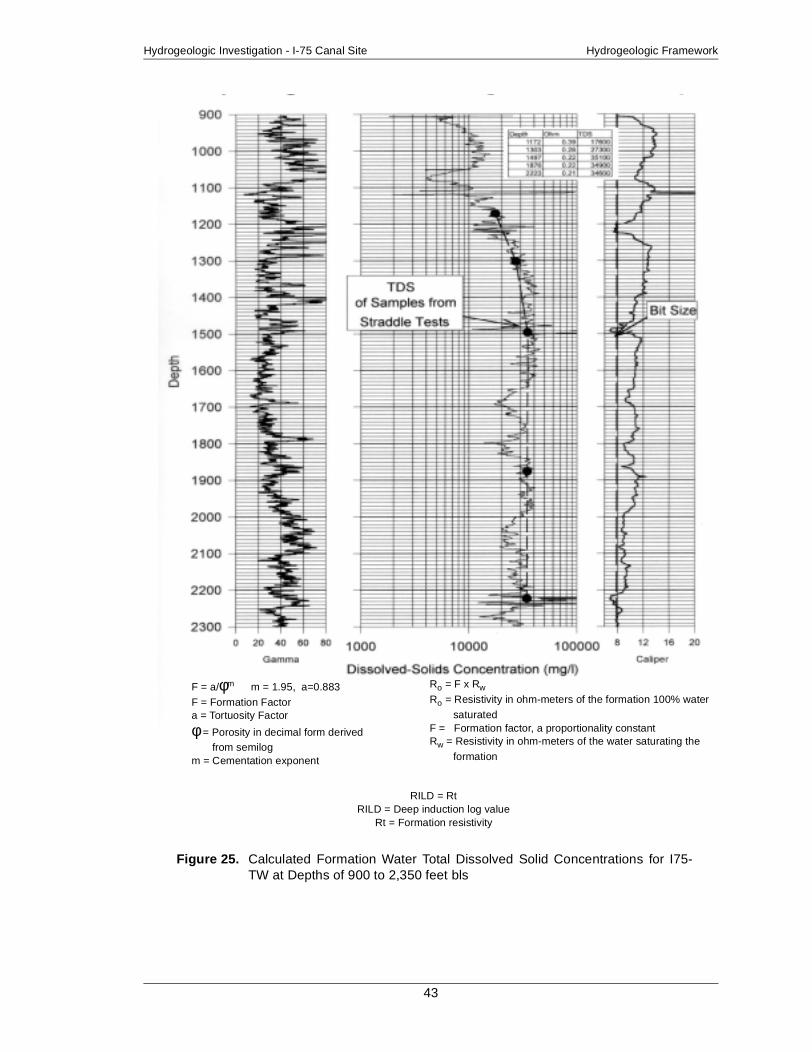
Hydrogeologic Investigation - I-75 Canal Site Hydrogeologic Framework
Figure 25. Calculated Formation Water Total Dissolved Solid Concentrations for I75-TW at Depths of 900 to 2,350 feet bls
F = a/φm m = 1.95, a=0.883
F = Formation Factora = Tortuosity Factor
φ= Porosity in decimal form derivedfrom semilog
m = Cementation exponent
Ro = F x Rw
Ro = Resistivity in ohm-meters of the formation 100% water
saturatedF = Formation factor, a proportionality constantRw = Resistivity in ohm-meters of the water saturating the
formation
RILD = RtRILD = Deep induction log value
Rt = Formation resistivity
43

Hydrogeologic Framework Hydrogeologic Investigation - I-75 Canal Site
of drawdown, but produced water similar to seawater in composition with chlorideconcentrations greater than 17,000 mg/L.
The Avon Park Formation from 1,785 to 1,986 feet bls is characterized bymoderate to well indurated packstones to grainstones, interbedded with minor dolostoneunits. These limestone units show evidence of varying degrees of pinhole and moldicporosity development with the dolostones being slightly surcrosic in nature. However, awell defined flow zone is not evident, as indicated by smooth log traces in both thetemperature and flowmeter logs (See I75-TW Geophysical Log Run 3 in Appendix A).The lithology and moderate degree of secondary porosity development as seen in the wellcuttings suggests low to moderate production capacity over this interval. However, aproductive horizon at 1,850 to 1,901 feet bls identified from well cuttings and boreholevideo log, yielded a specific capacity of 13.49 gpm/ft at a pumping rate of 102 gpm. Thisinterval produced saline waters and is located well below the USDW. Therefore, thisinterval was not identified for composite aquifer testing and long-term water level andwater quality monitoring.
Miller (1986) observed that portions of the lower Avon Park Formation are finegrained and have low permeability, thereby acting as interaquifer confining units withinthe FAS. Based on well cuttings, well indurated, low porosity mudstone to packstone unitswith intermittent brown to gray dolostones occur in the subsurface from 1,986 to 2,213feet in depth. The geophysical logs also identify this lithologic change with the caliper logmeasuring a relatively gauged borehole, an increase in both resistivity and bulk densityvalues, and shorter sonic travel times (see I75-TW Geophysical Log Run 3 in AppendixA).
Lower Floridan Aquifer
Below the middle confining unit is the lower Floridan aquifer from 1,986 and2,213 feet bls that is characterized by thin, moderate to high permeability, fractured, andcavernous dolostones that occur interspersed within low permeability dolostone andlimestone units. A significant lithologic change occurs at a depth of 2,213 feet bls, andcontinues to the total depth of the borehole at 2,694 feet. Well indurated, crystalline(euhedral to subhedral) dolostones dominate this interval with only minor stringers ofwackestone and packstone limestone units. This change in lithology is indicated by anincrease in resistivity and decrease in sonic travel times (see I75-TW Geophysical LogRun 3 in Appendix A). A highly fractured dolostone unit from 2,340 to 2,374 feet bls wasinitially identified by sharp deflections in both the resistivity and sonic traces and laterverified by a borehole video log. This highly fractured interval produced boulders thatobstructed the borehole, precluding geophysical logging of the borehole below a depth of2,374 feet bls. Based on Meyers (1989) and Reese (2000), the interval from 2,213 to 2,694feet bls was identified as the upper dolostone units of the lower Floridan aquifer. The pilothole extends through the upper dolostone units of the lower Floridan to a total depth of2,694 feet bls. From a stratigraphic perspective, the Oldsmar Formation was not found atthis site, based on lithologic criteria defined by Miller (1986), the lack of a glauconitemarker bed used by Duncan et al. (1994), and the absence of early Eocene index fossilssuch as Helicostegina gyralis (Chen, 1965).
44

Hydrogeologic Investigation - I-75 Canal Site Summary
Table 14 summarizes the stratigraphic formations identified at the I-75 Canal siteand the depth below land surface at which they were reported.
SUMMARY• The top of the FAS, as defined by the Southeastern Geological
Society Ad Hoc Committee on Florida Hydrostratigraphic UnitDefinition (1986), was identified at a depth of approximately 690feet bls.
• Lithologic and geophysical logs, specific capacity and packer testresults, and petrophysical data indicate moderate to goodproduction capacity of the upper Floridan aquifer.
• Water quality data from reverse air returns and straddle-packertests indicate that chloride and TDS in the upper Floridan aquiferwaters exceed potable drinking water standards. Chloride andTDS concentrations above 1,050 feet bls range from 1,530 to4,020 mg/L and 3,410 to 7,150 mg/L, respectively.
• The first productive horizon in the upper Floridan aquifer, from690 to 780 feet bls, yielded a transmissivity value of 116,400gpd/ft, a storage coefficient of 1.664 x 10⁻⁵, and an r/B value of0.04, and a leakance value of 2.33 x 10⁻³ gpd/ft3.
• The second productive interval in the upper Floridan aquifer,from 890 to 1,050 feet bls, yielded a transmissivity value of52,500 gpd/ft, a storage coefficient of 2.3 x 10⁻⁵, and an r/B valueof 0.05 and a leakance value of 1.64 x 10⁻³ gpd/ft3.
• The base of the USDW, those waters having TDS concentrationsless than 10,000 mg/L, occurs at an approximate depth of 1,090feet bls.
Table 14. Summary of Stratigraphic Units Identified in the Subsurface
FormationFGSa
(feet bls)
a. FGS = Florida Geological Society
USGSb
(feet bls)
b. Reese, 2000
This Report(feet bls)
Hawthorn Group 195 NRc
c. NR = not reported
195
Suwannee Limestone 768 750 768
Ocala Limestone 1,299 1,240 1,299
Avon Park Formation 1,785 1,485 1,785
Oldsmar Formation NId
d. NI = not identified
NI NI
45

References Hydrogeologic Investigation - I-75 Canal Site
• Fluid-type (flowmeter and temperature) geophysical logs showlittle natural flow below the base of the USDW, at a depth of1,090 feet bls.
• The highest mean horizontal permeability, 4,800 millidarcies,from cores corresponds to a cored section at approximately 950feet bls consisting of an intraalgal foraminiferal peloidalpackstone likely deposited in an open lagoonal shoalenvironment.
• The average measured potentiometric heads for the Floridanmonitoring intervals are as follows:
• 34.6 feet NGVD: +0.41 feet for the 690 to 760 feet blsmonitor interval
• 34.5 feet NGVD: +0.39 feet for the 905 to 1,050 feet blsmonitor interval
• 9.1 feet NGVD: +0.44 feet for the 2,300 to 2,350 feet blsmonitor interval
• Water levels in the FAS respond to external stresses such as tidalloading and barometric pressure variations.
REFERENCES
Agarwal, R.G., R. Al-Hussainy, and H.J. Ramey, Jr. 1970. An investigation of wellborestorage and skin effect in unsteady liquid flow – analytical treatment. Trans. Soc. Pet. Eng.AIME 249: 279-290.
American Petroleum Institute. 1998. Recommended Practices for Core Analysis.
Applin, P.L., and E.R. Applin. 1944. Regional subsurface stratigraphy and structure of Floridaand southern Georgia. AAPG Bulletin 28 (12): 1,673-1,753.
Archie, G.E. 1942. The electrical resistivity log as an aid in determining some reservoircharacteristics. AIME Transaction 146: 54-61.
Bennett, M.W. 2001. Hydrogeologic Investigation of the Floridan Aquifer System at the L-2Canal Site Hendry County, Florida. Technical Publication WS-3, South Florida WaterManagement District, West Palm Beach, FL.
Chen, C.S. 1965. The Regional Lithostratigraphic Analysis of Paleocene and Eocene Rocks ofFlorida. Bulletin 45, Florida Geological Survey.
Coleman, M.L., T.J. Shepherd, J.J. Durham, J.E. Rouse, and G.R. Moore. 1982. Reduction ofwater with zinc for hydrogen isotope analysis. Analytical Chemistry 54: 993-995.
Craig, H. 1961. Isotopic variations in meteoric waters. Science, 133: 1,702-1,703.
Drimmie, R.J., A.R. Heemskerk, and R. Aravena. 1990. Dissolved Inorganic Carbon (DIC).Technical Procedure 5.0, Rev. 01, Environmental Isotope Laboratory, Department of EarthSciences, University of Waterloo.
46

Hydrogeologic Investigation - I-75 Canal Site References
Drimmie, R.J., A.R. Heemskerk, W.A. Mark, and R.M. Weber. 1991. Deuterium by zincReduction. Technical Procedure 4.0, Revision 02, Environmental Isotope Laboratory,Department of Earth Sciences, University of Waterloo.
Drimmie, R.J., and A.R. Heemskerk. 1993. Water 18O by CO2 Equilibration. TechnicalProcedure 13.0, Revision 02, Environmental Isotope Laboratory, Department of EarthSciences, University of Waterloo.
Duncan, J.C., W.L. Evan III, and K.L. Taylor. 1994. The Geologic Framework of the LowerFloridan Aquifer System in Brevard County, Florida. Bulletin No. 64, Florida GeologicalSurvey.
Dunham, R.J. 1962. Classification of Carbonate Rocks according to depositional texture. In:Ham, W.E. (ed), Classification of Carbonate Rocks Mem, AAPG 1: 108-121.
Edwards, L.E., S.D. Weedman, K.R. Simmons, T.M. Scott, G.L. Brewster-Wingard, S.E.Ishman, and N.M. Carlin. 1998. Lithostratigraphy, Petrography, Biostratigraphy, andStrontium-Isotope Stratigraphy of the Surficial Aquifer System of Western Collier County,Florida.
Epstein, S., and T.K Mayeda. 1953. Variations of the 18O/16O ratio in natural waters.Geochimica et Cosmochimica Acta 4: 213.
Hantush, M.S. 1960. Modification of the theory of leaky aquifers. Jour. of Geophys. Res.65(11): 3,713-3,725
Hantush, M.S., and C.E. Jacob. 1955. Nonsteady radial flow in an infinite leak aquifer. EosTrans. AGU 36(1): 95-100.
Hanshaw, B.N., W. Back, and M. Rubin. 1964. Radiocarbon determinations for estimatingflow velocities in Florida. Science 143: 494-495.
Knapp, M.S., W.S. Burns, and T.S. Sharp. 1986. Preliminary Assessment of the Ground WaterResources of Western Collier County, Florida. Technical Publication 86-1, South FloridaWater Management District.
Kohout, F.A. 1965. A hypothesis concerning cyclic flow of salt water related to geothermalheating in the Floridan Aquifer. New York Academy of Sciences Transaction, Ser.2 28(1):11-15.
Kohout, F.A. 1967. Ground water flow and the geothermal regime of the Florida Plateau.Trans. Gulf Coast Assoc. Geol. Soc. 17: 339-354.
Hallenburg, J.K. 1998. Standard Methods of Geophysical Formation Evaluation. CRC Press,Lewis Publishing, Boca Raton, FL.
Meyer, F.W., 1989. Hydrogeology, Ground Water Movement, and Subsurface Storage in theFloridan Aquifer System in Southern Florida. Professional Paper 1403-G, United StatesGeological Survey.
Meyers, J.B., P.K. Swart, J.L. Myers. 1993. Geochemical evidence for groundwater behaviorin an unconfined aquifer, south Florida. Journal of Hydrology 149: 249-27
Miller, J.A. 1986. Hydrogeologic Framework of the Floridan Aquifer System in Florida and inParts of Georgia, Alabama, and South Carolina. Professional Paper 1403-B, United StatesGeological Survey.
47

References Hydrogeologic Investigation - I-75 Canal Site
Moench, A.F., 1985. Transient flow to a large-diameter well in an aquifer with storative semi-confining layers. Water Resources Research 21(8): 1,121-1,131.
Mook, W.G., 1976. The dissolution-exchange model for dating groundwater with 14C. In:EDITOR (ed), Interpretation of Environmental Isotope and Hydrochemical Data inGroundwater Hydrology, Vienna, IAEA, pp. 213-225.
Papadopulos, I.S., and H.H. Cooper, Jr. 1967. Drawdown in a well of large diameter. WaterResource Research 3(1): 241-244.
Reese, R.S. 1994. Hydrogeology and the Distribution and Origin of Salinity in the FloridanAquifer System, Southeastern Florida. Water Resources Investigation Report 94-4010,United States Geological Survey.
Reese, R.S. 2000. Hydrogeology and the Distribution of Salinity in the Floridan AquiferSystem, Southwestern Florida. Water Resources Investigation Report 98-4253, UnitedStates Geological Survey.
Reese, R.S., and S.J. Memberg. 2000. Hydrogeology and the Distribution of Salinity in theFloridan Aquifer System, Palm Beach County, Florida. Water Resources InvestigationReport 99-4061, United States Geological Survey.
Sandal, H.M., R.N. Horne, H.J. Ramey, Jr., and J.W. Williamson. 1978. Interference Testingwith Wellbore Storage and Skin Effect at the Produced Well. Paper presented at the 53rd
Annual Fall Technical Conference and Exhibition, Society of Petroleum Engineers ofAIME, Houston, Texas Oct 1-3, 1978.
Scott, T.M. 1988. The Lithostratigraphy of the Hawthorn Group (Miocene) of Florida.Bulletin No. 59, Florida Geological Survey.
SFWMD. 1994. Comprehensive Quality Assurance Plan. South Florida Water ManagementDistrict, West Palm Beach, FL.
Smith, K.R., and K.M. Adams. 1988. Preliminary assessment of the Ground Water Resourcesof Hendry County, Florida. Technical Publication 88-12, South Florida WaterManagement District, West Palm Beach, FL.
Southeastern Geological Society Ad Hoc Committee on Florida Hydrostratigraphic UnitDefinition. 1986. Hydrogeologic Unit of Florida. Special Publication No. 28, FloridaDepartment of Natural Resources, Bureau of Geology.
Stuiver, M, and H.A. Polach. 1977. Discussion, reporting of 14C data. Radiocarbon 19(3):355-363.
Tamers, M.A. 1967. Surface-water infiltration and groundwater movement in arid areas ofVenezuela. Isotopes in Hydrology, IAEA, Vienna, pp. 339-351.
Walton, W.W. 1960. Leaky artesian aquifer condition in Illinois. Report of InvestigationsNo.39, Illinois State Water Survey.
48

Hydrogeologic Investigation - I-75 Canal Site Appendix A
APPENDIX AGEOPHYSICAL LOGS
A-1

Appendix A Hydrogeologic Investigation - I-75 Canal Site
A-2
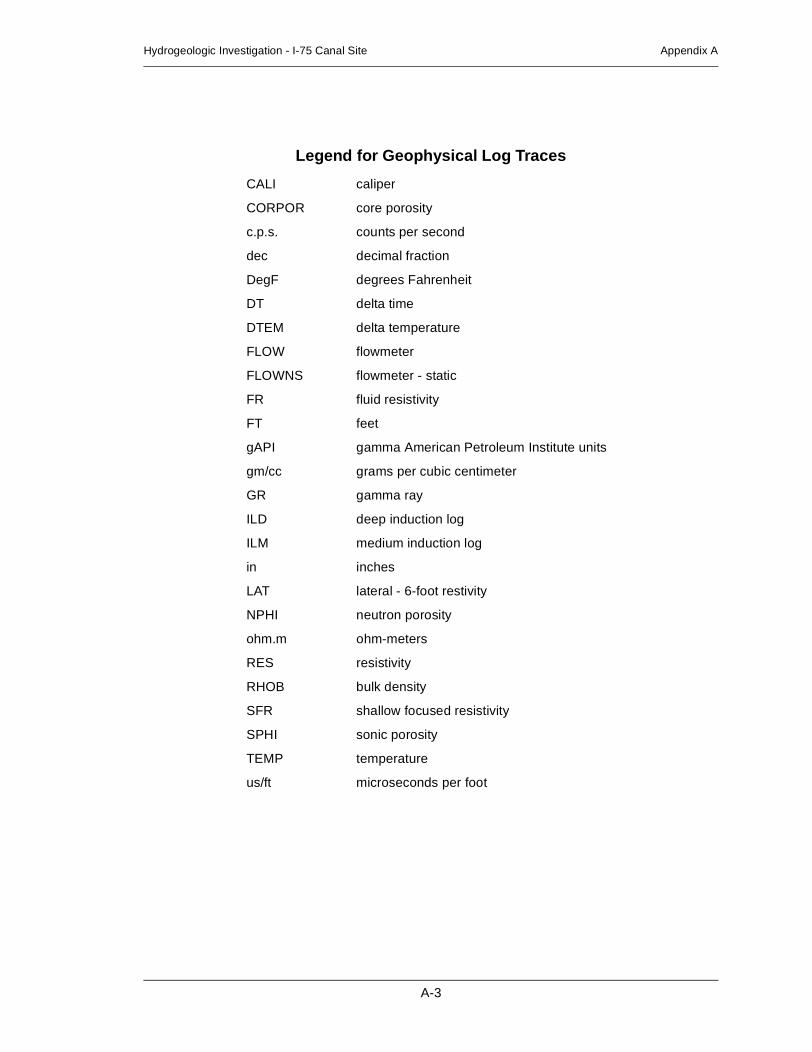
Hydrogeologic Investigation - I-75 Canal Site Appendix A
Legend for Geophysical Log Traces
CALI caliper
CORPOR core porosity
c.p.s. counts per second
dec decimal fraction
DegF degrees Fahrenheit
DT delta time
DTEM delta temperature
FLOW flowmeter
FLOWNS flowmeter - static
FR fluid resistivity
FT feet
gAPI gamma American Petroleum Institute units
gm/cc grams per cubic centimeter
GR gamma ray
ILD deep induction log
ILM medium induction log
in inches
LAT lateral - 6-foot restivity
NPHI neutron porosity
ohm.m ohm-meters
RES resistivity
RHOB bulk density
SFR shallow focused resistivity
SPHI sonic porosity
TEMP temperature
us/ft microseconds per foot
A-3

Appendix A Hydrogeologic Investigation - I-75 Canal Site
GRc.p.s0 200
CALIin8 18
DEPTHFT
16" RESohm.m0.2 200
64" RESohm.m0.2 200
6' LATohm.m0.2 200
FLOWc.p.s0 50
TEMPDeg F85 90
FRohm0 5
Casing
Production Zone N
100
200
300
400
500
600
700
800
900
Figure A-1. Log Traces from I75-TW Geophysical Log Run 1
A-4
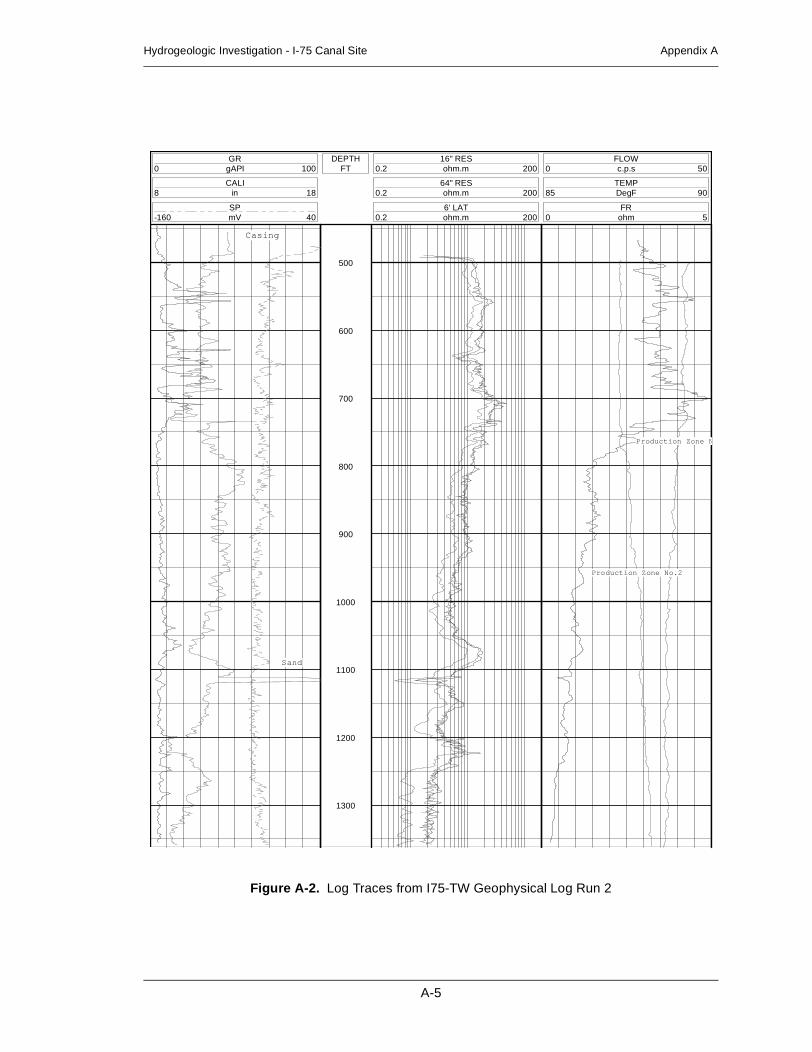
Hydrogeologic Investigation - I-75 Canal Site Appendix A
GRgAPI0 100
CALIin8 18
SPmV-160 40
DEPTHFT
16" RESohm.m0.2 200
64" RESohm.m0.2 200
6' LATohm.m0.2 200
FLOWc.p.s0 50
TEMPDegF85 90
FRohm0 5
Casing
Sand
Production Zone No.2
Production Zone N
500
600
700
800
900
1000
1100
1200
1300
Figure A-2. Log Traces from I75-TW Geophysical Log Run 2
A-5

Appendix A Hydrogeologic Investigation - I-75 Canal Site
GRgAPI0 200
CALIin8 18
FLOWc.p.s0 12
DEPTHFT
SFRohm.m0.2 200
ILMohm.m0.2 200
ILDohm.m0.2 200
DTus/ft140 40
RHOBgm/cc0.95 2.95
SPHIdec0.6 0
NPHIdec0.6 0
♦ ♦CORPORdec0.6 0
TEMPDegF82 87
FRohms0 5
DTEMDegF-0.1 0.1
♦♦ ♦
♦♦♦ ♦♦♦
♦♦
1000
1100
1200
1300
1400
1500
1600
1700
1800
1900
2000
2100
2200
2300
Figure A-3. Log Traces from I75-TW Geophysical Log Run 3
A-6

Hydrogeologic Investigation - I-75 Canal Site Appendix B
APPENDIX BLITHOLOGIC DESCRIPTION
B-1

Appendix B Hydrogeologic Investigation - I-75 Canal Site
B-2

Hydrogeologic Investigation - I-75 Canal Site Appendix B
LITHOLOGIC WELL LOG PRINTOUT SOURCE - FGS
WELL NUMBER: W-17405 COUNTY - COLLIERTOTAL DEPTH: 2694 FEET LOCATION: T.49S R.26E S.29331 SAMPLES FROM 10 TO 2694 FEET LATITUDE = 26D 10M 12S
LONGITUDE = 81D 43M 51SCOMPLETION DATE: 03/26/96 ELEVATION: 10 FT
OTHER TYPES OF LOGS AVAILABLE - ELECTRIC
OWNER/DRILLER: SFWMD/RST Enterprise Inc.
WORKED BY: MARTIN BALINSKY (FGS) (9/19/96)SFWMD GEOPHYSICAL # 021-000066SFWMD ID# FOR CUTTINGS IS I75-TW (021-26)WELL IS LOCATED IN SECTION 29, TOWNSHIP 49S, RANGE 26EBELLE MEADE SW QUADRANGLE, COLLIER COUNTY
0 - 10 000NOSM NO SAMPLES10 - 195 121PCPC PLIOCENE-PLEISTOCENE
195 - 768 122HTRN HAWTHORN GROUP768 - 1299 123SWNN SUWANNEE LIMESTONE
1299 - 1785 124OCAL OCALA GROUP1785 - 2694 124AVPK AVON PARK FORMATION
0 - 10 000NOSM NO SAMPLES280 - 287 000NOSM NO SAMPLES482 - 490 000NOSM NO SAMPLES
1795 - 1796 000NOSM NO SAMPLES
10 - 30 SHELL BED; YELLOWISH GRAY TO WHITE25% POROSITY: INTERGRANULAR, POSSIBLY HIGH PERMEABILITYUNCONSOLIDATEDACCESSORY MINERALS: CALCILUTITE-05%FOSSILS: MOLLUSKS
30 - 90 SHELL BED; VERY LIGHT ORANGE TO GRAYISH OLIVE25% POROSITY: INTERGRANULAR, POSSIBLY HIGH PERMEABILITYUNCONSOLIDATEDACCESSORY MINERALS: CALCILUTITE-15%, PHOSPHATIC SAND-01%FOSSILS: MOLLUSKS
90 - 195 SAND; YELLOWISH GRAY TO MODERATE LIGHT GRAY30% POROSITY: INTERGRANULAR, POSSIBLY HIGH PERMEABILITYGRAIN SIZE: COARSE; RANGE: VERY FINE TO COARSEHIGH SPHERICITY; UNCONSOLIDATED
195 - 210 WACKESTONE; LIGHT OLIVE GRAY TO WHITE15% POROSITY: LOW PERMEABILITY, INTERGRANULARGRAIN TYPE: CALCILUTITE, SKELETAL40% ALLOCHEMICAL CONSTITUENTSGRAIN SIZE: COARSE; RANGE: VERY FINE TO COARSEMODERATE INDURATIONCEMENT TYPE(S): CALCILUTITE MATRIXACCESSORY MINERALS: QUARTZ SAND-25%FOSSILS: MOLLUSKS
B-3

Appendix B Hydrogeologic Investigation - I-75 Canal Site
THE SAND FOUND HERE IS DOMINANTLY FINE-GRAINED. POSSIBLETOP OF MIOCENE HAWTHORN FORMATION
210 - 220 SAND; MODERATE OLIVE BROWN TO WHITE20% POROSITY: INTERGRANULARGRAIN SIZE: COARSE; RANGE: VERY FINE TO COARSEHIGH SPHERICITY; POOR INDURATIONCEMENT TYPE(S): CALCILUTITE MATRIXACCESSORY MINERALS: SILT-30%, CALCILUTITE-20%FOSSILS: MOLLUSKS
220 - 280 SHELL BED; MODERATE LIGHT GRAY TO WHITE25% POROSITY: INTERGRANULAR, POSSIBLY HIGH PERMEABILITYPOOR INDURATIONCEMENT TYPE(S): CALCILUTITE MATRIXACCESSORY MINERALS: PHOSPHATIC GRAVEL-02%PHOSPHATIC SAND-01%FOSSILS: MOLLUSKSSOME RECRYSTALLIZATION (5%)
280 - 287 NO SAMPLES
287 - 305 SAND; LIGHT OLIVE GRAY TO WHITE25% POROSITY: INTERGRANULAR,GRAIN SIZE: FINE; RANGE: VERY FINE TO FINEMEDIUM SPHERICITY; POOR INDURATIONCEMENT TYPE(S): CALCILUTITE MATRIXACCESSORY MINERALS: CALCILUTITE-10%, SHELL-85%FOSSILS: MOLLUSKSSHELLY SAND
305 - 335 WACKESTONE; WHITE TO LIGHT GRAY20% POROSITY: INTERGRANULARGRAIN TYPE: SKELETAL, CALCILUTITE15% ALLOCHEMICAL CONSTITUENTSGRAIN SIZE: VERY FINE; RANGE: VERY FINE TO COARSEPOOR INDURATIONCEMENT TYPE(S): CALCILUTITE MATRIXACCESSORY MINERALS: PHOSPHATIC SAND-01%FOSSILS: MOLLUSKS
335 - 370 WACKESTONE; WHITE TO MODERATE LIGHT GRAY15% POROSITY: LOW PERMEABILITY, INTERGRANULARGRAIN TYPE: SKELETAL, CALCILUTITE40% ALLOCHEMICAL CONSTITUENTSGRAIN SIZE: VERY FINE; RANGE: VERY FINE TO VERY COARSEMODERATE INDURATIONCEMENT TYPE(S): CALCILUTITE MATRIXACCESSORY MINERALS: PHOSPHATIC SAND-01%BRYOZOANS
370 - 430 MUDSTONE; WHITEPOROSITY: LOW PERMEABILITY, INTERGRANULARGRAIN TYPE: CALCILUTITE, SKELETAL05% ALLOCHEMICAL CONSTITUENTSGRAIN SIZE: VERY FINE; RANGE: VERY FINE TO COARSEMODERATE INDURATIONCEMENT TYPE(S): CALCILUTITE MATRIX
B-4

Hydrogeologic Investigation - I-75 Canal Site Appendix B
ACCESSORY MINERALS: PHOSPHATIC SAND-01%FOSSILS: MOLLUSKS
430 - 482 MUDSTONE; YELLOWISH GRAYPOROSITY: LOW PERMEABILITY, INTERGRANULARGRAIN TYPE: CALCILUTITE, SKELETAL03% ALLOCHEMICAL CONSTITUENTSGRAIN SIZE: VERY FINE; RANGE: VERY FINE TO COARSEMODERATE INDURATIONCEMENT TYPE(S): CALCILUTITE MATRIXACCESSORY MINERALS: PHOSPHATIC SAND-01%FOSSILS: MOLLUSKS
482 - 490 NO SAMPLES
490 - 635 MUDSTONE; VERY LIGHT ORANGE TO YELLOWISH GRAYPOROSITY: LOW PERMEABILITY, INTERGRANULARGRAIN TYPE: CALCILUTITE, SKELETAL05% ALLOCHEMICAL CONSTITUENTSGRAIN SIZE: VERY FINE; RANGE: VERY FINE TO COARSEMODERATE INDURATIONCEMENT TYPE(S): CALCILUTITE MATRIXACCESSORY MINERALS: PHOSPHATIC SAND-01%FOSSILS: MOLLUSKSPARTIALLY RECRYSTALLIZED
635 - 660 MUDSTONE; VERY LIGHT GRAY TO LIGHT OLIVE GRAYPOROSITY: LOW PERMEABILITY, INTERGRANULARGRAIN TYPE: CALCILUTITE, SKELETAL05% ALLOCHEMICAL CONSTITUENTSGRAIN SIZE: VERY FINE; RANGE: VERY FINE TO COARSEMODERATE INDURATIONCEMENT TYPE(S): CALCILUTITE MATRIXFOSSILS: MOLLUSKS
660 - 735 MUDSTONE; YELLOWISH GRAYPOROSITY: LOW PERMEABILITY, INTERGRANULAR, VUGULARGRAIN TYPE: CALCILUTITE, SKELETAL03% ALLOCHEMICAL CONSTITUENTSGRAIN SIZE: VERY FINE; RANGE: VERY FINE TO COARSEGOOD INDURATIONCEMENT TYPE(S): CALCILUTITE MATRIXACCESSORY MINERALS: PHOSPHATIC SAND-01%FOSSILS: MOLLUSKS
735 - 764 WACKESTONE; WHITE TO DARK GRAYISH YELLOW12% POROSITY: LOW PERMEABILITY, INTERGRANULAR, VUGULARGRAIN TYPE: CALCILUTITE, SKELETAL12% ALLOCHEMICAL CONSTITUENTSGRAIN SIZE: VERY FINE; RANGE: VERY FINE TO COARSEGOOD INDURATIONCEMENT TYPE(S): CALCILUTITE MATRIXACCESSORY MINERALS: DOLOMITE-15%, PHOSPHATIC SAND-01%VUGGY EUHEDRAL DOLOSTONE EXISTS AS SEPARATE FRAGMENTS
FROMCALCILUTITE
B-5

Appendix B Hydrogeologic Investigation - I-75 Canal Site
764 - 777 PACKSTONE; VERY LIGHT ORANGE TO YELLOWISH GRAY12% POROSITY: LOW PERMEABILITY, INTERGRANULARGRAIN TYPE: CALCILUTITE, SKELETAL70% ALLOCHEMICAL CONSTITUENTSGRAIN SIZE: MEDIUM; RANGE: VERY FINE TO COARSEGOOD INDURATIONCEMENT TYPE(S): CALCILUTITE MATRIXFOSSILS: MOLLUSKSGASTROPODS. SOME PARTIAL RECRYSTALLIZATION OBSERVABLE
777 - 806 MUDSTONE; WHITE TO PINKISH GRAYPOROSITY: LOW PERMEABILITY, INTERGRANULARGRAIN TYPE: CALCILUTITE, CRYSTALS05% ALLOCHEMICAL CONSTITUENTSGRAIN SIZE: VERY FINE; RANGE: VERY FINE TO COARSEMODERATE INDURATIONCEMENT TYPE(S): CALCILUTITE MATRIXFOSSILS: MOLLUSKS
806 - 860 WACKESTONE; VERY LIGHT ORANGE TO WHITE12% POROSITY: LOW PERMEABILITY, INTERGRANULARGRAIN TYPE: CALCILUTITE, SKELETAL30% ALLOCHEMICAL CONSTITUENTSGRAIN SIZE: VERY FINE; RANGE: VERY FINE TO COARSEMODERATE INDURATIONCEMENT TYPE(S): CALCILUTITE MATRIXFOSSILS: MOLLUSKSGASTROPODS. ABOUT 80% RECRYSTALLIZED
860 - 912 PACKSTONE; VERY LIGHT ORANGE TO WHITE12% POROSITY: LOW PERMEABILITY, INTERGRANULARGRAIN TYPE: CALCILUTITE, SKELETAL, CRYSTALS80% ALLOCHEMICAL CONSTITUENTSGRAIN SIZE: COARSE; RANGE: VERY FINE TO COARSEMODERATE INDURATIONCEMENT TYPE(S): CALCILUTITE MATRIXFOSSILS: MOLLUSKSDOMINANTLY PELOIDS. ABOUT 90% RECRYSTALLIZED
912 - 996 PACKSTONE; GRAYISH ORANGE TO VERY LIGHT ORANGE15% POROSITY: LOW PERMEABILITY, INTERGRANULARGRAIN TYPE: CALCILUTITE, SKELETAL70% ALLOCHEMICAL CONSTITUENTSGRAIN SIZE: COARSE; RANGE: VERY FINE TO COARSEMODERATE INDURATIONCEMENT TYPE(S): CALCILUTITE MATRIXFOSSILS: MOLLUSKSABOUT 30% RECRYSTALLIZED
996 - 1030 WACKESTONE; VERY LIGHT ORANGE TO YELLOWISH GRAY11% POROSITY: LOW PERMEABILITY, INTERGRANULAR, VUGULARGRAIN TYPE: CALCILUTITE, SKELETAL40% ALLOCHEMICAL CONSTITUENTSGRAIN SIZE: VERY FINE; RANGE: VERY FINE TO COARSEGOOD INDURATIONCEMENT TYPE(S): CALCILUTITE MATRIXFOSSILS: BENTHIC FORAMINIFERA, MOLLUSKSABOUT 90% RECRYSTALLIZED
B-6

Hydrogeologic Investigation - I-75 Canal Site Appendix B
1030 - 1033 GRAINSTONE; DARK GRAYISH YELLOW TO WHITE17% POROSITY: INTERGRANULAR, POSSIBLY HIGH PERMEABILITYGRAIN TYPE: CALCILUTITE, SKELETAL, CRYSTALS95% ALLOCHEMICAL CONSTITUENTSGRAIN SIZE: COARSE; RANGE: VERY FINE TO COARSEGOOD INDURATIONCEMENT TYPE(S): CALCILUTITE MATRIXFOSSILS: BENTHIC FORAMINIFERA, MOLLUSKSGASTROPODS. ABOUT 95% RECRYSTALLIZED. PELOIDS ANDFORAMINIFERA. IDENTIFICATION OF TYPES OF FORAMINIFERAINDETERMINATE
1033 - 1040 PACKSTONE; WHITE TO VERY LIGHT ORANGE14% POROSITY: LOW PERMEABILITY, INTERGRANULARGRAIN TYPE: CALCILUTITE, SKELETAL65% ALLOCHEMICAL CONSTITUENTSGRAIN SIZE: COARSE; RANGE: VERY FINE TO COARSEGOOD INDURATIONCEMENT TYPE(S): CALCILUTITE MATRIXTHIS SAMPLE CONSISTS OF ABOVE UNIT (1030-1033 FEET) AND AMATRIX-SUPPORTED UNIT (PARTIALLY RECRYSTALLIZED)
CONTAINING FORAMINIFERA AND PELOIDS
1040 - 1045 WACKESTONE; WHITE TO VERY LIGHT ORANGE10% POROSITY: LOW PERMEABILITY, INTERGRANULARGRAIN TYPE: CALCILUTITE, SKELETAL35% ALLOCHEMICAL CONSTITUENTSGRAIN SIZE: VERY FINE; RANGE: VERY FINE TO COARSEGOOD INDURATIONCEMENT TYPE(S): CALCILUTITE MATRIXFOSSILS: MOLLUSKS, CORALGASTROPODS
1045 - 1060 WACKESTONE; VERY LIGHT ORANGE TO WHITE15% POROSITY: LOW PERMEABILITY, INTERGRANULARGRAIN TYPE: CALCILUTITE, SKELETAL15% ALLOCHEMICAL CONSTITUENTSGRAIN SIZE: VERY FINE; RANGE: VERY FINE TO COARSEMODERATE INDURATIONCEMENT TYPE(S): CALCILUTITE MATRIXFOSSILS: MOLLUSKS
1060 - 1070 MUDSTONE; YELLOWISH GRAY TO WHITEPOROSITY: LOW PERMEABILITY, INTERGRANULARGRAIN TYPE: CALCILUTITE, SKELETAL05% ALLOCHEMICAL CONSTITUENTSGRAIN SIZE: VERY FINE; RANGE: VERY FINE TO COARSEMODERATE INDURATIONCEMENT TYPE(S): CALCILUTITE MATRIXFOSSILS: MOLLUSKS
1070 - 1073 MUDSTONE; WHITE TO VERY LIGHT ORANGEPOROSITY: LOW PERMEABILITY, INTERGRANULARGRAIN TYPE: CALCILUTITE, SKELETAL05% ALLOCHEMICAL CONSTITUENTSGRAIN SIZE: VERY FINE; RANGE: VERY FINE TO COARSEMODERATE INDURATIONCEMENT TYPE(S): CALCILUTITE MATRIXFOSSILS: MOLLUSKS
B-7

Appendix B Hydrogeologic Investigation - I-75 Canal Site
1073 - 1092 MUDSTONE; VERY LIGHT ORANGE TO WHITEPOROSITY: LOW PERMEABILITY, INTERGRANULARGRAIN TYPE: CALCILUTITE, SKELETAL03% ALLOCHEMICAL CONSTITUENTSGRAIN SIZE: VERY FINE; RANGE: VERY FINE TO COARSEMODERATE INDURATIONCEMENT TYPE(S): CALCILUTITE MATRIXFOSSILS: MOLLUSKS
1092 - 1122 PACKSTONE; YELLOWISH GRAY TO WHITE15% POROSITY: LOW PERMEABILITY, INTERGRANULARGRAIN TYPE: CALCILUTITE, SKELETAL, BIOGENIC85% ALLOCHEMICAL CONSTITUENTSGRAIN SIZE: MEDIUM; RANGE: VERY FINE TO COARSEMODERATE INDURATIONCEMENT TYPE(S): CALCILUTITE MATRIXFOSSILS: MOLLUSKS, BENTHIC FORAMINIFERAEXTENSIVE RECRYSTALLIZATION (95%). SKELETAL FRAGMENTS OFMOLLUSKS, FORAMINIFERA AND PELOIDS.
1122 - 1126 SAND; VERY LIGHT ORANGE30% POROSITY: INTERGRANULAR, POSSIBLY HIGH PERMEABILITYGRAIN SIZE: MEDIUM; RANGE: VERY FINE TO MEDIUMHIGH SPHERICITY; UNCONSOLIDATEDTHIS SAMPLE IS DOMINANTLY MEDIUM-GRAINED SAND.
1126 - 1173 PACKSTONE; YELLOWISH GRAY TO WHITE12% POROSITY: LOW PERMEABILITY, INTERGRANULARGRAIN TYPE: CALCILUTITE, SKELETAL60% ALLOCHEMICAL CONSTITUENTSGRAIN SIZE: COARSE; RANGE: VERY FINE TO VERY COARSEGOOD INDURATIONCEMENT TYPE(S): CALCILUTITE MATRIXDICTYOCONUS (FIRST OCCURRENCE). POSSIBLE OLIGOCENESUWANNEE LIMESTONE. GASTROPODS
1173 - 1195 MUDSTONE; VERY LIGHT ORANGE15% POROSITY: LOW PERMEABILITY, INTERGRANULARGRAIN TYPE: CALCILUTITE, SKELETAL05% ALLOCHEMICAL CONSTITUENTSGRAIN SIZE: VERY FINE; RANGE: VERY FINE TO COARSEMODERATE INDURATIONCEMENT TYPE(S): CALCILUTITE MATRIX
1195 - 1204 WACKESTONE; VERY LIGHT ORANGE TO WHITE10% POROSITY: LOW PERMEABILITY, INTERGRANULARGRAIN TYPE: CALCILUTITE, SKELETAL05% ALLOCHEMICAL CONSTITUENTSGRAIN SIZE: VERY FINE; RANGE: VERY FINE TO COARSEMODERATE INDURATIONCEMENT TYPE(S): CALCILUTITE MATRIXABOUT 80% RECRYSTALLIZED
1204 - 1207 DOLOSTONE; OLIVE GRAY TO LIGHT OLIVE GRAY10% POROSITY: LOW PERMEABILITY, INTERGRANULAR90-100% ALTERED; ANHEDRALGRAIN SIZE: FINE; RANGE: VERY FINE TO FINEGOOD INDURATION
B-8

Hydrogeologic Investigation - I-75 Canal Site Appendix B
CEMENT TYPE(S): DOLOMITE CEMENTACCESSORY MINERALS: CALCILUTITE-05%FOSSILS: ALGAECALCILUTITE AND DOLOSTONE EXIST AS SEPARATE FRAGMENTS
1207 - 1227 DOLOSTONE; YELLOWISH GRAY10% POROSITY: LOW PERMEABILITY, INTERGRANULAR, VUGULAR90-100% ALTERED; EUHEDRALGRAIN SIZE: FINE; RANGE: VERY FINE TO FINEGOOD INDURATIONCEMENT TYPE(S): DOLOMITE CEMENTACCESSORY MINERALS: CALCILUTITE-02%MINOR REMNANT CALCILUTITE. MINOR VUGS, LINED WITH
EUHEDRAL DOLOMITE RHOMBS
1227 - 1231 DOLOSTONE; MODERATE LIGHT GRAY10% POROSITY: LOW PERMEABILITY, INTERGRANULAR90-100% ALTERED; EUHEDRALGRAIN SIZE: FINE; RANGE: VERY FINE TO FINEGOOD INDURATIONCEMENT TYPE(S): DOLOMITE CEMENTACCESSORY MINERALS: CALCILUTITE-05%SEPARATE CALCILUTITE AND DOLOSTONE FRAGMENTS
1231 - 1267 WACKESTONE; MODERATE LIGHT GRAY TO YELLOWISH GRAY12% POROSITY: LOW PERMEABILITY, INTERGRANULARGRAIN TYPE: CALCILUTITE, SKELETAL25% ALLOCHEMICAL CONSTITUENTSGRAIN SIZE: VERY FINE; RANGE: VERY FINE TO COARSEGOOD INDURATIONCEMENT TYPE(S): CALCILUTITE MATRIXACCESSORY MINERALS: DOLOMITE-40%OTHER FEATURES: DOLOMITICFOSSILS: MOLLUSKS, ECHINOIDSEPARATE FRAGMENTS OF CALCILUTITE AND DOLOSTONE.DICTYOCONUS ABOUT 70% RECRYSTALLIZED. SOME FRAGMENTS AREHIGH IN SKELETAL MATERIAL
1267 - 1287 PACKSTONE; YELLOWISH GRAY TO WHITE15% POROSITY: LOW PERMEABILITY, INTERGRANULARGRAIN TYPE: CALCILUTITE, SKELETAL70% ALLOCHEMICAL CONSTITUENTSGRAIN SIZE: COARSE; RANGE: VERY FINE TO COARSEMODERATE INDURATIONCEMENT TYPE(S): CALCILUTITE MATRIXFOSSILS: MOLLUSKS, ECHINOID
1287 - 1299 PACKSTONE; YELLOWISH GRAY15% POROSITY: LOW PERMEABILITY, INTERGRANULARGRAIN TYPE: CALCILUTITE, SKELETAL, BIOGENIC85% ALLOCHEMICAL CONSTITUENTSGRAIN SIZE: COARSE; RANGE: VERY FINE TO COARSEMODERATE INDURATIONCEMENT TYPE(S): CALCILUTITE MATRIXDOMINANTLY PELOIDS
1299 - 1413 WACKESTONE; YELLOWISH GRAY TO MODERATE LIGHT GRAY10% POROSITY: LOW PERMEABILITY, INTERGRANULARGRAIN TYPE: CALCILUTITE, SKELETAL
B-9

Appendix B Hydrogeologic Investigation - I-75 Canal Site
40% ALLOCHEMICAL CONSTITUENTSGRAIN SIZE: COARSE; RANGE: VERY FINE TO COARSEMODERATE INDURATIONCEMENT TYPE(S): CALCILUTITE MATRIXFOSSILS: CRUSTACEA, MOLLUSKSSIMILAR TO PRECEDING LITHOLOGY, BUT BETTER INDURATED, ANDLOWER AMOUNT OF PELOIDS. GASTROPODS
1413 - 1481 WACKESTONE; YELLOWISH GRAY TO WHITE15% POROSITY: LOW PERMEABILITY, INTERGRANULARGRAIN TYPE: CALCILUTITE, SKELETAL15% ALLOCHEMICAL CONSTITUENTSGRAIN SIZE: VERY FINE; RANGE: VERY FINE TO COARSEMODERATE INDURATIONCEMENT TYPE(S): CALCILUTITE MATRIXFOSSILS: MOLLUSKS
1481 - 1483 DOLOSTONE; DARK GRAYISH YELLOW12% POROSITY: LOW PERMEABILITY, INTERCRYSTALLINE90-100% ALTERED; EUHEDRALGRAIN SIZE: MEDIUM; RANGE: VERY FINE TO MEDIUMGOOD INDURATIONCEMENT TYPE(S): DOLOMITE CEMENTACCESSORY MINERALS: CALCILUTITE-01%
1483 - 1485 MUDSTONE; VERY LIGHT ORANGE TO YELLOWISH GRAYPOROSITY: LOW PERMEABILITY, INTERGRANULARGRAIN TYPE: CALCILUTITE, SKELETAL01% ALLOCHEMICAL CONSTITUENTSGRAIN SIZE: VERY FINE; RANGE: VERY FINE TO COARSEMODERATE INDURATIONCEMENT TYPE(S): CALCILUTITE MATRIXACCESSORY MINERALS: DOLOMITE-20%FOSSILS: MOLLUSKSPARTIALLY DOLOMITIZED FRAGMENTS INTERBEDDED WITHCALCILUTITE
1485 - 1500 DOLOSTONE; GRAYISH BROWN TO MODERATE YELLOWISH BROWN13% POROSITY: LOW PERMEABILITY, INTERCRYSTALLINE, VUGULAR90-100% ALTERED; EUHEDRALGRAIN SIZE: FINE; RANGE: VERY FINE TO FINEGOOD INDURATIONCEMENT TYPE(S): DOLOMITE CEMENTACCESSORY MINERALS: CALCILUTITE-10%OTHER FEATURES: CALCAREOUSMINOR VUGS
1500 - 1527 WACKESTONE; WHITE TO GRAYISH BROWN10% POROSITY: LOW PERMEABILITY, INTERGRANULARGRAIN TYPE: CALCILUTITE, SKELETAL30% ALLOCHEMICAL CONSTITUENTSGRAIN SIZE: VERY FINE; RANGE: VERY FINE TO COARSEGOOD INDURATIONCEMENT TYPE(S): CALCILUTITE MATRIXACCESSORY MINERALS: DOLOMITE-15%OTHER FEATURES: DOLOMITICFOSSILS: MOLLUSKSSEPARATE FRAGMENTS OF DOLOSTONE AND WACKESTONE.
B-10

Hydrogeologic Investigation - I-75 Canal Site Appendix B
LEPIDOCYCLINA PRESENT. POSSIBLE TOP OF LATE EOCENE OCALALIMESTONE
1527 - 1532 MUDSTONE; YELLOWISH GRAY15% POROSITY: LOW PERMEABILITY, INTERGRANULARGRAIN TYPE: CALCILUTITE, SKELETAL01% ALLOCHEMICAL CONSTITUENTSGRAIN SIZE: VERY FINE; RANGE: VERY FINE TO COARSEMODERATE INDURATIONCEMENT TYPE(S): CALCILUTITE MATRIXFOSSILS: MOLLUSKS
1532 - 1545 MUDSTONE; WHITEPOROSITY: LOW PERMEABILITY, INTERGRANULARGRAIN TYPE: CALCILUTITE, SKELETAL01% ALLOCHEMICAL CONSTITUENTSGRAIN SIZE: VERY FINE; RANGE: VERY FINE TO COARSEGOOD INDURATIONCEMENT TYPE(S): CALCILUTITE MATRIXFOSSILS: MOLLUSKS
1545 - 1610 MUDSTONE; VERY LIGHT ORANGEPOROSITY: LOW PERMEABILITY, INTERGRANULARGRAIN TYPE: CALCILUTITE, SKELETAL05% ALLOCHEMICAL CONSTITUENTSGRAIN SIZE: VERY FINE; RANGE: VERY FINE TO COARSEMODERATE INDURATIONCEMENT TYPE(S): CALCILUTITE MATRIXFOSSILS: MOLLUSKSLEPIDOCYCLINA
1610 - 1620 WACKESTONE; VERY LIGHT ORANGE TO YELLOWISH GRAY15% POROSITY: LOW PERMEABILITY, INTERGRANULARGRAIN TYPE: CALCILUTITE, SKELETAL12% ALLOCHEMICAL CONSTITUENTSGRAIN SIZE: VERY FINE; RANGE: VERY FINE TO COARSEMODERATE INDURATIONCEMENT TYPE(S): CALCILUTITE MATRIXACCESSORY MINERALS: DOLOMITE-05%FOSSILS: MOLLUSKSCALCILUTITE-BEARING DOLOSTONE EXISTS AS SEPARATE
FRAGMENTS FROM CALCILUTE. NUMMULITES COMPRISE ABOUT 10%
OF SAMPLE.DICTYOCONUS
1620 - 1690 WACKESTONE; VERY LIGHT ORANGE15% POROSITY: LOW PERMEABILITY, INTERGRANULARGRAIN TYPE: CALCILUTITE, SKELETAL40% ALLOCHEMICAL CONSTITUENTSGRAIN SIZE: VERY FINE; RANGE: VERY FINE TO COARSEMODERATE INDURATIONCEMENT TYPE(S): CALCILUTITE MATRIXLEPIDOCYCLINA
1690 - 1747 PACKSTONE; YELLOWISH GRAY15% POROSITY: LOW PERMEABILITY, INTERGRANULARGRAIN TYPE: CALCILUTITE, SKELETAL85% ALLOCHEMICAL CONSTITUENTSGRAIN SIZE: COARSE; RANGE: VERY FINE TO COARSEMODERATE INDURATION
B-11

Appendix B Hydrogeologic Investigation - I-75 Canal Site
CEMENT TYPE(S): CALCILUTITE MATRIXNUMMULITES DOMINATE. LEPIDOCYCLINA
1747 - 1777 WACKESTONE; YELLOWISH GRAY10% POROSITY: LOW PERMEABILITY, INTERGRANULARGRAIN TYPE: CALCILUTITE, SKELETAL20% ALLOCHEMICAL CONSTITUENTSGRAIN SIZE: VERY FINE; RANGE: VERY FINE TO COARSEGOOD INDURATIONCEMENT TYPE(S): CALCILUTITE MATRIXFOSSILS: MOLLUSKSNUMMULITES MINOR (1%)
1777 - 1795 PACKSTONE; YELLOWISH GRAY TO WHITE10% POROSITY: LOW PERMEABILITY, INTERGRANULARGRAIN TYPE: CALCILUTITE, SKELETAL60% ALLOCHEMICAL CONSTITUENTSGRAIN SIZE: COARSE; RANGE: VERY FINE TO COARSEGOOD INDURATIONCEMENT TYPE(S): CALCILUTITE MATRIXFOSSILS: CORAL, MOLLUSKSNUMMULITES
1795 - 1796 NO SAMPLES
1796 - 1800 WACKESTONE; DARK GRAYISH YELLOW15% POROSITY: LOW PERMEABILITY, INTERCRYSTALLINEGRAIN TYPE: CALCILUTITE, SKELETAL15% ALLOCHEMICAL CONSTITUENTSGRAIN SIZE: VERY FINE; RANGE: VERY FINE TO COARSEMODERATE INDURATIONCEMENT TYPE(S): CALCILUTITE MATRIXFOSSILS: MOLLUSKS, ECHINOIDSAMPLE CONSISTS OF DOMINANTLY RECRYSTALLIZED CALCITEFRAGMENTS, WITH SOME CALCILUTITE. EXTENSIVE SKELETALFRAGMENTS FLOAT IN THIS MATRIX.
1800 - 1864 PACKSTONE; YELLOWISH GRAY15% POROSITY: LOW PERMEABILITY, INTERGRANULARGRAIN TYPE: CALCILUTITE, SKELETAL65% ALLOCHEMICAL CONSTITUENTSGRAIN SIZE: COARSE; RANGE: VERY FINE TO COARSEMODERATE INDURATIONCEMENT TYPE(S): CALCILUTITE MATRIXFOSSILS: MOLLUSKS, BENTHIC FORAMINIFERA, SPICULESSOME RECRYSTALLIZATION (APPROXIMATELY 15%). MANY SKELETAL
FRAGMENTS. IDENTITY UNCLEAR. DICTYOCONUS AMERICANUS.POSSIBLE TOP OF MIDDLE EOCENE AVON PARK FORMATION
1864 - 1876 WACKESTONE; GRAYISH ORANGE TO WHITE15% POROSITY: LOW PERMEABILITY, INTERGRANULARGRAIN TYPE: CALCILUTITE, SKELETAL, CRYSTALS35% ALLOCHEMICAL CONSTITUENTSGRAIN SIZE: VERY FINE; RANGE: VERY FINE TO COARSEMODERATE INDURATIONCEMENT TYPE(S): CALCILUTITE MATRIXFOSSILS: MOLLUSKS, BENTHIC FORAMINIFERAEXTENSIVE RECRYSTALLIZATION. MATRIX-SUPPORTED FRAGMENTSWITH RECRYSTALLIZED CALCITE AND REMNANT CALCILUTITE (15%)
B-12
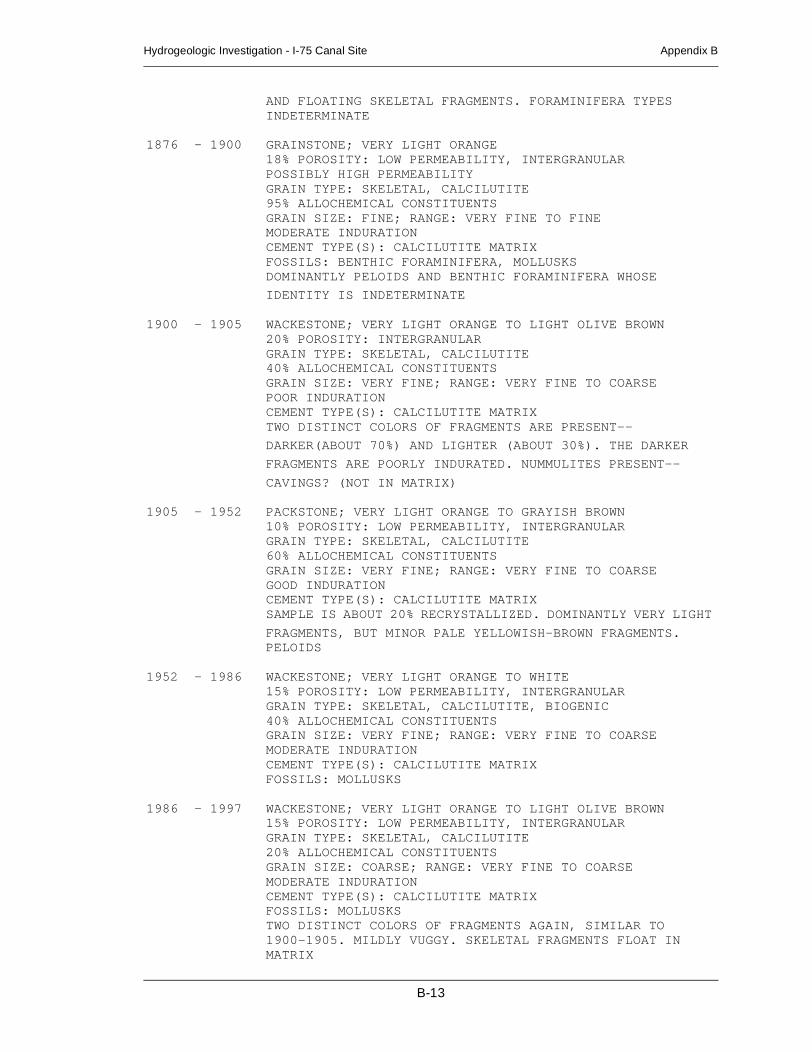
Hydrogeologic Investigation - I-75 Canal Site Appendix B
AND FLOATING SKELETAL FRAGMENTS. FORAMINIFERA TYPESINDETERMINATE
1876 - 1900 GRAINSTONE; VERY LIGHT ORANGE18% POROSITY: LOW PERMEABILITY, INTERGRANULARPOSSIBLY HIGH PERMEABILITYGRAIN TYPE: SKELETAL, CALCILUTITE95% ALLOCHEMICAL CONSTITUENTSGRAIN SIZE: FINE; RANGE: VERY FINE TO FINEMODERATE INDURATIONCEMENT TYPE(S): CALCILUTITE MATRIXFOSSILS: BENTHIC FORAMINIFERA, MOLLUSKSDOMINANTLY PELOIDS AND BENTHIC FORAMINIFERA WHOSE
IDENTITY IS INDETERMINATE
1900 - 1905 WACKESTONE; VERY LIGHT ORANGE TO LIGHT OLIVE BROWN20% POROSITY: INTERGRANULARGRAIN TYPE: SKELETAL, CALCILUTITE40% ALLOCHEMICAL CONSTITUENTSGRAIN SIZE: VERY FINE; RANGE: VERY FINE TO COARSEPOOR INDURATIONCEMENT TYPE(S): CALCILUTITE MATRIXTWO DISTINCT COLORS OF FRAGMENTS ARE PRESENT--
DARKER(ABOUT 70%) AND LIGHTER (ABOUT 30%). THE DARKER
FRAGMENTS ARE POORLY INDURATED. NUMMULITES PRESENT--
CAVINGS? (NOT IN MATRIX)
1905 - 1952 PACKSTONE; VERY LIGHT ORANGE TO GRAYISH BROWN10% POROSITY: LOW PERMEABILITY, INTERGRANULARGRAIN TYPE: SKELETAL, CALCILUTITE60% ALLOCHEMICAL CONSTITUENTSGRAIN SIZE: VERY FINE; RANGE: VERY FINE TO COARSEGOOD INDURATIONCEMENT TYPE(S): CALCILUTITE MATRIXSAMPLE IS ABOUT 20% RECRYSTALLIZED. DOMINANTLY VERY LIGHT
FRAGMENTS, BUT MINOR PALE YELLOWISH-BROWN FRAGMENTS.PELOIDS
1952 - 1986 WACKESTONE; VERY LIGHT ORANGE TO WHITE15% POROSITY: LOW PERMEABILITY, INTERGRANULARGRAIN TYPE: SKELETAL, CALCILUTITE, BIOGENIC40% ALLOCHEMICAL CONSTITUENTSGRAIN SIZE: VERY FINE; RANGE: VERY FINE TO COARSEMODERATE INDURATIONCEMENT TYPE(S): CALCILUTITE MATRIXFOSSILS: MOLLUSKS
1986 - 1997 WACKESTONE; VERY LIGHT ORANGE TO LIGHT OLIVE BROWN15% POROSITY: LOW PERMEABILITY, INTERGRANULARGRAIN TYPE: SKELETAL, CALCILUTITE20% ALLOCHEMICAL CONSTITUENTSGRAIN SIZE: COARSE; RANGE: VERY FINE TO COARSEMODERATE INDURATIONCEMENT TYPE(S): CALCILUTITE MATRIXFOSSILS: MOLLUSKSTWO DISTINCT COLORS OF FRAGMENTS AGAIN, SIMILAR TO1900-1905. MILDLY VUGGY. SKELETAL FRAGMENTS FLOAT INMATRIX
B-13

Appendix B Hydrogeologic Investigation - I-75 Canal Site
1997 - 2084 WACKESTONE; YELLOWISH GRAY TO WHITE15% POROSITY: LOW PERMEABILITY, INTERGRANULARGRAIN TYPE: SKELETAL, CALCILUTITE30% ALLOCHEMICAL CONSTITUENTSGRAIN SIZE: COARSE; RANGE: VERY FINE TO COARSEMODERATE INDURATIONCEMENT TYPE(S): CALCILUTITE MATRIXFOSSILS: MOLLUSKS
2084 - 2127 WACKESTONE; VERY LIGHT ORANGE13% POROSITY: LOW PERMEABILITY, INTERGRANULARGRAIN TYPE: SKELETAL, CALCILUTITE, BIOGENIC40% ALLOCHEMICAL CONSTITUENTSGRAIN SIZE: COARSE; RANGE: VERY FINE TO COARSEMODERATE INDURATIONCEMENT TYPE(S): CALCILUTITE MATRIXFOSSILS: MOLLUSKSPELOIDS, MOST OF WHICH HAVE BEEN RECRYSTALLIZED
2127 - 2155 WACKESTONE; GRAYISH YELLOW10% POROSITY: LOW PERMEABILITY, INTERGRANULARGRAIN TYPE: CALCILUTITE, BIOGENIC30% ALLOCHEMICAL CONSTITUENTSGRAIN SIZE: COARSE; RANGE: VERY FINE TO COARSEGOOD INDURATIONCEMENT TYPE(S): CALCILUTITE MATRIX
2155 - 2185 WACKESTONE; YELLOWISH GRAY TO LIGHT OLIVE GRAY13% POROSITY: LOW PERMEABILITY, INTERGRANULARGRAIN TYPE: CALCILUTITE, SKELETAL, BIOGENIC35% ALLOCHEMICAL CONSTITUENTSGRAIN SIZE: VERY FINE; RANGE: VERY FINE TO COARSEMODERATE INDURATIONCEMENT TYPE(S): CALCILUTITE MATRIXDICTYOCONUS
2185 - 2189 DOLOSTONE; OLIVE GRAY TO WHITE17% POROSITY: LOW PERMEABILITY, INTERCRYSTALLINE, VUGULAR50-90% ALTERED; ANHEDRALGRAIN SIZE: MEDIUM; RANGE: VERY FINE TO MEDIUMGOOD INDURATIONCEMENT TYPE(S): DOLOMITE CEMENTACCESSORY MINERALS: CALCILUTITE-15%OTHER FEATURES: CALCAREOUSFOSSILS: BENTHIC FORAMINIFERADOLOSTONE WITH REMNANT SKELETAL CALCITE FRAGMENTS AND
SOME CALCILUTITE FRAGMENTS. DOLOSTONE IS EXTENSIVELY
VUGGY.DOMINANTLY ANHEDRAL AND SUBHEDRAL, BUT EUHEDRAL CRYSTALSARE FOUND AS VUG LINERS AND DOMINATING A FEW PARTICULARAREAS
2189 - 2210 DOLOSTONE; OLIVE GRAY TO WHITE12% POROSITY: LOW PERMEABILITY, INTERCRYSTALLINE50-90% ALTERED; SUBHEDRALGRAIN SIZE: FINE; RANGE: VERY FINE TO FINEGOOD INDURATIONCEMENT TYPE(S): DOLOMITE CEMENT, CALCILUTITE MATRIX
B-14

Hydrogeologic Investigation - I-75 Canal Site Appendix B
ACCESSORY MINERALS: CALCILUTITE-35%OTHER FEATURES: CALCAREOUSPELOIDS AND REMNANT FORAMINIFERA. DIFFICULT TO DETERMINETHE IDENTITY OF THE FORAMINIFERA. CALCILUTITE ISINTERBEDDED WITH DOLOSTONE
2210 - 2213 DOLOSTONE; OLIVE GRAY TO WHITE12% POROSITY: LOW PERMEABILITY, INTERCRYSTALLINE50-90% ALTERED; SUBHEDRALGRAIN SIZE: FINE; RANGE: VERY FINE TO FINEGOOD INDURATIONCEMENT TYPE(S): DOLOMITE CEMENT, CALCILUTITE MATRIXACCESSORY MINERALS: CALCILUTITE-35%OTHER FEATURES: CALCAREOUSWHICH RESEMBLES THAT SEEN FROM 2185 TO 2189 FEET. ABOUT90% OF DOLOSTONE IS SUBHEDRAL AND 10% IS EUHEDRAL
2213 - 2215 DOLOSTONE; MODERATE YELLOWISH BROWN TO LIGHT OLIVE GRAY10% POROSITY: LOW PERMEABILITY, INTERCRYSTALLINE90-100% ALTERED; SUBHEDRALGRAIN SIZE: MEDIUM; RANGE: VERY FINE TO MEDIUMGOOD INDURATIONCEMENT TYPE(S): DOLOMITE CEMENT, CALCILUTITE MATRIXACCESSORY MINERALS: CALCILUTITE-01%APPROXIMATELY 35% EUHEDRAL CRYSTALS, AND 65% SUBHEDRAL.EUHEDRAL CRYSTALS DOMINATE CERTAIN AREAS ON THE SAMPLE,
AND LINE VUGS
2215 - 2222 DOLOSTONE; LIGHT OLIVE GRAY TO MODERATE YELLOWISH BROWN10% POROSITY: LOW PERMEABILITY, INTERCRYSTALLINE90-100% ALTERED; EUHEDRALGRAIN SIZE: MEDIUM; RANGE: VERY FINE TO MEDIUMGOOD INDURATIONCEMENT TYPE(S): DOLOMITE CEMENTACCESSORY MINERALS: SHELL-%DOMINANTLY LARGE FRAGMENTS WITH SMOOTH FACES. POSSIBLE“FRACTURE ZONE” EUHEDRAL CRYSTALS ON FRACTURE SURFACES
2222 - 2235 DOLOSTONE; LIGHT BROWNISH GRAY10% POROSITY: LOW PERMEABILITY, INTERCRYSTALLINE90-100% ALTERED; SUBHEDRALGRAIN SIZE: FINE; RANGE: VERY FINE TO MEDIUMGOOD INDURATIONCEMENT TYPE(S): DOLOMITE CEMENTACCESSORY MINERALS: SHELL-%MOSTLY LARGE FRAGMENTS WITH ALMOST ALL SMOOTHFACES--POSSIBLE “FRACTURE ZONE” ROCK. MOST FRACTURESURFACES DISPLAY FINE-GRAINED SUBHEDRAL AND ANHEDRALCRYSTLAS, BUT MEDIUM-GRAINED EUHEDRAL RHOMBS DOMINATE A
FEW FACES OF THE ROCK
2235 - 2242 DOLOSTONE; LIGHT OLIVE GRAY TO MODERATE YELLOWISH BROWN10% POROSITY: LOW PERMEABILITY, INTERCRYSTALLINE90-100% ALTERED; SUBHEDRALGRAIN SIZE: FINE; RANGE: VERY FINE TO MEDIUMGOOD INDURATIONCEMENT TYPE(S): DOLOMITE CEMENTEXTENSIVE VUGS WHICH ARE LINED WITH EUHEDRAL CRYSTALS.EUHEDRAL CRYSTALS ARE ALSO FOUND ALONG SMOOTH SURFACES
B-15

Appendix B Hydrogeologic Investigation - I-75 Canal Site
WHICH ARE LESS DOMINANT THAN IN ABOVE SAMPLE
2242 - 2244 DOLOSTONE; MODERATE LIGHT GRAY TO DARK GRAYISH YELLOW12% POROSITY: LOW PERMEABILITY, INTERCRYSTALLINE, VUGULAR90-100% ALTERED; SUBHEDRALGRAIN SIZE: FINE; RANGE: VERY FINE TO MEDIUMGOOD INDURATIONCEMENT TYPE(S): DOLOMITE CEMENTSTILL DOMINANTLY LARGE FRACTURES WITH SMOOTH FACES. SOMEFACES HAVE EUHEDRAL DOLOMITE CRYSTALS (FRACTURE FILL)
2244 - 2249 DOLOSTONE; MODERATE LIGHT GRAY TO GRAYISH OLIVE12% POROSITY: LOW PERMEABILITY, INTERCRYSTALLINE, VUGULAR90-100% ALTERED; SUBHEDRALGRAIN SIZE: FINE; RANGE: VERY FINE TO MEDIUMGOOD INDURATIONCEMENT TYPE(S): DOLOMITE CEMENTACCESSORY MINERALS: CALCILUTITE-08%CALCILUTITE AND DOLOSTONE EXIST AS SEPARATE FRAGMENTS.ABOUT 15% EUHEDRAL CRYSTALS
2249 - 2265 WACKESTONE; VERY LIGHT ORANGE TO DARK YELLOWISH BROWN15% POROSITY: LOW PERMEABILITY, INTERGRANULARGRAIN TYPE: CALCILUTITE, SKELETAL30% ALLOCHEMICAL CONSTITUENTSGRAIN SIZE: COARSE; RANGE: VERY FINE TO COARSEMODERATE INDURATIONCEMENT TYPE(S): CALCILUTITE MATRIXACCESSORY MINERALS: DOLOMITE-10%OTHER FEATURES: DOLOMITICFRAGMENTS OF VERY PALE ORANGE MATRIX WITH UNIDENTIFIABLECOARSE-GRAINED WHITE ALLOCHEMS FLOATING IN THEM.
DOLOSTONEAND CALCILUTITE EXIST AS SEPARATE FRAGMENTS. SOME OF THEDOLOSTONE FRAGMENTS HAVE THESE PALER FRAGMENTS FLOATING
IN THEM. 20% OF
2265 - 2271 DOLOSTONE; LIGHT GRAY TO WHITE10% POROSITY: LOW PERMEABILITY, INTERGRANULAR50-90% ALTERED; EUHEDRALGRAIN SIZE: FINE; RANGE: VERY FINE TO MEDIUMGOOD INDURATIONCEMENT TYPE(S): CALCILUTITE MATRIXACCESSORY MINERALS: CALCILUTITE-35%, GYPSUM-05%CALCILUTITE IS PRESENT AS REMNANT SPOTS IN DOLOSTONE, ANDAS SEPARATE FRAGMENTS
2271 - 2277 DOLOSTONE; OLIVE GRAY TO WHITE12% POROSITY: LOW PERMEABILITY, INTERCRYSTALLINE, VUGULAR50-90% ALTERED; EUHEDRALGRAIN SIZE: FINE; RANGE: VERY FINE TO MEDIUMGOOD INDURATIONCEMENT TYPE(S): CALCILUTITE MATRIXACCESSORY MINERALS: CALCILUTITE-15%, GYPSUM-03%SIMILAR TO ABOVE DESCRIPTION. ABOUT 40% OF DOLOSTONE ISSUBHEDRAL
2277 - 2298 LIMESTONE; YELLOWISH GRAY12% POROSITY: LOW PERMEABILITY, INTERGRANULAR, VUGULAR
B-16

Hydrogeologic Investigation - I-75 Canal Site Appendix B
GRAIN TYPE: CRYSTALS, CALCILUTITEGRAIN SIZE: VERY FINE; GOOD INDURATIONCEMENT TYPE(S): CALCILUTITE MATRIXACCESSORY MINERALS: DOLOMITE-15%ABOUT 35% OF SAMPLES ARE DOLOSTONE WITH LARGE PATCHES OFCALCILUTITE. ABOUT 65% OF FRAGMENTS ARE FAIRLY PURECALCILUTITE. RECRYSTALLIZATION MAKES IT DIFFICULT TOESTIMATE ALLOCHEMICAL PERCENTAGE. BOTH LITHOLOGIES AREVUGGY.
2298 - 2302 LIMESTONE; VERY LIGHT ORANGE11% POROSITY: LOW PERMEABILITY, INTERGRANULAR, VUGULARGRAIN TYPE: CRYSTALS, CALCILUTITEGRAIN SIZE: VERY FINE; GOOD INDURATIONCEMENT TYPE(S): CALCILUTITE MATRIXACCESSORY MINERALS: DOLOMITE-01%EXTENSIVE RECRYSTALLIZATION (70%) LIMESTONE. AGAINDIFFICULT TO ESTIMATE PERCENTAGE OF ALLOCHEMICALCONSTITUENTS
2302 - 2323 LIMESTONE; VERY LIGHT ORANGE11% POROSITY: LOW PERMEABILITY, INTERGRANULAR, VUGULARGRAIN TYPE: CRYSTALS, CALCILUTITEGRAIN SIZE: VERY FINE; GOOD INDURATIONCEMENT TYPE(S): CALCILUTITE MATRIXACCESSORY MINERALS: DOLOMITE-07%OTHER FEATURES: DOLOMITICSEPARATE FRAGMENTS OF CALCILUTITE AND DOLOSTONE WITHCALCILUTITE
2323 - 2329 DOLOSTONE; MODERATE DARK GRAY TO MODERATE YELLOWISH BROWN12% POROSITY: LOW PERMEABILITY, INTERCRYSTALLINE90-100% ALTERED; SUBHEDRALGRAIN SIZE: FINE; RANGE: VERY FINE TO MEDIUMGOOD INDURATIONCEMENT TYPE(S): DOLOMITE CEMENTACCESSORY MINERALS: CALCILUTITE-03%CALCILUTITE EXISTS AS REMNANT AMONG DOLOSTONE. DOMINANTLY
SUBHEDRAL CRYSTALS, BUT EUHEDRAL CRYSTALS ARE FOUND
LINING VUGS AND CERTAIN SURFACES ON FRAGMENTS
2329 - 2331 DOLOSTONE; MODERATE LIGHT GRAY TO YELLOWISH GRAY13% POROSITY: LOW PERMEABILITY, INTERGRANULARINTERCRYSTALLINE; 50-90% ALTERED; SUBHEDRALGRAIN SIZE: FINE; RANGE: VERY FINE TO MEDIUMGOOD INDURATIONCEMENT TYPE(S): DOLOMITE CEMENT, CALCILUTITE MATRIXACCESSORY MINERALS: CALCILUTITE-30%DOLOSTONE EXISTS AS SEPARATE FRAGMENTS FROM PARTIALLYDOLOMITIC LIMESTONE, AND NONDOLOMITIC LIMESTONE
2331 - 2337 DOLOSTONE; MODERATE YELLOWISH BROWN TO MODERATE GRAY13% POROSITY: LOW PERMEABILITY, INTERCRYSTALLINE, VUGULAR90-100% ALTERED; SUBHEDRALGRAIN SIZE: FINE; RANGE: VERY FINE TO MEDIUMGOOD INDURATIONCEMENT TYPE(S): DOLOMITE CEMENT, CALCILUTITE MATRIXACCESSORY MINERALS: CALCILUTITE-01%DOMINANTLY SUBHEDRAL CRYSTALS, BUT ABOUT 35% EUHEDRAL
B-17

Appendix B Hydrogeologic Investigation - I-75 Canal Site
RHOMBS FOUND AS VUG LINERS, AND CONCENTRATED IN CERTAINAREAS
2337 - 2352 DOLOSTONE; GRAYISH BROWN12% POROSITY: LOW PERMEABILITY, INTERCRYSTALLINE90-100% ALTERED; ANHEDRALGRAIN SIZE: FINE; RANGE: VERY FINE TO MEDIUMGOOD INDURATIONCEMENT TYPE(S): DOLOMITE CEMENTMINOR CALCILUTITE EXIST AS SEPARATE FRAGMENTS FROMDOLOSTONE. DOMINANTLY ANHEDRAL. MINOR AREAS (15%) OFEUHEDRAL AND SUBHEDRAL CRYSTALS. EUHEDRAL RHOMBS DOMINATE
SOME SURFACES
2352 - 2392 DOLOSTONE; DARK YELLOWISH BROWN TO MODERATE YELLOWISH
BROWNLX% POROSITY: VUGULAR; 90-100% ALTERED; SUBHEDRALGRAIN SIZE: FINE; RANGE: VERY FINE TO MEDIUMGOOD INDURATIONCEMENT TYPE(S): DOLOMITE CEMENTDOLOMITE RHOMBS (ABOUT 30%) EXIST AS VUG LINERS AND ALONGSURFACES.
2392 - 2412 WACKESTONE; YELLOWISH GRAY TO MODERATE LIGHT GRAY10% POROSITY: LOW PERMEABILITY, INTERGRANULARGRAIN TYPE: CALCILUTITE, BIOGENIC30% ALLOCHEMICAL CONSTITUENTSGRAIN SIZE: VERY FINE; RANGE: VERY FINE TO FINEGOOD INDURATIONCEMENT TYPE(S): CALCILUTITE MATRIXACCESSORY MINERALS: DOLOMITE-35%OTHER FEATURES: DOLOMITIC CALCILUTITE AND DOLOSTONE EXIST
AS SEPARATE FRAGMENTS.DOLOSTONE IS VUGGY--SIMILAR IN APPEARANCE TO THAT FOUNDBETWEEN 2350 AND 2392 FEET
2412 - 2422 DOLOSTONE; MODERATE GRAY TO MODERATE YELLOWISH BROWN11% POROSITY: LOW PERMEABILITY, INTERCRYSTALLINE, VUGULAR90-100% ALTERED; SUBHEDRALGRAIN SIZE: FINE; RANGE: VERY FINE TO MEDIUMGOOD INDURATIONCEMENT TYPE(S): DOLOMITE CEMENT, CALCILUTITE MATRIXACCESSORY MINERALS: CALCILUTITE-02%ABOUT 70% SUBHEDRAL FINE-GRAINED DOLOMITE CRYSTALS, ANDABOUT 28% MEDIUM-SIZED EUHEDRAL RHOMBS
2422 - 2432 CALCILUTITE; VERY LIGHT ORANGE TO MODERATE DARK GRAY14% POROSITY: LOW PERMEABILITY, INTERGRANULARINTERCRYSTALLINEGRAIN TYPE: CALCILUTITE, BIOGENIC01% ALLOCHEMICAL CONSTITUENTSGRAIN SIZE: VERY FINE; RANGE: VERY FINE TO FINEGOOD INDURATIONCEMENT TYPE(S): CALCILUTITE MATRIX, DOLOMITE CEMENTACCESSORY MINERALS: DOLOMITE-35%A MIX OF PARTIALLY DOLOMITIZED FRAGMENTS (30%), ALMOSTENTIRELY DOLOMITIZED FRAGMENTS (10%), AND CALCILUTITEFRAGMENTS (70%). THE CALCILUTITE IS MODERATELY INDURATED
B-18

Hydrogeologic Investigation - I-75 Canal Site Appendix B
WHILE THE DOLOSTONE IS WELL-INDURATED
2432 - 2434 DOLOSTONE; MODERATE DARK GRAY TO WHITE12% POROSITY: LOW PERMEABILITY, INTERCRYSTALLINE, VUGULAR50-90% ALTERED; SUBHEDRALGRAIN SIZE: FINE; RANGE: VERY FINE TO MEDIUMGOOD INDURATIONCEMENT TYPE(S): DOLOMITE CEMENT, CALCILUTITE MATRIXSOME PARTIALLY DOLOMITITE CALCILUTITE FRAGMENTS(DOLOMITIZED AREAS ARE DISTINCT REGIONS OF FRAGMENTS)INTERBEDDED WITH FULLY DOLOMITIZED FRAGMENTS. DOLOSTONEHAS SAME CHARACTERISTICS AS THAT BETWEEN 2422 AND 2432FRAGMENTS
2434 - 2436 DOLOSTONE; GRAYISH OLIVE TO MODERATE BROWN11% POROSITY: LOW PERMEABILITY, INTERCRYSTALLINE, VUGULAR50-90% ALTERED; SUBHEDRALGRAIN SIZE: FINE; RANGE: VERY FINE TO MEDIUMGOOD INDURATIONCEMENT TYPE(S): DOLOMITE CEMENT, CALCILUTITE MATRIXACCESSORY MINERALS: CALCILUTITE-05%OTHER FEATURES: CALCAREOUS
2436 - 2438 DOLOSTONE; MODERATE DARK GRAY TO VERY LIGHT ORANGE12% POROSITY: LOW PERMEABILITY, INTERCRYSTALLINE, VUGULAR90-100% ALTERED; SUBHEDRALGRAIN SIZE: FINE; RANGE: VERY FINE TO MEDIUMGOOD INDURATIONCEMENT TYPE(S): DOLOMITE CEMENTACCESSORY MINERALS: CALCILUTITE-01%VERY SIMILAR TO PRECEDING LITHOLOGIES OFDOLOSTONE--PARTIALLY EUHEDRAL, AND DOMINANTLY SUBHEDRAL
2438 - 2451 GRAINSTONE; YELLOWISH GRAY TO LIGHT OLIVE GRAY12% POROSITY: LOW PERMEABILITY, INTERGRANULARGRAIN TYPE: CALCILUTITE, BIOGENIC90% ALLOCHEMICAL CONSTITUENTSGRAIN SIZE: FINE; RANGE: VERY FINE TO FINEGOOD INDURATIONCEMENT TYPE(S): CALCILUTITE MATRIXACCESSORY MINERALS: DOLOMITE-20%DOMINANTLY PELOIDS. DOLOSTONE AND GRAINSTONE EXIST ASSEPARATE FRAGMENTS
2451 - 2458 DOLOSTONE; MODERATE DARK GRAY TO MODERATE YELLOWISH BROWN11% POROSITY: LOW PERMEABILITY, INTERCRYSTALLINE90-100% ALTERED; SUBHEDRALGRAIN SIZE: FINE; RANGE: VERY FINE TO MEDIUMGOOD INDURATIONCEMENT TYPE(S): CALCILUTITE MATRIX, DOLOMITE CEMENTACCESSORY MINERALS: CALCILUTITE-45%OTHER FEATURES: CALCAREOUSSIMILAR TO SAMPLES FOUND FROM 2436-2438 FEET
2458 - 2537 GRAINSTONE; YELLOWISH GRAY TO PINKISH GRAY10% POROSITY: LOW PERMEABILITY, INTERGRANULARGRAIN TYPE: CALCILUTITE, BIOGENIC95% ALLOCHEMICAL CONSTITUENTSGRAIN SIZE: FINE; RANGE: VERY FINE TO FINE
B-19
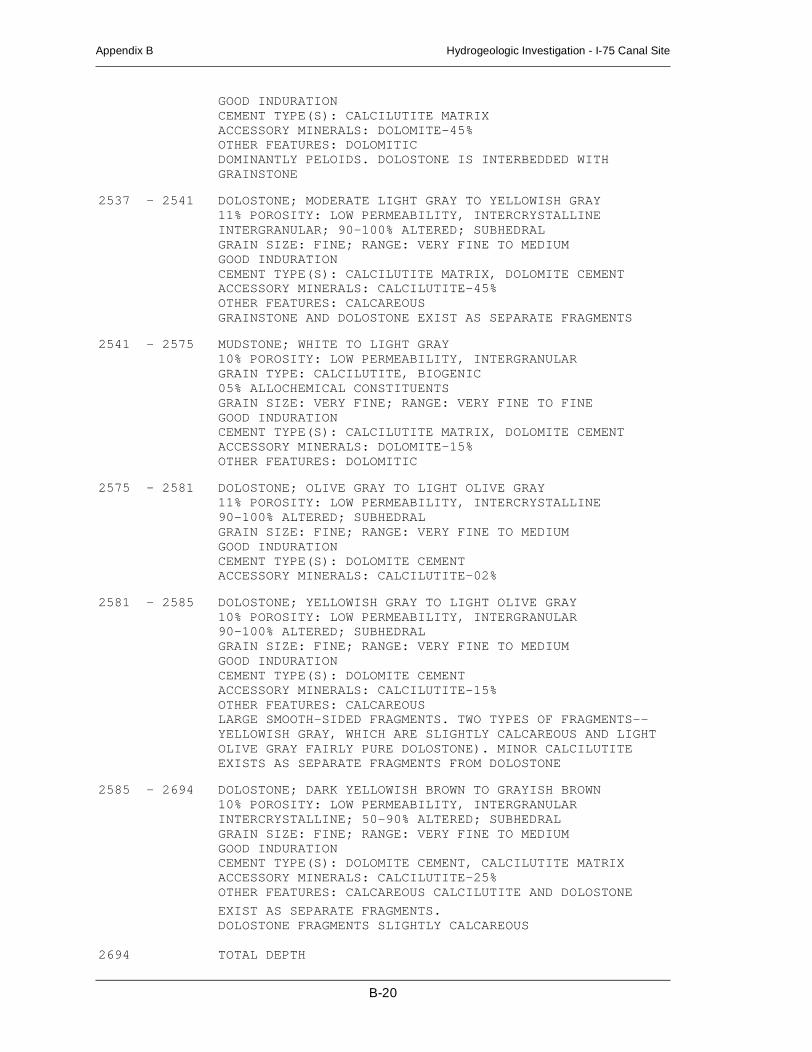
Appendix B Hydrogeologic Investigation - I-75 Canal Site
GOOD INDURATIONCEMENT TYPE(S): CALCILUTITE MATRIXACCESSORY MINERALS: DOLOMITE-45%OTHER FEATURES: DOLOMITICDOMINANTLY PELOIDS. DOLOSTONE IS INTERBEDDED WITHGRAINSTONE
2537 - 2541 DOLOSTONE; MODERATE LIGHT GRAY TO YELLOWISH GRAY11% POROSITY: LOW PERMEABILITY, INTERCRYSTALLINEINTERGRANULAR; 90-100% ALTERED; SUBHEDRALGRAIN SIZE: FINE; RANGE: VERY FINE TO MEDIUMGOOD INDURATIONCEMENT TYPE(S): CALCILUTITE MATRIX, DOLOMITE CEMENTACCESSORY MINERALS: CALCILUTITE-45%OTHER FEATURES: CALCAREOUSGRAINSTONE AND DOLOSTONE EXIST AS SEPARATE FRAGMENTS
2541 - 2575 MUDSTONE; WHITE TO LIGHT GRAY10% POROSITY: LOW PERMEABILITY, INTERGRANULARGRAIN TYPE: CALCILUTITE, BIOGENIC05% ALLOCHEMICAL CONSTITUENTSGRAIN SIZE: VERY FINE; RANGE: VERY FINE TO FINEGOOD INDURATIONCEMENT TYPE(S): CALCILUTITE MATRIX, DOLOMITE CEMENTACCESSORY MINERALS: DOLOMITE-15%OTHER FEATURES: DOLOMITIC
2575 - 2581 DOLOSTONE; OLIVE GRAY TO LIGHT OLIVE GRAY11% POROSITY: LOW PERMEABILITY, INTERCRYSTALLINE90-100% ALTERED; SUBHEDRALGRAIN SIZE: FINE; RANGE: VERY FINE TO MEDIUMGOOD INDURATIONCEMENT TYPE(S): DOLOMITE CEMENTACCESSORY MINERALS: CALCILUTITE-02%
2581 - 2585 DOLOSTONE; YELLOWISH GRAY TO LIGHT OLIVE GRAY10% POROSITY: LOW PERMEABILITY, INTERGRANULAR90-100% ALTERED; SUBHEDRALGRAIN SIZE: FINE; RANGE: VERY FINE TO MEDIUMGOOD INDURATIONCEMENT TYPE(S): DOLOMITE CEMENTACCESSORY MINERALS: CALCILUTITE-15%OTHER FEATURES: CALCAREOUSLARGE SMOOTH-SIDED FRAGMENTS. TWO TYPES OF FRAGMENTS--YELLOWISH GRAY, WHICH ARE SLIGHTLY CALCAREOUS AND LIGHTOLIVE GRAY FAIRLY PURE DOLOSTONE). MINOR CALCILUTITEEXISTS AS SEPARATE FRAGMENTS FROM DOLOSTONE
2585 - 2694 DOLOSTONE; DARK YELLOWISH BROWN TO GRAYISH BROWN10% POROSITY: LOW PERMEABILITY, INTERGRANULARINTERCRYSTALLINE; 50-90% ALTERED; SUBHEDRALGRAIN SIZE: FINE; RANGE: VERY FINE TO MEDIUMGOOD INDURATIONCEMENT TYPE(S): DOLOMITE CEMENT, CALCILUTITE MATRIXACCESSORY MINERALS: CALCILUTITE-25%OTHER FEATURES: CALCAREOUS CALCILUTITE AND DOLOSTONE
EXIST AS SEPARATE FRAGMENTS.DOLOSTONE FRAGMENTS SLIGHTLY CALCAREOUS
2694 TOTAL DEPTH
B-20

Hydrogeologic Investigation - I-75 Canal Site Appendix C
APPENDIX CCORE DESCRIPTIONS FOR I75-PW
(Provided by Collier Consulting, Inc.)
C-1

Appendix C Hydrogeologic Investigation - I-75 Canal Site
C-2

Hydrogeologic Investigation - I-75 Canal Site Appendix C
SUWANNEE LIMESTONE
Core Interval: 910 to 911.8 feet below land surface
Description: Cream to white colored, very fine to fine grained, slightlyphosphatic, foram-peloid packstone-wackestone; good interparticle porositywith scattered moldic and vugs, common forams, increasing porosity at 911.8feet below land surface (bls) (Figure C-1)
Depositional Environment: Open lagoon shoal
Core Interval: 911.8 to 913 feet below land surface
Description: Yellowish-gray, fine to pebble grained, poor sorted, very porous,molluscan-coquina rudstone; good interparticle and moldic porosity(Figure C-1)
Depositional Environment: Shoal
Core Interval: 945 to 946.8 feet below land surface
Description: Yellowish-gray, fine to medium grained, well sorted, slightlylaminated, ostracod-foram-peloidal packstone-grainstone; fair to goodintraparticle porosity, a trace of large vugs (Figure C-2)
Depositional Environment: Open lagoon shoal
Core Interval: 946.8 to 947 feet below land surface
Description: Yellowish-gray, medium grained, well sorted, foram-peloidalpackstone, with good interparticle moldic porosity; fair to good intraparticleporosity increasing to vuggy porosity with increasing grain size (Figure C-2)
Depositional Environment: Open lagoon shoal
Core Interval: 947 to 947.25 feet below land surface
Description: Yellowish gray, slightly laminated, fine to medium grained,moderate to well sorted, foram-peloidal packstone; this interval is very porouswith abundant good interparticle and vuggy moldic porosity with traces ofcoarse to very coarse vugs (Figure C-2)
Depositional Environment: Restrictive lagoon shoal
Core Interval: 947.25 to 950.75 feet below land surface
Description: Yellowish gray to pale orange, coarse to granular grained,moderately sorted, intraclast-algal-foram-peloidal packstone; this interval isvery porous and has good interparticle to vuggy moldic porosity with abundant
C-3

Appendix C Hydrogeologic Investigation - I-75 Canal Site
2 to 3-millimeter (mm) algae at 950 feet with scattered 1 to 5-mm vugs(Figure C-2)
Depositional Environment: Open lagoon shoal
Core Interval: 950.75 to 951.6 feet below land surface
Description: Very pale orange, slightly laminated, fine to very fine grained,foram-peloidal packstone with very fine to fine sized vugs and molds, andscattered intraparticle porosity (Figure C-2)
Depositional Environment: Open lagoon shoal
Core Interval: 951.6 to 956 feet below land surface
Description: Very light brown to pale orange, fine to very coarse grained, verypoorly sorted, bryozoan-gastropod wackestone-rudstone; this interval has goodvuggy moldic porosity with scattered 40-mm bryozoan molds and abundantbryozoan molds at 952-953 feet bls; pelecypod shells dominate below 953 feetmore akin to a pelecypod packstone-wackestone (Figures C-2 and C-3)
Depositional Environment: Bryozoan mound
Core Interval: 1,020 to 1,020.3 feet below land surface
Description: Yellowish gray, coarse to granular, gastropod-molluscan coquinawith very good moldic and interparticle porosity development containingscattered vugs measuring 5-10 mm in size (Figure C-3)
Depositional Environment: Restrictive lagoon
Core Interval: 1,020.3 to 1,023.5 feet below land surface
Description: White, very fine to medium grained, skeletal packstone; thisinterval has good vuggy moldic porosity with scattered intraparticle porosity; adiscontinuous, slightly laminated surface occurs at 1,020.5-1,020.6 feet(Figure C-3)
Depositional Environment: Mound flank
The core descriptions are summarized in Table C-1. Preceding the table is alegend defining the abbreviations used in the table.
C-4

Hydrogeologic Investigation - I-75 Canal Site Appendix C
3.236md33.5%
2205.7md33.2%
910.0
913.0
TOP OF CORE
BASE OF CORE
Lithofacies #1
Lithofacies #2
South Florida Water ManagementI-75-PW910-913
Lithofacies #1: Foram-peloidal packstone
Lithofacies #2: Pelecypod coquina
KEYCore Plug Location
Porosity (%)
Permeability (K90)
380.22md39.7%
Figure C-1. Core Slabs from depths of 910 to 930 bls for I75-PW
C-5
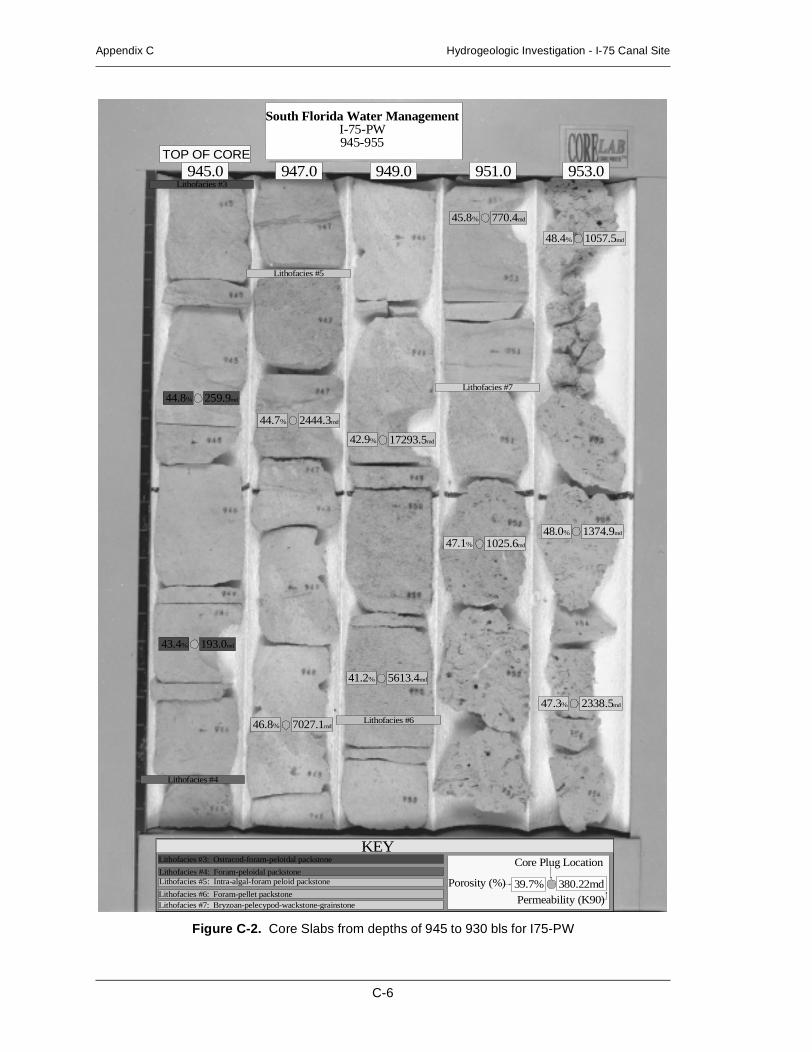
Appendix C Hydrogeologic Investigation - I-75 Canal Site
945.0 947.0 949.0 951.0 953.0TOP OF CORE
259.9md
770.4md
1057.5md
1374.9md
2444.3md
17293.5md
5613.4md
2338.5md
1025.6md
7027.1md
193.0md
44.8%
45.8%
48.4%
48.0%
44.7%
42.9%
41.2%
47.3%
47.1%
46.8%
43.4%
- 4 -
Lithofacies #3: Ostracod-foram-peloidal packstone
Lithofacies #4: Foram-peloidal packstoneLithofacies #5: Intra-algal-foram peloid packstone
Lithofacies #6: Foram-pellet packstoneLithofacies #7: Bryzoan-pelecypod-wackstone-grainstone
KEYCore Plug Location
Porosity (%)
Permeability (K90)
380.22md39.7%
South Florida Water ManagementI-75-PW945-955
Lithofacies #3
Lithofacies #4
Lithofacies #5
Lithofacies #6
Lithofacies #7
Figure C-2. Core Slabs from depths of 945 to 930 bls for I75-PW
C-6

Hydrogeologic Investigation - I-75 Canal Site Appendix C
956.0
1023.5
1020.01022.0
BASE OF CORE
BASE OF CORE
TOP OF CORE
49.66md
121.3md
34.2%
41.7%
Lithofacies #7 (cont.): Bryzoan-pelecypod-wackstone-grainstone
Lithofacies #8: Gastropod-pelecypod-skeletal peloidal wackpackstoneLithofacies #9: Peloidal skeletal packstone
KEYCore Plug Location
Porosity (%)
Permeability (K90)
380.22md39.7%
Lithofacies #7 (cont.) Lithofacies #8
Lithofacies #9
South Florida Water ManagementI-75-PW
955-1023.5
Figure C-3. Core Slabs from depths of 955 to 1,023.5 bls for I75-PW
C-7

Appendix C Hydrogeologic Investigation - I-75 Canal Site
KEY TO CORE DESCRIPTIONS IN TABLE C-1
Rock Type Cement
COQ Coquina REXL Recrystallization
G Grainstone SL Slight
P Packstone TR Trace
R Rudstone W Well
W Wackestone
Laminations
Grain Size INCL Inclined
C Coarse SL Slight
F Fine T Thin
G Granule VT Very Thin
M Medium
P Pebble Sorting
VF Very Fine M Medium
MW Moderately Well
Porosity Visual Dominant, Porosity Visual Other P Poor
F Fair VP Very Poor
G Good W Well
P Poor
VG Very Good Glauconite
SL Slight
Porosity Dominant, Porosity Other
BP Between Particles Sand
LV Large Vug S Some
MICOR Microscopic SL Slight
MO Moldic V Very
SH Shelter VSL Very Slight
V Vug
WP Within Particles Dolomite
SL Slight
Pore Size Dominant, Pore Size Other TR Trace
C Coarse
F Fine
G Granule
LMO Large Moldic
LV Large Vug
M Medium
MICRO Microscopic
MO Moldic
P Pebble
TR Trace
VC Very Coarse
VF Very Fine
C-8

Hydrogeologic
Investigation-
I-75C
analSite
Appendix
C
C-9
Gla
uco
nit
e
Do
lom
ite
LithofaciesDepositionalEnvironment
lightly foram peloidal packstone open lagoon shoal
TR pelecypod coquina shoal
ostracod-foram-peloidalpackstone
open lagoon shoal
foram-peloidal packstone open lagoon shoal
foram-peloidal packstone restrictive lagoonshoal
intra-algal-foram peloidpackstone
open lagoon shoal
foram-pellet packstone open lagoon shoal
TRbryzoan-pelecypodwackstone-grainstone bryozan mound
gastropod-pelecypod-skeletal peloidalwackestone-packstone
restrictive lagoon
lightly peloidal skeletal packstone mound flank
Table C-1. Core Descriptions
Co
reD
epth
Ro
ckTy
pe
Gra
inS
ize
Po
rosi
tyV
isu
alD
om
inan
t
Po
rosi
tyD
om
inan
t
Po
rosi
tyV
isu
alO
ther
Po
rosi
tyO
ther
Po
reS
izes
Do
min
ant
Po
reS
izes
Oth
er
Lam
inat
ion
s
So
rtin
g
910 - 911.8 wackestonevery fine to
finegood BP F MO-V
very fineto fine
moldicmoderately
wells
911.8 - 913 coquina-rudstone
fine topebble
verygood
BP-MO very fineto fine
C poor
945 - 946.8 packstone-grainstone
fine tomedium
fair WP-P very fineto medium
large vugsmoldic
Cslightly well
946.8 - 947 packstone medium good BP-MO F WP-V very fineto fine
large vugsmoldic
well
947 - 947.25 packstone fine tomedium
good BP-V-M0 TR V very fineto fine
large vugsmoldic
Cslightly poor
947.25 - 950.75 packstonevery fine tocoarse togranular
verygood
BP-V-MO F MICRO Vvery fine
to medium
large vugsC
VC
moderatelywell
950.75 - 951.6 packstonevery fine to
finefair V-WP TR BP
very fineto fine
large vugsmoldic
well
951.6 - 956
packstone-wackestone-grainstone-
rudstone
fine tocoarse to
pebblegood V-MO
very fineto medium
LMOC
VCvery poor
1,020 - 1,020.3wackestone-packstone
very fine tocoarse togranular
fair togood
MO-WP-BP F LVvery fineto fine
large vugsC
VCpoor
1,020.3 - 1,023.5 packstonemedium to
coursegood V-MO-WP P BP-M0-V
very fineto fine
moldicC
very poor s

Appendix C Hydrogeologic Investigation - I-75 Canal Site
C-10

Hydrogeologic Investigation - I-75 Canal Site Appendix D
APPENDIX DPHOTOMICROGRAPHS
D-1

Appendix D Hydrogeologic Investigation - I-75 Canal Site
D-2

Hydrogeologic Investigation - I-75 Canal Site Appendix D
WELL: I-75-PWDEPTH: 910.5
MAGNIFICATION: X40
LITHOFACIES: FORAM-PELOIDAL PACKSTONE WITH GOOD VERY FINE-FINEINTERPARTICLE AND FAIR VUGGY MOLDIC INTRAPARTICLE POROSITY
Figure D-1. Photomicrograph for Well I75-PW at a Depth of 910.5 feet bls.
D-3

Appendix D Hydrogeologic Investigation - I-75 Canal Site
WELL: I-75-PWDEPTH: 947.2
MAGNIFICATION: X40
LITHOFACIES: SLIGHTLY GLAUCONITIC FORAM-PELOIDAL PACKSTONEWITH GOOD INTERPARTICLE VUGGY POROSITY
Figure D-2. Photomicrograph for Well I75-PW at a Depth of 947.2 feet bls.
D-4

Hydrogeologic Investigation - I-75 Canal Site Appendix D
WELL: I-75-PWDEPTH: 947.3
MAGNIFICATION: X20
LITHOFACIES: ALGAL-INTERCLASTIC-FORAM-PELOIDAL PACKSTONE WITHGOOD INTERPARTICLE, VUG, AND MOLDIC POROSITY
Figure D-3. Photomicrograph for Well I75-PW at a Depth of 947.3 feet bls.
D-5

Appendix D Hydrogeologic Investigation - I-75 Canal Site
WELL: I-75-PWDEPTH: 950
MAGNIFICATION: X20
LITHOFACIES: FORAM-PELOIDAL PACKSTONE-GRAINSTONE WITH VERYGOOD VUGGY INTERPARTICLE, LARGE SECONDARY VUGS, AND “FLOATING
GRAINS”
Figure D-4. Photmicrograph for Well I75-PW at a Depth of 950 feet bls.
D-6

Hydrogeologic Investigation - I-75 Canal Site Appendix D
WELL: I-75-PWDEPTH: 951.4
MAGNIFICATION: X20
LITHOFACIES: PELOIDAL-FORAM PACKSTONE WITH FAIR VUGGYINTRAPARTICLE AND MOLDIC POROSITY
Figure D-5. Photomicrograph for Well I75-PW at a Depth of 951.4 feet bls.
D-7

Appendix D Hydrogeologic Investigation - I-75 Canal Site
WELL: I-75-PWDEPTH: 952.2
MAGNIFICATION: X20
LITHOFACIES: BRYOZOAN PELECYPOD COATED GRAIN PELOIDALWACKESTONE-GRAINSTONE WITH GOOD VUGGY-MOLDIC POROSITY. NOTE:
“FLOATING” COATINGS ARE INDICATIVE OF SECONDARY LEACHING.
Figure D-6. Photomicrograph for Well I75-PW at a Depth of 952.2 feet bls.
D-8

Hydrogeologic Investigation - I-75 Canal Site Appendix D
WELL: I-75-PWDEPTH: 1020.3
MAGNIFICATION: X20
LITHOFACIES: SKELETAL PELOIDAL PACKSTONE
Figure D-7. Photomicrograph for Well I75-PW at a Depth of 1,020.3 feet bls.
D-9

Appendix D Hydrogeologic Investigation - I-75 Canal Site
WELL: I-75-PWDEPTH: 1021
MAGNIFICATION: X40
LITHOFACIES: PELOIDAL SKELETAL PACKSTONE, GLAUCONITIC WITHGOOD VUGGY, MOLDIC, AND INTRAPARTICLE POROSITY
Figure D-8. Photmicrograph for Well I75-PW at a Depth of 1,021 feet bls.
D-10