Embed Size (px)
Citation preview

Hydrogen Peroxide Sensing with Prussian Blue-Based Fiber-Optic
Sensors
by
Hamed Akbari Khorami
B.Sc., Sharif University of Technology, Iran, 2008
M.Sc., Materials and Energy Research Center, Iran, 2010
A Dissertation Submitted in Partial Fulfillment
of the Requirements for the Degree of
DOCTOR OF PHILOSOPHY
in the Department of Mechanical Engineering
© Hamed Akbari Khorami, 2016
University of Victoria
All rights reserved. This dissertation may not be reproduced in whole or in part, by
photocopy or other means, without the permission of the author.

ii
Hydrogen Peroxide Sensing with Prussian Blue-Based Fiber-Optic Sensors
by
Hamed Akbari Khorami
B.Sc., Sharif University of Technology, Iran, 2008
M.Sc., Materials and Energy Research Center, Iran, 2010
Supervisory Committee
Dr. Nedjib Djilali, Department of Mechanical Engineering
Co-supervisor
Dr. Peter Wild, Department of Mechanical Engineering
Co-supervisor
Dr. Alexandre G. Brolo, Department of Chemistry
Outside Member

iii
Supervisory Committee
Dr. Nedjib Djilali, Department of Mechanical Engineering
Co-supervisor
Dr. Peter Wild, Department of Mechanical Engineering
Co-supervisor
Dr. Alexandre G. Brolo, Department of Chemistry
Outside Member
Abstract
Hydrogen peroxide (H2O2) is extensively used in a broad range of industrial and
medical applications, such as aseptic processing of food and pharmaceuticals,
disinfection, water treatment plants, and decontamination of industrial effluents. H2O2 is
believed to be responsible for chemical degradation of polymer membranes in Polymer-
Electrolyte-Membrane (PEM) fuel cells. Therefore, a versatile H2O2 sensor that functions
in different environments with different conditions is of practical importance in various
fields. This dissertation presents the fabrication of a fiber-optic H2O2 sensing probe
(optrode) and its H2O2 sensing behavior in different conditions.
An H2O2 optrode is fabricated using chemical deposition of Prussian blue (PB) onto
the tip of a multimode optical fiber. Sensing tests are performed in aqueous solutions at a
constant pH and different concentrations of H2O2. Sensing features of the optrode (i.e.
repeatability, durability, and reproducibility) are assessed by performing multiple sensing
tests with several optrodes. The results show the prepared optrode is able to detect
concentrations of H2O2 in aqueous solutions at a constant pH of 4 and the optrode
features a repeatable and durable response at this condition.

iv
The functionality of optrodes at different pH values is further investigated by
performing additional sensing experiments. These experiments are carried out in aqueous
solutions with different concentrations of H2O2 at different pH values (i.e. pH 2-7). The
sensor detects the presence of H2O2 at a range of pH values. Sensing behavior of optrodes
toward detection and measurement of H2O2 concentrations is studied at the pH value
corresponding to an operating PEM fuel cell (i.e. pH 2). The optrode is able to detect
concentrations of H2O2 at this condition with a repeatable and durable response.
The stability of PB films, prepared through different conditions, is investigated to
address the stability of optrodes at elevated temperatures. PB films are first deposited
onto the glass slides through three different chemical processes, and then at different
synthesis temperatures. The PB films are left in Phosphate-Buffer-Solutions (PBS) with
pH 2 and at elevated temperatures for a day. Finally, PB films are characterized using
Fourier transform infrared spectroscopy (FTIR) to analyze their stability following PBS
processing at operating temperatures and pH value corresponding to an operating PEM
fuel cell (i.e. 80 °C and pH 2). The results of these experiments illustrate the PB films
prepared through the single-source precursor (SSP) technique and at synthesis
temperatures above 60 °C remain stable after the PBS processing.
The proposed optrode shows reliable sensing behavior toward detection and
measurement of H2O2 concentrations in aqueous solutions at different conditions. The
prepared optrode has the potential for being developed and used in different industrial
and medical fields, as well as an operating PEM fuel cell, to detect and measure H2O2
concentrations.

v
Table of Contents
Supervisory Committee ...................................................................................................... ii
Abstract .............................................................................................................................. iii
Table of Contents ................................................................................................................ v
List of Tables ................................................................................................................... viii
List of Figures .................................................................................................................... ix
List of Symbols and Abbreviations.................................................................................... xi
Acknowledgements ........................................................................................................... xii
Dedication ........................................................................................................................ xiv
1. Introduction ................................................................................................................. 1
1.1. Research Motivation ......................................................................................... 1
1.2. Literature Review ............................................................................................. 2
1.2.1. Membrane Degradation by H2O2 in PEM Fuel Cell ................................. 2
1.3. Detection of H2O2 ............................................................................................. 5
1.3.1. Electrochemical Techniques ..................................................................... 6
1.3.2. Spectroscopic Techniques Using Optical Fibers ....................................... 7
1.4. Prussian Blue .................................................................................................. 11
1.4.1. H2O2 Detection mechanism by Prussian Blue ........................................ 11
1.4.2. Preparation of Prussian Blue Films ......................................................... 13
1.5. Objectives ....................................................................................................... 14
1.6. Structure of Dissertation ................................................................................. 15
2. Summary of Key Results ........................................................................................... 17

vi
2.1. Spectroscopic Detection of Hydrogen Peroxide with an Optical Fiber Probe
using Chemically Deposited Prussian Blue ............................................................... 17
2.2. pH-dependent Response of a Hydrogen Peroxide Sensing Probe .................. 19
2.3. Effect of Deposition Conditions on Stability of PB Films at PEMFC’s
Operating Temperatures and pH................................................................................ 20
3. Spectroscopic Detection of Hydrogen Peroxide with an Optical Fiber Probe using
Chemically Deposited Prussian Blue ................................................................................ 22
Preamble ........................................................................................................................... 22
Abstract ............................................................................................................................. 22
3.1. Introduction .................................................................................................... 23
3.2. Experimental ................................................................................................... 25
3.2.1. Materials .................................................................................................. 25
3.2.2. Chemical Deposition of Prussian Blue.................................................... 26
3.2.3. Characterization of the Prussian Blue ..................................................... 27
3.2.4. Sensing Test Procedures and Instrumentation ........................................ 27
3.3. Results and Discussion ................................................................................... 29
3.3.1. Chemical Deposition of Prussian Blue.................................................... 29
3.3.2. Sensing Behavior..................................................................................... 33
3.3.3. Repeatability............................................................................................ 37
3.3.4. Reproducibility ........................................................................................ 37
3.3.5. Durability ................................................................................................ 40
3.4. Conclusions .................................................................................................... 41
4. pH-dependent Response of a Hydrogen Peroxide Sensing Probe ............................. 43
Preamble ........................................................................................................................... 43
Abstract ............................................................................................................................. 43
4.1. Introduction .................................................................................................... 44
4.2. Experimental ................................................................................................... 47
4.2.1. Materials .................................................................................................. 47
4.2.2. Sensor Fabrication ................................................................................... 48
4.2.3. Sensing Test Procedure and Instrumentation .......................................... 48
4.3. Results and Discussion ................................................................................... 49
4.3.1. pH-dependent Response .......................................................................... 49

vii
4.3.2. Sensing Behavior at PEM Fuel Cell’s Operating pH .............................. 52
4.3.2.1. Repeatability ........................................................................................ 54
4.3.2.2. Reproducibility .................................................................................... 56
4.3.2.3. Durability ............................................................................................. 57
4.3.3. pH-dependent Sensitivity ........................................................................ 58
4.4. Conclusions .................................................................................................... 59
5. Effect of Deposition Conditions on Stability of PB Films at PEMFC’s Operating
Temperatures and pH ........................................................................................................ 60
Preamble ........................................................................................................................... 60
Abstract ............................................................................................................................. 60
5.1. Introduction .................................................................................................... 61
5.2. Experimental ................................................................................................... 63
5.2.1. Deposition of Prussian Blue Films .......................................................... 63
5.2.2. PBS Processing of Samples..................................................................... 65
5.3. Results and Discussion ................................................................................... 65
5.3.1. Effect of Synthesis Process and Precursors............................................. 65
5.3.2. Effect of Synthesis Temperature ............................................................. 67
5.4. Summary ......................................................................................................... 68
6. Conclusions and Future Work ................................................................................... 69
6.1. Conclusions and Contributions ....................................................................... 69
6.1.1. Spectroscopic Detection of Hydrogen Peroxide with an Optical Fiber
Probe using Chemically Deposited Prussian Blue ................................................. 70
6.1.2. pH-dependent Response of a Hydrogen Peroxide Sensing Probe........... 71
6.1.3. Effect of Deposition Conditions on Stability of PB Films at PEMFC’s
Operating Temperatures and pH ............................................................................ 72
6.1.4. Conclusions ............................................................................................. 72
6.2. Future work..................................................................................................... 73
Bibliography ..................................................................................................................... 74
Appendix A: Polymer Electrolyte Membrane Fuel Cell................................................... 81
Appendix B: Prussian Blue ............................................................................................... 85

viii
List of Tables
Table 4-1: Slopes of intensity variation at different concentrations of H2O2. .................. 55
Table 5-1: Source of Chemicals. ....................................................................................... 64

ix
List of Figures
Figure 1-1: Schematic of fuel cell’s components and reactions. ........................................ 3
Figure 1-2: Nafion structure (http://en.wikipedia.org/wiki/File:Nafion2.svg). .................. 3
Figure 1-3: (a) Surface and (b) cross-section SEM micrographs of the Nafion membranes
treating in H2O2/metal ions containing solution for 48 h (taken from [6], Reproduced
with permission from Elsevier). .................................................................................. 5
Figure 1-4: Configuration of a fiber-optic sensor. .............................................................. 9
Figure 1-5: An illustration of excitation and fluorescence. .............................................. 10
Figure 1-6: (a) Electrochemical and (b) spectroscopic characteristics of PB (taken from
[38], Reproduced with permission from Taylor & Francis). ..................................... 12
Figure 1-7: Detection mechanism of H2O2 using an optrode based on PB/PW system. .. 12
Figure 3-1: Detection mechanism of H2O2 using fiber-optic sensing probe based on
PB/PW system. .......................................................................................................... 24
Figure 3-2: Experimental setup. ........................................................................................ 28
Figure 3-3: Raman spectra in the range of 2025-3010 cm-1of red line) uncoated glass
substrate, blue line) sample synthesized in darkness, and green line) sample
synthesized under the fluorescent lamp light exposure. The inset is the Raman
spectra of same samples in the range of 100-3200 cm-1. ........................................... 31
Figure 3-4: The light reflection from the distal end of an optical fiber during synthesis a)
in darkness and in 720 ± 15 nm, b) under the light exposure in 720 ± 15 nm, c) in
darkness and in 420 ± 15 nm, and d) under the light exposure in 420 ± 15 nm. ....... 32
Figure 3-5: Response of the sensing probe to immersion in solutions with random H2O2
concentration. ............................................................................................................ 34
Figure 3-6: Response of the sensing probe and its inverse exponential fit to immersion in
100 µM H2O2 solution. .............................................................................................. 35
Figure 3-7: Time response of sensing probe versus H2O2 concentration. ........................ 36
Figure 3-8: Average time response of sensing probe versus H2O2 concentration. ........... 37
Figure 3-9: Response of three different sensing probes to immersion in solutions
containing H2O2. ........................................................................................................ 38

x
Figure 3-10: Time response of three different sensing probes versus H2O2 concentration.
................................................................................................................................... 39
Figure 3-11: Response of a sensing probe to immersion in solutions containing H2O2 four
and seven months after its fabrication. ...................................................................... 40
Figure 3-12: Time response of a sensing probe versus H2O2 concentration four and seven
months after its fabrication. ....................................................................................... 41
Figure 4-1: Detection mechanism of H2O2 using an optrode based on PB/PW system
(taken from [56]). ...................................................................................................... 46
Figure 4-2: Sensing test experimental Setup including white light source, optical fiber,
optrode, and spectrometer. ......................................................................................... 49
Figure 4-3: Intensity response of the optrode to immersion in solutions with different pH
values and 100 μmol L–1 of H2O2. ............................................................................. 50
Figure 4-4: Time constant of the optrode versus pH of the test solutions with 100 μmol L–
1 of H2O2. ................................................................................................................... 52
Figure 4-5: Intensity response of the optrode to immersion into solutions with different
H2O2 concentrations at pH 2. ..................................................................................... 53
Figure 4-6: Time constant of the optrode versus H2O2 concentration at pH 2. ................ 53
Figure 4-7: Successive intensity responses of the optrode to red) 50 μmol L–1 of H2O2,
green) 100 μmol L–1 of H2O2, blue) 200 μmol L–1 of H2O2, and orange) 400 μmol L–1
of H2O2 (For interpretation of the references to colour in this figure legend, the
reader is referred to the web version of this article). ................................................. 54
Figure 4-8: Time constant of the optrode versus H2O2 concentration. ............................. 55
Figure 4-9: Time constant of two different optrodes versus H2O2 concentration at pH 2. 56
Figure 4-10: Time constant of an optrode versus H2O2 concentration (A) five, (B) six, and
(C) nine months after its fabrication. ......................................................................... 57
Figure 4-11: Time constant of an optrode versus H2O2 concentration in solutions with (A)
pH 6, (B) pH 5, and (C) pH 2. ................................................................................... 58
Figure 5-1: Experimental procedure ................................................................................. 65
Figure 5-2: FTIR spectra of PB films synthesized through (a) sol-gel process, (b)
chemical process using potassium ferrocyanide and iron (III) chloride, and (c) SSP
process using potassium ferricyanide, before (solid line) and after (dashed line) PBS
processing. ................................................................................................................. 66
Figure 5-3: FTIR spectra of PB films synthesized at (a) 40 °C, (b) 60 °C, and (c) 80 °C,
before (solid line) and after (dashed line) PBS processing. ...................................... 67
Figure A-1: Schematic of fuel cell’s components and reactions. ..................................... 82
Figure A-2: Nafion structure (http://en.wikipedia.org/wiki/File:Nafion2.svg). ............... 84
Figure A-3: CL at cathode electrode (taken from [2], Reproduced with permission from
Elsevier). .................................................................................................................... 84
Figure B-1: Face-centered-cubic crystal structure of PB (taken from [38], Reproduced
with permission from Taylor & Francis). .................................................................. 85

xi
List of Symbols and Abbreviations
Symbol or Abbreviation Meaning
PB Prussian blue, ferric ferrocyanide
PW Prussian white, potassium ferrous ferrocyanide
BG Berlin green, ferric ferrocyanide
ABS Acetate buffer solution
PBS Phosphate buffer solution
TEOS Tetraethyl orthosilicate
PTFE Polytetrafluoroethylene
PEM Polymer electrolyte membrane
MEA Membrane electrode assembly
CL Catalyst layer
GDL Gas diffusion layer
SSP Single source precursor, synthesis approach
ESA Electrostatic self-assembly, deposition technique
LbL Layer-by-layer, deposition technique
FTIR Fourier transform infrared spectroscopy
STDEV Estimated standard deviation
R2 R-squared is a statistical measure of how close the data are to the
fitted regression line
τ Characteristic response time is the time elapsed for the signal to
reach (1 − 1/e) equal to 63% of the intensity at plateau state
T Transmittance
ci Amount concentration of material
εi Molar attenuation coefficient
l Path length of the beam through a thin layer of material

xii
Acknowledgements
First and foremost I would like to express my special appreciation and thanks to my
supervisors, Dr. Ned Djilali and Dr. Peter Wild. It has been an honor for me to be your
Ph.D. student. I would like to thank you for encouraging my research and for allowing
me to grow as a research scientist. You have taught me how to work in a professional
manner and how important is to have good research questions. Thank you for all the
support you have provided and all the lessons you have taught me during the years of my
Ph.D. studies
I would also like to thank Dr. Alexandre Brolo from the Department of Chemistry
for providing access to his laboratory facilities and for being my committee member. I
cannot forget to thank Dr. Harry Kowk from the Department of Electrical and Computer
Engineering who had been my supervisor before I started my Ph.D. in the Department of
Mechanical Engineering.
A special thanks goes to my family. Words cannot express how grateful I am to my
parents and parents-in-law for all their lifetime support. I would like to extend my
appreciation to Dr. Nazi Ghabaee who has always been beside my family and I, ready to
provide us with her support and love.
Starting my Ph.D. studies coincided with leaving my home country for the first
time and immigrating to a new country with a different language, culture, geography, and
weather than my home country. This could have been very challenging and difficult
without the support of my dear friend Dr. Alireza Tari, the family of Shayeste Kia, and
Dr. Mahyar Mazloumi. Thanks for welcoming me with your open arms and thanks for all
your support and love. I want to extend my gratitude to my dear friends Dr. Amirali
Baniasadi, Dr. Pourya Shirazian, and Reza Bayesteh who were always ready to provide
help and emotionally support me. Thank you all for giving me your friendship and
becoming a part of my life.
I would like to thank Susan Walton, Pauline Shepherd, and Peggy White in IESVic
and Dorothy Burrows, and Susan Wignall in the Department of Mechanical Engineering.

xiii
Thanks to all my friends, classmates and colleagues at UVic, Dr. Juan F. Botero-Cadavid,
Dr. Nigel David, Majid Soleimani nia, Alireza Akhgar, and Koh Yiin Hong.
I would also like to acknowledge financial support from the Natural Sciences and
Engineering Research Council of Canada (NSERC), as well as The German Academic
Exchange Service (DAAD) for supporting me as an exchange Ph.D. student at the
University of Oldenburg, Germany.

xiv
Dedication
To my wife Nina Taherimakhsousi
It would not have been possible without your love, endless support, encouragement, and
infinite patience

Chapter 1
1. Introduction
This dissertation describes the development of a fiber-optic sensing probe (optrode)
that detects and measures concentrations of hydrogen peroxide (H2O2) in an environment
similar to that in an operating Polymer-Electrolyte-Membrane (PEM) fuel cell. The
process of optrode preparation is studied to find suitable processes and conditions
yielding optrodes that remain stable under operating condition corresponding to a PEM
fuel cell (i.e. pH 2 and temperature range of 60 to 80 °C). Sensing behavior of the optrode
is then systematically investigated under a range of conditions. Section 1.1of this chapter
discusses the research motivation. A literature review on membrane degradation, by
H2O2, in PEM fuel cells is provided in Section 1.2. H2O2 sensing techniques and H2O2
detector agent are described in Sections 1.3 and 1.4. The objectives and the structure of
the dissertation are described in Sections 1.5 and 1.6.
1.1. Research Motivation
PEM fuel cells convert chemical energy directly into electricity. When using
hydrogen and oxygen as reactants, the only by-products of fuel cells are water and heat.
PEM fuel cells are prospective power sources for multiple applications (e.g.
transportation systems and portable electronics). For using PEM fuel cells in
transportation systems, high power density, fast start-up, high efficiency, and durability
need to be optimized or improved in order to make PEM fuel cells competitive with
internal combustion engines [1].

2
A key component of a PEM fuel cell is the polymer electrolyte membrane. The
chemical and mechanical stability of the membrane are crucial to fuel cell performance,
efficiency and life time. However, under certain operating conditions, H2O2 is produced
and causes chemical degradation of the membrane resulting in a decrease in fuel cell
efficiency and life time. Monitoring H2O2 and understanding underlying conditions that
promote its formation is a challenging problem. This requires the development of a
suitable H2O2 sensor to measure concentrations of H2O2 in operando within a fuel cell, to
investigate production rates and controlling factors.
1.2. Literature Review
This section briefly describes PEM fuel cells and reviews progress reported in the
literature on understanding of membrane degradation by H2O2 in PEM fuel cells. Further
information on PEM fuel cell operation is provided in Appendix A.
1.2.1. Membrane Degradation by H2O2 in PEM Fuel Cell
A PEM fuel cell consists of an anode, a cathode, and a proton exchange membrane
(PEM) that all together form the so-called Membrane Electrode Assembly (MEA). The
anode and cathode electrodes are connected to an external circuit. At the anode electrode,
hydrogen fuel is oxidized and forms hydrogen cations and electrons. Hydrogen cations
migrate to the cathode side through the electrolyte membrane. Conversely, electrons are
blocked by the electrolyte membrane, and flow through the external circuit, drive the
load, and return to the cathode side. At the cathode, oxygen reacts with hydrogen cations
and consumes electrons. As long as the anode and cathode are fed with hydrogen and
oxygen, the electrons continue to flow through the external circuit [1, 2]. Figure 1-1 is a
schematic of the fuel cell components and shows the key reactions of fuel cell operation.
The electrolyte membrane in the PEM fuel cell is formed from a hydrophobic and
inert polymer backbone which is sulfonated with hydrophilic and ionically conductive
acid clusters. Nafion is the most used and studied polymer electrolyte for fuel cells and is
synthesized by sulphonation (SO3-) of the basic polytetrafluoroethylene (PTFE) structure,
Nafion structure is shown in Figure 1-2. The PTFE is not ionically conductive but
provides chemical stability and durability for the membrane. Clustering of the sulfonic

3
acid side groups and hydration level are determining factors for the ionic conductivity of
the electrolyte.
Figure 1-1: Schematic of fuel cell’s components and reactions.
The performance of the PEM fuel cell degrades gradually due to deterioration of
cell components [1]. In particular, degradation of the electrolyte membrane which may
leads to many aspects of the damage such as gas crossover, local membrane breakdown
or thinning, lowering of catalyst utilization in MEA. Consequently, the chemical and
mechanical stability and durability of the electrolyte membrane are crucial to fuel cell
performance, efficiency and life time [1].
Figure 1-2: Nafion structure (http://en.wikipedia.org/wiki/File:Nafion2.svg).

4
H2O2 is one of the chemicals that is believed to play a leading role in chemical
degradation of the polymer membrane in PEM fuel cells [3, 4, 5, 6]. Both the
thermodynamic and the kinetic factors necessary for formation of H2O2 exist in the PEM
fuel cell environment [7]. H2O2 presence in PEM fuel cells has been detected by analysis
of the effluent water condensate from the anode and cathode during fuel cell operation
[8]. In that work, the H2O2 flux was less than 0.02 µmol h-1 cm-2. However, this flow may
not represent the total amount of H2O2 formed in the cell [8].
Two pathways have been proposed for the formation of H2O2 in PEM fuel cells.
First, H2O2 is formed at the cathode side through the oxygen reduction, reaction (1-1).
Next, H2O2 is formed at the anode side through reactions (1-2) and (1-3) [9]. The
necessary oxygen molecules for reaction (1-3) to take place are provided at the anode
side through oxygen crossover from the cathode to the anode or air bleed on the anode
side.
22 2OO + 2H 2e H (1-1)
21Pt+ H
2PtH
(1-2)
*
2 2 2O2H O H (1-3)
The effect of H2O2 on membrane degradation has been investigated by introducing
Nafion membranes into H2O2 solutions at 80 °C [4, 9]. After H2O2 processing of Nafion,
fluoride and sulfate ions (F- and SO42-) are detected in the solution which are derived
from the C-F bonds and the sulfonic acid groups, respectively. Kinumoto et al. [4]
observed that the loss of sulfonic acid groups leads to decrease in the proton conductivity,
and the decomposition of the C-F bonds causes formation of holes in Nafion membrane
and membrane thinning. The proton conductivity, water uptake and water self-diffusion
coefficient in membrane gradually decrease with H2O2 processing [9]. Moreover, Nafion
is used in the catalyst layer to enhance ionic conductivity. Therefore, decomposition of
Nafion inside the catalyst layer also reduces the effective reaction area and raises the
overpotential of the cell [4].
5
Another cause of membrane degradation is the formation of hydroxyl (OH•) and
hydroperoxyl (OOH•) radicals from H2O2 decomposition in the presence of transition
metal ions (Mn+) [6, 10]. These reactions are represented by
2 3
2 2H O +M M OH OH (1-4)
2 2 2OH H O OOH H O (1-5)
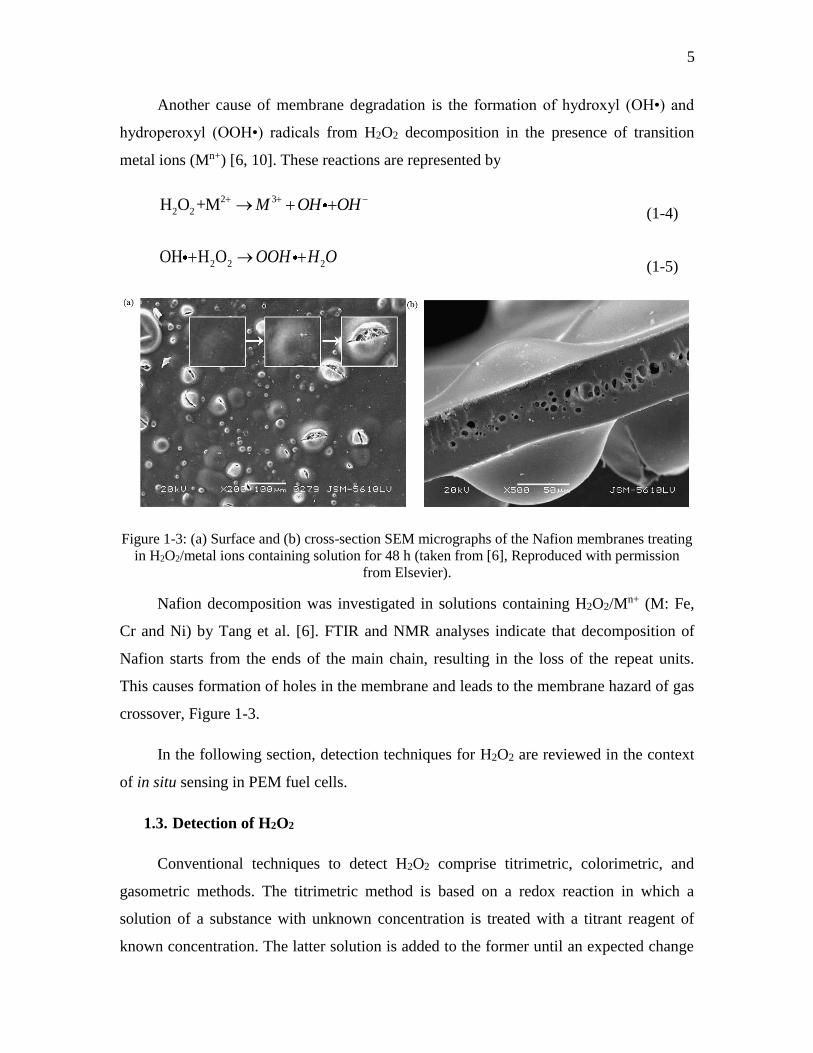
Figure 1-3: (a) Surface and (b) cross-section SEM micrographs of the Nafion membranes treating
in H2O2/metal ions containing solution for 48 h (taken from [6], Reproduced with permission
from Elsevier).
Nafion decomposition was investigated in solutions containing H2O2/Mn+ (M: Fe,
Cr and Ni) by Tang et al. [6]. FTIR and NMR analyses indicate that decomposition of
Nafion starts from the ends of the main chain, resulting in the loss of the repeat units.
This causes formation of holes in the membrane and leads to the membrane hazard of gas
crossover, Figure 1-3.
In the following section, detection techniques for H2O2 are reviewed in the context
of in situ sensing in PEM fuel cells.
1.3. Detection of H2O2
Conventional techniques to detect H2O2 comprise titrimetric, colorimetric, and
gasometric methods. The titrimetric method is based on a redox reaction in which a
solution of a substance with unknown concentration is treated with a titrant reagent of
known concentration. The latter solution is added to the former until an expected change

6
happens (e.g. color of the auxiliary detector agent, potential of the reaction, etc). At this
point, the volume of the titrant is used to determine the concentration of the substance
with unknown concentration using the stoichiometry of the reaction. For example, the
potentiometric titration of H2O2 is performed by known concentration of a KMnO4
solution. In colorimetric technique, the concentration of a substance in a solution is
determined by evaluating the change of color intensity of the solution as a result of
treating with a colorimetric reagent. This color change is due to production of a colored
compound through the reaction [11]. For instance, treating an H2O2 solution with
titanium sulfate reagent leads to pertitanic acid production with yellow color [12].
Gasometric technique is performed by measurement of a derivative gas from a reaction
between H2O2 and a reagent such as NaBrO [13].
These techniques require complex equipment and time consuming sample
preparation; they are sensitive to interference from other chemical species; and their
limits of detection limit the use of these techniques [14]. Therefore, they are not suitable
for in situ detection of H2O2 in PEM fuel cells.
Electrochemical and spectroscopic techniques on the other hand are able to
determine small concentrations of H2O2 [14, 15, 16, 17, 18, 19] which might be suitable
for in situ detection of H2O2 in PEM fuel cells. These two techniques are briefly
discussed in Sections 1.3.1 and 1.3.2.
1.3.1. Electrochemical Techniques
Electrochemical techniques engage an electrochemical cell consisting of at least
two electrodes and measuring the current and the potential. Depending on whether the
current is passed through the cell and how the current or the potential is controlled.
Electrochemical techniques are divided into potentiometry, coulometry, and
voltammetry.
Potentiometry measures the potential of a solution between an indicator electrode
and a reference electrode while there is no current passing through the cell. The measured
potential is then related to the concentration of analytes.

7
Coulometry measures the charge versus time while a current or a potential is
applied to the cell. This method is based on the complete conversion of an analyte from
one oxidation state to another. The number of charges transferred in the course of a redox
reaction in the cell is determined in accordance with Faraday’s laws. Thus, the
concentration of analytes can be determined by knowing the number of electrons
involved in the electrochemical reaction.
Voltammetry measures the current of the cell as a function of potential while a
fixed or variable potential is applied to the electrode surface. Hydrodynamic and cyclic
voltammetries, amperometry, and polarography are examples of voltammetry methods
with different functions of the applied potential to the cell.
In spite of this wide variety of electrochemical techniques, these methods are not
promising for in situ measurement of H2O2 inside PEM fuel cells since they require
complex instrumentation. Further, the current inside PEM fuel cells may interfere with
the current from the electrochemical cell that needs to be measured in case of coulometry
and voltammetry methods. Potentiometry, in particular, needs to be done in a current free
environment which is not the case in an operating PEM fuel cell.
However, the only report so far on in situ detection of H2O2 is based on the
electrochemical method [7]. An electrochemical technique using Pt wires as working
electrodes was used to detect H2O2 in a PEM fuel cell. This sensor detected H2O2 inside
the PEM fuel cell but was not able to quantify the amount of H2O2 produced in the cell.
Also, the existence of an electrical field in a PEM fuel cell can interfere with the function
of amperometric sensors, which detect current signal in nanoampere to picoampere range
[20]. As mentioned earlier, this limits the application of electrochemical sensors for
monitoring trace of H2O2 in PEM fuel cells.
1.3.2. Spectroscopic Techniques Using Optical Fibers
Recently, fiber-optic sensors have been used for in situ sensing of temperature and
relative humidity in PEM fuel cells [21, 22]. Optical fibers are attractive for this
application for several reasons. The small size of optical fibers allows for high spatial
resolution and easy integration of the sensing probe into the fuel cells. The optical signal
8
does not interfere with electrochemical processes in the fuel cell and is not affected by
the electromagnetic noise. The fiber material is compatible with the harsh environment
inside the fuel cell while conductor wires of electrical sensors may suffer corrosion due to
the temperature, humidity, and electrochemically active atmosphere in PEM fuel cells
[23].
Fiber-optic sensors and sensing mechanism for detecting H2O2 including absorption
[16, 17, 24, 25, 26, 27, 28, 29], fluorescence [30, 31], and chemiluminescence [32, 33]
techniques are briefly explained in below.
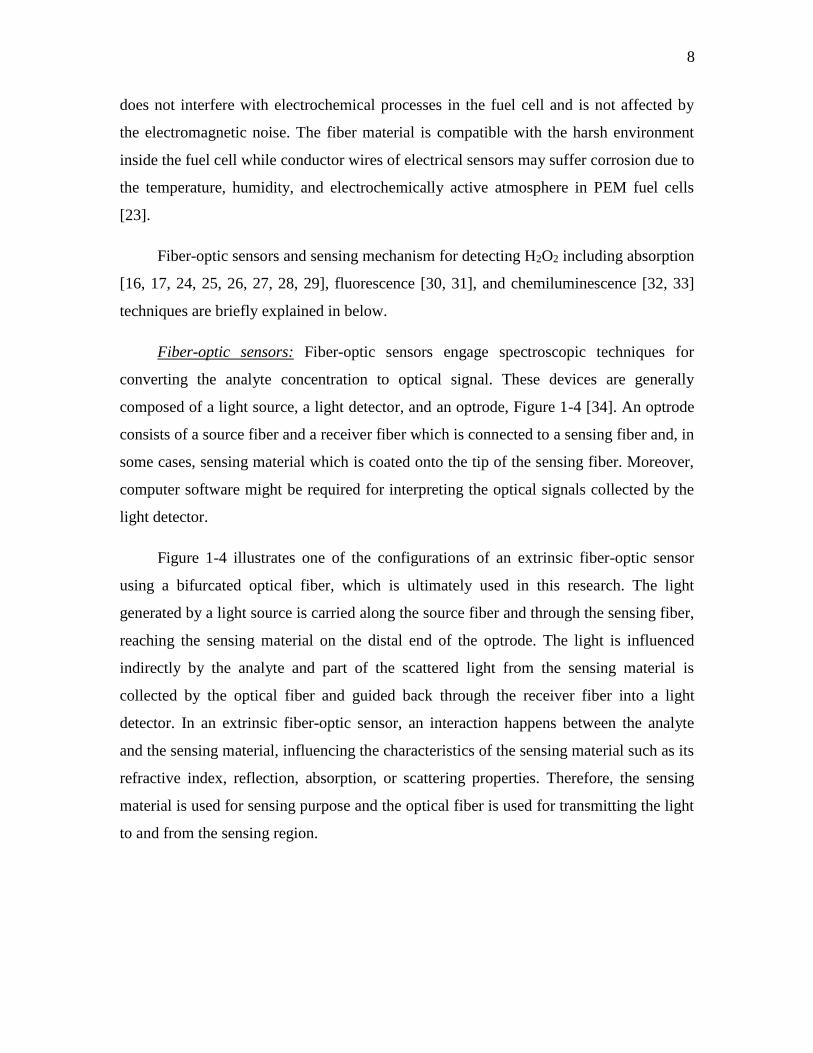
Fiber-optic sensors: Fiber-optic sensors engage spectroscopic techniques for
converting the analyte concentration to optical signal. These devices are generally
composed of a light source, a light detector, and an optrode, Figure 1-4 [34]. An optrode
consists of a source fiber and a receiver fiber which is connected to a sensing fiber and, in
some cases, sensing material which is coated onto the tip of the sensing fiber. Moreover,
computer software might be required for interpreting the optical signals collected by the
light detector.
Figure 1-4 illustrates one of the configurations of an extrinsic fiber-optic sensor
using a bifurcated optical fiber, which is ultimately used in this research. The light
generated by a light source is carried along the source fiber and through the sensing fiber,
reaching the sensing material on the distal end of the optrode. The light is influenced
indirectly by the analyte and part of the scattered light from the sensing material is
collected by the optical fiber and guided back through the receiver fiber into a light
detector. In an extrinsic fiber-optic sensor, an interaction happens between the analyte
and the sensing material, influencing the characteristics of the sensing material such as its
refractive index, reflection, absorption, or scattering properties. Therefore, the sensing
material is used for sensing purpose and the optical fiber is used for transmitting the light
to and from the sensing region.

9
Figure 1-4: Configuration of a fiber-optic sensor.
There are also intrinsic fiber-optic sensors in which the optical fiber is used not
only for guiding the light, but also for sensing purpose. The sensing of measureand by
optical fibers occurs when the optical fiber structure is influenced by the measureand.
This causes some changes in parameters like intensity, wavelength, phase, or polarization
of the output light. The fiber-Bragg-grating sensor used for temperature measurements in
PEM fuel cells is an example of a wavelength-modulated intrinsic fiber-optic sensor [21].
Absorption: Absorption-based fiber-optic sensors involve the absorption of light by
the analyte, or by a sensing material whose absorption is influenced by the analyte.
Therefore, the changes in the concentration of the analyte correlate to absorption-based
optical signals. In these sensors, white light passes through an optical fiber to the sensing
material and the amount of the light absorbed by the sensing material is determined by
measuring the light reflected back. The sensing scheme explained in previous section and
illustrated in Figure 1-4 is an example of an absorption-based fiber-optic sensor.
Fluorescence: In general, luminescence is emission of light by a substance as a
result of stimuli except heat. Fluorescence is a form of luminescence that is initiated by
photoexcitation. When a fluorescent molecule (fluorophore) absorbs light at certain
wavelength (excitation), the emission of light happens after a period of time (lifetime)
and at longer wavelength (fluorescence), Figure 1-5. The lifetime is defined as the
average amount of time that fluorophore stays in the excited state between the photon
absorption and the fluorescence emission. The wavelengths at which the excitation and
emission occur are unique fingerprints of each fluorophore. Therefore, measuring the

10
fluorescent intensity or fluorescent lifetime allows us not only to determine the presence
of the analyte, but also to correlate the fluorescent intensity to the concentration of the
analyte.
Figure 1-5: An illustration of excitation and fluorescence.
Chemiluminescence: Chemiluminescence is another form of luminescence that is
initiated by a chemical reaction. Since no light is required for excitation of molecules, no
light source is needed for the sensor application. There is usually an intermediate state
involved in a chemiluminescence, reaction (1-6), in which the step from the reactants to
the intermediate state is called exciting step and the step from the intermediate state to the
final products is called emission step.
1 2
Reactants Products + Light k k
Intermediate (1-6)
A chemiluminescence-based H2O2 sensor involves oxidation of a chemical
compound and requires the presence of a catalyst. For example, oxidation of luminol
(C8H7N3O2) by H2O2 in the presence of hemin (C34H32ClFeN4O4) results in
chemiluminescence. The reaction of luminol and H2O2 initially forms an exited state of 3-
aminophthalate (intermediate). This excited state then decays to a lower energy level
producing 3-aminophthalate and light [35].

11
Among the three aforementioned techniques, absorption-based techniques are one
of the simplest detection systems for sensing H2O2 and these methods do not require
expensive and complex instrumentation. Conversely, fluorescence-based techniques
require complex instrumentation including specialized light sources and detectors. The
performance of the chemiluminescence-based sensor, on the other hand, is highly
dependent on pH of the sensing environment with the maximum intensity of emitted light
in the pH value ranging from 8.5 to 9, and a very low response in acidic environments.
Therefore, the chemiluminescence-based technique is mostly suitable for developing
biosensors; and it does not seem suitable for application in PEM fuel cells with an
operating pH of 2.
Therefore, the absorption-based technique is chosen in this research for developing
H2O2 sensor suitable to be used in PEM fuel cells. This leads to the next step which is
choosing a sensing material for developing the H2O2 optrode.
1.4. Prussian Blue
Prussian blue (PB) is one of the sensing materials which has been successfully
demonstrated as an indicator of H2O2 in both electrochemical and spectroscopic manners
[36, 37]. PB is briefly described in Appendix B. The sensing mechanism of H2O2 by PB
through the absorption-based technique and the PB films preparation technique which is
used in this research are briefly described in Sections 1.4.1 and 1.4.2.
1.4.1. H2O2 Detection mechanism by Prussian Blue
The detection mechanism of the proposed optrode relies on the redox reactions of
PB/PW compound, and the evaluation of corresponding changes of the optical properties
of the compound, Figure 1-6. PB is reduced to PW in the presence of a reducing agent,
such as ascorbic acid. The reverse reaction happens when PW is exposed to an oxidizing
agent, such as H2O2, resulting in PB. PB has a strong intervalence charge transfer
absorption band near 700 nm because transition from FeIIIFeII to FeIIFeIII states absorbs
red photons, and reflects blue light. On the other hand, transparent PW does not have any
distinct bands in the visible range of its absorption spectrum [38]. As a result, the
increasing absorbance in the visible range while PW is oxidizing to PB by H2O2 is used

12
to detect the presence of this oxidant. Moreover, the initial PW state is recovered by
exposing PB to ascorbic acid. Figure 1-7 illustrates the detection mechanism of H2O2
using optrodes based on chemically deposited PB/PW system onto the tip of an optical
fiber.
Figure 1-6: (a) Electrochemical and (b) spectroscopic characteristics of PB (taken from [38],
Reproduced with permission from Taylor & Francis).
Figure 1-7: Detection mechanism of H2O2 using an optrode based on PB/PW system.
13
1.4.2. Preparation of Prussian Blue Films
Generally, PB can be synthesized by electrochemical [39, 40, 41, 42, 43] or
chemical [44, 45, 46, 47, 48, 49] paths. In the former case, the substrate should be
electrically conductive. Considering that optical fibers are made of non-conductive
materials, the chemical synthesis of PB is a more suitable approach. Several chemical
methods such as sol-gel [50, 51], sonochemichal [46], photochemical [52], hydrothermal
[47], and layer-by-layer (LbL) electrostatic self-assembly (ESA) [48] are used to
synthesize or immobilize PB nanoparticles and thin films onto non-conductive substrates.
In the chemical paths PB films are normally synthesized using a solution containing
two components: iron (II) salt and hexacyanoferrate (III), or iron (III) salt and
hexacyanoferrate (II) [53]. Using these precursors, PB forms directly in the presence of
both iron valences.
Among the aforementioned techniques, Single-source precursor (SSP) is the most
straightforward chemical technique that is used in this research to prepare PB films. SSP
is a synthesis approach in which all the elements that are required in the final product are
incorporated into one compound. In SSP technique, the precursor may participate in
several consecutive reactions to afford the final product. Potassium hexacyanoferrate (III)
(or potassium ferricyanide) was used as a single-source precursor containing just one of
the iron valences, (i.e. iron (III)) whereas both iron valences are required for formation of
PB. Therefore, redox reactions are required to occur in the course of PB formation to
provide both iron valences.
There are two possible mechanisms for chemical formation of PB from a single
source hexacyanoferrate (III). First, partial decomposition of hexacyanoferrate (III)
occurs in a high acidity environment of reacting mixture (1-7) [36]. Free iron (III) cations
from the associated complex are reduced to iron (II) cations (1-8). The iron (II) cations
then react with undissociated hexacyanoferrate (III) anions to form soluble PB (1-9) [54].
Since the reduction of iron (III) to iron (II) is unfavorable thermodynamically, the driving
force would be provided by the reaction of iron (II) cations and hexacyanoferrate (III)

14
anions [54]. The standard free energy change for the combined reactions is -177 kJ mol–1
[54].
33
6Fe CN 6H Fe 6HCN (1-7)
3+ + 2+12 2
12 4
Fe H O +HO +Fe (1-8)
3+ 2+ III II
6 6K +F+Fe Fe CNe CN KFe
(1-9)
In the second case, the iron (III) cations produced in (1-7) and hexacyanoferrate
(III) anions present in the solution can form a highly reactive complex of ferric
ferricyanide or Berlin green (BG) (1-10) [36]. This mixture has an oxidation potential
higher than that of each component, and it even causes oxidation of water [55]. For BG to
become PB, the presence of a reducing agent is necessary. It is reported that BG can
oxidize water (solvent), solution impurities, and liberate cyanides through reaction (1-11)
[39, 40, 54, 36]. However, liberated cyanides can play the role of main reducing agent –
more than water and the impurities– for the process of PB formation [36]. The reduced
BG reacts with free iron (III) cations in the solution and forms insoluble PB (1-12) [36].
3 II II3 I I
66Fe Fe CN Fe Fe CN
(1-10)
III III II III
6 6Fe Fe CN +e Fe Fe CN
(1-11)
II III 3+ III II
6 4 6 3Fe Fe3Fe Fe CN +Fe CN
(1-12)
Itaya et al. reported the chemical synthesis of PB using hexacyanoferrate (III) and
iron (III) chloride [39]. They studied the ratio of the total charges consumed in the
reduction of prepared PB and its oxidized form. Based on this ratio, they demonstrated
that the PB is insoluble [39], in agreement with the second interpretation.
1.5. Objectives
The overall objective of this research is to develop an H2O2 optrode that is able to
detect and measure H2O2 concentrations at operating temperature and pH corresponding

15
to an operating PEM fuel cell (i.e. 80 °C and pH 2). This overall objective is broken to
several steps as follows:
(1) To develop optrodes by depositing PB1 films onto the tip of the optical fibers,
Chapter 3.
(2) To demonstrate the capability of the sensor to detect and measure H2O2
concentrations at room temperature and pH 42, Chapter 3.
(3) To assess the functionality of the sensor to detect and measure H2O2
concentrations at different pH values including pH 2 (i.e. pH of PEM fuel
cells), Chapter 4.
(4) To find the deposition conditions that result in a stable PB film at the high
temperature and the low pH of the PEM fuel cell’s environment (i.e.
temperature range of 60 to 80 °C and pH 2), Chapter 5.
1.6. Structure of Dissertation
This dissertation comprises the current introductory chapter that serves to provide
context and framework that links the following chapters in terms of the research
motivation, background information, and objectives. A summary of key contributions of
this research is presented in Chapter 2. Chapters 3, 4 and 5 present these contributions in
the manuscript format. Each of these manuscripts is a proof-of-concept study on the
development of an optrode which responds to H2O2 concentrations in solutions at similar
temperature and pH to an operating PEM fuel cell. The relevant background,
experimental, and detailed aspects of the research are presented in Chapters 3 to 5, and
each chapter terminates with a conclusion. Finally the sixth chapter list all the
conclusions and possible future considerations for this work.
Chapter 3 presents the peer-reviewed published article [56] and describes the sensor
fabrication process and demonstrates the sensor response to H2O2 concentrations at room
temperature and pH 4. PB film is deposited onto the tip of an optical fiber through the
SSP method. SSP is a synthesis approach in which all the elements that are required in
1 The PB serves as an indicator of H2O2 in a spectroscopic manner. 2 pH 4 is chosen because the most reliable response of PB to H2O2 concentrations is reported at this pH [59].

16
the final product are incorporated into one compound. The effect of light exposure,
during the deposition of PB films, on the purity of PB compound is investigated. The
sensor response to H2O2 concentrations is evaluated and the reliability of the sensor
response is examined by performing multiple sensing tests with several different sensors.
This proof-of-concept leads to the next step which is investigating the functionality of the
sensor at different pH values with a focus on operating pH of PEM fuel cells.
Chapter 4 presents the peer-reviewed published article [57] and demonstrates the
sensor response to H2O2 concentrations at room temperature and different pH values (i.e.
pH 2 to 7). In spite of the effect of pH of the sensing test solution on sensor response, the
sensor is found to be functional for detecting and measuring H2O2 concentrations at
different pH values. More sensing tests are performed at pH 2 to evaluate the behavior of
the sensor in terms of the repeatability, reproducibility and durability of the sensor
response at this specific pH. The final stage of the research is to make sure that the sensor
remains functional at temperatures between 60 °C to 80 °C (PEM fuel cell’s operating
temperature).
Chapter 5 presents the peer-reviewed published article [58] and explains a
methodology for assessing stability of PB films in solutions with pH 2 and at elevated
temperatures. PB films are deposited on glass slides through different chemical
techniques. Then PB films are soaked in Phosphate-Buffer-Solutions (PBS) with pH 2
and at elevated temperatures for a day. These PB films are characterized using Fourier
transform infrared spectroscopy (FTIR) to analyze their stability following PBS
processing. Extra samples are prepared at different temperatures through the deposition
technique that leads to the most stable PB films. The same PBS processing is performed
on these samples following with FTIR analysis to find the temperature in which the most
stable PB films are prepared.
Conclusions from all contributions are summarized in Chapter 6 and suggestions
for possible future works are made in Chapter 6 as well.

Chapter 2
2. Summary of Key Results
This chapter provides a summary of key results from the three studies presented in
this dissertation. These studies, which are presented in Chapters 3 to 5, have been
published in peer-reviewed journals. The first study describes the process of sensor
development and analyzes the sensor response to H2O2 concentrations in aqueous
solutions at room temperature and pH 4. This work is extended in the second study which
evaluates the sensor behavior in environments with pH values ranging from 2 to 7. The
third study presents a systematic assessment of the stability of PB films, prepared under
different conditions, at elevated temperatures and in acidic environments (i.e. 80-90 °C
and pH 2).
2.1. Spectroscopic Detection of Hydrogen Peroxide with an Optical Fiber Probe
using Chemically Deposited Prussian Blue
The objectives of this study are: (1) to develop an H2O2 sensor that is immune to
electromagnetic interference and; (2) to study the response of the prepared sensor to H2O2
concentrations in aqueous solutions at room temperature and pH 4. A spectroscopic
technique using optical fibers is chosen for H2O2 detection in this study because the
special features of an optrode make it a suitable candidate for integration into an
operating PEM fuel cell. The special features of optrodes include; immunity to
electromagnetic interference, small size, flexibility, and compatibility of the fiber
material (i.e. silica glass) with electrochemically active environment of a PEM fuel cell.

18
The process of the sensor development includes deposition of PB films onto the
distal end of the fiber. Since the fiber material is not conductive, only chemical
techniques can be considered for PB deposition on the tip of the fiber, unless the fiber
surface is modified with a conductive material. Therefore, PB films are deposited
chemically in aqueous solutions using potassium ferricyanide as a single-source
precursor. Although PB films are deposited successfully onto the distal end of optical
fibers, analysis of PB films prepared through the same deposition technique but different
conditions of lighting reveals the effect of light on purity of PB compound. The light
exposure leads to formation of pure PB film, whereas deposition in darkness leads to co-
precipitation of PB and BG.
The prepared PB-based optrodes are used to detect H2O2 concentrations in buffered
solutions at room temperature of pH 4. This pH value was chosen because the previous
PB-based optrodes have demonstrated reliable response to H2O2 concentrations at this pH
value [59, 17]. The sensing test is performed by exposing the optrode to solutions with
different concentrations of H2O2 and collecting the reflected light, from the distal end of
the optical fiber, using a spectrometer. Different response times are obtained at different
concentrations of H2O2. These response times are found to vary linearly with H2O2
concentrations, on a log-log scale. This allows us not only to detect the presence of H2O2,
but also to measure its concentration.
Additional sensing tests are performed with multiple optrodes to investigate sensor
characteristics in terms of the repeatability, reproducibility and durability. Performing
multiple sensing tests with the optrode shows that sensor response is repeatable with an
adjusted-r-squared value of 0.91.
The optrode preparation through the SSP technique is tested for reproducibility by
preparing multiple optrodes at different times and then performing the same sensing test
with each optrode. This experiment demonstrates that the response times of optrodes vary
linearly with the change of H2O2 concentrations with a similar slope on a log-log scale.
In the final stage of this study, the durability of sensor response is investigated by
performing several sensing tests with an optrode four and seven months after optrode

19
preparation. Comparing those results reveals that the sensor behavior remains linear
although the slope of linear response is slightly changed. This change in the slope
necessitates periodic recalibration of the sensor.
The key findings of this study are as follows. (1) The SSP is a reproducible
technique for preparing PB-based optrodes. (2) The lighting conditions during PB
synthesis affect the purity of PB films. (3) The sensor detects concentrations of H2O2,
(i.e. 2 µM – 400 µM of H2O2) in aqueous solutions at room temperature and pH 4. (4)
The sensor responds to H2O2 concentrations seven months after its fabrication; however,
periodic recalibration is necessary because of the change in the slope of the sensor
response.
This study is published in Electrochimica Acta [56] and is presented in Chapter 3.
2.2. pH-dependent Response of a Hydrogen Peroxide Sensing Probe
The objectives of this study are: (1) to investigate the functionality of the sensor at
different pH values ranging from 2 to 7; (2) to evaluate the sensor response and
performance at pH 2 (i.e. PEM fuel cells operating pH). Investigating the sensor behavior
at different pH values is a crucial step to assess the functionality of the sensor in
environments with a pH fluctuation. This step also determines the possibility of using this
sensor in other environments with different pH values than that of an operating PEM fuel
cell. Evaluating the sensor performance at PEM fuel cell operating pH is also another
critical step to assess the suitability of this sensor for being used as an in situ sensor
inside a PEM fuel cell.
In this study, an optrode is first exposed to buffered solutions with different pH
values, ranging from 2 to 7, and a constant concentration of H2O2. Both the intensity and
time response of the sensor change in solutions with a constant concentration of H2O2 and
different pH values. Therefore, the pH of the sensing environment affects the sensor
behavior. This indicates the optrode requires recalibration prior to be used in each pH
value.

20
In the next step of this study, the sensor response to H2O2 concentrations and the
sensor characteristics are investigated at pH 2 (i.e. PEM fuel cell operating pH). An
optrode is exposed to solutions with different concentrations of H2O2. The response times
of the sensor is plotted versus H2O2 concentration on a log-log scale which shows the
sensor behavior at pH 2 is also linear with a different slope than that of at pH 4.
Repeating the same sensing experiment with the same optrode showed the sensor
response to H2O2 concentrations is reproducible at pH 2. Therefore, the sensor can be
used for in situ sensing of H2O2 inside a PEM fuel cell.
In the final step of this study, the optrode is exposed to solutions at different pH
values with different concentrations of H2O2 in each pH value. The sensor behavior is
consistent at different pH values, which allows us to detect and measure H2O2
concentrations at different pH values. However, the slope of the response time versus
H2O2 concentration plots varies with pH. This indicates that the sensitivity of the sensor
is different at different pH values with the higher sensitivity at lower pH values.
The key findings of this study are as follows. (1) The proposed optrode is
functional in solutions with pH values ranging from 2 to 7. (2) The pH of the sensing
environment affects the sensor behavior; making the sensor recalibration necessary
before using the optrode in each pH value. (3) The sensor detects H2O2 concentrations at
pH 2; validating the application of the sensor inside an operating PEM fuel cell, provided
that the sensor withstands the high temperatures inside PEM fuel cells. (4) The sensitivity
of the sensor is higher at lower pH values.
This study is published in Sensors and Actuators B: Chemical [57] and is presented
in Chapter 4.
2.3. Effect of Deposition Conditions on Stability of PB Films at PEMFC’s
Operating Temperatures and pH
The objective of this study is to find the deposition conditions which result in a PB
film that is stable at the PEM fuel cell operating temperature and pH. This study is
motivated by previous studies that have shown that PB films tested in solutions at
elevated temperatures are prone to leaching [60].

21
Three different deposition methods are used to prepare PB films: sol-gel dip
coating, direct chemical process (i.e. using both iron valences as precursors), and SSP.
All samples are prepared in reaction mixtures at temperature of 60 °C. The prepared PB
films are left in PBS with pH 2 and at elevated temperatures for a day3. FTIR analyses are
performed with all PB films before and after PBS processing. The results show the film
prepared through the SSP method has the highest stability after PBS processing.
Additional samples are prepared through the SSP method and at different
deposition temperatures (i.e. 40 °C, 60 °C, and 80 °C) to find the temperature that leads
to the most stable PB film. PBS processing of the samples is performed and followed by
the FTIR analysis. The FTIR analysis reveals that the film prepared at 40 °C is
completely leached into the PBS, while the films prepared at 60 °C and 80 °C are
sufficiently robust to sustain the PBS processing. Therefore, the deposition temperature
of over 60 °C is chosen for optrode preparation for in situ sensing tests.
The key findings of this study are as follows. (1) The PB film prepared through the
SSP technique is more stable than the PB films prepared through the sol-gel dip coating
and direct chemical process. (2) The optrode that is prepared by deposition of PB film
through the SSP method and at deposition temperatures over 60 °C remains stable at
PEM fuel cell operating temperatures and pH.
This study is published in Journal of The Electrochemical Society [58] and is
presented in Chapter 5.
3 The temperature and time period for PBS processing are overestimated based on the condition through which in situ
sensing tests may be performed inside PEM fuel cells.

Chapter 3
3. Spectroscopic Detection of Hydrogen Peroxide with an Optical Fiber Probe using
Chemically Deposited Prussian Blue
(Electrochimica Acta, volume 115, 2014, 416–424)
Reproduced with permission from Elsevier
Preamble
The primary objectives of this research are to develop a fiber-optic sensor, and to
demonstrate the sensor capability to detect and measure H2O2 concentrations in solutions
at room temperature and with a constant pH value. These are two major contributions that
validate the proof-of-concept in this research. In the first part, the process of sensor
development is described with a focus on the deposition process of PB films onto the tip
of optical fibers. The second part presents an investigation of the sensor behavior and the
sensor characteristics in terms of the stability and reliability of sensor response.
The Body of this chapter was published in Electrochimica Acta.
Abstract
A novel fiber-optic hydrogen peroxide sensing probe was fabricated using
chemically deposited ferric ferrocyanide, often referred to as Prussian blue (PB). The
probe features a fast linear response and durability, due to the robustness and purity of the
PB film. Potassium ferricyanide was used as a single source precursor in a
straightforward chemical deposition of nanostructured PB onto the tip of a multimode
optical fiber. Spectroscopic detection of hydrogen peroxide (H2O2) was performed based

23
on the reduction of PB to Prussian white (PW) by agents like ascorbic acid, and oxidation
of PW to PB by H2O2. Measurement of H2O2 concentration is based on the changes of the
absorption spectrum, under visible light, of PB and PW. The fiber-optic probes exhibit a
linear response to concentration on a log-log scale and are found suitable for determining
small concentrations of H2O2. Multiple tests were performed to investigate the
repeatability and durability of a sensor response and though requiring recalibration, the
probes were found to remain functional for an extended period of time.
Keywords: Chemical deposition, Hydrogen peroxide, Optical fiber sensor, Prussian blue,
Single source precursor, Spectroscopic detection.
3.1. Introduction
H2O2 is commonly used in many industrial and medical processes such as water
treatment plants and disinfection [61, 62]. It is also a by-product of oxidative
metabolisms [63]. Detection and determination of small concentrations of hydrogen
peroxide remains a major challenge in many fields where it plays a main role in a variety
of damage mechanisms. For example, H2O2 induces cellular damage in human cells [64,
65] and its presence can be used to diagnose illnesses such as asthma [66]. It is also
believed to be responsible for chemical degradation of polymer membranes in PEM-Fuel
cells [3, 4, 5, 6]. Conventional techniques to detect H2O2 comprise titrimetric,
colorimetric, and gasometric methods which, in general, require complex equipment and
time consuming sample preparation, or have poor selectivity and limits of detection [14].
Electrochemical and spectroscopic techniques on the other hand are able to determine
small concentrations of H2O2 and have good selectivity [14, 15, 16, 17, 18, 19], with
spectroscopic techniques being preferred for many biochemical and industrial
applications because of their immunity to electromagnetic interference. Spectroscopic
detection includes chemiluminescent [32, 33], fluorescent [30, 31], and absorptive [16,
17, 24, 25, 26, 27, 28, 29] techniques.
The absorptive technique chosen in the present work relies on a detector agent film
deposited onto the tip of optical fiber. It affords a small size, flexible fiber-optic sensing
probe that is immune to electromagnetic interference. The prepared sensing probe has

24
potential for developing in-situ sensors for PEM-Fuel cells, as well as portable
biosensors.
PB was chosen as an H2O2 indicator for the proposed fiber-optic probe because of
its sensitivity and selectivity toward H2O2 [16, 55]. PB is a ferric ferrocyanide with the
basic face-centered-cubic crystalline structure consisting of iron ions linked by the
cyanide groups with two chemical forms Fe4III[FeII(CN)6]3 and KFeIIIFeII(CN)6 [39, 40].
These two chemical forms are commonly known as “insoluble” and “soluble”,
respectively [40]. Both insoluble and soluble forms of PB are highly insoluble (Ksp = 10-
40), the difference refers to the simplicity of potassium peptization [54]. Large metal
cations and water molecules, as well as other small molecules like H2O2, can be
accommodated in the open structure of PB [54]. Chemical reduction and oxidation of PB
leads to PW (potassium ferrous ferrocyanide) and Berlin green (BG) (ferric ferricyanide),
with chemical formula K2FeIIFeII(CN)6, and FeIIIFeIII(CN)6, respectively [39, 54].
Figure 3-1: Detection mechanism of H2O2 using fiber-optic sensing probe based on PB/PW
system.
The H2O2 detection mechanism in the absorptive technique based on PB relies on
the redox reactions of PB/PW system, and the evaluation of corresponding changes of the
optical properties of the compound. PB will be reduced to PW in the presence of a
reducing agent, such as ascorbic acid. The reverse reaction happens when PW is exposed
to an oxidizing agent, such as H2O2, resulting in PB. PB has a strong intervalence charge

25
transfer absorption band near 700 nm because transition from FeIIIFeII to FeIIFeIII states
absorbs red photons, and reflects blue light. On the other hand, transparent PW does not
have any distinct bands in the visible range of its absorption spectrum [38]. As a result,
the increasing absorbance in the visible range while PW is oxidizing to PB by H2O2 can
be used to detect the presence of this oxidant. Moreover, the initial PW state can be
recovered by exposing PB to ascorbic acid. Figure 3-1 illustrates the detection
mechanism of H2O2 using fiber-optic sensing probe based on chemically deposited
PB/PW system onto the tip of an optical fiber.
Generally, PB can be synthesized by electrochemical [39, 40, 41, 42, 43] or
chemical [44, 45, 46, 47, 48, 49] paths. In the former case, the substrate should be
electrically conductive. Considering that optical fibers are made of non-conductive
materials, the chemical synthesis of PB would be a more suitable approach. Several
chemical methods such as sol-gel [50, 51], sonochemichal [46], photochemical [52],
hydrothermal [47], and electrostatic self-assembly [48] have been used to synthesize or
immobilize PB nanoparticles and thin films onto non-conductive substrates.
In the present work, a PB thin film was chemically deposited onto the tip of an
optical fiber through the single-source precursor approach which, to the best of our
knowledge, is the simplest method for synthesizing PB nanoparticles. This method allows
the particle size, shape, and porosity to be adjusted by tuning the synthesis parameters
such as solution pH, concentration of precursor, temperature and time of synthesis, and
reaction environment light [46, 52]. After the synthesis of PB, the optical fiber probe was
annealed and sensing measurements were performed at room temperature in H2O2
buffered solutions with pH 4. Repeatability, durability, and reproducibility of sensor
responses were analyzed using multiple sensing probes.
3.2. Experimental
3.2.1. Materials
Potassium hexacyanoferrate (III) (product No. 13746-66-2) from Sigma-Aldrich
was used as single-source precursor in an aqueous solution of Hydrochloric acid (HCl)
(37%) for synthesizing PB onto the tip of an optical fiber. L-ascorbic acid from Aldrich,

26
(catalog No. 25,556-4), was used as the reducing agent for the PB to PW reaction. Glacial
acetic acid, (product No. 00598-468) from Anachemia and Sodium acetate trihydrate,
(product No. S-1850) from ACP Chemicals were used to prepare an acetate buffer
solution (ABS) at pH 4.0 in which the H2O2 solutions and ascorbic acid were prepared.
The reducing solution was prepared in ABS with 0.04 mol L−1 of L-ascorbic acid. H2O2
(30 wt%) from ACP Chemicals was used to prepare the oxidizing solutions at different
concentrations in ABS. Sodium hydroxide (NaOH) and Hydrochloric acid (HCl) at
concentrations of 0.1mol L−1 were used to adjust the pH of the solutions to the desired
values. All chemicals were used as received with no further purification. The water used
in the experiments was purified with a four-cartridge purification system (Super- Q Plus,
Millipore, Billerica, MA) and had a resistivity of 18.2 MΩ cm. The optical fiber was a
multi-mode AFS50/125Y from Thorlabs (Newton, NJ), with core and cladding diameters
of 50 μm and 125 μm, respectively.
3.2.2. Chemical Deposition of Prussian Blue
The PB film was deposited chemically using the distal end of an optical fiber as a
substrate. The optical fiber was cleaved and cleansed with isopropanol. In a synthesis
process, 0.25 mmol of K3Fe(CN)6 were added to 25mL of an aqueous solution of 0.1 mol
L–1 hydrochloric acid. The optical fiber was immersed in this prepared mix, and was kept
at 40°C under continuous stirring at 300 rpm for 10 hours. The synthesis process was
done under the fluorescent lamp light exposure. Finally, the optical fiber was left inside
the solution to cool to room temperature. The prepared fiber-optic probe was removed
from the solution and left at room temperature and relative humidity for one day, and
then it was annealed at 100°C for 15 min.
In the present work, the sensing region with PB was located at the distal end of the
optical fiber rather than along the fiber in order to facilitate the eventual integration of the
probe into the membrane of a PEM fuel cell. With the distal end PB deposition, the probe
operates based on the reflected light from the sensing region and only requires an inlet
port into the membrane. In the other case, the operation of the probe would relies on the
attenuation of the transmitted light through the optical fiber, similarly to the fiber sensor
presented by Hu and Tao [20]; This requires both inlet and outlet ports, which would

27
impose additional design constraints to ensure proper alignment and sealing of the
sensing probe within a fuel cell.
3.2.3. Characterization of the Prussian Blue
The effect of light exposure in synthesis process was characterized by Raman
spectroscopy. Two samples were prepared on plain microscope slides in two conditions:
(a) under fluorescent lamp light exposure, and (b) in darkness. The Raman spectra were
recorded using Renishaw inVia microRaman system equipped with a He-Ne laser source
with excitation at 785 nm and a laser power of 1mW. The light reflection from the distal
end of optical fibers during synthesis in both conditions were recorded and analyzed.
3.2.4. Sensing Test Procedures and Instrumentation
The sensing behavior of the probe to solutions with concentrations of H2O2 ranging
from 2 μmol L–1 to 400 μmol L–1was evaluated in liquid phase. H2O2 solutions were
prepared in ABS with a pH of 4.0±0.1. L-ascorbic acid in solution was used as a reducing
agent in all tests. This solution was prepared at a concentration of 0.04 mol L–1 using
ABS as solvent and adjusting its pH to 4.0±0.1. The pH measurements of all the prepared
solutions were performed using a digital pH-meter (AR25 accumet®, Fisher Scientific,
Hampton, NH) using an (Ag|AgCl) electrode.
The sensing measurement method, as described in detail in [59], includes the
following steps. The sensing probe is immersed in the ascorbic acid and H2O2 solutions
alternately for the recovery and oxidation steps of the PB/PW system. Three sequences of
concentrations of H2O2 solutions were used during the tests. In the first, H2O2
concentrations were chosen randomly in the range of 2 μmol L–1 to 400 μmol L–1. In the
second, the concentration of H2O2 increased from 2 μmol L–1 to 200 μmol L–1 and then
decreased back to 2 μmol L–1. In the final sequence, H2O2 concentrations decreased from
400 μmol L–1 to 5 μmol L–1 and increased back to 400 μmol L–1.
In each of the sequences, the sensing probe was initially immersed in an ascorbic
acid solution to promote the reduction of PB to PW. When the intensity of reflected light
from the sensing probe plateaued to a minimum level, it was considered to have reached
the PW state. The optical fiber was then removed from the ascorbic acid and placed in the
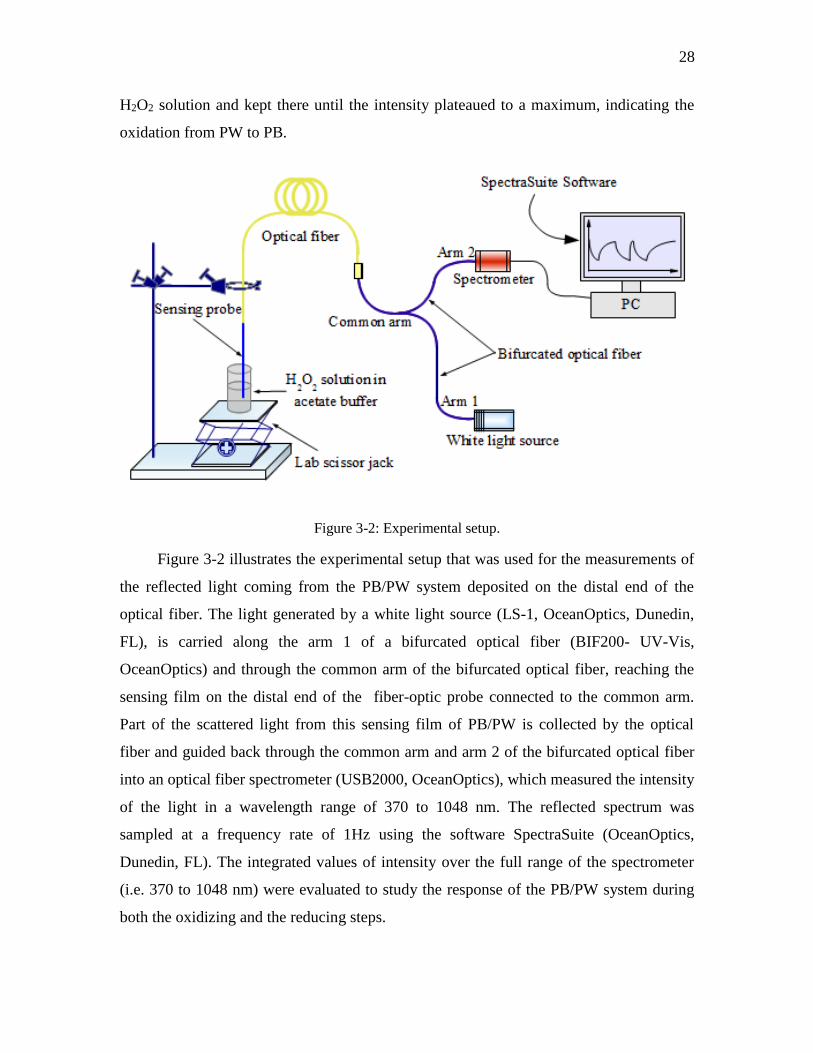
28
H2O2 solution and kept there until the intensity plateaued to a maximum, indicating the
oxidation from PW to PB.
Figure 3-2: Experimental setup.
Figure 3-2 illustrates the experimental setup that was used for the measurements of
the reflected light coming from the PB/PW system deposited on the distal end of the
optical fiber. The light generated by a white light source (LS-1, OceanOptics, Dunedin,
FL), is carried along the arm 1 of a bifurcated optical fiber (BIF200- UV-Vis,
OceanOptics) and through the common arm of the bifurcated optical fiber, reaching the
sensing film on the distal end of the fiber-optic probe connected to the common arm.
Part of the scattered light from this sensing film of PB/PW is collected by the optical
fiber and guided back through the common arm and arm 2 of the bifurcated optical fiber
into an optical fiber spectrometer (USB2000, OceanOptics), which measured the intensity
of the light in a wavelength range of 370 to 1048 nm. The reflected spectrum was
sampled at a frequency rate of 1Hz using the software SpectraSuite (OceanOptics,
Dunedin, FL). The integrated values of intensity over the full range of the spectrometer
(i.e. 370 to 1048 nm) were evaluated to study the response of the PB/PW system during
both the oxidizing and the reducing steps.

29
3.3. Results and Discussion
3.3.1. Chemical Deposition of Prussian Blue
PB films are normally synthesized using a solution containing two components:
iron (II) salt and hexacyanoferrate (III), or iron (III) salt and hexacyanoferrate (II) [53].
Using these precursors, PB forms directly in the presence of both iron valences. In the
current work, potassium hexacyanoferrate (III) was used as a single-source precursor. In
this case, a redox reaction needs to occur during synthesis to provide both iron valences.
There are two possible mechanisms for chemical formation of PB from a single
source hexacyanoferrate (III). In the first, partial decomposition of hexacyanoferrate (III)
occurs in a high acidity environment of reacting mixture (3-1) [36]. Free iron (III) cations
from the associated complex are reduced to iron (II) cations (3-2). The iron (II) cations
then react with undissociated hexacyanoferrate (III) anions to form soluble PB (3-3) [54].
Since the reduction of iron (III) to iron (II) is unfavorable thermodynamically, the driving
force would be provided by the reaction of iron (II) cations and hexacyanoferrate (III)
anions [54]. The standard free energy change for the combined reactions is -177 kJ mol–1
[54].
33
6Fe CN 6H Fe 6HCN (3-1)
3+ + 2+12 2
12 4
Fe H O +HO +Fe (3-2)
3+ 2+ III II
6 6K +F+Fe Fe CNe CN KFe
(3-3)
In the second case, the iron (III) cations produced in (3-1) and hexacyanoferrate
(III) anions present in the solution can form a highly reactive complex of ferric
ferricyanide or BG (3-4) [36]. This mixture has an oxidation potential higher than that of
each component, and it even causes oxidation of water [55]. For BG to become PB, the
presence of a reducing agent is necessary. It has been reported that BG can oxidize water
(solvent), solution impurities, and liberate cyanides through reaction (3-5) [39, 40, 54,
36]. However, liberated cyanides can play the role of main reducing agent –more than
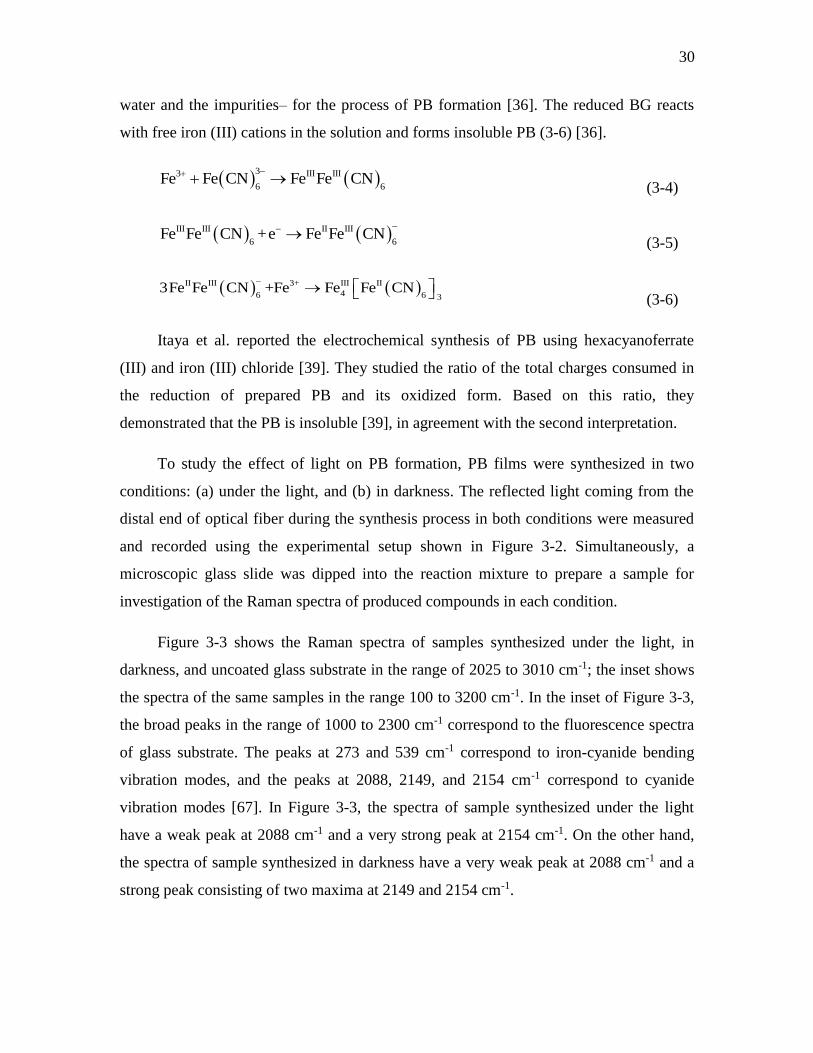
30
water and the impurities– for the process of PB formation [36]. The reduced BG reacts
with free iron (III) cations in the solution and forms insoluble PB (3-6) [36].
3 II II3 I I
66Fe Fe CN Fe Fe CN
(3-4)
III III II III
6 6Fe Fe CN +e Fe Fe CN
(3-5)
II III 3+ III II
6 4 6 3Fe Fe3Fe Fe CN +Fe CN
(3-6)
Itaya et al. reported the electrochemical synthesis of PB using hexacyanoferrate
(III) and iron (III) chloride [39]. They studied the ratio of the total charges consumed in
the reduction of prepared PB and its oxidized form. Based on this ratio, they
demonstrated that the PB is insoluble [39], in agreement with the second interpretation.
To study the effect of light on PB formation, PB films were synthesized in two
conditions: (a) under the light, and (b) in darkness. The reflected light coming from the
distal end of optical fiber during the synthesis process in both conditions were measured
and recorded using the experimental setup shown in Figure 3-2. Simultaneously, a
microscopic glass slide was dipped into the reaction mixture to prepare a sample for
investigation of the Raman spectra of produced compounds in each condition.
Figure 3-3 shows the Raman spectra of samples synthesized under the light, in
darkness, and uncoated glass substrate in the range of 2025 to 3010 cm-1; the inset shows
the spectra of the same samples in the range 100 to 3200 cm-1. In the inset of Figure 3-3,
the broad peaks in the range of 1000 to 2300 cm-1 correspond to the fluorescence spectra
of glass substrate. The peaks at 273 and 539 cm-1 correspond to iron-cyanide bending
vibration modes, and the peaks at 2088, 2149, and 2154 cm-1 correspond to cyanide
vibration modes [67]. In Figure 3-3, the spectra of sample synthesized under the light
have a weak peak at 2088 cm-1 and a very strong peak at 2154 cm-1. On the other hand,
the spectra of sample synthesized in darkness have a very weak peak at 2088 cm-1 and a
strong peak consisting of two maxima at 2149 and 2154 cm-1.

31
Figure 3-3: Raman spectra in the range of 2025-3010 cm-1of red line) uncoated glass substrate,
blue line) sample synthesized in darkness, and green line) sample synthesized under the
fluorescent lamp light exposure. The inset is the Raman spectra of same samples in the range of
100-3200 cm-1.
The weak peak around 2088 and very strong peak at 2154 cm-1 are the
characteristic peaks for PB [67]. As shown in Figure 3-3 the sample synthesized under
the light has the same characteristic peaks, and since it does not exhibit any extra peaks, it
is therefore pure PB. The strong peak at 2149 cm-1 is the characteristic peak for BG [67].
The sample synthesized in darkness has a strong peak at 2149 cm-1 which indicates the
presence of BG in the sample. It also has a very weak peak around 2088 cm-1 and a
distinct peak at 2154 cm-1, which are the characteristic peaks of PB. Therefore, the
sample synthesized in darkness has both PB and BG in the form of
Fe4III[FeII(CN)6]3xFeIIIFeIII(CN)61-x.
These results show that iron (III) is reduced to iron (II) even in the absence of light.
Although, the iron (II) production rate is not sufficient to form just PB, and another
reaction also occurs between iron (III) and hexacyanoferrate (III) to form BG. On the
other hand, it is found that exposure to light during the synthesis process promotes the

32
reduction of iron (III) to iron (II). The iron (II) production rate, in this case, is sufficiently
high to form just PB.
Figure 3-4: The light reflection from the distal end of an optical fiber during synthesis a) in
darkness and in 720 ± 15 nm, b) under the light exposure in 720 ± 15 nm, c) in darkness and in
420 ± 15 nm, and d) under the light exposure in 420 ± 15 nm.
Figure 3-4 depicts the intensity of reflected light coming from the distal end of an
optical fiber during the synthesis processes. The intensities integrated over the range of
720 ± 15 nm and 420 ± 15 nm are shown respectively in Figure 3-4 (a) and (b), and
Figure 3-4 (c) and (d). Figure 3-4 (a) and (c), and Figure 3-4 (b) and (d) belong to
samples synthesized in darkness and under the light, respectively.
In general, two phenomena affect the amount of light reflection from the distal end
of an optical fiber: changes in the reaction mixture that generally result in changes in the
imaginary part of the reaction mixture’s refractive index; and variation in the
precipitation of the compounds, with each having its own characteristics absorbance
spectrum, onto the distal end of optical fiber.

33
As seen in Figure 3-4 (a), the intensity of light around 720 nm decreases during the
synthesis in darkness. This may happen when no PB is being produced, or when PB is
produced but its formation rate is very low. Traces of PB are seen in the Raman result for
the sample synthesized in darkness. Therefore, PB is produced in darkness but the effect
of changes of reaction mixture’s refractive index is dominant and causes a decrease in
light reflection from the distal end of the optical fiber. Figure 3-4 (c) depicts the intensity
of light around 420 nm for sample synthesized in darkness, which initially increases, and
starts to decrease after an hour. Increasing the intensity at this wavelength is evidence for
formation of BG and it shows, as soon as introducing the optical fiber to the reaction
mixture in darkness the BG starts to from. The decrease of intensity after the initial
period is due to the change in the reaction mixture’s refractive index, with reflection
becoming dominant. The increase of light reflection around 720 nm for the sample
synthesized under illumination illustrates the high rate of PB formation in this condition,
Figure 3-4 (b). The purity of synthesized PB under illumination is supported by the
absence of change in the light reflection around 420 nm, Figure 3-4 (d).
The results of monitoring the light reflection from the distal end of optical fiber
during the synthesis in darkness and under the light are in good agreement with Raman
spectra of the synthesized samples. Both imply the formation of pure PB while the
synthesis is being done under illumination and formation of PB and BG simultaneously
while the synthesis is being done in darkness.
3.3.2. Sensing Behavior
The time response of the intensity of the reflected light from the distal end of the
sensing probe during its immersion in solutions at random concentrations of H2O2 is
shown in Figure 3-5. The circles and squares indicate the instant at which the sensing
probe was immersed into the H2O2 test solution and ascorbic acid, respectively. Since
PW has a low absorbance under visible light, when the film is in PW state the majority of
the light transmits through the film, and consequently, a lower intensity of reflected light
is attained. The intensity of the recorded light starts rising after the immersion of the
sensing probe in the H2O2 solutions due to oxidation of PW to PB. This behavior
continues until plateauing at a maximum reflectance in PB state. Following the

34
immersion of the probe in ascorbic acid, the intensity decreases as the reagent returns the
PB deposited film to its PW state.
Figure 3-5: Response of the sensing probe to immersion in solutions with random H2O2
concentration.
The intensities after each immersion shown in Figure 3-5 reach essentially the same
value. Koncki et al. proved earlier that the changes in the intensity of the reflected light
from the PB/PW system are related to the total amount of H2O2 that enters in contact with
the sensing film and the extent of the reaction [36]. In addition to this, the porosity and
particle size of the PB/PW structure determine the surface area of the film accessible to
H2O2. These parameters control the extension of the reaction between the H2O2 and
sensing film. As a result, the intensity of the optical signal is related to the extent of
reaction and not to the concentration of the H2O2 [16, 38, 36]. In the case of the probe
used in this work, only the portion of the sensing film that covers the flat portion of the
distal end is responsible for the light scattered back into the optical fiber and that is
measured by the spectrometer. Due to the small amount of PB/PW compound involved in
the reaction and the constant intensity after each test performed, it is believed that the test
solutions are able to oxidize almost all the PW to PB even at very low concentrations of
H2O2, which directly affects the detection limit of the probe.
Despite this drawback, there is a beneficial distinction between the signals
corresponding to the tests at different concentrations of H2O2. The time it takes the signal
to reach the saturation level decreases with increasing concentrations of H2O2. This
behavior is governed by the increased diffusion rates associated with the higher
concentration potentials. This behavior was previously observed in the development of
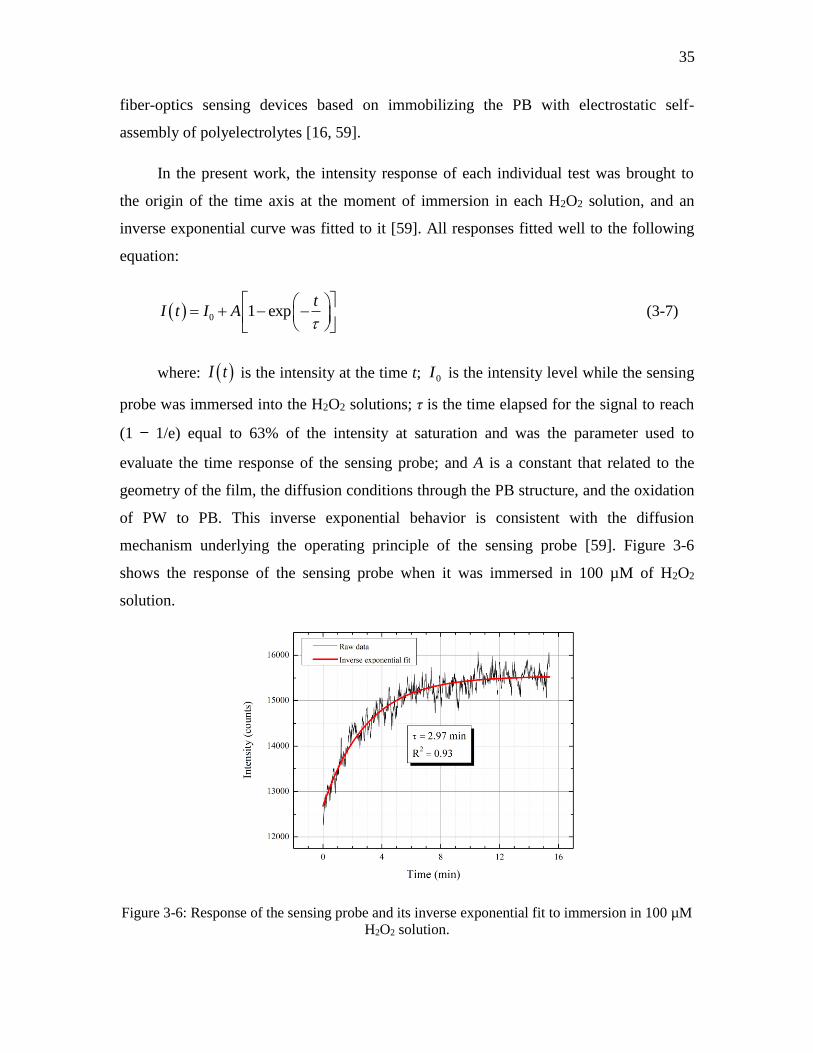
35
fiber-optics sensing devices based on immobilizing the PB with electrostatic self-
assembly of polyelectrolytes [16, 59].
In the present work, the intensity response of each individual test was brought to
the origin of the time axis at the moment of immersion in each H2O2 solution, and an
inverse exponential curve was fitted to it [59]. All responses fitted well to the following
equation:
0 1 expt
I t I A
(3-7)
where: I t is the intensity at the time t; 0I is the intensity level while the sensing
probe was immersed into the H2O2 solutions; τ is the time elapsed for the signal to reach
(1 − 1/e) equal to 63% of the intensity at saturation and was the parameter used to
evaluate the time response of the sensing probe; and A is a constant that related to the
geometry of the film, the diffusion conditions through the PB structure, and the oxidation
of PW to PB. This inverse exponential behavior is consistent with the diffusion
mechanism underlying the operating principle of the sensing probe [59]. Figure 3-6
shows the response of the sensing probe when it was immersed in 100 µM of H2O2
solution.
Figure 3-6: Response of the sensing probe and its inverse exponential fit to immersion in 100 µM
H2O2 solution.

36
The characteristic response time, τ, versus the H2O2 concentration plotted in Figure
3-7, shows that the probe exhibits a linear response to H2O2 concentration on a log-log
scale. Calibration of the probe can thus be performed by fitting the log-log relation to two
data points using two solutions with known amounts of H2O2.
Figure 3-7: Time response of sensing probe versus H2O2 concentration.
One of the features of this sensing probe that distinguishes it from previously
reported sensors is the nearly-constant signal baselines in the response at either the PB or
the PW state, shown in Figure 3-5. Other fiber-optic sensing probes based on the PB/PW
system have been fabricated immobilizing PB by the technique of electrostatic self-
assembly of polyelectrolytes [16, 17, 59]. Some of the reported baselines in those studies
were not stable, suggesting that not all the immobilized PB/PW takes part in the redox
reactions. This causes some uncertainty in the interpretation of the behavior of the
sensing probe. An additional advantage of the pure chemical deposition used here is the
faster response and recovery times, which can be attributed to the easier diffusion in a
pure PB/PW, as opposed to the slower diffusion through a multilayered structure of
polyelectrolytes.
The uncertainties in determining concentration and response time of the probe were
estimated for 100 µM H2O2 since it is a representative value of the evaluated range. The
uncertainties for this case are ± 5 % for concentration and ± 14 % for the response time.

37
3.3.3. Repeatability
Various experiments comprising multiple sensing tests were performed with the
same sensing probe to demonstrate the repeatability of the results. As noted in the
experimental section, in every experiment the sequence of concentrations of the H2O2
solutions was different. Figure 3-8 presents the time response vs. concentration for four
experiments using the same sensing probe with different sequences of sensing tests.
These sequences include two sets with random concentrations, one decreasing and then
increasing the concentration, and one increasing and then decreasing the concentration.
The error bars are the Estimated Standard Deviation (STDEV) for each concentration.
The probe exhibits a linear behavior with slopes similar to those in the single test
presented in Figure 3-7.
Figure 3-8: Average time response of sensing probe versus H2O2 concentration.
3.3.4. Reproducibility
Three sensing probes were prepared in the same manner at different times and
multiple sensing experiments were done with each. The intensity response of these
probes is plotted vs. time in Figure 3-9. The saturation intensities at PB and PW states are
different for different sensing probes, but all these probes exhibited the same behavior
and the characteristic decrease in response time with higher H2O2 concentration.
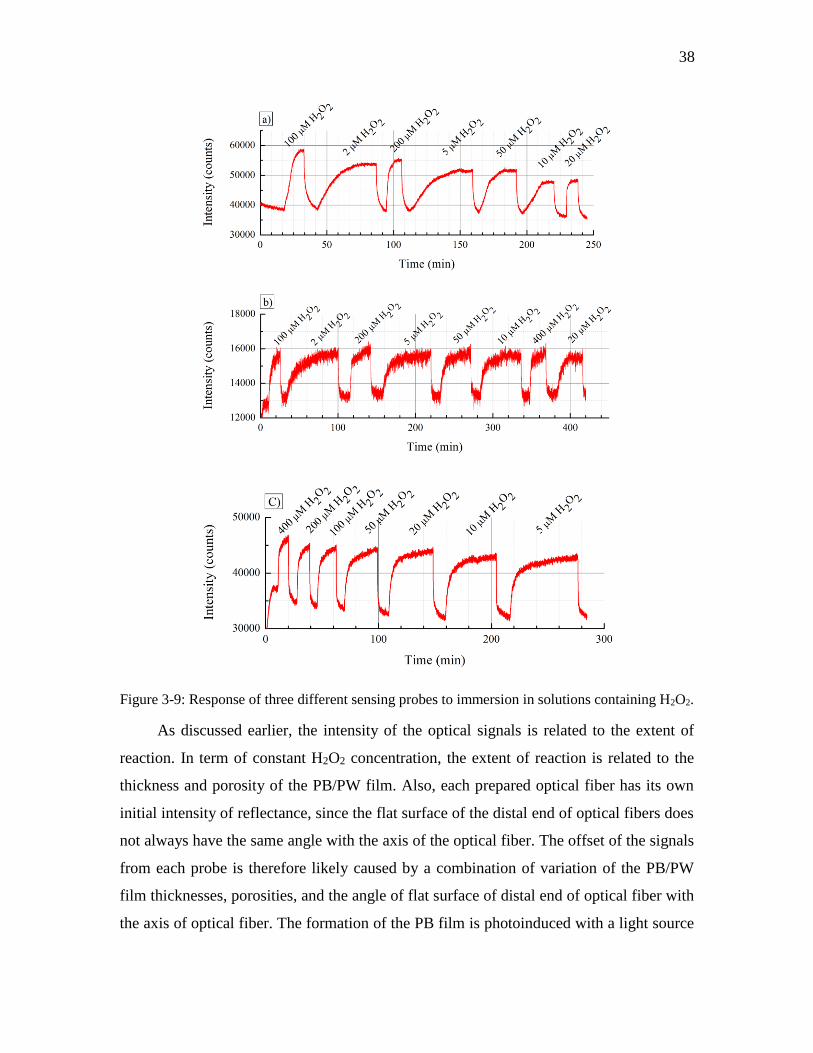
38
Figure 3-9: Response of three different sensing probes to immersion in solutions containing H2O2.
As discussed earlier, the intensity of the optical signals is related to the extent of
reaction. In term of constant H2O2 concentration, the extent of reaction is related to the
thickness and porosity of the PB/PW film. Also, each prepared optical fiber has its own
initial intensity of reflectance, since the flat surface of the distal end of optical fibers does
not always have the same angle with the axis of the optical fiber. The offset of the signals
from each probe is therefore likely caused by a combination of variation of the PB/PW
film thicknesses, porosities, and the angle of flat surface of distal end of optical fiber with
the axis of optical fiber. The formation of the PB film is photoinduced with a light source
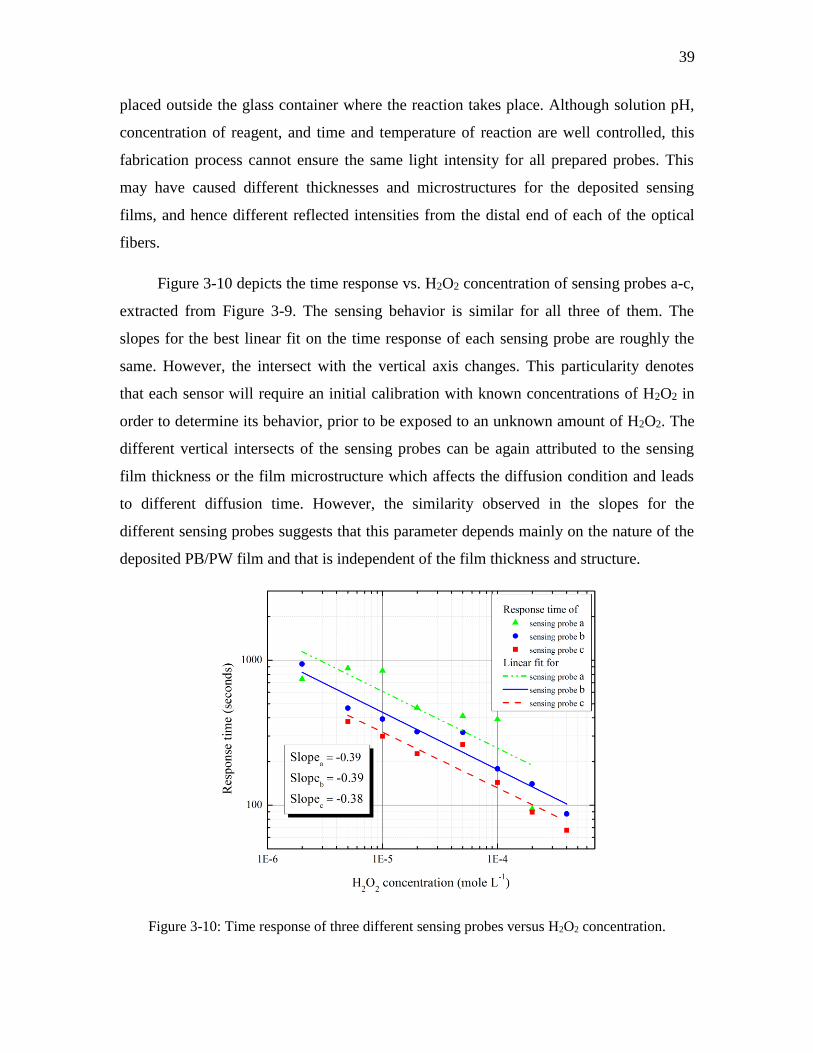
39
placed outside the glass container where the reaction takes place. Although solution pH,
concentration of reagent, and time and temperature of reaction are well controlled, this
fabrication process cannot ensure the same light intensity for all prepared probes. This
may have caused different thicknesses and microstructures for the deposited sensing
films, and hence different reflected intensities from the distal end of each of the optical
fibers.
Figure 3-10 depicts the time response vs. H2O2 concentration of sensing probes a-c,
extracted from Figure 3-9. The sensing behavior is similar for all three of them. The
slopes for the best linear fit on the time response of each sensing probe are roughly the
same. However, the intersect with the vertical axis changes. This particularity denotes
that each sensor will require an initial calibration with known concentrations of H2O2 in
order to determine its behavior, prior to be exposed to an unknown amount of H2O2. The
different vertical intersects of the sensing probes can be again attributed to the sensing
film thickness or the film microstructure which affects the diffusion condition and leads
to different diffusion time. However, the similarity observed in the slopes for the
different sensing probes suggests that this parameter depends mainly on the nature of the
deposited PB/PW film and that is independent of the film thickness and structure.
Figure 3-10: Time response of three different sensing probes versus H2O2 concentration.

40
3.3.5. Durability
The durability of a number of the sensing probes and the reliability in the
measurements were evaluated by performing similar sensing experiments four and seven
months after fabrication. The intensity responses of the sensing probe are presented in
Figure 3-11. The maximum intensity that the signal reached is slightly lower for the
probe tested in the seventh month. Since the probe was subjected to multiple experiments
within the fourth and seventh month, the decrease is likely due to a leaching of the
immobilized compound. Hence, to ensure accurate measurements in H2O2 concentration,
periodic recalibrations may be required in practice.
Figure 3-11: Response of a sensing probe to immersion in solutions containing H2O2 four and
seven months after its fabrication.
Figure 3-12 depicts the time response of the experiments remains linear with the
sensing probe for the fourth and seventh months. The response and the slopes are
essentially the same for both data sets. However, the vertical intersect is shifted toward
slower response times in the more aged probe. Slower diffusion times could again be due
to leaching of the structure or possible alterations in the microstructure of the deposited

41
film that difficult the access of the oxidant to the reaction sites. The sensing probe was
found to remain nonetheless functional for an extended period of time and multiple
experiments. The results presented here show the prepared sensing probe can be used to
detect the H2O2 as well as it allows us to quantify the concentration of H2O2, and the
fabrication method by the chemical synthesis ease the mass production of the sensing
probes.
Figure 3-12: Time response of a sensing probe versus H2O2 concentration four and seven months
after its fabrication.
3.4. Conclusions
A novel fiber-optic probe was developed for the detection and measurement of
small concentrations of H2O2 in liquid phase. A Prussian blue (PB) film served as an
indicator of H2O2 in a spectroscopic manner. Pure and robust PB films have been
deposited onto the distal end of optical fiber through a simple chemical method using the
single-source potassium ferricyanide. The effect of light exposure during synthesis
process was analyzed and shows that the light exposure during synthesis will lead to
formation of pure PB film, while synthesis in darkness will lead to co-precipitation of PB
and BG.

42
The intensity response of the fiber-optic sensing probes follows an inverse
exponential behavior which is in accordance with the physics of diffusion. The
characteristic time taken from the inverse exponential equation, which is the ≈63% of the
time for intensity to reach the saturation level, shows a linear relationship with the H2O2
concentration in a log–log scale.
Several sensing experiments with different sequences of H2O2 concentrations and
testing of several probes fabricated under the same conditions demonstrate the
repeatability, reliability, and reproducibility of the probes. Durability of the sensing probe
was tested by comparing the sensing behaviors four and seven months after its
fabrication. Although the sensing behavior remained unchanged, a small increase in
response time observed over the 3-month period, indicating that periodic recalibration of
sensing probes is required in practice.
The probes demonstrated in this study capitalize on some of the unique advantages
of the fiber-optic devices such as small size, flexibility, and immunity to electromagnetic
interference combined with the sensing properties of the synthesized PB, and in particular
high sensitivity and selectivity toward H2O2, the proposed optical sensors can pave the
way for a high performance and portable H2O2 sensing probe applicable for in situ
measurements in polymer electrolyte membrane fuel cells, as well as in minimally
invasive biosensor.

Chapter 4
4. pH-dependent Response of a Hydrogen Peroxide Sensing Probe
(Sensors and Actuators B: Chemical, volume 237, 2016, 113–119)
Reproduced with permission from Elsevier
Preamble
The previous chapter demonstrates the process of sensor development and H2O2
sensing at room temperature and a pH of 4. This proof-of-concept leads to the next step
which is investigating the functionality of the sensor at different pH values especially at
pH 2 which is typical of an operating PEM fuel cell. The sensor behavior at different pH
values (i.e. pH 2 to 7) and sensor characteristics at pH 2 are evaluated and presented in
this chapter.
The Body of this chapter was published in the Sensors and Actuators B: Chemical.
Abstract
The response of a fiber-optic hydrogen peroxide (H2O2) sensing probe is
investigated under a range of pH conditions. The H2O2 optrode is prepared by depositing
a thin layer of Prussian blue (PB) onto the tip of a multimode optical fiber, and its
detection mechanism is based on the PB/Prussian white (PW) redox reaction. PW is
oxidized to PB by H2O2 leading to changes in the absorption of visible light. The sensor
can be restored after usage by reducing the PB to PW with ascorbic acid. This optrode
was previously shown to have good repeatability and sensitivity to H2O2 concentrations
at room temperature and a pH of 4. For practical applications, the sensor must be capable
44
of detecting H2O2 in environments spanning a range of pH conditions, including
biological and industrial environments which together span pH values from 7 to less than
3. We present experiments using multiple PB optrodes, at pH values ranging from 7 to 2,
and for different concentrations of H2O2. The work demonstrates that the optrode remains
functional and provides stable and reproducible measurements of H2O2 under a range of
pH conditions that correspond, in particular, to those in an operating PEM fuel cell.
Keywords: Hydrogen peroxide, Optrode, PEM Fuel cell, pH-dependent Response,
Prussian blue, Spectroscopic detection.
4.1. Introduction
Hydrogen peroxide (H2O2) is a by-product of oxidative metabolisms [68, 63]. It is
involved in many biological processes and plays a leading role in a variety of damage
mechanisms. For example, H2O2 induces cellular damage in human cells [64, 65] and its
presence in exhaled breath and breast cancer cells can be used to diagnose illnesses such
as asthma and human breast cancer, respectively [66, 3]. On the other hand, H2O2 is used
in a broad range of industrial and medical applications, such as aseptic processing of food
and pharmaceuticals, disinfection, water treatment plants, and decontamination of
industrial effluents [61, 62, 69]. H2O2 is also believed to play a central role in chemical
degradation of polymer membranes in PEM fuel cells [4]. A versatile H2O2 sensor that
functions in environments spanning a range of pH values is therefore of practical
importance in various fields. In this study we investigate the functionality of an H2O2
optrode at different pH values, and in particular, at pH value corresponding to those in an
operating fuel cell, to assess its suitability for eventual in situ monitoring of H2O2 in PEM
fuel cells.
H2O2 sensors are usually based on the electrochemical and spectroscopic
techniques [15, 14, 16, 17, 18, 19, 70], with spectroscopic techniques being preferred for
many biochemical and industrial applications because of their immunity to
electromagnetic interference. On the other hand, Prussian blue (PB), ferric ferrocyanide,
is widely used for making sensors and biosensors for detection and measurements of
H2O2 [15, 71]. In particular, optrodes based on PB have shown reliable response to H2O2

45
concentration [59, 56]. These sensors were prepared by depositing PB onto the tip of
multimode optical fibers, with PB serving as a spectroscopic indicator of H2O2. Because
optical fibers are made of non-conductive materials, the chemical deposition of PB has
been preferred for constructing PB-based fiber-optic sensors. Among chemical deposition
methods, single-source precursor and layer-by-layer (LbL) techniques have been used
successfully to prepare PB-based H2O2 optrodes [17, 56]. However, the performance of
PB-based H2O2 sensors prepared with LbL is limited in environments spanning a range of
pH values and although the performance of this type of sensors is slightly improved by
adding capping bilayers on the LbL-based PB film, long-term stability is poor.
The single-source precursor technique is a synthesis approach in which all the
elements required in the final product are incorporated into one compound. In this
technique, the precursor may participate in several consecutive reactions to arrive at the
final product. The single-source precursor technique was selected in this work to deposit
PB onto the optical fiber because this approach leads to sensors with better long-term
stability in aqueous solutions at pH 4 [56]. The single-source precursor technique is a
more straightforward process than the LbL technique and results in more stable PB film
on the tip of the optical fiber. This is likely due to the different structure of PB that is
afforded though the single-source precursor technique compared to the structure that is
obtained thought the LbL technique. It has been observed that the pH stability of the PB
film also depends on the deposition process [71].
A potential application of such a sensor is integration into a PEM fuel cell for in
situ detection and measurement of H2O2 concentrations. The sensor is well suited for this
application because of its small size, immunity to electromagnetic interference, and
compatibility of the fiber material (i.e. silica glass) with the electrochemically active
environment inside a fuel cell. Since H2O2 is a product of glucose oxidation in the
presence of glucose oxidase and oxygen, the proposed optrode has also potential for
indirect measurement of glucose content [72].
The H2O2 spectroscopic detection mechanism relies on the redox reactions of the
PB/PW system, and the evaluation of corresponding changes of the optical properties of
the compound. The optrode is first reset by reducing PB to PW in the presence of a

46
reducing agent, such as ascorbic acid, as shown in Equation 4-1. When the PW-modified
fiber is exposed to an oxidizing agent, such as H2O2, the reverse reaction (i.e. PB
formation) occurs, as shown in Equation 4-2. PB has a strong intervalence charge transfer
absorption band near 700 nm due to a transition from FeIIIFeII to FeIIFeIII states. On the
other hand, PW does not have any distinct absorption bands in the visible range [73]. As
a result, the increasing absorbance in the visible range as PW oxidizes to PB, in the
presence of H2O2, can be used to detect the presence of this oxidant. Moreover, the initial
PW state can be recovered by exposing PB to ascorbic acid. Fig. 4-1 illustrates the
detection mechanism of H2O2 using the optrode based on chemically deposited PB/PW
system onto the tip of an optical fiber.
Figure 4-1: Detection mechanism of H2O2 using an optrode based on PB/PW system (taken from
[56]).
Ascorbic acid4 6 3(PB) 6 8 6( )
4 4 6 3(PW) 6 6 6
Fe [Fe(CN) ] 2C H O 4K
K Fe [Fe(CN) ] +2C H O 4H
(4-1)
4 4 6 3(PW) 2 2 4 6 3(PB)K Fe [Fe(CN) ] 2H O Fe [Fe(CN) ] +4OH 4K (4-2)
47
In this study we investigate the functionality of an H2O2 optrode at different pH
values, and in particular, at pH value corresponding to those in an operating fuel cell, to
assess its suitability for eventual in situ monitoring of H2O2 in PEM fuel cells. An H2O2
optrode was prepared using the single-source precursor technique for deposition of PB
onto the tip of multimode optical fibers. Sensing measurements in H2O2 buffered
solutions with pH values, ranging from 7 to 2, were performed to investigate the
functionality of the optrode. The sensing behavior of the probe, including stability and
reproducibility, was investigated at the operating pH of PEM fuel cells (i.e. 2).
Furthermore, sensing experiments were performed at three additional pH values, (i.e. 2,
5, and 6) and in each pH with different concentrations of H2O2 to study the pH
dependency of the sensor response.
4.2. Experimental
4.2.1. Materials
Potassium hexacyanoferrate (III) (product No. 13746-66-2) from Sigma-Aldrich
was used as a single-source precursor in an aqueous solution of hydrochloric acid (HCl)
(37%) for synthesizing PB onto the tip of an optical fiber. L-ascorbic acid from Aldrich,
(catalog No. 25,556-4), was used as the reducing agent for the PB to PW reaction. H2O2
(30 wt%) from ACP Chemicals was used to prepare the oxidizing solutions at different
concentrations.
Potassium phosphate monobasic (product No. 7778-77-0) from Caledon, sodium
phosphate dibasic (product No. 7558-79-4) from EM science, sodium phosphate
monobasic (product No. 13472-35-0) from EM science, and Phosphoric acid (product
No. 7664-38-2) from Caledon were used to prepare phosphate buffer solutions (PBS) at a
range of pH values (i.e. 2, 3, 5, 6, and 7). The reducing solution is prepared in PBS with
0.04 mol L−1 of L-ascorbic acid. Sodium hydroxide and phosphoric acid were used to
adjust the pH of the solutions to the desired values.
All chemicals were used as received with no further purification. The water used in
the experiments was purified with a four-cartridge purification system (Super-Q Plus,
Millipore, Billerica, MA) and has a resistivity of 18.2 MΩ cm. The optical fiber is a
48
multi-mode AFS50/125Y from Thorlabs (Newton, NJ), with core and cladding diameters
of 50 μm and 125 μm, respectively.
4.2.2. Sensor Fabrication
The PB-based optrode was prepared using chemical deposition of PB film onto the
tip of a multimode optical fiber. As reported in our previous work [56], 10 mmol L–1 of
potassium ferricyanide, as a single-source precursor, is added to 25 mL of an aqueous
solution of 0.1 mol L–1 HCl. The optical fiber is then immersed in this prepared mixture,
and held at 40 °C under continuous stirring at 300 rpm for 10 hours. The synthesis
process is performed with exposure to fluorescent lamp light (Philips Alto, F28T5 25W).
Finally, the optical fiber is left in the solution to cool to room temperature. The prepared
optrode is then removed from the solution and left at room temperature for one day. We
have explored a range of annealing temperatures and times and found that annealing at
100 °C for 15 min leads to the best performance of the optrode. Therefore, the sensor was
annealed under these conditions.
4.2.3. Sensing Test Procedure and Instrumentation
The sensing test procedure comprises three steps: First, the sensor response to
aqueous solutions with different pH values (i.e. 2, 3, 5, 6, and 7) and containing 100 μmol
L–1 of H2O2 is evaluated. Then, the sensor behavior in concentrations of H2O2 ranging
from 5 μmol L–1 to 400 μmol L–1 is examined in solutions with a pH of 2.0±0.1, which is
the typical operating pH of a PEM fuel cell. Additional sensing measurements are
performed at pH of 2.0±0.1 with multiple sensors to study the performance of the sensors
in terms of repeatability, durability, and reproducibility. Finally, several sensing tests are
carried out in solutions containing various concentrations of H2O2 at a range of pH values
(i.e. 2, 5, and 6). Ascorbic acid and H2O2 solutions are prepared in PBS at each pH. The
pH of all of the prepared solutions are determined using a digital pH-meter (AR25
accumet®, Fisher Scientific, Hampton, NH).
Each sensing test is performed by alternately immersing the optrode to an ascorbic
acid and H2O2 solutions, for the recovery and oxidation steps of the PB/PW system.
When the intensity of reflected light from the optrode plateaus to a minimum level, it is

49
considered to have reached the PW state. The optrode is then removed from the ascorbic
acid and placed in the H2O2 solution and kept there until the intensity plateaus to a
maximum, indicating the oxidation from PW to PB.
Figure 4-2: Sensing test experimental Setup including white light source, optical fiber, optrode,
and spectrometer.
Fig. 4-2 illustrates the experimental setup used for collecting and measuring the
reflected light from the optrode. The light from the white light source (LS-1,
OceanOptics, Dunedin, FL), is carried to the optrode through arm 1 of a bifurcated
optical fiber (BIF200- UV-Vis, OceanOptics) and the common arm. Part of the scattered
light from the PB/PW film on the tip of the optrode is collected by the optical fiber and
guided back through the common arm and arm 2 of the bifurcated optical fiber into an
optical fiber spectrometer (USB2000, Ocean Optics), which measures the intensity of the
light in a wavelength range from 370 nm to 1048 nm. The reflected spectrum is sampled
at a frequency of 1 Hz using the software, SpectraSuite (Ocean Optics, Dunedin, FL).
The intensity data is integrated over the full range of the spectrometer (i.e. 370 to 1048
nm) and is used to study the response of the PB/PW system during both the oxidizing and
the reducing steps.
4.3. Results and Discussion
4.3.1. pH-dependent Response
The pH-dependent response of the optrode is investigated in 100 μmol L–1 H2O2
solutions at different pH values. Ascorbic acid and H2O2 test solutions are prepared in
PBS with pH of 2, 3, 5, 6, and 7. Fig. 4-3 illustrates the intensity of the light reflected
from the optrode at different pH values. The circles and squares in Fig. 4-3 indicate the
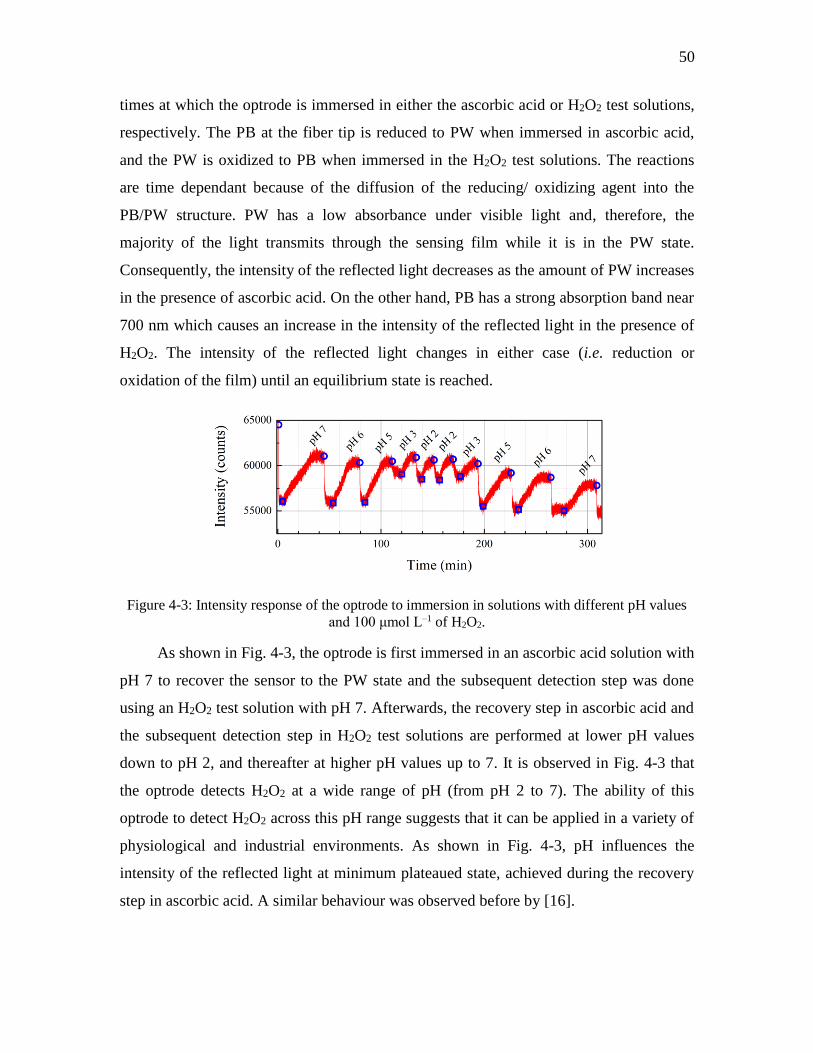
50
times at which the optrode is immersed in either the ascorbic acid or H2O2 test solutions,
respectively. The PB at the fiber tip is reduced to PW when immersed in ascorbic acid,
and the PW is oxidized to PB when immersed in the H2O2 test solutions. The reactions
are time dependant because of the diffusion of the reducing/ oxidizing agent into the
PB/PW structure. PW has a low absorbance under visible light and, therefore, the
majority of the light transmits through the sensing film while it is in the PW state.
Consequently, the intensity of the reflected light decreases as the amount of PW increases
in the presence of ascorbic acid. On the other hand, PB has a strong absorption band near
700 nm which causes an increase in the intensity of the reflected light in the presence of
H2O2. The intensity of the reflected light changes in either case (i.e. reduction or
oxidation of the film) until an equilibrium state is reached.
Figure 4-3: Intensity response of the optrode to immersion in solutions with different pH values
and 100 μmol L–1 of H2O2.
As shown in Fig. 4-3, the optrode is first immersed in an ascorbic acid solution with
pH 7 to recover the sensor to the PW state and the subsequent detection step was done
using an H2O2 test solution with pH 7. Afterwards, the recovery step in ascorbic acid and
the subsequent detection step in H2O2 test solutions are performed at lower pH values
down to pH 2, and thereafter at higher pH values up to 7. It is observed in Fig. 4-3 that
the optrode detects H2O2 at a wide range of pH (from pH 2 to 7). The ability of this
optrode to detect H2O2 across this pH range suggests that it can be applied in a variety of
physiological and industrial environments. As shown in Fig. 4-3, pH influences the
intensity of the reflected light at minimum plateaued state, achieved during the recovery
step in ascorbic acid. A similar behaviour was observed before by [16].

51
The precise reason for the increased intensity when the film is in PW state at lower
pH values shown in Fig. 4-3 is unknown as several factors are involved, such as the
various equilibria involved (e.g. ionization equilibrium of acid ascorbic) and even the
microstructured environment of the film. The reduction potential of ascorbic acid also
decreases with increasing pH, according to the Nernst equation, which should also
contribute to this effect. A similar trend has been observed in another study [74] on
reduction of PB nanoparticles in different reaction media with different pH values. In that
study, the intensity of the absorbance of PB nanoparticles after reduction in different pH
values showed no significant change between pH 2 and 3 while the intensity changed
significantly between pH 3 and 5.
The intensity response of the optrode when it is at equilibrium in the presence of
H2O2 is similar for all tests, regardless of the pH of the test solution, as shown in Fig. 4-3.
This suggests that the extent of PW oxidation to PB in the presence of H2O2 is also
similar at all pH values. However the intensity response of the optrode at equilibrium in
the presence of either H2O2 or ascorbic acid decreases slightly after several tests, which
can be attributed to leaching or possible alterations in the microstructure of the deposited
PB/PW film. Possible leaching of the PB film would reduce the durability of the optrode.
Therefore, the durability of the optrode has been investigated and discussed in section
3.2.3.
To investigate the optrode response to test solutions, the time constant of the
optrode was extracted from the intensity response of each test. For this calculation, the
moment of immersion in each H2O2 solution is defined as t=0, and the data is fit to an
inverse exponential function (Equation 4-3):
0 1 expt
I t I A
(4-3)
where I t and 0I are the intensities at time t and the instant the optrode was initially
immersed into the H2O2 solutions, respectively. τ is a constant equal to the time elapsed
when the intensity reaches 63% of the intensity at equilibrium and is the parameter used
to evaluate the response of the optrode. A is a constant related to the geometry of the film,

52
the diffusion conditions through the PB structure, and the oxidation of PW to PB. This
inverse exponential behavior is consistent with the diffusion mechanism underlying the
operating principle of the optrode [59].
Fig. 4-4 depicts the average time constant of the optrode versus pH of the test
solutions containing 100 μmol L–1 H2O2, on a log-log scale. It is apparent that pH affects
the time constant of the optrode. The time constant is smaller for the test H2O2 solutions
at lower pH values.
Figure 4-4: Time constant of the optrode versus pH of the test solutions with 100 μmol L–1 of
H2O2.
4.3.2. Sensing Behavior at PEM Fuel Cell’s Operating pH
Sensing H2O2 and understanding the underlying conditions that promote its
formation within a fuel cell are keys to understanding the mechanism of PEM fuel cell
membrane degradation. Therefore, the sensing behavior of the optrode for detection and
measurement of H2O2 has been studied at a pH typical of an operating PEM fuel cell (i.e.
pH 2).

53
Figure 4-5: Intensity response of the optrode to immersion into solutions with different H2O2
concentrations at pH 2.
Fig. 4-5 shows the intensity response of the optrode to different H2O2
concentrations at pH 2. The intensity of the reflected light reaches approximately the
same value after each immersion at different concentrations of H2O2. Using the technique
described in Section 3.1, the time constant, τ, is extracted from Fig. 4-5 and plotted
versus H2O2 concentration in Fig. 4-6.
Figure 4-6: Time constant of the optrode versus H2O2 concentration at pH 2.
Fig. 4-6 shows that the time constant changes linearly (i.e. R2=0.99) with H2O2
concentration, on a log-log scale. This linear behavior allows us to detect and quantify the
concentration of H2O2. Fig. 4-6 also shows that the time constant is smaller for the test

54
solutions with higher concentration of H2O2. This behavior is governed by the increased
diffusion rates associated with the higher concentration potentials.
4.3.2.1. Repeatability
To investigate the repeatability of the measurements, four experiments with 50,
100, 200, and 400 μmol L–1 of H2O2 and with each one comprising three sensing tests are
performed using the same optrode. Fig. 4-7 illustrates the intensity response of the
optrode during these four experiments.
Figure 4-7: Successive intensity responses of the optrode to red) 50 μmol L–1 of H2O2, green) 100
μmol L–1 of H2O2, blue) 200 μmol L–1 of H2O2, and orange) 400 μmol L–1 of H2O2 (For
interpretation of the references to colour in this figure legend, the reader is referred to the web
version of this article).
Fig. 4-7 shows that the intensity levels at minimum and maximum plateaued states
are essentially the same and it is only the slope that increases following immersion into
higher concentration H2O2 test solutions, leading to smaller time constants. The slope of
intensity variation for each concentration of H2O2 is calculated during the first 60 seconds
after the probe immersion into test solutions and presented in Table 4-1. The slopes for
each concentration of H2O2 are close to each other, particularly at higher concentrations
of H2O2, which indicates the repeatability of the results. On the other hand, the slope of
intensity variation during the probe immersion in ascorbic acid solutions is always the
same with an average of negative 23 counts per seconds and standard deviation of 1.09
(i.e. slopes were calculated during the first 180 seconds after probe immersion in ascorbic
acid). The same concentration of ascorbic acid was used in all tests, this behaviour further
confirms the repeatability of the results with this optrode.

55
Table 4-1: Slopes of intensity variation at different concentrations of H2O2.
H2O2 concentration
(μmol L–1)
Slope of intensity variation (counts/seconds)
First response Second response Third response Average
50 16 12 22 16
100 23 38 38 33
200 63 65 81 70
400 118 129 125 124
Note: Slopes were calculated during the first 60 seconds after probe immersion into H2O2
test solution.
The time constant of the optrode versus H2O2 concentration is extracted from Fig.
4-7 and plotted in Fig. 4-8. The average time constant decreases linearly with increasing
H2O2 concentration with an R2 of 0.99. This is in a good agreement with the results
presented in Fig. 4-6. The error, which is based on the Estimated Standard Deviation for
each concentration, decreases as the H2O2 concentration increases (i.e. the optrode
response is more reliable at higher concentrations of H2O2).
Figure 4-8: Time constant of the optrode versus H2O2 concentration.

56
4.3.2.2. Reproducibility
Two optrodes are prepared in the same manner at different times and multiple
sensing experiments are performed with each. The time constants of both optrodes are
plotted versus H2O2 concentration in Fig. 4-9. Both optrodes exhibit a linear behavior and
a lower time constant with higher H2O2 concentration. The slopes for both optrodes are
similar, -0.97 and -1.00 s mol-1 L. However, the extrapolation of the linear fits do not
intercept the vertical axis at the same point. This suggests that each sensor will require an
initial calibration with known concentrations of H2O2. The different intercepts can be
attributed to variations in sensing film thickness or microstructure which affect diffusive
transport and lead to different diffusion times. However, the similarity of the slopes for
the different optrodes suggests that this parameter depends mainly on the nature of the
deposited PB/PW film under given experimental conditions (i.e. the temperature and pH
of the sensing environment) and that is independent of the film thickness and structure.
Figure 4-9: Time constant of two different optrodes versus H2O2 concentration at pH 2.
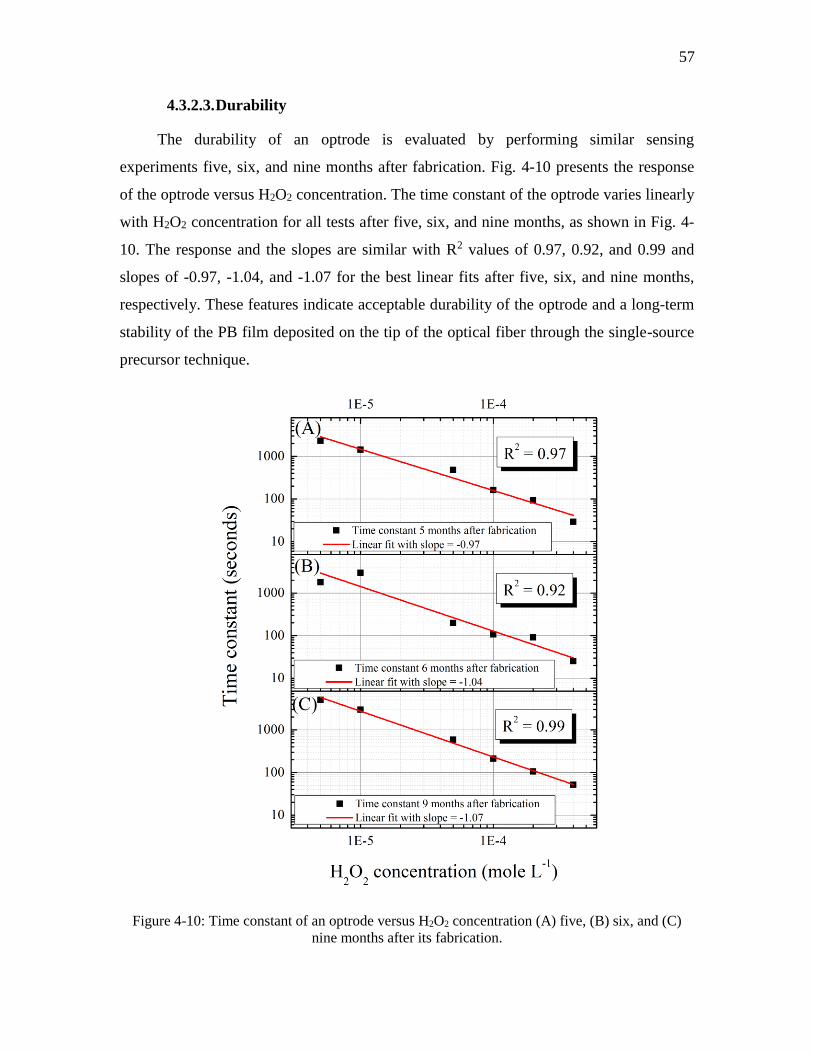
57
4.3.2.3. Durability
The durability of an optrode is evaluated by performing similar sensing
experiments five, six, and nine months after fabrication. Fig. 4-10 presents the response
of the optrode versus H2O2 concentration. The time constant of the optrode varies linearly
with H2O2 concentration for all tests after five, six, and nine months, as shown in Fig. 4-
10. The response and the slopes are similar with R2 values of 0.97, 0.92, and 0.99 and
slopes of -0.97, -1.04, and -1.07 for the best linear fits after five, six, and nine months,
respectively. These features indicate acceptable durability of the optrode and a long-term
stability of the PB film deposited on the tip of the optical fiber through the single-source
precursor technique.
Figure 4-10: Time constant of an optrode versus H2O2 concentration (A) five, (B) six, and (C)
nine months after its fabrication.

58
Figure 4-11: Time constant of an optrode versus H2O2 concentration in solutions with (A) pH 6,
(B) pH 5, and (C) pH 2.
4.3.3. pH-dependent Sensitivity
The optrode time constant depends on the pH of the H2O2 test solutions, see Fig. 4-
4. To further evaluate the dependency of the sensor response on the pH of the test
solution, tests were performed at three different pH values (i.e. pH 2, 5, and 6) with
different concentrations of H2O2. Fig. 4-11A – 4-11C illustrate the response of an optrode
versus H2O2 concentration at pH 6, 5, and 2, respectively. The sensor was found to be
functional in all three pH values with a linear response to H2O2 concentration on a log-
log scale. However, the slope of the best linear fit to the time constant of the sensor varies
with pH value (i.e. -0.6, -0.78, and -1.07 at pH 6, 5, and 2 respectively). The sensor
sensitivity (s mol-1 L) increases with decreasing pH of the H2O2 test solution. This
suggests that the H2O2 reduction rate increases with increasing H2O2 concentration at
lower pH values. We also note that the time constant of the sensor in 100 μmol L–1 of

59
H2O2 is lowest at pH 2 which confirms the results obtained in Fig. 4-4. The results also
point to the need for independent pH monitoring in environments with unknown or
fluctuating pH values.
4.4. Conclusions
The effect of pH on the sensing behavior of the PB-based H2O2 optrode was
characterized and the optrode ability to detect H2O2 across a wide range of pH values (i.e.
from pH 2 to pH 7) demonstrated. The pH dependency was quantified as the time
constant of the optrode. Shorter time constants (i.e. faster response) were obtained at
lower pH values. The linear response of the optrode to H2O2 concentration allows us to
detect and quantify the concentration of H2O2 with good precision (i.e. R2 of 0.99). The
optrode shows repeatable response to H2O2 concentrations with improved reliability at
higher concentrations. Sensing experiments with different optrodes exhibit the similar
linear behavior with different time constants which indicates that each sensor requires
individual calibration. The optrode also shows reliable responses five, six, and nine
months after fabrications with the R2 values of 0.97, 0.92, and 0.99, respectively, for the
best linear fits on the time constant. This verifies the durability of the probe and long-
term stability of the PB film deposited on the tip of the optical fiber through the single-
source precursor technique. Sensing tests at three different pH values (i.e. pH 2, 5, and 6)
with different concentrations of H2O2 reveal that the optrode remains functional at all pH
values with a linear response to H2O2 concentration on a log-log scale. Moreover, the
sensor sensitivity (s mol-1 L) increases with decreasing test solution pH.
Although this work was primarily motivated by the need to develop in situ
detection of H2O2 in an operating PEM fuel cell, where low pH values (~2) prevail, the
optrode described in this paper can be used in a variety of industrial and environmental
systems and could potentially be adapted to biological applications and physiological
environments once appropriately calibrated.

Chapter 5
5. Effect of Deposition Conditions on Stability of PB Films at PEMFC’s Operating
Temperatures and pH
(Journal of The Electrochemical Society, volume 163 (6), 2016, B185–B187)
Reprinted with permission from J. Electrochem, Soc., 163, B185 (2016). Copyright 2016,
The Electrochemical Society.
Preamble
Sensor development and detection of H2O2 concentrations at room temperature and
different pH values including pH 2 (PEM fuel cell’s operating pH) are shown in the
previous chapters. Having established the functionality in an environment with pH value
typical of an operating PEM fuel cell, it remains to establish the stability of the sensor at
temperatures similar to an operating PEM fuel cell. For in situ detection of H2O2 in PEM
fuel cells, the sensor must withstand the temperatures between 60 °C to °80 C. A set of
experiments are performed and presented in this chapter, investigating the sensor stability
at such temperatures. PB films are deposited under different conditions and the stability
of the produced PB films is examined in solutions at elevated temperatures with pH 2.
The deposition conditions under which the most stable PB film is obtained are identified
and presented in this chapter.
The Body of this chapter was published in Journal of The Electrochemical Society.
Abstract
Optrodes based on Prussian blue (PB) are promising for hydrogen peroxide

61
detection within PEMFCs to study the Membrane-Electrode-Assembly degradation. The
PB film is however required to sustain the harsh environment of PEMFCs. In this work,
PB films were deposited through different conditions and soaked in Phosphate-Buffer-
Solutions with pH 2 at elevated temperatures for a day. These PB films were
characterized using FTIR to analyze their stability following PBS processing at operating
temperature and pH corresponding to an operating PEMFC. The PB film prepared using
the single-source precursor at the temperature of 60 °C is found to be the most stable.
5.1. Introduction
Hydrogen peroxide (H2O2) is one of the chemical species associated with
degradation of the electrolyte membrane in PEMFCs [75, 4]. Understanding the
underlying degradation mechanisms requires H2O2 sensors that function in the harsh
environment of PEMFCs. Various approaches proposed to date for sensing H2O2 are
reviewed in Botero et al, Sensors and Actuators 2013 [59]. Here we focus on sensing
based on Prussian blue (PB), ferric ferrocyanide, which has been successfully
demonstrated as an indicator of H2O2 [36]. However, PB film was found to leach into the
sensing test solution at the temperatures and pH levels of an operating PEMFC, leading
to an inconsistent sensing behavior [60]. This paper presents an experimental study of the
stability of PB films deposited with alternative methods and at various temperatures.
The presence of H2O2 in PEMFCs has been detected by analysis of the effluent
condensate from the anode and cathode [8, 76, 77]. Two pathways have been proposed
for the formation of H2O2 in PEMFCs. First, oxygen reduction occurs at the cathode
according to the reaction (5-1). The alternative view is based on the crossover of oxygen
from the cathode to the anode side, which provides the oxygen needed to react with
hydrogen, and produces H2O2 at the anode, reaction (5-2) and (5-3) [9].
O2 + 2H+ + 2e → H2O2 (5-1)
Pt + 1/2H2 → PtH (5-2)
2H* + O2 → H2O2 (5-3)
Membrane degradation by H2O2 has been investigated by introducing Nafion

62
membranes to H2O2 solutions at 80 °C [4, 9]. After H2O2 processing of Nafion, fluoride
and sulfate ions (F- and SO42-) were detected in the solution which are derived from the
C-F bonds and the sulfonic acid groups, respectively. Kinumoto et al. observed that the
loss of sulfonic acid groups of Nafion reduces the proton conductivity, and the
decomposition of the C-F bonds leads to membrane thinning and the formation of
pinholes [4]. Qiao et al. showed that the proton conductivity, water uptake and the water
self-diffusion coefficient gradually decrease with H2O2 processing [7]. Furthermore,
Nafion is used in the catalyst layer to provide ionic conduction pathways. Therefore,
decomposition of Nafion inside the catalyst layer also causes a reduction in the effective
reaction area and increases the overpotential of the cell [4].
For in situ detection of H2O2 inside the fuel cell electrochemical and spectroscopic
techniques are preferred among other conventional techniques such as titrimetric,
colorimetric, and gasometric because of the challenges involved in in situ detection of
H2O2. These challenges comprise the low concentration of H2O2, lack of space for
insertion of a sensor into a cell, the corrosive environment, and the electrochemical
noises inside a cell.
To date, the only report of in situ detection of H2O2 is based on an electrochemical
method in which, Pt wires were used as electrodes to detect H2O2 in a PEMFC [7]. These
sensors were able to detect H2O2 in the fuel cell but were not able to measure
concentrations. The applicability of this or any other amperometric sensors in this
application is limited by interference effects from the electrical fields created by fuel cell
operation. The currents in fuel cells are a potential source of electromagnetic noise which
can induce currents in the Pt wires, based on Faraday’s law of induction, leading to
inaccurate measurements.
Recently, optrodes have been demonstrated for in situ sensing of temperature and
relative humidity in PEMFCs [21, 22]. Optrodes are well-suited to this application
because their small size allows high spatial resolution and minimally disruptive access to
the fuel cell. Furthermore, optical signals do not interfere with electrochemical processes
in the fuel cell and are immune to electromagnetic interference. In addition, the fiber
material (i.e. silica glass) is compatible with the electrochemically active environment

63
inside the fuel cell.
In a recent study, the authors developed an H2O2 optrode based on chemical
deposition of PB onto the tip of an optical fiber [56]. The sensor detects H2O2 in a
spectroscopic manner based on the oxidation of Prussian white (PW), PB reduced state,
to PB in presence of H2O2, reaction (5-4), and evaluation of corresponding changes of the
reflected light from the optrode. This sensor responds reliably to H2O2 concentrations in
aqueous solutions at room temperature. However, the sensor responses are not consistent
at higher temperatures which is likely attributed to leaching of the PB film into the
sensing test solution.
𝐾4𝐹𝑒4[𝐹𝑒(𝐶𝑁)6]3(𝑃𝑊) + 2𝐻2𝑂2 𝐹𝑒4[𝐹𝑒(𝐶𝑁)6]3(𝑃𝐵) + 4𝑂𝐻− + 4𝐾+ (5-4)
In the present work, we want to address the stability of PB films at elevated
temperatures. PB films were deposited on glass microscopy slides at different condition.
The samples were immersed in Phosphate-Buffer-Solution (PBS) at elevated temperature
and low pH to investigate the film stability in environment similar to that in an operating
fuel cell. These PB films were characterized using Fourier transform infrared
spectroscopy (FTIR) to assess their stability following PBS processing.
5.2. Experimental
5.2.1. Deposition of Prussian Blue Films
PB films were deposited on the substrates using three different processes. The first
process comprises chemical deposition of PB through the sol-gel process and dip-coating
technique. The sol-gel process was performed using a mixture of 25 mL of anhydrous
ethanol, 25 ml of TEOS, 50 mL of an aqueous solution of 0.1 M hydrochloric acid, 50
mM potassium ferrocyanide, and 50 mM iron chloride (III). The prepared mixture was
left at room temperature for 4 hours for gelation.
The second process comprises chemical deposition of PB films over a 5 hour period
using a solution, containing both iron valences, of 5 mM potassium ferrocyanide and 5
mM iron chloride (III) in 50 mL of an aqueous solution of 0.1 M hydrochloric acid.
The third process involved deposition of PB films using potassium ferricyanide as a

64
single-source precursor (SSP). SSP is a synthesis approach in which all the elements that
are required in the final product are incorporated into one compound. Following the
procedure discussed in our previous work [56] to synthesize PB using potassium
ferricyanide, photo-induced deposition of PB films was performed during 5 hours, in
which 10 mM of potassium ferricyanide was added to 50 mL of an aqueous solution of
0.1 M hydrochloric acid [56]. All three processes were performed in solutions at 60 °C
and the prepared samples were dried first at room temperature and then at 100 °C for 15
min. The sources of the chemicals are documented in table 5-1. Thermo Scientific glass
microscopy slides were prepared and used as the substrate in all deposition processes.
The chemical composition of the slide is: SiO2 72.20%, MgO 4.30%, Na2O 14.30%,
Al2O3 1.20%, K2O 1.20%, Fe2O3 0.03%, CaO 6.40%, SO3 0.30%.
Table 5-1: Source of Chemicals.
Chemicals Product No. Source
Potassium ferrocyanide 14459-95-1 VWR International
Potassium ferricyanide 13746-66-2 Sigma-Aldrich
Iron chloride (III) hexahydrate 7119.2 Carl Roth
Tetraethyl orthosilicate (TEOS) 86578 Aldrich chemistry
Anhydrous ethanol 64-17-5 Fisher chemical
Di-sodium hydrogen phosphate dihydrate 4984.1 Carl Roth
Sodium dihydrogen phosphate dihydrate 13472-35-0 VWR International
To increase the adhesion of PB films to the substrate, the OH groups on the surface
of the substrate were activated by an acid treatment comprised of first washing with soap
and distilled water and then treating with 68% HNO3 for 5 minutes. The substrate was
then rinsed with distilled water and cleaned with ethanol. Finally, the substrate was
placed into the oven at 100 °C for 2 hours.
To study the effect of synthesis temperature on stability of PB films, additional
samples were prepared through the SSP route at temperatures of 40 °C, 60 °C, and 80 °C.
Deposition was also attempted at 20 °C, but the rate of deposition was found too slow.

65
Figure 5-1 shows the experimental procedure.
Figure 5-1: Experimental procedure
5.2.2. PBS Processing of Samples
PBS at pH 2 and buffer strength of 100 mM was prepared using di-sodium
hydrogen phosphate dihydrate and sodium dihydrogen phosphate dihydrate. Two samples
were prepared using each deposition processes, with one sample subjected to PBS
processing, and each deposition process has been done twice to ensure the repeatability of
the results. PBS processing was performed by immersing and leaving the samples in PBS
at 80 °C for 21 hours and, thereafter, at 90 °C for 3 hours. Finally both samples prepared
using each deposition processes were characterized using FTIR to study the effect of
deposition process and synthesis temperature on stability of PB films.
5.3. Results and Discussion
5.3.1. Effect of Synthesis Process and Precursors
Figure 5-2 shows the FTIR spectra, in the range 2500 – 1500 cm-1, of the samples
synthesized through different processes before (solid lines) and after (dashed lines) PBS
processing. The peak at 2083 cm-1 is the characteristic absorption peak of PB which is
ascribed to the stretching vibration of C≡N group in PB structure [78]. Considering the
Beer-Lambert law, equation (5-5), the transmittance of light (T) through the material has
an inverse relation with the amount concentration of material (ci) within the pass length
of the beam of light (l). Since just the characteristic absorption peak of PB is studied here

66
the molar attenuation coefficient (εi), which is an intrinsic property of a material, would
be constant. Therefore, increasing the transmittance in FTIR spectra would be due to
decreasing the amount of PB within the sample. This might happen in case of leaching
PB film into the PBS.
𝑇 = 10−∑ 𝜀𝑖 ∫ 𝑐𝑖(𝑧)𝑑𝑍𝑙0
𝑁𝑖=1 (5-5)
Figure 5-2: FTIR spectra of PB films synthesized through (a) sol-gel process, (b) chemical
process using potassium ferrocyanide and iron (III) chloride, and (c) SSP process using potassium
ferricyanide, before (solid line) and after (dashed line) PBS processing.
Among the three different deposition processes, the samples prepared through the
sol-gel process, Figure 5-2 (a), exhibits the weakest peak at 2083 cm-1 before PBS
processing, and almost no characteristic peak after PBS processing. This indicates the PB
film has completely leached into the PBS. Conversely, the sample prepared with the SSP
process, Figure 5-2 (c), has the strongest peak at 2083 cm-1 both before and after PBS
processing, indicating this is the most stable PB film. The sample which was prepared
with the chemical process using both iron valences, Figure 5-2 (b), does not suffer from
complete leaching in PBS; however the characteristic peak of PB at 2083 cm-1 is not as

67
strong as the peak for the samples prepared using SSP. We conclude that less PB is
deposited onto the substrate through the second process compared to the SSP process.
Figure 5-3: FTIR spectra of PB films synthesized at (a) 40 °C, (b) 60 °C, and (c) 80 °C, before
(solid line) and after (dashed line) PBS processing.
5.3.2. Effect of Synthesis Temperature
The PB film prepared through the SSP process was the most stable both before and
after PBS processing. Therefore, this process was chosen for further investigation with
respect to the effect of synthesis temperature on the stability of PB films. Figure 5-3
depicts the FTIR spectra in the range of 2500 cm-1 to 1500 cm-1 for the samples
synthesized at different temperatures ranging from 40 °C to 80 °C. The solid lines and
dashed lines are the spectra of the samples before and after PBS processing, respectively.
The sample which was prepared at 40 °C has no distinct peak at 2083 cm-1 after PBS
processing which indicates the PB film has completely leached into the PBS, Figure 5-3
(a). On the other hand, the PB films prepared at 60 °C and 80 °C have a strong peak at
2083 cm-1 both before and after PBS processing (Figure 5-3 (b) and (c)) which confirms
stability of PB films prepared at these temperatures. As there is no significant difference

68
between the PB films prepared at 60 °C and 80 °C, a temperature of 60 °C is selected as
the synthesis temperature to achieve the most stable PB film through this technique.
5.4. Summary
PB films were synthesized using three different chemical processes. The stability of
the films was assessed by PBS processing at temperature and pH corresponding to an
operating PEMFC. The film prepared through SSP had the highest stability after PBS
processing. The effect of synthesis temperature on stability of the PB films was also
investigated by preparing films through SSP route at temperatures of 40 °C, 60 °C, and
80 °C, and by subsequently processing the samples in PBS solutions. This experiment
revealed the film that was prepared at 40 °C was completely leached into the PBS, while
the films that were prepared at 60 °C and 80 °C were sufficiently robust to sustain the
PBS processing.
Preparing optrodes based on PB through SSP at temperature of 60 °C and
performing sensing tests at temperature and pH corresponding to an operating PEMFC
will be considered in future work.

Chapter 6
6. Conclusions and Future Work
This chapter links the contributions of this dissertation and summarizes the findings
from the three studies presented in Chapters 3 to 5. Possible avenues for future work are
also discussed in this chapter.
6.1. Conclusions and Contributions
This dissertation presents the development of a novel optrode, and demonstrates the
sensing behavior of the proposed sensor toward detection and measurement of H2O2
under a range of conditions. The motivation for carrying out this research was to develop
a sensor that can be used for detection and measurement of H2O2 concentrations in an
environment similar to that in an operating PEM fuel cell. However, the development of
such a sensor is challenging because the sensor is required to have specific characteristics
to be able to work and sustain the harsh environment inside an operating PEM fuel cell.
The first stage in this research focused on a review of previous work and state of the art
to select a suitable sensing technique. Based on a preliminary assessment and the fact that
there are active electrical and electromagnetic fields inside an operating PEM fuel cell, a
spectroscopic technique was deemed preferable to other techniques (e.g. electrochemical
or amperometric techniques). Several challenges, mainly related to the stability of the
sensor at PEM fuel cells operating conditions, needed to be addressed to allow successful
implementation of the technique. These challenges were addressed in three studies
presented as contributions in Chapters 3 to 5.

70
6.1.1. Spectroscopic Detection of Hydrogen Peroxide with an Optical Fiber
Probe using Chemically Deposited Prussian Blue
In the first study (Chapter 3), an H2O2 optrode was developed by chemical
deposition of PB onto the tip of an optical fiber. The main objective of this study was to
prepare a sensor with repeatable sensing response to H2O2 concentrations.
Multiple optrodes were prepared using the same procedure and sensing tests
protocols. The sensing behavior of the optrodes to H2O2 concentrations was found to be
inconsistent between different optrodes. Examination and analysis of the results
prompted a change of this study from assessing the sensing behavior of the optrode to
investigating the chemical deposition of PB films.
PB films prepared through the same chemical technique with different deposition
parameters were characterized using Raman spectroscopy. This revealed that fluorescent
lamp light (Philips Alto, F28T5 25W) exposure affects the purity of the prepared films.
The light exposure leads to the formation of pure PB film, whereas deposition in darkness
leads to co-precipitation of PB and BG.
After resolving the above problem several new optrodes were prepared under
controlled light exposure during deposition of PB films. The new set of optrodes were
found to behave consistently, and additional sensing tests were performed to assess the
repeatability and reproducibility of sensor response. The durability of the optrode was
also established by subjecting an optrode to multiple experiments during seven months
and comparing the sensor responses to H2O2 concentrations four and seven months after
the optrode preparation.
This study resulted in a novel H2O2 optrode in which the PB film is deposited onto
the tip of an optical fiber through the photoinduced SSP technique. Using this sensor,
H2O2 can be detected and measured in buffered solutions at room temperature with pH 4.
The sensor characteristics (i.e. repeatability, reproducibility, and durability) were
examined and the sensor response found to be reliable under this condition.

71
6.1.2. pH-dependent Response of a Hydrogen Peroxide Sensing Probe
The performance of the PB-based H2O2 optrode prepared through other methods
(e.g. LbL technique) is limited in environments with different pH values. Therefore, in
the second study (Chapter 4), the sensor’s capability for detection and measurement of
H2O2 under a range of pH values was investigated, including pH value corresponding to a
PEM fuel cell environment.
The sensor response was initially assessed in solutions with a constant
concentration of H2O2 at different pH (i.e. 2 to 7) to demonstrate the sensor capability to
detect H2O2 at different pH values. However, the sensor response was found to be
affected by the pH, with faster response times obtained at lower pH values.
Further sensing tests were carried out at pH 2 with multiple optrodes prepared at
different times through the same process. These optrodes are capable of detecting and
measuring different concentrations of H2O2 at pH 2 and show repeatable response to
H2O2 concentrations with the more reliable response at higher concentrations. The results
also indicate acceptable durability of the probe and long-term stability of the PB film.
Investigation of the effect of pH on sensitivity of the optrode confirmed the sensor
capability to detect and measure different concentrations of H2O2 at different pH values,
and showed the sensitivity of the sensor is also affected by the pH, whereby optrode has
higher sensitivity to H2O2 concentrations at lower pH values.
In summary, the optrode was found to be functional at the pH corresponding to an
operating PEM fuel cell. This paves the way for developing a sensor for in situ detection
of H2O2 inside PEM fuel cells. Moreover, the sensor works in a wide range of pH values
(i.e. from pH 2 to pH 7) that suggests this sensor as a suitable candidate for applications
in environments with the pH values in the range of 2 to 7. Investigating the effect of pH
on sensing behavior of the optrode shows the sensor has faster response times and higher
sensitivities at lower pH values.

72
6.1.3. Effect of Deposition Conditions on Stability of PB Films at PEMFC’s
Operating Temperatures and pH
Although the sensor is functional at PEM fuel cell’s operating pH, the stability of
the sensor at PEM fuel cell’s operating temperature needed to be established. In the third
study (Chapter 5), PB films were prepared under different conditions and the stability of
the films in solutions with pH 2 and at elevated temperatures were assessed by FTIR
analysis.
PB films were deposited by sol-gel dip coating, direct chemical process, and SSP
techniques. Experiment and FTIR analysis revealed that the film prepared through SSP
technique has the highest stability after PBS processing.
The effect of synthesis temperature on stability of PB films was also investigated.
The FTIR analysis of these samples shows the film prepared at 40 °C is completely
leached into PBS, while the films prepared at 60 °C and 80 °C are sufficiently robust to
sustain the PBS processing.
A key conclusion is that optrodes prepared using the SSP technique at 40 °C might
not be stable for in situ sensing in PEM fuel cells. Instead, the optrode should be prepared
using the same technique but at a synthesis temperature of 60 °C to sustain the high
temperatures inside PEM fuel cells.
6.1.4. Conclusions
This work presents a novel optrode for detection and measurement of H2O2
concentrations at temperatures and pH corresponding to an operating PEM fuel cell. The
proposed optrodes capitalize on some of the unique advantages of the fiber-optic devices
such as small size, flexibility, and immunity to electromagnetic interference. The effect of
synthesis conditions on properties of PB films was systematically studied, revealing the
effect of light exposure during deposition of PB films on purity of the films and the effect
of deposition technique and temperature on stability of PB films at elevated temperatures.
The proposed optrodes pave the way for developing high performance H2O2 sensor
applicable for in situ PEM fuel cell measurements, as well as portable H2O2 sensors for a
range of applications with environments with a pH range of 2 to 7 and temperatures of
73
less than 90 °C.
6.2. Future work
Although the initial motivation for this research was to develop a sensor that can be
used for detecting H2O2 concentrations inside PEM fuel cells, the functionality of the
developed sensor is only demonstrated ex situ in solutions with pH 2 (PEM fuel cell’s
operating pH).
Extension of this research should next focus on the development of optrodes based
on PB films through SSP technique at temperature of 60 °C, and deployment of the
sensors for in situ PEM fuel cell tests. The in situ sensing tests might be done by
embedding multiple sensors into the flow channels to increase the chance of H2O2
detection, and running the fuel cell under stress conditions conducive to H2O2 formation.
One major challenge in this work might be related to placement of the sensors into the
fuel cell in such a way as to allow the recovery of the sensor in ascorbic acid after
exposure to H2O2. In his doctoral dissertation, Botero-Cadavid suggests a method for
integration of this kind of sensors in PEM fuel cells [79].
Further work will also be required to develop in situ calibration procedures to allow
sensing in an operating PEM fuel cell. For this, an H2O2 vapor generator is necessary. In
an H2O2 vapor generator, a hot air stream with a temperature around 100 °C is introduced
to a container of liquid mixture of H2O2/H2O. The resultant flow exiting from the
container of H2O2/H2O mixture is at sufficiently high temperature for all components (i.e.
air, H2O2, and H2O) to be in the gaseous phase. This stream can be introduced to a fuel
cell through the flow field. On the other hand, a coolant flow through bipolar plates is
necessary to keep the flow fields at the desired (lower) temperatures and decrease the
temperature of the air/H2O2/H2O stream. This causes some portion of H2O2/H2O mixture
condenses into liquid.

74
Bibliography
[1] Matthew M. Mench. Fuel cell engines. John Wiley & Sons, Inc., 2008.
[2] N Djilali and PC Sui. Transport phenomena in fuel cells: from microscale to macroscale.
International Journal of Computational Fluid Dynamics, 22(1-2):115–133, 2008.
[3] Jing Zhao, Yalin Yan, Li Zhu, Xiaoxi Li, and Genxi Li. An amperometric biosensor for
the detection of hydrogen peroxide released from human breast cancer cells. Biosensors and
Bioelectronics, 41:815–819, 2013.
[4] Taro Kinumoto, Minoru Inaba, Yoko Nakayama, Kazuhito Ogata, Ryota Umebayashi,
Akimasa Tasaka, Yasutoshi Iriyama, Takeshi Abe, and Zempachi Ogumi. Durability of
perfluorinated ionomer membrane against hydrogen peroxide. Journal of power sources,
158(2):1222–1228, 2006.
[5] A Pozio, RF Silva, M De Francesco, and L Giorgi. Nafion degradation in pefcs from end
plate iron contamination. Electrochimica acta, 48(11):1543–1549, 2003.
[6] Haolin Tang, Shen Peikang, San Ping Jiang, Fang Wang, and Mu Pan. A degradation
study of nafion proton exchange membrane of pem fuel cells. Journal of Power Sources,
170(1):85–92, 2007.
[7] Wen Liu and David Zuckerbrod. In situ detection of hydrogen peroxide in pem fuel cells.
Journal of The Electrochemical Society, 152(6):A1165–A1170, 2005.
[8] Vishal O Mittal, H Russell Kunz, and James M Fenton. Is h2o2 involved in the
membrane degradation mechanism in pemfc? Electrochemical and Solid-State Letters,
9(6):A299–A302, 2006.
[9] Jinli Qiao, Morihiro Saito, Kikuko Hayamizu, and Tatsuhiro Okada. Degradation of
perfluorinated ionomer membranes for pem fuel cells during processing with h2o2. Journal of
The Electrochemical Society, 153(6):A967–A974, 2006.
[10] Vijay A Sethuraman, John W Weidner, Andrew T Haug, Sathya Motupally, and Lesia V
Protsailo. Hydrogen peroxide formation rates in a pemfc anode and cathode effect of humidity
and temperature. Journal of The Electrochemical Society, 155(1):B50–B57, 2008.
[11] Biyan Zhou, Jihua Wang, Zhenfei Guo, Huoquan Tan, and Xiaochuan Zhu. A simple
colorimetric method for determination of hydrogen peroxide in plant tissues. Plant Growth
Regulation, 49(2-3):113–118, 2006.
[12] George Eisenberg. Colorimetric determination of hydrogen peroxide. Industrial &
Engineering Chemistry Analytical Edition, 15(5):327–328, 1943.
[13] William M Dehn. A gasometric method for the determination of hydrogen peroxide.
Journal of the American Chemical Society, 29(9):1315–1319, 1907.

75
[14] Jian Yao Zheng, Yongli Yan, Xiaopeng Wang, Wen Shi, Huimin Ma, Yong Sheng Zhao,
and Jiannian Yao. Hydrogen peroxide vapor sensing with organic core/sheath nanowire optical
waveguides. Advanced Materials, 24(35):OP194–OP199, 2012.
[15] Robert Koncki, Tomasz Lenarczuk, Anna Radomska, and Stanislaw Glab. Optical
biosensors based on prussian blue films. Analyst, 126:1080–1085, 2001.
[16] Ignacio DelVillar, Ignacio R. Matías, Francisco J. Arregui, and Richard O. Claus. Esa-
based in-fiber nanocavity for hydrogen–peroxide detection. IEEE TRANSACTIONS ON
NANOTECHNOLOGY, 4(2):187–193, March 2005.
[17] Ignacio DelVillar, Ignacio R. Matias, Francisco J. Arregui, Jes´us Echeverr´?a, and
Richard O. Claus. Strategies for fabrication of hydrogen peroxide sensors based on electrostatic
self-assembly (esa) method. Sensors and Actuators B, 108:751–757, 2005.
[18] Li Wang, Haozhi Zhu, Yonghai Song, Li Liu, Zhifang He, Lingli Wan, Shouhui Chen,
Ying Xiang, Shusheng Chen, and Jie Chen. Architecture of poly (o-phenylenediamine)–ag
nanoparticle composites for a hydrogen peroxide sensor. Electrochimica Acta, 60:314–320, 2012.
[19] Qiang Yan, Zhiliang Wang, Jian Zhang, Hui Peng, Xuejiao Chen, Huina Hou, and
Chunran Liu. Nickel hydroxide modified silicon nanowires electrode for hydrogen peroxide
sensor applications. Electrochimica Acta, 61:148–153, 2012.
[20] Xuemi Hu and Shiquan Tao. An optical fiber h2o2-sensing probe using a titanium(iv)
oxyacetylacetonate immobilized nafion coating on a bent optical fiber probe. IEEE Sensors
Journal, 11:2032–2036, 2011.
[21] Nigel A David, Peter M Wild, Jingwei Hu, and Nedjib Djilali. In-fibre bragg grating
sensors for distributed temperature measurement in a polymer electrolyte membrane fuel cell.
Journal of Power Sources, 192(2):376–380, 2009.
[22] NA David, PM Wild, J Jensen, T Navessin, and N Djilali. Simultaneous in situ
measurement of temperature and relative humidity in a pemfc using optical fiber sensors. Journal
of The Electrochemical Society, 157(8):B1173–B1179, 2010.
[23] Xnemei Hu Shiquan Tao, Joseph C. Fanguy. Fiber optic sensors for in situ real-time
monitoring pem fuel cell operation. In Proceedings of FUELCELL2005 Third International
Conference on Fuel Ceil Science, Engineering and Technology, 2005.
[24] Ignacio DelVillar, Ignacio R. Matías, Francisco J. Arregui, and Richard O. Claus. Fiber-
optic hydrogen peroxide nanosensor. IEEE SENSORS JOURNAL, 5(3):365–371, June 2005.
[25] Chandrakant Tagad, Sreekantha Dugasani, Rohini Aiyer, Sungha Park, Atul Kulkarni,
and Sushma Sabharwal. Green synthesis of silver nanoparticles and their application for the
development of optical fiber based hydrogen peroxide sensor. Sensors and Actuators B:
Chemical, 183:144– 149, 2013.

76
[26] Edgar Pick and Yona Keisari. A simple colorimetric method for the measurement of
hydrogen peroxide produced by cells in culture. Journal of immunological methods, 38(1):161–
170, 1980.
[27] Makoto Mizoguchi, Munetaka Ishiyama, and Masanobu Shiga. Water-soluble
chromogenic reagent for colorimetric detection of hydrogen peroxide—an alternative to 4-
aminoantipyrine working at a long wavelength. Anal. Commun., 35(2):71–74, 1998.
[28] Craig Gay and Janusz M Gebicki. A critical evaluation of the effect of sorbitol on the
ferric–xylenol orange hydroperoxide assay. Analytical biochemistry, 284(2):217–220, 2000.
[29] Aleksandra Lobnik and Merima Cajlakovic. Sol–gel based optical sensor for continuous
determination of dissolved hydrogen peroxide. Sensors and Actuators B: Chemical, 74(1):194–
199, 2001.
[30] Evan W Miller, Orapim Tulyathan, Ehud Y Isacoff, and Christopher J Chang. Molecular
imaging of hydrogen peroxide produced for cell signaling. Nature chemical biology, 3(5):263–
267, 2007.
[31] Evan W Miller, Aaron E Albers, Arnd Pralle, Ehud Y Isacoff, and Christopher J Chang.
Boronate-based fluorescent probes for imaging cellular hydrogen peroxide. Journal of the
American Chemical Society, 127(47):16652–16659, 2005.
[32] Thompson M Freeman and W Rudolf Seitz. Chemiluminescence fiber optic probe for
hydrogen peroxide based on the luminol reaction. Analytical Chemistry, 50(9):1242–1246, 1978.
[33] Azra Tahirovic, Amira Copra, Enisa Omanovic-Miklicanin, and Kurt Kalcher. A
chemiluminescence sensor for the determination of hydrogen peroxide. Talanta, 72(4):1378–
1385, 2007.
[34] TS Francis, Shizhuo Yin, and Paul B Ruffin. Fiber optic sensors. CRC press, 2010.
[35] Erick L Bastos, Paulete Romoff, Camila R Eckert, and Wilhelm J Baader. Evaluation of
antiradical capacity by h2o2-hemin-induced luminol chemiluminescence. Journal of agricultural
and food chemistry, 51(25):7481–7488, 2003.
[36] Robert Koncki, Tomasz Lenarczuk, and Stanisaw Gab. Optical sensing schemes for
prussian blue/prussian white film system. Analytica chimica acta, 424(1):27–35, 2000.
[37] Meng Lin, Jiao Yang, Misuk Cho, and Youngkwan Lee. Hydrogen peroxide detection
using a polypyrrole/prussian blue nanowire modified electrode. Macromolecular Research,
19(7):673–678, 2011.
[38] Robert Koncki. Chemical sensors and biosensors based on prussian blues. Critical
Reviews in Analytical Chemistry, 32(1):79–96, 2002.

77
[39] Kingo Itaya, Tatsuaki Ataka, and Shinobu Toshima. Spectroelectrochemistry and
electrochemical preparation method of prussian blue modified electrodes. Journal of the
American Chemical Society, 104(18):4767–4772, 1982.
[40] Vernon D Neff. Electrochemical oxidation and reduction of thin films of prussian blue.
Journal of the Electrochemical Society, 125(6):886–887, 1978.
[41] Dan Du, Minghui Wang, Yuehua Qin, and Yuehe Lin. One-step electrochemical
deposition of prussian blue–multiwalled carbon nanotube nanocomposite thin-film: preparation,
characterization and evaluation for h2o2 sensing. Journal of Materials Chemistry, 20:1532–1537,
2010.
[42] Ru Yang, Zaibo Qian, and Jiaqi Deng. Electrochemical deposition of prussian blue from
a single ferricyanide solution. Journal of the Electrochemical Society, 145(7):2231–2236, 1998.
[43] SA Agnihotry, Punita Singh, Amish G Joshi, DP Singh, KN Sood, and SM Shivaprasad.
Electrodeposited prussian blue films: Annealing effect. Electrochimica acta, 51(20):4291–4301,
2006.
[44] Ming Hu, Shuhei Furukawa, Ryo Ohtani, Hiroaki Sukegawa, Yoshihiro Nemoto, Julien
Reboul, Susumu Kitagawa, and Yusuke Yamauchi. Synthesis of prussian blue nanoparticles with
a hollow interior by controlled chemical etching. Angewandte Chemie, 124(4):1008–1012, 2012.
[45] Sani Demiri, Metodija Najdoski, and Julijana Velevska. A simple chemical method for
deposition of electrochromic prussian blue thin films. Materials Research Bulletin, 46:2484–
2488, 2011.
[46] Xinglong Wu, Minhua Cao, Changwen Hu, and Xiaoyan He. Sonochemical synthesis of
prussian blue nanocubes from a single-source precursor. Crystal Growth & Design, 6(1):26–28,
2006.
[47] Junfeng Zhai, Yueming Zhai, Liang Wang, and Shaojun Dong. Rapid synthesis of
polyethylenimine-protected prussian blue nanocubes through a thermal process. Inorganic
chemistry, 47(16):7071–7073, 2008.
[48] Ignacio Del Villar, Ignacio R Matás, FJ Arregui, and RO Claus. Esa based fiber-optic
sensor for continuous detection of hydrogen peroxide concentration. In Sensors, 2003.
Proceedings of IEEE, volume 1, pages 393–396. IEEE, 2003.
[49] Xiaomiao Feng, Zhengzong Sun, Wenhua Hou, and Jun-Jie Zhu. Synthesis of functional
polypyrrole/prussian blue and polypyrrole/ag composite microtubes by using a reactive template.
NANOTECHNOLOGY, 18:195603 (7pp), 2007.
[50] Subramanian Bharathi and Ovadia Lev. Sol-gel-derived prussian blue-silicate
amperometric glucose biosensor. Applied biochemistry and biotechnology, 89(2-3):209–216,
2000.

78
[51] Silvia Zamponi, Anna M Kijak, Andre J Sommer, Roberto Marassi, Pawel J Kulesza, and
James A Cox. Electrochemistry of prussian blue in silica sol-gel electrolytes doped with
polyamidoamine dendrimers. Journal of Solid State Electrochemistry, 6(8):528–533, 2002.
[52] Yu-Lin Hu, Jin-Hua Yuan, Wei Chen, Kang Wang, and Xing-Hua Xia. Photochemical
synthesis of prussian blue film from an acidic ferricyanide solution and application.
Electrochemistry communications, 7(12):1252–1256, 2005.
[53] Akihito Gotoh, Hiroaki Uchida, Manabu Ishizaki, Tetsutaro Satoh, Shinichi Kaga,
Shusuke Okamoto, Masaki Ohta, Masatomi Sakamoto, Tohru Kawamoto, Hisashi Tanaka, et al.
Simple synthesis of three primary colour nanoparticle inks of prussian blue and its analogues.
Nanotechnology, 18(34):345609, 2007.
[54] D Ellis, M Eckhoff, and VD Neff. Electrochromism in the mixed-valence hexacyanides.
1. voltammetric and spectral studies of the oxidation and reduction of thin films of prussian blue.
The Journal of Physical Chemistry, 85(9):1225–1231, 1981.
[55] Robert Koncki and Otto S. Wolfbeis. Composite films of prussian blue and n-substituted
polypyrroles: Fabrication and application to optical determination of ph. Analytical Chemistry,
70(13):2544–2550, July 1 1998.
[56] Hamed Akbari Khorami, Juan F Botero-Cadavid, Peter Wild, and Ned Djilali.
Spectroscopic detection of hydrogen peroxide with an optical fiber probe using chemically
deposited prussian blue. Electrochimica Acta, 115:416– 424, 2014.
[57] Hamed Akbari Khorami, Peter Wild, Alexandre G Brolo, and Ned Djilali. ph-dependent
response of a hydrogen peroxide sensing probe. Sensors and Actuators B: Chemical, 237:113–
119, 2016.
[58] Hamed Akbari Khorami, Nadine Jacobs, Peter Wagner, Alexander Dyck, Peter Wild,
Alexandre G Brolo, and Ned Djilali. Effect of deposition conditions on stability of pb films at
pemfc’s operating temperatures and ph. Journal of The Electrochemical Society, 163(6):B185–
B187, 2016.
[59] Juan F Botero-Cadavid, Alexandre G Brolo, Peter Wild, and Ned Djilali. Detection of
hydrogen peroxide using an optical fiber-based sensing probe. Sensors and Actuators B:
Chemical, 185:166–173, 2013. In Press.
[60] Juan F Botero-Cadavid, Peter Wild, and Ned Djilali. Temperature response and durability
characterization of an optical fiber sensor for the detection of hydrogen peroxide. Electrochimica
Acta, 129:416–424, 2014.
[61] Paulette BL Chang and Thomas M Young. Kinetics of methyl< i> tert</i>-butyl ether
degradation and by-product formation during uv/hydrogen peroxide water treatment. Water
research, 34(8):2233–2240, 2000.

79
[62] T Pottage, C Richardson, S Parks, JT Walker, and AM Bennett. Evaluation of hydrogen
peroxide gaseous disinfection systems to decontaminate viruses. Journal of Hospital Infection,
74(1):55–61, 2010.
[63] RK Root, J Metcalf, N Oshino, and B Chance. H2o2 release from human granulocytes
during phagocytosis. i. documentation, quantitation, and some regulating factors. Journal of
Clinical Investigation, 55(5):945, 1975.
[64] Yu Jeong Byun, Seong Keun Kim, Young Mi Kim, Gue Tae Chae, Seong-Whan Jeong,
and Seong-Beom Lee. Hydrogen peroxide induces autophagic cell death in c6 glioma cells via
bnip3-mediated suppression of the mtor pathway. Neuroscience letters, 461(2):131–135, 2009.
[65] Subhashinee SK Wijeratne, Susan L Cuppett, and Vicky Schlegel. Hydrogen peroxide
induced oxidative stress damage and antioxidant enzyme response in caco-2 human colon cells.
Journal of agricultural and food chemistry, 53(22):8768–8774, 2005.
[66] Dam TV Anh, W Olthuis, and P Bergveld. A hydrogen peroxide sensor for exhaled
breath measurement. Sensors and Actuators B: Chemical, 111–112:494–499, 2005.
[67] Louise Samain, Bernard Gilbert, Fernande Grandjean, Gary J Long, and David Strivay.
Redox reactions in prussian blue containing paint layers as a result of light exposure. J. Anal. At.
Spectrom., 28(4):524–535, 2013.
[68] Ivanildo Luiz de Mattos, Lo Gorton, and Tautgirdas Ruzgas. Sensor and biosensor based
on prussian blue modified gold and platinum screen printed electrodes. Biosensors and
Bioelectronics, 18(2):193–200, 2003.
[69] Bernhard AH Von Bockelmann and Irene LI Von Bockelmann. Aseptic packaging of
liquid food products: a literature review. Journal of agricultural and food chemistry, 34(3):384–
392, 1986.
[70] Malcolm S Purdey, Jeremy G Thompson, Tanya M Monro, Andrew D Abell, and Erik P
Schartner. A dual sensor for ph and hydrogen peroxide using polymer-coated optical fibre tips.
Sensors, 15(12):31904–31913, 2015.
[71] F Ricci and G Palleschi. Sensor and biosensor preparation, optimisation and applications
of prussian blue modified electrodes. Biosensors and Bioelectronics, 21(3):389–407, 2005.
[72] Minmin Liu, Ru Liu, and Wei Chen. Graphene wrapped cu 2 o nanocubes: non-
enzymatic electrochemical sensors for the detection of glucose and hydrogen peroxide with
enhanced stability. Biosensors and Bioelectronics, 45:206–212, 2013.
[73] Robert Koncki and Otto S Wolfbeis. Optical chemical sensing based on thin films of
prussian blue. Sensors and Actuators B: Chemical, 51(1):355–358, 1998.
[74] Behrooz Zargar and Amir Hatamie. Prussian blue nanoparticles: a simple and fast optical
sensor for colorimetric detection of hydralazine in pharmaceutical samples. Analytical Methods,
6:5951–5956, 2014.

80
[75] Shinji Kato, Yuya Masahira, Kazuhiko Noda, and Hatiro Imai. Degradation of solid
polymer membrane in pefc by hydrogen peroxide. ECS Transactions, 16(48):1–5, 2009.
[76] Minoru Inaba, Taro Kinumoto, Masayuki Kiriake, Ryota Umebayashi, Akimasa Tasaka,
and Zempachi Ogumi. Gas crossover and membrane degradation in polymer electrolyte fuel cells.
Electrochimica Acta, 51(26):5746–5753, 2006.
[77] Kazuhiro Teranishi, Kentaro Kawata, Shohji Tsushima, and Shuichiro Hirai. Degradation
mechanism of pemfc under open circuit operation. Electrochemical and Solid-State Letters,
9(10):A475–A477, 2006.
[78] AM Farah, C Billing, CW Dikio, AN Dibofori-Orji, OO Oyedeji, D Wankasi,
FM Mtunzi, and ED Dikio. Synthesis of prussian blue and its electrochemical detection of
hydrogen peroxide based on cetyltrimethylammonium bromide (ctab) modified glassy carbon
electrode. Int. J. Electrochem. Sci, 8:12132–12146, 2013.
[79] Juan F Botero-Cadavid. Fiber-optic sensor for detection of hydrogen peroxide in PEM
fuel cells. PhD thesis, University of Victoria, 2014.

81
Appendix A: Polymer Electrolyte Membrane Fuel Cell
PEM fuel cells have the potential to be used in portable (0-100W), stationary (0-
25kW), and transportation (~ 80kW) applications. Among those, using PEM fuel cells in
transportation systems is attracted more attention because of its low operating
temperature (from room temperature to ~ 80°C) and high relative performance. Current
and voltage of PEM fuel cells are required to be adjusted in order to generate the required
power. Fuel cell current is adjustable simply by changing the size of the active electrode
area. The higher active electrode area leads to higher current in a single fuel cell. On the
other hand, the output voltage of a single fuel cell is always less than 1 V. This is because
of the limitation that is caused by the fundamental of electrochemical potential of reactant
and product species. Therefore, the voltage of a fuel cell stack is tunable by connecting
several individual fuel cells in series to achieve compact design, and higher voltage and
power. To have a better understanding about the fundamental of fuel cells operation, the
mechanism of energy conversion within PEM fuel cells, key components of PEM fuel
cells and the materials that are used in PEM fuel cells are explained below.
The basis of electricity generation in the fuel cell is electrochemical reactions that
take place inside it. In general, the energy difference between products and reactants
states in an exothermic electrochemical reaction minus various losses of the fuel cell
system gives the operating voltage of the fuel cell. The operating voltage of the fuel cell
is a driving force for electrons to flow through the external circuit and drive the load. For
an electrochemical reaction to happen, there are several necessary components [1]:
1. Anode and cathode electrodes: electrochemical reactions happen on electrodes.
Oxidation occurs at anode side and electrons are produced. Reduction occurs at
cathode side and electrons are consumed. A pair of oxidation and reduction
reactions is called a redox reaction and explains the overall reaction of a system.
2. Electrolyte: an electrolyte can be a liquid or a solid that physically separates
electrodes, or in other words, fuel and oxidizer. It is ion conductive and electron
insulator that prevents electron short-circuiting between electrodes. The produced
ions in a half redox reaction are conducted to the other electrode through the
electrolyte and the other half redox reaction happens there.

82
3. External connection between electrodes for current flow: the external circuit
connects electrodes to each other. The produced electrons at anode side flow
through an external circuit, drive the load, and reach to the cathode side to
complete the circuit.
A PEM fuel cell also consists of an anode electrode, a cathode electrode, and a
proton exchange membrane (PEM) that all together called as Membrane Electrode
Assembly (MEA). Anode and cathode electrodes are connected together with an external
circuit. At the anode electrode, hydrogen fuel is oxidized to hydrogen cations and
produces electrons. Hydrogen cations migrate to cathode side through the electrolyte
membrane. Conversely, electrons are blocked by electrolyte membrane, and flow through
the external circuit, drive the load, and return to the cathode side. On the other hand, at
the cathode electrode, oxygen reacts with hydrogen cations and consumes electrons. As
long as anode and cathode are fed with hydrogen and oxygen, the electrons flow through
the external circuit [1, 2]. Figure A-1 is a schematic of fuel cell’s components and shows
the general reactions happen in the fuel cell.
Figure A-1: Schematic of fuel cell’s components and reactions.

83
PEM fuel cells include the following key components: polymer electrolyte
membrane, catalyst layers (CL), gas diffusion layers (GDL), and bipolar plates with flow
channels for reactants, products, and coolant in larger stacks [1].
The solid electrolyte membrane in the PEM fuel cell is formed from a hydrophobic
and inert polymer backbone which sulfonated with hydrophilic and ionically conductive
acid clusters. Nafion is the most well-studied polymer electrolyte for fuel cells which is
created by sulphonation (SO3-) of the basic polytetrafluoroethylene (PTFE) structure, as
shown in Figure A-2. Although the PTFE is not ionically conductive but provides
chemical stability and durability of membrane. Clustering of the sulfonic acid side groups
and hydration level are determining factors on the ionic conductivity of the electrolyte.
A catalyst layer (CL) in a PEM fuel cell is a tree-dimensional porous structure
consists of carbon-supported catalyst and ionomer. Electrochemical reactions at anode
and cathode happen in catalyst layers. For example a reduction reaction occurs in cathode
when oxygen, hydrogen ions, and electrons meet in presence of catalyst particles. For the
reactions to happen ions, electrons, reactants, and products are required to be easily
transported in CL. The CL must also have a high electrochemically active surface area.
Ionomer and high conductive carbon particles function as an ion conductor and electron
conductor, respectively. Catalyst particles decrease the required activation energy of the
electrochemical reaction and promote the electrochemical reaction. Highly porous
structure of the CL facilitates transport of reactants and products. Figure A-3 shows the
CL at cathode electrode.

84
Figure A-2: Nafion structure
(http://en.wikipedia.org/wiki/File:Nafion2.svg).
Figure A-3: CL at cathode electrode
(taken from [2], Reproduced with
permission from Elsevier).
A gas diffusion layer (GDL) consists of a carbon fiber or woven cloth microporous
layer. The GDL functions as an electron conductor to/from the CL and reactant transport
to or product removal from the CL. It also provides heat transport from the CL to the
bipolar plate and is a mechanical support for the CL.
A bipolar plate or flow field utilizes polymer-sealed high-conductivity graphite
material. Bipolar plates conduct electrons from the anode to the external circuit and from
the external circuit to the cathode. It delivers fuel flow through flow channels and
provides structural integrity of the stack. A bipolar plate also dissipates waste heat
generated by inefficiencies of the reaction, often with a coolant flow through itself. A
polymer sealing is used in bipolar plates to ensure the normally porous graphite is
impermeable to water.

85
Appendix B: Prussian Blue
PB is a ferric ferrocyanide with the basic face-centered-cubic crystalline structure
consisting of iron ions linked by the cyanide groups with two chemical forms
Fe4III[FeII(CN)6]3 and KFeIIIFeII(CN)6, Figure B-1 [39, 40]. These two chemical forms are
commonly known as “insoluble” and “soluble”, respectively [40]. Both insoluble and
soluble forms of PB are highly insoluble (Ksp = 10-40), the difference refers to the
simplicity of potassium peptization [54]. Large metal cations and water molecules, as
well as other small molecules like H2O2, can be accommodated in the open structure of
PB [54]. Chemical reduction and oxidation of PB leads to Prussian White (PW)
(potassium ferrous ferrocyanide) and Berlin green (BG) (ferric ferricyanide), with
chemical formula K2FeIIFeII(CN)6, and FeIIIFeIII(CN)6, respectively [39, 54]. Reactions
(B-1) to (B-4) show the reduction and oxidation for soluble and insoluble forms of PB,
respectively.
Figure B-1: Face-centered-cubic crystal structure of PB (taken from [38], Reproduced with
permission from Taylor & Francis).
2 6
III II +
6KFe Fe (CN) +e + ( )K II IIK Fe Fe CN (B-1)
III II
6 6KFe Fe (CN) ( )III IIIFe Fe CN e K (B-2)
III II +
4 46 4 6 33Fe [Fe (CN) ] +4e +4 ( ]K [ )II IIK Fe Fe CN
(B-3)
III II
4 6 3 4 6 3 3Fe [Fe (CN) ] +3 [ ( ) ] 3X III IIIFe Fe CN X e (B-4)