Embed Size (px)
Citation preview

Hydrogen Fuel Quality Specifications for Polymer Electrolyte Fuel Cells in Road VehiclesReport to the Safety, Codes and Standards Program
Fuel Cell Technologies Office
U.S. Department of Energy
Published November 2, 2016

(This page intentionally left blank)(This page intentionally left blank)

i
HYDROGEN FUEL QUALITY SPECIFICATIONS FOR POLYMER ELECTROLYTE FUEL CELLS IN ROAD VEHICLES
AuthorsLead Authors: James M. Ohi, Nicholas Vanderborgh, Gerald Voecks Consultants
Contributing Authors: Shabbir Ahmed, Romesh Kumar, Dennis Papadius Argonne National Laboratory, Tommy Rockward, Los Alamos National Laboratory
AcknowledgementThe authors would like to acknowledge Antonio Ruiz, technology manager of the Safety, Codes and Standards program (SCS) in the U.S. Department of Energy’s Fuel Cell Technologies Office (FCTO), whose guidance and support were critical to the team’s success. Preceding SCS managers Pat Davis, Dr. Sig Gronich, and Neil Rossmeissl and current SCS manager Will James also provided critical guidance and support. We also thank Nancy Garland and Fred Joseck of the FCTO, who encouraged and enabled collaboration among researchers affiliated with different FCTO programs. The authors also acknowledge the leadership of the convener of International Organization for Standardization (ISO) Technical Committee (TC) 197 Working Group 12 (WG12), Professor Yasuo Takagi of Tokyo City University, and the secretary of WG12, Dr. Hidenori Tomioka of the Japan Automobile Research Institute.
The work described in this report could not have been accomplished without the invaluable contributions of the team of experts who conducted the testing, modeling, and analysis to help develop the ISO and SAE International (SAE) standards. Many thanks to the team members listed below, including their affiliations during the height of team activity between 2006 and 2008. This report was originally submitted to FCTO on November 30, 2012 as a supplement to the development of the fuel quality specifications.
Air Liquide Robert Benesch, Martin Carre
Air ProductsDave Guro, Tom Joseph
Argonne National LaboratoryRajesh Ahluwalia, Shabbir Ahmed, Romesh Kumar
Ballard Power Systems (Canada)Silvia Wessel
BPJim Simnick
California Fuel Cell Partnership Jackie Birdsall
CEA (France)Laurent Antoni, Olivier Lemaire
ChevronBhaskar Balasubramanian, John Lemen
Daimler-ChryslerGeorge Mitchell , Jesse Schneider
General Motors Mike Steele, Fred Wagner
Japan Automobile Research Institute Motoaki Akai
Linde (BOC Group)Bob Boyd
Los Alamos National LaboratoryTommy Rockward, Ken Stroh, Francisco Uribe
National Hydrogen Association (NHA)Karen Hall

HYDROGEN FUEL QUALITY SPECIFICATIONS FOR POLYMER ELECTROLYTE FUEL CELLS IN ROAD VEHICLES
ii
(This page intentionally left blank)

iii
HYDROGEN FUEL QUALITY SPECIFICATIONS FOR POLYMER ELECTROLYTE FUEL CELLS IN ROAD VEHICLES
Table of ContentsAcknowledgement i
Table of Contents iii
1 Introduction vii
1 1 Background vii
1 2 Preparation of ISO FDIS 14687-2 and SAE J2719 viii
1 3 Hydrogen Fuel Quality and PEM Fuel Cell Degradation 2
1 4 Fuel Cell System and Vehicle Considerations 3
2 Approach 4
2 1 Rationale 4
2 2 Limitations and Caveats 8
3 Single-Cell Testing 9
3 1 Test Plan 9
3 2 Data Reporting Format 10
3 3 Single-Cell Round Robin Tests 12
3 4 Single-Cell Tests with Common Membrane Electrode Assemblies 13
3 5 Single-Cell Test Results 14
3 5 1 Carbon Monoxide (CO) 14
3 5 2 Total Sulfur Compounds 19
3 5 3 Ammonia (NH3) 23
3 5 4 Hydrocarbons and Halogenated Compounds 25
3 5 5 Inert Compounds, Oxygen, and Water 26
3 5 6 Binary and Multiple Contaminant Mixtures 27
3 5 7 Particulate Matter 29

HYDROGEN FUEL QUALITY SPECIFICATIONS FOR POLYMER ELECTROLYTE FUEL CELLS IN ROAD VEHICLES
iv
4 Single-Cell Test Results and Real-World Polymer Electrolyte Membrane Fuel Cell Vehicle Operating Conditions 31
4 1 Acceptable Performance and Durability Losses Due to Fuel Contaminants 31
4 2 Effects of Operating Conditions 32
4 2 1 Fuel Cell Tech Team Performance and Durability Test Protocols 32
4 2 2 Temperature, Pressure, Relative Humidity, Stoichiometry 32
4 2 3 Cell Potential and Duty Cycle 33
4 2 4 Shutdown–Startup 33
4 2 5 Fuel Cell–Battery Hybridization 33
5 Modeling 34
5 1 Contamination Models 34
5 2 Stack Modeling 35
6 Field Data 39
6 1 Controlled Hydrogen Fleet and Infrastructure Demonstration and Validation Project (United States) 39
6 2 Japan Hydrogen and Fuel Cell Demonstration Project 40
6 3 Other Demonstration Projects 41
7 Analysis 42
7 1 Cost–Benefit Analysis and Trade-offs—Fuel Quality versus Fuel Cost 42
7 1 1 Production–Purification System 42
7 1 2 Analysis Assumptions 43
7 2 Steam Methane Reforming—Pressure Swing Adsorption Modeling Results 44
7 2 1 Base Case 44
7 2 2 Limiting (Canary) Species 45
7 2 3 Process Optimization—Effect of S/C and Pressure 46

v
HYDROGEN FUEL QUALITY SPECIFICATIONS FOR POLYMER ELECTROLYTE FUEL CELLS IN ROAD VEHICLES
7 3 Cost Analysis 48
7 3 1 Cost of Hydrogen 48
7 3 2 Fuel Cell Performance versus Fuel Quality 50
7 3 3 Quality Assurance Requirements and Costs 50
7 4 Summary and Conclusions 51
8 Analytical Methods and Quality Control 52
8 1 Perspectives of Fuel Providers 52
8 2 ASTM Standardized Analytical Methods 53
8 3 Detection Limits 55
8 4 Quality Assurance 57
8 4 1 Near-Term Quality Assurance Considerations 58
9 Summary and Conclusion 59
Appendix A Acronyms and Initialisms 61
Appendix B The Literature of Contaminant Effects on Fuel Cell Performance 65
List of FiguresFigure 2-1 Overall DOE approach to fuel quality testing, modeling, and analysis 4
Figure 2-2 Baseline production–purification system 6
Figure 3-1 Test plan parameters and test set-up 10
Figure 3-2 Data reporting format, summary sheet 11
Figure 3-3 Results of round robin tests at 60ºC operating temperature 12
Figure 3-4 Effect of CO concentration 15
Figure 3-5 Effect of current density 15

HYDROGEN FUEL QUALITY SPECIFICATIONS FOR POLYMER ELECTROLYTE FUEL CELLS IN ROAD VEHICLES
vi
Figure 3-6 Effect of RH 16
Figure 3-7 Effect of temperature (30°C) 16
Figure 3-8 Effect of temperature (80°C) 17
Figure 3-9 Recirculation of CO in the anode fuel stream 17
Figure 3-10 Effect of CO at 0 2 ppmv 18
Figure 3-11 Tests at HNEI with 0 2 ppm CO 18
Figure 3-12 Summary of CO tests with 0 05 mg Pt/cm2 at different temperatures 19
Figure 3-13 Effects of duration of exposure (1 5 ppm H2S) with increased: (a) time and (b) dosage 20
Figure 3-14 Effect of RH (2 ppm H2S, 80°C, 0 5 v) 21
Figure 3-15 Effect of operating voltage 21
Figure 3-16 Effect of OCV (10 seconds) on cell recovery 22
Figure 3-17 Effect of RH 22
Figure 3-18 Effects of NH3 poisoning 23
Figure 3-19 Effect of NH3 at 0 1 ppm 24
Figure 3-20 Electrochemical impedance spectrograph of NH3 poisoning 25
Figure 3-21 Polarization curves of NH3 poisoning 25
Figure 3-22 Specifications for total hydrocarbons, formaldehyde, formic acid, and total halogenated compounds from ISO FDIS 14687-2 26
Figure 3-23 Summary of testing for total hydrocarbons, formaldehyde, formic acid, and total halogenates 26
Figure 3-24 Co-adsorption of CO and H2S 28
Figure 3 25 Effects of critical contaminant mixture 28
Figure 5-1 ANL PEM fuel cell stack model with recirculation–purge scheme 36
Figure 5-2 Purge loss (%) and purge interval (seconds) vs stack tower (%) 36
Figure 5-3 Simultaneous effect of contaminants with recirculation 37
Figure 5-4 Conclusions from JARI study on contaminant accumulation due to recirculation 38

vii
HYDROGEN FUEL QUALITY SPECIFICATIONS FOR POLYMER ELECTROLYTE FUEL CELLS IN ROAD VEHICLES
Figure 6-1 Hydrogen quality index by year and production method 40
Figure 7-1 Simplified schematic of the hydrogen production–purification process for the steam reforming of natural gas 43
Figure 7-2 Impurity concentrations in the product hydrogen as a function of hydrogen recovery for the base-case set of conditions 45
Figure 7-3 (a) Effect of the S/C ratio on fuel efficiency as a function of the hydrogen recovery; (b) effect of pressure on fuel efficiency (S/C = 4 and with optimal S/C) 47
Figure 7-4 Hydrogen cost shown to be a weak function of CO concentration (natural gas price: $7 73/million BTU) 49
List of TablesTable 1-1 Directory of limiting characteristics (maximum allowable limits of contaminants) from ISO FDIS 14687-2 2
Table 2-1 Relative difficulty of removing selected contaminant species from hydrogen produced by SMR and purified by PSA 7
Table 3-1 Concentration and size of particulate matter sampled at selected fueling stations 30
Table 6-1 Fuel quality data from the Senju fueling station 41
Table 7-1 Base case natural gas and reformate compositions 45
Table 7-2 Reformate gas compositions (%-Dry) as a function of S/C ratio 46
Table 7-3 Distributed production of hydrogen from the steam reforming of natural gas: economic and technical operating parameters used in H2A v2 0 1 48
Table 7-4 Cost of hydrogen over the life of a fuel cell vehicle as a function of CO content 50
Table 7-5 Cost of analyzing product hydrogen 51
Table 8-1 ASTM D04 14 status of priority standards for hydrogen fuel quality 54
Table 8-2 Analytical methods and limits for ISO FDIS14687-2 55
Table 8-3 Analytical sampling and measurement of contaminants at H2 fueling stations in Japan 57

HYDROGEN FUEL QUALITY SPECIFICATIONS FOR POLYMER ELECTROLYTE FUEL CELLS IN ROAD VEHICLES
viii
This report is being disseminated by the Department of Energy. As such, the document was prepared in compliance with Section 515 of the Treasury and General Government Appropriations Act for Fiscal Year 2001 (Public Law 106-554) and information quality guidelines issued by the Department of Energy. Though this report does not constitute “influential” information, as that term is defined in DOE’s information quality guidelines or the Office of Management and Budget’s Information Quality Bulletin for Peer Review (Bulletin), the report was reviewed both internally and externally prior to publication.
NOTICEThis report was prepared as an account of work sponsored by an agency of the United States government. Neither the United States government nor any agency thereof, nor any of their employees, makes any warranty, express or implied, or assumes any legal liability or responsibility for the accuracy, completeness, or usefulness of any information, apparatus, product, or process disclosed, or represents that its use would not infringe privately owned rights. Reference herein to any specific commercial product, process, or service by trade name, trade¬mark, manufacturer, or otherwise does not necessarily constitute or imply its endorsement, recommendation, or favoring by the United States government or any agency thereof. The views and opinions of authors expressed herein do not necessarily state or reflect those of the United States government or any agency thereof.

ix
HYDROGEN FUEL QUALITY SPECIFICATIONS FOR POLYMER ELECTROLYTE FUEL CELLS IN ROAD VEHICLES
1. IntroductionThe U.S. Department of Energy (DOE), through its Fuel Cell Technologies Office (FCTO), supports, among other activities, testing, modeling, and analysis to help establish a technical foundation for requirements in key hydrogen codes and standards essential for the commercial deployment of hydrogen and fuel cell technologies. One of these key standards addresses hydrogen fuel quality specifications for polymer electrolyte membrane (PEM) fuel cells in road vehicles. These specifications must be quantified at the vehicle-fueling station interface and must consider how the presence of small amounts of contaminants affect the performance and durability of PEM fuel cells and balance of plant (BOP)1; material compatibility of on-board and stationary hydrogen storage systems; and the operation and maintenance of hydrogen production, purification, and delivery systems. Most importantly, fuel quality specifications must consider trade-offs between the cost of hydrogen fuel and the performance and complexity of PEM fuel cells and hydrogen infrastructure technologies.
DOE worked with key stakeholders to develop consensus single-cell PEM fuel cell test protocols and plans and conduct testing; perform modeling and analysis of PEM single-cell and fuel cell system performance and durability; and conduct modeling and trade-off analysis of hydrogen production and purification versus fuel cost to build a technical basis for requirements for a hydrogen fuel quality standard. This work also sought a better understanding of the fundamental mechanisms through which contaminants affect the performance and durability of PEM fuel cells. This paper highlights DOE’s research & development (R&D) efforts in support of the development of consensus domestic and international hydrogen fuel quality specifications under the International Organization for Standardization (ISO) and in parallel with SAE International (SAE). The paper also discusses the planning and development of a collaborative R&D program between the United States, Japan, and the European Commission to establish these specifications grounded on sound technical data, modeling, and analysis.
1.1. BackgroundIn April 2004, DOE conducted its first national workshop on hydrogen fuel quality specifications for PEM fuel cells for road vehicles. The event was held in conjunction with the National Hydrogen Association’s annual conference in Los Angeles, California. The purpose of the DOE workshop was to initiate and coordinate participation by U.S. experts in a discussion on R&D and testing relating to fuel quality with the aim of supporting the amendment of the existing ISO standard for hydrogen fuel quality (ISO 14687-1)2 and the preparation of a parallel domestic standard (SAE J2719)3 under SAE. The workshop provided U.S. stakeholders with a better perspective on developing an international hydrogen fuel quality standard. Participants helped prepare a rough work breakdown structure of the fuel quality issue for the total hydrogen “source-to-use” chain for which specifications must be defined. The remainder of this section provides a summary of the key points from this meeting.
One of the first steps was to address terminology, particularly “fuel purity.” Participants concluded that this term is a misnomer because the aim is not to achieve purity but to determine the maximum levels of contaminants that can be tolerated by the vehicular fuel cell system while maintaining acceptable performance, durability, and cost requirements. The U.S. team agreed to use the term “fuel quality” rather than fuel purity and, in addition, define a common terminology for work products to be developed, such as test protocols, test plans, matrices of impurities, and R&D plans.
The initial discussion by U.S. stakeholders focused on a logistical conflict. The stakeholders stated that it is of limited usefulness to determine the effects of hydrogen fuel quality on PEM fuel cell stacks that are not yet commercially viable and that will likely be very different from the current state of the art when they reach commercial viability; furthermore, million-dollar demonstration vehicles cannot serve as test beds for fuel quality requirements. At the same time, if fuel quality requirements for fuel cells stacks are not first defined, requirements
1 Balance of plant (BOP) refers to the supporting and/or auxiliary system components enabling the operation of the fuel cell-based power system.2 ISO, ISO14687-1:1999, Hydrogen Fuel—Product Specification—Part 1: All applications except proton exchange membrane (PEM) fuel cell for
road vehicles, March 1, 2007.3 SAE International, SAE J2719, Hydrogen Fuel Quality for Fuel Cell Vehicles, September 1, 2011.

HYDROGEN FUEL QUALITY SPECIFICATIONS FOR POLYMER ELECTROLYTE FUEL CELLS IN ROAD VEHICLES
x
for the whole system or upstream fuel infrastructure requirements cannot be realistically addressed. An initial step may be to identify those components and subsystems that are least likely to change and those for which changes are essential if the technology is to be commercially viable.
While it is important to avoid premature standards, codes, and regulations that may slow the introduction of new technologies, important questions must be addressed concerning the effects of hydrogen fuel quality on fuel cell stack performance and durability. In any case, most of the testing will be done in laboratories, and the workshop participants decided that the initial focus of work should be to identify the “bad actors,” the key contaminants, and the fuel cells’ level of tolerance to each of these contaminants. Species that may have similar characteristics or effects could be grouped, and targets could be set for each such group of contaminants. The aim of this initial work would be to determine preliminary fuel quality specifications that can be used to develop minimum guidelines using current state-of-the-art PEM fuel cells as a baseline. Existing standards of the Compressed Gas Association (CGA) and ISO can provide a starting point for preliminary minimum specifications, including the history of gaseous and liquid hydrogen quality, for example, that fuel providers are meeting under CGA 5.3.4 At the same time, the initial guidelines will be “conservative” to protect the large R&D investments in prototype and demonstration fuel cell vehicles (FCVs).
Another key initial step will be to classify contaminants according to risk—perhaps high, medium, and low—in terms of probability of occurrence (presence in gas stream) and severity of impact on cell and stack performance and durability. In other words, fuel quality could be addressed as a risk management problem. An attempt should be made to develop a matrix of contaminants by species and key characteristics (especially accumulating vs. self-cleaning contaminants), analytic techniques, and sensitivities (to both measurement protocols and cell and stack performance and durability).
Other important issues discussed include the need for low-cost analytical equipment and procedures and the need to address cathode-side contaminants, particularly the effects of low-level species extant in air on fuel cell performance and durability. It was also pointed out that storage materials used in commercially viable systems will also be different from the current state of the art and a better understanding of fuel storage system tolerance of various contaminant types and levels is needed. Finally, the work on developing fuel quality guidelines could also lead to R&D insights and opportunities to better understand key technical and material issues and should be much more than a testing program. The workshop helped to establish a structured approach to developing fuel quality specifications that addressed the major concerns of key stakeholders.
1.2. Preparation of ISO FDIS 14687-2 and SAE J2719Japan proposed work to amend the existing International Organization for Standardization (ISO) standard 14687:1999, which led to the convening of Working Group 12 (WG12) of ISO Technical Committee 197 (Hydrogen Technologies) under Professor Yasuo Takagi, then director of the Hydrogen Research Center, Mushashi Institute of Technology, in Japan. WG12 held its first meeting in Yokohama in June 2004, preceding the World Hydrogen Energy Conference (WHEC15). As presented by Japan, the rationale for amending the existing ISO standard was that it described a common grade of hydrogen fuel for both internal combustion engine vehicles and FCVs, but the allowable limits of carbon monoxide (CO) and sulfur compounds would likely be harmful for use in a PEM FCV. The intent of the amended standard was to focus on small-scale (limited) introduction of an FCV fleet that, if necessary, could be revised in concert with the progress of FCV technology and fuel quality testing. A revised international standard was deemed crucial given the accelerating pace of FCV demonstration projects in Asia, North America, and Europe. Adoption of such a standard could remove one variable in the data obtained from these demonstration projects and also facilitate eventual FCV commercialization.
The initial response of the U.S. hydrogen and fuel cell industries was that preparation of an international standard for hydrogen fuel quality was premature. Both PEM fuel cell and vehicle technologies were still being developed, and they could change significantly over the next several years. Furthermore, there were very few data on the effects of fuel contaminants on PEM fuel cell performance and durability. In a subsequent meeting of WG12, the
4 Compressed Gas Association, CGA G5.3 Commodity Specification for Hydrogen, 6th Ed., June 20, 2011.

1
HYDROGEN FUEL QUALITY SPECIFICATIONS FOR POLYMER ELECTROLYTE FUEL CELLS IN ROAD VEHICLES
United States proposed that preparation of a technical specification (TS), rather than an international standard (IS), was more appropriate for the reasons stated above. A TS is a “normative” document similar to an IS, but a TS has a maximum lifetime of three years, after which it can be renewed for another three years or modified to an ISO standard. If a TS is renewed, it must be withdrawn at the end of the second three-year period or modified to an IS. WG12 accepted the U.S. position and worked to prepare a TS intended to apply to pre-commercial demonstration fleets of PEM FCVs.
At its seventh meeting in June 2006, WG12 approved a final draft technical specification (FDTS), FDTS 14687-2, with recommended limits for non-hydrogen constituents for submission to Technical Committee (TC) 197. The draft contained language to limit the TS’s application to the pre-commercial phase of technology development of PEM fuel cells for road vehicles. On December 1, 2006, the United States submitted to TC197 its vote to approve the TS with substantive comments on the limitations of available standardized analytic methodologies to sample and measure non-hydrogen constituents at levels recommended in the TS. The TS was approved by a unanimous vote of participating member countries of TC197 and published on March 1, 2008.
With a TS in place, WG12 began work on an IS in August 2008. The convener committed to address U.S. comments on the TS by including specific clauses on sampling, analytical testing methods, and detection limits of such methods. The IS was also to include non-normative annexes containing information on best practices to reduce the cost of quality assurance of near-term hydrogen production (steam methane reforming [SMR] with pressure swing adsorption [PSA] purification) and a more extended discussion on detection limits of available analytical methods (e.g., gas chromatography using a flame ionization detector) to verify compliance with the IS’s recommended limits for contaminants in hydrogen. WG12 developed the required sequence of draft standards as required under ISO procedures and, in November 2011, submitted a final draft international standard (FDIS) to the TC197 Secretariat. In September 2012, the Secretariat issued the FDIS5 for approval by vote of participating member countries. The recommended limits included in this FDIS are shown below in Table 1-1. Verification of fuel quality is to be conducted at the dispenser nozzle under applicable standardized sampling and analytical methods or at other locations or methods acceptable to the supplier and customer. Contaminants not listed are not assumed to be benign. Upon balloting and approval of the FDIS, the IS will be published.
In parallel with the activities of WG12, DOE also supported work on SAE J2719 so that the specifications and requirements in the international and domestic standards for hydrogen fuel quality would be harmonized to the greatest possible extent. Testing, modeling, and analysis supported by DOE were made available to the Interface Working Group (IWG), chaired by Mike Steele, then with General Motors, whose work proceeded very much in step with that of WG12 during the time described above. WG12 and IWG had many common members, and the secretary and chair, respectively, each provided periodic updates to the other’s group. Furthermore, the two groups jointly resolved critical topics such as specifications for allowable contaminants, especially the difficult issue of particulate matter, and identification and incorporation of analytic methods in the standards. The IWG provided an effective forum for input by automotive original equipment manufacturers (OEMs) from Germany, Japan, and the United States, as well as energy and industrial gas companies and organizations such as the California Fuel Cell Partnership (CaFCP) and the (then) U.S. Fuel Cell Council (USFCC). Specifications in SAE J2719 (as well as ISO FDIS 14687-2) were derived from an initial listing of fuel contaminants developed by the CaFCP in 2003.6 SAE published the initial Technical Information Report (TIR) J2719 in November 2005, a revised version of the TIR in April 2008, and a standard in September 2011.3 Both the ISO and SAE standards will be updated and revised as required by ISO and SAE procedures for standard review and revision, as more data become available, and as PEM fuel cell technology for FCV progresses.
5 ISO/FDIS 14687-2:2012 (E), Hydrogen fuel—Product Specification—Part 2: Proton exchange membrane (PEM) fuel cell applications for road vehicles 6 California Fuel Cell Partnership, VeOps Hydrogen Purity Specifications, August 2003.

HYDROGEN FUEL QUALITY SPECIFICATIONS FOR POLYMER ELECTROLYTE FUEL CELLS IN ROAD VEHICLES
2
Table 1-1. Directory of limiting characteristics (maximum allowable limits of contaminants) from ISO FDIS 14687-2
Characteristics(assay)
Type I, Type II
Grade D
Hydrogen fuel index (minimum mole fraction) a 99,97%
Total non-hydrogen gases 300 µmol/mol
Maximum concentration of individual contaminants
Water (H2O) 5 µmol/mol
Total hydrocarbons b (Methane basis)
2 µmol/mol
Oxygen (O2) 5 µmol/mol
Helium (He) 300 µmol/mol
Total Nitrogen (N2) and Argon (Ar) b 100 µmol/mol
Carbon dioxide (CO2) 2 µmol/mol
Carbon monoxide (CO) 0,2 µmol/mol
Total sulfur compounds c (H2S basis)
0,004 µmol/mol
Formaldehyde (HCHO) 0,01 µmol/mol
Formic acid (HCOOH) 0,2 µmol/mol
Ammonia (NH3) 0,1 µmol/mol
Total halogenated compounds d (Halogenate ion basis)
0,05 µmol/mol
Maximum particulates concentration 1 mg/kg
NOTE: For the constituents that are additive, such as total hydrocarbons and total sulfur compounds, the sum of the constituents are to be less than or equal to the acceptable limit. The tolerances in the applicable gas testing method are to be the tolerance of the acceptable limit.
a The hydrogen fuel index is determined by subtracting the "total non-hydrogen gases" in this table, expressed in mole percent, from 100 mole percent.
b Total hydrocarbons include oxygenated organic species. Total hydrocarbons are measured on a carbon basis (µmolC/mol). Total hydrocarbons may exceed 2 µmol/mol due only to the presence of methane, in which case the summation of methane, nitrogen, and argon is not to exceed 100 ppm.
c As a minimum, includes H2S, COS, CS2 and mercaptans, which are typically found in natural gas.
d Includes, for example, hydrogen bromide (HBr), hydrogen chloride (HCl), chlorine (Cl2), and organic halides (R-X).
1.3. Hydrogen Fuel Quality and PEM Fuel Cell Degradation The effects of fuel quality on PEM fuel cell performance and durability must be considered within the larger context of the causes and mechanisms of PEM fuel cell degradation, that is, the gradual decline in power output during operation in road vehicles. According to Borup et al., who conducted a comprehensive review of the research and literature on this topic,7 these mechanisms include degradation of mechanical properties due to dissolution and sintering of platinum particles, thinning of the membrane, and corrosion of carbon support materials. Borup et al. cite a delicate balance between maximizing fuel cell performance and durability while reducing cost and complexity and consider the presence of contaminants in the fuel stream as one of the conditions of the operation, along with temperature, voltage, current, pressure, and duty cycle that affect performance and
7 R. Borup et al., “Scientific Aspects of Polymer Electrolyte Fuel Cell Durability and Degradation,” Chemical Reviews 107 (2007): 3904–3951.

3
HYDROGEN FUEL QUALITY SPECIFICATIONS FOR POLYMER ELECTROLYTE FUEL CELLS IN ROAD VEHICLES
durability. Borup et al. state that “the causes of the gradual performance decline are not completely understood, especially the degradation mechanisms that occur in the fuel cell’s different components and the relative contribution of each component’s degradation to the degradation of the entire fuel cell.”
Wu et al. also reviewed the literature on performance degradation and mitigation strategies for PEM fuel cells.8 They attempted a literature-based analysis to achieve a “unified definition of PEM fuel cell lifetime for cells operated either at a steady state or at various accelerated conditions.” As did Borup et al., Wu’s paper addresses failure modes of key PEM fuel cell components, including the membrane, electrocatalyst and catalyst layer, gas diffusion layer, bipolar plate, and sealing gaskets. According to Wu et al., durability affects the cost and reliability of PEM fuel cells and is the most critical factor delaying commercialization of this technology. Understanding of the “quantitative correlations between the degradation of individual components within the fuel cell and the resulting performance loss” is still insufficient, and continuing research and testing are essential.
Contaminants in the hydrogen fuel stream can be contributing factors to degradation mechanisms, the extent of which is difficult to assess given the current state of knowledge of these mechanisms and the difficulty of isolating one, perhaps secondary, factor among many complex and interrelated factors. In their paper, Borup et al. list the various mechanisms by which certain contaminants can decrease PEM fuel cell performance and durability. Contaminants such as CO and hydrogen sulfide (H2S) adsorb on the catalyst’s surface and impede the electrode charge transfer process that leads to losses due to higher cell overpotential. Contaminants such as NH3 form cations that, through ion exchange with protons in the ionomer, inhibit proton conduction and create larger ohmic losses. Contaminants can also decrease mass transfer by changing water and/or gas transport in the gas diffusion layer. The effects of fuel contaminants on performance and durability are themselves complex and are just one contributing factor among many other considerations that are discussed in subsequent sections of this report.
1.4. Fuel Cell System and Vehicle ConsiderationsA vehicular PEM fuel cell system is made up of several subsystems with the PEM fuel cell stack being the focus of operations. The synergistic connection of the subsystems is critical to overall system efficiency and durability. Efficiency of the air compressor/cleanup/delivery is critical to cathode operation, and efficiency of the heat exchange subsystem is crucial to maintaining uniform stack temperature during cold and hot thermal and load excursions. Water management from freezing to high-temperature/low-relative humidity (RH) operations maintains consistency in stack performance, and the hydrogen storage and delivery subsystem affects the anode performance and life, particularly since a low anode catalyst loading is necessary to meet system cost objectives. Hydrogen quality must be maintained from the fueling nozzle receptacle to the anode inlet, which encompasses on-board storage and BOP fuel system components. The team of ISO and SAE experts that contributed to the research and this report recognized that advanced onboard storage technologies is an important consideration for fuel quality, particularly to reduce the onboard storage pressure requirements, but addressed only high-pressure gaseous storage because of the ISO standard’s limitation to the near-term, early commercialization phase of PEM fuel cell vehicle deployment. Both the ISO and SAE hydrogen fuel quality standards address quality of the hydrogen fuel dispensed at the nozzle to the vehicle.
Vehicular PEM fuel cell systems are unique to each OEM, and many factors can significantly affect the degree of PEM fuel cell stack performance, degradation, recovery, and life as a function of hydrogen fuel contaminant species and concentration. Vehicular operations that are critical to fuel cell performance include temperature of operation, shutdown–startup procedure, extent of time operating at idle and full load potential (i.e., degree of hybridization, etc.), and transient/steady state demands, among other parameters. Operating parameters, while chosen to reflect a particular OEM vehicle demand criterion, may be altered if the impact of these parameters could be an asset to the overall vehicle/fuel combination. For example, air introduction to the anode during shutdown has been shown to recover losses due to CO contamination and must be considered among operational conditions assumed to be appropriate for a marketable vehicle.
8 J. Wu et al., “A review of PEM fuel cell durability: Degradation mechanisms and mitigation strategies,” Journal of Power Resources 184 (2006) 104–119.

HYDROGEN FUEL QUALITY SPECIFICATIONS FOR POLYMER ELECTROLYTE FUEL CELLS IN ROAD VEHICLES
4
2. Approach Beginning with DOE’s first national workshop on hydrogen fuel quality specifications in 2004, DOE supported and coordinated a team of experts from national laboratories, universities, industry, and other organizations to address the scientific and technical requirements for fuel quality and to participate in WG12 meetings. The DOE team developed a comprehensive approach to R&D and testing, as shown in Figure 2-1, to obtain data required to establish a scientific foundation for an international fuel quality standard.9 The DOE team developed the approach and rationale described in this section, fully aware of the difficulty of isolating the effects of fuel contaminants as a contributing factor to a complex and not fully understood set of PEM fuel cell degradation mechanisms.
Figure 2-1. Overall DOE approach to fuel quality testing, modeling, and analysis
2.1. Rationale The team defined its overall task in terms of the need to trade off fuel cell performance and durability against the cost of delivering “clean” hydrogen at the fuel dispenser while also recognizing the need for standardized analytical methods to verify compliance with allowable contaminant limits. The team then focused expertise on key aspects of the task: (1) single-cell testing and obtaining data on PEM fuel cell performance and the mechanisms of cell and material degradation due to the presence of selected but critical non-hydrogen constituents in the fuel, (2) fuel quality considerations in both PEM fuel cell systems and in hydrogen production, purification, and delivery systems under realistic operating environments, and (3) analytical methodology and instrumentation needs to verify compliance with the specifications to be established in both the ISO and SAE standards.
As noted above, the ISO standard is intended to apply to the limited-scale introduction of an FCV fleet, and if needed, this standard will be revised in concert with the progress of FCV technology and fuel quality testing.
9 Members of the team are identified in the Acknowledgements section.

5
HYDROGEN FUEL QUALITY SPECIFICATIONS FOR POLYMER ELECTROLYTE FUEL CELLS IN ROAD VEHICLES
Therefore, the team focused on single-cell testing, fuel quality and cost trade-offs for fuel production and purification, and analytical sampling and measurement with near-term PEM fuel cell technology and vehicles in mind. Accordingly, the team focused on high-pressure gaseous storage on board the vehicle and did not assess the potential effects of fuel quality for on-board storage media under development. The team also assumed that near-term hydrogen production and purification will be based on SMR of natural gas and PSA, respectively, and did not address other production or purification methods in any detail.
Because testing for all of the non-hydrogen constituents listed on Table 1 of ISO FDTS 14687 (or SAE J2719) would be time-consuming and extremely expensive, the team defined a subset of those constituents that are likely to be the major technical and economic drivers of the trade-offs between fuel quality and cost.10 After much discussion among the team members, industry, and other WG12 members, the team identified five “critical constituents” upon which to focus R&D and testing: carbon monoxide (CO), sulfur (S) species, ammonia (NH3), methane (CH4) and other inert gases, and particulate matter (PM) under 10 microns in diameter. These constituents are those most likely to affect PEM fuel cell performance and durability as well as the cost of hydrogen produced by SMR and purified by PSA to the levels required by FDTS 14687-2. Furthermore, the focus on fuel quality meant that air contaminants, though equally critical for PEMFC performance and durability, would not be addressed in any detail.
In parallel, the team defined a baseline hydrogen production–purification system (Figure 2-2) upon which to base its consideration and analysis of trade-offs between hydrogen fuel quality specifications and the cost of producing and purifying the fuel to meet the specifications. Using this baseline system, the team first assessed the hydrogen fuel containing CO levels of 0.1 to 10 ppm and prepared estimates of the cost of hydrogen by examining the recovery rates of hydrogen from SMR–PSA with CO in the range of levels given above. As shown in Table 2-1, the team determined the relative difficulty of removing contaminant species included in Table 1 of FDTS 14687-2, assuming production and purification under the baseline system. Helium, which is found in some natural gas sources in the United States, cannot be removed using PSA. CO has the highest “purification ratio for SMR,” perhaps providing a basis for its serving as a “canary” for other contaminant species, i.e., the amount of CO in the fuel stream may serve as an indicator of the likely presence and concentrations of the other critical constituents (except PM). The team established a relationship between CO concentration with respect to PSA breakthrough properties of other critical constituents (NH3, S species, CH4, etc.) and estimated a rough order of magnitude of breakthrough of these constituents in relation to CO concentration for the baseline system.
10 Annex A of ISO FDIS 14687-2 provides the rationale for selecting the specific contaminants addressed in the ISO standard.

HYDROGEN FUEL QUALITY SPECIFICATIONS FOR POLYMER ELECTROLYTE FUEL CELLS IN ROAD VEHICLES
6
Source: Argonne National Laboratory
Figure 2-2. Baseline production–purification system

7
HYDROGEN FUEL QUALITY SPECIFICATIONS FOR POLYMER ELECTROLYTE FUEL CELLS IN ROAD VEHICLES
Table 2-1. Relative difficulty of removing selected contaminant species from hydrogen produced by SMR and purified by PSA
Source: Chevron

HYDROGEN FUEL QUALITY SPECIFICATIONS FOR POLYMER ELECTROLYTE FUEL CELLS IN ROAD VEHICLES
8
2.2. Limitations and CaveatsIn attempting to assess the effects of hydrogen fuel contaminants within the given limits of budget and time, the team faced a key constraint: it would be far too expensive and time-consuming to operate vehicular PEM fuel cell stacks with contaminated hydrogen and determine which contaminant(s) and operating factors (or combinations thereof) cause or contribute to specific deleterious effects. The team, therefore, decided to conduct tests using single-cell membrane electrode assemblies (MEAs) for data that could be more easily acquired and could bound the problem at hand so that the researchers could establish maximum allowable limits for the selected “critical constituents” of hydrogen fuel contamination with an acceptable level of confidence.
The team also understood that data could not be taken from single-cell MEA (usually a 50 cm2 area) tests and extrapolated to address the same issues in automotive fuel cell stacks. Therefore, the researchers decided to conduct the single-cell tests under controlled conditions following a consensus test protocol derived from the literature and discussion with fuel cell manufacturers and automotive OEMs. Industry organizations could subsequently determine how to relate the test data to their own fuel cell stack designs and operating conditions and respond to the recommended limits for contaminant species to be incorporated in the ISO and SAE standards.
Given the assumptions and limitations described above, perhaps the most essential caveat is that the specifications listed in Table 1-1 above should be seen as a baseline that can be improved upon with additional single-cell testing augmented with limited short-stack testing and with better field data from demonstration projects. For now, Table 1-1 lists maximum allowable concentrations of selected non-hydrogen constituents based on a limited number of tests under a small set of primarily constant operating conditions using single cells that do not reflect the state of the art of PEM fuel cell design and engineering. That said, the specifications are based on a consensus of experts—including those involved in the research highlighted in this report—from industry, universities, and national laboratories and, as stated in ISO FDIS 14687-2, should provide adequate requirements for the pre-commercial phase of technology development of PEM fuel cells for road vehicles, supported by DOE’s R&D efforts.

9
HYDROGEN FUEL QUALITY SPECIFICATIONS FOR POLYMER ELECTROLYTE FUEL CELLS IN ROAD VEHICLES
3. Single-Cell TestingThe focus of the DOE effort was to obtain sufficient data by testing single cells under carefully defined and controlled conditions to establish a baseline consensus among a team of experts from industry, universities, and national laboratories on maximum allowable quantities of selected contaminants already known to affect PEM fuel cell performance and durability. These data, augmented by modeling and analysis, could then provide a technical foundation for a standard that, in turn, would be subjected to examination and consensus building through the ISO and SAE balloting processes. Borup et al.7 cite extensive literature on single-cell testing and specifically mention those tests conducted to address the effects of CO, NH3, H2S, and hydrocarbons. Some of the tests cited were conducted by researchers supported by DOE, which facilitated extending and focusing the testing effort described below.
Building on the existing literature, the team prepared a test plan and a set of test procedures and conditions to establish a foundation to conduct comparative tests to generate the data. The team also developed a matrix to focus testing on the problem at hand while distributing the effort according to the capabilities and interests of the team members’ participating laboratories. Because a number of tests conducted by different researchers at different locations would be required to accumulate sufficient, adequate, and verifiable data, the team also agreed upon a format to report data to ensure that they were compiled and reported so that the tests could be duplicated by other laboratories using the same protocol (see Section 3.2).
3.1. Test PlanThe Hawaii Natural Energy Institute (HNEI) at the University of Hawaii developed detailed test procedures11 to ensure that tests conducted by one laboratory on the team could be replicated at another laboratory. Furthermore, test data could be shared, compared, and, if needed, reproduced to establish consensus within the team. Consensus on the data would, in turn, enable and facilitate consensus on the specifications to be recommended by the team for incorporation in both the ISO and SAE standards. In developing the team’s test plan, HNEI began with the Single Cell Test Protocol published by the USFCC (now Fuel Cell and Hydrogen Energy Association) to provide a non-proprietary template of best practices in small-scale testing that would, among other things, expedite inter-laboratory data exchange.12 HNEI adapted and modified the protocol to address the specific single-cell fuel quality testing HNEI and other laboratories on the team were to undertake. The test plan documented standard operating procedures, calibration requirements, and equipment capabilities for a contaminant survey, long-term contaminant testing, and load cycle contaminant testing of PEM fuel cells.
The test plan is applicable to any test cell that can be used in a contamination study and describes how to establish baseline cell performance prior to contamination tests. The baseline includes the effects of varying the operating temperature and the anode catalyst loading. The test plan also includes a protocol to characterize the MEA and cell prior to and after baseline and contaminant testing. The protocol includes procedures for cell assembly verification and conditioning; beginning-of-test (BOT) diagnostics, including electrochemically active platinum surface area (ECSA) measurement; H2 crossover measurement and polarization measurements both in air and in oxygen; cell evaluation; and end-of-test (EOT) diagnostics. The test plan also allows for representative samples of tested MEAs to be archived for additional ex situ testing. The parameters of the test plan and set-up of the test equipment are illustrated in Figure 3-1.
11 HNEI, University of Hawaii at Manoa, Test Plan for Characterization of Contaminants on PEM Fuel Cell Performance, September 21, 2006.12 USFCC’s Single Cell Testing Task Force, Single Cell Test Protocol, Document No. 05-014, July 13, 2006,
http://ftp.fchea.org/core/import/PDFs/Technical%20Resources/MatComp%20Single%20Cell%20Test%20Protocol%2005-014RevB.2%20071306.pdf.

HYDROGEN FUEL QUALITY SPECIFICATIONS FOR POLYMER ELECTROLYTE FUEL CELLS IN ROAD VEHICLES
10
Source: HNEI/University of Hawaii
Figure 3-1. Test plan parameters and test set-up
3.2. Data Reporting FormatThe team also developed a comprehensive format for the participating laboratories to report test data to ensure that the data were compiled and reported so that, if needed, the tests could be duplicated and the data replicated by any of the laboratories.13 The reporting format enabled the team to tabulate data from different researchers at different locations in an orderly and structured way so that the data could be easily shared and assessed. The summary sheet for the more extensive data reporting format is shown in Figure 3-2.
13 G. Bender and T. Rockward, Data Reporting Format for Fuel Cell Testing, Version 1.0, April 4, 2008

11
HYDROGEN FUEL QUALITY SPECIFICATIONS FOR POLYMER ELECTROLYTE FUEL CELLS IN ROAD VEHICLES
Run 1 (ID #) Run 2 (ID #) Run 3 (ID #)
MEA (Batch#-ID#) GORE-49
Anode Pt loading, mg/cm2
Cathode Pt loading, mg/cm2
Anode ECSA (BOT), m2/g
Anode∆ECSA (EOT vs BOT), %
Cathode ECSA (BOT), m2/g
Cathode ∆ECSA (EOT vs BOT), %
H2 cross-over (BOT), mA/cm2
H2 cross-over (EOT), mA/cm2
O2 cross-over (BOT)
O2 cross-over (EOT)
Contaminant Tests
(Species) concentration (inlet), ppm
(Species) concentration (outlet), ppm
Current density, A/cm2
Flow Rate
Anode stoichiometry
Cathode stoichiometry
Anode flow, slpm
Cathode flow, slpm
Temperature
Cell, °C
Humidification
Anode RH, %
Cathode RH, %
Pressure
Anode inlet, kPag
Anode exit, kPag
Cathode inlet, kPag
Cathode exit, kPag
Performance
V-I (BOT)
V-I (EOT)
∆V @ 1 A/cm2, mV
∆V due to Species poisoning, mV
Figure 3-2. Data reporting format, summary sheet

HYDROGEN FUEL QUALITY SPECIFICATIONS FOR POLYMER ELECTROLYTE FUEL CELLS IN ROAD VEHICLES
12
3.3. Single-Cell Round Robin TestsTo ensure the validity and reproducibility of single-cell test data obtained by the team, the DOE Safety, Codes and Standards program (SCS) and Los Alamos National Laboratory (LANL) conducted a round robin test to qualify testing facilities and capabilities among four universities and two national laboratories.14 LANL assembled and conducted initial testing, following the USFCC protocol12 with some adaptations, on a fuel cell test article with an MEA produced in-house. The test cell hardware was sent to the participating laboratories with detailed testing instructions. Each laboratory performed a “gross leak” test, hydrogen crossover measurements, cyclic voltammetry, and polarization curves. Figure 3-3 shows excellent reproducibility of data among the laboratories testing at 60°C cell operating temperature. Testing at 80°C showed similar outcomes.
Source: LANL
Figure 3-3. Results of round robin tests at 60ºC operating temperature
After the laboratories completed their testing, the test article was returned to LANL for a re-testing, which showed less than 6 mV of degradation along the entire IV curve (current–voltage curve)—excluding an 11 mV degradation in the high current region, possibly due to the presence of liquid water. The reproducibility of data among the participating laboratories and the test cell’s lack of degradation verified that data from all of participants could be directly compared with confidence. The round robin results also reinforced the need for timely equipment calibrations, software upgrades, and proper adherence to test protocols to ensure data quality.
14 Information and data provided for this report by T. Rockward, LANL. The participating laboratories were LANL, HNEI/University of Hawaii, Clemson University, Savannah River National Laboratory, the National Institute of Standards and Technology, University of Connecticut, and the University of South Carolina. The active area of the MEA was 50 cm2 with a 2-mil Nafion® membrane and 0.2 mg platinum/cm2 at each electrode. See also T. Rockward, I. Urdampilleta, F. Uribe, E. L. Brosha, B. Pivovar, and F. H. Garzon, “The Effects of Multiple Contaminants on Polymer Electrolyte Fuel Cells,” ECS Transactions 11, no. 1 (2007): 821–829.

13
HYDROGEN FUEL QUALITY SPECIFICATIONS FOR POLYMER ELECTROLYTE FUEL CELLS IN ROAD VEHICLES
In 2006, prior to the round robin tests described above, HNEI and the Japan Automobile Research Institute (JARI) conducted a cross-check using a test cell prepared by JARI. The cell was first tested at JARI and then sent to HNEI, using the same initial break-in procedure and polarization curve measurement sequence. The test results showed that JARI and HNEI were able to reproduce IV curves with a standard deviation of 1% or less. As JARI and HNEI were among the principal contributors to the single-cell testing effort under ISO and SAE, the cross-check indicated that data between the two laboratories could be exchanged with a high level of confidence about their reproducibility.
3.4. Single-Cell Tests with Common Membrane Electrode AssembliesIn addition to assembling a well-documented record of single-cell tests, the team also tried to collect data that could be incrementally integrated into PEM fuel cell performance models, enabling researchers to project contaminant effects and to conduct fewer, more targeted tests. Testing in concert with modeling could illuminate and verify critical gaps in understanding contaminant mechanisms and effects. The test plan and data reporting format helped to focus testing while the round robin tests qualified the test stations and capabilities of the laboratories. However, the effects of contaminants on PEM fuel cell performance and durability depend significantly on MEA composition and preparation and can lead to widely varying test results.15 Therefore, SCS supported tests at the participating laboratories using a common, commercially available MEA to establish a baseline for better comparability of test data among the laboratories.
After discussion with several MEA manufacturers, the team selected a Gore 57 Series MEA (0.1 mg anode/0.4 mg cathode Pt/cm2, 18 micron Gore membrane) for the common MEA tests. The Gore MEA had a demonstrated history of reproducible test results, and SCS, through the National Renewable Energy Laboratory (NREL), negotiated terms of sale and publication of test data with Gore that made the testing feasible. Although the anode catalyst loading was not state of the art, the team could still obtain relevant data without having to deal with more complex issues such as alloying or non-optimization at lower loadings. High cathode loading was acceptable because of historical data at this level and because the focus of testing was on anode contaminants. Using the Gore MEAs for baseline tests did not preclude the laboratories from conducting additional tests using MEAs with lower catalyst loadings.
Each laboratory followed a cell conditioning procedure based on recommendations from Gore and developed by team consensus and used the common data reporting format described above. Data acquired supplemented existing data from tests using other MEAs with different catalyst loadings to enable modelers to extrapolate and project results at different conditions and/or catalyst loadings. The following parameters and conditions were followed by each laboratory for baseline testing with the Gore MEA:
• Temperature: 80°C
• RH: 75 anode/25 cathode (in accordance with Gore recommendations)
• Pressure: 150 kPa (absolute)
• Electrical load: 1 A/cm2
• Stoics: 1.2/2.0 (anode/cathode)
Given the limited time available, testing was focused on obtaining critical data points:
• Contaminants to be tested: CO, NH3, halogenates, ISO mixture (CO, H2S, NH3, inerts)
• Contaminant levels—two for each contaminant: (1) at ISO/SAE H2 Fuel Quality Guideline level and (2) at 10X the guideline level
• Test duration: (e.g., 300 hours or until performance drops by > 60 mV); laboratories have discretion to run tests as suitable for a contaminant
15 Using its standard test protocol, HNEI measured significant variation in the effect of CO (1–2 ppm) when it tested two similar MEAs with slightly different catalyst loadings, Pt/C weight ratios, membrane thickness, and gas diffusion layers (G. Bender et al., presentation to the DOE fuel quality team, May 19, 2009).

HYDROGEN FUEL QUALITY SPECIFICATIONS FOR POLYMER ELECTROLYTE FUEL CELLS IN ROAD VEHICLES
14
Following the first priority test conditions listed above, tests at 60°C, lower electrical loads (500 mA/cm2 and 200 mA/cm2), and one alternative RH (based on control of water condensation in cell) were also conducted. In addition to baseline tests with ultra-high pure (UHP) hydrogen and the basic tests with contaminants specified above, each laboratory, given time and resources, could conduct other tests to reveal as much as possible about the effects of the contaminants. Data from these tests have been only partially tabulated.
3.5. Single-Cell Test ResultsThe objective of single-cell testing was to obtain data on the effects of selected critical contaminants on the performance and durability of PEM fuel cells in road vehicle applications. The tests were conducted to gain better understanding of the mechanisms of these effects and how they affect PEM fuel cell materials, particularly in the MEA, so that the maximum allowable concentrations of these contaminants in the ISO and SAE standards can be based on the best possible technical information and knowledge. In September 2010, key members of the team responsible for testing convened a roundtable prior to a WG12 meeting in San Francisco to present current test data and to make recommendations on the maximum allowable level of the critical contaminants based on these data. The recommendations from the workshop, which included experts from Japan and Europe, formed the basis for the specifications incorporated in ISO FDIS 14687-2 and SAE J2719. Key results from the roundtable and from other tests for the critical contaminants are highlighted below.
3.5.1. Carbon Monoxide (CO)Borup et al.7 documented extensive work on the effects of CO on PEM fuel cell performance and durability, including that by some members of the team. This work shows that CO adsorbs onto catalyst surface sites and blocks hydrogen dissociation and thus impedes the MEA’s electrochemical kinetics. For the roundtable, Dr. Guido Bender of NREL summarized what is currently known about the effects of CO and whether the maximum allowable limit included in the ISO draft international standard (0.2 ppm) should be confirmed or modified based on this knowledge. Dr. Bender first contrasted the key limitations of single-cell testing in a laboratory when compared to the complexity of real-world operation of a PEM fuel cell vehicle. Laboratory tests of single cells are typically conducted at constant temperature and RH, and with operation of the cell at constant and optimized conditions. Furthermore, laboratory tests are usually conducted with a single pass of a single contaminant. In real-world operation, there will likely be small amounts of multiple contaminants in the fuel that could mitigate or accentuate the effects of other contaminant species, temperature and RH will vary, and fuel cell system operation will non-optimized and dynamic. The fuel stream will not be fed in a single-pass to the anode but will be recirculated to capture residual hydrogen and returned (along with additional hydrogen) to the fuel stream. There will also be stop/start cycles of the vehicle as well as aging of fuel cell materials and components.
Given these caveats, Dr. Bender summarized the relevant state of knowledge for CO, beginning with theoretical considerations. Using realistic assumptions, Dr. Bryan Pivovar of NREL estimated that it would take about 6.6 hours for a monolayer of CO to form on a platinum catalyst surface.16 Using similar assumptions, Dr. Fred Wagner calculated an approximate “empirical tolerance rule” of 0.1 ppm for a monolayer of CO.17 Dr. Bender also referred to a calculation by Dr. Jean St-Pierre, then at the University of South Carolina, that up to 0.9 ppm of CO could be tolerated under typical conditions, although the catalyst loadings were high at 0.5 mg/cm2 for both electrodes.18 These theoretical calculations showed that the CO tolerance of PEM fuel cells was in the range of 0.1 to 1.0 ppm under typical test conditions.
Dr. Bender then reviewed test data selected to assess the appropriateness of the proposed limit of 0.2 ppm for CO. Data from tests he conducted at HNEI showed a strong effect of operating conditions and that the worst case of such conditions included, as expected, high CO concentration but also high current density, and low RH. Examples of these tests are shown in Figure 3-4, Figure 3-5, and Figure 3-6 , respectively.
16 Presented during a team webinar, March 16, 2009. The key assumptions included 0.05 mg/cm2 Pt catalyst loading, 50m2 Pt/g surface area, 0.2 ppm CO, 1A/cm2 cur-rent density, 16.3Å2/molecule CO, no CO oxidation, sticking coefficient=1 due to low temperature.
17 Presented at SAE, Troy, MI, October 19, 2004. Key assumptions included 0.05 mg/cm2 Pt only catalyst loading, 80C operating temperature, 1A/cm2 current density, CO oxidation due only to oxygen crossover.
18 J. St-Pierre, “PEMFC Contaminant Tolerance Limit – CO in H2,” Electrochim. Acta, 55 (2010) 4208-4211.

15
HYDROGEN FUEL QUALITY SPECIFICATIONS FOR POLYMER ELECTROLYTE FUEL CELLS IN ROAD VEHICLES
Figure 3-4. Effect of CO concentration
Figure 3-5. Effect of current density

HYDROGEN FUEL QUALITY SPECIFICATIONS FOR POLYMER ELECTROLYTE FUEL CELLS IN ROAD VEHICLES
16
Figure 3-6. Effect of RH
Dr. Bender also showed data taken by Mr. Tommy Rockward at LANL that showed the dependence of CO effects on cell temperature (Figure 3-7 and Figure 3-8).
Figure 3-7. Effect of temperature (30°C)

17
HYDROGEN FUEL QUALITY SPECIFICATIONS FOR POLYMER ELECTROLYTE FUEL CELLS IN ROAD VEHICLES
Figure 3-8. Effect of temperature (80°C)
Another key consideration was recirculation of CO in the anode fuel stream. Dr. Bender referred to data taken by JARI that showed that CO in the fuel stream did not accumulate but that it was oxidized to CO2 that did accumulate (Figure 3-9).
Figure 3-9. Recirculation of CO in the anode fuel stream
The level of CO tolerance is increased by the oxidation of CO to CO2, which can accumulate when the anode fuel stream is recycled. Oxidation is enabled by the crossover of oxygen from air intake at the cathode, and the worst case for this aspect of CO tolerance would be thicker membranes, lower temperatures and pressures, and higher current density. In tests conducted in collaboration with CEA Liten of Grenoble, France, HNEI showed that the MEA structure affects CO tolerance because of differences in the availability of chemically active platinum. Lower platinum utilization results in lower CO tolerance but also higher CO-to-CO2 conversion. As MEA structure also affects oxygen crossover and accumulation of CO2, its effects are complex and difficult to assess.

HYDROGEN FUEL QUALITY SPECIFICATIONS FOR POLYMER ELECTROLYTE FUEL CELLS IN ROAD VEHICLES
18
In Dr. Bender’s studies, JARI and LANL test data for CO at 0.2 ppm, the maximum allowable limit proposed at that time under both the proposed ISO and SAE standards, showed none or minimal effects at the test conditions used (Figure 3-10). The tests at JARI also showed little effect of Pt catalyst loadings between 0.3 and 0.5 gm/cm2 with CO at 0.2 ppm.
Figure 3-10. Effect of CO at 0.2 ppmv
Tests with 0.2 ppm CO at HNEI, however, showed up to 23 mV change in overpotential that varied with temperature and with MEA manufacturer (Figure 3-11). The conflicting test results reinforced the need for more data and information, beginning with consensus on what is acceptable loss of performance and durability due to the presence of fuel contaminants. Other uncertainties include the effects of dynamic (varying electrical load) operation, stop/start processes, build-up of contaminants due to recycling of the anode fuel stream, differences in MEA structure on Pt utilization and CO-to-CO2 conversion, and aging of the cell. The allowable limit of CO was below 0.2 ppm, as proposed in the then-current version of ISO DIS 14687-2.
Figure 3-11. Tests at HNEI with 0.2 ppm CO
Most of these effects are negative and would imply stricter limits of allowable CO in the fuel, but some, such as stop/start processes, could be positive in that they lead to recovery of cell performance and imply less restrictive limits of CO. Given these uncertainties and the need for a safety margin, Dr. Bender recommended that the limit for CO be reduced to 0.05 ppm. This recommendation was presented to WG12 at a subsequent meeting, but WG12 declined to reduce the allowable limit of CO below 0.2 ppm.

19
HYDROGEN FUEL QUALITY SPECIFICATIONS FOR POLYMER ELECTROLYTE FUEL CELLS IN ROAD VEHICLES
One of the key considerations in testing the effects of CO is the level of catalyst loading on both the anode and cathode. Most of the tests to date have been conducted with CO levels higher than that specified in the ISO and SAE standards (0.2 ppm) because of the difficulty of preparing and maintaining quality control of very low levels of contaminants in hydrogen during testing. Furthermore, most tests to date have used Pt catalyst loadings higher than the DOE 2015 target of a total of 0.15 gm/cm2 Pt (0.05 anode/0.1 cathode) that automotive OEMs have adopted. The results of LANL single-cell tests with anode platinum loading of 0.05 mg/cm2 are summarized in Figure 3-12. The tests conditions included constant current (1 A/cm2), 100% RH at 80°C, and constant dosage (20ppm/hour CO) obtained by varying both concentration and exposure times.19
Figure 3-12. Summary of CO tests with 0.05 mg Pt/cm2 at different temperatures
This summary shows that even though CO is the most tested of all of the critical contaminants, more testing is needed to address the concerns identified above by Dr. Bender. The current maximum allowable limit of 0.2 ppm included in the ISO and SAE standards was reached by consensus of experts who addressed this issue. This consensus was achieved by collaborative testing by laboratories in Japan, Korea, the United States, and the European Union. Under both ISO and SAE procedures, standards are subject to periodic review and update, and the specification for CO will be re-examined.
3.5.2. Total Sulfur CompoundsLike CO, sulfur compounds adsorb on the surface of the catalyst and impede the electrode charge transfer process that leads to losses due to higher cell overpotential. Unlike CO, sulfur compounds at very low levels can cause irreversible degradation of fuel cell performance, particularly at lower catalyst loadings. These compounds include hydrogen sulfide (H2S), carbonyl sulfide (COS), carbon disulfide (CS2), and methyl mercaptan (CH3SH). Single-cell testing focused on H2S to represent the effects of total sulfur compounds that may be present in the hydrogen fuel stream.
19 T. Rockward, C. Quesada, K. Rau, and F. Garzon, “PEMFC Poisoning with CO: Measuring Tolerance vs. Temperature and Low Platinum Loadings,” 220th Electrochemical Society Meeting, Boston, MA, October 2010.

HYDROGEN FUEL QUALITY SPECIFICATIONS FOR POLYMER ELECTROLYTE FUEL CELLS IN ROAD VEHICLES
20
At the roundtable, Mr. Tommy Rockward of LANL presented then-current test results and understanding about the effects of H2S on cell performance. A critical factor in specifying maximum allowable limits for sulfur compounds is that catalyst poisoning increases with time of exposure. As shown in Figure 3-13, catalyst poisoning increases with time (a), and degradation is more severe for larger dosages (b).
(a) (b)
Figure 3-13. Effects of duration of exposure (1.5 ppm H2S) with increased: (a) time and (b) dosage
Other factors that affect tolerance of a cell to H2S include RH and operating voltage as shown in Figure 3-14 and Figure 3-15, respectively. Both the rate and extent of cell poisoning is more severe at lower RH, and RH during operation and humidification techniques incorporated in fuel cell system design will be important factors that are largely unknown because of the proprietary nature of such information. Tolerance to H2S poisoning increases with cell voltage, which can lead to higher operating efficiency but may also result in uncertainties when the cell (or stack) is cycled during real-world operation. Momentary operation at open-circuit voltage (OCV) during shutdown can help the cell recover from H2S poisoning, as shown in Figure 3-16.

21
HYDROGEN FUEL QUALITY SPECIFICATIONS FOR POLYMER ELECTROLYTE FUEL CELLS IN ROAD VEHICLES
Figure 3-14. Effect of RH (2 ppm H2S, 80°C, 0.5 v)
Figure 3-15. Effect of operating voltage

HYDROGEN FUEL QUALITY SPECIFICATIONS FOR POLYMER ELECTROLYTE FUEL CELLS IN ROAD VEHICLES
22
Figure 3-16. Effect of OCV (10 seconds) on cell recovery
In his presentation at the roundtable, Mr. Rockward also discussed experimental difficulties in testing the effects of H2S related to the dosage effect described previously. Tests were run after 100 hours of exposure to 0.1 ppm of H2S and after cyclic voltammetry. Results showed that clean catalyst surfaces resulted in larger performance degradation, indicating a residual effect of sulfur remaining in the test cell, whether in the subsurface of the electrode or gas diffusion layer, and/or the test apparatus. Such a residual effect can be very detrimental the performance of PEM fuel cell systems and vehicles.
Mr. Rockward also tested the effects of H2S at the 0.004 ppm level specified in the ISO and SAE standards that further demonstrated the strong relationship between RH and tolerance to H2S. As shown in Figure 3-17, voltage losses at 1 A/cm2 were approximately 30 mV at 100% RH. These losses were magnified to ~70 mV in an identical cell operating at 50% RH. Further analyses using cyclic voltammetry show a difference in the amount of sulfur coverage on the platinum surface as the fuel cell operating conditions were varied.
Figure 3-17. Effect of RH

23
HYDROGEN FUEL QUALITY SPECIFICATIONS FOR POLYMER ELECTROLYTE FUEL CELLS IN ROAD VEHICLES
This summary shows that more testing is needed to address the concerns identified by Mr. Rockward. Given the uncertainties and the large effects of real-world operating conditions that can only be surmised, Mr. Rockward recommended at the roundtable that the limit for total sulfur compounds be reduced to 0.002 ppm. This recommendation was presented to WG12 at a subsequent meeting, but WG12 declined to reduce the allowable limit below the 0.004 ppm proposed in the then-current version of ISO DIS 14687-2. The maximum allowable limit of 0.004 ppm included in the current versions of the ISO and SAE standards was reached by consensus of experts who addressed this issue. This consensus was achieved by collaborative testing by laboratories in Japan, Korea, the United States, and the European Union. Under both ISO and SAE procedures, standards are subject to periodic review and update, and the specification for total sulfur compounds will be re-examined as provided by these procedures.
3.5.3. Ammonia (NH3)At the roundtable, Dr. John Van Zee, then with the University of South Carolina, presented and discussed the state of knowledge concerning the effects of NH3 contamination and results of tests and studies conducted the university, Savannah River National Laboratory (SRNL), and University of Connecticut. Testing with 2 ppm NH3 at SRNL showed that poisoning is nearly linear with time, and the degradation rate was five times that of the baseline, as shown in Figure 3-18. At both the anode and cathode, Pt catalyst loading was 0.3 mg/cm2, and the RH was 100%. Minimal recovery in performance was observed after 50 hours of operation in neat hydrogen. Subsequent cyclic voltammetry showed no residual adsorption of NH3 on the catalyst.
Figure 3-18. Effects of NH3 poisoning
The effect of NH3 at the maximum allowable limit in the ISO and SAE standards (0.1 ppm) was minimal, as shown in Figure 3-19, with no discernable reduction of the baseline. Given these test results, Dr. Van Zee recommended no modification in the limit of 0.1 ppm for NH3.

HYDROGEN FUEL QUALITY SPECIFICATIONS FOR POLYMER ELECTROLYTE FUEL CELLS IN ROAD VEHICLES
24
Figure 3-19. Effect of NH3 at 0.1 ppm
Dr. Van Zee reviewed work done at SRNL and University of Connecticut on the interaction of NH3 with the membrane. Electrochemical impedance spectroscopy (EIS) tests at SRNL using an Ion Power MEA (0.3/0.3 mg Pt) showed that resistance increased in both the membrane and electrode ionomer during poisoning with 10 ppm NH3 (Figure 3-20). Polarization scans of another MEA poisoned with 10 ppm NH3 showed a rapid drop in performance that reached a steady state in 12 hours and two distinct slopes characteristic of such a response (Figure 3-21). Work at University of Connecticut showed NH3 poisoning has significant effects on electrochemical reactions by increasing both charge transfer resistance and diffusion-related resistance, the latter due to increased internal resistance in the membrane. University of Connecticut also showed that higher RH increases performance recovery when the cell is purged with pure hydrogen.
Whereas CO and sulfur compounds adsorb on the surface of catalysts and impede the electrode charge transfer process that leads to higher cell overpotential, contaminants such as NH3 also form cations that, through ion exchange with protons in the ionomer, inhibit proton conduction and create larger ohmic losses.20 Like sulfur compounds, NH3 contamination is also cumulative, and dosage (time of exposure) is as important as the level present in the fuel stream. For this reason, Dr. Van Zee concluded that the maximum allowable limit for NH3 would depend on the MEA’s ion exchange capacity, the amp-hours, and allowable voltage of operation. Critical gaps remain that must be addressed with more testing, modeling, and analysis. Dr. Van Zee recommended that the ion exchange capacity (EW/cm2) and the slope of resistance be added to data reported for NH3 testing.
20 B. Pivovar, et al., “Performance Impact of Cations,” Handbook of Fuel Cells—Fundamentals, Technology and Applications, W. Vielstich, et al., eds., Vol. 6, Chapter 48, 2009.

25
HYDROGEN FUEL QUALITY SPECIFICATIONS FOR POLYMER ELECTROLYTE FUEL CELLS IN ROAD VEHICLES
Figure 3-20. Electrochemical impedance spectrograph of NH3 poisoning
Figure 3-21. Polarization curves of NH3 poisoning
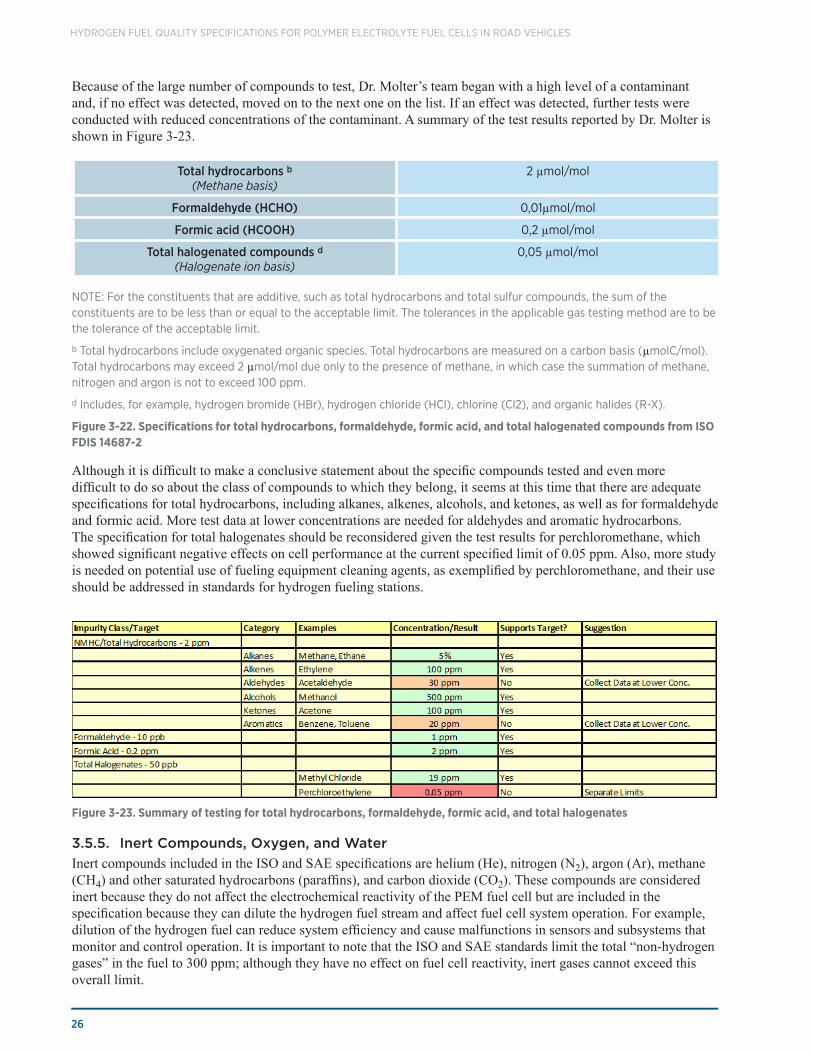
3.5.4. Hydrocarbons and Halogenated CompoundsThe number and variety of hydrocarbons require that testing be both selective and strategic, as different hydrocarbons have different effects on PEM fuel cell performance. Aromatic hydrocarbons adsorb more strongly on the catalyst surface than other hydrocarbons and inhibit access to hydrogen. Methane (CH4) is considered an inert constituent since its effect on fuel cell performance is to dilute the hydrogen fuel stream. Halogenated compounds cause irreversible performance degradation but are not a significant source of contamination in hydrogen produced by SMR/PSA. Potential sources of halogenated compounds, such as chloromethane and perchloromethane, include chloralkali production processes, refrigerants used in processing, and cleaning agents.
At the roundtable, Dr. Trent Molter, Center for Clean Energy, University of Connecticut, summarized testing with selected hydrocarbons and halogenated compounds. Specifications included the ISO standard (Table 1-1 above) that addresses these compounds, as shown in Figure 3-22. Dr. Molter’s summary for hydrocarbons included methane, ethane, ethylene, toluene (HNEI data), and acetaldehyde; for total halogenates, chloromethane and perchloromethane (SRNL data); and formaldehyde and formic acid. The test strategy employed was to focus on compounds that may be present in the fuel stream and on those based on a literature search and input from industry.
HYDROGEN FUEL QUALITY SPECIFICATIONS FOR POLYMER ELECTROLYTE FUEL CELLS IN ROAD VEHICLES
26
Because of the large number of compounds to test, Dr. Molter’s team began with a high level of a contaminant and, if no effect was detected, moved on to the next one on the list. If an effect was detected, further tests were conducted with reduced concentrations of the contaminant. A summary of the test results reported by Dr. Molter is shown in Figure 3-23.
Total hydrocarbons b (Methane basis)
2 µmol/mol
Formaldehyde (HCHO) 0,01µmol/mol
Formic acid (HCOOH) 0,2 µmol/mol
Total halogenated compounds d (Halogenate ion basis)
0,05 µmol/mol
NOTE: For the constituents that are additive, such as total hydrocarbons and total sulfur compounds, the sum of the constituents are to be less than or equal to the acceptable limit. The tolerances in the applicable gas testing method are to be the tolerance of the acceptable limit.
b Total hydrocarbons include oxygenated organic species. Total hydrocarbons are measured on a carbon basis (µmolC/mol). Total hydrocarbons may exceed 2 µmol/mol due only to the presence of methane, in which case the summation of methane, nitrogen and argon is not to exceed 100 ppm.
d Includes, for example, hydrogen bromide (HBr), hydrogen chloride (HCl), chlorine (Cl2), and organic halides (R-X).
Figure 3-22. Specifications for total hydrocarbons, formaldehyde, formic acid, and total halogenated compounds from ISO FDIS 14687-2
Although it is difficult to make a conclusive statement about the specific compounds tested and even more difficult to do so about the class of compounds to which they belong, it seems at this time that there are adequate specifications for total hydrocarbons, including alkanes, alkenes, alcohols, and ketones, as well as for formaldehyde and formic acid. More test data at lower concentrations are needed for aldehydes and aromatic hydrocarbons. The specification for total halogenates should be reconsidered given the test results for perchloromethane, which showed significant negative effects on cell performance at the current specified limit of 0.05 ppm. Also, more study is needed on potential use of fueling equipment cleaning agents, as exemplified by perchloromethane, and their use should be addressed in standards for hydrogen fueling stations.
Figure 3-23. Summary of testing for total hydrocarbons, formaldehyde, formic acid, and total halogenates
3.5.5. Inert Compounds, Oxygen, and WaterInert compounds included in the ISO and SAE specifications are helium (He), nitrogen (N2), argon (Ar), methane (CH4) and other saturated hydrocarbons (paraffins), and carbon dioxide (CO2). These compounds are considered inert because they do not affect the electrochemical reactivity of the PEM fuel cell but are included in the specification because they can dilute the hydrogen fuel stream and affect fuel cell system operation. For example, dilution of the hydrogen fuel can reduce system efficiency and cause malfunctions in sensors and subsystems that monitor and control operation. It is important to note that the ISO and SAE standards limit the total “non-hydrogen gases” in the fuel to 300 ppm; although they have no effect on fuel cell reactivity, inert gases cannot exceed this overall limit.

27
HYDROGEN FUEL QUALITY SPECIFICATIONS FOR POLYMER ELECTROLYTE FUEL CELLS IN ROAD VEHICLES
Sources of oxygen in the fuel stream include air leaks in the system and crossover from the cathode. Hydrogen produced by electrolysis of water could also contain trace amounts of oxygen. Water must be kept below a certain level to minimize formation of ice within the fuel cell system, for example, in fuel lines, valves, and orifices, and to minimize entrainment of aerosols, particularly cations such as sodium and potassium ions. The presence of water could also create a safety hazard if certain solid state hydrogen storage media are used on board the vehicle. At the roundtable, Dr. Gerald Voecks, then consultant to NREL, reviewed the rationale for including these compounds in the current specifications and concluded that the proposed maximum allowable limits seemed reasonable given the state of knowledge about them.
Helium can be present in natural gas extracted in North America and thus in hydrogen produced from such natural gas, as helium is unaffected by chemical production and purification processes. Quantities of helium detected to date in hydrogen do not exceed the limits specified in the ISO and SAE standards, and data from JARI suggest that the presence of helium in hydrogen does not affect fuel cell performance. Dr. Voecks also noted that as helium itself is a valuable commodity, it is likely to be separated from natural gas at the wellhead, which reduces the likelihood of its presence, especially in significant amounts, in natural gas.
Nitrogen and argon can be present in hydrogen from air entrained during the reforming of natural gas. Nitrogen crossover from the cathode and diffusion through the membrane could be a limiting factor21 in the “hydrogen fuel index,” or so-called “purity” of the fuel. For the SMR/PSA process, the presence of nitrogen will be restricted by the maximum allowable limit for CO (0.2 ppm); that is, if the limit for CO is met, the presence of nitrogen above its specified limit is unlikely. Argon, like helium and nitrogen, will not have an electrochemical effect on the fuel cell but can dilute the fuel stream.
Carbon dioxide also acts as a diluent in the hydrogen fuel stream and should not affect performance or durability of the fuel cell at its maximum allowable level of 2 ppm. There remain uncertainties about the level and significance of the conversion of CO to CO2 under a water–gas shift (WGS) reaction in the fuel cell, as noted above in Dr. Bender’s discussion of CO effects, but there is little evidence of a reverse WGS and the reduction of CO2 to CO. Furthermore, if the limit of 0.2 ppm for CO is met, there is little expectation that CO2 will exceed its allowable limit.
3.5.6. Binary and Multiple Contaminant MixturesSingle-cell tests described in the previous subsections were limited to single contaminants, but the hydrogen fuel stream in real-world operation can contain multiple contaminants, some of which can interact to augment or diminish individual effects on PEM fuel cell performance and durability. Along with establishing a baseline for single contaminant effects, the team conducted limited testing of binary and multiple contaminant mixtures.
At the roundtable, Mr. Rockward reviewed results of binary and multiple contaminant tests conducted at LANL. He first reported tests on the co-adsorption of CO and H2S on electrode surfaces in which cyclic voltammetry showed a larger presence of CO during short-term exposure (12 minutes) but eventual displacement of the CO by H2S (Figure 3-24). The kinetics of CO adsorption are faster, but H2S has a higher adsorptive strength and over time suppresses CO adsorption. A mixture of the two contaminants will behave differently from how they would singly, and the competition between the two species could affect operating conditions and implementation of shutdown–startup techniques and procedures to maximize recovery for performance and durability benefits.
Mr. Rockward also described tests of NH3 mixed separately with CO (0.1 ppm) and H2S (0.01 ppm). The NH3-CO mixture showed the same reduction in performance (20 mV in 24 hours) that NH3 alone showed. Minimal adsorption of either contaminant was detected by cyclic voltammetry, and the high-frequency resistance remained constant, indicating little effect on membrane conductivity. In contrast, the NH3-H2S mixture showed a higher loss of performance (38 mV in 24 hours), showing that there is some interaction between the two species of contaminants. More testing is needed to better understand these interactions and their implications for PEM fuel cell performance and durability as well as for system operation techniques and strategies.
21 F. Wagner, “Gas Impurity Effects in the Operation of Fuel Cells: General Considerations,” presentation to SAE Fuel Cell Working Group, October 19, 2004.

HYDROGEN FUEL QUALITY SPECIFICATIONS FOR POLYMER ELECTROLYTE FUEL CELLS IN ROAD VEHICLES
28
Figure 3-24. Co-adsorption of CO and H2S
Testing with multiple contaminants has some more difficult aspects: accurately mixing minute quantities of reactive chemical species and precisely controlling and maintaining the injection of the contaminant species into the fuel stream during testing. Mr. Rockward described tests that used a mixture of critical contaminants at the levels specified by the ISO standard (CO, H2S) and NH3 at 1 ppm. These tests also showed an inverse linear relationship between of RH and performance loss (Figure 3-25). After 300 hours of testing at 100% RH, cell voltage dropped 50 mV; while at 50% RH, cell voltage dropped 100 mV. Testing with H2S alone (Section 3.5.2) showed an even stronger effect of RH on voltage loss.
Figure 3 25. Effects of critical contaminant mixture
It is clear that more testing is needed on contaminant mixtures to address how interactions among certain key contaminants, particularly CO, H2S, and NH3, affect fuel cell performance and durability and how these interactions, in turn, are affected by operational parameters and conditions, such as dynamic, variable loads, RH, and shutdown–startup procedures. More disaggregated fuel quality and fuel cell vehicle performance data from demonstrations are also needed to address these issues.

29
HYDROGEN FUEL QUALITY SPECIFICATIONS FOR POLYMER ELECTROLYTE FUEL CELLS IN ROAD VEHICLES
3.5.7. Particulate MatterThe presence of PM in the hydrogen fuel stream should not directly affect PEM fuel cell performance and durability, but PM can affect the integrity of BOP components such as seals, gaskets, and valve seats and cause fuel leaks and other problems. The ISO and SAE standards specify a maximum particulate concentration (1 mg/kg H2) “to ensure that filters are not clogged and/or particulates do not enter the fuel system and affect operation of valves and fuel cell stacks. A maximum particulate size diameter is not specified but should be addressed in fueling station and/or component standards. Particulate sizes should be kept as small as possible.”22
Although PM may not directly affect the performance and durability of a PEM fuel cell stack, automotive OEMs were concerned enough about potential safety issues that the team at first addressed limits for maximum allowable PM, examining both quantity and size. However, it became evident that the size of PM at the dispenser nozzle could be affected much more by the immediate environment (e.g., fugitive dust in the ambient air and cleanliness of the fueling station and equipment) than by the quality of the hydrogen fuel delivered to or produced at the station.23 The limitation on quantity, 1 mg PM per 1 kg of hydrogen fuel, was based input from hydrogen fuel suppliers that was agreed to by the automotive OEMs.
Testing for PM presents more sampling-related difficulties than other contaminants, but a few results can be reported. In 2006, Quong and Associates, Inc., tested the hydrogen fueling station at the AC Transit depot in Richmond, California, for PM by flowing a known quantity of hydrogen through 0.2 µm polytetrafluorethylene (PTFE) filters.24 The test followed a strict procedure agreed upon by AC Transit to determine PM concentration by weighing the filters before and after exposure to hydrogen. The results showed that the PM concentration was less than 1µg/l (@ 1atm, 0ºC) and 1kg/mg of hydrogen. In contrast, a test at an unidentified fueling station at a flow rate of less than 10 g/second of hydrogen resulted in PM concentrations ranging from 0.019–0.0049 µg/l and “measurable” PM size ranging from 241 µm to 2.8 cm.25
Smart Chemistry, Inc., developed an apparatus and sampling method to enable extensive and rigorous PM sampling and measurement at fueling stations operated by the CaFCP.26 In 2009, NREL worked with Smart Chemistry and the CaFCP and examined a subset of the samples (Table 3-1).27 The tests by Smart Chemistry show that all of the samples were below the limit for PM concentration. The size of the PM collected by Smart Chemistry showed wide variance, ranging from millimeters to less than 10 µm. The test results show a correlation between PM size and concentration with hydrogen flow rate. Furthermore, PM size increased exponentially with flow rate. These results show that additional testing is needed to better understand the relationship between flow rate and collection of PM so that standardized sampling procedures can be developed.
Filters used by Smart Chemistry in the tests were shipped to NREL for advanced analytical analysis, including transmission electron microscopy (TEM) and scanning electron microscopy/energy dispersive x-ray spectroscopy (SEM/EDX). The purpose of the analysis was to determine particle size, morphology, and chemical composition and to assess appropriate methods for estimating, measuring, or calculating important physical properties (e.g., hardness and density). This additional characterization was intended to provide a basis for identifying the sources of PM in the hydrogen production and delivery system and to relate physical and chemical properties of PM to their effects on wear surfaces of valves, moving seals, and systems for joining components. In addition to the microscopic characterization of these components, experimental and fluid dynamic modeling techniques were to be developed and applied to evaluate the flow and deposition of particles in the on-board system.
22 Annex A, “Rationale for the Selection of Hydrogen Contaminants,” ISO FDIS 14687-2:2012(E).23 Annex A further notes that “a specific threshold for particulate size which causes degradation has not been
made clear and it is influenced by the particulate in ambient air while sampling and refueling process.”24 S. Quong, letter report to G. Sleiman, Hydrogenics Corporation, August 12, 2006.25 B. Boyd and J. Birdsall, ASTM Update for CSTT, January 9, 2008.26 J. P. Hsu, “Proposed Detailed Particulate Sampling Procedure for CaFCP,” July 25, 2005.27 D. M. Blake, “Particulate Contamination in Hydrogen at the Point of Delivery Particle Analysis for
Samples from the California Fuel Partnership 2005 to 2009,” report for NREL, n.d.

HYDROGEN FUEL QUALITY SPECIFICATIONS FOR POLYMER ELECTROLYTE FUEL CELLS IN ROAD VEHICLES
30
Analysis of the samples showed that a large number of the particles analyzed had elemental compositions suggestive of dust or dirt particles, and most of them were high in some combination of aluminum (Al) and silicon (Si). There were a large number of particles high in magnesium (Mg) that is not normally found in high concentrations in dust and dirt and may be from a specific source in the dispensing system. Steel and brass particles of varying composition were detected on many of the samples, and other metal particles, such as chromium (Cr), nickel (Ni), and zinc (Zn), were observed in some of the samples analyzed.
Table 3-1. Concentration and size of particulate matter sampled at selected fueling stations
Flow Rate (g/s)*
More than 1 cm (10,000 µm)
Between 1 mm (1000 µm) and 1 cm (10,000 µm)
Between 100 µm and 1000 µm
Between 10 µm and 100 µm
Concentration (µg/L)
29.5 1 3 5 0 0.019
6.68* 0 1 7 0 0.0054
4.16* 0 1 2 0 0.0049
4.16* 0 2 1 0 0.0025
3.92* 0 1 4 0 0.0025
4.54* 0 10 4 0 0.012
2.5* 0 0 3 3 0.00041
6.9 0 0 4 0 0.0044
9.1 0 2 6 21 0.0058
7.1 0 0 5 4 0.005
11.9 0 2 6 4 0.0062
11.2 0 2 18 22 0.0055
8.1 0 0 5 2 0.007
3.3 0 0 5 0 0.0042
*Flow rates determined by dispenser read-out and approximate fill time. All others established using a station test apparatus developed by Smart Chemistry.
Based on the particle sampling and analyses performed, NREL concluded that it was not possible to unambiguously identify the sources of contamination for the metallic particles. Additional testing and sampling are needed to establish the accuracy and reproducibility for the gravimetric analysis of particle concentration and to qualify the sampling methodology and determine the appropriate range of operating parameters (e.g., flow rates, pressures). Some of the particles detected were significantly larger than 10 µm and may need to be removed by a pre-filter either in the hydrogen delivery system or in the vehicle system. The observed range of particle sizes and compositions found in the sampling done to date should be taken into consideration in designing the vehicle fuel receptacle and requirements for filtration.
Unfortunately, NREL did not complete the work plan described above, in part because the principal investigator retired. Given the wide variation in PM size and composition found, NREL recommended that when PM samples are taken from hydrogen delivery systems and other hydrogen streams, samples of ambient air in the vicinity of the hydrogen source should be taken using standard air sampling methods to get background information from the local environment. This recommendation should be addressed as a first step in continuing NREL’s work. There remain many unresolved questions about the importance of limiting PM quantity and size in hydrogen fuel. A key question that the NREL work began to address was whether certain chemical and physical characteristics of PM are critical in affecting the wear and tear of components in the fuel cell system and, if so, whether these elemental and morphological characteristics, rather than quantity or size, should be controlled. In the case of PM, as with other contaminants, field data from demonstrations and early commercial fleets can provide valuable information and data to help answer this and other questions.

31
HYDROGEN FUEL QUALITY SPECIFICATIONS FOR POLYMER ELECTROLYTE FUEL CELLS IN ROAD VEHICLES
4. Single-Cell Test Results and Real-World Polymer Electrolyte Membrane Fuel Cell Vehicle Operating ConditionsThe preceding section summarized results of tests using single-cell MEAs (usually 50 cm2 area) to help establish maximum allowable limits for selected “critical constituents” and others of concern, such as total hydrocarbons, halogenates, inert compounds, and particulate matter. Data from these tests cannot be directly extrapolated to address the same issues in automotive fuel cell stacks.The tests were conducted primarily under constant operating conditions using single cells that do not reflect state-of-the-art PEM fuel cell design and engineering. The purpose of this section is to examine key parameters of real-world operation of PEM fuel cell vehicles and how they affect interpretation of test results using single cells under controlled experimental laboratory conditions.
4.1. Acceptable Performance and Durability Losses Due to Fuel ContaminantsAs discussed in Section 1.3, the effects of fuel quality on PEM fuel cell performance and durability must be considered within the larger context of the causes and mechanisms of PEM fuel cell degradation, that is, the gradual decline in power output during operation in road vehicles. Specification of maximum allowable concentrations of fuel contaminants must, in turn, be considered within the context of overall acceptable performance and durability losses due to degradation of the PEM fuel cell system in real-world operation.
DOE’s 2011 Multi-Year Research, Development and Demonstration Plan (MYRDDP) included technical targets for direct hydrogen PEM fuel cell stacks for transportation.28 One target is 5,000-hour durability in an “automotive drive cycle” by 2017, with less than a 10% drop in rated power after being subjected to the U.S. DRIVE Fuel Cell Tech Team’s (FCTT’s) Component Accelerated Stress Test and Polarization Curve Protocols.29 The DOE 2017 performance targets include stack power density (2,250 W/L), specific power (2,000 W/kg), and efficiency @ 25% of rated power (65%).
At the October 21, 2009, meeting of the U.S. DRIVE FCTT, the team asked for technical input to identify an acceptable loss (e.g., > 10 mV) at the cell level due to fuel contaminants in view of the DOE performance and durability targets described above. In making this request, the team listed the parameters and conditions for single-cell testing that had been approved by the FCTT at a previous meeting:
• Gore 57 Series MEA (0.1/0.4 mg Pt/cm2 anode/cathode, 18 µ)
• T: 80ºC, RH 75 anode/25 cathode (Gore specifications)
• P: 150 kPa (absolute)
• Electrical load: 1 A/cm2
• Stoics: 1.2/2.0 anode/cathode
The requested input was that there should be no performance loss (relative to baseline) after recovery specifically due to fuel impurities. More specifically, after recovery, acceptable performance loss is 0 mV while the overall target of <10% loss over 5,000 hours is maintained. The measurement error should be no larger than that
28 Office of Fuel Cell Technologies, Multi-Year Research, Development and Demonstration Plan, 2011, 3.4 Fuel Cells, www1.eere.energy.gov/hydrogenandfuelcells/mypp/pdfs/fuel_cells.pdf. Performance targets are given in Table 3.4.4 of the MYRDDP.
29 U.S. DRIVE Partnership FCTT, Cell Component Accelerated Stress Test and Polarization Curve Protocols for Polymer Electrolyte Membrane Fuel Cells, revised December 16, 2010. http://www.uscar.org/commands/files_download.php?files_id=267.

HYDROGEN FUEL QUALITY SPECIFICATIONS FOR POLYMER ELECTROLYTE FUEL CELLS IN ROAD VEHICLES
32
experienced to date in durability testing with maximum test error margin of +/- 20 mV. Possible recovery steps during testing (at T, RH, length of time, and frequency to be determined) include the following:
• Expose the anode to air.
• Expose the anode to liquid water.
• Expose the cathode to liquid water.
• Run the cell on OCV.
• Run the cell at lower potentials (how low and how long are to be determined).
The input from the FCTT meeting was helpful, but more information and discussion are needed on specific details of recovery steps and on the practicality of incorporating recovery as recommended in a single-cell testing procedure. As discussed in several places in Section 3, shutdown–startup procedures and duty cycles of automotive systems are particularly important in assessing how recovery affects performance and durability and, in turn, the limitations on contaminants. Fuel cell operation strategies, including shutdown–startup procedures and duty cycles, are business-sensitive and largely unavailable. For subsequent revisions of the ISO and SAE standards, tests should be conducted that incorporate recovery mechanisms within typical automotive duty cycles, including those for hybrid powertrains.
4.2. Effects of Operating ConditionsIn their paper, Wu et al.8 address the importance of operating conditions in understanding degradation mechanisms and failure modes of key PEM fuel cell components. Borup et al. note that “operation of the fuel can accelerate existing decay modes or even invoke entirely new modes of degradation.”30 The FCTT points out that fuel cells for automotive propulsion must operate over a wide range of operating and cyclic conditions.26 These conditions encompass temperatures from below the freezing point to well above the boiling point of water, humidity from ambient to saturated, half-cell potentials from 0 V to >1.5 V, and possible exposure of the anode to hydrogen and air during different parts of the driving and shutdown–startup cycles. Furthermore, the severity in operating conditions can be further exacerbated by their transient and cyclic nature as cell and stack conditions cycle, sometimes quite rapidly, between high and low voltages, temperatures, RH, and gas compositions, resulting in physical and chemical changes, sometimes with catastrophic results. If there is to be no performance loss (relative to baseline) after recovery specifically due to fuel contaminants, as put forth by the FCTT, the effects of these contaminants must be ascertained under the severe but realistic operating conditions outlined by the FCTT.
4.2.1. Fuel Cell Tech Team Performance and Durability Test ProtocolsThe FCTT has prepared protocols for accelerated stress testing of PEM fuel cell components, including electrocatalysts and supports, membranes, and MEAs, to assess their performance and durability for automotive propulsion for comparison against DOE and U.S. DRIVE targets.29 The protocols are intended to establish a common approach for determining and projecting PEM fuel cell component durability under simulated automotive drive cycle conditions. Data from this testing may also help to model PEM fuel cell performance under variable load conditions and the effects of aging on performance. The specified cycles have not been fully correlated with data from stacks and systems operated under actual drive cycles, and additional tests to correlate these results to real-world lifetimes are needed, including actual driving, start–stop, and freeze–thaw cycles. The FCTT protocols, however, provide a starting point to address the effects of operating conditions on PEM fuel cell performance and durability.
4.2.2. Temperature, Pressure, Relative Humidity, StoichiometryThe effects of temperature, RH, and stoichiometric quantities of air and hydrogen play significant roles in the immediate, and even more dramatically, in the long-term performance and durability of PEM fuel cells. Temperature and RH are intimately connected in many aspects of PEM fuel cell operations and involve the
30 Borup et al.,6 p. 3915.

33
HYDROGEN FUEL QUALITY SPECIFICATIONS FOR POLYMER ELECTROLYTE FUEL CELLS IN ROAD VEHICLES
demands of humidification of the MEA and polymeric membrane, the ability to remove product water from the cathode catalyst, and ambient RH conditions. Standard parameters for single-cell testing have been 80ºC and 80ºC dew point (100% RH) for steady state conditions, since 80ºC is the maximum operating temperature defined by DOE targets. Depending on the water transport properties of the polymeric membrane, the operating pressure, and the vehicle fuel cell system design, the RH of the hydrogen fuel feed can be less than 100%, but the membrane cannot be allowed to dry out. Furthermore, testing under other than optimal conditions would provide more realistic information on the effects of contaminants. Testing under multiple conditions would help qualify modeling that could establish boundaries within which contaminant effects can be tolerated while meeting long-term performance and durability targets. The test plan table includes several operating parameters that can be applied in any of several combinations, as well as independently. However, practical limits on testing necessitate judicious choice of test parameters and their combination.
4.2.3. Cell Potential and Duty Cycle A critical aspect of determining the real-world effects of hydrogen fuel contaminants on PEM fuel cell performance is the duty cycle under which the single-cell tests are conducted. Most test data to date are reported at steady state conditions. Tests are conducted at constant load in part because a constant load can more easily be controlled and replicated during testing. Furthermore, there are no commonly accepted accelerated test protocols to assess durability over the service life in a practical period of time, nor are there drive cycles to test under more realistic load conditions. Although all vehicular fuel cells will undergo transient loads, even if only from start to steady state, automobile OEMs do not disclose cell potential required for vehicle operations. The effects of contaminants differ based on operation at transient loads and loads at different potentials, but there is no a standard reference or baseline that would provide meaningful comparative results. DOE adopted a fuel cell load capability that became the standard for steady state tests. Some research, however, did address this issue by operating at more than one steady state condition to ascertain what impact a certain contaminant would exhibit when the fuel cell was not operating at any specific steady state load.
4.2.4. Shutdown–StartupWhether at steady state or under a given duty cycle, shutdown–startup cycles will be an important aspect of automotive fuel cell operation. The longest continuous operation under a single shutdown–startup cycle will depend on the capacity of a vehicle’s fuel tank. The frequency and duration of these cycles will depend on the duty cycle(s) to which the vehicle is subjected. The impacts of shutdown–startup cycles on fuel cell performance and durability and recovery from upset (non-optimal) conditions are difficult to assess. Furthermore, the startup conditions may take place under low ambient temperatures, and the shutdown procedure will vary according to the automobile OEM’s proprietary operating strategy and control algorithms. Electrochemical changes within the fuel cell on the micro scale have been documented when the cell is shut down because of final potential load, availability of reactants, gas and water transport rates, etc. There is evidence that contaminant effects can be reversed if the cell is shut down under certain conditions, but the effects of such conditions on cell durability are unclear. Although the FCTT incorporated recovery as an integral part of its definition of acceptable performance loss due to fuel contaminants, the team did not try to include recovery in its set of single-cell test parameters because recovery mechanisms are closely tied to real-world vehicular operating conditions and proprietary information. However, recovery of cell performance from the effects of fuel contaminants remains an important factor in determining the allowable levels of some contaminants.
4.2.5. Fuel Cell–Battery HybridizationAutomobile OEMs have several options available as to how the fuel cell stack and system will be operated on their vehicles. There are advantages to combining fuel cells with battery storage, particularly since regenerative braking can be a major efficiency gain and load cycling can be accommodated under different control strategies. If a fuel cell is operated in a battery-charging mode, for example, it can run at an optimum efficiency point and undergo fewer and less severe load cycles. However, on–off cycling could be significantly greater than operating continuously from initial startup. On the other hand, if a fuel cell is on constantly during vehicle operations, the demand can vary significantly and lead to long periods of time at idle, which could lower efficiency and fuel cell life. More testing, modeling, and field data are needed so that hydrogen fuel contaminants’ impacts on vehicle performance can be better understood from single-cell testing.

HYDROGEN FUEL QUALITY SPECIFICATIONS FOR POLYMER ELECTROLYTE FUEL CELLS IN ROAD VEHICLES
34
5. ModelingDevelopment, validation, and application of mathematical models can provide valuable tools to better understand fundamental phenomena, allowing technicians to predict behavior under different operating conditions and to design and optimize control systems.31 Modeling is a key element of the overall approach adopted by the DOE team (Figure 2-1 above). The purpose is to better understand the effects of fuel quality on cell and stack performance, particularly cell failure mechanisms, tradeoffs between hydrogen quality and fuel cost, and effects of system operating parameters, especially anode fuel recycling. The team was only partially successful in incorporating the full potential of modeling in many respects, such as extrapolating single-cell test data under one set of conditions to other sets of conditions and using the insights gained from modeling to direct a testing strategy. The team held two workshops on modeling,32 and some of the key insights from these workshops and from modeling activities that contributed to the development of fuel quality specifications are described in this section.
5.1. Contamination ModelsPredictive contamination models can facilitate assessing poisoning mechanisms and assist in the development of specifications for contaminant species. Dr. Jean St-Pierre provides an overview of contamination models and a “transient, generic contamination model addressing kinetic losses in proton exchange membrane fuel cells (PEMFCs) with closed form solutions.”33 Dr. St-Pierre notes that “heterogeneous reaction kinetics are complex, involving aspects such as adsorbate interactions (steric hindrance, etc.), existence of several adsorbate and catalyst site configurations (crystallographic faces, etc.), serial or parallel reaction pathways, and effect of catalyst oxidation state on reaction rates.” Nevertheless, “generic contamination models are needed for both kinetic and ohmic [ion exchange between membrane protons and foreign cations] overpotentials” that address reactant kinetics affected by catalyst “surface blockage by adsorbates, reduction in Faradaic efficiency, and product-selectivity modifications [that result from interactions between reactant and contaminant adsorbates].”
At the modeling workshop held at Argonne National Laboratory (ANL), Dr. Tom Springer of LANL presented an overview of fuel cell modeling and fuel quality that included discussion of complex hydrogen oxidation reaction kinetic processes and anode poisoning by CO and H2S and membrane contamination by cations.34 With DOE support, Dr. St-Pierre derived equations from his generic model referenced above to predict the effect of CO contaminant concentration on steady state performance losses and tolerance limits for Pt and WC catalysts under specific operating conditions.18 The results predicted less than 1% loss in steady state performance independent of catalyst loading for CO concentrations between 0.2 and 0.9 ppm. Based on these results, Dr. St-Pierre suggested that the specification in the ISO standard of 0.2 ppm could be raised.
It is notable that Dr. St-Pierre suggested raising the CO specification based on mathematical modeling while Dr. Bender (Section 3.5.1) recommended lowering it based on experimental test results and the uncertainties and limitations inherent in the test protocols. In designing an overall approach for its work, the team tried to establish a close link between testing and modeling as a key element of coordination. A primary objective of the modeling workshops held at ANL and NREL was to develop an interactive relationship between modelers and experimentalists to facilitate integration of modeling and testing activities. Although members shared test data and modeling results, the team was only partially successful in this integration, as there were difficulties working across incompatible deliverables, milestones, and funding programs. Partial success in this area does not lessen the remarkable coordination and collaboration that the team achieved in developing a scientific foundation for the specifications.
31 The advantages and features of mathematical modeling and key trends in PEM fuel cell modeling activities are addressed by J. St-Pierre, “Section Preface, Device and Materials Modeling in PEM Fuel Cells,” Topics in Applied Physics, Vol. 113, S. J. Paddison and K. S. Promislow, eds., Springer, 2009, pp. 3-17. Also, D. Feroldi and M. Basualdo, “Description of PEM Fuel Cell Systems,” PEM Fuel Cells with Bio-Ethanol Processor Systems: A Multidisciplinary Study of Modeling, Simulation, Fault Diagnosis and Advanced Control, ed. M. Basualdo, et al., Springer, 2012.
32 Argonne National Laboratory, August 30–31, 2007; National Renewable Energy Laboratory, November 20–21, 2008.33 J. St-Pierre, “PEMFC Contamination Model: Competitive Adsorption Followed by an Electrochemical Reaction,” J. Electrochem. Soc., 156 (2009) B291-B300.34 T. Springer, “Fuel Cell Modeling and Fuel Quality,” Fuel Quality Modeling Workshop, Argonne National Laboratory, August 30, 2007.

35
HYDROGEN FUEL QUALITY SPECIFICATIONS FOR POLYMER ELECTROLYTE FUEL CELLS IN ROAD VEHICLES
5.2. Stack ModelingWith support from the FCTO, ANL developed a mechanistic fuel cell stack model that provided an effective complement to single-cell testing.35 In fiscal year (FY) 2007, ANL initiated modeling the effects of fuel contaminants on stack performance.36 Modeling results indicated that at low CO concentrations, Pt poisoning is consistent with CO adsorption on bridge sites, followed by electrochemical oxidation at high anode overpotentials. ANL was able to simulate much of the existing data on CO2 poisoning by postulating a reverse WGS reaction between CO2 and adsorbed H2 to produce CO. Data from the literature on H2S poisoning could be explained by a reaction mechanism that includes at least three steps for reversible associative adsorption of H2S, irreversible dissociation to form a Pt2S-like species, and electrochemical oxidation of Pt2S at high overpotentials. ANL also showed that data in the literature on the effect of NH3 could be modeled by considering its reversible uptake in the membrane and the ionomer in the catalyst. Most importantly for the purpose of defining fuel quality specifications, ANL modeled the effect of anode gas recycle on the buildup of impurities and determined preliminary impurity limits as functions of stack design (membrane thickness, Pt loading), operating conditions (P, T, RH, H2 and O2 utilization), and acceptable degradation in stack voltage and efficiency.
At the 2010 roundtable, Dr. Rajesh Ahluwalia, the principal investigator for the ANL stack model development and validation, described work to date in modeling the effects of critical contaminants on PEM fuel cell stack performance.37 Dr. Ahluwalia reviewed the poisoning mechanisms for CO-CO2, H2S, NH3, and HCHO- HCOOH-C7H8 incorporated in the stack model and results of model runs plotted against test data from JARI, HNEI, and LANL that showed the model captured the effects and key dependencies (concentration, catalyst loading, temperature) of performance losses due to contaminants.
A major value added of the model is its ability to simulate the effects of anode fuel gas recirculation on accumulation of non-hydrogen species. Recirculation is particularly critical in considering limits on so-called inert constituents that do not directly affect fuel cell performance but that can reduce stack efficiency by diluting the hydrogen fuel stream or increase parasitic losses by requiring purging to maintain an adequate level of hydrogen in the fuel stream. Figure 5-1 shows the substructure of the model used to capture the effects of recirculation, and Figure 5-2 shows purge loss (%) and purge interval (seconds) as a function of stack power (%). The reference conditions and assumptions included a pressurized stack 87 kWe at 1 A/cm2 with pure H2, 50% O2 and 70% per-pass H2 utilization; N111 membrane (0.2(c)/0.1(a) mg/cm2 Pt loading); stack pressure 2.5/1.9/1.6 atm at 100/25/5% power; and inlet RH 60/80/90% at 100/25/5% power. Purge criteria were a single purge (14 L) equivalent to 2 volumes of anode subsystem that restored gas in anode channels to H2 fuel specifications. The stack efficiency was defined as the ratio of DC power produced to the lower heating value (LHV) of H2 consumed (chemically and electrochemically) and purged. Purging occurred when the level of a contaminant reached 15%.
Dr. Ahluwalia’s work showed that the accumulation of nitrogen is almost entirely due to crossover from the cathode and may exceed the level of nitrogen found in the hydrogen fuel stream.
35 For model details and progressive development of capabilities, visit the DOE Hydrogen and Fuel Cells website: www.hydrogen.energy.gov/annual_progress.html (accessed May 2015).
36 R. K. Ahluwalia, X. Wang and R. Kumar, “Fuel Cell Systems Analysis,” ANL, from FY 2007 Annual Progress Report, www.hydrogen.energy.gov/pdfs/progress07/v_a_1_ahluwalia.pdf.
37 R.K. Ahluwalia, “Dynamic Behavior of Fuel Hydrogen Impurities in Polymer Electrolyte Fuel Cells,” ISO TC197 Working Group 12 Meeting, San Francisco, January 26–29, 2010.

HYDROGEN FUEL QUALITY SPECIFICATIONS FOR POLYMER ELECTROLYTE FUEL CELLS IN ROAD VEHICLES
36
Figure 5-1. ANL PEM fuel cell stack model with recirculation–purge scheme
Figure 5-2. Purge loss (%) and purge interval (seconds) vs stack tower (%)

37
HYDROGEN FUEL QUALITY SPECIFICATIONS FOR POLYMER ELECTROLYTE FUEL CELLS IN ROAD VEHICLES
This finding is consistent with Dr. Fred Wagner’s conclusion21 that the nitrogen crossover from the cathode and diffusion through the membrane could be a limiting factor in the “hydrogen fuel index,” or so-called “purity” of the fuel. Dr. Ahluwalia showed the simultaneous effect of the ISO mixture of contaminants (Figure 5-2) on performance with recirculation (Figure 5-3).
Figure 5-3. Simultaneous effect of contaminants with recirculation
Dr. Ahluwalia’s work is also important in that it provided an analytical method to evaluate the effects of recirculation on contaminant accumulation. Previous to this work, in late 2004, Japan recommended applying a 1/500 factor to the allowable threshold limits of contaminants under consideration in the ISO specifications to accommodate fuel recirculation and a hydrogen fuel index of 99.8. After objections from the DOE team and after assessing Dr. Ahluwalia’s work, Japan conducted its own modeling of recirculation and found results similar to those of Dr. Ahluwalia.38 Key findings from the Japanese work (Figure 5-4) agree with those of Dr. Ahluwalia that CO and NH3 do not accumulate and that any N2 accumulation is masked by crossover from the cathode. The Japanese work found that H2S does not accumulate, while Dr. Ahluwalia’s work showed H2S breaking through and accumulating above 20% stack power after more than 30 hours of exposure.
More validation and refinement of the ANL stack model would have additional value. Dr. Jean St-Pierre provided an independent assessment of the ANL model39 and discussed possible improvements with Dr. Ahluwalia. The objective of this collaboration was to incorporate, as appropriate, refinements suggested by Dr. St-Pierre’s work on developing and validating contamination models (Section 5.1). Unfortunately, this collaboration was only partially successful but should be resumed if and when the ISO and SAE specifications are updated.
38 Y. Matsuda et al., “Accumulation Behavior of Impurities in Fuel Cell Hydrogen Circulation System,” Japan Automobile Research Institute, USFCC/DOE/JARI Meeting, November 13, 2009.
39 J. St-Pierre, “Technical Support to Refine and Validate Proton Exchange Membrane Fuel Cell Model,” Final Report to NREL, 2008.

HYDROGEN FUEL QUALITY SPECIFICATIONS FOR POLYMER ELECTROLYTE FUEL CELLS IN ROAD VEHICLES
38
Figure 5-4. Conclusions from JARI study on contaminant accumulation due to recirculation

39
HYDROGEN FUEL QUALITY SPECIFICATIONS FOR POLYMER ELECTROLYTE FUEL CELLS IN ROAD VEHICLES
6. Field DataData on the effects of fuel quality on the performance and durability of PEM fuel cell vehicles under real-world fueling and driving conditions are, as might be expected, very limited. Such vehicles have been and continue to be demonstrated in Asia, Europe, and North America, but the main focus of these demonstrations has been on key technical targets, primarily durability (hours of fuel cell stack operation) and vehicle range. Other targets in demonstration projects include fuel economy and operational characteristics, such as start-up capability at temperatures below freezing. For the infrastructure side, demonstration projects typically focus on cost of fuel and refueling time. Field data on fuel quality are limited because fuel used in demonstration projects is typically special batch deliveries of liquid or gaseous hydrogen by tankers or tube trailers, respectively. There are also a limited number of fueling stations that produce hydrogen on-site by SMR or electrolysis.
Fueling with hydrogen is at a pre-commercial stage, as are PEM fuel cell vehicles, and the quality of such fuel delivered or produced on-site is carefully controlled by fuel providers to minimize or remove the effect of fuel quality on the performance and durability of very expensive PEM fuel cell demonstration vehicles. Under these conditions, fuel quality is at best a secondary parameter in assessing the real-world performance and durability of PEM fuel cell vehicles. As these vehicles begin to approach commercial viability and the global auto industry approaches its target date of initial commercialization in 2015, it is important that data on fuel quality and its effect on the performance and durability of PEM fuel cell vehicles be collected in a structured and comprehensive manner. In the meantime, some field data can be gleaned from demonstration projects conducted in the United States and elsewhere.
6.1. Controlled Hydrogen Fleet and Infrastructure Demonstration and Validation Project (United States)DOE initiated the Controlled Hydrogen Fleet and Infrastructure Demonstration and Validation Project (Tech Val) in 2004 to help enable a decision by industry to commercialize PEM fuel cell vehicles by 2015.40 Key performance targets set for 2009 and 2015, respectively, were durability of fuel cell stacks of 2,000 and 5,000 hours, vehicle range of 250+ and 300+ miles, and hydrogen fuel cost at the station of $3.00/kg and $1.50/kg. Through a competitive solicitation, DOE selected four teams of automobile OEMs and energy companies to undertake an eight-year cost-shared effort with a total funding of $359 million that helped to demonstrate and accelerate advancement of fuel cell and hydrogen energy technologies under real-world conditions.
As part of the Tech Val project, NREL collected and analyzed data provided by project partners and issued detailed “data products” to the partner providing the data. In addition, NREL published composite data products (CDPs), aggregated across multiple sites and teams, that include the “hydrogen quality index”41 (Figure 6-1) sampled at fueling stations using on-site production (natural gas reforming and electrolysis) and delivered hydrogen.42 These aggregated data show that during the first two years of the Tech Val project, only stations using on-site electrolysis to produce hydrogen exceeded the contaminant limits in the ISO specifications (and SAE J2719).43 After the first two years, all stations met the minimum fuel index. CDP #28 provides composite data for individual fuel contaminants. For example, the limit for CO is met by both delivered hydrogen and hydrogen from on-site natural gas reforming, but not (surprisingly) by electrolysis in all but one year; for NH3, all hydrogen sources, including delivered, exceeded the limit at least in one year; and for total sulfur, all sources exceed the limit during the first two years, but only hydrogen from electrolysis does so by the fourth year.
40 J. Garbak et al., Controlled Hydrogen Fleet and Infrastructure Demonstration and Validation Project, Fuel Cell Seminar, San Antonio, Texas, November 4, 2004; K. Wipke et al., National Hydrogen Learning Demonstration Status, National Renewable Energy Laboratory, DOE Informational Webinar Series, February 6, 2012.
41 The “hydrogen fuel index” as defined by ISO FDIS14687-2 is determined by subtracting the total non-hydrogen gases (all listed contaminants in Table 1-1) from 100 mole percent. The minimum allowable fuel index is 99.97 percent; i.e., total non-hydrogen gases should not exceed 300 µmol/mol of hydrogen.
42 The CDPs are available at www.nrel.gov/hydrogen/cdp_topic.html#stations.43 National Renewable Energy Laboratory, CDP #27, March 10, 2010.

HYDROGEN FUEL QUALITY SPECIFICATIONS FOR POLYMER ELECTROLYTE FUEL CELLS IN ROAD VEHICLES
40
Figure 6-1. Hydrogen quality index by year and production method
The CDPs from NREL provide a composite snapshot of fuel quality at a limited number (maximum 25) of stations using three different hydrogen sources, but the composite data do not allow for further analysis that would be useful for better understanding of such issues as potential contamination sources (e.g., natural gas feedstock, compressors in electrolysis systems) and contamination at stations upstream of hydrogen production or delivery. Furthermore, these data, furthermore cannot be linked (if there are any) to vehicle performance and durability. The Tech Val project played an important role in advancing the commercial readiness of fuel cell vehicles and hydrogen fueling technologies. For fuel quality concerns, however, the data available were too aggregated and not linked to vehicle performance and durability and, as a result, were not directly useful to determining fuel quality specifications for PEMFC vehicles.
6.2. Japan Hydrogen and Fuel Cell Demonstration ProjectThe Japan Hydrogen and Fuel Cell Demonstration Project (JHFC) was launched in 2002 under the Ministry of Economy, Trade and Industry (METI) with participation by major global automotive OEMs, energy companies, and other industry partners for “the Future of the Earth.”44 Phase 1 (2002–2005) of JHFC focused on clarifying the well-to-wheel energy efficiency of hydrogen fuel cell vehicles and associated fuel infrastructure and obtaining data from demonstration vehicles and fueling stations. Phase 2 (2006–2010) focused on clarifying remaining issues under actual use conditions, including energy savings and environment impact mitigation; collecting data to develop regulations, codes, and standards; formulating and implementing strategies for public education and information dissemination; and identifying technology and policy trends.
A major JHFC activity was the construction and operation of eleven hydrogen stations and one hydrogen liquefaction facility in the Tokyo and Osaka areas. JHFC was the first demonstration in the world of concurrent operation of stations with hydrogen produced from different feedstocks and methods. These feedstocks and methods included reforming of natural gas, naptha, gasoline, methanol, liquefied petroleum gas, and kerosene; water electrolysis; and liquefied hydrogen. Furthermore, JHFC gathered and made available data, including fuel quality, from these stations. Tokyo Gas Company, a member of JHFC, on behalf of the Japan Gas Association,
44 For information about and publications from the JHFC project, visit www.jari.or.jp/jhfc/e/jhfc/index.html.

41
HYDROGEN FUEL QUALITY SPECIFICATIONS FOR POLYMER ELECTROLYTE FUEL CELLS IN ROAD VEHICLES
presented fuel quality data from stations that reformed natural gas to ISO TC197 WG12.45 These data were derived from continuous monitoring of CO and CH4 at the PSA exit of six stations and batch analysis of N2, CO, CO2, CH4, O2, and H2O at different intervals (bimonthly, quarterly, semiannually) at different stations. Table 6-1 shows fuel quality data in parts per million (ppm) from one station using natural gas reformed on site (ND: “not detected”).
Table 6-1. Fuel quality data from the Senju fueling station
ND = “not detected”
In July 2009, major energy suppliers and industrial gas and other companies in Japan launched the Research Association of Hydrogen Supply/Utilization Technology (HySUT) to attain a low-carbon society by establishing a hydrogen infrastructure and improving the business environment for hydrogen.46 Under HySUT, Japan will continue to advance deployment of hydrogen and fuel cell technologies, including hydrogen fueling stations and PEMFC vehicles. Data from the field will be acquired so that regulations can be revised as needed. DOE will continue to work with the appropriate agencies and organizations in Japan to facilitate international harmonization of regulations, codes and standards (RCS), including fuel quality specifications.
6.3. Other Demonstration Projects Demonstration projects in other countries may also provide field data on fuel quality effects and costs. In September 2009, Germany launched H2 Mobility, a public–private partnership between the Nationale Organisation Wasserstoff (NOW) and ten major industrial stakeholders to help build a hydrogen infrastructure and establish Germany as a lead market for hydrogen and fuel cell technologies.47 The European Commission and the Fuel Cells and Hydrogen Joint Undertaking (FCJHU) also support demonstration projects that may provide additional field data on fuel quality effects and costs.48 Such projects will be monitored for fuel quality data. The International Partnership for Hydrogen and Fuel Cells in the Economy (IPHE) has formed the Regulations, Codes and Standards Working Group (RCSWG) to address critical issues involving harmonization of international RCS. The Joint Research Centre of the EC (JRC-EC), a member of the RCSWG, has proposed round robin testing of a 1.5 kW PEMFC short stack to validate fuel and air contaminant specifications and tolerance levels and to identify areas for improvement.49 Such round robin testing conducted by various laboratories using the short stack provided by the JRC-EC will provide valuable data not obtainable from single-cell testing.
45 I. Yasuda, Discussion of C/B Analysis in View of Fuel Suppliers, presentation to ISO TC197 WG12, San Francisco, January 28–29, 2010.46 HySUT website, accessed May 2015, http://hysut.or.jp.47 K. Bonhoff, Current Progress of Fuel and Hydrogen Demonstrations in Germany, JHFC Seminar, Tokyo, Japan, March 1, 2011.48 FCJHU website, accessed May 2015, www.fch-ju.eu.49 Source: Dr. Georgios Tsotridis, JRC-EC, Institute for Energy and Transport Petten, Netherlands, http://iet.jrc.ec.europa.eu.

HYDROGEN FUEL QUALITY SPECIFICATIONS FOR POLYMER ELECTROLYTE FUEL CELLS IN ROAD VEHICLES
42
7. Analysis From the outset, the team defined its overall task in terms of the need to trade off fuel cell performance and durability against the cost of delivering “clean” hydrogen at the fuel dispenser. Along with single-cell testing to obtain data on performance and the mechanisms of degradation due to selected, critical contaminants, the team looked closely at fuel quality considerations in hydrogen production, purification, and delivery systems particularly for the near-term, limited-scale introduction of a FCV fleet for which the ISO standard is intended to apply.
ANL developed a model of hydrogen production using the SMR–PSA process in particular, as it might be used at the relatively small scale of 1500 kg/day of H2 in distributed forecourt production at neighborhood hydrogen fueling stations.50,51 The objective of this work was to evaluate the effects of setting various levels of contaminants in the hydrogen (dispensed to the fuel cell vehicles) on the production/purification efficiency, hydrogen recovery, and the cost of the hydrogen. Combining the results of this model with the observed and modeled effects of impurities on fuel cell performance can yield a better understanding of the effects of setting various contaminant-level specifications on the costs of hydrogen fuel, and the performance and costs of the automotive fuel cell systems using that hydrogen fuel.
7.1. Cost–Benefit Analysis and Trade-offs—Fuel Quality versus Fuel CostThe production of H2 with the desired low contaminant levels is achievable with existing purification processes, but penalties would be incurred in terms of energy efficiency and the cost of hydrogen, as the allowable concentrations of the contaminants are lowered. At present, a major fraction of commercial hydrogen is produced by the steam reforming of natural gas (SMR) in large facilities. On a dry basis, the product gas mixture from SMR contains primarily hydrogen and carbon oxides, with much smaller amounts of methane and nitrogen, and trace levels of other species, such as hydrogen sulfide and ammonia. All species other than hydrogen are removed from this gas mixture using PSA. For example, the PSA system can be designed to remove many of the contaminants to even lower levels, but only by operating at a lower H2 recovery. For the commercial H2 supplier, however, a greater concern is the ability to verify/certify meeting the regulatory requirements at these very low (e.g., 4 ppb total sulfur) contaminant levels.
7.1.1. Production–Purification System The production unit for the SMR/PSA process is shown schematically in Figure 7-1. The feed natural gas (NG) is compressed from the supply pressure of 3 atm to the operating pressure (Pf) of the steam reformer (SR) and water–gas shift (WGS) reactor. The product reformate gas mixture is cooled to condense out the bulk of the water in it before flowing to the PSA unit. The PSA process uses sorbents, typically activated carbons and zeolites, to preferentially adsorb impurities at a high partial pressure and then release them at a lower partial pressure for sorbent regeneration. Because hydrogen is adsorbed much less strongly than other species (except helium), a PSA process yields a purified hydrogen stream at the feed pressure. The PSA is a cyclic process that uses multiple beds operating in a staggered time sequence to provide constant product and tail-gas flow. Large-scale processes typically employ a large number of beds with several pressure equalizations for high hydrogen recovery and process efficiency. For the smaller system considered here, an established PSA process using four beds was used.52 The contaminants included in the SMR-PSA model are CO, CO2, N2, CH4, and H2S. The high-purity hydrogen product exiting the PSA at a pressure Pf is delivered to the refueling station (RF). Here, the product hydrogen is compressed for storage in metal cylinder storage tanks (170 atm max pressure). The hydrogen is next compressed to 430 atm (max) for transfer into a 4-bed high-pressure cascade system to allow rapid filling of 340 atm (5000 psi) onboard H2 vehicular tanks.
50 S. Ahmed, D. Papadias, and R. Kumar, Cost Implications of Hydrogen Quality Requirements, DOE Hydrogen Program Annual Merit Review, Arlington, VA, 2009.51 D. Papadias, S. Ahmed, R. Kumar, and F. Joseck, “Hydrogen quality for fuel cell vehicles – A modeling study of the sensitivity of impurity content in hydrogen to the
process variables in the SMR–PSA pathway,” International Journal of Hydrogen Energy (34, 2009): 6021–6035.52 W. E. Waldron, S. Sircar, “Parametric Study of a Pressure Swing Adsorption Process,” Adsorption (6, 2000): 179–188.

43
HYDROGEN FUEL QUALITY SPECIFICATIONS FOR POLYMER ELECTROLYTE FUEL CELLS IN ROAD VEHICLES
Figure 7-1. Simplified schematic of the hydrogen production–purification process for the steam reforming of natural gas
7.1.2. Analysis Assumptions The simplified process model shown in Figure 7-1 was calibrated to provide the same efficiency and overall heat integration as used for the H2A53 case study, Current Forecourt Hydrogen Production from Natural Gas (1,500 kg per day) Version 2.01. In this case (Figure 7-1), the enthalpy flows exiting the process boundary at specified temperatures are treated as waste heat (e.g., reformate for cooling, burner exhaust). Furthermore, the case study used a flat heat loss from the process equivalent to 2.5% of the lower heating value of the H2 product. The reformate composition is calculated by assuming it to be at thermodynamic equilibrium at the reformer exit temperature (with the additional constraint that the CH4 content remains unchanged in the WGS). Typically, the sulfur species are converted to H2S by recycling a small amount of H2 from the exit of the reformer; H2S is then removed in a ZnO bed. A desulfurizer bed was not included in the process model. However, to study the effectiveness of the PSA in removing H2S, the reformate composition entering the PSA unit was arbitrarily modified to include 100 ppm of H2S.
The PSA unit was modeled in greater detail to delineate the product hydrogen quality and recovery as functions of various process conditions (e.g., inlet reformate composition, adsorbent mix, pressure, etc.).
The following main assumptions were used to derive the model:54
• The gas phase follows the ideal gas law.
• There is negligible axial pressure drop.
• The bulk gas and the solid phase (adsorbent) are in thermal equilibrium.
53 Hydrogen Analysis (H2A) production models: www.hydrogen.energy.gov/h2a_production.html 54 W. E. Waldron et al., op. cit.; D. M. Ruthven, Principles of Adsorption and Adsorption Processes, (New York: John Wiley & Sons, 1984), p 433; J. Jiang,V. G. Fox,
and L. T. Biegler, “Simulation and Optimal Design of Multiple-Bed Pressure Swing Adsorption Systems,” AIChE Journal (50, 2004): 2904–2917; J. A. Ritter and R. T. Yang, “Equilibrium Adsorption of Multicomponent Gas Mixtures at Elevated Pressures,” Industrial and Engineering Chemistry Research (26, 1987): 1679–1686.

HYDROGEN FUEL QUALITY SPECIFICATIONS FOR POLYMER ELECTROLYTE FUEL CELLS IN ROAD VEHICLES
44
• Operation is adiabatic.
• Average isosteric heat of adsorption for each gas in the mixture may be used.
• Adsorption rates may be calculated using the linear driving force model with lumped mass-transfer parameters.
For this study, layered adsorption beds consisting of activated carbon in the feed end and zeolite 5A in the product end of each PSA column were considered. These adsorbents are typically used for the purification of reformer effluent gas mixtures.55 The carbon and zeolite beds may be preceded by a silica or alumina layer to reduce the moisture content. However, for simplification, it was assumed that the reformate is dry before it enters the PSA unit.
The study did not include a detailed analysis of parasitic power consumption (blowers, pumps, etc.) and water management. A constant value for the electrical demand according to the H2A case study was assumed. Since the study investigated a range of pressures for the process, however, compression energy in more detail was included. The natural gas compressor was modeled as a single stage unit, while the compression of hydrogen to the dispensing pressure was calculated using the H2A model (Refueling Station).
7.2. Steam Methane Reforming—Pressure Swing Adsorption Modeling Results 7.2.1. Base CaseFor the reference base case, the selected parameter values were as follows: steam-to-carbon molar ratio of 4, 8 atm pressure, 750ºC SMR exit (equilibrium) temperature, 435ºC WGS exit (equilibrium, excluding any change in CH4 concentration from that in the SMR exit) temperature, 25ºC PSA inlet temperature, and 80% carbon fraction in the PSA beds. For this base case, Table 7-1 shows the feed natural gas composition and the SMR-WGS product composition (feed to PSA), both on a dry basis.
Figure 7-2 shows the impurity concentrations of N2, CO, CH4, and CO2 in the purified hydrogen as a function of H2 recovery. Because the adsorption capacity of the PSA beds for N2 is much lower than that for any of the other impurities considered in this study, N2 shows the highest concentration in the product H2, followed by CO. Of the impurity species considered, the purified hydrogen product gas is very low in CO2 (<10–15 ppm) and CH4 (10–5 to 10–10 ppm); these species essentially do not show any significant breakthrough for the H2 recovery values investigated. The H2S, despite the relatively high concentration of 100 ppm in the feed to the PSA, is effectively removed without any indication of breakthrough. Thus, the main contaminant species of interest are CO and N2. As shown in Figure 7-2, at a H2 recovery of 76.3%, the PSA process will be sufficient to meet the proposed ISO-SAE guideline of 100 ppm for N2, but the CO will exceed the guideline value of 0.2 ppm. On the other hand, operating the PSA at a lower H2 recovery of 74% will yield a product that contains 0.2 ppm CO and 10 ppm N2 and meets the guideline values for all of the species tracked in the model. Thus, CO may be considered to be the limiting species, in that the maximum recovery of H2 in the PSA unit is limited by the specified CO concentration in the H2 product.
55 S. Sircar, T. C. Golden, “Purification of Hydrogen by Pressure Swing Adsorption,” Separation Science and Technology (35, 2000): 667–687

45
HYDROGEN FUEL QUALITY SPECIFICATIONS FOR POLYMER ELECTROLYTE FUEL CELLS IN ROAD VEHICLES
Table 7-1. Base case natural gas and reformate compositions
Natural Gas Compositiona Reformate Composition
CH4 93.1% H2 76.4%
C2H6 3.2% CO2 17.5%
N2 1.6% CH4 2.8%
CO2 1.0% CO 2.8%
C3H8 0.7% N2 0.4%
C4H10 0.4% H2S 100 ppmv
a Average composition in major U.S urban areas56
Figure 7-2. Impurity concentrations in the product hydrogen as a function of hydrogen recovery for the base-case set of conditions
For the base case with a limiting H2 recovery of 74%, fuel efficiency57 is calculated to be 65.6%. The electrical energy needed for compression is estimated to 2.3 kWh per kilogram of product hydrogen. This includes (i) natural gas compression from the supply pressure (3 atm) to the steam reformer pressure (8 atm), and (ii) compression of the product hydrogen from the PSA outlet pressure (8 atm) to the off-board storage pressure (430 atm) at the fueling station.
7.2.2. Limiting (Canary) Species The major operating parameters and their ranges used in the analyses were a steam-to-carbon molar ratio (S/C) of 3 to 6, SMR and PSA operating pressures (Pf) of 6 to 22 atm, PSA inlet temperatures (TPSA) of 25ºC or 40ºC, and carbon fractions (C/F) of 20% to 80% in carbon/zeolite PSA beds.58 For the majority of the cases studied,
56 W. E. Liss, W. H. Thrasher, G. F. Steinmetz, P. Chowdiah, and A. Attari, “Variability of Natural Gas Composition in Select Major Metropolitan Areas of the United States,” Gas Research Institute Report No. GRI-92/0123:1992.
57 Defined as the ratio of the lower heating value of the product H2 to the lower heating value of the natural gas feed to the SMR-PSA system.58 D. Papadias et al., op. cit.

HYDROGEN FUEL QUALITY SPECIFICATIONS FOR POLYMER ELECTROLYTE FUEL CELLS IN ROAD VEHICLES
46
recovery was limited by the specified CO concentration (0.2 ppm) in the product hydrogen (see Table 7-2). On the other hand, process conditions, such as the pressure and temperature of the PSA beds, had a significant impact on hydrogen recovery, while S/C ratio only marginally affected the hydrogen recovery.
Nitrogen was the limiting species only for the cases where the carbon-to-zeolite ratio in the PSA bed was reduced below ~60%. For all cases studied, the rest of the impurity species in the product hydrogen (CO2, H2S, and CH4) did not show any significant breakthrough for the H2 recovery values investigated. The model results are qualitatively in agreement with impurity data collected in the JHFC demonstration projects.59 For most of the cases, CO was identified as a “canary” species (i.e., CO limits recovery), with inerts (Ar+N2) being the bulk impurity in the product hydrogen.
Table 7-2. Reformate gas compositions (%-Dry) as a function of S/C ratio
Process Parameter1) CO (ppm) N2 (ppm) H2 Recovery (%)
S/C Fixed: TPSA=25 °C, Pf=8 atm, C/F=80%
3 0.2 (L) 15 74
4a 0.2 (L) 10 74
6 0.2 (L) 8 74
TPSA (°C) Fixed: S/C=4, Pf=8 atm, C/F=80%
25a 0.2 (L) 10 74
40 0.2 (L) 25 70
Pf (atm) Fixed: S/C=4, TPSA=25 °C, C/F=80%
6 0.2 (L) 4 67
8a 0.2 (L) 8 74
10 0.2 (L) 18 77.4
12 0.2 (L) 15 78.8
15 0.2 (L) 12 80
18 0.2 (L) 9 80.4
22 0.2 (L) 8 80
C/F (%) Fixed: S/C=4, TPSA=25 °C, Pf=8 atm
80a 0.2 (L) 10 74
60 0.1 100 (L) 77
40 0.01 100 (L) 78
20 >1e-4 100 (L) 79
aReference base case, (L) denotes limiting species
7.2.3. Process Optimization—Effect of S/C and Pressure The S/C ratio is an important parameter for the hydrogen production and purification process in terms of both process energy and impurity concentrations. Adding water to the reformer promotes the desired conversions (reforming and WGS reactions), but it increases the amount of heat needed to vaporize it. This additional heat has to be provided either by operating the PSA at a lower recovery or by feeding additional natural gas to the burner. Both options lead to lower process efficiencies. Figure 7-3(a) shows the relationship between fuel efficiency and S/C ratio as a function of H2 recovery in the PSA unit, clearly indicating the combination of S/C and H2 recovery where the efficiency is at a maximum. The process efficiency is maximized when the heat required in the steam
59 I. Yasuda, Tokyo Gas Co., Ltd, The Japan Gas Association, Discussion of C/B Analysis in View of Fuel Suppliers, ISO/TC197/WG12, 16th meeting, San Francisco, 2010.

47
HYDROGEN FUEL QUALITY SPECIFICATIONS FOR POLYMER ELECTROLYTE FUEL CELLS IN ROAD VEHICLES
reformer is evenly matched with the energy content of the tail-gas from the PSA unit. When the S/C ratio exceeds the thermo-neutral point (the ratio at which the energy in the PSA tail-gas balances the process heat requirement), it is necessary to burn additional natural gas to compensate for the energy shortfall in the PSA tailgas. As the S/C ratio decreases below the thermo-neutral point, all of the energy of the PSA tailgas is not used, and the excess energy is wasted. The efficiency decreases more rapidly below the thermo-neutral point than it does above the thermo-neutral point because (1) the excess energy is not utilized and (2) the lower S/C decreases the conversion efficiency in the steam reformer.
The effect of varying the pressure in the fuel processor is to change the equilibrium composition of the reformate entering the PSA system. Higher pressures lead to lower CH4 conversions in the reformer and, therefore, lower H2 yields in the reformate gas stream entering the PSA unit. Increasing the system pressure, however, has the beneficial effect of increasing the working capacity of the sorbents. As shown in Table 7-2, the advantage of increasing pressure is most significant at the lower pressures. The net effect on H2 recovery is positive for pressures up to 18 atm, while the effect on recovery at pressures greater than 18 atm is very small, if any. At some point, the benefit of increasing pressure on H2 recovery is offset by the H2 that is lost in the regeneration steps of the PSA (increase the mass of H2 in the void spaces of the PSA bed and on the adsorbent).
Figure 7-3(b) shows the effect of pressure on process efficiency for the base-case condition of S/C = 4 and for optimal S/C values (i.e., where the recovery and the S/C are simultaneously adjusted to maximize the efficiency). In contrast to the sharp increase in recovery up to about 18 atm, the optimal efficiency curve shows that the net H2 production/purification efficiency peaks (at >68%) at pressures of 8–10 atm.
(a) (b)
Figure 7-3. (a) Effect of the S/C ratio on fuel efficiency as a function of the hydrogen recovery; (b) effect of pressure on fuel efficiency (S/C = 4 and with optimal S/C)
The efficiency values reflect not only the variations in H2 recovery from the PSA unit but also the amount of H2 that enters the PSA, which decreases with increasing system pressure. The efficiency change attributable to compression energy varies to the extent that with increasing pressure the natural gas (available at 3 atm) has to be compressed more while the product H2 has to be compressed correspondingly less (to 430 atm), and this represents a small part of the efficiency change.

HYDROGEN FUEL QUALITY SPECIFICATIONS FOR POLYMER ELECTROLYTE FUEL CELLS IN ROAD VEHICLES
48
7.3. Cost Analysis 7.3.1. Cost of HydrogenThe H2A case study, Current Forecourt Hydrogen Production from Natural Gas (1,500 kg per day) Version 2.01,60 was used to calculate the delivered cost of hydrogen for the SMR-PSA pathway. Economic parameters and inputs used to calculate the cost of hydrogen are shown in Table 7-3.
Table 7-3. Distributed production of hydrogen from the steam reforming of natural gas: economic and technical operating parameters used in H2A v2.0.1
Characteristics Units Value
Financial Inputs (Standard)
Reference year - 2005
Start-up time years 0.5
Plant life years 20
Depreciation schedule length years 7
Depreciation type - MACRS
Total tax rate % 38.90
Technical Operating Parameters
Plant design capacity kg-H2/day 1500
Operating capacity factor % 85.2
Production Unit outlet pressure atm 6 - 22
Dispensing pressure atm 430
Electrical consumptiona kWhe/kg-H2 3.1
Water consumption Liters/kg-H2 21.8
Costs
Production unit capital cost (uninstalled)b $ 870,000
Refueling station total capital investmentc $ 3,994,000
Process water $/gal 0.0017
Natural gas – Industriald $/(1000-scft) 7.6
$/(MM-BTU) 7.73
$/Nm3 0.27
Electricity – Commercial $/kWh 0.081
a Total electrical consumption was weakly affected by production unit pressure.
b Default values assumed. Production unit refers to all pieces of equipment to compress and purify the feedstock, reformer, burner, condenser, and PSA unit. The installation factor is 10% of the capital costs.
c Denotes installed cost for compressors storage and dispensers. The refueling station calculations are determined using the default values in H2A.
d Base case value—Natural gas reflects an average price during 2007 (data from http://www.eia.gov). The average price for industrial natural gas during 2011 was $5/(1000-scft) for comparison.
60 H2A Hydrogen Production Model User Guide, Version 3 draft, www.hydrogen.energy.gov/h2a_production.html.

49
HYDROGEN FUEL QUALITY SPECIFICATIONS FOR POLYMER ELECTROLYTE FUEL CELLS IN ROAD VEHICLES
Most of the default values in the case study were kept fixed. This includes all capital costs and the majority of the operations and maintenance costs. Utilities such as water and electricity were kept fixed assuming a reforming pressure of 20 atm. As discussed in Section 7.2.3, the difference in electrical consumption when operating at different pressures was negligible. For the base case,61 the cost of hydrogen (untaxed) from the steam reforming of natural gas was calculated to be $3.95/kg-H2 (at a natural gas price of $7.73/million BTU, which is far higher than the April 2012 natural gas commodity price of <$2.00/million BTU). The bulk of the hydrogen cost was mainly attributed to feedstock (natural gas) (34%) and refueling station capital costs (32%). Capital cost contribution of the production unit accounted for only 11% of the delivered hydrogen cost where the PSA unit represented only a small fraction (~6%) of those costs.
Figure 7-4 shows the sensitivity of the cost of H2 to the level of CO in the product hydrogen under the various process conditions that have been calculated (i.e., S/C, PSA inlet temperature, etc.). The cost sensitivity to the level of other impurities such as N2 and CH4 showed the same trends as the CO case. These are not shown here, as the CO was the limiting species in most of the cases analyzed. Each curve represents either the base-case conditions or a single parameter variation from the base case (with the exception of the optimal S/C, where both S/C and the H2 recovery were adjusted to maximize efficiency). Some process parameters were found to have a significant impact on the cost of hydrogen, such as the cost increase of $0.20/kg of hydrogen when the S/C ratio was increased from 3 to 6. Changing process parameters (S/C and pressure) is likely to affect the capital cost for the production unit. However, since the capital cost for the production unit accounts for ~11% of the total hydrogen cost delivered for the base case, the changes in process parameters to the capital cost are expected to affect the cost of hydrogen only moderately.
Figure 7-4. Hydrogen cost shown to be a weak function of CO concentration (natural gas price: $7.73/million BTU)
61 S/C = 4, CO (0.2 ppm) limits fuel efficiency to 66%.

HYDROGEN FUEL QUALITY SPECIFICATIONS FOR POLYMER ELECTROLYTE FUEL CELLS IN ROAD VEHICLES
50
For given fixed process conditions, the PSA achieves a variation of quality specifications for the product hydrogen through changes in the PSA operating variables, such as cycle time and purge-to-feed ratio.62 Thus, when the allowable impurity concentration is varied, the total hydrogen cost (the slope of each curve in Figure 7-4) is affected because of changes in hydrogen recovery and, consequently, plant efficiency. The slopes of the curves show that the cost of hydrogen is only weakly affected by the impurity level, with each curve showing a change of less than $0.05/kg hydrogen as the CO level changes by almost three orders of magnitude (from 0.1 to 100 ppm).
7.3.2. Fuel Cell Performance versus Fuel QualityThe impact of variable impurity concentrations on the cost of hydrogen over the lifecycle of a fuel cell vehicle was also explored. In addition to the cost of hydrogen as a function of impurity level, such an analysis requires the effect of the impurity on fuel cell performance, i.e., fuel cell system efficiency translated to a corresponding fuel economy multiplier. Table 7-4 shows the results for a set of conditions and assumptions. The cost of hydrogen and its dependence on a range of CO levels spanning an order of magnitude have been taken from Figure 7-4 (optimal S/C). The fuel cell efficiency and fuel economy multipliers were derived from fuel cell modeling calculations.63 The fuel economy multiplier is for a sports utility class of internal combustion engine vehicle. Increasing the CO concentration from 0.1 to 1.0 ppm results in a fuel economy drop from 50.8 to 48.4 miles per gallon gasoline equivalent (mpgge). Then, over 100,000 miles of driving, the cost of hydrogen fuel for such a vehicle increases by ~$340 (or 4.4%). The last row in Table 7-4 shows the cost multiplier, relative to the case using 0.2 ppm CO. Limiting the CO level to a stricter standard of 0.1 ppm will help reduce the fuel cost by 1.3%. On the other hand, relaxing the standard to 1 ppm will increase it by 3%. Thus the fuel cost implication of changing the CO concentration over an order of magnitude is approximately 4.4%.
This simplified analysis of fuel costs does not reflect the cost (capital and maintenance) of the fuel cell vehicle that operates on a hydrogen fuel containing up to 1 ppm CO. Qualitatively, it can be said that the known fuel cell degradation behavior suggests that the cells will require, at least, higher platinum loadings and will need to operate at lower current densities, both of which will increase the cost of the automotive fuel cell system. In addition, other clean-up and maintenance routines may be required, which would further add to the cost of operating the fuel cell vehicle over 100,000 miles.
Table 7-4. Cost of hydrogen over the life of a fuel cell vehicle as a function of CO content
CO Concentration in Hydrogen, ppm 0.1 0.2 0.5 1.0
Cost of Hydrogen, $/kg 3.895 3.891 3.885 3.881
Fuel Cell Stack Efficiency, % (LHV) 50.7 49.4 47.8 46.4
FCV / ICEV Fuel Economy Multiplier (SUV type ICEV achieving 20 mpg)
2.54 2.50 2.46 2.42
Fuel Economy, mpgge 50.8 50.0 49.2 48.4
Hydrogen Required (Life=100,000 miles), kg 1,970 1,998 2,033 2,065
Cost of Fuel (Vehicle Life), $ 7,673 7,774 7,898 8,014
Cost Multiplier 0.987 1.00 1.02 1.03
7.3.3. Quality Assurance Requirements and CostsThe sampling, analysis, and quality verification of the hydrogen fuel will be of critical importance with respect to the initial commercial deployment of fuel cell vehicles and the hydrogen fueling stations for these vehicles. The cost of the gas composition analysis, especially for some of the impurities that have very low allowable
62 R. K. Ahluwalia, X. Wang, “Effect of CO and CO2 impurities on performance of direct hydrogen polymer-electrolyte fuel cells,” Journal of Power Sources (180, 2008): 122-131; R. K. Ahluwalia, X. Wang, “Buildup of nitrogen in direct hydrogen polymer-electrolyte fuel cell stacks,” Journal of Power Sources (171, 2007): 63–70.
63 D. M. Ruthven, op. cit.
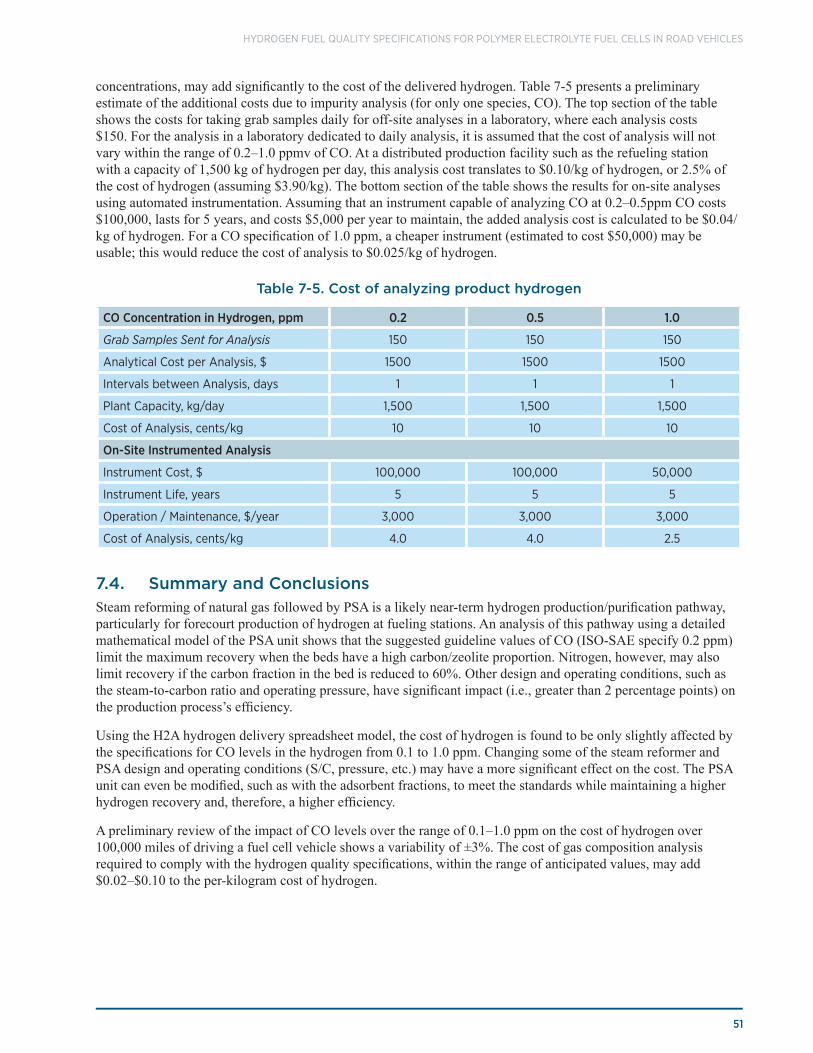
51
HYDROGEN FUEL QUALITY SPECIFICATIONS FOR POLYMER ELECTROLYTE FUEL CELLS IN ROAD VEHICLES
concentrations, may add significantly to the cost of the delivered hydrogen. Table 7-5 presents a preliminary estimate of the additional costs due to impurity analysis (for only one species, CO). The top section of the table shows the costs for taking grab samples daily for off-site analyses in a laboratory, where each analysis costs $150. For the analysis in a laboratory dedicated to daily analysis, it is assumed that the cost of analysis will not vary within the range of 0.2–1.0 ppmv of CO. At a distributed production facility such as the refueling station with a capacity of 1,500 kg of hydrogen per day, this analysis cost translates to $0.10/kg of hydrogen, or 2.5% of the cost of hydrogen (assuming $3.90/kg). The bottom section of the table shows the results for on-site analyses using automated instrumentation. Assuming that an instrument capable of analyzing CO at 0.2–0.5ppm CO costs $100,000, lasts for 5 years, and costs $5,000 per year to maintain, the added analysis cost is calculated to be $0.04/kg of hydrogen. For a CO specification of 1.0 ppm, a cheaper instrument (estimated to cost $50,000) may be usable; this would reduce the cost of analysis to $0.025/kg of hydrogen.
Table 7-5. Cost of analyzing product hydrogen
CO Concentration in Hydrogen, ppm 0.2 0.5 1.0
Grab Samples Sent for Analysis 150 150 150
Analytical Cost per Analysis, $ 1500 1500 1500
Intervals between Analysis, days 1 1 1
Plant Capacity, kg/day 1,500 1,500 1,500
Cost of Analysis, cents/kg 10 10 10
On-Site Instrumented Analysis
Instrument Cost, $ 100,000 100,000 50,000
Instrument Life, years 5 5 5
Operation / Maintenance, $/year 3,000 3,000 3,000
Cost of Analysis, cents/kg 4.0 4.0 2.5
7.4. Summary and ConclusionsSteam reforming of natural gas followed by PSA is a likely near-term hydrogen production/purification pathway, particularly for forecourt production of hydrogen at fueling stations. An analysis of this pathway using a detailed mathematical model of the PSA unit shows that the suggested guideline values of CO (ISO-SAE specify 0.2 ppm) limit the maximum recovery when the beds have a high carbon/zeolite proportion. Nitrogen, however, may also limit recovery if the carbon fraction in the bed is reduced to 60%. Other design and operating conditions, such as the steam-to-carbon ratio and operating pressure, have significant impact (i.e., greater than 2 percentage points) on the production process’s efficiency.
Using the H2A hydrogen delivery spreadsheet model, the cost of hydrogen is found to be only slightly affected by the specifications for CO levels in the hydrogen from 0.1 to 1.0 ppm. Changing some of the steam reformer and PSA design and operating conditions (S/C, pressure, etc.) may have a more significant effect on the cost. The PSA unit can even be modified, such as with the adsorbent fractions, to meet the standards while maintaining a higher hydrogen recovery and, therefore, a higher efficiency.
A preliminary review of the impact of CO levels over the range of 0.1–1.0 ppm on the cost of hydrogen over 100,000 miles of driving a fuel cell vehicle shows a variability of ±3%. The cost of gas composition analysis required to comply with the hydrogen quality specifications, within the range of anticipated values, may add $0.02–$0.10 to the per-kilogram cost of hydrogen.

HYDROGEN FUEL QUALITY SPECIFICATIONS FOR POLYMER ELECTROLYTE FUEL CELLS IN ROAD VEHICLES
52
8. Analytical Methods and Quality ControlAs noted above, the team defined its overall task in terms of the need to trade off fuel cell performance and durability against the cost of delivering “clean” hydrogen at the fuel dispenser. In doing so, the team also recognized the critical need for standardized analytical methods and instrumentation to verify compliance with the specifications included in both the ISO and SAE standards. Experts on both the ISO and SAE working groups identified the refinement of existing and the development of new standardized analytic procedures to sample and measure non-hydrogen constituents at the levels recommended in the ISO and SAE fuel quality specifications as a critical area of work. This section describes the effort DOE supported, particularly with ASTM, to develop and validate consensus analytic procedures to enable laboratories to verify whether a particular fuel sample meets these specifications using standardized instrumentation and test procedures.
8.1. Perspectives of Fuel ProvidersIt is important to note that specifications in SAE J2719 (as well as ISO FDIS 14687-2) were derived from an initial listing of fuel contaminants developed by the CaFCP in 200364 and that these specifications primarily reflected the priority of automobile OEMs to minimize risks of damaging very expensive pre-commercial fuel cell demonstration vehicles. SAE published its initial TIR J2719 in November 2005; the report largely incorporated the specifications developed by the CaFCP. As fuel quality must be weighed against fuel cost, DOE convened a teleconference with fuel providers, who participate in the standards development process, on August 26, 2005, to obtain their independent perspectives on the ISO and SAE standards under development. Fuel providers represented at this teleconference included Air Products and Chemicals, BOC, BP, Chevron, ConocoPhillips, and Shell Hydrogen. A representative of the American Petroleum Institute (API) also participated. The key issues and concerns outlined below informed the DOE team’s path in addressing analytical and quality assurance aspects of fuel quality specifications.
The fuel providers noted that the proposed specifications are very stringent and are largely based on the lowest common denominator of the potential fuel constituents of concern to the automotive OEMs. Although the cost implications for producing and purifying hydrogen fuel to meet such specifications cannot be quantified at this time, they could be severe, and the fuel providers requested that automotive OEMs provide more data to justify the stringency of the specifications. The ISO and SAE specifications contain six constituents whose recommended maximum levels in the fuel are at the lowest detectable limits of those constituents under standardized sampling and measurement methodologies. Furthermore, some of the measurement methodologies listed in the ISO and SAE tables are not sensitive enough to measure to the levels specified and wrongly imply that methodologies are available and adequate.
The recommended levels of some constituents in the fuel are below concentrations of these constituents typically found in ambient air or included in air quality regulations, and it must be remembered that ambient air enters the cathode where the electrochemical conditions are different from those at the anode where the fuel enters. Air contaminants are of critical concern, as cathode reactions are rate-limiting in the PEM fuel cell, but air contaminants are not necessarily germane to fuel quality specifications. In testing the effects of fuel constituents on the PEM fuel cell, considerations such as oxygen crossover from the cathode affecting CO clean-off at the anode will be important.
The fuel constituents of major concern to hydrogen producers are inert gases, particularly helium and CO. Helium is very difficult to detect and measure at the level proposed for total inert gases and can be present at significant levels (hundreds of parts per million). For on-site generation, CO even at or below 1 ppm could make demonstration projects prohibitively expensive. The specifications as proposed could also disadvantage certain production/purification technologies that are at early stages of development and could constrain innovation. Such innovation needs to be accommodated without having to resort to multiple grades of hydrogen.
64 CaFCP, VeOps Hydrogen Purity Specifications, August 2003

53
HYDROGEN FUEL QUALITY SPECIFICATIONS FOR POLYMER ELECTROLYTE FUEL CELLS IN ROAD VEHICLES
It would be beneficial for the hydrogen and fuel cell industry if the hydrogen fuel suppliers could identify and define what can be produced without extra costs for purification and provide data on clean-up costs to meet the specifications. A better understanding of how various production and clean-up technologies affect the level of each constituent is needed, along with an analysis of cost implications. It would also be helpful if the industry could develop a rationale for fuel specifications and map a path forward that can be presented to ISO WG12. This information would be valuable input for R&D and code and standard development activities conducted by public and private sector organizations. It was suggested that CGA 5.3 could provide a starting point for this rationale. An objective basis for fuel specifications, e.g., minimizing the long-term cost of hydrogen to the consumer, should be the basis for a path forward. The API could provide a forum to develop the path forward.
DOE expeditiously addressed most of the concerns and issues raised by the fuel providers. The DOE team actively sought and received participation by experts from fuel providers, including all of those who participated in the teleconference. The team, in turn, formed a subgroup of experts to address fuel quality specifications from the perspective of fuel providers; a representative of a major energy company chaired the subgroup. A second subgroup of experts was formed to address, among other things, incorporating issues such as crossover of contaminants from the cathode and the effects of inert constituents, particularly with fuel recirculation (Sections 3.5 and 5.2). The issue of cost of purification to the levels required in the ISO and SAE specification was addressed primarily by ANL under the analysis effort described in Section 7. The key concern raised by fuel providers was the lack of standardized analytical methodologies sensitive enough to verify compliance with specifications as stringent as those included in the ISO and SAE standards as then under consideration. The effort to address this concern is described below.
8.2. ASTM Standardized Analytical Methods As recommended by fuel providers, the DOE team worked with ASTM to develop and validate priority standardized analytic test procedures needed to verify whether hydrogen fuel quality as specified in ISO TS 14687-2 and SAE J2719 has been met. Specifically, the team approached two experts to develop and validate these procedures: Dr. Raul Dominguez of the South Coast Air Quality Management District, then chair of the ASTM Committee D03 on Gaseous Fuels, and Jackie Birdsall, then with the CaFCP and then chair of ASTM Subcommittee D03.14 on Hydrogen and Fuel Cells. ASTM Committee D03 is responsible, among other things, for the development of terminology definitions, specifications, classifications, recommended practices, and methods of sampling, analysis, and testing relating to commercial gaseous hydrogen fuel. Dr. Dominguez was very supportive and prepared a plan to develop and validate priority standardized sampling and analysis procedures for the critical contaminants identified by the team.
DOE supported accelerated development and validation of these procedures through Subcommittee D03.14, which prepared and executed the standards whose status is listed in Table 8-1. All of the priority standards have been or are in the process of being published. These standards address the concern stated by fuel providers that standardized analytical methods are not available to measure the presence of contaminants in hydrogen at the levels specified in the ISO and SAE documents.
After the standards are published, they can be referenced by other standards development organizations, and both ISO TC197 WG12 and SAE have incorporated the ASTM standards by reference in their respective standards. Under ASTM procedures, published standards are validated for precision and bias by undergoing an inter-laboratory study program (ILS), in which the standard is tested by independent laboratories.65 As shown in Table 8-1, an ILS for D-7553-10 (Standard Test Method for Determination of Trace Gaseous Contaminants in Hydrogen Fuel by Fourier Transform Infrared [FTIR] Spectroscopy) is almost complete. An ILS for this standard was initiated first because it addresses both CO and NH3, two of the critical contaminants identified by the team. An ILS is time-consuming and requires laboratories with advanced instrumental capabilities to volunteer to participate. In addition, reference and sample gases have to be prepared and shipped to participating laboratories, and ASTM has to tabulate and analyze the resulting data. Even with DOE support, only one of the standards listed in Table 8-1 has undergone an ILS, and it is still unfinished almost two years after initiation. Validation of the ASTM standards is important and will require support from key stakeholders.
65 ASTM, ASTM E691 - 11 Standard Practice for Conducting an Interlaboratory Study to Determine the Precision of a Test Method, http://www.astm.org/DATABASE.CART/HISTORICAL/E691-11.htm.

HYDROGEN FUEL QUALITY SPECIFICATIONS FOR POLYMER ELECTROLYTE FUEL CELLS IN ROAD VEHICLES
54
Table 8-1. ASTM D04.14 status of priority standards for hydrogen fuel quality
Work Item Title Constituents (DL) Update (as of April 2016)
Published Standard Test Method for Determination of Trace Carbon Dioxide, Argon, Nitrogen, Oxygen and Water in Hydrogen Fuel by Jet Pulse Injection and Gas Chromatography/Mass Spectrometer Analysis
CO2 (0.5 ppm), nitrogen (5 ppm), argon (1 ppm),
oxygen (2 ppm), and water (1 ppm)
Published official item: D7649-10 ILS in process
Published Standard Practice for Sampling of High Pressure Hydrogen and Related Fuel Cell Feed Gases
Gaseous sampling Published official item: D7606-11
Published Standard Test Method for Determination of Ammonium, Alkali and Alkaline Earth Metals in Hydrogen and Other Cell Feed Gases by Ion Chromatography
Formic acid (low ppb to ppm)
Published official item: D7550-09
Published Standard Test Method for Sampling of Particulate Matter in High Pressure Hydrogen used as a Gaseous Fuel with an In Stream Filter
Particulate sampling Published official item: D7650-10
Revision complete,
resolution in process
Published Standard Test Method for Determination of Trace Gaseous Contaminants in Hydrogen Fuel by Fourier Transform Infrared (FTIR) Spectroscopy
Ammonia, CO2, CO, formaldehyde, formic acid, and water (defined by EPA 40 CFR Part 136 Appendix A “meet detection limits of
SAE TIR J2719”)
Published official item: D7653-10
ILS almost complete
21162 Standard Test Method for the Characterization of Particles from Hydrogen Fuel Streams by Scanning Electron Microscope
Particulates N/A
Published Standard Test Method for Visualizing Particulate Sizes and Morphology of Particles Contained in Hydrogen Fuel by Microscopy
Particulates Published official item: D7634-10
Published Standard Test Method for Gravimetric Measurement of Particulate Concentration of Hydrogen Fuel
Particulates Published official item: D7651-10
Document withdrawn for
revision
Published Standard Test Method for the Determination of Total Hydrocarbons in Hydrogen by FID Based Total Hydrocarbon (THC) Analyzer
Total hydrocarbons (0.1 ppm)
Published official item: D7675-11
23815 Determination of Total Halocarbons Contained in Hydrogen and Other Gaseous Fuels
Total halogenated compounds (“halocarbon
determination requirements contained in
SAE J2719” 0.1 ppb)
Being revised for main ballot
Published Standard Test Method for Determination of Trace Hydrogen Sulfide, Carbonyl Sulfide, Methyl Mercaptan, Carbon Disulfide and Total Sulfur in Hydrogen Fuel by Gas Chromatography and Sulfur Chemiluminescence Detection
Total sulfur (0.02 ppb) Published official item: D7652-11

55
HYDROGEN FUEL QUALITY SPECIFICATIONS FOR POLYMER ELECTROLYTE FUEL CELLS IN ROAD VEHICLES
Work Item Title Constituents (DL) Update (as of April 2016)
Published Standard Test Method for Determination of Total Organic Halides, Total Non-Methane Hydrocarbons and Formaldehyde in Hydrogen Fuel by Gas Chromatography/Mass Spectrometry
Trace hydrogen bromide, hydrogen chloride,
chlorine, and organic halides
Published official item: D7892-15
None Standard Practice for the Determination of Carbon Monoxide, Formaldehyde, Ammonia and Other Trace Substances in Hydrogen Fuel Streams by Laser Based Spectrometric Methods
CO, formaldehyde, ammonia (unknown)
N/A
None Field Sampling Apparatus All N/A
None Vehicle Fueling Interface Surface Particulate Matter Particulates N/A
8.3. Detection LimitsFrom the onset, the DOE team faced the question of whether analytical instruments could detect the presence of contaminants in hydrogen at the levels specified in the ISO and SAE standards. This question was also prominent in deliberations of ISO TC197 WG12 and the SAE J2719 Interface Working Group. To address this issue, WG12 developed Table 8-2, which lists the analytical instrumentation, their detection and determination limits,66 and test methods that provide standardized procedures to apply the instrumentation to measure the contaminants listed in ISO FDIS 14687-2. Also, as part of the demonstration of fuel cell vehicles and hydrogen fueling infrastructure, the JHFC (Section 6.2) provided verification that detection limits of analytical methods deployed at hydrogen fueling stations were sufficient to enable verification of fuel quality standards under consideration except for total halogenates (Table 8-3). These tables show that the detection and determination limits needed to verify compliance with the specifications of the ISO and SAE standards can be met. As pointed out by the ANL analysis (Section 7.3.3), however, the cost of sampling and verification remains an open issue and must be addressed as part of demonstration projects now underway or planned.
Table 8-2. Analytical methods and limits for ISO FDIS14687-2
Impurities [ISO limit]
Analytical methods μmol/mol
Detection limitμmol/mol
Determination limit Test methods
Water (H2O) [5 μmol/mol]
Dewpoint analyzer 0,5 1,7 JIS K0225
GC/MS with jet pulse injection
1 3 ASTM D7649-10 JIS K0123
GC/MS with direct injection
0,8 2,4 NPL Report AS 64
Vibrating quartz analyzer
0,02 0,07 JIS K0225
Electrostatic capacity type moisture meter
0,04 0,1 JIS K0225
FTIR 0,12 1
0,4 3
ASTM D7653-10 JIS K0117
Cavity ring-down spectroscopy
0,01 0,03 NPL Report AS 64
66 R. Lindstrom, NIST, “Limits for Qualitative Detection and Quantitative Determination,” n.d.

HYDROGEN FUEL QUALITY SPECIFICATIONS FOR POLYMER ELECTROLYTE FUEL CELLS IN ROAD VEHICLES
56
Impurities [ISO limit]
Analytical methods μmol/mol
Detection limitμmol/mol
Determination limit Test methods
Total hydrocarbons(C1 basis)[2 μmol/mol]
FID 0,1 0,3 ASTM D7675-11
GC/FID 0,01–0,1 0,03–1,0 JIS K0114
FTIR 0,01 0,03 JIS K0117
Oxygen (O2) [5 μmol/mol]
Galvanic cell O2 meter
0,01 0,03 JIS K0225
GC/MS with jet pulse injection
1 3 ASTM D7649-10
GC/PDHID 0,006 0,018 NPL Report AS 64
GC/TCD 3 9 NPL Report AS 64
Electrochemical Sensor
0,1 0,3 ASTM D7607-11
Helium (He) [300 μmol/mol]
GC/TCD 3–5 10–15 ASTM D1945-03 JIS K0114
GC/MS 10 30 JIS K0123
Nitrogen (N2), Argon (Ar) [100 μmol/mol]
GC/MS with jet pulse injection
5 (N2), 1 (Ar) 0,03
15 (N2), 3 (Ar) 0,1
ASTM D7649-10 JIS K0123
GC/TCD 1–3 3–10 JIS K0114
GC/PDHID 0,001 0,01 JIS K0114
Carbon dioxide (CO2) [2 μmol/mol]
GC/MS with jet pulse injection
0,5 0,01
1,5 0,03
ASTM D7649-10 JIS K0123
GC/FID – methanizer 0,01 0,03 JIS K0114
GC/PDHID 0,001 0,01 JIS K0114
FTIR 0,01 0,02
0,03 0,06
ASTM D7653-10 JIS K0117
Carbon monoxide (CO) [0.2 μmol/mol]
GC/FID with methanizer
0,01 0,03 JIS K0114
FTIR 0,01 0,1
0,03 0,3
ASTM D7653-10 JIS K0117
GC/PDHID 0,001 0,01 JIS K0114
Total sulfur compounds [0.004 μmol/mol]
IC with concentrator 0,0001–0,001 0,0003–0,004 JIS K0127
GC/SCD with concentrator
0.00002 0,001
0.00006 0,003
ASTM D7652-11 JIS K0114
GC/SCD without pre-concentration
0,001 0,003 NPL Report AS 64
Formaldehyde (HCHO) [0.01 μmol/mol]
DNPH/HPLC 0,002–0,01 0,006–0,03 JIS K0124
GC/PDHID 0,01 0,03 JIS K0114
FTIR 0,02 0,01
0,06 0,03
ASTM D7653-10 JIS K0117
Formic acid (HCOOH) [0.2 μmol/mol]
IC 0,001–1 0,002–0,01
0,003–3 0,006–0,03
ASTM D7550-09 JIS K0127
FTIR 0,02 0,01
0.06 0,03
ASTM D7653-10 JIS K0117

57
HYDROGEN FUEL QUALITY SPECIFICATIONS FOR POLYMER ELECTROLYTE FUEL CELLS IN ROAD VEHICLES
Impurities [ISO limit]
Analytical methods μmol/mol
Detection limitμmol/mol
Determination limit Test methods
Ammonia (NH3) [0.1 μmol/mol]
IC with concentrator 0,001–0.01 0,003–0.03 JIS K0127
FTIR 0,02 0,01
0,06 0,03
ASTM D7653-10 JIS K0117
Total halogenated compounds [0.05 μmol/mol]
IC with concentrator 0,05 0,17 JIS K0101, K0127
Maximum particulate concentration[1mg/kg]
Gravimetric 0,005 mg/kg 0,015 mg/kg ASTM D7651-10 JIS Z8813
Table 8-3. Analytical sampling and measurement of contaminants at H2 fueling stations in Japan
Note: DPM (dewpoint meter), GC-FID (gas chromatography-flame ionization detector), GC-TCD (gas chromatography-thermal conductivity detector), GC-MS (gas chromatography-mass spectrometer), IR (infrared spectrometry), IC (ion chromatography), DNPH/HPLC (dintrophenylhydrazine–high-performance liquid chromatography). See footnote 41 for source of information.
8.4. Quality AssuranceHydrogen fuel for PEM fuel cell vehicles presents unique issues for quality assurance. Unlike the situation for gasoline and diesel fuels, quality assurance for hydrogen fuel may be less demanding in that, for example, specifications are not needed from the U.S. Environmental Protection Agency (EPA) for air pollution reduction or by state and local governments for air quality improvement. On the other hand, the stringent limits on certain contaminants, such as total sulfur compounds at 0.004 ppm, require extremely sensitive analytical equipment and careful monitoring of fuel quality along the entire fuel chain from production to dispensing to conform to the ISO and SAE specifications. As described above, the team worked closely with ASTM D03.14 to develop and validate standardized methods and instrumentation to sample and analyze hydrogen fuel in a manner that would enable verification of fuel quality to these specifications.

HYDROGEN FUEL QUALITY SPECIFICATIONS FOR POLYMER ELECTROLYTE FUEL CELLS IN ROAD VEHICLES
58
As the ANL analysis noted, the cost of quality assurance can be significant (>2% of the fuel cost), depending on whether batch sampling and analysis or continuous on-site monitoring is used. Fuel providers can determine cost-effective pathways to meet quality assurance requirements for hydrogen fuel as they have done with conventional liquid fuels. Existing quality assurance practices of the industrial gas companies may be applicable and can, if needed, be modified to accommodate the commercial-scale use of hydrogen fuel.67 Lower-cost analytical instrumentation can also be developed. For example, LANL is developing a very sensitive and rapid-responding in-line hydrogen fuel quality analyzer based on stripping an impurity off a catalyst surface using an appropriate potential and/or high-frequency resistance measurements.
8.4.1. Near-Term Quality Assurance Considerations Although several contaminant species are of concern in hydrogen fuel and are considered to be acceptable only at levels specified in the ISO and SAE standards, analyses of all species at any one time is not necessarily required to define hydrogen acceptability. Likewise, monitoring only one species is impractical based on the variability of the hydrogen source and possible alterations that could occur when numerous sources could be used. However, a “fingerprint” set of key species, if selected correctly, may serve as a guide that would identify the possibility that any of the other contaminants may be present at levels higher than those acceptable.
It is unlikely that H2S will be present as a result of the SMR-PSA process because of the inherent damage to the process if sulfur was present in the natural gas. Furthermore, if the upstream removal of sulfur species failed for some reason, it is highly probable that any residual H2S would be removed by the sulfur scrubbing activity of the catalysts in the SMR reactors and the PSA units. Likewise, the level of NH3 due to N2 in the natural gas source undergoing SMR will most likely be removed first, along with the removal of water from the hydrogen product stream prior to PSA purification, and it is unlikely that NH3 would slip through the PSA at levels higher than allowed in the specifications. Removal of water and PSA operation are typically necessary to bring CO down to an acceptable level of 0.2 ppm, and under this process, N2 is typically held to the levels allowed in the specification.
If any of the cleanup processes were to be upset, one of the following species would appear to be too high and immediately call attention to an improper hydrogen fuel quality: CO, N2, O2, H2O. For example, levels of O2 and H2O higher than those allowable together with N2 and CO would suggest that the water dropout and PSA operations were not functioning properly and could, therefore, allow levels of H2S and NH3 to exceed the limits in the specifications. Likewise, any other source of contamination would likely produce an upset value of N2 and O2, since air, for example, would show a 4/1 ratio, definitely different from the 100 ppm N2 and 5 ppm O2 allowed (Table 1-1). Also, if the H2O level were higher than 5 ppm, the possibility of polar species such as H2S and NH3 slipping through would also be indicated. Therefore, CO, N2, O2, and H2O could be considered to be the “fingerprint” species for continuous monitoring and periodic analysis of hydrogen fuel, and such analysis could be conducted on an as-needed basis or at intervals that compromise neither the fuel quality nor the cost.
Fuel providers have expressed concern about the difficulty and expense of analyzing for helium, but monitoring hydrogen fuel for helium may not be required for several reasons. The presence of helium seems to be of concern only for natural gas feedstocks in North America, and the levels of helium recently found in these feedstocks are low enough that the allowable level in the specifications is unlikely to be exceeded. Also, helium is not a major concern for hydrogen storage, fuel cell operations, or hydrogen metrology at anticipated levels. Finally, as Dr. Voecks noted (Section 3.5.5), helium itself is a valuable commodity, and it is likely to be separated from natural gas at the wellhead, which reduces the likelihood of its presence, especially in significant amounts, in natural gas reformed to produce hydrogen fuel.
67 J. Reijerkerk, Linde Group, Commercial Hydrogen for FCV Projects, International Workshop on Fuel and Air Quality Issues in Fuel Cells, Berlin, Germany, September 9–11, 2009.

59
HYDROGEN FUEL QUALITY SPECIFICATIONS FOR POLYMER ELECTROLYTE FUEL CELLS IN ROAD VEHICLES
9. Summary and ConclusionISO and SAE have prepared hydrogen fuel quality standards based on available data and information. Both specifications in the ISO standard apply only to PEM fuel cells for road vehicles. The specifications are conservative and are intended for the pre-commercial demonstration phase of fuel cell vehicle and hydrogen fuel infrastructure development. To enable development of an international standard, DOE led and supported a team of experts who planned and executed a comprehensive, structured testing effort to determine the effects, especially degradation mechanisms, of various contaminants on fuel cell electrodes and membranes. Hydrogen production, purification, and delivery technologies were also evaluated to determine the technical and economic drivers that affect fuel quality and cost. Standard analytical procedures, including sampling and instrumentation to measure non-hydrogen fuel constituents to the levels required (sub-ppm for selected constituents), were also critical needs that were addressed by the team. Finally, implications of hydrogen fuel quality on the complexity, performance, and durability of fuel cell systems and upstream hydrogen infrastructure, as well as on the cost of hydrogen fuel, were assessed so that critical trade-offs can be better understood.
Beginning with a national workshop in 2004, DOE formed a team to obtain sufficient data to establish specifications that would balance PEM fuel cell performance and durability with hydrogen fuel costs that would allow for the required hydrogen quality while not deterring the commercial success of PEM fuel cell vehicles. The team focused on single-cell testing, fuel quality, and cost trade-offs for fuel production and purification, and analytical sampling and measurement. The team assumed that near-term storage would be primarily based on pressurized gaseous containers and that near-term hydrogen production and purification would be based on SMR and PSA, respectively.
Because testing for all of the non-hydrogen constituents included in the ISO and SAE standards would be too time-consuming and extremely expensive, the team defined a subset of those constituents that are likely to be the major technical and economic drivers of the trade-offs between fuel quality and cost, as discussed above. After much discussion among the team members, industry, and other ISO and SAE working group members, the team identified “critical constituents” upon which to focus the testing, modeling, and analysis: carbon monoxide (CO), sulfur (S) species, ammonia (NH3), methane (CH4) and other inert gases, and particulate matter (PM) under 10 microns in diameter. These constituents are those most likely to affect PEM fuel cell performance and durability as well as the cost of hydrogen produced by SMR and purified by PSA to the levels required by the ISO and SAE standards.
Given the two-fold nature of the problem, that is, the need to trade off fuel cell performance and durability against the cost of delivering clean hydrogen at the fuel dispenser, the team created two subteams to focus expertise on each aspect of the problem. Subteam 1 focused on single-cell testing and obtaining data on PEM fuel cell performance and the mechanisms of cell and material degradation due to the presence of selected critical non-hydrogen constituents in the fuel. Subteam 2 focused on the engineering aspects of fuel quality in both PEM fuel cell systems and in hydrogen production, purification, and delivery systems under realistic operating environments. Subteam 2 also addressed analytical methodology and instrumentation needs.
Subteam 1 worked to bound the effects of CO, starting with a baseline of low-level CO concentration at steady state and low loads to assess cumulative coverage on the catalyst. The testing provided essential data on rates of accumulation, degradation, and recovery of PEM fuel cells in an automotive environment from CO in a range of 0.1–10 ppm. Based on these tests, the subteam developed parametric performance descriptors, assessed projected performance for different conditions using validated empirical models, and conducted cyclic tests under changed conditions to test and validate projections. In parallel with the testing, the subteam searched the literature and compiled data from previous tests using a standard reporting format. The subteam also defined baseline test cells, identified commercially available MEAs, and developed a testing protocol and standardized data-reporting format. Much of this work was based on information available from industry, universities, and national laboratories and on publications of the (then) USFCC.

HYDROGEN FUEL QUALITY SPECIFICATIONS FOR POLYMER ELECTROLYTE FUEL CELLS IN ROAD VEHICLES
60
Subteam 2 worked in parallel with Subteam 1 to bound the production and purification trade-offs of hydrogen fuel containing CO levels of 0.1 to 10 ppm. The subteam prepared estimates of the cost of hydrogen by examining the recovery rates of hydrogen from SMR-PSA with CO in the range of levels given above. Subteam 2 established a relationship between CO concentration with respect to PSA breakthrough properties of other critical constituents (inerts, CH4, sulfur species, etc.) and estimated a rough order of magnitude of breakthrough of these constituents in relation to CO concentration for a baseline SMR-PSA system. The subteam also worked closely with ASTM to help develop and beta test the critical sampling and measurement methodologies and instruments needed.
After submission of a final draft technical specification (FDTS 14687-2) in 2006, the member countries of ISO TC197 WG12 continued to conduct testing in parallel with preparation of an international standard based on the FDTS. The key countries represented in WG12 are Canada, the European Union, Japan, Korea, and the United States. Identification of the critical constituents discussed above was a crucial step in defining a path forward and allowed the members of WG12 to focus resources for R&D, testing, and developing standard analytical methodologies and instrumentation. The team with Japanese experts also explored the use of one of the critical constituents, CO, as a potential “canary” species. As a canary species, the amount of CO in the fuel stream may serve as an indicator of the likely presence and concentrations of the other critical constituents (except PM).
A key meeting of WG12 took place in November 2006, during which its members agreed to pursue a collaborative effort between Canada, the European Commission (EC), Japan, Korea, and the United States based on the approach and preliminary documents presented by the DOE team. The WG12 members developed a consensus testing plan and a collaborative effort to obtain and share the data needed to modify the FDTS into an international standard. Although the focus of this report is on the work of the DOE team, the collaboration with research organizations of other WG12 member countries was critical in conducting testing in the most cost-effective way and in utilizing the expertise and research facilities of many nations. The collaboration established in developing the ISO and SAE standards provides an important foundation for continued testing, modeling, and analysis that will take place when these standards are revised.

61
HYDROGEN FUEL QUALITY SPECIFICATIONS FOR POLYMER ELECTROLYTE FUEL CELLS IN ROAD VEHICLES
Appendix A. Acronyms and Initialismsμ Micro°C Degrees CelsiusA AmpereAl AluminumANL Argonne National LaboratoryAPI American Petroleum Institute Ar ArgonASTM ASTM International (formerly the American Society for Testing and Materials)atm Atmosphere (unit of pressure)BOP Balance of PlantBOT Beginning of TestBr BromineBTU British Thermal Unit(s)C CarbonCaFCP California Fuel Cell PartnershipCDP Composite Data ProductCF Carbon FractionCFR Code of Federal RegulationsCGA Compressed Gas AssociationCH4 MethaneCl Chlorinecm Centimeter(s)CO Carbon MonoxideCO2 Carbon DioxideCr ChromiumDC Direct CurrentDNPH DinitrophenylhydrazineDOE U.S. Department of EnergyDPM Dewpoint MeterECSA Electrochemically Active Surface AreaEDX Energy Dispersive X-ray SpectroscopyEIS Electrochemical Impedance Spectroscopy EOT End of TestEPA U.S. Environmental Protection AgencyEW Equivalent WeightFCJHU Fuel Cells and Hydrogen Joint UndertakingFCTO Fuel Cell Technologies Office

HYDROGEN FUEL QUALITY SPECIFICATIONS FOR POLYMER ELECTROLYTE FUEL CELLS IN ROAD VEHICLES
62
FCTT Fuel Cell Tech TeamFCV Fuel Cell VehicleFDIS Final Draft International StandardFDTS Final Draft Technical SpecificationFID Flame Ionization DetectorFTIR Fourier Transform InfraredFQ Fuel QualityFY Fiscal Yearg Gram(s)GC/MS Gas Chromatography–Mass SpectrometryH HydrogenH2O WaterH2S Hydrogen SulfideHCHO FormaldehydeHCOOH Formic AcidHe HeliumHNEI Hawaii Natural Energy InstituteHPLC High-Performance Liquid ChromatographyHySUT Research Association of Hydrogen Supply/Utilization TechnologyIC Ion ChromatographyILS Inter-Laboratory Study (program)IPHE International Partnership for Hydrogen and Fuel Cells in the Economy IR Infrared SpectrometryIS International StandardISO International Organization for StandardizationIWG Interface Working GroupIV Current–Voltage (curve)JHFC Japan Hydrogen and Fuel Cell Demonstration ProjectJIS Japanese Industrial StandardsJRC-EC Joint Research Centre–European Commissionkg Kilogram(s)kPa Kilopascal(s)kPag Kilopascal(s) GaugeL Liter(s)LANL Los Alamos National LaboratoryLHV Lower Heating ValuemA Milliampere(s)MEA Membrane Electrode AssemblyMETI Ministry of Economy, Trade and Industry

63
HYDROGEN FUEL QUALITY SPECIFICATIONS FOR POLYMER ELECTROLYTE FUEL CELLS IN ROAD VEHICLES
Mg Magnesiummg Milligram(s)mol Mole(s)mpgge Miles Per Gallon Gasoline EquivalentmV Millivolt(s)MYRDDP Multi-Year Research, Development and Demonstration PlanN NitrogenND Not DetectedNG Natural GasNH3 AmmoniaNi NickelNOW Nationale Organisation WasserstoffNPL National Physical Laboratory (United Kingdom)NREL National Renewable Energy LaboratoryO OxygenOCV Open-Circuit VoltageOEM Original Equipment ManufacturerPa Pascal(s)PDHID Pulsed Discharge Helium Ionization DetectorPEM Polymer Electrolyte Membrane PEMFC Proton Exchange Membrane Fuel CellPM Particulate Matterppb Parts Per Billionppm Parts Per Millionppmv Parts Per Million by VolumePSA Pressure Swing Adsorptionpsi Pounds per Square Inchpsig Pounds per Square Inch GaugePt PlatinumPTFE PolytetrafluorethyleneR&D Research and DevelopmentRCS Regulations, Codes and StandardsRCSWG Regulations, Codes and Standards Working GroupRF Refueling StationRH Relative HumidityQA Quality AssuranceS SulfurS/C Steam-to-Carbon (molar ratio)SAE SAE International

HYDROGEN FUEL QUALITY SPECIFICATIONS FOR POLYMER ELECTROLYTE FUEL CELLS IN ROAD VEHICLES
64
sccm Standard Cubic Centimeters per MinuteSCD Sulfur Chemiluminescence Detectorscft Standard Cubic FeetSCS Safety, Codes and Standards (program)SEM Scanning Electron MicroscopySi SiliconSMR Steam Methane ReformingSR Steam ReformerSRNL Savannah River National LaboratoryT TemperatureTC Technical CommitteeTCD Thermal Conductivity DetectorTEM Transmission Electron Microscopy TIR Technical Information ReportTS Technical Specification UHP Ultra-High PureUSFCC U.S. Fuel Cell CouncilV Volt(s), VoltageWC Tungsten CarbideWG Working GroupWGS Water–Gas ShiftWHEC World Hydrogen Energy ConferenceZn Zinc

65
HYDROGEN FUEL QUALITY SPECIFICATIONS FOR POLYMER ELECTROLYTE FUEL CELLS IN ROAD VEHICLES
Appendix B. The Literature of Contaminant Effects on Fuel Cell PerformanceThis section covers existing literature pertaining to contaminant effects influencing performance of PEM fuel cell electrochemical reactors. This literature is large, and the citations listed below are but a part of that information set. They were selected to be particularly significant and discuss effects mainly resulting from chemical constituents in the anode feed stream, as well as those within that compartment which entered originally through the cathode feed. The citations are arranged by general topic and organized within each section chronologically. Readers should also refer to bibliographies included in ISO FDIS 14687-2 and SAE J2719.
A. Review PapersA1. Xuan Cheng, Zheng Shi, Nancy Glass, Lu Zhang, Jiujun Zhang, Datong Song, Zhong-Sheng Lu, Haijian Wang, Jun Shen, ”A Review of PEM hydrogen fuel cell contaminations: impacts, mechanisms, and mitigation” (review article), Journal of Power Sources, Volume 165, Issue 2, 2007, pages 739-756.
A2. H. Li, Z. Shi, J. Zhang, “Fuel Cells-Proton-membrane fuel cells | Impurities in Fuels and Air,” Encyclopedia of Electrochemical Power Sources, 2009, pages 941-950.
A3. Yun Wang, Ken S. Chen, Jeffrey Mishler, Sun Chan Cho, Xavier Cordobes Adroher, “A Review of polymer electrolyte membrane fuel cells: technology, applications, and needs on fundamental research,” Applied Energy, Volume 88, 2011, pages 981-1007.
A4. Nada Zamerl, Xianguo Li, “Effects of contaminants on polymer electrolyte membrane fuel cells,” Progress in Energy and Combustion Science, Volume 37, pages 292-329.
B. Effects of Carbon Oxides, CO and CO2B1. R. Borup, D.Sauer, E. Stuve, “Electrolyte interactions with vapor dosed and solution dosed carbon monoxide on platinum (111),” Surface Science, Volume 374, 1997, pages 142-150.
B2. M. Inbody, J. Hedstrom, J. Tofoya, K. Stroh, N. Vanderborgh, “Transient carbon monoxide control for PEM fuel cell systems,” 1998 Fuel Cell Seminar, Palm Springs, CA.
B3. Masataka Kadoaki, Shunsuke Taniguchi, T. Matsubayashi, Yukinori Akiyama, Yasuo Miyake, Koji Nishio, Kenji Kohno, “Influence of reformed gas on PEFC performance,” 1998 Fuel Cell Seminar, Palm Springs, CA.
B4. K. A. Friedrich, M. Huber, L. Carrette, U. Stimming, “Improvement of the CO tolerance of PEM fuel cells by pulsing the anode potential,” 2000 Fuel Cell Seminar, Abstracts, pages 31-34.
B5. M. A. Inbody, R, L. Borup, J. C. Hedstrom, J. Tafoya, B. L. Morton, “Transient Carbon Monoxide Control for PEMFC automotive applications,” 2000 Fuel Cell Seminar, pages 86-89.
B6. F. Hajbolouri, B. Andreaus, G G. Scherer, A. Wokaun, “Temperature dependence of CO-poisoning in a polymer electrolyte fuel cell,” 2002 Fuel Cell Seminar, pages 251-254.
B7. P. Liu, A. Logadottir, J. K. Nørskov, “Modeling the electro-oxidation of CO and H2/CO on Pt, Ru, PtRu and Pt3Sn,” Electrochimica Acta, 107, 2003, pages 3731-3742.
B8. F. Hajbolouri, B. Andreaus, G G. Scherer, A. Wokaun, “Temperature dependence of CO-poisoning in a polymer electrolyte fuel cell,” 2002 Fuel Cell Seminar, pages 251-254.
B9. K.Narusawa, M. Hayashida, U. Kamiya, H. Roppongi, D. Kurashima, K. Wakabayashi, “Deterioration in fuel cell performance resulting from hydrogen fuel containing impurities: poisoning effects of CO, CH4, HCHO and HCOOH,” Japanese Society of Automotive Engineers (JSAE), Review, 24.1, 2003, pages 41-46.

HYDROGEN FUEL QUALITY SPECIFICATIONS FOR POLYMER ELECTROLYTE FUEL CELLS IN ROAD VEHICLES
66
B10. G. J. M. Janssen, “Modeling study of CO2 poisoning on PEFC anodes,” Journal of Power Sources, Volume 136, 2004, pages 45-54.
B11. C. Huang, R. Jiang, M. Elbaccouch, N. Muradov, J. Fenton, “On-board removal of CO and other impurities in hydrogen for PEM fuel cell applications,” Journal of Power Sources, Volume 162, 2006, pages 563-571.
B12. F. A. De Bruijn, D. C. Papageorgopoulos, E. F. Sitters, G. J. M. Janssen, “The influence of carbon dioxide on PEM fuel cell anodes,” Journal of Power Sources, Volume 110, 2007, pages 117-124.
B13. R. K. Ahluwalia, X. Wang, “Effect of CO and CO2 impurities on performance of direct hydrogen polymer-electrolyte fuel cells,” Journal of Power Sources, Volume 180, 2008, pages 122-131.
B14. Nada Zamel, Xianguo Li, “Transient analysis of carbon monoxide poisoning and oxygen bleeding in a PEM fuel cell anode catalyst layer,” International Journal of Hydrogen Energy, Volume 33, 2008, pages 1335-1344.
B15. W-M Yan, H-S Chu, M-X Lu, F-B. Weng, G-B Jung, C-Y Lee, “Degradation of proton exchange membrane fuel cells due to CO and CO2 poisoning,” Journal of Power Sources, Volume188, 2009, pages 141-147.
B16. Georgeta Postole, Simona Bennici, Aline Auroux, “Calorimetric study of the reversibility of CO pollutant adsorption on high loaded Pt/carbon catalysts used in PEM fuel Cells,” Applied Catalysis B: Environmental, Volume 92, pages 307-317.
B17. Jean St-Pierre, “PEMFC contaminant tolerance limit—CO in H2,” Electrochemical Acta, Volume 55, 2010, pages 4208-4211.
B18. Jack Z. Zang, Zhiming Liu, et al., The effect of low concentrations of CO on H2 adsorption and activation on Pt/C. Part 1: in the absence of humidity,” Journal of Power Sources, Volume 195, 2010, pages 3060-3068.
B19. Jack Z. Zhang, Kitiya Hongsrikam, et al., “The effects of low concentration of CO on H2 adsorption and activation on Pt/C:Part 2—In the presence of H2O vapor,” Journal of Power Sources, Volumes 196, pages 6186-6195.
B20. Jenny E. Hu, Zhufang Liu, et al., “CO tolerance of nano-architectured Pt-Mo anode electrocatalysts for PEM fuel cells,” International Journal of Hydrogen Energy, Volume 37, 2012, pages 11268-11275.
B21. J. Uribe-Godinez and O. Jiménez-Sandoval, “Study of the electrocatalytic properties of Ir4(CO)12 for the oxygen reduction and hydrogen oxidation reactions, in the absence and presence of fuel cell contaminants,” International Journal of Hydrogen Energy, Volume 37, 2012, 9477-9484.
C. Effects of Sulfur CompoundsC1. J. M. Moore, P. L. Adcock, J. B. Lakeman, G. O. Mepsted, “The effects of battlefield contaminants on PEMFC performance,”Journal of Power Sources, Volume 85, 2000, pages 254-260.
C2. Y. Wang, H. Yan, E. Wang, “The electrochemical oxidation and the quantitative determination of hydrogen sulfide on a solid polymer electrolyte-based system,” Journal of Electroanalytical Chemistry, Volume 497, 2001, pages 163-167.
C3. R. Mohtadi, W. Lee, S. Cowan, J. vanZee, M. Murthy, “Effects of hydrogen sulfide on the performance of a PEMFC,” Electrochemistry and Solid State Letters, Volume 6, 2003, pages 272-274.
C4. R. Mohtadi, W.-K. Lee, J. W. VanZee, “The effect of temperature on the adsorption rate of hydrogen sulfide on Pt anodes in a PEMFC,” Applied Catalysis B: Environmental, Volume 56, 2005, pages 226-232.
C5. John P. Kopasz, “Fuel cells and odorants for hydrogen,” International Journal of Hydrogen Energy, Volume 32, 2007, pages 2527-2531.

67
HYDROGEN FUEL QUALITY SPECIFICATIONS FOR POLYMER ELECTROLYTE FUEL CELLS IN ROAD VEHICLES
C6. I. G. Urdampilleta, F.A. Uribe, T. Rockward, E. L. Brosha, B. S. Pivovar, F. H. Garzon, “PEMC poisoning with H2S, dependence on operating conditions,” ECS Transactions, Volume 11, 2007, pages 831-842.
C7. A. A. Shah, F. C. Walsh, “A model for hydrogen sulfide poisoning in proton exchange membrane fuel cells,” Journal of Power Sources, 2008, Volume 135, pages 287-301.
C8. Z. Shi, D. Song, J. Zhang, Z.X. Liu, S. Knights, R. Vhora, et al.,”Transient analysis of hydrogen sulfide contamination on the performance of a PEM fuel cell,” Journal of Power Sources, Volume 185, 2008, pages 287-301.
C9. Benjamin D. Gold, Olga Baturina, et al., “Deactivation of Pt/VC proton exchange membrane fuel cell cathodes by SO2, H2S and COS,” Journal of Power Sources, Volume 188, 2009, pages 89-95.
C10. Junxiang Zhai, Ming Hou, et al., “Study of sulfur dioxide crossover in proton exchange membrane fuel cells,” Journal of Power Sources, Volume 196, 2011, pages 3172-3177.
C11. Thiago Lopes, Valdecir A. Paganin, Ernesto R. Gonzlez, “Hydrogen sulfide tolerance of palladium-coper catalysts for PEM fuel cell anode applications,” International Journal of Hydrogen Energy, Volume 36, 2011, pages 13703-13707.
C12. J. Zhai, M. Hou, H. Zhang, Z. Zhou, J. Fu, Z. Shao, B Yi, “Study of sulfur dioxide crossover in proton membrane fuel cells,” Journal of Power Sources, Volume 196, 2011, pages 3172-3177.
C13. Junxiang Zhai, Ming Hou, et al., “Investigation on the electrochemical removal of SO2 in ambient air for proton exchange membrane fuel cells,” Electrochemistry Communications, Volume 18, 2012, pages 131-134.
C14. Thiago Lopes, Valdecir, A. Paganin, et al., “Hydrogen sulfide tolerance of palladium-copper catalysts for PEM fuel cell anode applications,” International Journal of Hydrogen Energy, Volume 36, 2011, pages 13703-13707.
D. Effects of Nitrogen CompoundsD1. D. Yang, J. Ma, L. Xu, M. Wu, H. Wang, “The effect of nitrogen oxides in air on the performance of proton exchange membrane fuel cell,” Electrochimica Acta, 2006 Volume 51, pages 4039-4044.
D2. R. K. Ahluwalia, X. Wang, “Buildup of nitrogen in direct hydrogen polymer-electrolyte fuel cell stacks,” Journal of Power Sources, Volume 171, 2007, pages 63-71.
D3. X. Zhang, U. Pasaogullari, T. Molter, “Influence of ammonia on membrane-electrode assemblies in polymer electrolyte fuel cells,” International Journal of Hydrogen Energy, Volume 34, 2009, pages 9188-9194.
D4. Lopes Thiago, Chlistunoff Jerzy, Sansinena Jose-Maria, et al., “Oxygen reduction reaction on a Pt/carbon fuel cell catalyst in the present of trace quantities of ammonium ions: An RRDE study,” International Journal of Hydrogen Energy, Volume 37, 2012, pages 5202-5207.
D5. Lopes Thiago, Kim Dae Sik, Kim Yu Seung, et al., “Ionic transport and water vapor uptake of ammonium exchanged perfluorosulfonic acid membranes,” Journal Electrochemical Society, Volume 159, 2010, pages B265-B269.
D6. Kitiya Hongsirikarn, James G. Goodwin Jr., et al., “Influence of ammonia on the conductivity of Nafion membranes,” Journal of Power Sources, Volume 195, 2010, pages 30-38.
D7. Yoshiyuki Hashimasa, Yoshiyuki Matsuda, et al., “PEFC power generation performance degradation by hydrogen sulfide and ammonia – effects of lowering platinum loading,” Electrochemistry, Volume 79, 2011, pages 343-345.
D8. X. Zhang, U. Pasaogullari, T. Molter, “Influence of ammonia on membrane assemblies in polymer electrolyte fuel cells,” International Journal of Hydrogen Energy, Volume 35, 2011, pages 9188-9194.

HYDROGEN FUEL QUALITY SPECIFICATIONS FOR POLYMER ELECTROLYTE FUEL CELLS IN ROAD VEHICLES
68
E. Effects of CationsE1. B. Kienitz, H. Baskaran, T. Zawodzinski Jr., “Modeling the steady state effects of cationic contamination on polymer electrolyte membranes,” Electrochemical Acta, Volume 54, 2009, pages 1671-1679.
E2. Hui Li, Ken Tsay,et al., “Durability of PEM fuel cell cathode in the presence of Fe+++ and Al+++,” Journal of Power Sources, Volume 195, 2010, pages 8089-8093.
E3. Hui Li, Ken Tsay, et al., “Effects of Co++ on oxygen reduction reaction catalyzed by Pt catalyst, and its implications for fuel cell contamination,” Electrochimica Acta, Volume 55, 2010, pages 2622-2628.
E4. J. St-Pierre, “PEMFC contaminant tolerance limit—foreign cations in ionomers,” International Journal of Hydrogen Energy, Volume 36, 2011, pages 5527-5535.
E5. B. Kienitz, B. Pivovar, T. Zawodzinski, “Cationic contamination effects on polymer electrolyte membrane fuel cell performance,” Journal of the Electrochemical Society, 1589, 2011, pages B1175-B1183.
E6. Jean St-Pierre, “Foreign cation exchange with ionomer protons,” Journal of Power Sources, 196, 2011, pages 6274-6283.
E7. Karel Bouzek, Martin Paidar, Jakub Malis, Ivo Jakubec, Ludek Janik, “Influence of hydrogen contamination by mercury on the lifetime of the PEM-type fuel cell,” Electrochemical Acta, Volume 56, 2010, pages 889-895.
E8. Mustafa F. Serincan, Ugur Pasaogullari, et al, “Modeling the cation transport in an operating polymer electrolyte fuel cell (PEFC),” International Journal of Hydrogen Energy, Volume 35, 2010, pages 5539-5551.
E8. Jean St-Pierre, “PEMFC contaminant tolerance limit—foreign cations in ionomers,” International Journal of Hydrogen Energy, 36, 2011, pages 5527-5535.
E10. B. Kienitz, B. Pivovar, T. Zawodzinski, “Cationic contamination effects on polymer electrolyte membrane fuel cell performance,” Journal of the Electrochemical Society, 1589, 2011, pages B1175-B1183.
E11. Jean St-Pierre, “Foreign cation exchange with ionomer protons,” Journal of Power Sources, Volume 196, 2011, pages 6274-6283.
F. Effects of ChlorideF1. D. Strmcnik, M. Gaberscek, S. Hocevar, J. Jamnik, “The effect of halide impurities and Nafion on electro-oxidation of CO on platinum,” Solid State Ionics, Volume 176, 2005, pages 1759-1763.
F2. S. Ali, Q. Li, C. Pan, J. Jensen, L. Nielsen, P. Møller, “Effect of chloride impurities on the performance and durability of polybenzimidazole-based high temperature membrane fuel cells,” International Journal of Hydrogen Energy, Volume 36, 2011, pages 1628-1636.
F3. Hui Li, Haijiang Wang et. al., “Chloride contamination effects on proton exchange membrane fuel cell performance and durability,” JJournal of Power Sources, Volume 196, 2011, pages 6249-6255
F4. Hui Li, H. Wang, W. Qian, S. Zhang, S. Wessel, T. Cheng, J. Shen, S. Wu., “Chloride contamination effects on proton exchange membrane fuel cell performance and durability,” Journal of Power Sources, Volume 196, 2011, pages 6249-6255.
F5. W-M. Yan, H-S Chu, Y-L Liu, L. Chen, J-H Jang, “Effects of chlorides on the performance of proton exchange membrane fuel cells,” International Journal of Hydrogen Energy, Volume 36, 2011, pages 5435-5441.
F6. Hui Li, Shengsheng Zheng, et al., “Impacts of operating conditions on the effects of chloride contamination on PEM fuel cell performance and durability,” Journal of Power Sources, Volume 218, 2012, pages 375-382.

69
HYDROGEN FUEL QUALITY SPECIFICATIONS FOR POLYMER ELECTROLYTE FUEL CELLS IN ROAD VEHICLES
G. Effects of Organic CompoundsG1. Hui Li, J. Zhang, K. Fatih, Z. Wang, Y. Tang, Z. Shi, S. Wu, D. Song, J. Zhang, N. Jia, S. Wessel, R. Abouatallah, N. Joos, “Polymer electrolyte membrane fuel cell contamination: testing and diagnosis of toluene-induced cathode degradation,” Journal of Power Sources, Volume 185, 2008, pages 272-279.
G2. Katrin Kortsdottir, Rakel W. Lindström, et al., “Influence of toluene contamination at the hydrogen Pt/C anode in a proton exchange membrane fuel cell,” Electochimica Acta, Volume 55, 2010, pages 7643-7651.
G3. Xiaoyu Zhang, et. al., “Influence of Formic Acid Impurity on Proton Exchange Membrane Fuel Cell Performance,” Journal of the Electrochemical Society, Volume 157, 2010, pages B409-B414.
G4. Jack K. Zhang, Hector R. Colon-Mercado, James G. Goodwin Jr., “The effect of low concentrations of tetrachloroethylene on H2 adsorption and activation on Pt in a fuel cell catalyst,” Journal of Power Sources, Volume 196, 2011, pages 8391-8397.
G5. Katrin Kortsdottir, Rakel W. Lindström, et al., “The influence of ethene impurities in the gas feed of a PEM fuel cell,” International Journal of Hydrogen Energy, October 2012 (in press).
H. Models that Explore Contaminant Degradation MechanismsH1. T. Okada, “Theory for water management in membranes for polymer electrolyte fuel cells: “Part 1. The effect of impurity ions at the anode side of the membrane performances,” Journal of Electroanalytical Chemistry, Volume 456, 1999, pages 1-17.
H2. T. Okada, “Theory for water management in membranes for polymer electrolyte fuel cells, Part 2,” The effect of impurity ions at the cathode side of the membrane performances,” Journal of Electroanalytical Chemistry, Volume 456, 1999, pages 18-29.
H3. M. A. Rubio, A. Urqula, et al., “Diagnosis of performance degradation phenomena in PEM fuel cells,” International Journal of Hydrogen Energy, Volume 35, 2001, pages 2586-2590.
H4. Shanna D. Knights, Keven M. Colbow, Jean St-Pierre, David P. Wilkinson, “Aging mechanisms and lifetime of PEFC and DMFC,” Journal of Power Sources, Volume 127, 2004, pages 127-134.
H5. R. Mohtadi, W-K. Lee, J. Van Zee, “Assessing durability of cathodes exposed to common air impurities,” Journal of Power Sources, Volume 18, 2004, pages 216-225.
H6. W-M. Yan, C-Y. Soong, F. Chen, H-S. Chu, “Transient analysis of reactant gas transport and performance of PEM fuel cells,” Journal of Power Sources, Volume 143, 2005, pages 48-56.
H7. J. Zhang, H. Wang, D. Wilkinson, D. Song, J. Shen, Z-S. Liu, “Model for the contamination of fuel cell anode catalyst in the presence of fuel stream impurities,” Journal of Power Sources, Volume 147, 2005, pages 58-71.
H8. W-M. Yan, C-Y. Soong, F. Chen, H-S. Chu, “Transient analysis of reactant gas transport and performance of PEM fuel cells,” Journal of Power Sources, Volume 143, 2005, pages 48-56.
H9. Zheng Shi, Datong-Song, Hui Li, Khalid Fatih, Yanghua Tang, Jianlu Zhang, Zhenwei Wang, Shaohong Wu, Zhong-Sheng Liu, Haijang Wang, Jiujun Zhang, “A general model of air-side proton exchange membrane fuel cell contamination,” Journal of Power Sources, Volume 186, 2008, pages 435-445.
H10. Dennis D. Papadias, Shabbir Ahmed, Romesh Kumar, Fred Joseck, “Hydrogen quality for fuel cell vehicles - A modeling study of the sensitivity of impurity content in hydrogen to the process variables in the SMR-PSA pathway,” International Journal of Hydrogen Energy, Volume 34, 2009, pages 6021-6035.
H11. S. Chen, H. A. Gasteiger, K. Hayakawa, T. Tada, Y. Shao-Horn, “Platinum-Alloy Cathode Catalyst Degradation in Proton Exchange Membrane Fuel Cells: Nanometer-Scale Compositional and Morphological Changes,” Journal Electrochemical Society, Volume 157, 2010, pages A82-A97.

HYDROGEN FUEL QUALITY SPECIFICATIONS FOR POLYMER ELECTROLYTE FUEL CELLS IN ROAD VEHICLES
70
H12. Jean St-Pierre, “Proton exchange membrane fuel cell contamination model: competitive adsorption followed by a surface segregated electrochemical reaction leading to an irreversibly adsorbed product,” Journal of Power Sources, Volume 195, 2010, pages 6379-6388.
H13. Georgeta Postole, Aline Auroux, “The Poisoning of Pt/C catalysts used in PEM fuel cells by the hydrogen feed gas impurities: The bonding strength,” International Journal of Hydrogen Energy, Volume 36, 2011, pages 6817-6825.
H14. Jean St-Pierre, Yunfeng Zhai, Michael Angelo, “Quantitative ranking criteria for PEMFC contaminants,” International Journal of Hydrogen Energy, Volume 37, 2012, pages 6784-6789.
H15. R. Jia, S. Dong, T. Hasegawa, J. Ye, R. Dauskardt, “Contamination and moisture absorption effects on the mechanical properties of catalyst coated membranes in PEM fuel cells,” International Journal of Hydrogen Energy, Volume 37, 2012, pages 6790-6797.
I. General Reports on Fuel Cell Performance Changes Resulting from ContaminantsI1. J. Jones, J. Cox, “The effect of oxygen-supply impurities on the performance of a hydrogen oxygen fuel cell,” Energy Conversion, Volume 8, 1968, pages 113-114.
I2. K. Weisbrod, N. Vanderborgh, “Effect of operating parameters and anode gas impurities upon polymer electrolyte fuel cells,” Paper # 94-4074, AIAA 29th Intersociety Energy Conversion Engineering Conference, August 1994.
I3. T. Zawodzinski, J. Bauman, S. Savett, T. Springer, F. Uribe, and S. Gottesfeld, “Reformate tolerance in polymer electrolyte fuel cells: experimental and modeling studies,” 1998 Fuel Cell Seminar, Palm Springs, CA
I4. R. Mohtadi, W-K Lee, J. W. vanZee, “Assessing durability of cathodes exposed to common air impurities,” Journal of Power Sources Volume 85, 2000, pages 216-225.
I5. S. Sakamoto, M. Karakane, H. Maeda, Y. Miyake, T. Susai, “Study of the factors affecting PEFC life characteristic,” 2000 Fuel Cell Seminar, pages 141-144.
I6. T. Matsubayaski, S. Suzuki, M. Morita, S. Sakamoto, A Hamada, and H. Izaki, “Influence of operating conditions on the performance of polymer electrolyte Fuel Cell,” 2002 Fuel Cell Seminar, pages 129-132.
I7. S. Knights, N. Jia, C. Chuy, J. Zhang, “Fuel Cell Reactant Contaminants,” 2005 Fuel Cell Seminar, pages 121-124.
I8. E. Brosha, F. Garzon, B. Pivovar, T. Rockward, J. Valerio, F. Uribe, “Effect of fuel and air impurities on PEM fuel cell performance,” U.S. Department of Energy 2005 Hydrogen, Fuel Cells, and. Infrastructure Technologies Program Review, May 25, 2005.
I9. T. Rockward, I. G., Urdampilleta, F. A. Uribe, El L. Borsha, B. S. Pivovar, F. H. Garzon, “The effects of multiple contaminants on polymer electrolyte fuel cells,” Electrochemical Society Transactions, Volume 11, pages 821-829.
I10. F. Garzon, “Effects of fuel and air impurities on PEM fuel cell performance,” 2008 Department of Energy Program Review, June 2008.
I11. F. Jing, M. Hou, W. Shi, J. Fu, H. Yu, P Ming, “The effect of ambient contamination on PEMFC performance,” Journal of Power Sources, Volume 166, 2007, pages 172-176.
I12. D. D. Papadias, S. Ahmed, R. Kumar, “Fuel Quality Effects on Stationary Fuel Cell Systems,” 2011 Hydrogen Program Annual Merit Review Meeting, Arlington, VA., May 2011.

71
HYDROGEN FUEL QUALITY SPECIFICATIONS FOR POLYMER ELECTROLYTE FUEL CELLS IN ROAD VEHICLES
I13. E. Brosha, F. Garzon, R. Mukundan, C. Padro, T. Rockward, “Hydrogen Fuel Quality: The Year in Review,” U.S. Department of Energy Program Review, June 2008.
I14. H. Hongsirikarn, X. Mo, J. Goodwin, “Esterification as a diagnostic tool to predict proton conductivity affected by impurities on Nafion components for proton exchange membrane fuel cells,” Journal of Power Sources, Volume 195, 2010, pages 3416-3424.
I15. B. Besancon, V.Hasanov, R. Imbault-Lastapis, R. Benesch, M. Barrio, M. Mølnvik, “Hydrogen quality from decarbonized fossil fuels to fuel cells,” International Journal of Hydrogen Energy, Volume 34, 2009, pages 2350-2360.
I16. R. Jia, S. Dong, T. Hasegawa, J. Ye, R. Dauskardt, “Contamination and moisture absorption effects on the mechanical properties of catalyst coated membranes in PEM fuel cells,” International Journal of Hydrogen Energy, Volume 37, 2012, pages 6790-6797.
I17. W-M. Yan, C-Y. Soong, F. Chen, H-S. Chu, “Transient analysis of reactant gas transport and performance of PEM fuel cells,” JJournal of Power Sources, Volume 143, 2005, pages 48-56.
I18. F. Ettingshausen, J. Kleemann, M. Micel, M. Quintus, H. Fuess, C. Roth, “Spatially resolved degradation effects in membrane-electrode-assemblies of vehicle aged polymer electrolyte membrane fuel cell stacks,” Journal of Power Sources, Volume 194, 2009, pages 899-907.
I19. C. Bas, N.D. Albérola, L. Flandin, “Effects of contaminant on thermal properties in perfluorinated sulfonic acid membranes,” Journal of Membrane Science, Volume 263, 2010, pages 67-71.
I20. C. Macomber, H. Wang, K. O’Neill, “Identifying leachant contaminants and degradation schemes of fuel cell systems components, leading to effects on performance,” Abstracts of Papers of the American Chemical Society, 242, 342-Fuel, August 2011.
I21. H. Wang, C. Macomber, K, O. Neill, “Effect of PEMFC system contaminants on the performance of catalyst,” Abstracts of Papers of the American Chemical Society, 242, 406-Fuel, August 2011.
I22. R. Jia, S. Dong, T. Hasegawa, J. Ye, R. Dauskardt, “Contamination and moisture absorption effects on the mechanical properties of catalyst coated membranes in PEM fuel cells,” International Journal of Hydrogen Energy, Volume 37, 2012, pages 6790-6797.
J. Standards and Testing Protocols:J1. J. Ohi, B. Bailey, “Fuels for PEM fuel cells,” 1998 Fuel Cell Seminar, Palm Springs, CA.
J2. S. D. Sharma, “Fuels—Hydrogen Production | Gas Cleaning: Pressure Swing Adsorption,” Encyclopedia of Electrochemical Power Sources, 2009, pages 335-349.
J3. S. D. Sharma, J. N. Carras, “Fuels—Hydrogen production production | Gas Cleaning: Barrier Filters,” Encyclopedia of Electrochemical Power Sources, 2009, pages 313-318.
J4. G. Bender, M. Angelo, K. Bethune, S. Dorn, T. Thampan, R. Rocheleau, “Method using gas chromatography to determine the molar flow balance for proton exchange membrane fuel cells exposed to impurities,” Journal of Power Sources, Volume 193, 2009, pages 713-722.
J5. J. Zhang, R. Carter, P. Yu, F. Wagner, H. Gasteiger, “Fuel Cells – Proton Exchange Membrane Fuel Cells | Catalysts: Life-limiting considerations,” Encyclopedia of Electrochemical Power Sources, 2009, pages 626-638.
J6. Shabbir Ahmed, Sheldon H. D. Lee, Dionissios D. Papadias, “Analysis of trace impurities in hydrogen: Enrichment of impurities using a H2 selective permeation membrane,” International Journal of Hydrogen Energy, Volume 35, 2010, pages 12480-12490.

HYDROGEN FUEL QUALITY SPECIFICATIONS FOR POLYMER ELECTROLYTE FUEL CELLS IN ROAD VEHICLES
72
J7. Julie Cairns, “North American and international hydrogen/fuel cell standards,” International Journal of Hydrogen Energy, Volume 35, 2010, pages 2767-2771.
J8. Carl Rivkin, Chad Blake, Robert Burgess, William J. Buttner, and Matthew B. Post, “A national set of hydrogen codes and standards for the United States,” International Journal of Hydrogen Energy, Volume 36, Issue 3, pages 2736-2741.
J9. Xiao-Zi Yuan, Hui Li, et al., “A review of polymer membrane fuel cell durability test protocols,” Journal of Power Sources, Volume 196, 2011, pages 9107-9116.
J10. Ali Mokmeli, Saeed Asghari, “An Investigation into the effect of anode purging on the fuel cell performance,” International Journal of Hydrogen Energy, Volume 35, September 2010, pages. 9276-9282.
J11. Jong Pyng Hsu, “Recommended pre-operation cleanup procedures for hydrogen fueling station,” International Journal of Hydrogen Energy, Volume 37, 2012, pages 1770-1780.


DOE/EE-1493 • November 2016
For more information, visit: hydrogenandfuelcells.energy.gov