Embed Size (px)
Citation preview

5/16/2018 Hydrocarbon Processing February 2012 - slidepdf.com
http://slidepdf.com/reader/full/hydrocarbon-processing-february-2012 1/93
Unlike a phony cowboy who is all hat with no
cattle, a boiler from RENTECH will pass muster
Each boiler is designed and built to meet its demanding specifications and operate in its uniqu
conditions in a variety of industries, including refining, petro-chemical and power generatioOur quality control system assures you that RENTECH boilers are safe, reliable and efficient.
For a real, genuine, original boiler, you can depend on RENTECH. Honestly.
WWW.RENTECHBOILERS.COM
Select 52 at www.HydrocarbonProcessing.com/RS

5/16/2018 Hydrocarbon Processing February 2012 - slidepdf.com
http://slidepdf.com/reader/full/hydrocarbon-processing-february-2012 2/93
FEBRUARY 2012
HPIMPACT SPECIALREPORT TECHNOLOGY
CLEAN FUELSCLEAN FUELS
Innovative methodsInnovative methodsoptimize clean dieseloptimize clean diesel
productionproduction
Bio-based polymersBio-based polymerscould be the nextcould be the nextbig thingbig thing
European pipelineEuropean pipeline performanceperformance
Eliminate cavitation Eliminate cavitation your piping systemyour piping system
Treat oily waste viaTreat oily waste via
centrifuge plantscentrifuge plants
www.HydrocarbonProcessing.com

5/16/2018 Hydrocarbon Processing February 2012 - slidepdf.com
http://slidepdf.com/reader/full/hydrocarbon-processing-february-2012 3/93
Select 55 at www.HydrocarbonProcessing.com/RS

5/16/2018 Hydrocarbon Processing February 2012 - slidepdf.com
http://slidepdf.com/reader/full/hydrocarbon-processing-february-2012 4/93
SPECIAL REPORT: CLEAN FUELS
41ViewpointKey representatives from the energy industry present their insight on how
to achieve balanced energy policy, what is the future for alternative fuels,what part will renewable/biofuels play in the transportation fuel mix, and more
51Consider total value when optimizing catalytic cracking unitsLow rare-earth catalysts balance activity and selectivity against cost
S. Ismail
57Increase energy efficiency for your refineryBehavioral and organization changes are needed to effectively maximize operating profits
Z. Milosevic
61Use advanced catalysts to improve xylenes isomerizationThis refiner wanted to increase ethylbenzene conversion while limiting aromatics losses
G. Shouquan and J. Chua
65
Improve diesel quality through advanced hydroprocessing
New upgrading technologies help meet fuel quality specificationsC. Peng, X. Huang, T. Liu, R. Zeng, J. Liu and M. Guan
69Debottleneck crude-unit preheat exchangernetwork inefficienciesSimulation models can be effectively used to optimizeheat transfer and boost operational performance
E. Bright, S. Roy and S. Al-Zahrani
Cover During the 1940s, the focus
of the US refining industry shiftedto producing quality transportationand aviation fuels needed by themilitary. The US federal governmentsponsored several constructionprojects to increase refining capacityto support war efforts on twodifferent fronts. This expansionprogram involved the constructionof fluid catalytic cracking units(FCCUs)—a process needed to blend100-octane aviation fuel—along withthe building of new isomerizationand alkylation units. Over $900million was invested in refiningconstruction projects from 1943 to1945. This month’s cover is a photoof the dedication ceremony for the
Texas Co.’s two new FCCUs, heldon Feb. 29, 1944 (see pg. 11). ThisPort Arthur, Texas refinery is still inoperation and owned under Motiva,a joint venture between Shell Oiland Saudi Aramco. This refinery iscompleting another major expansionand is scheduled to come onstreamin early 2012. It will have a crudedistillation capacity of 600,000 bpdand rank among the 20 largestglobal refineries.
HPIMPACT19 Bio-based polymerscould be nextbig thing
20 European pipelineperformance
COLUMNS
9 HPINSIGHTGovernment,environmentand taxes, oh my!
13 HPIN RELIABILITYSelecting steam
turbines in a‘lean’ environment
17 HPINTEGRATIONSTRATEGIESStandards neededfor laboratorysystem integration
90 HPIN CONTROLHow difficult is it
to controlabsorber columns?
DEPARTMENTS
7 HPIN BRIEF • 23 HPIN INNOVATIONS • 29 HPINCONSTRUCTION38 HPI CONSTRUCTION BOXSCORE UPDATE86 HPI MARKETPLACE • 89 ADVERTISER INDEX
FLUID FLOW
75
Eliminate cavitation in your piping systemsNew pressure control devices improve fluid flow
E. Casado flores
ROTATING EQUIPMENT
79
Understand multi-stage pumps and sealing options: Part 1Service life and cost impact what seals to use on your heavy-duty pump
L. Gooch
83
Treat oily waste with decanter centrifuge plantsTurning a challenge into an opportunity
A. Hertle
www.HydrocarbonProcessing.com
FEBRUARY 2012 • VOL. 91 NO. 2

5/16/2018 Hydrocarbon Processing February 2012 - slidepdf.com
http://slidepdf.com/reader/full/hydrocarbon-processing-february-2012 5/93
years $539, digital format one year $199. Airmail rate outside NorthAmerica $175 additional a year. Single copies $25, prepaid.
Because Hydrocarbon Processing is edited specifically to be of greatestvalue to people working in this specialized business, subscriptions arerestricted to those engaged in the hydrocarbon processing industry, orservice and supply company personnel connected thereto.
Hydrocarbon Processing is indexed by Applied Science & TechnologyIndex, by Chemical Abstracts and by Engineering Index Inc. Microfilmcopies available through University Microfilms, International, AnnArbor, Mich. The full text of Hydrocarbon Processing is also availablein electronic versions of the Business Periodicals Index.
ARTICLE REPRINTS
If you would like to have a recent article reprinted for an upcoming con-ference or for use as a marketing tool, contact Foster Printing Companyfor a price quote. Articles are reprinted on quality stock with advertise-ments removed; options are available for covers and turnaround times.Our minimum order is a quantity of 100.
For more information about article reprints, call Rhonda Brownwith Foster Printing Company at +1 (866) 879-9144 ext 194or e-mail [email protected].
HYDROCARBON PROCESSING (ISSN 0018-8190) is published monthly by Gulf Publishing Company, 2 GreenwayPlaza, Suite 1020, Houston, Texas 77046. Periodicals postage paid at Houston, Texas, and at additional mailingoffice. POSTMASTER: Send address changes to Hydrocarbon Processing, P.O. Box 2608, Houston, Texas 77252.
Copyright © 2012 by Gulf Publishing Co. All rights reserved.
Permission is granted by the copyright owner to libraries and others registered with the Copyright Clearance Center(CCC) to photocopy any articles herein for the base fee of $3 per copy per page. Payment should be sent directly tothe CCC, 21 Congress St., Salem, Mass. 01970. Copying for other than personal or internal reference use withoutexpress permission is prohibited. Requests for special permission or bulk orders should be addressed to the Editor.ISSN 0018-8190/01.
www.HydrocarbonProcessing.com
GULF PUBLISHING COMPANYJohn Royall, President/CEORon Higgins, Vice President
Bill Wageneck, Vice PresidentPamela Harvey, Business Finance Manager
Part of Euromoney Institutional Investor PLC.
Other energy group titles include:
World Oil®
Petroleum Economist
Publication Agreement Number 40034765
Printed in U.S.A
Houston Office: 2 Greenway Plaza, Suite 1020, Houston, Texas 77046 USAMailing Address: P. O. Box 2608, Houston, Texas 77252-2608 USAPhone: +1 (713) 529-4301 Fax: +1 (713) 520-4433E-mail: [email protected]
Publisher Bill Wageneck [email protected]
EDITORIAL Editor Stephany RomanowReliability/Equipment Editor Heinz P. BlochProcess Editor Adrienne BlumeTechnical Editor Billy ThinnesOnline Editor Ben DuBoseAssociate Editor Helen MecheContributing Editor Loraine A. HuchlerContributing Editor William M. GobleContributing Editor Y. Zak FriedmanContributing Editor ARC Advisory Group
MAGAZINE PRODUCTIONDirector—Production and Operations Sheryl StoneManager— Editorial Production Angela BatheArtist/Illustrator David WeeksManager—Advertising Production Cheryl Willis
ADVERTISING SALESSee Sales Offices page 88.
CIRCULATION +1 (713) 520-4440Director—Circulation Suzanne McGeheeE-mail [email protected]
SUBSCRIPTIONSSubscription price (includes both print and digital versions): UnitedStates and Canada, one year $199, two years $359, three years $469.Outside USA and Canada, one year $239, two years $419, three
www.HydrocarbonProcessing.com
www.inpro-seal.com | 309-787-4971
PERMANENTBEARINGPROTECTION
The non-contacting Inpro/Seal® Steam Turbine Bearing
Isolator is custom engineered to permanently safeguard
against steam ingress to the bearing housing and
lubrication loss– increasing plant reliability. At Inpro/Seal,
we recognize the high cost of downtime, that’s why we’re
able to ship same day on most products, including new
designs. The right technology, right when you need it.
Find out more at www.inpro-seal.com.
FOR YOUR STEAM TURBINES
4 I FEBRUARY 2012 HydrocarbonProcessing.comSelect 151 at www.HydrocarbonProcessing.com/RS

5/16/2018 Hydrocarbon Processing February 2012 - slidepdf.com
http://slidepdf.com/reader/full/hydrocarbon-processing-february-2012 6/93
Select 93 at www.HydrocarbonProcessing.com/RS
5/16/2018 Hydrocarbon Processing February 2012 - slidepdf.com
http://slidepdf.com/reader/full/hydrocarbon-processing-february-2012 7/93
ThyssenKrupp Uhde
ThyssenKrupp Uhde –Engineering with ideas.The key to our success is the creativity and resourcefulness of
our employees. And it is this that keeps turning major challenges
into solutions that are not only brilliant and innovative, but often
set the standard for the entire engineering sector.
Visit us at
Frankfurt a.M., June 18 - 22, 2012
Hall 9.1, Stand B4
www.uhde.eu
Select 102 at www.HydrocarbonProcessing.com/RS

5/16/2018 Hydrocarbon Processing February 2012 - slidepdf.com
http://slidepdf.com/reader/full/hydrocarbon-processing-february-2012 8/93
HPIN BRIEF
BILLY THINNES, TECHNICAL EDITOR
HYDROCARBON PROCESSING FEBRUARY 2012 I 7
A three-year study by a team ofresearchers based at MIT has now iden-tified a suite of policy and investmentstrategies that could accelerate innova-tion in the US, helping the country tomeet its growing energy needs. Theconclusions are detailed in the newbook Unlocking Energy Innovation by Richard Lester, a professor at MIT,and David Hart, a professor at George
Mason University.The authors identified four stagesthrough which an innovative technol-ogy becomes an established part ofthe energy infrastructure. Of those, thefirst stage (the discovery of new tech-nological options) and the final stage(fine-tuning of technologies alreadyin commercial use) are relatively well-managed, they said, though both willrequire more investment.
The two middle stages are less well-managed. These stages, spanning whatis often referred to as “the valley ofdeath,” include the development of
prototypes to demonstrate viability inthe marketplace and the initial imple-mentation of the first full-scale systemsby early adopters in the marketplace.These intermediate stages are costlyand pose high investment risks, anda modest carbon price will do little toaccelerate them.
The book’s analysis of past advancesreveals several steps that tend to fosterenergy innovation: encouraging com-petition (and always leaving space fornew market entrants), making rigorousand timely selections of promising con-
cepts, and matching the scale of thesystem to the scale of the need. “Thecurrent system satisfies none of these,”the authors said.
They think that it’s essential to pur-sue parallel innovation strategies aimedat different timescales: changes overthe next decade focused on efficiencyimprovements, such as building insula-tion and gas mileage; mid-range effortsto reduce the costs and risks of knownlow-carbon energy-supply and elec-tricity-storage technologies; and, fromabout 2050 on, a third wave of techno-logical deployments drawing on fun-
damentally new developments in fieldssuch as materials and catalysis. HP
Petroplus Holdings closed three European refineries in January dueto credit line difficulties. According to the company, the restart of the refineries isdependent on economic conditions and credit availability. The shuttered refineries arein Antwerp, Belgium; Petit Couronne, France; and Cressier, Switzerland. The refiner-ies have a combined throughput capacity of approximately 667,000 bpd. Meanwhile,the company’s refineries in the UK and Germany are running at half of their com-bined 330,000-bpd capacity.
Inpex and Total have finalized sales agreements with customers in Japan and Taiwan for their proposed Ichthys gas-export project in northern Australia,according to the country’s resources minister. The agreements to provide Taiwan’sCPC and Japan’s Chubu Electric Power Co. and Toho Co. with liquefied natural gas(LNG) were first announced in June. Inpex and Total have also agreed to sell LNG
from the project to another five Japanese utilities and they are close to making a finalinvestment decision on the project’s construction. Inpex said last June that it hadagreed to sell to CPC 1.75 million metric tpy of LNG from the project for 15 years,commencing 2017. It also said it had agreed to sell Chubu Electric 490,000 tpy andToho 280,000 tpy.
LyondellBasell will shut down two polypropylene (PP) lines in Wesseling, Germany, by mid-2012. The lines, with a combined capacity of 90,000tpy, are among the company’s smallest and oldest PP production units. A company executive said that it has sufficient capacity to meet the needs of customers in Europefrom its larger scale facilities. LyondellBasell produces PP at eight sites in Europe,including facilities in Germany, France, Italy, Spain and the United Kingdom.
Enterprise Products Partners has received sufficient transportation commitments to support development of its 1,230-mile Appalachia to Texas pipeline(known as the ATEX Express) that will deliver growing ethane production from theMarcellus/Utica shale areas of Pennsylvania, West Virginia and Ohio to the US Gulf Coast. ATEX Express will have the capacity to transport up to 190,000 bpd from the Appalachian production areas to the partnership’s storage and distribution assets inTexas. The committed shipper transportation rate will range between 14.5 cents pergallon and 15.5 cents per gallon.
Tesoro plans to sell its Hawaii operations, including the 94,000 bpd Kapolei refinery, operations at 32 retail stations and all associated logistical assets.The company’s president said that Hawaii is not aligned with its strategic focus onthe Midwest and West Coast. The Kapolei refinery yield is distillate-focused and
is complementary to the on-island demand for utility, jet and military fuels. Thefacility has the necessary logistics to support product movements to and from theUS West Coast or Pacific Rim markets. The Hawaii operations are fully integratedand include a hydrocracking refinery, a network of retail stations, a deep draft singlepoint mooring facility for crude and product movements, proprietary pipelines withconnections to business hubs and terminal access and barge operations to supply themajor outlying islands.
IHS CERA’s 31st annual executive conference rolls into Houston’s Hilton Americas March 5–9. This year’s CERAWeek will focus on energy’s new role in rebuilding the global economy and providing stability in a volatile timefor the international political order. Heavy hitting speakers booked for this eventinclude Martin Craighead, CEO of Baker Hughes; Iain Conn, BP’s executive direc-
tor; James Hackett, chairman of Anadarko Petroleum; and Jeffrey Immelt, CEO of General Electric. HP
■ Acceleratingenergy innovation

5/16/2018 Hydrocarbon Processing February 2012 - slidepdf.com
http://slidepdf.com/reader/full/hydrocarbon-processing-february-2012 9/93
Select 64 at www.HydrocarbonProcessing.com/R

5/16/2018 Hydrocarbon Processing February 2012 - slidepdf.com
http://slidepdf.com/reader/full/hydrocarbon-processing-february-2012 10/93
HPINSIGHT
HYDROCARBON PROCESSING FEBRUARY 2012 I 9
Government, environment and taxes, oh my!In this issue of HPInsight, the global hydrocarbon processing
industry (HPI) still battles some very familiar and present day challenges, such as economic cycles, feedstock spikes, governmentover regulation, construction material shortages and more. Thetimes may be different, but the HPI must continue to evolve andinnovate to resolve its problems and hurdles.
Headlines from Hydrocarbon Processing, February 2002:
For the first time in a decade, total US consumer petroleumproduct demand declined in 2001. The US consumed about 19.6
million bpd of crude oil, according to the American PetroleumInstitute. Demand for most oil products weakened during the yearexcept for gasoline, which showed a 1.4% rise over 2000 levels. Among the causes for the decline were sharply reduced air travelafter the September 11 attacks, continued lackluster economy,fuel switching to natural gas, weak demand for petrochemicalfeedstocks and abnormally warm winter temperatures.
Revised EU directive poses plant upgrades. The EU oil refiningindustry will face new challenges due to revisions to the 1988Large Combustion Plant directive (88/609/EEC). It will limitthe processing of heavy residuals from the refining processes. New guidelines further limit emissions of carbon dioxide, nitrogen
oxide and particulates.
US process catalyst demand to grow 4.4%/yr. Demand forprocess catalyst (which excludes environmental applications) isforecast to increase 4.4%/yr to $3.3 billion in 2006. Demand isbeing driven by the refining sector and continued strength in new polymerization technologies.
Headlines from Hydrocarbon Processing, February 1992:
Key issues identified by refining execs. A survey of US refiningexecutives lists tops concerns for the industry; they include: 1)
Clean Air Act (CAA), 2) public intervention in environmentalmatters, 3) use of more oxygenates, 4) government interventionon CAFE and taxes, 5) safety, and 6) processing heavier crudes.Leading environmental issues were prioritized as: 1) CAA, 2.ROI of capital expenditures, 3) corporate strategies and profit-ability, 4) alternative fuels, 5) public environmental pressures,6) government intervention in CAFE and taxes, and 7) use of new catalysts.
TAME is a ‘forgotten’ oxygenate. The forgotten oxygenate istertiary amyl methyl ether (TAME) according to the EuropeanFuel Oxygenates Association. TAME is produced by reacting FCCisoamylenes with methanol. Only a few TAME units are in opera-
tion because of octane-component investments and marginaleconomics for such units.
Natural gas prices ‘to be up 5%’ in 1992. Natural gas (NG)prices will be about 5% higher in 1992 than 1991 levels, whilecrude oil prices will face significant instability as the world’s sup-ply picture changes. In 1992, the US energy demand is forecastto grow slightly as the economy strengthens. NG will assume alarger market share of the new energy demand in the industrialand utility sectors. However, a large-scale movement to NG by the transportation sectors is not in the immediate future. NG wellhead prices will hover around $1.45/MMBtu in 1992, upslightly from 1991 prices of $1.38/MMBtu.
Headlines from Hydrocarbon Processing,
February 1982:
Europe’s refining industry continues stagnation, but there ishope. There is new cracking capacity coming online from 1980 to1985. Here is how the countries line up for capacity increases, inmillion tpy (MMtpy): Austria, 1 MMtpy; Belgium, 3.7 MMtpy;Denmark, 1.5 MMtpy; France, 6.7 MMtpy; West Germany,8.8 MMtpy; Italy, 11.6 MMtpy; the Netherlands, 11.3 MMtpy;Spain, 7.6 MMtpy; and the UK, 10.6 MMtpy, according to Fol-ger & Co., Boston.
Sell alcohol as an octane booster, not a fuel. That is Texaco’sapproach. The company will redirect its marketing program for
alcohol-enhanced motor fuels to emphasize the value of ethanolas an octane improver. Federal and state tax programs will play akey role in alcohol fuel’s future.
World styrene consumption forecast to grow. From 1982 to1990, annual global styrene consumption should average a5.1% increase. Styrene demand will have double-digit growth
BP and Petrofina constructed a new catalytic cracking unit with a
capacity of 500,000 tpy at the Antwerp Refinery. The new unit enabledthis refinery to increase motor spirit production, July 1955.
5/16/2018 Hydrocarbon Processing February 2012 - slidepdf.com
http://slidepdf.com/reader/full/hydrocarbon-processing-february-2012 11/93
HPINSIGHT
10 I FEBRUARY 2012 HydrocarbonProcessing.com
in developing nations such as Algeria, South Africa and Turkey.In contrast, demand consumption by industrial regions of North America and Western Europe are expected to average a 3.9%/yr increase. In 1981, world styrene capacity was only at 71% of nameplate capacity. New project announcements will keep aheadof future demand growth through 1990.
Headlines from Hydrocarbon Processing, February 1972:
Forecast 10% growth for synthetic rubber. Synthetic rubberproduction in the US and Canada will increase 10% to reach 2.65million long tons in 1972, according to the International Instituteof Synthetic Rubber Producers Inc. Increased production is basedon a predicted 6% increase in rubber demand for autos and tires.Styrene-butadiene rubber (SBR) will hold the largest share of synthetic rubber produced and reach an all-time high demand of 1.63 million long tons.
Non-US sector leads in petroleum investment. Capital expen-
ditures by the global petroleum industry, at an all-time high of $20.1 billion in 1970, must increase substantially in the future toallow for costs associated in controlling the environment, accord-ing to a Chase Manhattan Bank (CMB) report. CMB stressedthe need for well-planned capital investments over environmentalprotection projects. The petroleum industry invested more money in capital projects in 1970 than in any other single year. Nearly $11.9 billion was spent in the “Free Foreign” nations in 1970—anincrease of $1.7 billion over 1969. The US industry invested $8.2billion over the same period. An unattractive investment climateis cited as the reason for less spending on US projects in 1972.
New sulfur recovery technology unit startup. With the Septem-
ber 1971 startup of the world’s first IFP sulfur-recovery unit atthe Nippon Petroleum Refining Company’s (NPRC’s) Negishisrefinery, the company concluded it has proved that atmosphericpollution can be dramatically reduced. In the IFP process, tailgas from a one-, two- and three-reactor Claus unit is catalytically converted in a liquid-phase reactor to yield high-purity liquidsulfur. In Japan, the atmospheric pollution problem became soacute, that Idemitus, Kyokuto Petroleum and Shows Oil decidedto construct the IFP sulfur-recovery units in their refineries.
Shell Oil completes first orthoxylene unit in the US. The facil-ity is located at Shell’s Houston, Texas, refinery and has an annual
capacity of 200 million lb. The new unit is the second expansion with the construction of a paraxylene unit in 1967. With the new orthoxylene unit, Shell will become an important manufacturerof xylene isomers.
Headlines from Hydrocarbon Processing and Petroleum Refiner, February 1962:
Esso reports new HDDV process. Esso R&D has developeda hydrogen-donor-diluent-visbreaking (HDDV) process thatinvolves mild hydrocracking to aid visbreaking operations thatare limited by fuel oil quantities.
Remedies for road antiknock. New methods for calculatingantiknock performance were developed by a joint Ethyl-StandardOil study on the feasibility of using “road blending numbers” of gasoline components to predict road performance of finishedgasoline blends. One method predicts the road octane number when combining particular components with base gasoline. Thismethod could be useful in process planning and refinery control.
Polypropylene fiber breakthrough. Motecatini has developedthe first dyeable-type polypropylene (PP) fiber for commercialproduction. The PP fiber can be stock, yard or piece-dyed, aloneor in blends with dyestuffs in use by the textile industry. The dye-able fiber in no way alters the PP’s properties, but affords many new applications for PP fibers.
New acetic acid process available. The Soviet Union claims tohave found an easy, economical solution for using butane foracetic acid manufacturing. A Moscow refinery has successfully used the new process, which liquefies butane at 140°C at 750 psi. A catalyst is added to initiate a violent oxidization reaction that
yields acetic acid and substantial quantities of solvents. The new process is claimed to be more cost-efficient than present acetic-acid manufacturing technologies.
Japan increasing petrochemical production. Japan is planningto expand petrochemical production through 1970. A new fore-cast claims ethylene capacity to reach 4 billion lb/yr by 1970 andrequire more naphtha cracking capacity. Propylene capacity willclimb to 2.8 billion lb/yr, which will be supported by offgas fromrefineries and byproducts from naphtha cracking.
Headlines from the Petroleum Refiner, February 1952:
Steel for refinery expansions. Additional steel to spur construc-tion of needed refining capacity may be possible in later 1952based on a recent Petroleum Administration for Defense (PAD)statement. The agency is developing a new refinery expansionprogram to permit the construction of 475,000 bpy of new refin-ing capacity. The new projects will consume 44% more than thepresent steel allocation program.
Shale oil production and refining today. The US Bureau of Minesrecently announced that it will build a much larger plant for theproduction and refining of shale oil. This project, together with therecent dangerous development in Iran, has again moved shale oil
into the limelight. The amount of US shale oil is tremendous, andit is estimated to be in excess of 225 billion bbl. Many new pro-
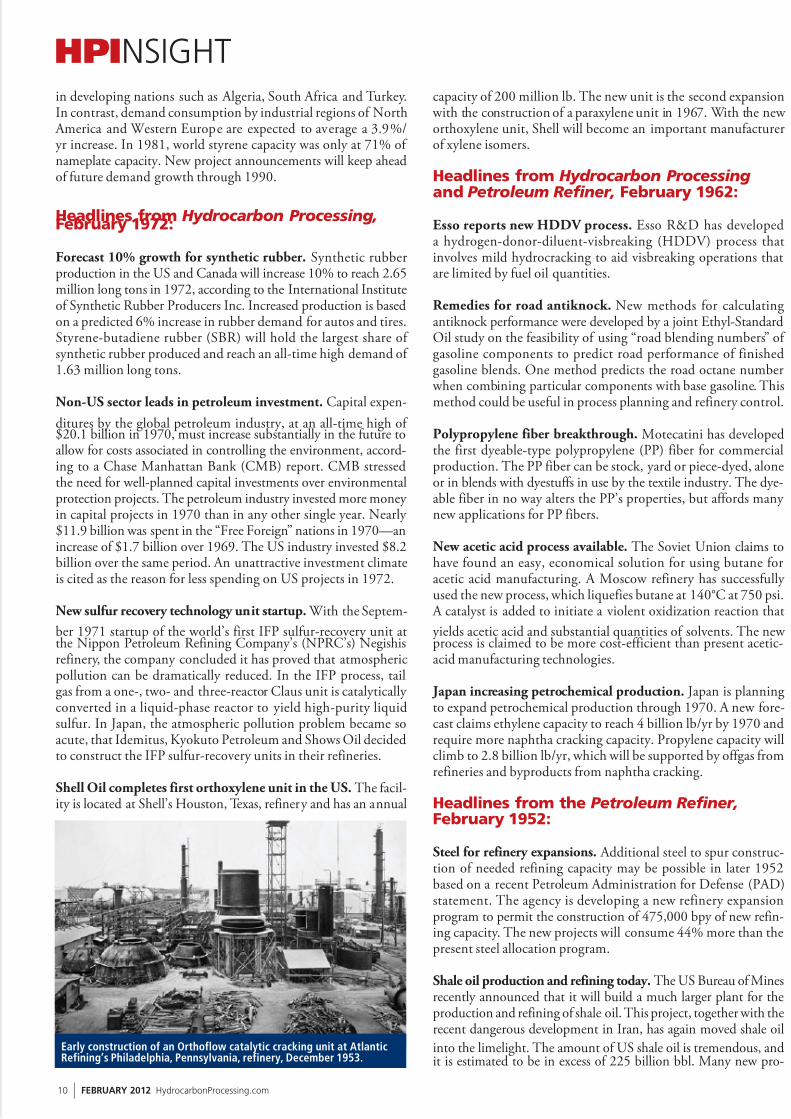
Early construction of an Orthoflow catalytic cracking unit at AtlanticRefining’s Philadelphia, Pennsylvania, refinery, December 1953.
5/16/2018 Hydrocarbon Processing February 2012 - slidepdf.com
http://slidepdf.com/reader/full/hydrocarbon-processing-february-2012 12/93
HYDROCARBON PROCESSING FEBRUARY 2012 I 11
HPINSIGHT
cesses are under consideration for recovering shale oil. The ultimateobjective in refining shale oil is the production of gasoline and dieselfuels. Refining operations applied experimentally to refine shale oilinclude crude distillation, visbreaking, recycle cracking, coking andreforming. One of the most promising techniques that maximizesgasoline yield from shale oil is hydrogenation.
European synthetic catalyst plant built to meet increasing demand for high-octane gasoline. Growing European demandfor high-octane gasoline is reflected in the construction of a new
synthetic catalyst plant in Warrington, Lancashire, England. With a capital cost of $2.8 million, the new facility will manu-facture sodium silicate catalysts, using a process developed by The Davison Chemical Corp. The new catalyst unit will supply catalyst to several oil companies including Esso Petroleum Co., Anglo-Iranian Co., Shell Refining & Marketing Co. and BahreinPetroleum Co. HP
To see the headlines from 1942 to 1922,visit HydrocarbonProcessing.com.
The Allied forces of WWII depended on aviation fuel toconduct their operations on several continents in two very different regions. Consequently, the newer military air forceneeded much higher octane fuels than in the pre-1940s era tomeet their mission goals and to transport soldiers and suppliesthroughout Europe and the Pacific region.
Role of technology. The refining technology of thepre1940s included using alkylation processes for octanegoals, and the average refinery blending pool was about 65octane. However, the new engines for the military air forceneeded 100 octane. The US government, in cooperation with domestic refining companies, embarked on a massiveconstruction program to expanding the processing capability and to produce more gasoline and diesel along with higheroctane aviation fuels for the military. This program involvedapplying new refining technologies to reach 100 octane forthe blending pool. A new process, fluid catalytic cracking(FCC), became the foundation to meet this fuel goal. Several
licensing companies joined in the effort. Refining technology leaders participating in the 100-octane program included TheM. W. Kellogg (now KBR), Universal Oil Products (UOP, adivision of Honeywell) and the Standard Oil Co. The push was to produce aviation- grade alkylate.
The program involved construction of catalytic crackingcapacity, along with new alkylation and isomerization units.
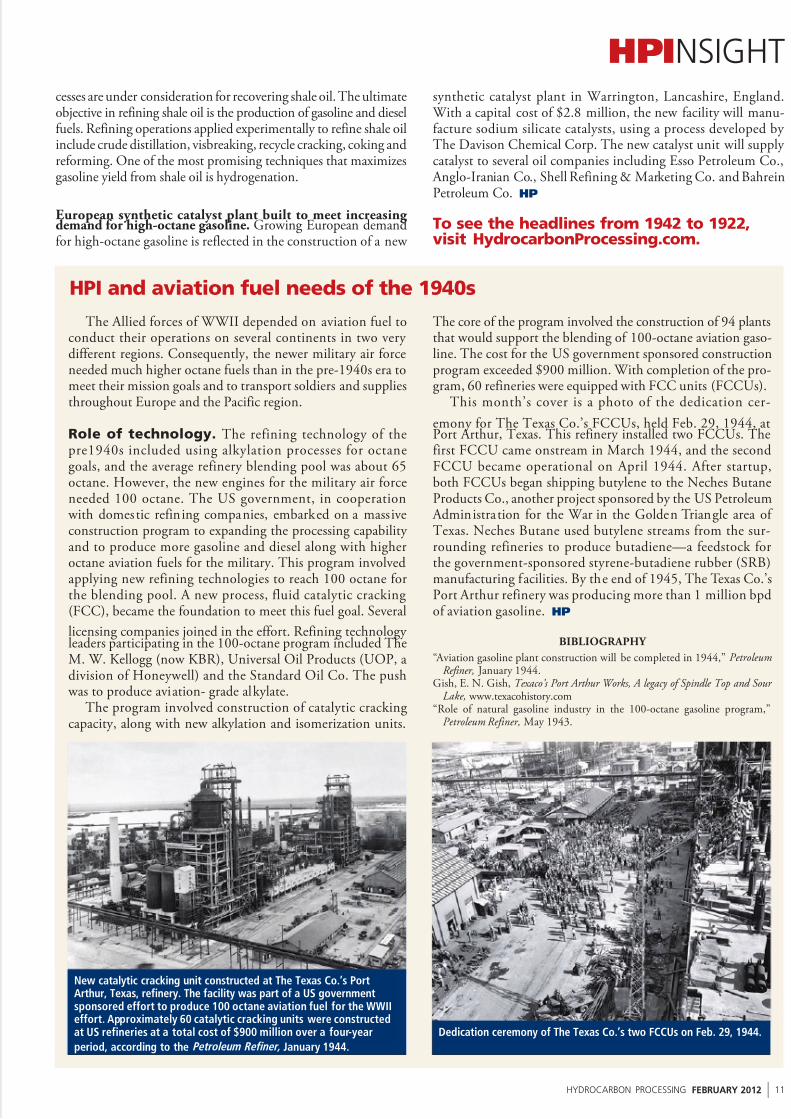
The core of the program involved the construction of 94 plantsthat would support the blending of 100-octane aviation gaso-line. The cost for the US government sponsored constructionprogram exceeded $900 million. With completion of the pro-gram, 60 refineries were equipped with FCC units (FCCUs).
This month’s cover is a photo of the dedication cer-
emony for The Texas Co.’s FCCUs, held Feb. 29, 1944, atPort Arthur, Texas. This refinery installed two FCCUs. Thefirst FCCU came onstream in March 1944, and the secondFCCU became operational on April 1944. After startup,both FCCUs began shipping butylene to the Neches ButaneProducts Co., another project sponsored by the US Petroleum Administration for the War in the Golden Triangle area of Texas. Neches Butane used butylene streams from the sur-rounding refineries to produce butadiene—a feedstock forthe government-sponsored styrene-butadiene rubber (SRB)manufacturing facilities. By the end of 1945, The Texas Co.’sPort Arthur refinery was producing more than 1 million bpdof aviation gasoline. HP
BIBLIOGRAPHY
“Aviation gasoline plant construction will be completed in 1944,” PetroleumRefiner, January 1944.
Gish, E. N. Gish, Texaco’s Port Arthur Works, A legacy of Spindle Top and Sour Lake, www.texacohistory.com
“Role of natural gasoline industry in the 100-octane gasoline program,”Petroleum Refiner, May 1943.
HPI and aviation fuel needs of the 1940s
New catalytic cracking unit constructed at The Texas Co.’s PortArthur, Texas, refinery. The facility was part of a US governmentsponsored effort to produce 100 octane aviation fuel for the WWIIeffort. Approximately 60 catalytic cracking units were constructedat US refineries at a total cost of $900 million over a four-year
period, according to the Petroleum Refiner, January 1944.
Dedication ceremony of The Texas Co.’s two FCCUs on Feb. 29, 1944.

5/16/2018 Hydrocarbon Processing February 2012 - slidepdf.com
http://slidepdf.com/reader/full/hydrocarbon-processing-february-2012 13/93
Good night.Rest easy, your operation is running
smoothly, efficiently, safely.That’s because you manage your operation
successfully, without the worry of persistent
lubrication issues that divert attention away
from the core business. You turned to TotalLubrication Management SM from Colfax. They gave
you the on-site team of specialists, the long-term
commitment, the customized program of products,
services and expertise, the sustainable, continuous
improvement to take one heavy load off your
shoulders. Dedicated to keep you Up and Running ,
so that you have many more good nights. And
good days too.
Colfax Total Lubrication Management...Up and Running
Colfax is a registered trademark and Total Lubrication is a service mark of Colfax Corporation. ©2012 Colfax Corporation. All rights reserved.
Select 86 at www.HydrocarbonProcessing.com/RS
5/16/2018 Hydrocarbon Processing February 2012 - slidepdf.com
http://slidepdf.com/reader/full/hydrocarbon-processing-february-2012 14/93
HEINZ P. BLOCH, RELIABILITY/EQUIPMENT EDITOR
HPIN RELIABILITY
HYDROCARBON PROCESSING FEBRUARY 2012 I
13
We received a nice compliment recently from a reader in South America. He wrote: “I am a mechanical engineer working onpower plant designs at a major corporation and admire your work as a writer of turbomachinery books. Your texts are much respectedand I usually refer to them to find answers to my equipment ques-tions.” He then added, “I am writing you because I could not findall the answers in your steam turbine text.1 My aim is to clear upsome doubts related to steam turbine technical specifications. Morespecifically, the corporation is developing a combined-cycle power
plant project that includes an 86-MW condensing-type steam tur-bine with one reheat entry. The HP inlet steam is at 110 bar and540°C and the reheat is being designed for 24 bar.
We are communicating with several respected steam-turbinemanufacturers and some of them are proposing a ‘standard-type’machine. In other words, they offer a turbine with a single casingand a single rotor direct-coupled to the generator. But there arealso some manufacturers that propose a “cross-compound-type”machine, a turbine with two casings and two rotors. In one offer,the HP rotor is coupled to the generator by gearbox and the IP/LP casing is direct-coupled to the generator.
Personally, I am not comfortable with the ‘cross-compound’machine. Accordingly, I would like to know your opinion about
this machine. Is this solution technically feasible? Are there many operating and maintenance (O&M) problems?”
I drafted an answer agreeing that the recent Bloch-Singhsteam-turbine book gives little guidance on the matter.1 It does,of course, describe similar machines. However, the book may have added to the reader’s confusion by mentioning not only cross-compound double-casing machines, but also double-shellsteam turbines.
More information needed. The only way one could makea definitive judgment is to:
a) Look at the guaranteed efficiencies of the two differentoffers and keep in mind the overall steam balance of the facility
b) Make a decision as to how well trained the operators will bec) Closely examine the respective field and service experience
histories of the two different turbine offers.Complying with the basic requirements of a), b) and c) requires
considerable diligence, time and effort. The reviewer should addto this a thorough check of the gearbox design and should acceptthat time is needed to draw up a comprehensive comparisonbetween the two offers. It would even be appropriate to ask if theoriginal inquiry went to the right bidders. It is always prudentto solicit bids from manufacturers that have ample experience with both direct-drive generator turbines and the more complexcompound/reheat multi-casing machines.
With time permitting, consider including a few bidders who
can comment on the very advisability of double-shell machines. A double-shell construction machine prevents inlet steam coming
into direct contact with the outer casing joint. These machinesrequire less attention from the operator. However, during themaintenance cycle, this steam turbine does need very competentmaintenance skills.
“Cross-compound” machines are probably found on shipboard,but predominantly at inlet pressures slightly lower than 110 bar. Again, substantial inquiring should be done before a decision canbe made. As regards items to be reviewed, one might investigate thelubrication system. In a cross-compound machine, the input and
output shafts are at different levels, and the lubrication system servesnot only the turbine and generator bearings, but also the gearbox.Investigate who makes the gearbox and how the gears are lubricated.
Total cost issues. Initial cost, operating cost (efficiency) andlong-term reliability expenses are of interest, and the total mustbe considered as part of the life-cycle cost. All are of equal concernand, without making a final judgment one way or the other, many different options should be explored before reaching a conclusion. Although one should make good use of vendor input and defer totheir demonstrated experience, expect double-shell machines to costmore money and cross-compound machines to require more thanthe average maintenance commitment. And the “simple” machine would also stay in the running until all the data are reviewed.
Don’t get caught in the ‘lean and mean’ craze. A perceptive reader may have seen how our answer alludes to the
Selecting steam turbines in a ‘lean’ environment
Axial rockingFirst axial
First tangential0
4,000
1,0000 2,000 3,000Turbine speed, rpm
5 x runningspeed
6 x N P
F
5 x N P
F
4 x N P F
3 x N P F
2 x N P F
1 x N P F
( 4 4 N O Z )
4,000 5,000 6,000
8,000
12,000 F r e q u e n c y , – H
Z
16,000
20,000
24,000
Governoradjustment range(3,520 to 5,293)
Mode5452515049
48464543
3931292827242322
Ratedspeed
28,000
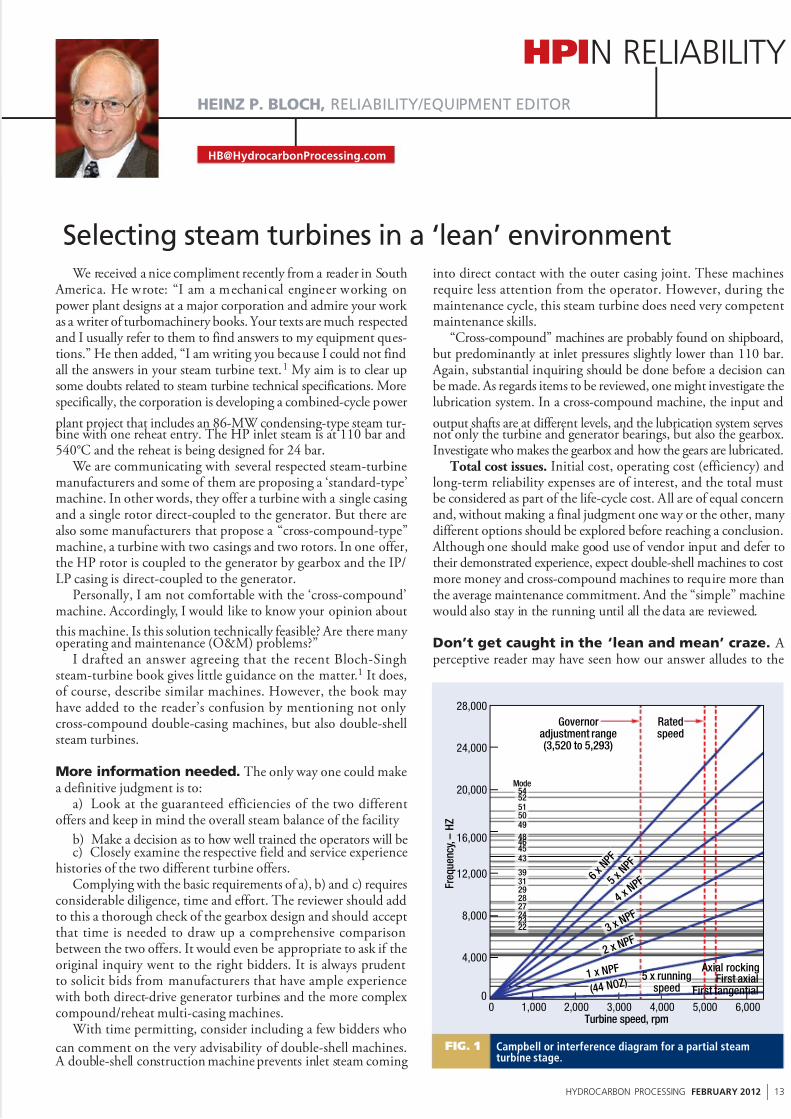
Campbell or interference diagram for a partial steamturbine stage.
FIG. 1

5/16/2018 Hydrocarbon Processing February 2012 - slidepdf.com
http://slidepdf.com/reader/full/hydrocarbon-processing-february-2012 15/93
HPIN RELIABILITY
14 I FEBRUARY 2012 HydrocarbonProcessing.com
subject of suitability analyses or pre-purchase selection work thatneeds to be done. We were reminded of the pitfalls of “lean andmean” when another facility experienced several extreme failureson smaller two-stage back-pressure mechanical drive steam tur-bines. For several years, these turbines had been driving refrigera-tion compressors without incidents. Then, about two years ago,the refrigeration gas composition was changed to accommodate
new (and well-justified) environmental concerns. The new gasconditions mandated a speed change for the steam turbine drivers,and multiple catastrophic blade failures have occurred since then.
It seems that the equipment owner was unaware of the needto look at the vibration modes of the blades for these steam tur-bines. A Campbell diagram, or interference diagram (Fig. 1) isused to indicate what speeds to avoid and to safeguard blade lifein a particular stage. Because almost all blade failures are causedby vibratory stresses, many reliability-conscious purchasers arerequesting Campbell diagrams with turbine quotes or orders. A Campbell diagram is a graph with turbine speed (r/min) plottedon the horizontal axis and the frequency, in cycles/sec, plottedon the vertical axis. Also drawn in are the blade frequencies and
the stage-exciting frequencies. When a blade frequency and anexciting frequency coincide or intersect, it is called resonance.Stress magnitudes are greatly amplified at resonance.
Over the past few years, the mindless interpretations givento “lean and mean” thinking have often led to costly oversights.No time or budget is allocated to understanding what happens when steam turbine speeds are re-set for operations away fromthe original governor adjustment range. The result has been a
much higher probability of steam-turbine-blade failures. Con-sider this comment a plea to know if and when it is proper to belean or green, or whatever. Evaluating interference diagrams andsteam turbine blade stresses is a mandatory task that can neverbe overlooked in a modern plant
Likewise, let your specifications reflect attention to seem-ingly small issues; include such items as keeping lube oil from
exiting the bearing housing, or steam leakage from entering intoa bearing housing. Review how best-of-class companies havesystematically solved these problems by using advanced bearingprotector seals (see HPIn Reliability, August 2010) or by scrupu-lously avoiding outdated or risk-prone old-style components (seeHPIn Reliability, October 2007 and HPIn Reliability, May 2009).Include details on field erection requirements in your specifica-tion; HPIn Reliabili ty, February 2008 commented on these. Avoid carbon seal rings in steam turbines (HPIn Reliability, April2008) and use only the most advantageous seal configurations inturbine-support pumps (HPIn Reliability, January 2009). Theseare just some of the items that can allow you to achieve lowestpossible cost of ownership. HP
LITERATURE CITED
1 Bloch, H. P. and M. P. Singh, Steam Turbines: Design, Applications and Re-Rating, 2nd Ed., McGraw-Hill, New York, New York, 2009.
← Alejandra Peralta, CHEMCAD Support Expert
Engineering advanced
© 2012 Chemstations, Inc. All rights reserved. | CMS-322-1 1/12
Need to incorporate customprocessing equipment orproperty calculations into
your simulations? We’re on it.
See other ways CHEMCAD helps advance
engineering at chemstations.com/demos02.
CHEMCAD_VBA
CHEMCAD_VBA
SLURRY
CAKE
CUSTOM STREAM PROPERTY
The author is Hydrocarbon Processing’s Reliability/Equipment Editor. A practic-
ing consulting engineer with 50 years of applicable experience, he advises process
plants worldwide on failure analysis, reliability improvement and maintenance cost-
avoidance topics.
Select 152 at www.HydrocarbonProcessing.com/RS

5/16/2018 Hydrocarbon Processing February 2012 - slidepdf.com
http://slidepdf.com/reader/full/hydrocarbon-processing-february-2012 16/93
Custom Support Grids
Johnson Screens Shaped Support Grid
The new Johnson Screenspatented Shaped Support Grid
matches the contour of the
vessel head. The innovative design
creates increased volume for catalyst or
molecular sieve
in the vessel,
provides uniform
entire vesselcross section,
allows a low cost
bed support and
eliminates the
need for costly
beams and
support ledges.
Leadi
the way
applying innovat
technologies to vess
Petrochemical and G
applications for mo
than 40 yea
Contact Us Toda
AUSTRALIA - ASIA PACIFIC
TEL: +61 7 3867 5555
EUROPE - MIDDLE EAST - AFRICATEL: +33 5 4902 1600
NORTH, SOUTH & CENTRAL AMER
TEL: +1 651 636 3900
JAPAN
TEL: +81 55 997 8511
www.johnsonscreens.com
Johnson Screens Flat Support Grid
designed and engineered
for each vessel,
accommodating
many design
features and
vessel shapes,
ensuring you getthe most
out of your process every time.
Select 91 at www.HydrocarbonProcessing.com/RS
5/16/2018 Hydrocarbon Processing February 2012 - slidepdf.com
http://slidepdf.com/reader/full/hydrocarbon-processing-february-2012 17/93
Selas FluidSubsidiary of The Linde Group
Headquarters: Five Sentry Parkway East • Blue Bell, PA 19422 USA • Tel: 610-832-8797 • Fax: 610-834-0473
Texas Ofce: 16225 Park Ten Place • Suite 250 • Houston, TX 77084 USA • Tel: 281-717-9090 • Fax: 281-717-9091
Linde has built a history of proven results with over 250synthesis gas plants and 2,800 air separation plantsinstalled worldwide.
As a world class supplier of synthesis gas and air separation plants,Linde Engineering and its subsidiary, Selas Fluid, provide single sourceresponsibility for engineering, procurement and construction ofcomplete synthesis gas and air separation plants.
Synthesis Gas Plants:• Hydrogen• Carbon monoxide• H2/CO synthesis gas• Ammonia• Methanol
• Synthetic natural gas
Cryogenic Plants - standard orcustom designed:• Nitrogen• Oxygen• Argon
Results
S E E U
S A T T
H E N P R A
A N N U
A L M E E T
I N G,
M A R
C H 1 1
- 1 3 !
Select 73 at www.HydrocarbonProcessing.com/RS

5/16/2018 Hydrocarbon Processing February 2012 - slidepdf.com
http://slidepdf.com/reader/full/hydrocarbon-processing-february-2012 18/93
PAULA HOLLYWOOD, CONTRIBUTING EDITOR
HPINTEGRATION STRATEGIES
HYDROCARBON PROCESSING FEBRUARY 2012 I
17
Standards needed for laboratory system integrationIndustries across the board are coping with relentless pressure
to reduce costs while simultaneously improving product quality.The hydrocarbon processing industry (HPI) has an additionalchallenge in achieving higher product quality as a result of theheavier raw materials available for processing. Heavier crudefeedstock from sources such as the Canadian tar sands have highsulfur content, thus making them more complex and expensive torefine. This heavier feedstock is in direct contrast to requirementsfor low-sulfur products dictated by ever-more-stringent regula-
tory requirements. In this environment, a well-designed quality management system (QMS), which includes a robust laboratory information management system (LIMS) that facilitates ISO 17025:2005 accreditation is critical to ensuring product quality and customer satisfaction.
LIMS is vital to quality management. Inspection systemsthat perform product sampling and chemical analyses are expen-sive; yet, they can be easily justified. Reprocessing or scrappingproduct wastes time, money and resources. Furthermore, off-specproduct can lead to unhappy customers or worse, product recallsthat can damage the manufacturer’s corporate image. Conversely,product quality over and above that required by contractual obli-
gations incurs additional costs for which manufacturers are notcompensated, and this impacts margins and profitability.
A comprehensive QMS with an integrated LIMS can helpreduce product variability and improve operational performance.In the HPI, lower-grade feedstock may dictate higher in-processsampling and analysis rates to prevent defects during the manu-facturing process. When integrated with manufacturing executionsystem (MES) and enterprise resource planning (ERP) systems,production and other departments can access quality-related infor-mation generated by the LIMS to help ensure that products meetdefined specifications and demonstrate compliance with regula-tory, product and safety standards.
An LIMS, such as Sample Manager 10 from Thermo Fisher
Scientific, adds value to quality assurance (QA)/quality control(QC) systems with full traceability functionality and it serves as arepository for documents and reports as evidence of compliance. An LIMS can provide vital information at the front end of themanufacturing cycle. Identifying off-spec raw materials uponinspection can provide the needed heads-up to tune the productionprocess to yield acceptable final product(s). It can demonstrate thata sample was handled appropriately and that the analysis was doneby a properly trained, qualified technician. It can act as a repository for laboratory equipment and maintenance histories or analyticalmethod validation, as well as the corporate quality manual. LIMSdata can also be useful in determining the appropriate correctiveaction for off-spec product and to evaluate the performance of the
quality system. Upon final QA quality and contamination checks,it can quickly release shipments.
If a non-compliant lot was inadvertently shipped, fast efficientflow of information will ensure that a recall can be quickly imple-mented. Without traceability records from an LIMS, it would benearly impossible to accomplish product recalls in a timely andcontrolled manner.
Integrated LIMS enhances QC. In the manufacturing envi-ronment, analytical measurements define the “who, what, when, where and how” of a manufacturing process. As the backbone of
the laboratory, an LIMS provides quantitative and qualitative infor-mation about chemical processes for enhanced QC. The wealth of analytical measurements provided places increased importance onintegrating this information into higher-level enterprise applicationplatforms. To improve response to operational issues, managerslook to technology to connect plant floor and business systems, likeERP, product information management system (PIMS) and MES,making it critical that analytical information are presented to theviewer in the context of their role, responsibility and authority. Forreal-time quality management, information visibility is the driverbehind the demand for better integration of laboratory-generatedinformation throughout the enterprise. Laboratory ISO 17025 compliance demonstrates commitment to quality.
Due to fluctuations in raw materials, HPI laboratories arebecoming almost like third-party service laboratories. As such,these labs must assure compliance of product(s) to specifica-tions, making laboratory accreditation with standards such ISO
17025:2005 no longer just nice to have, but a necessity to ensureconformance and customer satisfaction. Compliance with as ISO
17025 demonstrates a commitment to quality, and provides cus-tomers the assurance that the laboratory’s management and techni-cal requirements adhere to globally accepted best practices.
ISO 17025 requires a complete history of each piece of equip-ment including checks and calibrations performed prior to beingplaced in service as well as detailed records of all calibrations,repairs, maintenance and performance checks over the serviced life
of the device. A clear advantage for final product manufacturers isthat utilizing certified ISO 17025 laboratories as subcontractorsfulfills all the requirements as applicable to calibration and test-ing activities of an ISO 9001 quality management system. Thisenables the manufacturer to recognize the sub-contractor as ISO
9001 certified for any work done within the ISO 17025 scope.Quality audits of an accredited subcontractor are not required.HPI manufacturers can use the statements of work provided by an LIMS to ensure that customer requests match the delivery of samples to the lab, along with and the delivery of results back tothe customer. HP
The author has nearly 30 years’ experience in the areas of sales and product
marketing in industrial field instruments that utilize a vast array of technologiesincluding magnetic, Coriolis, radar, electrochemistry, capacitance and ultrasonic.

5/16/2018 Hydrocarbon Processing February 2012 - slidepdf.com
http://slidepdf.com/reader/full/hydrocarbon-processing-february-2012 19/93
low rare earth loves
high performanceBASF’s Rare Earth ALternative ( REAL ) solutions target the needs
of today’s Fluid Catalytic Cracking (FCC) catalyst market.
Through a world-class combination of technology, technical
service, procurement expertise, and investments in manufacturing
and R&D, BASF delivers performance and value to customerslooking for options to reduce rare earth costs.
At BASF, we create chemistry.
Realize the value of BASF innovation.
Visit www.catalysts.basf.com/real
Select 96 at www.HydrocarbonProcessing.com/RS

5/16/2018 Hydrocarbon Processing February 2012 - slidepdf.com
http://slidepdf.com/reader/full/hydrocarbon-processing-february-2012 20/93
HPIMPACT
BILLY THINNES, TECHNICAL EDITOR
HYDROCARBON PROCESSING FEBRUARY 2012 I
19
Bio-based polymerscould be next big thing
Biofuels and bio-based chemicals have been promoted as apotential solution for dependence on petroleum. They also havefavorable greenhouse gas emissions compared to fossil fuels andpetrochemicals because any carbon sourced from biomass can bedirectly traced to atmospheric CO2 via photosynthesis. Plus, theincreased emphasis on lifecycle analysis for both economic andecological factors has caused industry players to become familiar with the details of bio-feedstocks. The drumbeat for biofuels hasthundered for some time now, but new analysis is showing thatbio-based polymers could become the next big thing.
Global commodity polymer demand grew from 2000–2007. After a slight dip in recent years due to the economic downturn,consumption is expected to continue to grow for the next tenyears (Fig. 1), providing an opportunity for bio-based polymersto enter the market and make a splash. This idea is put forth andexplored in a new report from Nexant called, “Plants to plastics:Can nature compete in commodity polymers?”
Many producers, especially in high cost locations, have beenlooking for lower cost feedstocks in places like the Middle East, orare considering alternative feedstocks such as bio-based sources. With virtually all Middle East ethane allocations already appor-tioned for petrochemical projects, a portion of the next wave of new ethylene may well be from bio-based sources that can emerge from
strong agricultural-based economies such as Brazil, the US or India.
As illustrated in Fig. 2, there are many conventional routesto polymers that can be integrated with bio-based feedstocks toeither supplement or replace current petrochemical feedstocks.The report from Nexant compares technology, economics andpotential markets for polymers produced via renewable sourcesversus petrochemical sources.
Bio-ethanol dehydration to ethylene is a 40-year-old commer-cial technology available for license from companies in Swedenand the US. Bio-based “green propylene” and other “green” com-modity polymers most often can be made by adapting conven-tional petrochemical routes like metathesis. Metathesis is a com-mon process to react butylenes with ethylene to make propylene.Bio-propylene has a few alternative routes, including:
0
2 0 0 0
2 0 0 1
2 0 0 2
2 0 0 3
2 0 0 4
2 0 0 5
2 0 0 6
2 0 0 7
2 0 0 8
2 0 0 9
2 0 1 0
2 0 1 1
2 0 1 2
2 0 1 3
2 0 1 4
2 0 1 5
2 0 1 6
2 0 1 7
2 0 1 8
2 0 1 9
2 0 2 0
50,000
G l o b a l c o m m o d i t y p o l y m e r s
d e m a n d ,
t h o u s a n d t o n s LDPE
PETLLDPEHDPEPP
100,000
150,000
200,000
250,000
Global commodity polymers demand from 2000–2020.FIG. 1
Fermentation
(yeasts, bacteria, fungi)
Propane
Rubber, ABS, etc.
BTX
Natural gas
NaphthaEthane
Steam cracker
Propylene ButadieneEthylene
PETPEPP
Ethyleneoxide
+H2O
Refinery
PX
PTA Ethyleneglycol
PVC
Crude oil
+O2
+O2
Conventional petrochemical routes
PDH
Renewable feedstocks
Grains/StarchesCorn* Wheat
Grain sorghumCassava
LipidsVegetable oils*
FatsGreasesJatropha
AlgaeSugars
Sugarcane* Beets
Sorghum
LignocellulosicWood
GrassesCorn stover
StrawsMSW
Hydrolysis
Pre-treatment biomass
FCC
Lipids
Transesterification
Glycerine
Propylene
Thermochemical(gasification, pyrolysis,
catalysis)
Propane
PDH
IsobutanolEthanol
Isobutylene
Isooctene
PX
Ethylene
Pyrolysisw/zeolite
BTX
Potential green integration into the polymer value chain.FIG. 2

5/16/2018 Hydrocarbon Processing February 2012 - slidepdf.com
http://slidepdf.com/reader/full/hydrocarbon-processing-february-2012 21/93
20 I FEBRUARY 2012 HydrocarbonProcessing.com
HPIMPACT
• Bio-butanol dehydration to butylenes metathesized withbio-ethylene
• Bio-ethylene dimerization to butylenes metathesized withbio-ethylene to make bio-propylene
• Bio-based propane dehydrogenation• Fermentation to propanol followed by dehydration.
The three leading commodity polymers in the market (allgrades of polyethylene, polypropylene and polyvinyl chloride) arehighly relevant to large volume applications, and can all poten-tially be made by bio-based routes. That is, finished bio-polymerscan potentially be made that will be indistinguishable from thebest-performing conventional polymers, but with carbon contentcompletely sourced from green plants or biomass.
The report also examines bio-based polyethylene terephthalate, which can be produced by adapting conventional petrochemicalroutes. Bio-based terephthalic acid can be made from paraxylene viathe benzene, toluene and xylene process from renewable feedstocks. Also of note is bio-based mono ethylene glycol, which can be pro-duced via conventional ethylene-oxide routes using bio-ethylene.
The next 10 years could see bio-based polymers having a majorimpact on downstream polymer production (or not). Only time will tell.
European pipeline performanceEuropean oil industry group CONCAWE has collected 40
years of spillage data on European cross-country oil pipelines withparticular regard to spillages volume, cleanup and recovery, envi-
ronmental consequences and causes of the incidents. The resultshave been published in annual reports since 1971. CONCAWErecently issued a report that covers the performance of thesepipelines in 2010 and provides a full historical perspective since1971. The performance over the whole 40-year period is analyzedin various ways, including gross and net spillage volumes. Spillage
causes are grouped into five main categories: mechanical failure,operational, corrosion, natural hazard and third party.
Data for the CONCAWE annual survey comes from 77 com-panies and agencies operating oil pipelines in Europe. For 2010,data was received from 69 operators representing over 160 pipe-line systems and a combined length of 34,645 km (Fig. 3), slightly less than the 2009 inventory. There were minor corrections to thereported data.
Nine operators did not report, but CONCAWE believesnone of them suffered a spill in 2010. Nevertheless, they arenot included in the statistics. The reported volume transportedin 2010 was just under 800 million m3 of crude oil and refinedproducts, about 10% less than in 2009. Four spillage incidents
were reported in 2010, corresponding to 0.12 spillages per 1,000km of line, well below both the 5-year average of 0.25 and thelong-term running average of 0.52, which has been steadily decreasing over the years from a value of 1.2 in the mid-1970s(Fig. 4). There were no reported fires, fatalities or injuries con-nected with these spills. The gross spillage volume was low at 336m3 (Fig. 5). This is 10 m3 per 1,000 km of pipeline comparedto the long-term average of 78 m3 per 1,000 km of pipeline.
YearlyRunning average5-year movingaverage
G r o s s s p i l l a g e v o l u m e ,
m 3
0
1,000
2,000
3,000
4,000
5,000
6,000
7,000
1 9 7 1
1 9 7 3
1 9 7 5
1 9 7 7
1 9 7 9
1 9 8 1
1 9 8 3
1 9 8 5
1 9 8 7
1 9 8 9
1 9 9 1
1 9 9 3
1 9 9 5
1 9 9 7
1 9 9 9
2 0 0 1
2 0 0 3
2 0 0 5
2 0 0 7
2 0 0 9
Gross spillage volume from 1971–2010.FIG. 6
0
200
400
600
800
1,000
1,200
1,400
1,600
0
1 9 7 1
1 9 7 3
1 9 7 5
1 9 7 7
1 9 7 9
1 9 8 1
1 9 8 3
1 9 8 5
1 9 8 7
1 9 8 9
1 9 9 1
1 9 9 3
1 9 9 5
1 9 9 7
1 9 9 9
2 0 0 1
2 0 0 3
2 0 0 5
2 0 0 7
2 0 0 9
5
10
15
20
25
30
35
40
H o t p i p e l i n e s i n v e n
t o r y ,
k m
C o l d a n d t o t a l p i p
e l i n e s
i n v e n t o r y ,
t h o u s a
n d k m
TotalCrude
White productsHot
CONCAWE oil pipeline inventory and main servicecategories from 1971–2010.
FIG. 3
0
5
10
15
20
25
S p i l l a g e s / y r
YearlyRunning average5-year moving average
1 9 7 1
1 9 7 3
1 9 7 5
1 9 7 7
1 9 7 9
1 9 8 1
1 9 8 3
1 9 8 5
1 9 8 7
1 9 8 9
1 9 9 1
1 9 9 3
1 9 9 5
1 9 9 7
1 9 9 9
2 0 0 1
2 0 0 3
2 0 0 5
2 0 0 7
2 0 0 9
The 40-year trend for the annual number of spillages forall pipelines.
FIG. 4
0
50
100
150
200
250
Mechanical Operational Corrosion Natural 3rd party
A v e r a g e g r o s s v o l u m e s
p i l l e d ,
m 3
The 40-year average gross spillage volume listed per eventby cause.
FIG. 5

5/16/2018 Hydrocarbon Processing February 2012 - slidepdf.com
http://slidepdf.com/reader/full/hydrocarbon-processing-february-2012 22/93
HPIMPACT
HYDROCARBON PROCESSING FEBRUARY 2012 I
21
CONCAWE reports that essentially all the spilled volume wasrecovered or safely disposed.
Two of the spills accounted for about 95% of the gross spillvolume. Over the long term, less than 20% of the spillages areresponsible for about 80% of the gross volume spilled (Fig. 6).Pipelines carrying hot oils such as fuel oil have in the past suffered
from external corrosion due to design and construction problems.Most have been shut down or switched to cold service (Fig. 7), sothat the great majority of pipelines now carry unheated petroleumproducts and crude oil. Only 159 km of hot oil pipelines arereported to be in service today. The last reported spill from a hotoil pipeline was in 2002.
Of the four reported incidents in 2010, two were related tomechanical failures, one was caused by external corrosion, andone was the result of third party activities. Over the long term,third party activities remain the main cause of spillage incidents,although the number of events has progressively decreased over theyears. Mechanical failure is the second largest cause of spillage. Aftergreat progress during the first 20 years, the frequency of mechanical
failures has been on an upward trend over the last decade.In-line inspections were at a record high in 2010. A total of 89
sections covering a total of 12,300 km (45% more than in 2009) were inspected by at least one type of intelligence pipeline inspec-tion gauge (pig). Most inspection programs involved the runningof more than one type of pig in the same section, so that the totalactual length inspected was less at 7,178 km (21% of the inventory).
Most pipeline systems were built in the 1960s and 1970s. Whereas, in 1971, 70% of the inventory was 10 years old or less,
by 2010 only 4.4% was 10 years old or less and 50% was over40 years old. However, this has not led to an increase in spillages.Overall, there is no evidence that the aging of the pipeline systemimplies a greater risk of spillage. The development and use of new techniques, such as internal inspection with intelligence pigs, holdout the prospect that pipelines can continue reliable operations
for the foreseeable future. HP
C o l d p i p
e l i n e s s p i l l a g e f r e q u e n c i e s b y c a u s e ,
%
0.0
0.2
0.4
0.6
0.8
1.0
0
20
40
60
80
100
1971-1975
1976-1980
1981-1985
1986-1990
1991-1995
1996-2000
2001-2005
2006-2010
S p i l l s p e r y e a r p e r t h o u s a n d k m
3rd partyNatural
CorrosionOperational
Mechanical All causes
Cold pipelines spillage by cause.FIG. 7
V ALUE CREATION
YOU CAN RELY ON US.™™
Select 153 at www.HydrocarbonProcessing.com/RS

5/16/2018 Hydrocarbon Processing February 2012 - slidepdf.com
http://slidepdf.com/reader/full/hydrocarbon-processing-february-2012 23/93
EBARA CORPORATION
Select 52 at www.HydrocarbonProcessing.com/RS

5/16/2018 Hydrocarbon Processing February 2012 - slidepdf.com
http://slidepdf.com/reader/full/hydrocarbon-processing-february-2012 24/93
HPINNOVATIONS
HYDROCARBON PROCESSING FEBRUARY 2012 I
23
SELECTED BY HYDROCARBON PROCESSING EDITORS
AESSEAL wins bigat IMechE awards
The UK-bse mechcl sels m-fcrer ws me fr seve f ecegres he Is f MechclEgeers (IMechE) Mfcrg Excel-lece 2011 wrs, ws ve Overll Wer. I ls w he IMechE CsmerFcs wr.
AESSEAL hs grw verge ref 20% per yer sce peg 1979, s w he wrl’s frh-lrgesmechcl sel mfcrer, wh mre
h 70 ses wrlwe. The frm’s wer-mgeme echlgy ls sves sry ver 25 bll gl f cle wer per yer.Tl sles re expece rse frm r£128 mll (MM) 2011 £150 MM 2012 £200 MM by 2015.
The cmpy ffers we prcrge, clg crrge mechclsels, gs sels, cmpe sels ber-g prec. AESSEAL hs ls emerges prc leer, crssg ew bcmplemery secrs sch s sel sppr,helh cre crc mgeme f hs
eqpme, refrbshme servces frrg eqpme.
AESSEAL’s lgscl perleffceces re eve s bly elver mch f s prc rge wh leme f w ys. The frm s vesg ew prc lfe-cycle mgeme sysemfr 2012, whch hpes wll gve evegreer crl ver s prc prcesses.
Ally, he cmpy hs vesehevly s csmer sppr ems bh he UK br, hs esblshe glbl ewrk f sbsres rher h
relyg exesvely ges. Ths pprchgves glbl cherece csmer servce.
Jh Wlks , CEO f AES-SEAL, exple, “The cmpy’s pr-pse hs lwys bee cler: elver schexcepl servce h r csmers eeever cser lere mes f spply.Delverg h prmse s ffcl, bhe bsess hs bee esge cheve .”Select 1 at www.HydrocarbonProcessing.com/RS
Fieldbus introducesdevices for H1 ITK 6.0
The Felbs Foundation recely regsere he frs Foundation felbs
evces bse s H1 Ierperbly Tes K (ITK) Vers 6.0. Emers Pr-cess Mgeme Ykgw spplehe regsere H1 (31.25 klbs/sec)evces, whch were ese fr her fc-ly cfrmy wh he Founda-tion fc blck rscer blck specfcs.
Emers’s regsere evces cle heTpWrx D2-FF Dscree Vlve Crl-ler, whch cmbes lg/gl pssesg mrg wh Foundationfelbs cmmcs pl vlve
p rvers fr /ff pplcs; he Rsem Alycl 1066 pHTrsmer, whch mesres pH ORP/Rex, prves cmprehesve sesr,rsmer clbr gscs he bs v fel gscs.
Ykgw’s re g s ere ev c es r eehce pressre rsmers fergvs ml-sesg echlgy hmkes se f sgle-crysl slc ressesr. They ls sppr AR, IS, SC, IT PID fc blcks; NE107 fel gs-cs; sfwre wl fc.
All H1 ITK 6.0-ese evces spprhe les vcemes fel gscsper he NAMUR NE107 recmme-, whch bls p he exsg g-sc cpbles f Foundation fel-bs eqpme. A he sme me, s greer egree f rgz s h felsrmes c represe her gscs mre csse wy. Fr exmple, hese f NE 107 fel gsc cpblesllws crcl gscs be re mece s fr fre wrk, whle crcl gscs c be re
pers wh specfc recmmes hw reslve srme sse.Ths her vce ITK 6.0 feresre flly cfgrble prve flexbly ser pplcs.
A cmplee ls f regsere Founda-tion felbs prcs s vlble heFelbs F’s regsere clg www.felbs.rg/regsere.
Select 2 at www.HydrocarbonProcessing.com/RS
Sinopec picks new technologyfor catalyst research
The Chese l frm’s Reserch Isef Perlem Prcessg (RIPP) recely
selece prllel recr echlgy frmhe—he hgh hrghp experme- cmpy— ehce s reserch evelpme (R&D) effcecy l ref-g. The X2000-seres clys esg sys-em frm he s pmze fr cle gsleprc. The prllel recr sysem wsschele be elvere Spec RIPP Bejg, Ch he e f 2011.
RIPP’s ecs chse he’s echl-gy ws bse s fvrble perfrmce pre-vl sy f he’s recrsysems. The X2000-seres prllel recr
sysem ffers sble crl f ll key pr-cess prmeers, whch mes h 16 c-lyss c be ese smlesly er hesme r vrble cs ver exeepers f me.
Smll-scle esg reces he mf fee clys reqre, whle he ql-y f he s cmprble pl pl. The lre feres ly-cl se fr rel-me, fll-prc lyss, whch wll llw Spec RIPP rece heme mrke fr ew clys sls.Select 3 at www.HydrocarbonProcessing.com/RS
As HP editors, we hear about new
products, patents, software, processes,
services, etc., that are true industry
innovations—a cut above the typical
product offerings. This section enables
us to highlight these significant
developments. For more information from
these companies, please go to our website
at www.HydrocarbonProcessing.com/rs
and select the reader service number.
Award-winning AESSEAL offers awide range of products.
FIG. 1

5/16/2018 Hydrocarbon Processing February 2012 - slidepdf.com
http://slidepdf.com/reader/full/hydrocarbon-processing-february-2012 25/93
24 I FEBRUARY 2012 HydrocarbonProcessing.com
HPINNOVATIONS
New flowmeters measureCNG mass flow
Endress+Hauser’s Coriolis CNG massflowmeters measure direct mass or correctedvolume flow of compressed natural gas with0.5% accuracy. The series has been approved
by six US and international standards orga-nizations for custody transfer of compressednatural gas (CNG) and for fueling vehicles with CNG, and by five standards organiza-tions for use in hazardous areas.
Available in three common sizes from3 ⁄ 8 in. to 1 in., the CNG mass flowmetermeasures mass flow up to 330 lb/min (150kg/min) at fluid temperatures up to 257°F(125°C) and pressures up to 5,080 psi(350 bar). The instrument measures directmass or corrected volume flow with 0.5%accuracy to meet custody standards. It also
outputs temperature and density. As the
Coriolis flowmeter is a balanced, two-tubedesign, it is insensitive to pipeline vibrationsand can be installed without taking inlet oroutlet runs into consideration.
When used for custody transfer, theflowmeter is verified onsite using refer-
ence measurements approved by the localauthority for legal metrology controls.The flowmeter must be locked for cus-tody-transfer measurements and sealed by authorized personnel, but it can easily beconverted back to normal measurements.
The transmitter housing is powder-coated aluminium, the sensor housing isacid- and alkali-resistant stainless steel, andall process connections are stainless steel. A multi-colored LED on the transmitterhousing indicates the status of the instru-ment and the process conditions—such
as creepage, system working/not working,custody-transfer mode started and explicitModbus messages.
Four configuration methods are avail-able for this product. Endress+Hauser’sFieldCare software can be used for onsiteconfiguration, verification and diagnostics.The instrument can also be configured viaa highway addressable remote transducer(HART), manually via the local display, or with a plug-in electrically erasable program-mable read-only memory (EEPROM).Select 4 at www.HydrocarbonProcessing.com/RS
Dresser-Rand receivesNorwegian technology grant
Dresser-Rand, a global supplier of rotat-ing equipment solutions to the oil, gas, pet-rochemical and process industries, has beenawarded 4 million (MM) NOK ($684,000USD) in public grant funding by Innova-tion Norway (IN). The grant will be used tosupport testing for a new, environmentally friendly turbine-generator set known as theDresser-Rand KG2-3G unit.
KG2 gas turbines for power genera-
tion have a 99.3% start reliability, full-loadthrow-on capacity, and minimal mainte-nance requirements. Dresser-Rand KG2 gasturbines are ideal for standby and continu-ous power supply for onshore and offshoreapplications. The KG2-3G unit comes withan acoustic enclosure for onshore installa-tion and is suitable for a variety of applica-tions, including biofuel systems.
The KG2 generator set has been spe-cifically designed to meet requirements forpower from 1 MW to 10 MW at single andmultiple units. More than 900 units have
been delivered for standby, industrial, andoil and gas applications worldwide.
The unit will be installed at the WIN-GAS Transport GmbH site in Greifswald,Germany, where the North Stream pipelinecomes into Europe from Russia. WINGAS will provide natural gas for the field test inexchange for the heat and power produced
by the KG2-3G turbine. The electric power will be exported, and the exhaust heat willbe used to heat pipeline gas coming out of the Baltic Sea. The equipment was sched-uled for delivery in January 2012, and thetest is planned for up to 8,000 hours of field operation.
IN, a development funding arm of the Norwegian government that supportsenvironmental initiatives, awarded Dresser-Rand the funding because the KG2-3G tur-bine is expected to drastically reduce fuelconsumption, decrease CO2 emissions by
35%, and decrease NO X and CO emissionsby 80% compared to the rating of the KG2-3E turbine.Select 5 at www.HydrocarbonProcessing.com/RS
Barcode reader availablefor hazardous areas
Pepperl+Fuchs recently introduced thePowerScan Barcode Reader System forZone 1 and Division 1 hazardous areas.The wireless PowerScan M system forZone 1 locations consists of a transmit-ter and base station, with power provided
by a charger located in the safe area. The wired PowerScan D system for Division 1and Zone 1 locations consists of a barcodereader connected via a junction box to thehost PC, which can be located up to 150meters (m) away in the safe area.
With PowerScan, all common, one-dimensional barcode families can be cap-tured, and patented technology effectively scans damaged and difficult-to-read bar-codes. The rugged housing ensures fullfunctionality, even after being droppedfrom a height of 2 m.
PowerScan features a targeting guidethat helps the user achieve successful read-ings when codes are located in close prox-imity to one another. Three green LEDslocated on the top and back of the barcodereader are visible from any angle to visually confirm that the code has been successfully read. Successful readings are also confirmed with an audible tone, and the result can beread in the display.
PowerScan can be used as a stand-alonesolution, or in combination with VisuNetindustrial operator work stations or TER-
MEX operator terminals.Select 6 at www.HydrocarbonProcessing.com/RS
CNG flowmeter measures direct
mass or volume flow.
FIG. 2
New barcode scanner is ideal forhazardous areas.
FIG. 3

5/16/2018 Hydrocarbon Processing February 2012 - slidepdf.com
http://slidepdf.com/reader/full/hydrocarbon-processing-february-2012 26/93
Decades of experience in the oil and gas industry, leading
technical expertise, and our own product development
and production facilities are the solid foundation for a
wide range of high-performance products and services.
We offer comprehensive solutions for the entire life cycle
of a plant and along the entire oil and gas value chain.
The basis is our global engineering and project manage-
www.siemens.com/oilandgas
Solutions for the oil and gas industry
ment expertise as well as extensive experience in turnkey
projects. Siemens’ early involvement in the concept phase
results in the best possible technical solutions and limits
project risks. And packages for entire functionalities
reduce interface conflicts to help optimize a plant’s CAPEX
and OPEX.
Solutions for real
technical challengesSiemens always goes the extra mile to supply innovative
and reliable oil and gas solutions. E 5 0 0 0 1 - E 4 4 0 - F 1 5 7 - V 1 - 4 A 0 0
Select 101 at www.HydrocarbonProcessing.com/RS

5/16/2018 Hydrocarbon Processing February 2012 - slidepdf.com
http://slidepdf.com/reader/full/hydrocarbon-processing-february-2012 27/93
26 I FEBRUARY 2012 HydrocarbonProcessing.com
HPINNOVATIONS
Safety Manager FDU catersto small operations
Honeywell recently introduced its new Safety Manager field device unit (FDU), which allows process manufacturers to moreeasily implement small, stand-alone safety
applications in their facilities. The offer-ing combines Honeywell Process Solutions’ widely used Safety Manager platform andRemote Universal Safe input/output into asingle, space-friendly unit that meets stan-dards IEC61508 and IEC61511 for safety integrity level three (SIL-3) out of the box.
The module’s small size makes it idealfor plants that need to quickly implementintegrated safety measures for applicationssuch as burner or boiler management sys-tems. This is critical due to increasingly stringent safety regulations and compliance
standards, which often require manufactur-ers to upgrade or even replace existing safety equipment. For example, an outdated, non-compliant panel in a boiler managementsystem could be replaced with the FDU inthe limited space close to the boiler.
Additionally, the FDU has a low installa-tion cost since it requires fewer engineeringhours at initial implementation and remains
cost-effective over the course of its life cycle. Also, because it arrives SIL-3-certified, thesystem requires no extra engineering costto achieve higher certification levels, whichreduces associated capital expenditures andthe need to certify a system after its arrival.
Select 7 at www.HydrocarbonProcessing.com/RS
Biobutanol technology refinedfor commercial activities
Butamax Advanced Biofuels recently announced agreement on commercializa-tion principles with Highwater Ethanol, thefirst entrant to the Butamax Early Adopt-ers Group. Butamax’s business model is tooffer current ethanol producers proprietary biobutanol technology to permit improvedbiofuels growth and plant profitability.
The Early Adopters Group includes
founding member Highwater Ethanol, aleading ethanol producer based in the USstate of Minnesota. The ICM-designedfacility was constructed by Fagen with anameplate capacity of 50 MM gal/year.
In November 2010, Butamax ann-ounced the addition of a technology labora-tory in Paulinia, Brazil to accelerate processdevelopment efforts for producing biobuta-
nol from sugar cane. In addition, the Buta-max technology demonstration facility inHull, England is producing biobutanol tosupport the design of commercial facilities.
Biobutanol is a high-performing, drop-in biofuel that can be blended at higher
concentrations than ethanol without theneed for infrastructure changes. At 16%volume, biobutanol delivers twice therenewable energy content of 10% etha-nol blends. It is compatible with currentautomotive vehicles, retail stations and fueldistribution pipelines. The favorable blend-ing properties of biobutanol help reduce arefiner’s cost of producing gasoline and alsoprovide an attractive route to RenewableFuel Standard 2 compliance in the US.Select 8 at www.HydrocarbonProcessing.com/RS
Highwater Ethanol LLC facility inMinnesota.
FIG. 4
www.fourquest.com
PRE-COMMISSIONING?W ant
FourQuest Energy provides pre-commissioning as well as regular
shutdown and maintenance services to the Energy Industry including: steam
blowing, air blowing, oil fushing, chemical cleaning, fuid pumping, nitrogen
services, engineering & procedure writing, pipeline pigging and testing, static
load tank testing, hydro-testing and ltration & heating services. We are
ocused on ullling the needs o our clients in the Oil and Gas and Power
industry across Canada, the Middle East and Caspian.
www
FourQuest Enhutdown and mai
blowing, air blowin
ervices, engineerin
oad tank testing,
ocused on ullling
ndustry across Can
Find Us On:
SCAN WITH YOUR SMARTPHONETO VIEW OUR WEBSITE
Select 154 at www.HydrocarbonProcessing.com/RS

5/16/2018 Hydrocarbon Processing February 2012 - slidepdf.com
http://slidepdf.com/reader/full/hydrocarbon-processing-february-2012 28/93
separation loves undivided attentionThe reliability of the gas separation unit is essential for the successful performance of the whole plant.
Our customers can rely on our undivided attention to ensure continuous smooth operation. Under its
new OASE® brand, BASF provides gas treatment solutions consisting of technology, services and
products. We at BASF combine the experience of more than 40 years and about 300 distinct references
with the latest innovations to provide you with your unique solution. So if our undivided attention results
in your optimal gas separation and a smile on your face, it’s because at BASF we create chemistry.
www.basf.com/oase-gastreatment
GAS TREATING EXCELLENCE
Select 100 at www.HydrocarbonProcessing.com/RS

5/16/2018 Hydrocarbon Processing February 2012 - slidepdf.com
http://slidepdf.com/reader/full/hydrocarbon-processing-february-2012 29/93
power your
performance
45678
WR®525 high-temperature thermoplastic composites
Greene, Tweed & Co. | PetroChem & Power | Tel: +1.281.765.4500 | www.gtweed.com
0 1 / 1 2
A D - U K - P P - 0 0 9
Utilize innovative thermoplastic composites from Greene, Tweed.
Demanding environments wear critical components—especially metallic ones—
decreasing functionality and slowing delivery. But WR®525 actually improves
efficiency and MTBF, powering performance so you can finish faster, stronger
and more efficiently.
WR®525 is a thermoplastic composite that offers exceptional strength, excellent
nongalling and nonseizing properties and unique thermal expansion characteristics
not found in metallic or graphite materials. WR®525 delivers reduced friction and
vibration and increased stability and efficiency—making it an ideal thermoplastic
composite for wear rings, bushings and bearings for centrifugal pumps.
WR composites are powered by Greene, Tweed’s innovative technology. Contact us
to learn more about our complete portfolio of Friction & Wear products.
Select 82 at www.HydrocarbonProcessing.com/RS

5/16/2018 Hydrocarbon Processing February 2012 - slidepdf.com
http://slidepdf.com/reader/full/hydrocarbon-processing-february-2012 30/93
HYDROCARBON PROCESSING FEBRUARY 2012 I
29
HPIN CONSTRUCTION
HELEN MECHE, ASSOCIATE EDITOR
North AmericaSundrop Fuels, Inc., plans to con-
struct and operate its first productionfacility on about 1,200 acres of land thatit has purchased near Alexandria, Louisi-ana. The inaugural plant will use sustain-able forest waste combined with hydrogenfrom clean-burning natural gas to produceup to 50 million gpy of what is said to bethe world’s first ready-to-use, renewable“green gasoline.”
Located in Rapides Parish a few milesoutside of Alexandria, the Sundrop Fuels’
advanced biofuels plant will cost approxi-mately $450 to $500 million to build.
Toyo Engineering Canada Ltd. aCanadian subsidiary of Toyo Engineer-ing Corp., has a contract with North West Redwater Partnership (NWR), a jointventure between North West Upgrading Inc. and Canadian Natural ResourcesLtd., to provide engineering designspecification (EDS) work for a heavy-oilupgrading and refining complex in Stur-geon County, Alberta. This EDS work is
scheduled to be completed in August 2012.The NWR project’s target is to build
a heavy-oil upgrading and refining com-plex in three phases with a total capac-ity of 150,000 bpsd. This complex willprocess bitumen extracted from oil sandsto produce naphtha, diesel oil and otherpetroleum products. The project is dividedinto several units, and Toyo EngineeringCanada Ltd. will provide engineering ser-vices for a sulfur-recovery unit, a light-endsrecovery unit, a sour water-stripper unitand an amine-treatment unit.
Kinder Morgan Energy Partners,L.P., will build, own and operate a petro-leum condensate processing facility nearits Galena Park terminal on the HoustonShip Channel in Texas. With an initialthroughput of 25,000 bpd and a designthat provides for future expansions of upto 100,000 bpd, the approximately $130million project will split condensate intoits various components, such as light andheavy naphthas, kerosine and gasoil. A major oil industry customer is underwrit-
ing, through a fee structure, the initialthroughput of the facility.
The pipeline, which will transportcrude/condensate from the Eagle Fordshale in south Texas to the Houston ShipChannel, will consist of almost 70 miles of new-build construction and 113 miles of converted natural gas pipeline. Construc-tion on the pipeline has begun and KinderMorgan expects it to be in service in thesecond quarter of 2012.
Tesoro Corp. intends to invest approxi-mately $180 million on a capital project atthe Salt Lake City, Utah, refinery that will
expand crude-oil throughput capacity by 7%. The project will allow the company to increase throughput of transportation-advantaged black-wax and yellow-waxcrude oil to 21,000 bpd, an increase of over100%. The project also includes capital forconversion unit upgrades designed to drivea nearly 3% increase in the refinery’s cleanproduct yield. Based on present estimates,the project has a payback period of less thantwo years and is expected to be completedin two stages in 2013 and 2014, subject torequired permitting.
DKRW Advanced Fuels LLC’s wholly owned subsidiary, Medicine Bow Fuel & Power LLC (MBFP), has a contract with Vitol Inc., whereby Vitol would purchase100% of the gasoline produced from MBFP’sindustrial gasification and liquefaction facil-ity located near Medicine Bow, Wyoming.The contract is one of the first major com-mercial agreements in the US for the sale of liquid transport fuels made from coal.
MBFP plans to sequester the CO2 thatis captured from the facility by selling the
CO2 for enhanced oil recovery (EOR).MBFP has a contract with a subsidiary of Denbury Resources Inc. to purchasethe CO2 for use in its EOR operations.DKRW Advanced Fuels is completing finaldevelopment on the project and expects tocomplete financing activities and ramp upconstruction on the facility in 2012.
Chevron Phillips Chemical Co. LP hascompleted several key feasibility study ele-ments announced earlier this year and plansto pursue a project to construct a world-
scale ethane cracker and ethylene derivativesfacilities in the US Gulf Coast region.
Chevron Phillips Chemical’s existingCedar Bayou facility in Baytown, Texas, would be the location of the new ethyleneunit. The company has executed agree-ments with Shaw Energy and Chemicalsto design a 1.5 million-metric-tpy (3.3 bil-lion-lb/yr) ethane cracker using proprietary Shaw technology.
Chevron Phillips Chemical’s proprietary technologies would be used for the con-struction of two new polyethylene facili-ties, each with a capacity of 500,000 metrictpy. The new polyethylene units would be
located either at the Cedar Bayou facility ora site nearby the Chevron Phillips Chemi-cal Sweeny facility in Old Ocean, Texas. A final site selection decision for these unitsis anticipated during the first quarter of 2012. The estimated completion date forthe project is 2017.
PBF Holding Co. LLC and Dela- ware City Refining Co. LLC (PBF) havereceived conditional approval from PBF’sboard of directors for the construction of the PBF Clean Fuels Project. The $1 billion
project consists of a mild hydrocracker andhydrogen plant that will be built at PBF’sDelaware City refinery. The constructionperiod will last approximately three yearsand, when completed, will process streamsfrom both the Delaware City refinery andPBF’s Paulsboro, New Jersey, refinery.
Trend analysis forecastingHydrocarbon Processing maintains an
extensive database of historical HPI proj-
ect information. The Boxscore Database is a
35-year compilation of projects by type, oper-
ating company, licensor, engineering/construc-
tor, location, etc. Many companies use the his-
torical data for trending or sales forecasting.
The historical information is available in
comma-delimited or Excel® and can be custom
sorted to suit your needs. The cost depends on
the size and complexity of the sort requested.
You can focus on a narrow request, such as
the history of a particular type of project, or
you can obtain the entire 35-year Boxscore
database or portions thereof. Simply send
a clear description of the data needed and
receive a prompt cost quotation.
Contact: Lee Nichols
P.O. Box 2608, Houston, Texas 77252-2608713-525-4626 • [email protected]

5/16/2018 Hydrocarbon Processing February 2012 - slidepdf.com
http://slidepdf.com/reader/full/hydrocarbon-processing-february-2012 31/93
HPIN CONSTRUCTION
30
The mild hydrocracker will reduce thesulfur content by 99% in approximately 65,000 bpd of distillate production from2,000 ppm of sulfur to less than 15 ppmof sulfur, resulting in a reduction of over6,500 tpy of sulfur-dioxide emissions. In
addition, the mild hydrocracker will enablethe refinery to process a heavier crude slate while producing a greater volume of cleantransportation fuels with an emphasis onincreasing distillate production.
Linde in North America is investingin a new air-separation plant in Lewisville, Arkansas. Linde will build a 470-tpd plantthat will produce liquid nitrogen and oxygento meet rapidly growing demand in Arkan-sas, Louisiana and Texas. Construction is
scheduled to begin in the second quarter of 2012. The plant is expected to begin operat-ing by the fourth quarter of 2013.
The plant, which will be designed andconstructed by Linde’s Engineering Divi-
sion, will use the least amount of electricity possible in order to produce the gases.
South America
Toyo Engineering Corp., in consor-tium with Y&V Ingeniería y Construc-
ción, C.A., has a project management con-sultant (PMC) contract for the heavy-oilupgrading project of Petróleos de Venezu-ela, S.A. (PDVSA) at its Puerto La Cruzrefinery in the state of Anzoátegui. Theproject includes an atmospheric-distillationunit, a vacuum-distillation unit, a slurry hydrocracker (HDH Plus) unit, a sequen-tial hydroprocessing (SHP) unit, sulfur-recovery unit and a hydrogen-productionunit, along with offsite and utility units.
This project aims to increase the refin-ery’s processing capacity by maximizing
the use of the extra-heavy oil produced inthe Orinoco oil belt to satisfy the energy demands of Venezuela’s domestic marketand exports overseas.
This is said to be an epoch-making proj-ect since the project’s main unit is the firstcommercialization of a heavy-oil upgradingtechnology developed by PDVSA’s researchand development center, PDVSA Intevep.
The consortium will, jointly with PDV-SA’s project team, perform PMC servicesto manage and control several contractorsengaged in the project up to its startup.
Project duration is estimated to be 52months.
Braskem and PetroPerú have joinedforces to analyze the technical and eco-nomic feasibility of a petrochemical proj-ect in Peru. Both companies aim to study the possibility of implanting units for theintegrated production of 1.2 million tpy of ethylene and polyethylene using ethanefrom the natural gas reserves in the LasMalvinas region.
If feasibility is confirmed, and assuming
successful definitive agreement negotiationand approval by the shareholders of bothcompanies, the undertaking will be partof the so-called Integrated Southern Proj-ect. This project includes the constructionof the Southern Andean Gas Pipeline by Kuntur and of a modern petrochemicalcomplex in the south of Peru, which willreportedly be a landmark in the country’sindustrialization process.
WorleyParsons has a contract for theproject management consultancy of the
Refinería del Pacífico refining and pet-rochemical complex, a project with an
WorleyParsons is a leader in designing solutions to meet clean fuels regulations that now
face refiners around the world, including government mandates on sulphur, aromatic, and
oxygen content of fuels. We have extensive experience with the two major types of clean
fuels projects: reformulated gasoline and ultra low sulphur diesel (ULSD), and our refinery
services are backed by over 60 years of global experience in grass roots, revamp, and
expansion projects.
www.worleyparsons.com
To meet therequirements oftoday’s dynamic andcompetitive businessenvironment, wesupply innovative,
cost-effective, andsafe solutions forour customers.
Clean Fuels
Select 155 at www.HydrocarbonProcessing.com/RS
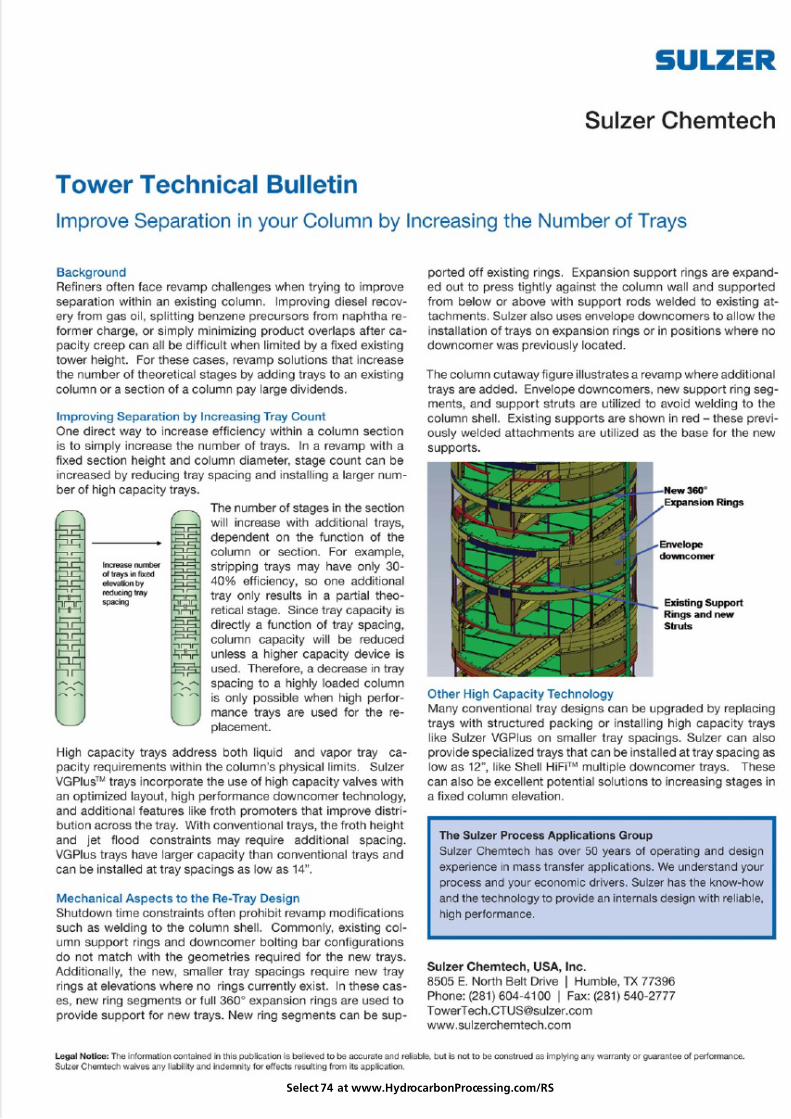
5/16/2018 Hydrocarbon Processing February 2012 - slidepdf.com
http://slidepdf.com/reader/full/hydrocarbon-processing-february-2012 32/93
Select 74 at www.HydrocarbonProcessing.com/RS
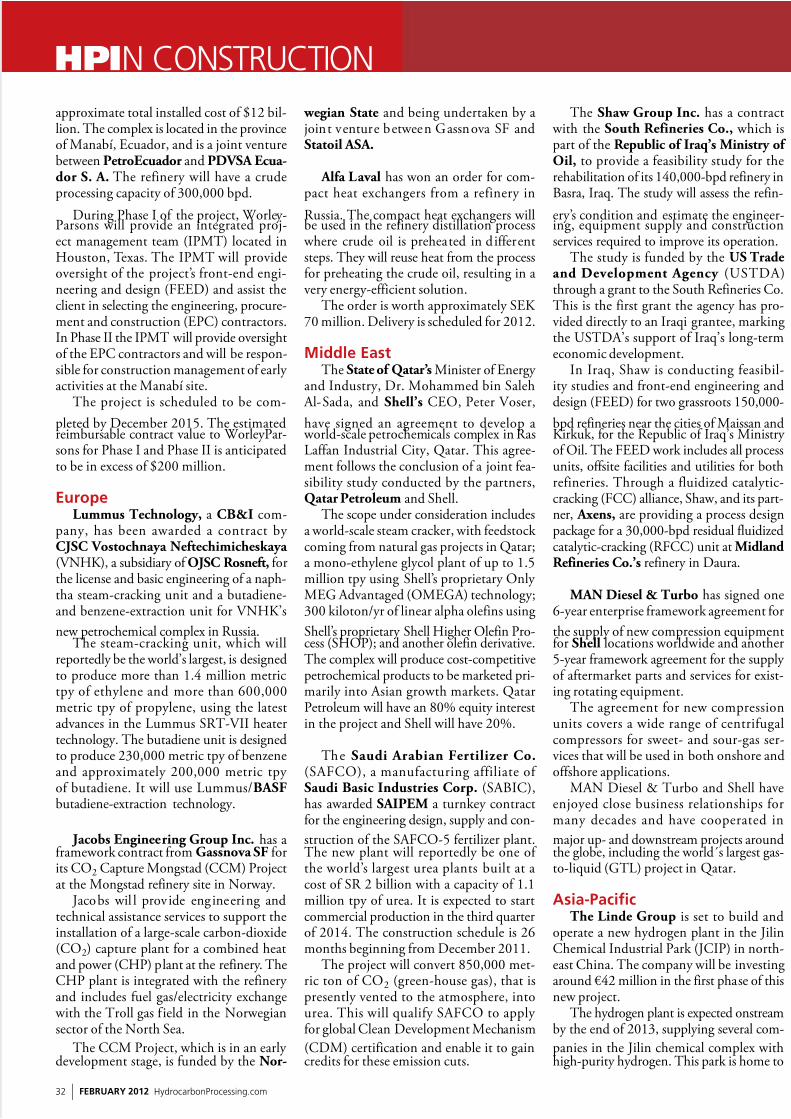
5/16/2018 Hydrocarbon Processing February 2012 - slidepdf.com
http://slidepdf.com/reader/full/hydrocarbon-processing-february-2012 33/93
32 I FEBRUARY 2012 HydrocarbonProcessing.com
HPIN CONSTRUCTION
approximate total installed cost of $12 bil-lion. The complex is located in the provinceof Manabí, Ecuador, and is a joint venturebetween PetroEcuador and PDVSA Ecua-dor S. A. The refinery will have a crudeprocessing capacity of 300,000 bpd.
During Phase I of the project, Worley-Parsons will provide an integrated proj-ect management team (IPMT) located inHouston, Texas. The IPMT will provideoversight of the project’s front-end engi-neering and design (FEED) and assist theclient in selecting the engineering, procure-ment and construction (EPC) contractors.In Phase II the IPMT will provide oversightof the EPC contractors and will be respon-sible for construction management of early activities at the Manabí site.
The project is scheduled to be com-
pleted by December 2015. The estimatedreimbursable contract value to WorleyPar-sons for Phase I and Phase II is anticipatedto be in excess of $200 million.
EuropeLummus Technology, a CB&I com-
pany, has been awarded a contract by CJSC Vostochnaya Neftechimicheskaya (VNHK), a subsidiary of OJSC Rosneft, forthe license and basic engineering of a naph-tha steam-cracking unit and a butadiene-and benzene-extraction unit for VNHK’s
new petrochemical complex in Russia.The steam-cracking unit, which will
reportedly be the world’s largest, is designedto produce more than 1.4 million metrictpy of ethylene and more than 600,000metric tpy of propylene, using the latestadvances in the Lummus SRT-VII heatertechnology. The butadiene unit is designedto produce 230,000 metric tpy of benzeneand approximately 200,000 metric tpy of butadiene. It will use Lummus/BASF butadiene-extraction technology.
Jacobs Engineering Group Inc. has aframework contract from Gassnova SF forits CO2 Capture Mongstad (CCM) Projectat the Mongstad refinery site in Norway.
Jacobs wil l provide engineering andtechnical assistance services to support theinstallation of a large-scale carbon-dioxide(CO2) capture plant for a combined heatand power (CHP) plant at the refinery. TheCHP plant is integrated with the refinery and includes fuel gas/electricity exchange with the Troll gas field in the Norwegiansector of the North Sea.
The CCM Project, which is in an early development stage, is funded by the Nor-
wegian State and being undertaken by a joint venture between Gassnova SF andStatoil ASA.
Alfa Laval has won an order for com-pact heat exchangers from a refinery in
Russia. The compact heat exchangers willbe used in the refinery distillation process where crude oil is preheated in differentsteps. They will reuse heat from the processfor preheating the crude oil, resulting in avery energy-efficient solution.
The order is worth approximately SEK 70 million. Delivery is scheduled for 2012.
Middle EastThe State of Qatar’s Minister of Energy
and Industry, Dr. Mohammed bin Saleh Al-Sada, and Shell’s CEO, Peter Voser,
have signed an agreement to develop a world-scale petrochemicals complex in RasLaffan Industrial City, Qatar. This agree-ment follows the conclusion of a joint fea-sibility study conducted by the partners,Qatar Petroleum and Shell.
The scope under consideration includesa world-scale steam cracker, with feedstock coming from natural gas projects in Qatar;a mono-ethylene glycol plant of up to 1.5million tpy using Shell’s proprietary Only MEG Advantaged (OMEGA) technology;300 kiloton/yr of linear alpha olefins using
Shell’s proprietary Shell Higher Olefin Pro-cess (SHOP); and another olefin derivative.The complex will produce cost-competitivepetrochemical products to be marketed pri-marily into Asian growth markets. QatarPetroleum will have an 80% equity interestin the project and Shell will have 20%.
The Saudi Arabian Fertilizer Co.(SAFCO), a manufacturing affiliate of Saudi Basic Industries Corp. (SABIC),has awarded SAIPEM a turnkey contractfor the engineering design, supply and con-
struction of the SAFCO-5 fertilizer plant.The new plant will reportedly be one of the world’s largest urea plants built at acost of SR 2 billion with a capacity of 1.1million tpy of urea. It is expected to startcommercial production in the third quarterof 2014. The construction schedule is 26months beginning from December 2011.
The project will convert 850,000 met-ric ton of CO2 (green-house gas), that ispresently vented to the atmosphere, intourea. This will qualify SAFCO to apply for global Clean Development Mechanism
(CDM) certification and enable it to gaincredits for these emission cuts.
The Shaw Group Inc. has a contract with the South Refineries Co., which ispart of the Republic of Iraq’s Ministry of Oil, to provide a feasibility study for therehabilitation of its 140,000-bpd refinery inBasra, Iraq. The study will assess the refin-
ery’s condition and estimate the engineer-ing, equipment supply and constructionservices required to improve its operation.
The study is funded by the US Tradeand Development Agency (USTDA)through a grant to the South Refineries Co.This is the first grant the agency has pro-vided directly to an Iraqi grantee, markingthe USTDA’s support of Iraq’s long-termeconomic development.
In Iraq, Shaw is conducting feasibil-ity studies and front-end engineering anddesign (FEED) for two grassroots 150,000-
bpd refineries near the cities of Maissan andKirkuk, for the Republic of Iraq’s Ministry of Oil. The FEED work includes all processunits, offsite facilities and utilities for bothrefineries. Through a fluidized catalytic-cracking (FCC) alliance, Shaw, and its part-ner, Axens, are providing a process designpackage for a 30,000-bpd residual fluidizedcatalytic-cracking (RFCC) unit at Midland Refineries Co.’s refinery in Daura.
MAN Diesel & Turbo has signed one6-year enterprise framework agreement for
the supply of new compression equipmentfor Shell locations worldwide and another5-year framework agreement for the supply of aftermarket parts and services for exist-ing rotating equipment.
The agreement for new compressionunits covers a wide range of centrifugalcompressors for sweet- and sour-gas ser-vices that will be used in both onshore andoffshore applications.
MAN Diesel & Turbo and Shell haveenjoyed close business relationships formany decades and have cooperated in
major up- and downstream projects aroundthe globe, including the world´s largest gas-to-liquid (GTL) project in Qatar.
Asia-PacificThe Linde Group is set to build and
operate a new hydrogen plant in the JilinChemical Industrial Park (JCIP) in north-east China. The company will be investingaround €42 million in the first phase of thisnew project.
The hydrogen plant is expected onstreamby the end of 2013, supplying several com-
panies in the Jilin chemical complex withhigh-purity hydrogen. This park is home to
5/16/2018 Hydrocarbon Processing February 2012 - slidepdf.com
http://slidepdf.com/reader/full/hydrocarbon-processing-february-2012 34/93
The “science” of recovering and refining preciousmetal catalysts is straightforward: state of the art technology. The “art” of this process, however, iswhat makes Sabin different from all others: that’s the
knowledge, experience, and expertise gained fromseven decades of successfully serving thousands oforganizations around the world. We’d be pleased to count you among them.
Experiencethe Sabin difference for precious metal
catalyst recoveryand refining.
We turn science into art for
highest possible returns and added value.
Learn more at sabinmetal.com
Select 81 at www.HydrocarbonProcessing.com/RS
5/16/2018 Hydrocarbon Processing February 2012 - slidepdf.com
http://slidepdf.com/reader/full/hydrocarbon-processing-february-2012 35/93
HPIN CONSTRUCTION
34
production facilities run by Evonik Indus-tries and Jishen, a joint venture between thePetroChina Jilin Beifang Chemical Group and the Jilin Shenhua Group.
The new hydrogen plant will use steammethane reforming (SMR) to produce
25,000 Nm3h of hydrogen. It will be builtby Linde’s Engineering Division and oper-ated by its Gases Division. In addition,Linde will set up a subsidiary, Linde Gases
Jilin, to focus on further expanding the
gas supply infrastructure in and around the JCIP chemical complex.
Jishen, Evonik Industries and Hunts-man are investing around €390 million intotal to construct a chemical hub in Jilinthat will produce high-pressure propylene
oxide (HPPO). Evonik is building a230-kiloton/yr hydrogen peroxide plantto supply Jishen’s 300-kiloton/yr HPPOplant. Jishen will then supply the HPPOto Huntsman for its polyol plant.
LG Chem has chosen Burckhardt Compression to deliver one hyper com-pressor as a secondary compressor and oneprocess gas compressor as a booster/pri-mary compressor for its low-density poly-ethylene (LDPE) ethylene-vinyl acetate
(EVA) plant in Daesan, Korea. After a thorough evaluation phase,
LG Chem selected Burckhardt Compres-sion, thanks to the proven technology and numerous references to LDPE plants with similar or larger capacities. For LGChem, it is essential to have a single pointof contact for both compressors sinceboth compressors are installed in the mainproduction line and are interdependent.Burckhardt Compression bears the overallresponsibility for the package, that is, forcompressing ethylene gas over the whole
compression range.The compressors are scheduled for
delivery in December 2012.
Jacobs Engineering Group Inc. hasreceived a contract from Shell India Mar-kets Private Ltd. to establish an integratedorganization with Shell Projects & Tech-nology for its project design office in Ban-galore, India. Contract duration is 5 years with provision for a further extension.
The Integrated Project Design Orga-nization expects to deliver a full range
of engineering and design services foronshore upstream (oil and gas) and down-stream major capital projects, mainly in the Middle Eastern and Far Easternregions. The new organization aims toblend the strong technical and engineeringdesign capability held by Shell and Jacobs, while optimizing the best work processesand tools of both companies.
UOP LLC, a Honeywell company, will provide key technology to Zhejiang Shaoxing Sanjin Petrochemical Co.,
Ltd., to produce propylene in China. Thenew propane dehydrogenation unit willuse Honeywell’s UOP C3 Oleflex processtechnology to produce 450,000 metrictpy of propylene. The unit is expectedto start up in 2013 at Zhejiang’s facil-ity in Shaoxing City, Zhejiang Province,China. In addition to technology licens-ing, Honeywell’s UOP will also provideengineering design, catalysts, adsorbents,equipment, staff training and technicalservice for the project.
Since the technology was commercial-
ized in 1990, Honeywell’s UOP has com-missioned nine C3 Oleflex units for on-
HEAT TRANSFER FLUIDS
®
®
31 Portland RoadWest Conshohocken PA 19428 USA
800-222-3611610-941-4900 • Fax: 610-941-9191
Start up at -37° F below zero. This is a non-aromatic/low odor
(not noxious), pure and colorless, inherently biodegradable
composition that reduces worker exposure and environmental
issues. Designed as a benzene-free alternative for gas-processing
applications it’s easier to handle and reduces maintenance.
You may want to check/test
your system with a Fluid
Analysis. Great for eliminating
any downside risk or call and
talk with one of our technical
specialists/engineers over the
phone about your particular
application. Contact us today
for real help right away.
Help is here...cold startup, non-toxic,biodegradable,Paratherm MR
®
heattransfer fluid will makeyour system safe andmore productive.
Easy and safe to handle,
a great user friendly
“non stink” alternative to
synthetic aromatic fluids.
Select 156 at www.HydrocarbonProcessing.com/RS

5/16/2018 Hydrocarbon Processing February 2012 - slidepdf.com
http://slidepdf.com/reader/full/hydrocarbon-processing-february-2012 36/93
CRYO-PLUS™Get More Valuable Liquid from your Gas Streams
Linde Process Plants, Inc. provides engineering, design,fabrication and construction of cryogenic plants for theextraction of hydrocarbon liquid from natural gas, refineryand petrochemical gas streams. Recovered liquid compo-nents can include ethylene, ethane, propylene, propane,isobutane as well as other valuable olefinic and paraffinichydrocarbons. Combine your CRYO-PLUS™ plant with aLinde PSA to recover high purity hydrogen from refineryand petrochemical off-gas streams.
Linde Process Plants, Inc.
6100 South Yale Avenue, Suite 1200, Tulsa, Oklahoma 74136, USAPhone: +1.918.477.1200, Fax: +1.918.477.1100, www.LPPUSA.com, e-mail: [email protected]
Why choose Linde’s CRYO-PLUS™
– Proprietary technology with a proventrack record in:
– Refinery Off-Gas– Petrochemical Off-Gas– Natural Gas
– Robust, adaptable and flexible design,and operation
– Typical payout times of six (6) monthsto two (2) years
A member of The Linde Group
Select 85 at www.HydrocarbonProcessing.com/RS
5/16/2018 Hydrocarbon Processing February 2012 - slidepdf.com
http://slidepdf.com/reader/full/hydrocarbon-processing-february-2012 37/93
HPIN CONSTRUCTION
36
purpose propylene production, with thetenth unit scheduled to start up in 2012 inRussia. Earlier this year, Honeywell’s UOPannounced four similar projects in China,as well as one in Abu Dhabi.
In June, SAMSON India opened itsnew production facilities in Ranjangaonin the Maharashtra district. About €3.5million was invested in the 18,000-m²facilities to ensure an optimum supply forthe fast-growing Indian market. Duringthe opening ceremony, Mr. Hans-ErichGrimm, head of SAMSON AG’s SalesDivision, pointed out that six chemicaland petrochemical sites will be estab-lished in India thanks to the support of the Indian Government in the next few years: “A total of $250,000 million will
be invested in these sites. We expect ahuge demand for our products and ser-vices in India.”
Essar Oil Ltd., a subsidiary of EssarEnergy, has successfully commissioneda new isomerization (ISOM) unit at itsVadinar refinery. The 0.7 million-metric-tpy ISOM unit is a key component of the
refinery’s Phase I expansion, which willincrease its capacity to 18 million met-ric tpy. Reported to be among the largestISOM units in the world, the commis-sioning of this unit was completed in just32 days (as against an industry average
of 50–55 days), without compromisingon safety.
The ISOM unit (Penex-DIH) islicensed by UOP, a Honeywell company. Itis the first expansion unit to be fully com-missioned, and, as such, it is now ready tostart commercial production. Using naph-tha as its primary feed, the ISOM unit willhelp produce Euro IV-grade gasoline witha high-octane rating and almost zero sul-fur content. This will enable Essar Oil toproduce high-grade gasoline that has wideacceptance both in the domestic and inter-
national markets.The Vadinar refinery expansion project
is very close to completion. Mechanicalcompletion has been achieved for 27 new units and utilities. Mechanical completionof the pending units—a delayed-cokerunit (DCU), a vacuum-gasoil hydrotreater(VGO-HT) and a new sulfur-recovery unit (SRU)—is expected by the end of the
month. Startup activity has commencedfor all of the new expansion units thathave been mechanically completed, andthey will be commissioned in a phasedmanner. Increased refinery throughputof 18 million metric tpy will begin in the
first quarter of 2012.
Asahi Kasei Chemicals has decidedto construct a second plant in Singaporeto produce solution-polymerized styrene-butadiene rubber (S-SBR), with a capac-ity of 50,000 tpy. The new plant will belocated adjacent to an S-SBR plant of the same capacity that is presently underconstruction.
Construction began in June 2011, andstartup is scheduled for May 2013. WithS-SBR demand expected to increase fur-
ther, Asahi Kasei Chemicals decided toadvance plans for a second plant in Singa-pore to meet customer needs and ensurestable supply.
Uzbekistan GTL LLC has awardedTechnip an extension of the existing reim-bursable services contract for the front-endengineering design (FEED) of a gas-to-liquids (GTL) plant located 40 km southof Qarshi in Uzbekistan.
This plant will be based on Sasol’s GTLtechnology, and will have a capacity of 1.4
million metric tpy, similar in capacity to theOryx GTL facility in Qatar implementedby Technip, with the following productslate: GTL, diesel, kerosine, naphtha andliquid petroleum gas.
Bechtel International Inc. hasselected Honeywell to design and imple-ment automation and safety solutions fora new multi-train liquefied natural gas(LNG) facility under construction as partof the Australia Pacific LNG project inQueensland. The project—a joint venture
between Origin Energy, ConocoPhillips and Sinopec—will create a long-termindustry utilizing Australia Pacific LNG’scoal-seam gas (CSG) resources in theSurat and Bowen basins. Bechtel selectedHoneywell Process Solutions to providevital integrated control and safety systems(ICSS) at the new facility, which is designedto convert CSG to LNG.
The project will produce CSG for com-mercial markets both locally and overseas,and it already supplies gas to power stationsin Queensland, major industrial custom-
ers, and homes and businesses in southeastQueensland. HP
Strategic Marketing CampaignsJoin the over 300 energy-related service companies who work withBIC Alliance annually to reach key decision makers in the upstream,
midstream, downstream and power generation sectors.
Investment BankingUtilize expertise from a firm that has completed $170 million
in energy and industrial transactions since 2008.
Executive RecruitingWith 15 years of recruiting experience, we are currently being
used by over 35 energy service companies.
Custom Book PublishingCustomize a book from the BIC Media Solutions library or let us
create a custom book for your business or organization.
Select 157 at www.HydrocarbonProcessing.com/RS

5/16/2018 Hydrocarbon Processing February 2012 - slidepdf.com
http://slidepdf.com/reader/full/hydrocarbon-processing-february-2012 38/93
www.bakerhughes.com
Find out how to maximize profit
by meeting fuel and crude oil
specifications and increasing the
value and marketability of your
fuels and crude oils.
© 2012 Baker Hughes Incorporated. All Rights Reserved. 34517
Let us increase your fuel and crude oil market value and maximize
your ROI with our fuel additive technology. At Baker Hughes, we
develop and manufacture fuel additives that enhance performance
and ensure your fuels meet your expectations and specifications.
Whatever your need—cold-flow additives, lubricity andconductivity improvers, H2S and mercaptan scavengers, dehazers
and demulsifiers, biocide and cetane improvers, or corrosion
inhibitors—we have the solution.
We’ll be there at every step to help you with better products
and superior service, from detailed product recommendations
to comprehensive laboratory assistance and around-the-clock
emergency support.
www.bakerhughes.com/fueladditives
we are the peopleof Baker Hughes.
and we can improvethe value of yourfuels and crude oils.
Frank Sluga, Account Manager
Select 56 at www.HydrocarbonProcessing.com/RS

5/16/2018 Hydrocarbon Processing February 2012 - slidepdf.com
http://slidepdf.com/reader/full/hydrocarbon-processing-february-2012 39/93
38 I FEBRUARY 2012 HydrocarbonProcessing.com
HPI CONSTRUCTION BOXSCORE UPDATECompany City Project Ex Capacity Unit Cost Status Yr Cmpl Licensor Engineering Constructor
AFRICA
Nigeria NNPC Bayelsa Refinery 300 bpd 2800 P 2016Nigeria NNPC Kogi Refinery TO 150 bpd 23000 P 2016Nigeria NNPC Koko/Delta State Petrochemical Complex None P 2016Nigeria NNPC Lagos Refinery 300 bpd 2800 P 2015
ASIA/PACIFIC
China CNOOC Oil & Petrochem Huizhou Lube Hydroprocessing 9 Mbpd C 2011 CLG CLGChina CNOOC Huizhou Refinery EX 440 bpd 6.6 C 2012 WorleyParsonsChina Sinochem Quanzhou Hydrotreater, Resid 48 Mbpd U 2013 CLG CLG
China TBC Undisclosed Alkylation, Sulf Acid 11.5 bpsd E 2014 MECS|Stratco|Bayer|DuPontIndia Bharat Oman Refineries Bina Diesel, HDS 36 Mbpd C 2011 CLG CLGSouth Korea Hyundai Oilbank Co., Ltd. Daesan Hydrotreater, Resid 66 Mbpd C 2011 CLG CLGSouth Korea SK Energy Incheon Hydrocracker 40 Mbpd A 2016 CLG CLG SKECTaiwan Chinese Petroleum Corp Kaohsiung Refinery Lube Hydroprocessing 6 Mbpd H CLG CLGVietnam NSRP Nghi Son EZ Hydrotreater, Resid 105 Mbpd 6200 U 2013 CLG CLG
CANADAAlberta North West Upgrading Edmonton Hydrocrack, Resid 29 Mbpd U 2013 CLG CLG KBRAlberta OPTI Canada Inc Fort McMurray/Long Lake Hydrocracker (2) 54 Mbpd H CLG Fluor|CLGAlberta Fort Hills Energy Sturgeon Lake Hydrotreater 120 bpd U 2015 CLG CLGNew Brunswick Irving Oil Ltd Saint John/Eider Rock Hydrotreater 80 Mbpd H CLG CLG
EUROPE
Belgium BASF Antwerp Sulfuric Acid 420 tpy C 2012Croatia INA Sisak Hydrocracker 20 Mbpd H CLG CLG Lummus TechnologFrance Total Gonfreville Lube Hydroprocessing 8 Mbpd H CLG CLGItaly SARAS SpA Sarroch Hydrocracker, Mild RE None U 2013 Shell Global FW FWLithuania Mazeikiu Nafta Mazeikiai/Juodeikiai Hydrocracker 35 Mbpd H CLG CLGNorway Statoil Mongstad Carbon Dioxide Capture None E Jacobs JacobsPoland Glimar Gorlice Hydrocracker 5 Mbpd U 2012 CLGRussian Federation Rosneft Tuapse Hydrotreater, Diesel 2 82 Mbpd 90 U 2014 CLG CLGUzbekistan Sasol/Petronas/Uzbekneftegaz Ustyurt GTL 1.4 MMtpy 817 F 2014 Technip|Samsung Eng
LATIN AMERICABrazi Petrobras Rio de Janeiro Water Treatment 2000 m3/hr U 2014 Toyo Engineering CSurinam Staatsolie Paramaribo Hydrocracker 10 Mbpd 800 U 2013 CLG CB&I Lummus|Saipem Aker Solutions|SaipTrinidad Petrotrin Pointe-a-Pierre Alkylation, Sulf Acid 10000 bpd U 2012 MECS|Stratco|DuPont Bechtel|Techint\Lummus Techint\Lummus
MIDDLE EAST
Iraq SRC Basra/Al Basrah Refinery RE 140 bpd S 2012 ShawIraq Iraq Ministry of Oil Kirkuk Refinery 150 Mbpd F 2016 ShawIraq SRC Maissan Refinery 150 Mbpd 470 F 2016 ShawOman Orpic Sohar Hydrocracker 96.8 bpd E 2015 CB&ISaudi Arabia Saudi Aramco\Total JV Al Jubail Hydrocracker (2) 61 Mbpd U 2012 CLG
UNITED STATESDelaware Delaware City Refining Co LLC Delaware City Hydrocracker 65 bpd 100 U 2015 PBF HoldingDelaware Delaware City Refining Co LLC Delaware City Hydrogen None 100 U 2015 PBF HoldingTexas Chevron Phillips Chemical Baytown Ethylene 1.5 Mtpy U 2013 Shaw Shaw
YOUR GUIDE TO PROFITABLE PLANNINGIN 2012 AND BEYONDProduced by the staff of Hydrocarbon Processing,HPI Market Data 2012 is the industry’s most trustedforecast of capital, maintenance and operatingexpenditures for the petrochemical, refining andnatural gas/LNG industries. Order your copy and gainactionable insight and analysis to drive your planningand global activities towards increased profitabilityand market share in 2012 and beyond.
HPI MARKET DATA2012
ORDER ONLINE AT
GULFPUB.COM/2012HPI
OR CALL +1 (713) 520-4426
CONSTRUCTION BOXSCORE
DATABASE ONLINEwww.ConstructionBoxscore.com
THE DEFINITIVE SOURCE FOR TRACKINGGLOBAL HPI CONSTRUCTION ACTIVITYFor more than 50 years, Hydrocarbon Processing magazineremains the only source that collects and maintains dataspecifically for the HPI community, publishing up-to-the-minute construction projects from around the globe withour online product, Boxscore Database.
FOR A FREE 2-WEEK TRIAL,contact Lee Nichols at +1 (713) 525-4626

5/16/2018 Hydrocarbon Processing February 2012 - slidepdf.com
http://slidepdf.com/reader/full/hydrocarbon-processing-february-2012 40/93
Are you looking to step up plant performance?
Topsøe’s next generation BRIM™ catalysts offer refiners the opportunity to increase
performance through an increase in catalyst activity.
Using the original BRIM™ technology Topsøe has developed several new catalysts, resulting
in higher activity at lower filling densities.
The next generation BRIM™ catalysts display
- high dispersion
- high porosity
- high activity
We look forward to stepping up your performance!
WWW.TOPSOE.COM
Stepping up performance– next generation BRIM™ technology
Select 69 at www.HydrocarbonProcessing.com/RS

5/16/2018 Hydrocarbon Processing February 2012 - slidepdf.com
http://slidepdf.com/reader/full/hydrocarbon-processing-february-2012 41/93
In 2011, we worked 57,919,271 hours with a total
Lost-Time Incident Rate of 0.02.
At CB&I, safety isn’t just a priority, it’s a core value.
Safety…It’s a core value
www.CBI.com
Select 58 at www.HydrocarbonProcessing.com/RS

5/16/2018 Hydrocarbon Processing February 2012 - slidepdf.com
http://slidepdf.com/reader/full/hydrocarbon-processing-february-2012 42/93
HPI VIEWPOINT
HYDROCARBON PROCESSING FEBRUARY 2012 I 41
Just about everyone favors protecting the environment, butfew have done as much as the members of the American Fuel andPetrochemicals Manufacturers (AFPM) to improve the US’ airand water quality.
Members of AFPM (formerly the National Petrochemicaland Refiners Association, or NPRA) are strongly committed toenvironmental protection. We have an outstanding record of
compliance with the Clean Air Act, and have invested hundredsof billions of dollars to dramatically reduce emissions as measuredby the US Environmental Protection Agency.
As a result of our emiss ions reductions and reductions by other industries, the US’ air today is cleaner than it has been ingenerations.
EPA data shows that total emissions of the six principal airpollutants in the US have dropped by 57% since 1980 and ozonelevels have decreased by 30%. These reductions occurred even asindustrial output has increased. And the EPA expects there willbe continued reductions in the years ahead under regulationsalready in place.
Today, US refiners manufacture the cleanest fuels in the world
and emissions are lower than anywhere else. Our products andfacilities are cleaner than those in any other nation. Our invest-
ments have resulted in significant cuts in sulfur levels in gasoline,reducing them by 90% just since 2004.
Between 1996 and 2005, refiners cut emissions of chemicalslisted under the Toxic Release Inventory by 36% and reducedemissions classified as hazardous air pollutants by 50%. Thecomparable reductions by chemical manufacturers in the sametime period are 61% under the Toxic Release Inventory and 64%of hazardous air pollutants.
Despite the great progress that has been made, we are con-cerned that the EPA and other government agencies have movedfrom reasonable regulation to overregulation that makes unreal-
istic and often conflicting demands on fuel and petrochemicalmanufacturers. These demands frequently have little or no signifi-cant environmental benefit but cost millions, and even billions, of dollars to meet, increasing energy costs for US consumers.
One example is the proposed rule by the EPA to further reducesulfur levels in gasoline. EPA is proceeding with what is known asa Tier 3 rulemaking as part of its general authority to regulate fuelsunder the Clean Air Act. The rule could lead to significant domes-tic fuel supply reductions, higher petroleum product imports,increased consumer costs, increased refinery emissions, the closureof US refineries that would leave their workers unemployed, andreduced energy security.
Another example of overregulation involves gasoline contain-
ing 15% ethanol, or E15. EPA decided to allow E15 to be soldinto the marketplace for use in cars and light trucks produced inmodel year 2007 and later, and then for model year 2001 andlater. In addition to being what we consider a violation of law,these decisions hold the potential to create significant problemsin the marketplace, including misfueling and engine damage.
The impact of overregulation is clear to see. A Department of Energy report issued in 2011 found that refining margins havebeen continuously decreasing over the past four years. The reportalso concluded that the compounded burden of federal regulations was a significant factor in the closure of 66 petroleum refineries inthe US in the past 20 years.
Just since 2008, the recession and refinery closures have led
to 3,000 lost jobs at US refineries. A handful of refineries arethreatened with closure in the near future if they cannot be sold. Although some of the lost supply from shuttered refineries hasbeen made up through capacity expansions at other facilities, therate of new capacity coming online is decreasing due to financialpressures and the threat of overseas competition.
Those lost American jobs aren’t simply disappearing, they aremoving overseas to foreign competitors not strangled by burden-some environmental and other business overregulation.
Foreign industries emit greenhouse gases (GHG) into thecommon atmosphere that every nation on Earth shares. GHGemissions produced in China have the same impact on our envi-ronment as emissions generated in the United States. Simply
shifting emissions from the US to other nations has absolutely no environmental benefit, but great economic cost here at home.
Charles T. Drevna is the president of the
American Fuel and Petrochemical Manufac-
turers (AFPM), a national trade association
with more than 450 members, including
those who own or operate virtually all US
refining capacity and most all petrochemical
manufacturers in the US. Prior to his election
as president in 2007, Mr. Drevna served as
AFPM’s executive vice president and director of policy and planning.
Mr. Drevna has an extensive background in energy, environmental
and natural resource matters, with more than 36 years of broad
energy industry experience in legislative, regulatory, public policyand marketplace issues. Prior to joining AFPM, Mr. Drevna served
as director of state and federal government relations for Tosco, Inc.,
the nation’s largest independent petroleum refiner, where he was
responsible for liaison with Congress, federal regulatory agencies and
state governments. Mr. Drevna also served as director of government
and regulatory affairs for the Oxygenated Fuels Association, where
he held similar responsibilities, and as vice president at Jefferson
Waterman International, a Washington, DC-based consulting group,
where he specialized in domestic and international energy issues. Mr.
Drevna also served as vice president of public affairs at the Sun Coal
Co., a Knoxville, Tennessee-based unit of Sun Co., Inc. (Sunoco), and
with the parent company as manager of public policy at its corporate
headquarters in Philadelphia, Pennsylvania. Mr. Drevna has a signifi-
cant background in environmental management that includes service
as director of environmental affairs for the National Coal Associationin Washington, DC, and as supervisor of environmental quality con-
trol for the Consolidation Coal Co. in Pittsburgh, Pennsylvania. He
received his BA degree in chemistry from Washington and Jefferson
College and performed graduate work at Carnegie-Mellon University.
The high cost of overregulationThe US does not need to choose between a healthy environment
and a healthy economy, it can have both
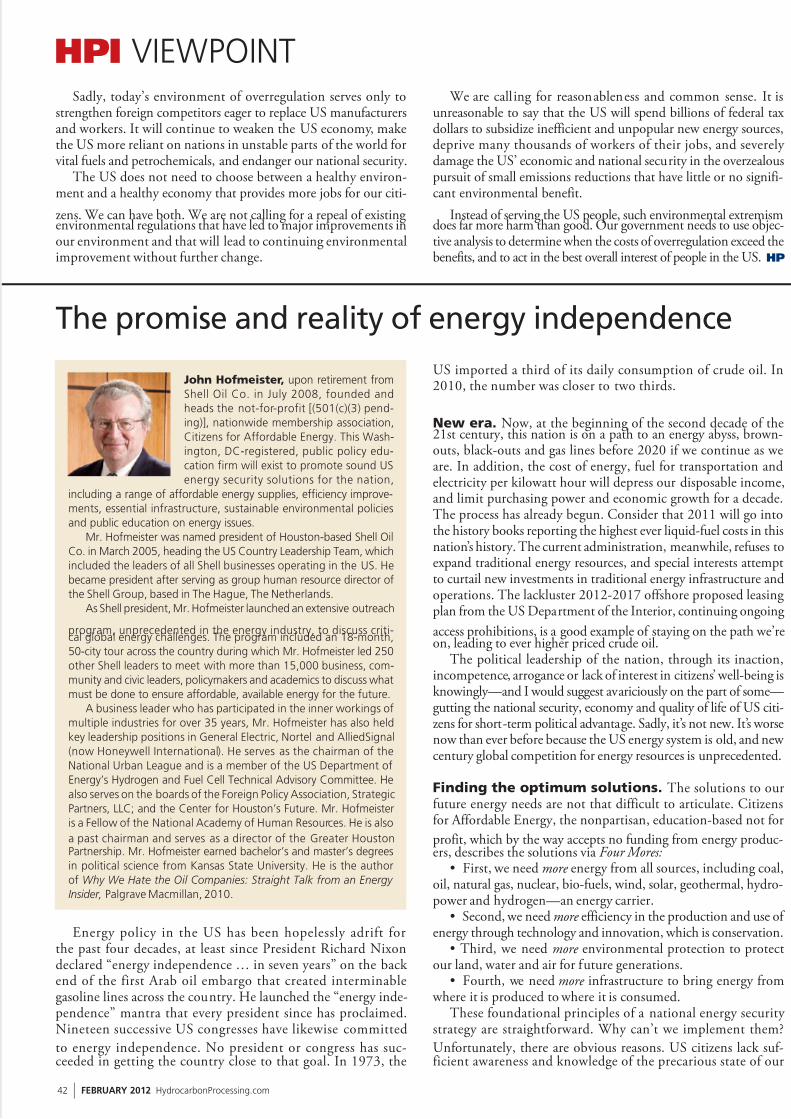
5/16/2018 Hydrocarbon Processing February 2012 - slidepdf.com
http://slidepdf.com/reader/full/hydrocarbon-processing-february-2012 43/93
HPI VIEWPOINT
42 I FEBRUARY 2012 HydrocarbonProcessing.com
Sadly, today’s environment of overregulation serves only tostrengthen foreign competitors eager to replace US manufacturersand workers. It will continue to weaken the US economy, makethe US more reliant on nations in unstable parts of the world forvital fuels and petrochemicals, and endanger our national security.
The US does not need to choose between a healthy environ-ment and a healthy economy that provides more jobs for our citi-
zens. We can have both. We are not calling for a repeal of existingenvironmental regulations that have led to major improvements inour environment and that will lead to continuing environmentalimprovement without further change.
We are calling for reasonableness and common sense. It isunreasonable to say that the US will spend billions of federal taxdollars to subsidize inefficient and unpopular new energy sources,deprive many thousands of workers of their jobs, and severely damage the US’ economic and national security in the overzealouspursuit of small emissions reductions that have little or no signifi-cant environmental benefit.
Instead of serving the US people, such environmental extremismdoes far more harm than good. Our government needs to use objec-tive analysis to determine when the costs of overregulation exceed thebenefits, and to act in the best overall interest of people in the US. HP
The promise and reality of energy independence
Energy policy in the US has been hopelessly adrift forthe past four decades, at least since President Richard Nixondeclared “energy independence … in seven years” on the back end of the first Arab oil embargo that created interminablegasoline lines across the country. He launched the “energy inde-pendence” mantra that every president since has proclaimed.Nineteen successive US congresses have likewise committed
to energy independence. No president or congress has suc-ceeded in getting the country close to that goal. In 1973, the
US imported a third of its daily consumption of crude oil. In2010, the number was closer to two thirds.
New era. Now, at the beginning of the second decade of the21st century, this nation is on a path to an energy abyss, brown-outs, black-outs and gas lines before 2020 if we continue as weare. In addition, the cost of energy, fuel for transportation andelectricity per kilowatt hour will depress our disposable income,and limit purchasing power and economic growth for a decade.The process has already begun. Consider that 2011 will go intothe history books reporting the highest ever liquid-fuel costs in thisnation’s history. The current administration, meanwhile, refuses toexpand traditional energy resources, and special interests attemptto curtail new investments in traditional energy infrastructure andoperations. The lackluster 2012-2017 offshore proposed leasingplan from the US Department of the Interior, continuing ongoing
access prohibitions, is a good example of staying on the path we’reon, leading to ever higher priced crude oil.
The political leadership of the nation, through its inaction,incompetence, arrogance or lack of interest in citizens’ well-being isknowingly—and I would suggest avariciously on the part of some—gutting the national security, economy and quality of life of US citi-zens for short-term political advantage. Sadly, it’s not new. It’s worsenow than ever before because the US energy system is old, and new century global competition for energy resources is unprecedented.
Finding the optimum solutions. The solutions to ourfuture energy needs are not that difficult to articulate. Citizensfor Affordable Energy, the nonpartisan, education-based not for
profit, which by the way accepts no funding from energy produc-ers, describes the solutions via Four Mores:
• First, we need more energy from all sources, including coal,oil, natural gas, nuclear, bio-fuels, wind, solar, geothermal, hydro-power and hydrogen—an energy carrier.
• Second, we need more efficiency in the production and use of energy through technology and innovation, which is conservation.
• Third, we need more environmental protection to protectour land, water and air for future generations.
• Fourth, we need more infrastructure to bring energy from where it is produced to where it is consumed.
These foundational principles of a national energy security strategy are straightforward. Why can’t we implement them?
Unfortunately, there are obvious reasons. US citizens lack suf-ficient awareness and knowledge of the precarious state of our
John Hofmeister, upon retirement from
Shell Oil Co. in July 2008, founded and
heads the not-for-profit [(501(c)(3) pend-
ing)], nationwide membership association,
Citizens for Affordable Energy. This Wash-
ington, DC-registered, public policy edu-
cation firm will exist to promote sound US
energy security solutions for the nation,
including a range of affordable energy supplies, efficiency improve-
ments, essential infrastructure, sustainable environmental policies
and public education on energy issues.
Mr. Hofmeister was named president of Houston-based Shell Oil
Co. in March 2005, heading the US Country Leadership Team, which
included the leaders of all Shell businesses operating in the US. He
became president after serving as group human resource director of
the Shell Group, based in The Hague, The Netherlands.
As Shell president, Mr. Hofmeister launched an extensive outreach
program, unprecedented in the energy industry, to discuss criti-cal global energy challenges. The program included an 18-month,
50-city tour across the country during which Mr. Hofmeister led 250
other Shell leaders to meet with more than 15,000 business, com-
munity and civic leaders, policymakers and academics to discuss what
must be done to ensure affordable, available energy for the future.
A business leader who has participated in the inner workings of
multiple industries for over 35 years, Mr. Hofmeister has also held
key leadership positions in General Electric, Nortel and AlliedSignal
(now Honeywell International). He serves as the chairman of the
National Urban League and is a member of the US Department of
Energy’s Hydrogen and Fuel Cell Technical Advisory Committee. He
also serves on the boards of the Foreign Policy Association, Strategic
Partners, LLC; and the Center for Houston’s Future. Mr. Hofmeister
is a Fellow of the National Academy of Human Resources. He is also
a past chairman and serves as a director of the Greater HoustonPartnership. Mr. Hofmeister earned bachelor’s and master’s degrees
in political science from Kansas State University. He is the author
of Why We Hate the Oil Companies: Straight Talk from an Energy
Insider, Palgrave Macmillan, 2010.

5/16/2018 Hydrocarbon Processing February 2012 - slidepdf.com
http://slidepdf.com/reader/full/hydrocarbon-processing-february-2012 44/93
What you can do
with atouch of blue.
Improve your refinery profitability by maximizing the production of cleantransportation fuels with our leading residue upgrading technologies.
Deliver the best in refinery hydrogen production while reducingyour operating costs with our unique Terrace Wall™ reformer design.
Enhance the efficiency of your overall sulfur recovery to achieve peakoperating and environmental performance with our SRU technology.
You can…
And these are just the technology options. There is so much moreyou can do with a touch of blue. Visit www.fwc.com/touchofblue
Select 88 at www.HydrocarbonProcessing.com/RS

5/16/2018 Hydrocarbon Processing February 2012 - slidepdf.com
http://slidepdf.com/reader/full/hydrocarbon-processing-february-2012 45/93
HPI VIEWPOINT
44 I FEBRUARY 2012 HydrocarbonProcessing.com
present energy system to appreciate how vulnerable this nationis, or they would, otherwise, be demanding such solutions now.
The energy industry is not responsible for the nation’s energy secu-rity policy, and it has figured out how to make money the way things are, so why change? The governance of energy by ourfederal government is broken, dysfunctional and unfixable in itscurrent form. And state and local governments are not responsible
for the nation’s energy future.
The system is broken. The federal government has threefundamental problems:
• No. 1. Political time priorities trump energy time priori-ties 100% of the time. Two-year political cycles determine ourenergy future, predicated on the best tactical requirements for win-ning the next election. Energy time, meanwhile, requires decadesto plan, construct, commission and operate, and it demands pre-dictable investment and consistent regulatory regimes. Govern-ment ignores energy time, so little or nothing happens. It’s why ourfleet of coal plants, 50% of supply, averages more than 40 years of age, and our nuclear fleet, 20% of supply, averages over 30 years of
age, with no plans for refreshing or rebuilding either.• No. 2. The perverse partisanship that infects the lead-
ership and most of the membership of the Democratic and Republican parties cripples the legislative, executive and judi-cial branches of our government. The two-party system, careerpoliticians and life-time judges appointed by partisans ensure thecontinuity and sustained perversity of partisan outcomes, whichprecludes government from serving the needs of the people overthe needs of the party. Citizens have tolerated this reality, whichmeans that, until they get involved in the electoral process, thestatus quo continues.
• No. 3. Government has grown too large and complex to govern energy and the environment in any coherent or
comprehensible manner. Thirteen executive branch agencies
govern energy and the environment, along with the White House.Twenty-six standing committees and sub-committees govern bothin the House and Senate. More than 800 federal judges decideenergy and environmental policy, when required, from theirrespective benches. Because there is so much governance, govern-ment can’t govern. And the status quo continues.
We have a choice. Either we can continue as is until we slideinto the energy abyss and then figure out what’s next. Or, we cantake the initiative to do two things: 1) educate the public on theissues and solutions for our energy future and 2) change the gov-ernance of energy and the environment into a structure that will work. Citizens for Affordable Energy has committed itself to theformer. We’ll do everything that we can, and we welcome yourhelp. We desperately also need new governance.
A new independent regulatory agency, the Federal Energy Resources Board, established by an act of Congress, is the gover-nance we need. With four essential authorities, the four mores asdescribed earlier:
• More energy from all sources
• More technology for efficiency • More environmental protection for land, water and air,
aligned with more supply • More infrastructure, so we can provide our future energy.Drawing lessons from the Federal Reserve Act, an independent
board of governors selected for their knowledge and expertise— with terms of 14 years, like the Federal Reserve, and empoweredto serve the needs of the nation and our society, not the needs of apolitical party—can create the short (0 to 10 years), medium (10to 25 years) and long-term (25 to 50 years) plan that the nationneeds. Anything short of transformational change in governance will fail. The sooner this change happens, the better. If we wait, we suffer. But, it’s still available to pull us out of the energy abyss
that our political leaders are driving us into. HP
Transportation and alternative fuels in Asia
The dynamics of energy markets are increasingly determined
by the emerging economies, particularly those in Asia. The World Energy Outlook 2011 (WEO-2011) projects that, over the next
25 years, 90% of the projected growth in global energy demand will come from non-Organization of Economic Cooperationand Development (non-OECD) economies, with China aloneaccounting for more than 30%.
Transport is one of the major global consumers of energy,and, therefore, it has an important role in the global energy policy going forward. Cheap and reliable supplies of transpor-
tation fuels are the very lifeblood of our globalized economy.The WEO-2011 reckons that non-OECD car markets willexpand substantially as economic growth pushes up demandfor personal mobility and freight. Car sales in these markets areexpected to exceed those in the OECD nations by 2020. Theglobal passenger vehicle fleet is set to double, reaching almost1.7 billion by 2035.
Mobility drives fuel demand. Vehicle numbers and own-ership in the developing countries of Asia, China and India, inparticular, have powered ahead. The recent economic slowdownnotwithstanding, the underlying momentum supports the ris-ing level of motorization in parallel with higher affluence and
living standards. Industry research suggested that, come 2030,automobile holdings in China could surge to about 233 million
Clarence Woo is executive director of the
Asian Clean Fuels Association. He is a mem-
ber of the Coordinating Council of Clean
Air Initiatives for Asian Cities funded by the
World Bank and Asian Development Bank.
He was involved as project director in a highly
successful China Auto-Oil Program in collabo-
ration with the then China State EnvironmentProtection Agency (now the Ministry of Environment Protection) and
Tsinghua University. Mr. Woo is an industry member of the Partnership
for Clean Fuels and Vehicles under the United Nations Environment
Program, as well as a member of the Asian Society of Automotive
Engineers. Mr. Woo has more than 20 years of experience in the oil,
gas and petrochemical industries. He started his career with Mobil Oil
Singapore where he held various responsibilities in the fields of lubri-
cants, fuels, chemicals and LPG. As senior manager at Ethyl Corp., Mr.
Woo was responsible for petroleum additive sales in the Asia Pacific.
He also served as product manager of fuel additives, where he man-
aged fuel additive sales and fuel additive developments in Asia.

5/16/2018 Hydrocarbon Processing February 2012 - slidepdf.com
http://slidepdf.com/reader/full/hydrocarbon-processing-february-2012 46/93
HYDROCARBON PROCESSING FEBRUARY 2012 I 45
HPI VIEWPOINT
vehicles, although the ratio of China’s automobile holdings percapita in 2030 is forecast to remain only about 14%—a figurestill lower than the average in developed countries (55% in2004). In short, China is projected to have tremendous motor-ization growth potential even after 2030.1
The impact of such explosive growth in the vehicle pop-ulation in Asia is multi-faceted. One recurring theme is air
pollution issues. Governments in Asia have been battling thisproblem for years. Various studies have shown that both trans-portation fuels and motor vehicles are major contributors tothe degradation of air quality. The fact that Asia is home to the world’s fa stest-growing automotive vehicle population com-pounds this challenge.
Major pollutant source. Automotive transportation has beenidentified as the largest source of particulate pollution in mostcities where the vehicle pool tends to be concentrated; in somecases, up to 90% of pollution in a city comes from vehicle emis-sions. Cutting vehicle emissions is one of the most urgent priori-ties in Asia’s efforts to improve air quality. Cleaner conventionalfuels and vehicle pollution control technologies are essential
components of an effective clean air strategy.
Sources for fuels. Energy for automotive transport is domi-nated by petroleum, as it is widely available, relatively inex-pensive and it is the source from which easily transportableliquid fuels of high-energy density, such as gasoline and diesel,are made from. Unless there are significant breakthroughs intechnology and cost structure, passenger vehicle technology isexpected to remain dependent on petroleum fuels and internalcombustion engines for the foreseeable future.2
To the extent that gasoline and diesel are the predominantfuels in use at present, they are widely criticized to be the mainculprits of the air pollution problem. Supporters of alternative
fuels have argued and concluded—or simply assumed—that they are necessarily “cleaner” than petroleum-based fuels and moreenvironmentally sustainable. Indeed, much of the hype surround-ing alternative fuels has centered on the promise that they will oneday replace regular gasoline and diesel.
We cannot see the substitution happening in the foreseeablefuture. The immediate reality is that oil remains the world’s most vital source of energy and it will remain so for the next few decades, even under the most optimistic of assumptions about the paceof development and deployment of alternative technology. The WEO-2011 expects fossil fuels (coal, oil and natural gas) to con-tribute about 90% of the increase in primary energy consumptionin Asia from 2004–2030. Therefore, hydrocarbons will continue
to play an important role as energy sources.The immediate future for transport fuel is still petroleum-
based. Gasoline and diesel fuels are the lowest-cost option to theconsumer, as the production and supply infrastructure is already well established, mature and available on a large scale. What thismeans is that alternative fuels and cleaner conventional fuels willhave to coexist. A successful clean-fuel strategy must includeboth cleaner petroleum-derived fuels, as well as alternative fuels.
Asia needs cleaner petroleum-based fuels.
ALTERNATIVE FUELS IN ASIA
Alternative automotive fuels currently under development in Asia cover an entire spectrum: biofuels, liquefied petroleum gas
(LPG), compressed natural gas (CNG), hydrogen, alcohol fuels,electricity, gas-to-liquids (GTLs), biomass-to-liquids (BTLs),
methanol-to-gasoline (MTG) and solar.3 The penetration of thesetechnologies is still in the early stages, with biofuels (mainly bio-ethanol gasoline) arguably making the most headway.
The key drivers for alternative automotive fuels in Asia vary from country to country. The most common motivation is toreduce dependency on foreign oil (increased energy security),to combat climate change and to encourage environmental
sustainability.
Biofuels in Asia. Advocates maintain that biofuels can helpreduce dependency on oil imports and lower greenhouse gas(GHG) emissions, and revitalize rural landscapes in both devel-oped and developing countries. A 2009 report by USAID on thebenefits and risks of biofuels in Asia estimated that total biofuelsproduction in the region will have jumped more than five-foldfrom 2004 levels—from just over 2 billion liters to almost 12billion liters in 2008.
Despite this accelerated growth, biofuels only accounted for3% of the region’s transport fuel mix. The report pointed outthat “even at this scale, it is evident that biofuels incur signifi-
cant trade-offs and economic and environmental risks.” Criticsof biofuels argue that they compete with food crops for land, water and agrichemicals, do not deliver cost-effective carbonemissions reductions, demand a disproportionate amount of subsidies and incentives, and negatively impact biodiversity.Others highlighted concerns over lower energy content, netnegative energy balance, potentially increased emissions in vola-tile organic compounds (VOCs) and nitrogen oxide (NOx), andvehicle performance issues.
The USAID report purported that large-scale productionof biofuels is unlikely to make a significant contribution to Asia’s future transport energy demand. By 2030, biofuels areexpected to account for an estimated 3%–14% of the total
transport fuel mix in China, India, Indonesia, the Philippines,Thailand and Vietnam. This projection is predicated on thepremise that these countries will rapidly expand cultivation of efficient first-generation biofuel crops on under-utilized land while promoting second-generation “cellulosic ethanol” usingagricultural residues.
Countries in Asia that have biofuels—both bio-gasoline andbio-diesel—programs and targets in place include Thailand,China, India, the Philippines, South Korea and Vietnam. Thai-land arguably has made the most progress with ethanol gasoline, while the rest of the countries continue to struggle to achieve
0
2000
Asia PacificEuropeNorth AmericaLatin America
Africa
Source: ANGV
2001 2002 2003 2004 2005 2006 2007 2008 2009
1
2
N G v e h i c l e p o p u l a t i o n ,
m i l l i o n u n i t
3
4
5
6
Natural gas vehicle population by regions—2000 to 2009.FIG. 1

5/16/2018 Hydrocarbon Processing February 2012 - slidepdf.com
http://slidepdf.com/reader/full/hydrocarbon-processing-february-2012 47/93
HPI VIEWPOINT
46 I FEBRUARY 2012 HydrocarbonProcessing.com
meaningful success as they deal with resource limitations, espe-cially in feedstock sufficiency.
Non-biofuel alternative fuels in Asia. Various usagetrials and programs involving nonbiofuel alternative fuels arecurrently underway across the region. Among them, CNG andauto-LPG have captured the most attention. Nonliquid fuel
options such as hybrid, electric and hydrogen/fuel cell vehiclesare also being explored.
Asia Pacific is home to the world’s largest natural gas vehicles(NGV) market and is the second largest in auto-LPG vehicles.Based on December 2009 data, India is the world’s fifth largestNGV market while China is seventh. South Korea is the largestauto-LPG vehicle market globally, while Japan and Thailand arefourth and ninth respectively, as shown in Fig. 1 and Table 1. 5
India’s NGV industry leverages the extensive natural gaspipelines laid across western India to distribute CNG. Otherstates tap into the LPG distribution network to supply auto-LPG. The government is also targeting 1 million hydrogenvehicles by 2020, having approved the addition of a maximum
20% hydrogen to CNG. India is the only country in the worldthat has approved the use of hythane, a mixture of hydrogenand methane.
While China runs the seventh largest NGV fleet in the world,CNG and auto-LPG each accounts for less than 5% of the totalnatural gas and LPG consumption. China is the only country worldwide consider ing methanol fuels, given i ts sizable coalindustry, which provides the resources to convert coal to liquidalternatives such as methanol in gasoline and dimethyl ether(DME) as auto fuel. China now allows M15 (15% methanol)gasoline in selected provinces on a trial basis. The governmentalso plans to devote substantial resources to develop electricvehicles. Thirteen cities, supported by government subsidies, will
be pilot markets for 1,000 new energy vehicles by 2012. Japan’s emphasis is on next-generation vehicles—mostly hybrid
cars. The government-driven switch from gasoline-powered auto-
mobiles to next-generation vehicles is based on the premise of reducing dependence on oil and GHGs. The focus is on innova-tion of engines (battery and fuel cell) and innovation of fuels inthe form of biofuels (bio-ETBE). The official 2020 target is 50%new vehicle sales to be next-generation vehicles. At present, about10% of the country’s vehicle fleet is hybrid cars.
OUTLOOK FOR ALTERNATIVE FUELS IN ASIA Alternative fuels do offer promise in an energy-intensive world.
However, they clearly come with challenges. Countries in Asiastill have some ways to go before the large-scale adoption of thesefuels can be realized.
Reliability of feedstock, cost efficiencies and large-scale appli-cation are the key obstacles that most, if not all, alternative fuelsface. Prohibitively expensive to produce, alternative fuels can only be sustained, at this point, by extensive fiscal subsidies. This is aparticularly sensitive issue in Asia where fuel-market subsidies areprevalent. Subsidized-fuel markets limit the scope for higher prices, which make alternative fuels nonviable economically. This, in turn,constrains investments, thus limiting production volume. In Asia’s
context, this is a vicious cycle that is hard to break. Alternative vehicle technologies are emerging that use oil much
more efficiently or not at all, such as electric vehicles. But it willtake time and concerted policy and industry action for them tobecome commercially viable and penetrate markets. In addition Asian consumers are not ready to embrace alternative fuels, botheconomically and psychologically speaking. A quantum shift inconsumer mindsets, preferences and behavior is required before aconsumer market with critical mass will emerge.
While alternative fuels are not yet mature, they do have arole to play in this energy-hungry world. This is inevitable inlight of the urgency to combat climate change and the needto satisfy the ever-growing energy needs globally in the face of
limited resources. Volatile and persistently high oil prices, along with the need and political will to diversify energy sources andpotential environmental benefits will continue to feed interestin alternative fuels.
The way forward. As far as automotive fuels are concerned,cleaner petroleum-based fuels are the way to go. Governments will continue to tighten legislation governing (conventional) fuelquality and vehicle emissions to arrest the decline in air quality.Besides a progressive reduction in sulfur, refiners would also berequired to cut benzene, aromatics and olefins levels in gasoline.The intensifying policy focus on reducing carbon dioxide andGHGs while raising vehicle efficiency will also add pressure on
refiners to produce a product that meets the strictest demands. Actual experience in the US, the EU and Japan indicates that
the refining process technology is mature and accessible. There isa cache of experience in the installation and integration of new processes within existing refineries. Experience with the produc-tion, blending, distribution and quality monitoring of cleanerfuels and tools to optimize refining operations are also available.
Implications for hydrocarbons. The world will continueto face tremendous pressure to develop a radically different energy and power mix. The global energy landscape is moving from theoil age to the age of diversity in fuels. The era of cheap oil is over;the rules of the energy game are changing.
While many people hope for an immediate shift in our energy mix, Robert Bryce, senior fellow at the Manhattan Institute and
TABLE 1. Ranking of NGV population as percentage of
total vehicles as of December 2009
Ranking Country
1 Pakistan
2 Argentina
3 Iran
4 Brazil
5 India
6 Italy
7 China
8 Colombia
9 Ukraine
10 Bangladesh
11 Thailand
12 Bolivia
13 Egypt
14 US
15 Armenia
Source: IANGV

5/16/2018 Hydrocarbon Processing February 2012 - slidepdf.com
http://slidepdf.com/reader/full/hydrocarbon-processing-february-2012 48/93
HYDROCARBON PROCESSING FEBRUARY 2012 I 47
HPI VIEWPOINTauthor of Power Hungry: The Myths of Green Energy and the Fuels of the Future, argues that the vast scale of global energy demand,along with the limits of alternative sources, will prevent such achange from happening for decades to come. Global energy con-sumption has increased by 27% over the past decade alone. Putanother way, global energy use now totals about 29% of Saudi Arabia’s daily oil production, and hydrocarbons account for nearly
90% of that total. It is a matter of basic physics and simple maththat hydrocarbons will continue to feed the world’s immenseappetite for energy.6 HP
LITERATURE CITED1 For the purpose of this article, only on-road automotive fuels will be discussed.2 Komiyami, R., “Asia Energy Outlook to 2030: Impacts of energy outlook
in China and India on the world,” The Institute of Energy Economics, Japan,EDMC.3 “Transport technologies and policy scenarios to 2050,” World Energy
Council 2007.4 For the purpose of this discussion, “alternative fuels” is defined to be automo-
tive fuels not derived from crude oil.5 IANGV (www.iangv.org), 2009 statistics.6 World LP Gas Association, 2008 statistics.7 http://www.energyopportunities.tv/Cleaner-Energy/The-Bryce-Challenge
Clean fuel challenges for refiners
With the increased global focus on the environment, there isa great deal of talk about clean fuels today. Clean fuel issues andchallenges show up on the news, in politicians’ speeches anddebates, and from keynote speakers at industry conferences.
Clean fuels is a common topic in magazines, on the Internetand on television. So, it is no surprise that the term “cleanfuels” has come to mean different things to people aroundthe world. For the refining industry, “clean fuels” primarily refers to reducing contaminants and volatile components intransportation fuels to meet increasingly stringent fuel-productquality specifications.
Refiners must meet these challenges while delivering desiredfinancial results to their shareholders. The refining industry isstruggling because meeting the challenge requires capital invest-ment, and it comes at the same time that world crude quality isdegrading. Result: Refiners are being forced to decide to investthe capital necessary to meet the new clean fuel regulations—a
tough decision in its own right—or to make the tougher deci-sion to shutdown or sell one or more of their refining assets. Thequestion is: How will operating companies best address thesechallenges, especially with the added complexity that not allregions have the same challenges, standards and requirements?
Regional challenges. The implementation of more strin-gent fuel specifications differs significantly in various parts of the world:
Europe has led the way with clean fuel regulations, andrefiners have responded either by implementing the requiredrefining technologies to meet these challenges, or by shuttingdown or selling refineries to another company that is willing
to make the investment. European refiners must comply withnational regulations and European Union (EU) directives such
as Euro 5 diesel. The challenge that they face today is con-tinuing to produce low-sulfur, clean transportation fuels withemerging Renewable Energy Directive targets and regulatedcarbon dioxide limits.
Asia Pacific. The challenge for Asian refiners is to meet fast
growing demand while complying with new emissions and fuelquality regulations and directives. Each country has its ownchallenges with unique regulations that are largely modeled afterthe EU plan. However, while in the Western World, clean fuelsproduction is often a leading issue, in Asia, it is usually on par with many other national issues that divert attention and fund-ing. As a result, Asia’s initiatives are moving to compliance at amore measured pace.
Middle East. In the Middle East, ultra-sophisticated and com-plex refineries are being built to meet growing energy demand forthe region, and to help meet the growing demand in Asia Pacific.Transportation-fuel quality is becoming a higher priority in theMiddle East due to increasingly stringent regulations within the
region and tighter regulations for fuel products that are exportedto other regions.
Latin America. It is no surprise that clean-fuel regulations arebeing rolled out slowly over time in Latin/South America. Eachcountry has its own set of regulations. Many countries, led by Brazil, have the additional complexity of high ethanol and otherbiofuels blending requirements in transportation fuels.
North America. In the US, there are so many sophisticatedfuel regulations that refiners are extremely challenged by the task of keeping track of all requirements that must be honored. Thereare numerous regulatory bodies that manage the multiple fuelsprograms at both the national and state levels. Similar to Europe,US refiners are struggling with driving profitability, while meet-
ing the new regulations and supporting long-term renewablecontent and carbon emissions limits and goals.
Technology and innovation. How do refiners respondto the clean fuel challenges? The quick answer is the same way that they have always responded to industry challenges—by looking to new technology and innovation to provide practicalsolutions to meet the market demands and to create value fortheir shareholders.
Refining technology is typically provided by three types of companies: 1) those whose only business is technology, 2) those who are operating companies that also have technology busi-nesses, and 3) those who are engineering companies that also
have technology businesses. While each type of company has its advantages, alliances
Douglas N. Kelly, PE, is KBR’s vice presi-
dent of refining technology. He is respon-
sible for the refining licensing, engineering
and proprietary equipment business within
the KBR Technology business unit. Mr. Kelly
joined KBR in 2010. He started his career atShell Oil Co. Prior to his current position, he
held a variety of leadership positions with
Zero Emission Energy Plants, Invensys and Aspen Technology. He
represents KBR as an associate member on the board of the AFPM
(formerly NPRA). He holds a BS degree in chemical engineering from
The University of Oklahoma and has more than 25 years of refining
and petrochemical experience.
5/16/2018 Hydrocarbon Processing February 2012 - slidepdf.com
http://slidepdf.com/reader/full/hydrocarbon-processing-february-2012 49/93
HPI VIEWPOINT
48 I FEBRUARY 2012 HydrocarbonProcessing.com
between different types of companies provide refiners withadditional advantages. For example, alliances between engineer-ing and operating companies that have technology offer uniqueand valuable experience to help refiners overcome challengesand evaluate options. They bring together different perspectivesthat provide innovative ideas that address challenges in the mosteconomically attractive way.
To address the clean-fuel challenges, refiners are partnering with refining technology suppliers to provide innovative technol-
ogy options to help:• Meet clean fuel standards• Improve reliability and efficiency • Provide operational and crude handling flexibility • Evaluate options and support economic decisions.Significant improvements have been made by technology
companies in hydroprocessing technology and catalyst to addressthese challenges. This is only part of the solution. Bundling thesetechnologies with other adjacent technologies is often what makes
a project meet the economic hurdles necessary to support share-holder-value creation. Each refinery is unique! There are many different scenarios, configurations, issues and constraints thatmust be considered to determine the best and most cost-effectiveapproach to meeting clean-fuel regulations.
Refiners who have spare hydrocracking and/or hydrotreatingcapacity and can use existing vessels and equipment to meet the
new environmental specifications are rare. However, new develop-ments in technology and catalyst occasionally make it possible toaddress these challenges with no more than equipment revampsas a low-cost option.
Other refiners have determined that their best option is toadd new parallel hydroprocessing units to meet the requiredspecifications. One European refinery had to overcome sev-eral challenges to produce low-sulfur Euro IV diesel to meetregulations and significantly increase capacity. In addition tothe clean fuel challenge, the bottoms capacity of the vacuumtower was limiting. The optimum solution was to add a secondcrude vacuum column, a supercritical solvent deasphalting unitand a parallel hydrocracker. While this option was more capital
intensive, it provided the refinery with increased flexibility tohandle more challenging crudes and meet increasingly morestringent limits.
The future. Whatever your current refining situation, theconstraints on the refining industry are not getting any easier. Asregulations increase and crude quality decreases, refiners will needinnovative ideas and new developments from technology provid-ers to profitably meet the challenges ahead. HP
■ Each refinery is unique. There are
many different scenarios, configurations,
issues and constraints that must be
considered to determine the best and
most cost-effective approach to meeting
clean-fuel regulations.

5/16/2018 Hydrocarbon Processing February 2012 - slidepdf.com
http://slidepdf.com/reader/full/hydrocarbon-processing-february-2012 50/93
REGEN ULS®
Ultra Low Sulfur LPG Product
Sweet Solutions. ®
713.428.5000 | www.merichem.com
REGEN ULS uses new FIBER FILM ® patented
technology to achieve Ultra Low Sulfur levels
as low as 2ppm in LPG product by reducing
disulfide oil (DSO). See how this
next-generation technology, with lower
capital costs and a smaller footprint can
enhance your LPG processing, resulting in
greater profitability.
Merichem’s patented THIOLEX™ mercaptan
extraction process combined with REGEN ULS
means efficient, effective and environmentally
sound treating of your LPG for greater profits.
Select 84 at www.HydrocarbonProcessing.com/RS

5/16/2018 Hydrocarbon Processing February 2012 - slidepdf.com
http://slidepdf.com/reader/full/hydrocarbon-processing-february-2012 51/93
The BestCompressor
for
HydrogenService
gasoline desulfurization
diesel desulfurization
hydrotreating
steam methane reformer
PSA
dissociation process
Kobelco Screw CompressorsWith suction/discharge pressures up to 1500 psig (100 barg), Kobelco oil-injected
screw compressors are excelling in many hydrogen applications, including:
They are also ideal for other process gas services, such as fuel gas
boosting for gas turbines, natural gas, coke oven gas, PP and PEprocess gas, helium and more.
The screw design is inherently reliable and can operate continuouslyfor more than five years. Lube oil injected into the compressor acts as a sealant,
lubricant and coolant – allowing the compressor to operate more efficiently with hydrogen
and other low molecular weight gases.
Kobelco screw compressors are the environmental choice, too. They reduce power
consumption, eliminate emissions and decrease noise, pulsation and vibration.
Kobelco manufactures screw, reciprocating and centrifugal compressors, allowing us to provide
the optimum technology for you.
Ask Kobelco! The Best Solution for Any Gas Compression.
Kobelco Compressors America, Inc.
Houston, Texas
+1-713-655-0015
Kobe Steel, Ltd.
Tokyo +81-3-5739-6771
Munich +49-89-242-1842
www.kobelcocompressors.com
Select 68 at www.HydrocarbonProcessing.com/RS

5/16/2018 Hydrocarbon Processing February 2012 - slidepdf.com
http://slidepdf.com/reader/full/hydrocarbon-processing-february-2012 52/93
CLEAN FUELS SPECIALREPORT
HYDROCARBON PROCESSING FEBRUARY 2012 I
51
Consider total value when
optimizing catalytic cracking unitsLow rare-earth catalysts balance activity and selectivity against cost
S. ISMAIL, BASF Corp., Iselin, New Jersey
Rare earths are incorporated in the fluid catalytic crack-ing (FCC) manufacturing recipe to achieve higher catalystactivity and to improve hydrothermal stability. Rare earths
(REs) achieved these goals by enhancing catalytic activity andpreventing loss of acid sites during normal unit operations. Toaddress the specific needs of each FCC unit, catalyst manufactur-ers have traditionally formulated catalysts with various RE levelsthat allow for optimal unit performance. The level of REs in aspecific catalyst formulation depends on the operational severity and product objectives for the specific FCC unit. As gasolinedemand increased, refiners requested higher RE levels of theircatalyst formulation. RE levels gradually increased over time, andat the end of 2010, the average was 3%, with several refineriesrunning in excess of the average.
Fig. 1 shows 2010 historical data for Ecat samples analyzed by for REO. The data reflect all of the samples that were received and
analyzed in the fourth quarter of 2010 before the RE price spikeoccurred. Although operational demands have not changed withinthe industry, current RE market conditions have put pressure oncatalyst manufacturers, along with refiners, to reassess the role of REs in the FCC industry.
When looking at the catalytic options, it is critical to look atthe total value, and not just the cost, of REs. Catalyst suppliers haveactively helped their customers analyze their operations and deter-mine when a drop in RE levels is beneficial. As will be discussed inthis article, the cost/benefits and possible performance deficits of this option should be clearly understood before making a change.
RE supply—demand balance. The supply/demand balance
of the global RE market became disconnected when China, whichproduces 95% of the world’s supply of REs, severely cut its exportquotas in July 2010. China is not expected to change its position,despite the World Trade Organization’s warning that reluctance toshare its RE supplies constitutes a violation of the global trade rules. At first glance, export quotas for the second half of 2011 indicateda significant increase over the 2010 numbers. However, on closerexamination, the new quotas reveal that nothing has changed; thenew figures merely include ferrous alloys. These were not part of the quota in 2010. Market expectations are that price volatility will continue until new suppliers enter the market and reestablishthe supply/demand balance. In a recent research note issued by Goldman Sachs, prices are likely to rise in the short term, over the
next 18 months, and then soften in the 2013 to 2015 period.1 Thissoftening of RE prices will most likely be due to additional capac-
ity coming online from non-Chinese sources that are expected tosignificantly shift the supply picture in the future.
During the interim period, until RE prices once again nor-
malize, members of the refining industry are looking for ways toaddress the increase in catalyst costs within their current budget-ary constraints. Instinctively, the drive is to opt for lower RE-catalyst formulations to offset the costs of the raw materials. Whilethis action can have an immediate and successful impact on theoperating budget, it may not be the best decision for the longterm. A total solution should encompass both the profitability of yield slate against the operating expense, which includes total cata-lyst costs. Understanding the constraints of a specific FCC unit iscritical in making the optimal economic decision. Suppliers haveproactively worked with their customers to examine how low-REcatalytic options can fit the needs of specific users.
Technological differences. While all catalyst companiescan offer catalyst products with lower RE levels, the refiner shouldequally look for options that balance lower RE levels with increas-ing activity, so that conversion is sustained at a constant catalystaddition rate from a higher zeolite content as represented by anactive and selective total surface area. This can be achieved by using in-situ technology, which is particularly well-suited forthis application. The in-situ process begins with a catalyst sizedmicrosphere. The ensuing step consists of growing the zeolitecrystal within the microsphere. The zeolite in-situ process servestwo functions: 1) it provides the active and selective area, and 2)it provides the strength imparted to the microsphere.
This technology is distinct from other catalyst technologies.
With incorporated technology, a single particle is formed consist-ing of an admixture of clay, zeolite and binder. The incorporated
0
5
10
15
20
25
30
35
40
45
0.5 1.0 1.5 2.0 2.5 3.0 3.5 4.0 4.5
RE, wt%
N u m b e r o f s a m p l e c o u n t s
0
10
20
30
40
50
60
70
80
90
100
C u m u l a t i v e p e r c e n t o f
s a m p l e s a t R E w t % l e
v e l
Distribution of RE in FCC catalyst samples.FIG. 1

5/16/2018 Hydrocarbon Processing February 2012 - slidepdf.com
http://slidepdf.com/reader/full/hydrocarbon-processing-february-2012 53/93
CLEAN FUELSSPECIALREPORT
52 I FEBRUARY 2012 HydrocarbonProcessing.com
catalyst technique is inherently limited to an upper level of zeolitecontent, and it cannot increase surface area without seriously com-promising the strength to withstand breakage in the FCC unit.
The decision to change catalyst or reformulate catalyst is nota trivial one. Simply reducing RE levels of the catalyst withouta comprehensive study can result in severe yield penalties and,possibly, force the refinery to cut feedrates to the FCC unit. All
such consequences are economically prohibitive. Helping refin-ers evaluate the effect of RE levels on key catalytic variables canreduce the uncertainty of change and facilitate the decision tomove to a reformulation of their FCC catalyst when appropri-ate. The specifics of this change in formulation and the impactof REO levels on conversion, as well as the effect of fresh catalystsurface area and addition rate, will be examined in this article.
How RE affects FCC catalyst performance. When con-sidering a move to reduce the RE component in the catalyst, it iscritical to grasp the performance shifts and economic impact of such a change. The economic impact comprises two aspects. It isa function of total catalyst cost and the value created from a given
catalyst formulation. Reducing the RE level will have an immediatecost saving. But this calculation alone will not give the true profitgeneration picture if the margin benefits from the yield slate are notincluded. To illustrate the impact of such changes on key catalyticperformance indicators, a proprietary FCC simulation model wasused to study the effects of RE levels, catalyst addition rates andfresh surface area for FCC units operating with these feedstocks:
• Hydrotreated vacuum gasoil (VGO)—Refinery A • Standard VGO—Refinery B• Moderate resid—Refinery C• Heavy resid—Refinery DThe selected feed types can provide an analysis that covers the
whole range of feed diets (types) used in FCC operations. TheBase Case for all cases was 3% RE in the catalyst. As seen from
Fig. 1, this was the average level of REs used in 155 FCC units.For each operation, the RE level was changed to model thesescenarios:
• Impact of REO level on conversion, at constant catalystaddition rates and unit conditions
• Impact of fresh catalyst addition rate, to restore Base Caseconversion at constant unit conditions
• Effect of increasing fresh catalyst surface area, at constantcatalyst addition rates and unit conditions.
This approach was adopted because the first negative impactfrom RE reductions is a decrease in catalyst activity. The secondand third bullet points were methods to recover the loss in activity through either increased catalyst additions or through choosing
catalyst with a higher intrinsic activity that is achieved throughincreased surface area. Table 1 summarizes the Base Case for thefeed types and Ecat properties. Table 2 provides the operatingconditions and yields of the four scenarios.
Unit performance as RE is reduced. In the first instance,the FCC simulation model was run by holding all variables con-stant with the exception of the RE levels of the catalyst. The resultis a fairly smooth logarithmic curve with increasing conversionand lower bottoms yields with increasing RE levels in the catalysts,as shown in Fig. 2. As the RE levels decrease, the conversion of feed to higher valued products will drop.
Restoring conversions with catalyst additions. Thereare two catalytic approaches to reduce RE levels in the fresh cata-lyst and, at the same time, restore the unit to conversion levels of the Base Case (old RE level):
70
71
72
73
74
75
76
0.0 0.5 1.0 1.5 2.0 2.5 3.0 3.5
RE, wt%
C o n v e r s i o n ,
%
7.0
7.5
8.0
8.5
9.0
9.5
10.0
F C C b o t t o m s
Conversion and bottoms changes with changing RE levels
in catalyst at constant catalyst additions and constant TSAarea at constant operating conditions.
FIG. 2
TABLE 1. Feed and equilibrium catalyst propertiesfor Base Cases
Refinery A B C D
API 26.3 22 22.1 20.1
Concarbon, wt% 0.3 0.3 0.9 4.5Sulfur, wt% 0.5 0.7 0.5 0.4
Basic N2, wt% 0.03 0.05 0.04 0.04
Distillation
% 650 °F– 15 20 7 4
% 1,000 °F+ < 10 < 10 10 20
Ecat properties
TSA, m2/g 180 152 116 130
Activity 75 73 72 72
REO, wt% 3 3 3 3
TABLE 2. Operating conditions and yields
Refinery A B C D
Mode of operation Full burn Full burn Partial burn Partial burn
Rx outlet temperature, °F 996 997 995 977
Regen. bed temp, °F 1,326 1,291 1,287 1,319
C/O 5.3 7.1 7.7 8.7
Conversion, vol% 81.9 75.4 70.3 74.1
LPG, vol% 28.8 27.4 29.1 24.4
Gasoline, vol% 65.3 58.9 53.6 60.7
LCO, vol% 11.5 17.1 20.9 15.7
Bottoms, vol% 6.7 7.5 8.7 10.2
TABLE 3. Increasing the catalyst fresh surface area toreduce RE for equal conversion at contact addition rates
TSA, m2/gm
Case 3% RE 2.5% RE 2% RE 1.5% RE 1% RE
A 350 370 410
B 325 344 380 406
C 312 330 365 390D 265 291 318 358 399

5/16/2018 Hydrocarbon Processing February 2012 - slidepdf.com
http://slidepdf.com/reader/full/hydrocarbon-processing-february-2012 54/93
CLEAN FUELS SPECIALREPORT
HYDROCARBON PROCESSING FEBRUARY 2012 I
53
Case A. The refiner can increase catalyst additions at lowerRE levels.
Case B. The refiner can increase the activity via higher zeolitecontent as represented by total surface area (TSA) of the catalyst.
In Case A, it is quite possible and often economically viable toincrease catalyst additions to restore the conversion to the BaseCase levels. Fig. 3 illustrates how catalyst rates can restore the unit
to the Base Case conversion. As can be seen from the trend, whenthe desired decrease in RE is low to moderate (3 wt% RE to 2.5 wt% RE or 2 wt% RE), the objective can be achieved fairly eas-ily. For Refineries B, C and D, this will require about 10% morecatalyst at an RE level of 2% as compared to the Base Case of 3%RE, while Refinery A will require a higher level of fresh catalyst,as this refinery operates at a higher severity. However, the productslate for the same conversion may be different, and the refiners will need to check whether there may be constraints that willprevent the refinery from taking a particular action.
In Case B, catalysts with a higher surface area (providing higheractivity) furnish the flexibility to lower RE content of the catalystand they can maintain performance and conversion at equal
catalyst addition rates.The in-situ technology allows increasing the TSA to a greater
extent. The application of this technology depends largely on thestarting point of the TSA being used by the refinery. From Table3, it can be seen, that, if the refiner operating at a lower surfacearea, such as D, then it has a larger range of opportunity to reduceRE content than that of a refiner operating with a blend like A.
To further understand this example, let us consider: RefinerB using a catalyst with 3% RE, 325 m2/g fresh TSA, and a daily consumption of 2 tpd of catalyst. The refinery would like tolower catalyst costs by reformulating the catalyst to a 1.5 wt%RE. Assuming that the refinery can handle higher levels of liq-uefied petroleum gas (LPG) in the wet-gas compressor and gas-
concentration system, there are three possible routes a refinery can follow to reduce RE in the catalyst while maintaining presentconversion levels:
Case 1. Increase catalyst additions containing lower RE levels(exchanged on the zeolite). If we look at Fig. 3, then the catalystquantity for this simulation is 20% higher. Therefore, the refinery can maintain conversion by increasing catalyst usage from 2 tpdto 2.4 tpd but at a low RE level, which is 50% lower than theBase Case.
Case 2. Reformulate the catalyst by keeping the total catalystaddition rate the same but increasing the fresh TSA. In this case,from Table 3, it can be achieved by increasing the TSA from 325m2/g to 406 m2/g.
Case 3. Use a combination of Cases 1 and 2. The refinery could increase catalyst additions by 10% (2.2 tpd) and increaseTSA of the catalyst from 325 m2/g to 350 m2/g. This idealizedexample is to illustrate a means to address the problem. Of course,individual needs may be different and they must be considered when making a decision. In either case, it is possible to com-bine the technology options of Cases A and B to meet a specificrefiner’s FCC requirement.
Constraints. As was discussed previously, this artic le only addresses generic options. Refiners and catalyst users should talk to their suppliers to achieve a carefully calibrated decision basedon intimate knowledge of operations needs and timing. When
conversion is restored to the Base Case at lower RE levels, the unitnecessarily produces a larger amount of LPG and less gasoline. This
is fundamentally due to the chemistry of the process. RE exchangedon the zeolite will increase the hydrogen-transfer reaction, which will push the increased conversion toward paraffins and aromatics atthe cost of reducing cycle oil naphthenes and olefins. The source of the naphthenes, which supply the hydrogen for the hydrogen trans-fer to take place, is usually in the light cycle oil (LCO) boiling range:
LCO naphthenes + gasoline olefinst
LCO aromatics +gasoline paraffins
The aromaticity of the gasoline does not change much. But,in most cases, it will increase the aromaticity of the LCO stream,thus lowering its cetane number. By reducing RE in the catalyst,the resulting gasoline will have a higher level of olefins, some of which will over-crack, yielding more LPG. Regarding the LCOquality, lowering the RE content improves the quality of theLCO; the LCO’s cetane number will increase marginally froma low base. Increasing the paraffinicity of LCO will also slightly increase its API gravity.
From Fig. 4, when the RE is reduced from 3 wt% to 1 wt%,then the gasoline decreases monotonically from 58.85 vol% to
57.7 vol%. Concomitantly, the LPG make increases from 27.4vol% at 3 wt% RE and rises to 29.1 vol% at an RE level of 1 wt%in the catalyst. This may not be an issue for some refineries that
100
110
120
130
140
150
160
170
180
0.0 0.5 1.0 1.5 2.0 2.5 3.0 3.5
RE, wt%
R e q u i r e d f o r c o
n s t a n t a d d i t i o n a l c o n v e r s i o n ,
%
A B C D
Increasing catalyst addition rate can restore conversion tothe Base Case.
FIG. 3
57.6
57.8
58.0
58.2
58.4
58.6
58.8
59.0
0.0 0.5 1.0 1.5 2.0 2.5 3.0 3.5
RE, wt%
G a s o l i n e ,
v o l %
27.2
27.4
27.6
27.8
28.0
28.2
28.4
28.6
28.8
29.0
29.2
L P G ,
v o l %
Gasoline make (vol%) vs. RE level of the FCC catalystagainst LPG production (vol%).
FIG. 4
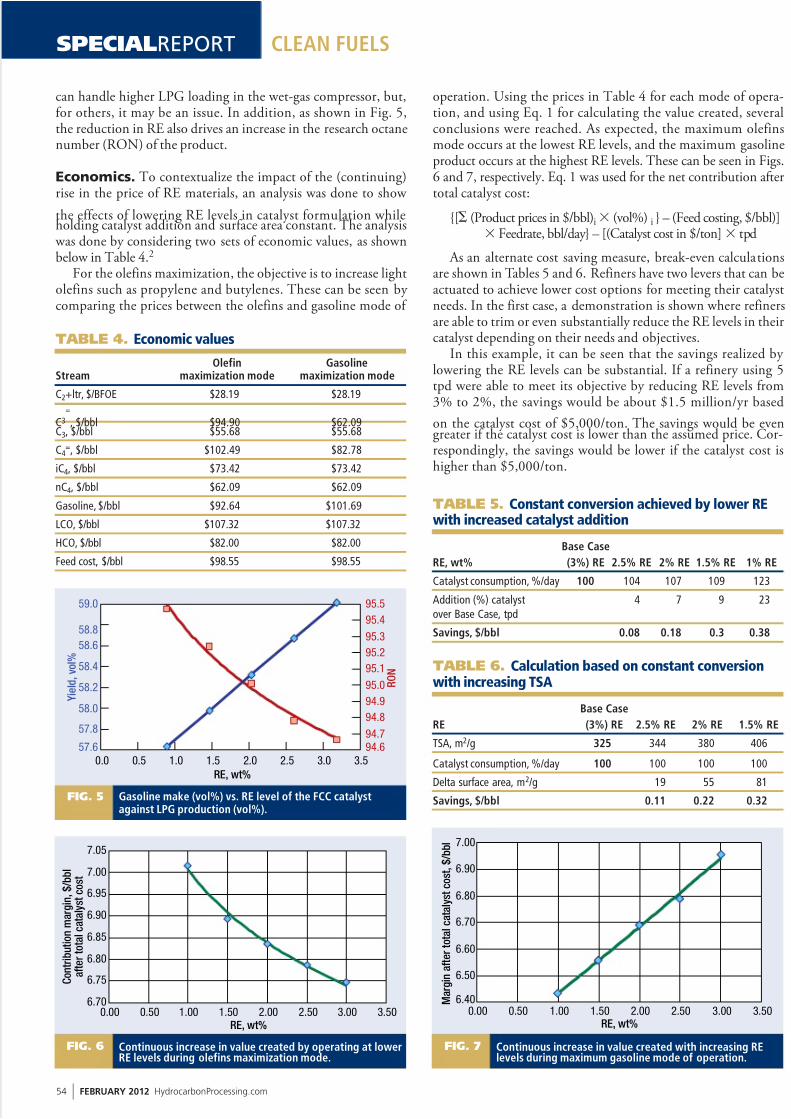
5/16/2018 Hydrocarbon Processing February 2012 - slidepdf.com
http://slidepdf.com/reader/full/hydrocarbon-processing-february-2012 55/93
CLEAN FUELSSPECIALREPORT
54 I FEBRUARY 2012 HydrocarbonProcessing.com
can handle higher LPG loading in the wet-gas compressor, but,for others, it may be an issue. In addition, as shown in Fig. 5,the reduction in RE also drives an increase in the research octanenumber (RON) of the product.
Economics. To contextualize the impact of the (continuing)rise in the price of RE materials, an analysis was done to show
the effects of lowering RE levels in catalyst formulation whileholding catalyst addition and surface area constant. The analysis was done by considering two sets of economic values, as shownbelow in Table 4.2
For the olefins maximization, the objective is to increase lightolefins such as propylene and butylenes. These can be seen by comparing the prices between the olefins and gasoline mode of
operation. Using the prices in Table 4 for each mode of opera-tion, and using Eq. 1 for calculating the value created, severalconclusions were reached. As expected, the maximum olefinsmode occurs at the lowest RE levels, and the maximum gasolineproduct occurs at the highest RE levels. These can be seen in Figs.6 and 7, respectively. Eq. 1 was used for the net contribution aftertotal catalyst cost:
{[ (Product prices in $/bbl)i (vol%) i } – (Feed costing, $/bbl)] Feedrate, bbl/day} – [(Catalyst cost in $/ton] tpd
As an alternate cost saving measure, break-even calculationsare shown in Tables 5 and 6. Refiners have two levers that can beactuated to achieve lower cost options for meeting their catalystneeds. In the first case, a demonstration is shown where refinersare able to trim or even substantially reduce the RE levels in theircatalyst depending on their needs and objectives.
In this example, it can be seen that the savings realized by lowering the RE levels can be substantial. If a refinery using 5tpd were able to meet its objective by reducing RE levels from3% to 2%, the savings would be about $1.5 million/yr based
on the catalyst cost of $5,000/ton. The savings would be evengreater if the catalyst cost is lower than the assumed price. Cor-respondingly, the savings would be lower if the catalyst cost ishigher than $5,000/ton.
TABLE 5. Constant conversion achieved by lower REwith increased catalyst addition
Base Case
RE, wt% (3%) RE 2.5% RE 2% RE 1.5% RE 1% RE
Catalyst consumption, %/day 100 104 107 109 123
Addition (%) catalyst 4 7 9 23over Base Case, tpd
Savings, $/bbl 0.08 0.18 0.3 0.38
TABLE 4. Economic values
Olefin GasolineStream maximization mode maximization mode
C2+ltr, $/BFOE $28.19 $28.19
C3
=
, $/bbl $94.90 $62.09C3, $/bbl $55.68 $55.68
C4=, $/bbl $102.49 $82.78
iC4, $/bbl $73.42 $73.42
nC4, $/bbl $62.09 $62.09
Gasoline, $/bbl $92.64 $101.69
LCO, $/bbl $107.32 $107.32
HCO, $/bbl $82.00 $82.00
Feed cost, $/bbl $98.55 $98.55
TABLE 6. Calculation based on constant conversionwith increasing TSA
Base Case
RE (3%) RE 2.5% RE 2% RE 1.5% RE
TSA, m2/g 325 344 380 406
Catalyst consumption, %/day 100 100 100 100
Delta surface area, m2/g 19 55 81
Savings, $/bbl 0.11 0.22 0.32
57.6
57.8
58.0
58.2
58.4
58.6
58.8
59.0
0.0 0.5 1.0 1.5 2.0 2.5 3.0 3.5
RE, wt%
Y i e l d ,
v o l %
94.6
94.7
94.8
94.9
95.0
95.1
95.2
95.3
95.4
95.5
R O N
Gasoline make (vol%) vs. RE level of the FCC catalystagainst LPG production (vol%).
FIG. 5
6.70
6.75
6.80
6.85
6.90
6.95
7.00
7.05
0.00 0.50 1.00 1.50 2.00 2.50 3.00 3.50
RE, wt%
C o n t r i b u t i o n m a r g i n ,
$ / b b l
a f t e r t o t a l c a t a l y s t c o s t
Continuous increase in value created by operating at lowerRE levels during olefins maximization mode.
FIG. 6
6.40
6.50
6.60
6.70
6.80
6.90
7.00
0.00 0.50 1.00 1.50 2.00 2.50 3.00 3.50 M a r g i n a f t e r t o t a l c a t a l y s t c o s t , $ / b b l
RE, wt%
Continuous increase in value created with increasing RElevels during maximum gasoline mode of operation.
FIG. 7

5/16/2018 Hydrocarbon Processing February 2012 - slidepdf.com
http://slidepdf.com/reader/full/hydrocarbon-processing-february-2012 56/93
CLEAN FUELS SPECIALREPORT
In a similar way, our analysis indicates that, in addition tosupplementing activity by increasing catalyst addition, an increasein activity can be achieved by increasing the TSA of the catalyst. When these two options are applied, a greater range of flexibility is achieved. The benefits of increased TSA can be seen in Table 6.In this case, the break-even cost ranges from $224 m2/g to $155m2/g. The actual cost of catalyst is a small fraction of this amount
and, therefore, the savings using this approach are even higherthan supplemental catalyst addition rates.
Post audit. As part of the comprehensive technical serviceprovided to customers, some catalyst suppliers do provide apost-audit service. The objective of the post audit is to confirmthe performance of the reformulation and to assess whether thereis scope for further fine-tuning. Of course, should the refinery’sobjective have changed significantly, the post audit can also helpdevelop new strategies to help the refinery aim at targeting itsnew priorities.
Table 7 is an example of a post audit for a European refinery that changed its catalyst formulation from an RE of 2.8% to
1.8%. The refinery kept its catalyst addition at the same levelbut used a reformulated higher TSA catalyst. After the refinery assessed the performance and felt comfortable with this new reformulation, it looked at other options to further cut its RElevels. As can be seen in Table 7, the post audit was done after afull inventory changeover. By comparing the projected and actualyield patterns from the unit, it can be seen that the accuracy of themodeling tool kit is very good.
Technical service. The standard service of some suppliers fol-lows an inclusive product selection approach to match the idealproduct based on input from sales, service, manufacturing and mar-keting. In this approach, each catalyst offer is customized to meetthe objectives of the refiner, taking into consideration the constraintsof the specific user whether, they are operational or economic.
As a follow up with continued after sales technical support,
regular technical support services (TSSs) should be made available.Such reports provide the refinery management with an ongoingsystematic evaluation of their FCC operating conditions, together with the impact of the catalyst to support the strategic direction of the FCC management.
The major objective is to ensure that the catalyst formulationfits into the refinery strategic decision of optimizing its profit-ability on an ongoing basis. This is done to support the refinery with an optimum catalyst recipe to meet the changing needsof the refinery within its operating unit, market and logisticalconstraints. Fig. 8 shows a quick summary of information flow for the TSS.
Action plan. In the context of the high RE price environment,refiners can apply methods to reduce operating costs associated with fresh catalyst purchase and to minimize the risk of a catalystreformulation. The process of extracting maximum benefit comesinto being by the interplay of information between customer andsupplier through communication, understanding, tools and prod-ucts. Suppliers have managed this process at the front end throughheavy investments in R&D, production process and equipment tobring about best in class products.
TABLE 7. Post audit results
2.8% RE, 360 TSA 1.8% RE, 360 TSA
Riser/reactor operation Projected Actual
Feedrate, tph Base Base
Feed specfic gravity, @ 60/60 Base Base
Catalyst circulation rate, t/min 18.8 20.5
Regeneration operation
Regen. 1 bed temp, °C 711 697
Fresh cat. makeup, tpd 2.15 2.2
Conversion
Fresh feed conversion (as cut), wt% 73.8 73.4
Product yields, wt%
Hydrogen 0.09 0.08
Hydrogen sulfide 0.17 0.15
Methane 1.56 1.54
Ethane 1.14 1.11
Ethylene 1.32 1.32
Propane 1.84 1.76
Propylene 7.32 7.65
n-Butane 0.95 0.95
Isobutane 3.71 3.78
Total butenes 7.57 7.82
C5 to 221°C gasoline 42.95 42.08
LCO, 221°C to 350°C 13.79 14.41
Slurry, 350°C 12.53 12.18Coke 5.19 5.17
Select 160 at www.HydrocarbonProcessing.com/RS
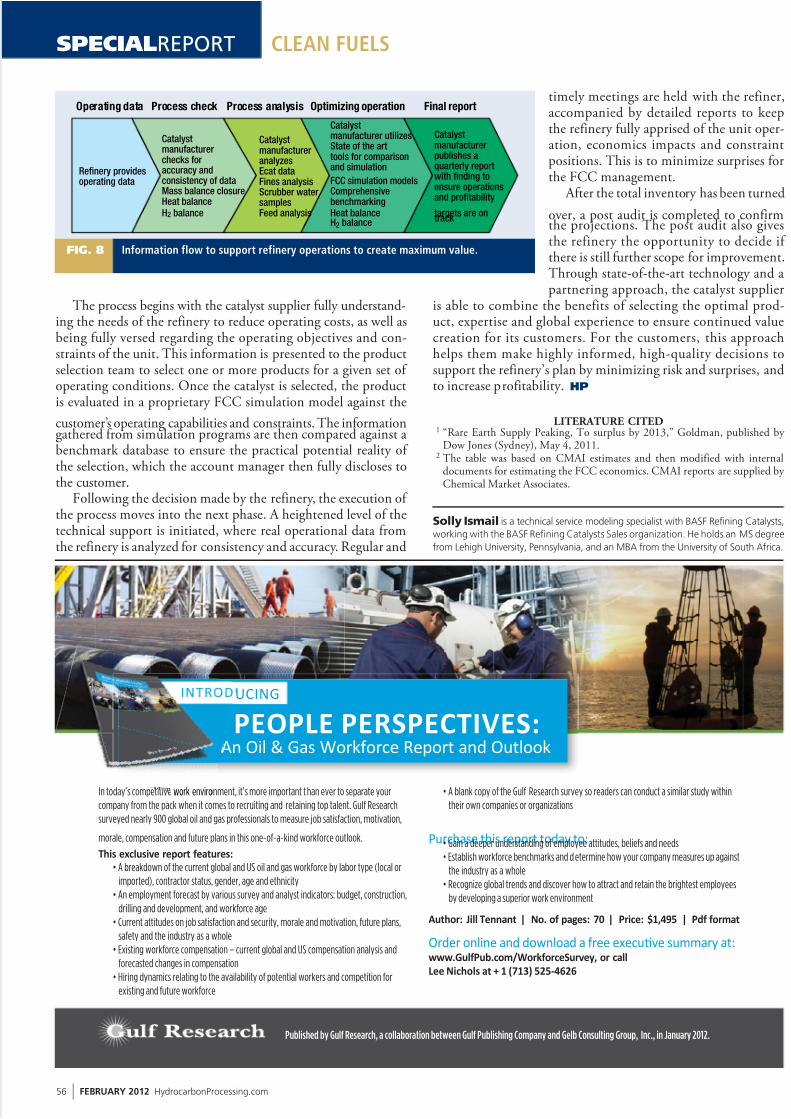
5/16/2018 Hydrocarbon Processing February 2012 - slidepdf.com
http://slidepdf.com/reader/full/hydrocarbon-processing-february-2012 57/93
CLEAN FUELSSPECIALREPORT
56 I FEBRUARY 2012 HydrocarbonProcessing.com
The process begins with the catalyst supplier fully understand-ing the needs of the refinery to reduce operating costs, as well asbeing fully versed regarding the operating objectives and con-straints of the unit. This information is presented to the productselection team to select one or more products for a given set of operating conditions. Once the catalyst is selected, the productis evaluated in a proprietary FCC simulation model against the
customer’s operating capabilities and constraints. The informationgathered from simulation programs are then compared against abenchmark database to ensure the practical potential reality of the selection, which the account manager then fully discloses tothe customer.
Following the decision made by the refinery, the execution of the process moves into the next phase. A heightened level of thetechnical support is initiated, where real operational data fromthe refinery is analyzed for consistency and accuracy. Regular and
timely meetings are held with the refiner,accompanied by detailed reports to keepthe refinery fully apprised of the unit oper-ation, economics impacts and constraintpositions. This is to minimize surprises forthe FCC management.
After the total inventory has been turned
over, a post audit is completed to confirmthe projections. The post audit also givesthe refinery the opportunity to decide if there is still further scope for improvement.Through state-of-the-art technology and apartnering approach, the catalyst supplier
is able to combine the benefits of selecting the optimal prod-uct, expertise and global experience to ensure continued valuecreation for its customers. For the customers, this approachhelps them make highly informed, high-quality decisions tosupport the refinery’s plan by minimizing risk and surprises, andto increase profitability. HP
LITERATURE CITED1 “Rare Earth Supply Peaking, To surplus by 2013,” Goldman, published by
Dow Jones (Sydney), May 4, 2011.2 The table was based on CMAI estimates and then modified with internal
documents for estimating the FCC economics. CMAI reports are supplied by Chemical Market Associates.
PEOPLE PERSPECTIVES:An Oil & Gas Workforce Report and Outlook
In today’s competitive work environment, it’s more important t han ever to separate your
company from the pack when it comes to recruiting and retaining top talent. Gulf Research
surveyed nearly 900 global oil and gas professionals to measure job satisfaction, motivation,
morale, compensation and future plans in this one-of-a-kind workforce outlook.
This exclusive report features:
• A breakdown of the current global and US oil and gas workforce by labor type (local or
imported), contractor status, gender, age and ethnicity
• An employment forecast by various survey and analyst indicators: budget, construction,
drilling and development, and workforce age
• Current attitudes on job satisfaction and security, morale and motivation, future plans,
safety and the industry as a whole
• Existing workforce compensation – current global and US compensation analysis and
forecasted changes in compensation
• Hiring dynamics relating to the availability of potential workers and competition for
existing and future workforce
• A blank copy of the Gulf Research survey so readers can conduct a similar study within
their own companies or organizations
Purchase this report today to:• Gain a deeper understanding of employee attitudes, beliefs and needs
• Establish workforce benchmarks and d etermine how your company measures up against
the industry as a whole
• Recognize global trends and discover how to attract and retain the brightest employees
by developing a superior work environment
Author: Jill Tennant | No. of pages: 70 | Price: $1,495 | Pdf format
Order online and download a free execuve summary at:www.GulfPub.com/WorkforceSurvey, or call
Lee Nichols at + 1 (713) 525-4626
Published by Gulf Research, a collaboration between Gulf Publishing Company and Gelb Consulting Group, Inc., in January 2012.
INTRODUCING
work enviro
Refinery providesoperating data
Final reportOptimizing operation
Catalystmanufacturerchecks foraccuracy andconsistency of dataMass balance closureHeat balanceH2 balance
Operating data Process check Process analysis
CatalystmanufactureranalyzesEcat dataFines analysisScrubber watersamplesFeed analysis
Catalystmanufacturerpublishes aquarterly reportwith finding toensure operationsand profitability
targets are ontrack
Catalystmanufacturer utilizesState of the arttools for comparisonand simulation
FCC simulation modelsComprehensivebenchmarkingHeat balanceH2 balance
Information flow to support refinery operations to create maximum value.FIG. 8
Solly Ismail is a technical service modeling specialist with BASF Refining Catalysts,
working with the BASF Refining Catalysts Sales organization. He holds an MS degree
from Lehigh University, Pennsylvania, and an MBA from the University of South Africa.

5/16/2018 Hydrocarbon Processing February 2012 - slidepdf.com
http://slidepdf.com/reader/full/hydrocarbon-processing-february-2012 58/93
CLEAN FUELS SPECIALREPORT
HYDROCARBON PROCESSING FEBRUARY 2012 I
57
Increase energy efficiency
for your refineryBehavioral and organization changes are neededto effectively maximize operating profits
Z. MILOSEVIC, KBC Process Technology Ltd., Walton on the Thames, Surrey, UK
A
s the margins remain low, theimportance of reducing the oper-
ating costs, improving marginsand maximizing the use of the existingassets remains a high priority for refinersglobally. Energy efficiency is in focus, bothas a cost issue and as environmental con-cern. This importance has also been rec-ognized by new standardization in the areaof Energy Management (ISO 50001, tobe implemented by end 2010) and Energy Management Systems (BS EN 16001,implemented in 2009).
However, while many refinery engi-neers and operators have ideas about how
to improve the energy efficiency of a site,these ideas very often fail to mature or beimplemented. What is most undesirable toany refiner in the present market environ-ment is that the good ideas and desirableprojects are not put into practice.
Refineries can and do focus very effec-tively on operational excellence, mainte-nance or safety, but they rarely create anenergy-focused organization. This occursdue to various reasons, including lack of organization, equipment (instrumenta-tion), or tools and skills that are required
for project identification and effectiveimplementation. Conversely, some refinersshow remarkable vigor and ability to imple-ment such projects. What is their secret? Which organizat ional factors affect theimplementability of good ideas, and whichcan be quickly adjusted and amended toachieve good implementability?
Project challenges. The obstacles toeffective project implementability usually fall into three categories:
• Technical—Lack of instrumentation,
measurements, accurate data or control-lability.
• Skills-related—a shortage of skills andtools.
• Behavioral and organizational.It has been often noticed that even in
the absence of the first two roadblocks, and with only the third challenge (behavioralor organizational) present, project imple-mentation is slow. The lack of requiredorganizational and behavioral features can-cels the effects of skills and technical effort.If so, a complete revamp of a refiner’s prac-tices is often required, encapsulated into what is called the creation of an “energy focused organization.” This article will dis-cuss behavioral and organizational factor,
what is needed to create an energy-focusedorganization, and how the transition canbe effectively made.
ENERGY-FOCUSED ORGANIZATIONRefiners have been talking about
“profit-oriented organization” and“operational-excellence-focused refining.”However, energy effectiveness has becomea factor of such a vital importance thata new term, “energy focused,” has beenadded. An organization may have all of the tools and knowledge necessary to
be a world-class energy performer, but without a clear energy strategy, along with motivated and informed personneland an organization that supports energy initiatives, the end result will be less thandesired. An energy-focused organizationis crucial for ensuring the implemen-tation of the identified improvementopportunities and for sustaining goodoperational efficiency.
The term “energy-focused organization”defines the organizational structure andprocedures that support good energy man-
agement. That structure and those proce-dures are usually contained in six areas:
• Energy policy. It includes existence,clarity, completeness and adherence to the
organization structure.• Organizational structure. It is the
position and role of the site energy coordi-nator and the energy team, their responsi-bilities, authority, and senior managementsupport.
• Motivation. Must be present at alllevels.
• Information systems. This includesadequacy of measurements, targets, reporting
• Marketing of energy efficiency. How is energy efficiency promoted bothinternally and externally for the company?
• Investment. Such projects requirebuilding the case for investment and creat-ing budget availability.
Energy policy. This is the refiner’s publicstatement of commitment. It is the vision,and, as such, it forms the foundation of asuccessful energy management program. It isformally written, clearly and succinctly, andcontains measurable objectives in improvingthe energy performance, including any othergoals such as environmental protection. Thepolicy is tailored for the particular organiza-
tion. It is approved and issued by its chief executive, and involves the key members of the senior management team.
A well-written policy is understandableto both employees and the public. It is real-istic. It includes the skills and abilities of allmanagement and employees. The policy iscommunicated to all staff, so that everyone isencouraged to get involved. The policy willideally state the chain of command, definethe responsibilities and provide authority forimplementing the energy program.
Organizational structure. The effec-tiveness of the organizational structure
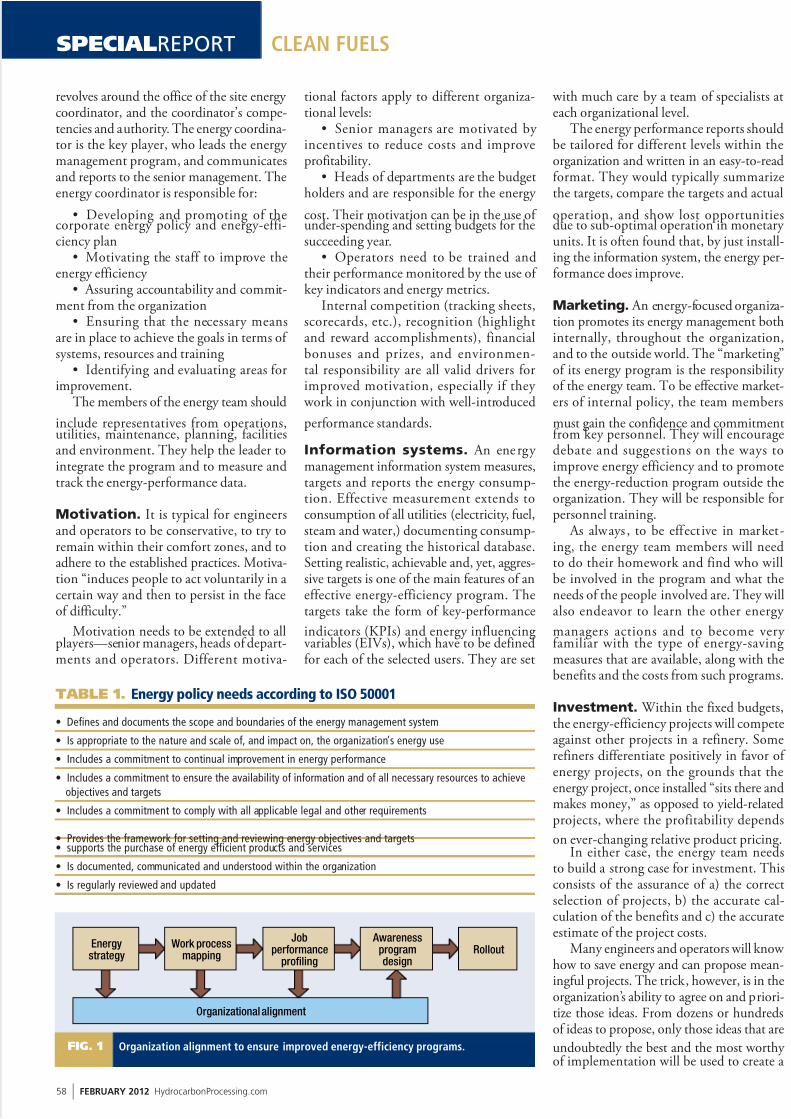
5/16/2018 Hydrocarbon Processing February 2012 - slidepdf.com
http://slidepdf.com/reader/full/hydrocarbon-processing-february-2012 59/93
CLEAN FUELSSPECIALREPORT
58 I FEBRUARY 2012 HydrocarbonProcessing.com
revolves around the office of the site energy coordinator, and the coordinator’s compe-tencies and authority. The energy coordina-tor is the key player, who leads the energy management program, and communicatesand reports to the senior management. Theenergy coordinator is responsible for:
• Developing and promoting of thecorporate energy policy and energy-effi-ciency plan
• Motivating the staff to improve theenergy efficiency
• Assuring accountability and commit-ment from the organization
• Ensuring that the necessary meansare in place to achieve the goals in terms of systems, resources and training
• Identifying and evaluating areas forimprovement.
The members of the energy team should
include representatives from operations,utilities, maintenance, planning, facilitiesand environment. They help the leader tointegrate the program and to measure andtrack the energy-performance data.
Motivation. It is typical for engineersand operators to be conservative, to try toremain within their comfort zones, and toadhere to the established practices. Motiva-tion “induces people to act voluntarily in acertain way and then to persist in the faceof difficulty.”
Motivation needs to be extended to allplayers—senior managers, heads of depart-ments and operators. Different motiva-
tional factors apply to different organiza-tional levels:
• Senior managers are motivated by incentives to reduce costs and improveprofitability.
• Heads of departments are the budgetholders and are responsible for the energy
cost. Their motivation can be in the use of under-spending and setting budgets for thesucceeding year.
• Operators need to be trained andtheir performance monitored by the use of key indicators and energy metrics.
Internal competition (tracking sheets,scorecards, etc.), recognition (highlightand reward accomplishments), financialbonuses and prizes, and environmen-tal responsibility are all valid drivers forimproved motivation, especially if they work in conjunction with well-introduced
performance standards.
Information systems. An energy management information system measures,targets and reports the energy consump-tion. Effective measurement extends toconsumption of all utilities (electricity, fuel,steam and water,) documenting consump-tion and creating the historical database.Setting realistic, achievable and, yet, aggres-sive targets is one of the main features of aneffective energy-efficiency program. Thetargets take the form of key-performance
indicators (KPIs) and energy influencingvariables (EIVs), which have to be definedfor each of the selected users. They are set
with much care by a team of specialists ateach organizational level.
The energy performance reports shouldbe tailored for different levels within theorganization and written in an easy-to-readformat. They would typically summarizethe targets, compare the targets and actual
operation, and show lost opportunitiesdue to sub-optimal operation in monetary units. It is often found that, by just install-ing the information system, the energy per-formance does improve.
Marketing. An energy-focused organiza-tion promotes its energy management bothinternally, throughout the organization,and to the outside world. The “marketing”of its energy program is the responsibility of the energy team. To be effective market-ers of internal policy, the team members
must gain the confidence and commitmentfrom key personnel. They will encouragedebate and suggestions on the ways toimprove energy efficiency and to promotethe energy-reduction program outside theorganization. They will be responsible forpersonnel training.
As always, to be effective in market-ing, the energy team members will needto do their homework and find who willbe involved in the program and what theneeds of the people involved are. They willalso endeavor to learn the other energy
managers actions and to become very familiar with the type of energy-savingmeasures that are available, along with thebenefits and the costs from such programs.
Investment. Within the fixed budgets,the energy-efficiency projects will competeagainst other projects in a refinery. Somerefiners differentiate positively in favor of energy projects, on the grounds that theenergy project, once installed “sits there andmakes money,” as opposed to yield-relatedprojects, where the profitability depends
on ever-changing relative product pricing.In either case, the energy team needs
to build a strong case for investment. Thisconsists of the assurance of a) the correctselection of projects, b) the accurate cal-culation of the benefits and c) the accurateestimate of the project costs.
Many engineers and operators will know how to save energy and can propose mean-ingful projects. The trick, however, is in theorganization’s ability to agree on and priori-tize those ideas. From dozens or hundredsof ideas to propose, only those ideas that are
undoubtedly the best and the most worthy of implementation will be used to create a
TABLE 1. Energy policy needs according to ISO 50001
• Defines and documents the scope and boundaries of the energy management system
• Is appropriate to the nature and scale of, and impact on, the organization’s energy use
• Includes a commitment to continual improvement in energy performance
• Includes a commitment to ensure the availability of information and of all necessary resources to achieve
objectives and targets
• Includes a commitment to comply with all applicable legal and other requirements
• Provides the framework for setting and reviewing energy objectives and targets• supports the purchase of energy efficient products and services
• Is documented, communicated and understood within the organization
• Is regularly reviewed and updated
Jobperformance
profiling
Energystrategy
Work processmapping
Awarenessprogramdesign
Rollout
Organizational alignment
Organization alignment to ensure improved energy-efficiency programs.FIG. 1

5/16/2018 Hydrocarbon Processing February 2012 - slidepdf.com
http://slidepdf.com/reader/full/hydrocarbon-processing-february-2012 60/93
CLEAN FUELS SPECIALREPORT
59
road map of projects that are targeted forenergy performance for the site.
HOW TO CREATE AN ENERGY-FOCUSED ORGANIZATION
An energy-focused organizat ion wil lhave most of the mentioned six areas of
concern well addressed, including:• The energy policy and the related
action plan will exist. It will be regularly reviewed, and will have the commitmentfrom top management.
• The energy management will be fully integrated into the management structure.
• There will be formal and informalchannels of communication at all levels tomotivate staff in energy conservation.
• A comprehensive information andmanagement system will exist with propermonitoring, target setting and reporting.
• The value of energy efficiency will becontinually promoted within the organiza-tion and outside of it.
• Positive discrimination in favor of energy projects will be secured.
These organizational features are notproduced overnight. It may take a long timefor pacesetters in energy efficiency to createand sharpen their energy focus. While it isdifficult to generalize, it is likely that theprocess of creating an energy focused orga-nization will start with proper organiza-tional alignment, which means aligning the
refinery management team with the energy strategy and the overall business goals, asshown in Fig. 1. The activities shown aredefined as:
Develop an energy strategy. Thisinvolves setting strategic goals, developinga vision statement and identifying how theorganization will support the main inter-nal clients for energy (energy efficiency “owners.”)
• Work process mapping. Writingthe working processes and practices asso-
ciated with economically optimizing theenergy performance of the plant should bereviewed and defined. It should cover:
• Energy reporting structure. Itdefines how energy performance is reportedand monitored throughout the organiza-tion.
• Operational practices. These prac-tices define key performance indicators andenergy influencing variables, packed intoan Energy Management System.
• Improvement identification prac-tices. These practices define the appropri-
ate procedures and resources for identify-ing and evaluating opportunities, and for
defining how energy projects are includedin investment budgets.
• Performance support tools. Thesetools identify training needs and develop-ing human performance management pro-cesses and support elements.
• Training programs.
Job profiles. Such profiles define theroles and responsibilities of the key mem-bers for the energy team, including anoutline of the required competencies andmeasurement criteria. This may requireintroduction of new positions. But energy focus should also be included in the rolesand responsibilities of existing operationsand technical staff.
Awareness program design. Thisprogram includes developing leaflets, cam-
paigns, information and training needs.
THE WAY FORWARD Assuming that energy effectiveness will
remain a strong industry driver for years tocome, creating an “energy-focused organi-zation” will become an unavoidable task and an essential part of good refinery man-agement. The process will start with bench-
marking the organizational structure andenergy management practices, and iden-tifying performance gaps. Many refiner-ies will find that, while sufficient expertiseand technical knowledge exist, the lack of adequate organization, motivation andimplementation ability or implementation
culture prevent them from actually improv-ing their energy performance.
The order and methods of addressingand reducing these gaps will differ fromsite to site, but most refiners will find thattraining will be required at all levels, fol-lowed by re-organization, with sufficientauthority given to the site energy coordi-nator, and implementation of an energy management system. HP
Dr. Zoran Milosevic is a senior
staff consultant with KBC ProcessTechnology Ltd., and an internationally
renowned authority on energy optimi-
zation and profit improvement of oil
refineries and petrochemical plants. He is best known
through his work on profit improvement and energy con-
servation. He has over 40 published papers and articles
on energy efficiency, refinery/petrochemicals profitability
improvement, and energy economics. Dr. Milosevic has
given numerous training courses on energy economics,
refinery energy efficiency and pinch technology.
Select 162 at www.HydrocarbonProcessing.com/RS

5/16/2018 Hydrocarbon Processing February 2012 - slidepdf.com
http://slidepdf.com/reader/full/hydrocarbon-processing-february-2012 61/93
T eam has led the industry in the delivery of safe,
effec tive hot taps and line stops for more than 35
years. Using the latest technology, Team provides hot
taps for new tie -ins and line stops for repairs and/or
modifications to any transmission or distribution line.
Fittings and services are available for all t ypes of pipe
materials, diameters, pressures and temperatures.
Key benefits include:
Hot taps, l ine stops, Hotstops®, Super HiStops®,BagStops ®, freeze stops, double stops, tee stops, elbow
stops, thru-valve stops…Team delivers 24/7/365. For safe,
reliable hot taps and line stops call +1-800-662-8326 or
visit www.teamindustrialservices.com .
Team Hot Tap Services
Experience, Technology, Expertise, Solutions.. .
Heat
Treating
Hot Taps,Line Stop
Scan code with
on smart phone
Select 95 at www.HydrocarbonProcessing.com/RS

5/16/2018 Hydrocarbon Processing February 2012 - slidepdf.com
http://slidepdf.com/reader/full/hydrocarbon-processing-february-2012 62/93
CLEAN FUELS SPECIALREPORT
HYDROCARBON PROCESSING FEBRUARY 2012 I
61
Use advanced catalysts
to improve xylenes isomerizationThis refiner wanted to increase ethylbenzene conversionwhile limiting aromatics losses
G. SHOUQUAN, Sinopec Zhenhai Refinery & Chemical Co., Zhenhai, China; andJ. CHUA, Zeolyst International, Singapore
Sinopec Zhenhai Refinery and Chemical Co. (ZRCC) started
up a 450,000-tpy paraxylene (PX) complex in August 2003.The complex was originally designed to use a locally pro-
duced xylene isomerization catalyst. The performance of xyleneisomerization catalyst during the first cycle began to deterioraterapidly after the regeneration in March 2007. The ethylbenzene(EB) conversion rate dropped from 25 wt% before regeneration to22 wt%, and the PX/xylene ratio in the product also dropped from22.7% to 22% and directly led to a 0.4 wt% reduction of PX con-centration in the PX adsorption unit feed. As a result, the PX pro-duction dropped by 50 tpd of PX; the C8 aromatics loss was higherthan 4%, which is very high. Temperature and pressure increases inthe reaction system were increasing significantly faster than beforeregeneration, with the rate of temperature increase jumping from
0.5°C /month to 2°C/month. As the isomerization catalyst per-formance deteriorated rapidly, ZRCC had planned to replace thexylene catalyst during a scheduled maintenance turnaround in 2008.
CATALYST SELECTION After discussions with a number of catalyst technology own-
ers (foreign and domestic) and conducting a catalyst technicalevaluation among them, ZRCC selected the latest generation of a xylene isomerization catalyst. The new first-generation xyleneisomerization catalyst was initially commercialized in 2001, and ithas now been applied in more than 11 units outside of China. In June 2006, the Sinopec Yangzi branch applied the first-generationcatalyst successfully in its aromatics plant with outstanding results.
The newer generation catalyst is developed based on the conceptof the first-generation catalyst with an improved manufacturingprocess. Processing benefits from the new catalyst system includedhigh activity, high EB conversion rate, high PX/xylene ratio inthe product, low C8 aromatics losses and long cycle life. In addi-tion, this catalyst is very robust and can perform well in differentoperating conditions. It is in operation at three operating units inTaiwan and outside of China.
CATALYST PARAMETERSThis catalyst is jointly developed and uses a proprietary carrier.
Upon delivery, ZRCC sampled and analyzed the catalyst. Theresults showed that the catalyst had a loss of ignition of 0.77 wt%
at 420°C and a specific surface area of 267 m2/ g, with no particlessmaller than 30 mesh.
Xylene isomerization process. The xylene isomerization
reaction of the EB reforming type catalyst is designed to isomer-ize aromatics present with PX in an amount often less than 1%in the reactor feed into four xylene isomers—PX, metaxylene(MX), orthoxylene (OX) and EB—close to equilibrium, at adefined temperature and pressure with the presence of a catalyst.The objective is to reduce the EB content and to increase xyleneconcentration of the feed for the PX adsorption unit. The higherxylene content to the adsorption unit increases the PX productyield and minimizes recycling and energy consumption.
For the isomerization reaction, higher EB conversion rateand PX concentration in the product will bring the C8 aromaticscloser to equilibrium. At the same time, the C8 aromatics loss willbe higher. This shows that, within a certain range, the activity
and selectivity are in an inverse relationship. Therefore, carefulconsideration should be given to the activity and selectivity whileoperating with this catalyst. Table 1 lists the guaranteed values of the catalyst performance parameters.
INDUSTRIAL APPLICATION OF ZRCC PX COMPLEXZRCC’s PX isomerization unit has a designed throughput
of 267 tons/hr. In the design, an extra C 8 naphthenes recyclecolumn was added downstream of the deheptanizer to reducethe circulation path of the C8 naphthenes. Fig. 1 is a simplifiedflow diagram of the ZRCC’s isomerization unit.
Xylene isomreactor
High-pressureseparator
Deheptanizer
E-7
Raffinate
Naphthenesrecyclecolumn
Fuel gas
To xylene splitter
Simplified flow diagram of ZRCC’s PX isomerization unit.FIG. 1

5/16/2018 Hydrocarbon Processing February 2012 - slidepdf.com
http://slidepdf.com/reader/full/hydrocarbon-processing-february-2012 63/93
CLEAN FUELSSPECIALREPORT
62 I FEBRUARY 2012 HydrocarbonProcessing.com
Catalyst loading. ZRCC’s isomerization reactor is a radial-flow reactor. Based on the calculation, centerpipe modificationin the original reactor was required to fully optimize the catalystperformance. This was done by removing the original seal andslump-catalyst layer and covering the top of the catalyst with aproprietary material that could withstand high temperatures.This top cap was followed with a layer of ceramic balls.
Pretreatment of the reactor. The spent catalyst did notundergo carbon burning before unloading. Thus, the reactorneeded a pre-treatment step to remove the residual hydrocar-bons. In the pre-treatment process, the carbon dioxide (CO2)level was monitored every hour. When the CO2 level in thereaction system was reduced to less than 0.2% and the watercontent to less than 1,800 ppm, the carbon-burning treatment was considered complete.
Reactor catalyst loading. After the carbon-burning treat-ment of the reactor, the catalyst was densely loaded using aproprietary dense-loading technology. The total actual catalystloading was 84.96 tons.
Pretreatment of catalyst before feed. Industrially produced catalysts will absorb moisture during manufactur-ing, transportation and loading. To ensure the activity of freshcatalyst, a drying process is done before introducing feed to thecatalyst bed. The drying process requires heating the catalystusing nitrogen with an oxygen content of 1 mol% to 3 mol%at 10 barg. As new insulation materials were installed in the
furnace during the downtime, to dry the insulation materials,the heating rate was very slow at first, and temperature waskept constant. When the temperature reached 200°C, after which the reactor inlet temperature was increased to 400°C ata rate of 25°C/hr and kept constant for two hours. Water wasdetected at 230°C and, at 260°C, the maximum water content was about 1,800 ppm, but no free water was detected at the low points of the system.
Catalyst reduction and passivation. After drying the cata-lyst was completed, the oxygen in the system was fully dis-placed by nitrogen. The pressure was then gradually raised withhydrogen to reduce the catalyst. During the reduction, fourhours after the inlet temperature reached 420°C, water began
discharging at low points of the system. The temperature waskept constant until the amount discharged started to decline.In total, 150.2 kg of water was collected during the reductionprocess; it is equivalent to 0.18 wt% of the water content of the fresh catalyst.
Catalyst sulfiding. Platinum, in a reduced state of the freshcatalyst, has a too high activity, which can lead to side reactionssuch as extensive cracking and/or temperature runaway in thecase of direct feed to the reactor. All side reactions impact thecatalyst’s long-term performance and service life. For that rea-son, catalyst pre-sulfiding is done before introducing feed inthe catalyst bed.
A total of over 100 kg of DMDS sulfiding agent was injected
into the system in two steps through a specific device onsite. It was hard to detect hydrogen sulfide (H2S) due to monitoringa large range of tubes, and no H2S was detected at the outletof the reactor after the sulfur injection. After the sulfiding, thereactor inlet temperature was maintained at 335°C for the finalpreparation for feed introduction.
Catalyst feed introduction. Prior to introducing feed tothe catalyst bed/reactor, the composition of the liquid feed (raf-finates and makeup hydrogen) was analyzed, and the feed metthe required specification. The liquid feed was introduced intothe reactor under these conditions: inlet temperature of 335°C,reactor pressure of 11 barg, recycle-gas hydrogen purity greater
than 80% and makeup-hydrogen purity greater than 97 mol%.The weight hourly space velocity was 3.0 hr–1. After feed intro-duction, the reaction pressure decreased rapidly, and tempera-ture rose sharply, during which the reactor outlet temperaturerose to a maximum of 418°C, and the maximum reactor Δ tem-perature was 50°C. After the first round of heat waves passed,the reactor Δ temperature dropped to 35°C. This signified asuccessful catalyst feeding. Fig. 2 shows the reaction temperatureincrease and pressure changes during feed introduction.
During the initial operating period after feeding, there wereobvious increases in hydrogen consumption and in gas generationdue to the formation of C8 naphthenes within the first few hours. After 24 hours, the difference between the temperatures at the
reactor inlet and outlet was reduced to about 21°C, and the reac-tor outlet pressure was reduced from 10 barg to 6.3 barg, with
TABLE 1. Guaranteed values of performanceparameters
Item Guaranteed value
PX approach to equilibrium (PX-ate), % ≥ 95
EB approach to equilibrium (EB-ate), % ≥ 60
C8 aromatics loss, wt% ≤ 2.9
TABLE 2. Catalyst operation conditions duringperformance test run
Ranges of Value duringItem parameters performance test run
WHSV, h–1 3–4.5 3.1
Reaction pressure, MPa 0.65–0.13 0.69
Inlet temperature, °C 350–415 374
Hydrogen-oil ratio, mol/mol 2.5–6.0 5.04
Recycle gas H2 purity, vol% ≥ 75 86
TABLE 3. Performance comparison between catalysts
New catalyst Previous catalystDesigned Performance Designed Performance
Item value test run value value test run value
Parameter
Recycle gas H2 purity, vol% ≥ 75 86 ≥ 80 85Pressure, MPa 0.65–1.13 0.69 0.65–1.13 0.76
Inlet temperature, °C 350–415 374 370–420 373
WHSV, h-1 3.0–4.5 3.08 ≤ 3.2 3.2
H2/oil ratio, mol/mol 2.5–6.0 5.04 ≥ 4.8 5.4
Reaction performance
PX-ate,% ≥ 95 ≥ 95 93
EB-ate,% ≥ 59 ≥ 59 52
PX/xylenes, wt% ≥ 22.1 ≥ 21 22.1
EB Conversion, wt% ≥ 25.8 ≥ 30 25.8
C8A loss, wt% ≤ 2.9 ≤ 2.9 ≤ 3.7 4.1
Service life of the 60 60first cycle, month
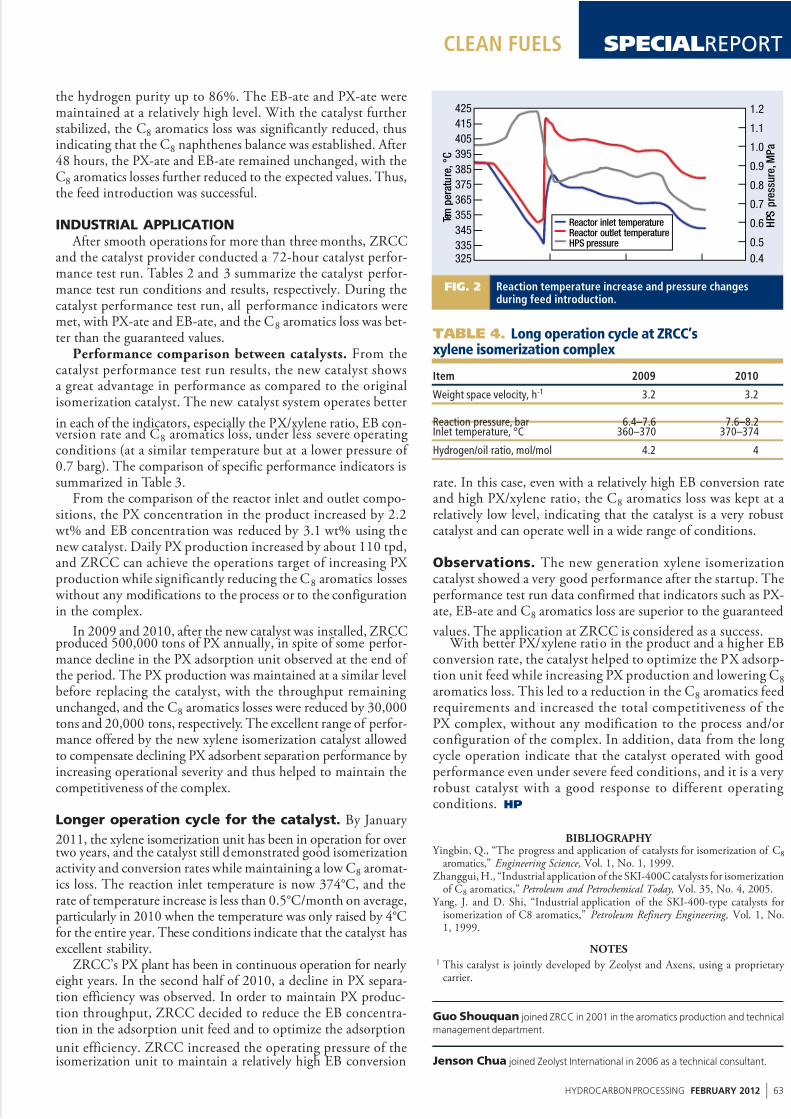
5/16/2018 Hydrocarbon Processing February 2012 - slidepdf.com
http://slidepdf.com/reader/full/hydrocarbon-processing-february-2012 64/93
CLEAN FUELS SPECIALREPORT
HYDROCARBON PROCESSING FEBRUARY 2012 I
63
the hydrogen purity up to 86%. The EB-ate and PX-ate weremaintained at a relatively high level. With the catalyst furtherstabilized, the C8 aromatics loss was significantly reduced, thusindicating that the C8 naphthenes balance was established. After48 hours, the PX-ate and EB-ate remained unchanged, with theC8 aromatics losses further reduced to the expected values. Thus,the feed introduction was successful.
INDUSTRIAL APPLICATION After smooth operations for more than three months, ZRCC
and the catalyst provider conducted a 72-hour catalyst perfor-mance test run. Tables 2 and 3 summarize the catalyst perfor-mance test run conditions and results, respectively. During thecatalyst performance test run, all performance indicators weremet, with PX-ate and EB-ate, and the C8 aromatics loss was bet-ter than the guaranteed values.
Performance comparison between catalysts. From thecatalyst performance test run results, the new catalyst showsa great advantage in performance as compared to the originalisomerization catalyst. The new catalyst system operates better
in each of the indicators, especially the PX/xylene ratio, EB con-version rate and C8 aromatics loss, under less severe operatingconditions (at a similar temperature but at a lower pressure of 0.7 barg). The comparison of specific performance indicators issummarized in Table 3.
From the comparison of the reactor inlet and outlet compo-sitions, the PX concentration in the product increased by 2.2 wt% and EB concentration was reduced by 3.1 wt% using thenew catalyst. Daily PX production increased by about 110 tpd,and ZRCC can achieve the operations target of increasing PX production while significantly reducing the C8 aromatics losses without any modifications to the process or to the configurationin the complex.
In 2009 and 2010, after the new catalyst was installed, ZRCCproduced 500,000 tons of PX annually, in spite of some perfor-mance decline in the PX adsorption unit observed at the end of the period. The PX production was maintained at a similar levelbefore replacing the catalyst, with the throughput remainingunchanged, and the C8 aromatics losses were reduced by 30,000tons and 20,000 tons, respectively. The excellent range of perfor-mance offered by the new xylene isomerization catalyst allowedto compensate declining PX adsorbent separation performance by increasing operational severity and thus helped to maintain thecompetitiveness of the complex.
Longer operation cycle for the catalyst. By January
2011, the xylene isomerization unit has been in operation for overtwo years, and the catalyst still demonstrated good isomerizationactivity and conversion rates while maintaining a low C8 aromat-ics loss. The reaction inlet temperature is now 374°C, and therate of temperature increase is less than 0.5°C/month on average,particularly in 2010 when the temperature was only raised by 4°Cfor the entire year. These conditions indicate that the catalyst hasexcellent stability.
ZRCC’s PX plant has been in continuous operation for nearly eight years. In the second half of 2010, a decline in PX separa-tion efficiency was observed. In order to maintain PX produc-tion throughput, ZRCC decided to reduce the EB concentra-tion in the adsorption unit feed and to optimize the adsorption
unit efficiency. ZRCC increased the operating pressure of theisomerization unit to maintain a relatively high EB conversion
rate. In this case, even with a relatively high EB conversion rateand high PX/xylene ratio, the C8 aromatics loss was kept at arelatively low level, indicating that the catalyst is a very robustcatalyst and can operate well in a wide range of conditions.
Observations. The new generation xylene isomerizationcatalyst showed a very good performance after the startup. Theperformance test run data confirmed that indicators such as PX-ate, EB-ate and C8 aromatics loss are superior to the guaranteed
values. The application at ZRCC is considered as a success. With better PX/xylene ratio in the product and a higher EB
conversion rate, the catalyst helped to optimize the PX adsorp-tion unit feed while increasing PX production and lowering C8 aromatics loss. This led to a reduction in the C8 aromatics feedrequirements and increased the total competitiveness of thePX complex, without any modification to the process and/orconfiguration of the complex. In addition, data from the longcycle operation indicate that the catalyst operated with goodperformance even under severe feed conditions, and it is a very robust catalyst with a good response to different operatingconditions. HP
BIBLIOGRAPHY Yingbin, Q., “The progress and application of catalysts for isomerization of C8
aromatics,” Engineering Science, Vol. 1, No. 1, 1999.Zhanggui, H., “Industrial application of the SKI-400C catalysts for isomerization
of C8 aromatics,” Petroleum and Petrochemical Today, Vol. 35, No. 4, 2005. Yang, J. and D. Shi, “Industrial application of the SKI-400-type catalysts for
isomerization of C8 aromatics,” Petroleum Refinery Engineering, Vol. 1, No.1, 1999.
NOTES1 This catalyst is jointly developed by Zeolyst and Axens, using a proprietary
carrier.
TABLE 4. Long operation cycle at ZRCC’sxylene isomerization complex
Item 2009 2010
Weight space velocity, h-1 3.2 3.2
Reaction pressure, bar 6.4–7.6 7.6–8.2Inlet temperature, °C 360–370 370–374
Hydrogen/oil ratio, mol/mol 4.2 4
Reactor inlet temperatureReactor outlet temperatureHPS pressure
0.4
0.5
0.6
0.7
0.8
0.9
1.0
1.1
1.2
325
335
345
355
365
375
385
395
405
415
425
H P S p r e s s u r e ,
M P a
T e m
p e r a t u r e ,
° C
Reaction temperature increase and pressure changesduring feed introduction.
FIG. 2
Guo Shouquan joined ZRCC in 2001 in the aromatics production and technical
management department.
Jenson Chua joined Zeolyst International in 2006 as a technical consultant.

5/16/2018 Hydrocarbon Processing February 2012 - slidepdf.com
http://slidepdf.com/reader/full/hydrocarbon-processing-february-2012 65/93
Select 99 at www.HydrocarbonProcessing.com/RS

5/16/2018 Hydrocarbon Processing February 2012 - slidepdf.com
http://slidepdf.com/reader/full/hydrocarbon-processing-february-2012 66/93
CLEAN FUELS SPECIALREPORT
HYDROCARBON PROCESSING FEBRUARY 2012 I
65
Improve diesel quality through
advanced hydroprocessingNew upgrading technologies help meet fuel quality specifications
C. PENG, X. HUANG, T. LIU, R. ZENG, J. LIU and M. GUAN, Fushun Research Institute of Petroleum and Petrochemicals, Liaoning, China
F
luid catalytic cracking (FCC) is an essential technology for converting heavy oil to light oil in refineries around
the world. Around 85% of the FCC, or catalytic, dieselproduced by Chinese oil refineries is used in the production of transportation diesel. Catalytic diesel is also used in fuel oil blend-ing and as heating oil in other countries.1
Recently, heavy, low-quality FCC feedstock has led to deteriora-tion in the quality of FCC diesel in China. Moreover, many compa-nies have revamped their FCC units or increased operational sever-ity to improve gasoline quality and to produce more propylene. Allof these efforts are contributing to a decline in diesel quality.
The aromatic content of catalytic diesel in Chinese refineriesis around 45%–80% [including large quantities of polycyclicaromatics (PCAs)2], with a cetane number between 20 and 35. As the diesel is high in both aromatics and sulfur, it leads to poor
ignition performance in diesel engines.Tightening environmental laws are pressuring Chinese refin-
ers to raise the quality of their products. To improve fuel quality and boost profits, researchers have developed a series of catalyticdiesel hydroprocessing solutions. This article discusses a numberof these technologies, which aid in the production of clean fuelsthat meet product quality specifications.
DIFFICULTIES IN PROCESSING CATALYTIC DIESEL
In refineries, diesel fractions are produced by FCC units, atmo-spheric and vacuum towers, delayed cokers and hydrocrackers.Table 1 shows the characteristics and makeup of Sinopec’s dieselfraction in 2008. The proportion of catalytic diesel in Sinopec’s
total diesel output in 2008 was 17.8%. Although this was a smallpercentage, the production from some units exceeded 30% dueto differences in unit scale and feed characteristics.
In 2008, catalytic diesel from Sinopec was mainly used in theproduction of transportation diesel, as a blending componentand as industrial fuel in power plants and factories in the Guang-dong and Zhejiang regions. Environmental standards at the timerequired diesel sulfur content to be less than 350 ppm, the cetanenumber to be 49+ and the PCA content to not exceed 11%.Compared to other types of diesel, Sinopec’s catalytic diesel hadhigh sulfur, nitrogen and aromatic contents; high density; and alower cetane number. It was also difficult to upgrade.
Converting aromatics in catalytic diesel via hydroprocessing
can affect the burning properties of the fuel, but it is also a key fac-tor in boosting diesel quality. Researchers in China have developed
a series of catalytic diesel hydroprocessing technologies that helpmeet fuel quality requirements and have diverse characteristics to
accommodate different upgrading needs.
FCC DIESEL HYDROPROCESSING TECHNOLOGIES
Catalytic diesel is an important fraction of China’s commercialdiesel stockpile, as it can help meet demand for transportation dieselduring petroleum shortages. However, due to FCC diesel’s high aro-matic content, it is difficult to considerably improve its quality, espe-cially its burning properties. Researchers have developed a number of catalytic diesel hydroprocessing technologies to address these issues.
TABLE 1. Makeup of Sinopec’s diesel fraction in 2008
Production, Total
thousand tons Proportion, Cetane aromatics,Type of diesel per year (tpy) wt% number wt%
Atmospheric and 39.65 56.8 42–58 15–30
vacuum diesel
Coker diesel 12.74 18.2 44–51 30–50
FCC diesel 12.41 17.8 20–35 45–80
Hydrocracker diesel 5.03 7.2 55–65 1–20
TABLE 2. Results from Gaoqiao dieselhydrogenation unit
Process conditions
Constitute proportion of feed, % 60.8 SR diesel, 30.8 coker gasolineand diesel, 8.4 catalytic diesel
Hydrogen partial pressure in inlet, MPa 6.2
LHSV of main catalyst, h–1 2.44
Inlet H2:oil, vol% 390:1
Average reaction temperature, °C 348
Industrial application results Feed Hydrotreated oil
Density, g/cm–3 0.8374 –
Distillation, °C 76–381 –
Sulfur, ppm 9,900 280
Nitrogen, ppm 322 48
Cetane number – 58PCAs, % – 6

5/16/2018 Hydrocarbon Processing February 2012 - slidepdf.com
http://slidepdf.com/reader/full/hydrocarbon-processing-february-2012 67/93
CLEAN FUELSSPECIALREPORT
66 I FEBRUARY 2012 HydrocarbonProcessing.com
Hydrotreating paths. In refineries where there is sufficientstraight-run (SR) and coker-based diesel production, transporta-tion-specification diesel can be processed with only hydrotreating,as needed. No adjustments are necessary for the cetane number.Researchers developed the FH-UDS hydrotreating catalyst seriesand ultra-desulfurization catalysts, which were successfully usedin hydrogenation units.
Operational requirements for the ultra-desulfurization of diesel were a liquid hourly space velocity (LHSV) of 1.5 h–1 to 2.5 h–1 and a total pressure of 6 MPa to 10 MPa. In the test, a 3-million-ton-per-year (MMtpy) diesel hydrogenation unit at Sinopec’sGaoqiao refinery processed SR diesel, coker gasoline and diesel,and FCC diesel into clean diesel with a sulfur content of less than10 ppm and a cetane number increase of 3–5 compared to thefeedstock. Results from the test are shown in Table 2.
The properties of the hydrotreating process were varied.The ultra-desulfurization catalyst series demonstrated powerful
hydrodesulfurization (HDS) ability. These catalysts producedclean diesel with a liquid yield of over 98% and sulfur content of less than 10 ppm. The catalyst series was used successfully in many units and carried a relatively low investment cost.
Maximizing diesel cetane number. In the 1990s,researchers began developing technology to maximize diesel
cetane, and they successfully carried out experiments in industrialapplications in 1998. The Maximum Cetane Number Improve-ment (MCI) technology soon saw widespread application. Basedon the first generation of MCI technology, researchers developeda second generation of MCI catalysts and process technology andapplied it to a 600,000-tpy diesel hydrogenation unit at Sinopec’sGuangzhou refinery in 2002.
Operational conditions required for the MCI process were atotal LHSV of 0.8 h–1 to 1.5 h–1 and a total pressure of 6 MPa to12 MPa. The process upgraded catalytic diesel into clean diesel with a sulfur content of less than 10 ppm and a cetane numberincrease of 8–20 compared to the feed. Moreover, the diesel yield was as high as 93% to 98%. Results are shown in Table 3.
TABLE 3. Results from Guangzhou dieselhydrogenation unit
Process conditions
Feed Catalytic diesel
Hydrogen partial pressure in inlet, MPa 6.3
Total LHSV, h–1 1
Inlet H2:oil, vol% 703:1
Average reaction temperature, °C 360
Industrial application results Feed Hydrotreated oil
Density, g/cm–3 0.8962 0.8534
Distillation, °C 189–367 164–357
Sulfur, ppm 7,000 5.8
Nitrogen, ppm 882 1.1
Cetane number 33.9 44.8
Increase in cetane number – 10.9
TABLE 4. Results from Yanshan dieselhydrogenation unit
Process conditions
Feed FCC diesel, FCC mixed oil, SR VGO
Hydrogen partial pressure in inlet, MPa 8.0
LHSV (hydrotreating/hydrocracking), h–1 1.01/1.30
Average reaction temperature 365/360
(hydrotreating/hydrocracking), °C
Industrial application results
Density, g/cm–3 0.8560
Distillation, °C 243–480
Sulfur, ppm 930
Nitrogen, ppm 810
Hydrogenation products Naphtha Light diesel Residue
Yield, % 18.6 45.1 30.4
Aromatics, % 63.5 – –
Sulfur, ppm < 0.5 < 10 < 10
Cetane number – 47.1 –
Bureau of Mines Correlation – – 6.2
Index (BMCI)**Calculated cetane number of a GO
TABLE 5. Results from pilot-scale FD2G test
Process conditions
Density, g/cm–3 0.9500
Distillation, °C 195–379
Sulfur, ppm 7,900
Nitrogen, ppm 1,109
Cetane number < 15
Total aromatics, % 79.9
Hydrogenation products Gasoline fraction Diesel fraction
Yield, % 53.27 35.95
Octane number (RON) 92.4 –Aromatics, % 53.74 –
Sulfur, ppm < 1 < 10
Cetane number – 45
TABLE 6. Results from Guangzhou hydrocracking unit
Process conditions
Feed FCC mixed oil (19.2% FCC diesel)
Cold high-pressure separator pressure, MPa 13.7
LHSV (hydrotreating/hydrocracking), h–1 1.38/1.60
Average reaction temperature 372/383
(hydrotreating/hydrocracking), °C
Industrial application results
Density, g/cm–3 0.9141
Distillation, °C 189–483
Sulfur, % 1.87
Nitrogen, ppm 701.3
Hydrogenation products Kerosine Diesel
Yield, % 26.71 27.75
Density, g/cm–3 0.8027 0.8234
Freezing point, °C < −65 –
Smoke point, mm 25 –
Sulfur, ppm – < 10Cetane index – 59.5

5/16/2018 Hydrocarbon Processing February 2012 - slidepdf.com
http://slidepdf.com/reader/full/hydrocarbon-processing-february-2012 68/93
CLEAN FUELS SPECIALREPORT
HYDROCARBON PROCESSING FEBRUARY 2012 I
67
MCI technology was found to be a good choice for refinerieslooking to maximize high-cetane diesel production. The use of MCI catalysts and optimal operating conditions resulted in pow-erful HDS, hydrodenitrogenation (HDN), hydrodearomatization(HDA) and partial open-ring reactions.
Moderate hydroprocessing technology. Researchers
began developing moderate hydroprocessing technology on theeve of the 1990s and successfully performed industrial experi-ments in 1997. The technology was geared toward refineries that were short on catalytic reforming feed and that wanted to improvediesel cetane number.
The technology was used in a 1-MMtpy diesel hydrogenationunit at Sinopec’s Yanshan refinery. Operational conditions requiredfor moderate hydroprocessing were a total LHSV of 0.8 h–1 to 1.5 h–1 and a total pressure of 6 MPa to 12 MPa. The process upgraded cata-lytic diesel, FCC mixed oil and SR light vacuum gasoil (VGO) intoclean diesel with a sulfur content of less than 10 ppm and a cetanenumber increase of 10–25 compared to the feed. The diesel yield wasas high as 80%. The process also yielded highly aromatic naphtha
as a potential catalytic reforming feed. Results are shown in Table 4.Moderate hydroprocessing technology was found to be a low-
cost choice for refineries seeking to improve diesel cetane numberand to maximize catalytic reformer feed. The technology alsoallowed for feed adjustment. The use of hydrotreating catalysts andopen-ring hydroprocessing catalysts resulted in powerful HDS,HDN, HDA and partial open-ring reactions, which enabled therefinery to produce clean diesel with sulfur content of less than 10ppm and highly aromatic naphtha for catalytic reforming feed. Also, considerable improvement was observed in the ignitionperformance of diesel engines using the clean diesel.
Hydroprocessing highly aromatic FCC diesel. In recent
years, as the quality of FCC feedstock became heavier and lower inquality, the aromatics content of catalytic diesel in some refineriesfell to 80%, with a cetane number of less than 20. For catalytic diesel with these characteristics, researchers developed technology to hydro-process FCC diesel into high-octane gasoline and light aromatics(FD2G). The process converts the aromatics in catalytic diesel intonaphtha, thereby producing a high-value blend of gasoline and diesel.
Operational requirements for the FD2G process were a totalLHSV of 0.6 h–1 to 1.0 h–1 and a total pressure of 8 MPa to 10MPa. The result was catalytic diesel with high aromatics contentand sulfur content of less than 10 ppm. The cetane number wasincreased by 10–30 compared to the feed.
The FD2G technology can also produce high-octane naphtha
for use as a blending component in clean gasoline. Since the lightaromatics content is over 50%, the naphtha can be processed asvarying aromatic feed to directly produce light aromatics. FD2G was implemented in a pilot-scale demonstration that met condi-tions for industrial applications; the results are displayed in Table 5.
The use of an exclusive catalyst and suitable process conditionsallowed for the hydroprocessing of FCC diesel with high aromat-ics content to high-octane gasoline and high-quality diesel. Thislow-cost process increased the value of the products and also metuser demand for increased production of gasoline and aromatics. Itproduced clean diesel with a sulfur content of less than 10 ppm andclean gasoline with a research octane number (RON) of up to 90.FD2G technology was deemed to be a good choice for refineries that
have catalytic diesel with high aromatics content and are seeking toimprove cetane number and produce more gasoline and aromatics.
Hydrocracking FCC diesel.This technology, which uses cata-lytic diesel as a hydrocracking feed, was developed for refineries lack-ing in hydrocracking feeds and having low production of catalyticdiesel. Research indicated that the hydrocracking of feeds with a spe-cific blend of catalytic diesel allowed for the conversion of low-cetanediesel to high-value naphtha and clean diesel. This not only enlargedthe hydrocracking feedstock base, but also satisfied requirements for
chemical naphtha and reduced the volume of low-quality diesel.In August 2009, Guangzhou Petrochemical Corp. applied the
mixed refining FCC diesel hydrocracking technology to a 1.2-MMtpy hydrocracker. Results from 2009 and 2010 suggestedthat hydrocracker operation was stable and that product quality met demand. Results are shown in Table 6.
The technology presented an optimal choice for refineries withlow production of FCC diesel and surplus hydrocracking capacity.Moreover, it was easy to implement at existing units and reducedthe difficulties associated with diesel blending, while considerably improving the quality of FCC diesel. HP
LITERATURE CITED
1 Thakkar,V. P., J. F. McGehee, S. F. Abdo, et al., “A Novel Approach for Greater Added Value and Improved Returns,” NPRA, San Francisco, California, 2005.
2 Zhao, Y., B. Shen, W. Zhang, et al., “Hydrodesulfurization and hydrodearo-matization activities of catalyst containing ETS-10 and AlPO4-5 on DaqingFCC diesel,” Fuel, 2008, Vol. 87, Nos. 10–11, pp. 2343–2346.
Xinlu Huang is a senior engineer at FRIPP. He has 14 years of
experience in hydrotreating and hydrocracking technologies. Mr.
Huang holds an MS degree in chemical engineering from Liaoning
University of Petroleum and Chemical Technology.
Tao Liu is a professor at FRIPP. He has 17 years of experience in
hydrotreating and hydrocracking technologies and holds a bach-
elor’s degree in petroleum chemicals from China University of
Petroleum.
Ronghui Zeng is a professor and the deputy chief engineer at
FRIPP in charge of hydrocracking and hydrotreating. He holds a BSdegree in petroleum refining from China University of Petroleum.
Jihua Liu is a professor at FRIPP with 27 years of experience in
gasoline and diesel hydroprocessing.
Chong Peng is an engineer at Sinopec’s Fushun Research
Institute of Petroleum and Petrochemicals (FRIPP). He began his
hydrogenation study after receiving his master’s degree from China
University of Petroleum (Beijing) in 2009. His research fields include
hydrotreating and hydrocracking technologies.
Minghua Guan is a professor at FRIPP and oversees all of
the institute’s technical fields. He has 30 years of experience in
petroleum refining and holds a BS degree in catalytic chemistryfrom Xiamen University.

5/16/2018 Hydrocarbon Processing February 2012 - slidepdf.com
http://slidepdf.com/reader/full/hydrocarbon-processing-february-2012 69/93
©2011 Baldor Electric Company
• Local Sales & Support
• Energy Efficiency
• Industrial Motors & Drives
• Unmatched Customer Service
For decades, ABB variable speed drives and Baldor
motors have set the standard for quality, reliability and
energy savings. Now, industrial customers in the U.S.
can buy these products and receive expert support
from a single source. Call 479-646-4711 to locate the
district office nearest you.
Two trusted names. One local source for sales and
support. Only from ABB and Baldor.
baldor.com
Scan with your smartphone to watch amotor and drive energy efficiency video
or go to http://bit.ly/mSM0JV.
Select 62 at www.HydrocarbonProcessing.com/RS
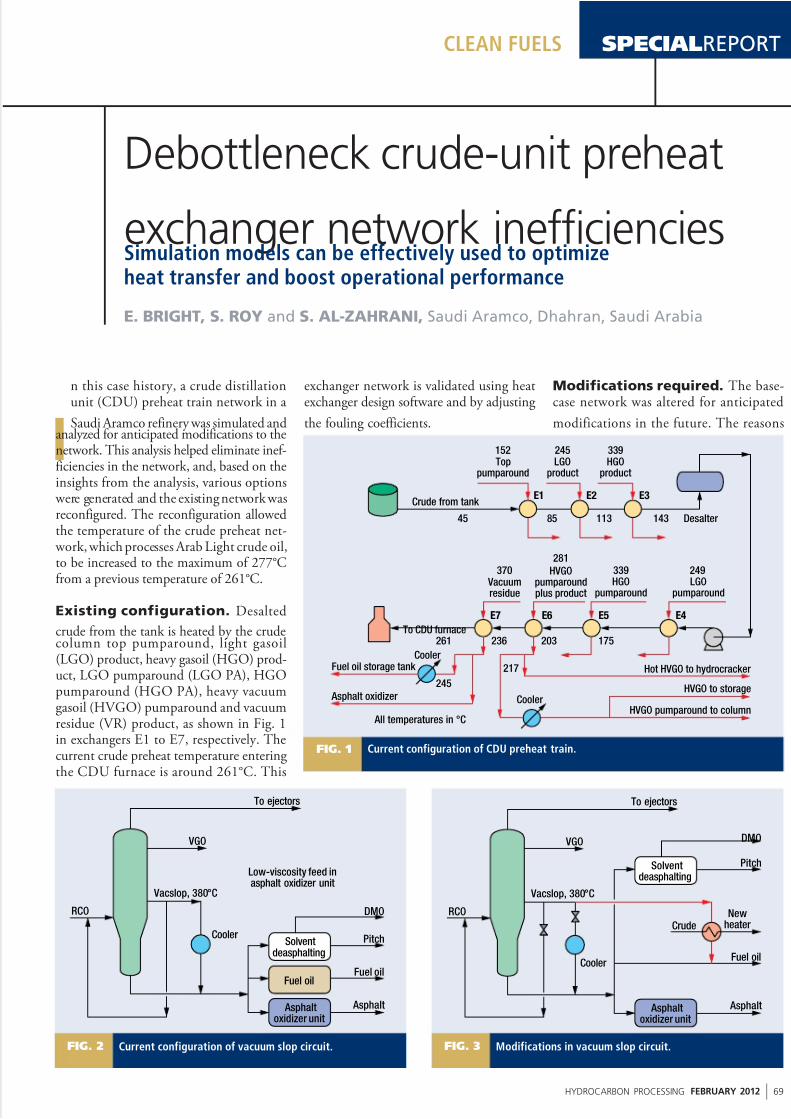
5/16/2018 Hydrocarbon Processing February 2012 - slidepdf.com
http://slidepdf.com/reader/full/hydrocarbon-processing-february-2012 70/93
CLEAN FUELS SPECIALREPORT
HYDROCARBON PROCESSING FEBRUARY 2012 I
69
Debottleneck crude-unit preheat
exchanger network inefficienciesSimulation models can be effectively used to optimizeheat transfer and boost operational performance
E. BRIGHT, S. ROY and S. AL-ZAHRANI, Saudi Aramco, Dhahran, Saudi Arabia
I
n this case history, a crude distillationunit (CDU) preheat train network in a
Saudi Aramco refinery was simulated andanalyzed for anticipated modifications to thenetwork. This analysis helped eliminate inef-ficiencies in the network, and, based on theinsights from the analysis, various options were generated and the existing network wasreconfigured. The reconfiguration allowedthe temperature of the crude preheat net- work, which processes Arab Light crude oil,to be increased to the maximum of 277°Cfrom a previous temperature of 261°C.
Existing configuration. Desalted
crude from the tank is heated by the crudecolumn top pumparound, light gasoil(LGO) product, heavy gasoil (HGO) prod-uct, LGO pumparound (LGO PA), HGOpumparound (HGO PA), heavy vacuumgasoil (HVGO) pumparound and vacuumresidue (VR) product, as shown in Fig. 1in exchangers E1 to E7, respectively. Thecurrent crude preheat temperature enteringthe CDU furnace is around 261°C. This
exchanger network is validated using heatexchanger design software and by adjusting
the fouling coefficients.
Modifications required. The base-case network was altered for anticipated
modifications in the future. The reasons
Toppumparound
Vacuumresidue
To CDU furnace
Crude from tank
Fuel oil storage tank Hot HVGO to hydrocracker
HVGO pumparound to column
HVGO to storage Asphalt oxidizer
All temperatures in °C
Cooler
Cooler
HVGOpumparoundplus product
HGOpumparound
LGOpumparound
LGOproduct
HGOproduct
Desalter
E7 E6 E5
175203236
45 85 113 143
339 249281
370
152 245 339
261
245
217
E4
E1 E2 E3
Current configuration of CDU preheat train.FIG. 1
Fuel oilFuel oil
Solventdeasphalting
Pitch
DMO
Vacslop, 380°C
Low-viscosity feed inasphalt oxidizer unit
VGO
RCO
Asphaltoxidizer unit
Asphalt
To ejectors
Cooler
Current configuration of vacuum slop circuit.FIG. 2
Fuel oil
Vacslop, 380°C
VGO
RCO
Asphalt
To ejectors
Cooler
NewheaterCrude
Solventdeasphalting
Pitch
DMO
Asphaltoxidizer unit
Modifications in vacuum slop circuit.FIG. 3

5/16/2018 Hydrocarbon Processing February 2012 - slidepdf.com
http://slidepdf.com/reader/full/hydrocarbon-processing-february-2012 71/93
CLEAN FUELSSPECIALREPORT
70 I FEBRUARY 2012 HydrocarbonProcessing.com
for the modifications are listed below:• Vacuum slop circuit. In the current
configuration (Fig. 2), the vacuum slopis recycled to the vacuum tower throughthe vacuum furnace. The purpose of thisrecycle is to recover the VGO componentsand send the VGO to the hydrocracker;
however, this is not achieved in the cur-rent operation due to vacuum furnacelimitations and insufficient separation inthe wash section. As a result, this vacuumslop stream (which is lower in viscosity)goes with the vacuum tower bottoms. The
mingling of streams deteriorates the feed tothe asphalt oxidizer and creates operationalproblems in meeting the penetration prop-erty of the asphalt.
To address this concern, the vacuumslop stream from the vacuum tower isavailable at a temperature of 380°C, which
is withdrawn as a separate cut and is usedto increase the preheat temperature of thecrude. This proposed new exchanger is con-figured to be in parallel with the existingheat exchanger E4 in Fig. 1. Fig. 3 showsthe rerouting of the vacuum slop.
• Future splitter configuration.To meet the clean gasoline specificationof 1% benzene in gasoline, the existingnaphtha splitter must remove the benzeneprecursors in the catalytic reformer feedby increasing the initial boiling point of the heavy naphtha. This process requires a
higher reboiler duty. In addition, the heavy naphtha from the hydrocracker needs tobe processed in the naphtha splitter, as thisfeed also contains benzene precursors.
Currently, hydrocracker heavy naphthais not part of the naphtha splitter feed. Thehydrocracker heavy naphtha feed volumeis 12,500 barrels per day (bpd), and theexisting naphtha splitter capacity is 23,000bpd. Figs. 4 and 5 show the naphtha sys-tem’s current and planned configurations,respectively. As the current naphtha splittercannot handle this higher throughput with
higher reboiler requirement, the existingnaphtha splitter will be mothballed. Theexisting reboiler, which uses HGO PA flow and gives a duty of 10.4 million kilocaloriesper hour (MMkcal/hr), will also be moth-balled. High-pressure steam will be used inthe reboiler of the new naphtha splitter tomeet the higher reboiler requirements. Forthe column to be in heat balance, this 10.4MMkcal/hr of heat removal is required.In the proposed exchanger network, thisstream (HGO CR) will be used to preheatthe crude.
Synthesis of crude preheat train. A new, preliminary heat exchanger network (Fig. 6) was synthesized to accommodate theabove modifications. While modifying thecrude preheat train network, the followingimpact on the equipment was kept in mind:
• Prevention of vaporizations in the fur-nace pass-control valves, as it is difficult tocontrol two-phase flows across pass-controlvalves. Inadequate flow in the furnace passflows will also lead to coking.
• Column heat balance.
• Column hydraulics.• Impact of hot streams going directly
to the other unit.The changes made in the base-case net-
work are listed below:• Exchanger N1 was added parallel to
E4 (see Fig. 6) using vacuum slop (vacslop)and vacuum residue ex-E7 as the hot fluid.This modification is required to improve theviscosity of the vacuum residue to the asphaltoxidizer. The current viscosity of the feed tothe asphalt oxidizer is 1,500 centistokes (cst),and the required viscosity is 2,000 cst.
• Another exchanger N2 (E5-2, similarto E2) was added parallel to E2 using HGO
LPG + gasLN LN to storage
Area Dtreater
LN to storageLN
NHTHN
HN
HCU HN
LPG + gas
FG C S F
D E
B f
e e d
C D U s
t a b
f e e d
Drag
Separator andstripper gas
Rich oil
CDUdebut
CSFdebut
CSF NS
CDU NS GCUdebut
Lean oil
HCUfractionator
Absorber
CSFtreater
Catalyticreformer
Causticwash
HGO CR
CDU NS willbe mothballed
in the future
E29
LPG + gas
C5 /C6 tostorage
Current configuration of naphtha circuit.FIG. 4
LPG + gasLN
LPG + gas
LN toisomerization
unit
LN+HN
HN FG toarea D
Lean oil
C S F
D E B f
e e d
C D U s
t a b
f e e d
Drag
CDUdebut
New piping and equipment
GCUdebut
CSFdebut CSF
NS
NewCDUNS
Steam
HCUfractionator
HCU HNHP SEP
gas
Absorber
Rich oil
Causticwash
Sulfurguard bed
LPG + gas
C5 /C6 tostorage
Catalyticreformer
NHT
Configuration of naphtha management system after clean-fuel implementation.FIG. 5

5/16/2018 Hydrocarbon Processing February 2012 - slidepdf.com
http://slidepdf.com/reader/full/hydrocarbon-processing-february-2012 72/93
CLEAN FUELS SPECIALREPORT
HYDROCARBON PROCESSING FEBRUARY 2012 I
71
PA fluid ex-E5 (hereafter referred to as E5-1)as the hot fluid. This modification is per-formed to accommodate the 10.4-MMkcal/hr duty in the HGO PA circuit.
• Increased area in E4 from the 2-par-allel-1-series arrangement to a 2-parallel-2-series design and added cooler N3 down-
stream of E4.Due to the first two modifications, the
inlet temperature to E4 has increased, whichdecreases the logarithmic mean tempera-ture difference (LMTD) available across theunit. Since E4 is the LGO PA exchanger,the column will not be in heat balance if therequired heat removal is not performed. Therequired duty was 18.8 MMkcal/hr, andthe available duty was 12.7 MMkcal/hr (seeTable 1). Therefore, additional area and acooler were added in the LGO PA circuit tomeet the duty requirement of the column.
The required HGO PA duty is 26.8MMkcal/hr, and the available duty is29.8 MMkcal/hr. As the heat removed inHGO PA is higher by 3 MMkcal/hr, therequirement of LGO PA duty will comedown by 3 MMkcal/hr. As both LGO andHGO are mixed outside of the column andgo to the diesel hydrotreater (DHT), thesplitting of the duty between LGO andHGO pumparound is not a concern froma separation point of view. However, itdoes impact the column draw temperature, which will sl ightly reduce the LMTD
across E3 (HGO product/crude exchanger)and E5 (HGO PA/crude exchanger).
Results of network modification.
In the modified network, the obtainedpreheat temperature was 266°C. The duty,LMTD and area of each exchanger in thenetwork are presented in Table 1. FromTable 1, it can be observed that:
• Exchanger E6, which has a higherarea, is experiencing the lowest LMTD;therefore, any modification that increasesthe LMTD will significantly increase the
heat recovered from E6.• The exchanger preceding exchanger
E6 is heated by HGO circulating reflux(CR), which is at 337°C; this is higher thanthe hot stream (HVGO CR) temperature of E6, which has decreased the LMTD in E6.
TABLE 1. Performance of base-case network after modifications
Exchangers Duty, MMkcal/hr Area, m2 LMTD, °C Minimum approach, °C
E1 A/B/C (top PA) 13.0 1,300 50.6 34.0
E2 (LGO) 7.6 326 94.8 79.0
E5-2 (new N2—HGO PA) 9.1 326 98.6 83.0
E3 (HGO) 9.4 363 92.7 38.0E4 (LGO PA) 12.7 1,379 48.1 35.0
Vacslop + FO (new N1) 3.5 270 99.5 84.0
E5-1 (HGO PA) 14.2 327 79.0 50.0
E6 (HVGO PA + HVGO) 10.9 1,458 24.0 14.0
E7 (VR) 10.4 1,027 39.0 8.6
Total area 6,776
Total duty 90.8
Note: Crude preheat temperature is 266°C. The required LGO PA duty is 18.8 MMkcal/hr; therefore, the new required LGO PAcooler duty is 6.1 MMkcal/hr. The required HGO PA duty is 26.8 MMkcal/hr, and the available HGO PA duty is 29.8 MMkcal/hr.
TABLE 2. Energy analysis ofbase-case network
Heat exchanger Percentnetwork of target
Heating, MMkcal/hr 67 145
Cooling, MMkcal/hr 21 N/ATotal area, m2 9,491 56
TABLE 3. Performance data for modified network in Fig. 8
Exchangers Duty, MMkcal/hr Area, m2 LMTD, °C Minimum approach, °C
E1 A/B/C (top PA) 13.00 1,300 50.6 34
E2 (LGO) 8.60 326 86.0 68
E5-2 (New N2—HGO PA) 13.60 326 113.0 92
E3 (HGO) 9.40 363 77.0 26
E4 (LGO PA) 11.10 1,379 47.0 31
Vacslop + FO (new N1) 3.20 270 77.0 65
E6 (HVGO PA + HVGO) 14.53 1,458 33.0 20
E5-1 (HGO PA) 8.60 327 60.0 49
E7 (VR) 10.30 1,027 50.0 23
Total area 6,776
Total duty 92.30Note: Crude preheat temperature is 269°C. The required LGO PA duty is 18.8 MMkcal/hr; therefore, the new required LGO PAcooler duty is 7.7 MMkcal/hr, and the required HGO PA duty is 26.8 MMkcal/hr.
Crude from tank
HGO pumparound
HGO CR to column
186
45 15112783 123 Area:326 m2
New N2
E26 A/B
6.5 MMkcal/hr
HVGO product
TO CDU furnace
To fuel oil storagetank through cooler
Asphalt oxidizer
Existing exchangerNew exchangerExisting exchanger withadditional areaPiping modifications
All temperatures in °C
HVGOpumparound
to column
New N1 Area:270 m2
378
198
188219
280370 337
243
Vacuum residue HVGO PA plus product 15 MMkcal/hr
266
251
Newcooler
N3
Vacuumslop
Cooler
133
245LGO product 335
HGO product Desalter155
Top pumparound
245 LGOpumparound
Additionalarea: 690 m2
E1
E2
E5-2E29
E3
E4E5E6E7
Base-case network after modifications.FIG. 6

5/16/2018 Hydrocarbon Processing February 2012 - slidepdf.com
http://slidepdf.com/reader/full/hydrocarbon-processing-february-2012 73/93
CLEAN FUELSSPECIALREPORT
72 I FEBRUARY 2012 HydrocarbonProcessing.com
This preliminary network was analyzedfor possible improvement in the preheattemperature. The analysis indicated that
heat recovery can be increased by 45% by boosting the area by 56% (see Table 2).
The analysis also indicated that the driv-
ing force across exchanger E7 further lim-ited the heat recovery. Fig. 7 displays thedriving-force plot. The figure indicates thatthe driving force in E7 can be increased by decreasing the inlet temperature in E7. Thistemperature adjustment can be achieved by operating E5 in parallel with E7.
Case 1. Based on the insights derivedfrom Table 1 and Fig. 7, to improve theheat recovery, the crude stream in E7 andE5 was split by operating E5 in parallel with E7. The objective of this modificationis to increase the LMTD across E7 and E6.However, it also decreases the LMTD acrossE5-1. The net effect is shown in Table 3, andthe modified network is shown in Fig. 8. With this arrangement, the preheat temper-ature has increased from 266°C to 269°C.
Case 2. From LMTD and approachdata in Table 3, it can be inferred that heat
recovery in E5-1 can still be improved by increasing the area. Hence, another casestudy was performed by adding two similarexchangers in a series in E5-1. The resultsare tabulated in Table 4. The preheat wasfound to be increased to 277°C.
The HGO PA is now providing an extra4.2 MMkcal/hr more than required, which will reduce the LGO PA duty requirementby the same amount for the column to bein heat balance. Then, the required LGOPA cooler duty comes down to 2.6 MMk-cal/hr. HP
Said A. Al-Zahrani is the general supervisor in the
process and control systems department at Saudi Aramco.
He is the chairman of the multi-disciplinary product speci-
fications committee, tasked with managing various issues
related to Saudi Aramco products and fuel specifications.
Al-Zahrani holds a degree in chemical engineering from
King Fahd University of Petroleum and Minerals, and
began his career at Saudi Aramco as a process engineer
in the Ras Tanura refinery. He is a member of several localand international societies and an officer of the American
Institute of Chemical Engineers, Saudi Arabian chapter.
Edwin Bright has over 17 years of experience in
the petroleum refining industry. Before joining Saudi
Aramco, he worked for Reliance Industries Ltd., Indian
Oil Corp., ATV Petrochemicals and Foster Wheeler India
Ltd. He holds a bachelor’s degree in chemical engineer-
ing and master’s degrees in petroleum refining and pet-
rochemicals from AC Tech, Anna University, Chennai. He
also earned a master’s degree in management from the
Asian Institute of Management in Manila.
Samit Roy is an engineering consultant at Saudi
Aramco’s downstream process engineering division
under the process control and systems department. A
graduate in chemical engineering, he has more than 33
years of broad experience in the process engineering and
technical services areas of oil refining and gas processing
plants. His experience includes 21 years in Saudi Aramco
refining and engineering services and 12 years at Indian
refineries. He has worked at most of the refinery process
units associated with distillation, hydroprocessing and
gas treating plants.
400
350
300
250
H o t t e m p e r a t u r e ,
° C
200
150
100
100 120 140 160 180 200
Cold temperature, °C
Target driving forceE5-1 at mainE6 at mainy=xE7 at main
220 240 260 280 300
Driving-force plot for base-case network.FIG. 7
Crude from tank
HGO pumparound
HGO CR to column
186
48
156
83
264
134 Area:326 m2
New N2E26 A/B6.5
MMkcal/hr
Naphthastabilizer
bottoms out
14.1 MMkcal/hr
9.1 MMkcal/hr
HVGO product
TO CDU furnace
To fuel oil storagetank through cooler
Asphalt oxidizer
Existing exchangerNew exchangerExisting exchangerwith additional area
Existing exchangerin new locationPiping modifications
All temperatures in °C
HVGOpumparound
to column
New N1 Area: 270
m2
378
198
241
191
280
HVGO PA plus product
Vacuum residue
271269
NewLGO orcooler
N3
Vacuumslop
Cooler
133
245LGO product 335
HGO productDesalter
155Top pumparound
LGOpumparound
Additional
area: 690 m2
E1
E2
E5-2
E3
E4E6E7
E5
E29
Modified network based on E5 operating in parallel with E7.FIG. 8
TABLE 4. Performance data for modified network with increased area in E5-1
Exchangers Duty, MMkcal/hr Area, m2 LMTD, °C Minimum approach, °C
E1 A/B/C (top PA) 13.0 1,300 50.6 34E2 (LGO) 8.6 326 86.0 68
E5-2 (new N2—HGO PA) 10.5 326 91.0 74
E3 (HGO) 9.7 363 80.0 27
E4 (LGO PA) 12.0 1,379 45.0 33
Vacslop + FO (new N1) 3.4 270 81.0 70
E6 (HVGO PA + HVGO) 15.0 1,458 34.0 21
E5-1 (HGO PA) 14.0 983 31.0 12
E7 (VR) 10.1 1,027 53.0 27
Total area 7,432
Total duty 96.3
Note: Crude preheat temperature is 277°C. The required LGO PA duty is 18.8 MMkcal/hr; therefore, the new required LGO PAcooler duty is 6.8 MMkcal/hr. The required HGO PA duty is 26.8 MMkcal/hr, and the available HGO PA duty is 31.0 MMkcal/hr.

5/16/2018 Hydrocarbon Processing February 2012 - slidepdf.com
http://slidepdf.com/reader/full/hydrocarbon-processing-february-2012 74/93
In today's challenging economic climate, creative thinking, accurate cost estimates and a
commitment to technical excellence are crucial to the success of capital projects. Mustanghas a superior reputation for providing owners with total project delivery, from feasibilityanalysis and front-end engineering to facility startup.
Whether a project is grassroots, revamp, expansion or modernization, Mustang has theexperience and capability to successfully execute your project to achieve the desired results.
Contact Mustang today!
Total Project Delivery
With a Reputation for Excellence
www.mustangeng.com
Select 90 at www.HydrocarbonProcessing.com/RS

5/16/2018 Hydrocarbon Processing February 2012 - slidepdf.com
http://slidepdf.com/reader/full/hydrocarbon-processing-february-2012 75/93
Why wait 10, 15 or 20 weeks for your delivery! Ask AMISTCO®
Separation Products about our Fast Track delivery for trays and
a complete range of tower internals. With complete in-house
engineering and fabrication, we can use your existing drawings
or modify them to improve your process.
Trays (numerous options)
Sieve or perforated
Bubble cap trays
Cartridge trays
Valve
A Member of Fractionation Research, Inc.
®
MIST ELIMINATORS
DISTRIBUTORS & SUPPORTS
COALESCERS
STRUCTURED PACKING
RANDOM PACKING
WEDGE WIRE SCREEN
Select 60 at www.HydrocarbonProcessing.com/RS

5/16/2018 Hydrocarbon Processing February 2012 - slidepdf.com
http://slidepdf.com/reader/full/hydrocarbon-processing-february-2012 76/93
FLUID FLOW
HYDROCARBON PROCESSING FEBRUARY 2012 I
75
Reducing pressure and controlling flowrates in pipes can beaccomplished via restriction plate orifices or throttle valves.In all cases, it must be achieved without producing cavita-
tion. To avoid cavitation with any pressure reducing component,Eq. 1 sets the process operating conditions:
(P 1 – P v )/(P 1 – P 2 ) > C i (1)
Where C i is the incipient cavitation coefficient obtained by testsfor every type of component. The ideal best component to run without cavitation would be with C i = 1 and P 2 = P v .
Control valves with an internal tortuous path almost approachthis value. However, restriction orifice plates, along with globe andbutterfly valves, have C i values from 1.8 to more than 6. Multi-holerestriction orifice plates have C i values from 1.2 to 4.
Newly developed multi-hole restriction plates do hold promise.1 Tests with butterfly valves can achieve C i values as low as 1.05 for
D = 4 in. and de/D = 0.2 or 1.14 for D = 24 in. and de/D = 0.2.2,3
Design characteristics. As shown in Fig. 1, the new restric-tion place/device may be considered as a butterfly valve with thedisc perforated by several holes or an adjustable rotary multi-hole
Eliminate cavitation
in your piping systemsNew pressure control devices improve fluid flow
E. CASADO FLORES, E. Agrupados, Madrid, Spain
0
500
1,000
1,500
2,000
2,500
0 10 20 30 40 50 60 70 80
Opening angle, º
C
v
de/D = 0.2
de/D = 0.5
Flow coefficient, C v for D = 8-in. and de/D = 0.2 or 0.5.FIG. 3
New multi-hole restrictive pressure/flow control plate.FIG. 2
Perforated disc
(A) As a control valve
(B) An ajustable multiple orifice plate
Sketches of the new flow/pressure control device: a) as acontrol valve and B) as an adjustable multi-orifice plate.
FIG. 1

5/16/2018 Hydrocarbon Processing February 2012 - slidepdf.com
http://slidepdf.com/reader/full/hydrocarbon-processing-february-2012 77/93
FLUID FLOW
76 I FEBRUARY 2012 HydrocarbonProcessing.com
restriction plate. Fig. 2 is a multi-hole restriction plate with D = 30in. For D = 8 in., Fig. 3 shows the flow coefficient, C v that relatesthe flow and pressure drop as calculated by Eq. 2:
C v = 1.17Q (P 1 – P 2 )0.5 (2)
Fig. 4 illustrates the incipient cavitation coefficient, C i , fordifferent values of de/D. For P 1 values greater than approxi-
mately 6 kg/cm2 abs, the pressure scale effects correction andmust be considered.4, 5 Fig. 5 shows the corresponding valuesof C i for restriction orifice plates, butterfly valves and the new restriction plate. The new C i values are the minimum that per-tain to every de/D value with the appropriated opening angle.They are close to 1 for de/D < 0.3.
Characteristics and operation. Two similar prototypesof the new restriction plate were installed and are now runningcavitation-free in CN Almaraz, a Spanish nuclear power plant.The prototypes were constructed by modifying two existingbutterfly valves, drilling the discs with a selected size and num-ber of holes. But the holes were done only in the external part
of the surface of the disc because the central part has a greaterthickness, as shown in Fig. 6. The prototypes were installed atthe end of the fire-water pump recirculation lines, and they discharge water to a lake. The pipe-length downstream the pro-totypes is less than 0.5 m with two 90° elbows. The prototypesize is D = 4 in. and de/D = 0.37.
When the opening angle is 0°, with the disc in the verticalposition, the prototype works as a multi-hole restriction plate,and the measured values are:
P 1 = 9.8 kg/cm2, P 2 = 0.039 kg/cm2, P 1 – P 2 = 9.761 kg/cm2,Q = 100 m3/h
The water temperature was approximately 60°F, so P v = 0.256
psia = 0.017 kg/cm2 abs. The prototype in this situation with thedisc in the vertical position has cavitation. This is in accordance with the theory because a multi-hole restriction orifice plate forD = 4 in. and de/D = 0.37 has C i = 1.25. From Eq. 1, the C i iscalculated as:
(9.8 + 1.02 – 0.017)/9.761 = 1.107 < 1.25
1
2
3
4
5
6
7
C i
de/D = 0.2
de/D = 0.35
de/D = 0.5
0 10 20 30 40 50 60 70 80
Opening angle, º
Incipient cavitation coefficients, C i for D = 8-in. andde/D = 0.2, 0.35 or 0.5.
FIG. 4
0
2
4
6
8
10
0.0 0.1 0.2 0.3 0.4 0.5 0.6 0.7 0.8 0.9de/D
C i
RO 1 central hole
Butterfly
RO multi-hole plates
New plate
Incipient cavitation coefficients for ROs, butterfly valve
and the new plate for D = 8-in.
FIG. 5 Design details for new flow control systems.FIG. 6

5/16/2018 Hydrocarbon Processing February 2012 - slidepdf.com
http://slidepdf.com/reader/full/hydrocarbon-processing-february-2012 78/93
FLUID FLOW
Note: 9.8 + 1.02 = 10.82 kg/cm2 abs. When the opening angle is only 5°, the cavitation disappears,
and the device runs without noise. The measured values are:
P 1 = 9.4 kg/cm2, P 2 = 0.12 kg/cm2, P 1 – P 2 = 9.28 kg/cm2, Q = 125 m3/h.
From Eq. 1, C i is calculated as:
(9.4 + 1.02 – 0.017)/9.28 = 1.12
As there i s no cavitat ion, then C i must be less than 1.12. According to these theoretical calculations, for the restrictiveplate with D = 4 in. and de/D = 0.37, the minimum C i value is1.08 for an opening angle of 20°. The prototype tests show thatin the opening range from 3° to 26°, there is no cavitation ornoise. The flowrate varies between 115 m3/h and 220 m3/h andthe pressure drop is between 9.5 kg/cm2 and 6 kg/cm2.
Upstream of the new device, a 4-in. globe valve was installed.In the tests, when the new plate is in the horizontal position(opening angle = 90°) and trying to control the flow by throt-tling the globe valve, high cavitation noise and valve vibration
levels occurred. This condition confirms that the globe valveshould not be throttled in this situation.
The new multi-hole device with the appropriated num-ber and size of holes and the corresponding opening angleapproaches the C i = 1 value that can successfully eliminate cavi-tation. HP
NOMENCLATURE
C i Incipient cavitation coefficientC v Flow coefficientD Pipe diameter, in.de Equivalent diameter of the holes (in.), de = do(n)0.5
do Hole diameter, in.n Number of holes
P 1 Upstream pressure, kg/cm2 absP 2 Downstream pressure, kg/cm2 absQ Flow, m3/h
LITERATURE CITED
1 Casado, E., “Look at orifice plates to cut piping noise, cavitation,” POWER,September 1991.
2 Casado, E., “Avoid cavitation in butterfly valves,” Hydrocarbon Processing, August 2006.
3 Casado, E., “Maximum throttling of manual valves without damage,”Hydrocarbon Processing, August 2008, pp. 55–57.
4 Tullis, J. P., “Cavitation Guide for Control Valves,” NUREG/CR-6301, April1983.
5 “Considerations for Evaluating Control Valve Cavitation,” ISA-RP75.23-1995, June 1995.
Emilio Casado Flores is mechanical head engineer in PWR
nuclear power plants with EEAA in Madrid, Spain. From 2007 to
2010, Mr. Casado was the engineering manager at the Almaraz
power upgrading project, PWR Spanish nuclear power plant. His
work experience includes mechanical, thermal and hydraulic engi-
neering design and operation in petroleum refineries and nuclear power plants. Mr.
Casado Flores has published technical papers about cavitation of restriction orifices,
heat exchanger operation, steam discharge through valves and pipes, flow of satu-
rated condensate through pipes and control valves, etc. He has developed someplant tests about cavitation and pressure drop in multi-hole perforated restriction
plates and throttled valves.
SAMSON AG · MESS- UND REGELTECHNIK Weismüllerstraße 3
60314 Frankfurt am Main·
GermanyPhone: +49 69 4009-0 · Fax: +49 69 4009-1507E-mail: [email protected]: www.samson.deSAMSON GROUP · www.samsongroup.de A
0 1 0 5 1 E N
Know-how
for Your Success
Due to global competition, companiescan only be successful on the market-place if they produce outstandingquality cost effectively.
High-quality control valves andaccessories with low cost of owner-ship are what it takes for economicproduction.
With over 50 independent subsidiar-ies and over 220 engineering andsales offices spread across the world,SAMSON ensures the safety andenvironmental compatibility of yourplants on any continent.
Select 163 at www.HydrocarbonProcessing.com/RS

5/16/2018 Hydrocarbon Processing February 2012 - slidepdf.com
http://slidepdf.com/reader/full/hydrocarbon-processing-february-2012 79/93
The Global Gas Industry
is Coming to London
www.gastech.co.uk/hydrocarbon-processing
S pec ia l
Ea r l y b i rd
o f fe r
Book
Gastech 2012
for the special
Earlybird rate of£1,999*
*Saving based on full delegate
rate for Gastech 2012.
A world leader in natural gas
Hosted by

5/16/2018 Hydrocarbon Processing February 2012 - slidepdf.com
http://slidepdf.com/reader/full/hydrocarbon-processing-february-2012 80/93
ROTATING EQUIPMENT
HYDROCARBON PROCESSING FEBRUARY 2012 I
79
Whenever heavy-duty pumping is involved, produced- water injection (PWI) pumps are among those thatcome to mind first. Except for large piston pumps
occasionally used for PWI duties, multi-stage centrifugal pumps
are now primarily used in this severe service. Two typical styles of multi-stage centrifugal pumps—barrel and horizontally split—are shown in Figs. 1 and 2. PWI pumps are offered by differentmanufacturers, and this article will make no attempt to describethem all. Instead, the author will provide insight into sealingoptions for major pumps.
Similarities exist among pumps. There are obvioussimilarities within a particular style, i.e., barrel or horizontally split. In many ways, the internals of both styles are identical.Either style of pump can produce over 400 bar discharge pres-sure, although discharge pressures for barrel style duties aremore typically in the 200 bar to 250 bar range. In both Figs.
1 and 2, the discharge nozzle is located near the center of thepump. This would indicate that several of the impellers makingup the pump rotors are oriented for inlet flow originating nearthe drive-end. The other impellers are oriented in mirror-imagefashion near the non-drive end (NDE) of the rotor. The designintent is to achieve hydraulic balance and to minimize thrust-bearing loads.
In Fig. 3, the cutaway shows a six-stage pump with fluid enter-ing the pump at the nozzle (A). The fluid is fed through the first
three impellers toward the center of the pump (B). Once the fluidexits the third impeller, it is redirected via a cross-over (C) to theoutside impeller at the opposite end of the pump. From here, the
Understand multi-stage pumps
and sealing options: Part 1Service life and cost impact what seals to use on your heavy-duty pump
L. GOOCH, AESSEAL plc, Rotherham, UK
Barrel-style multi-stage PWI pump. Source: Sulzer CPHbarrel pump.
FIG. 1
A cutaway view of a six-stage pump; three of its siximpellers are oriented in mirror image fashion so as to
achieve hydraulic thrust balance. Source: Goulds model3600.
FIG. 3
Horizontally split multi-stage pump. Source: David BrownType DB34 horizontal split case pump.
FIG. 2
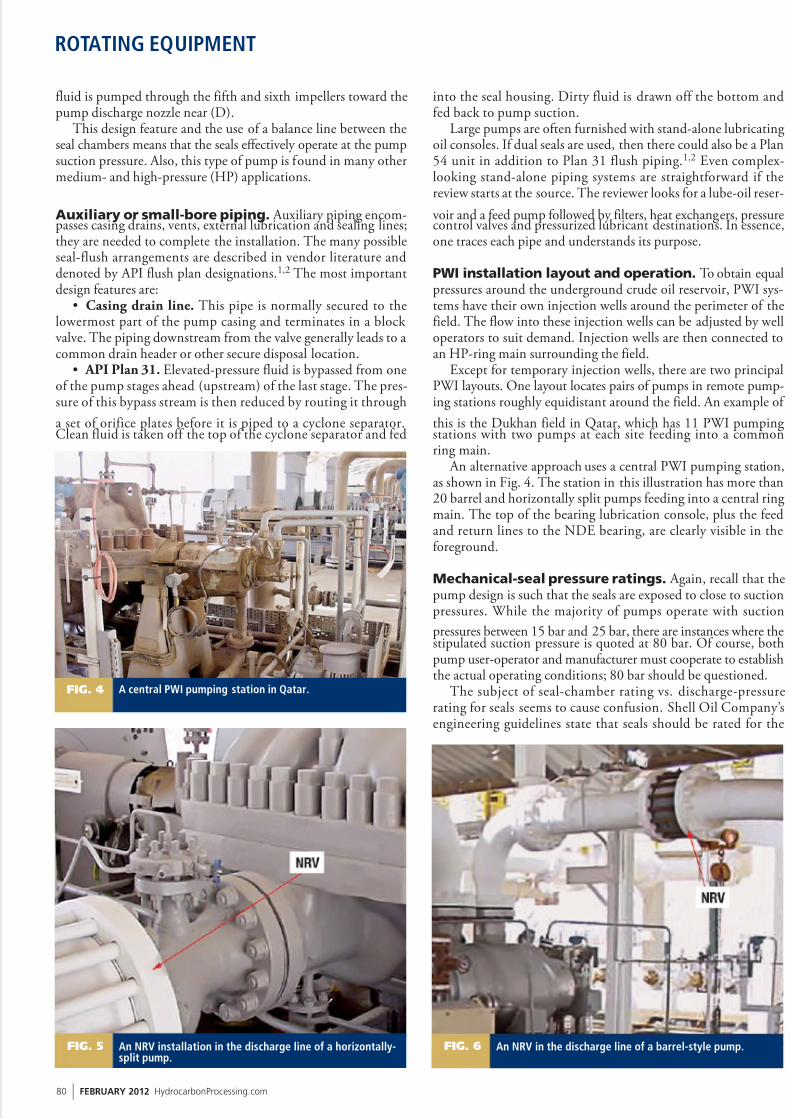
5/16/2018 Hydrocarbon Processing February 2012 - slidepdf.com
http://slidepdf.com/reader/full/hydrocarbon-processing-february-2012 81/93
ROTATING EQUIPMENT
80 I FEBRUARY 2012 HydrocarbonProcessing.com
fluid is pumped through the fifth and sixth impellers toward thepump discharge nozzle near (D).
This design feature and the use of a balance line between theseal chambers means that the seals effectively operate at the pumpsuction pressure. Also, this type of pump is found in many othermedium- and high-pressure (HP) applications.
Auxiliary or small-bore piping. Auxiliary piping encom-passes casing drains, vents, external lubrication and sealing lines;they are needed to complete the installation. The many possibleseal-flush arrangements are described in vendor literature anddenoted by API flush plan designations.1,2 The most importantdesign features are:
• Casing drain line. This pipe is normally secured to thelowermost part of the pump casing and terminates in a block valve. The piping downstream from the valve generally leads to acommon drain header or other secure disposal location.
• API Plan 31. Elevated-pressure fluid is bypassed from oneof the pump stages ahead (upstream) of the last stage. The pres-sure of this bypass stream is then reduced by routing it through
a set of orifice plates before it is piped to a cyclone separator.Clean fluid is taken off the top of the cyclone separator and fed
into the seal housing. Dirty fluid is drawn off the bottom andfed back to pump suction.
Large pumps are often furnished with stand-alone lubricatingoil consoles. If dual seals are used, then there could also be a Plan54 unit in addition to Plan 31 flush piping.1,2 Even complex-looking stand-alone piping systems are straightforward if thereview starts at the source. The reviewer looks for a lube-oil reser-
voir and a feed pump followed by filters, heat exchangers, pressurecontrol valves and pressurized lubricant destinations. In essence,one traces each pipe and understands its purpose.
PWI installation layout and operation. To obtain equalpressures around the underground crude oil reservoir, PWI sys-tems have their own injection wells around the perimeter of thefield. The flow into these injection wells can be adjusted by welloperators to suit demand. Injection wells are then connected toan HP-ring main surrounding the field.
Except for temporary injection wells, there are two principalPWI layouts. One layout locates pairs of pumps in remote pump-ing stations roughly equidistant around the field. An example of
this is the Dukhan field in Qatar, which has 11 PWI pumpingstations with two pumps at each site feeding into a commonring main.
An alternative approach uses a central PWI pumping station,as shown in Fig. 4. The station in this illustration has more than20 barrel and horizontally split pumps feeding into a central ringmain. The top of the bearing lubrication console, plus the feedand return lines to the NDE bearing, are clearly visible in theforeground.
Mechanical-seal pressure ratings. Again, recall that thepump design is such that the seals are exposed to close to suctionpressures. While the majority of pumps operate with suction
pressures between 15 bar and 25 bar, there are instances where thestipulated suction pressure is quoted at 80 bar. Of course, bothpump user-operator and manufacturer must cooperate to establishthe actual operating conditions; 80 bar should be questioned.
The subject of seal-chamber rating vs. discharge-pressurerating for seals seems to cause confusion. Shell Oil Company’sengineering guidelines state that seals should be rated for the
A central PWI pumping station in Qatar.FIG. 4
An NRV installation in the discharge line of a horizontally-split pump.
FIG. 5 An NRV in the discharge line of a barrel-style pump.FIG. 6
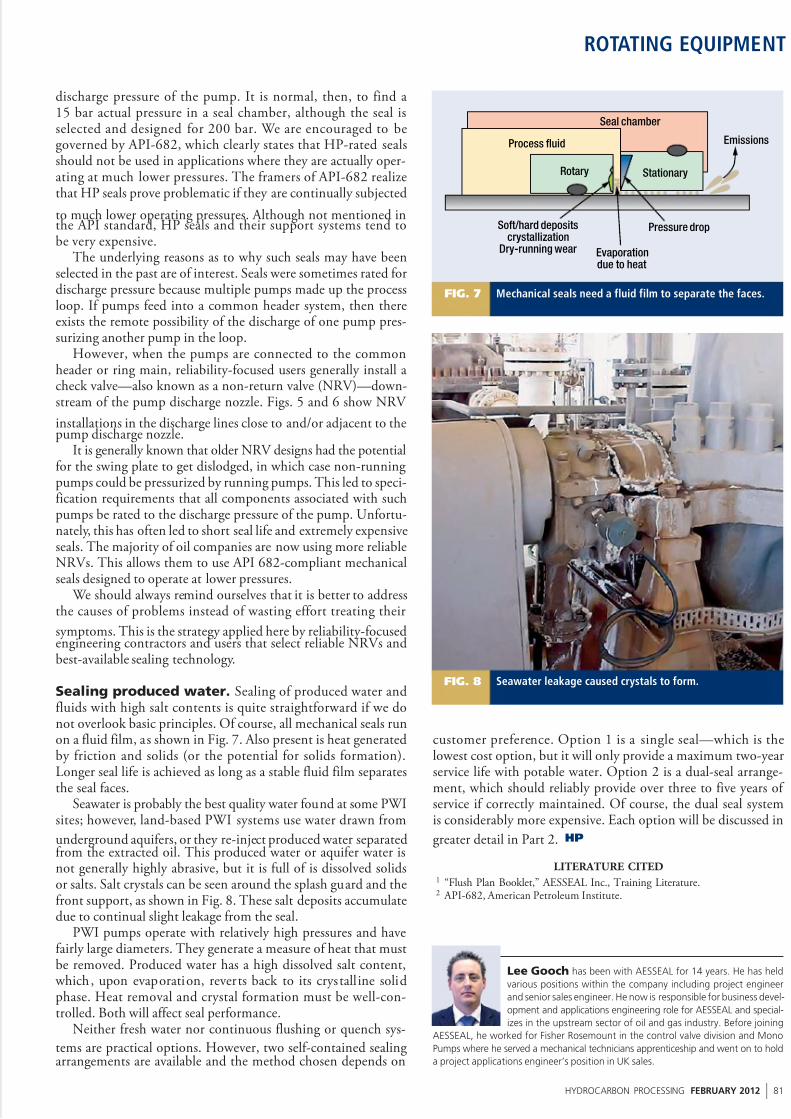
5/16/2018 Hydrocarbon Processing February 2012 - slidepdf.com
http://slidepdf.com/reader/full/hydrocarbon-processing-february-2012 82/93
ROTATING EQUIPMENT
HYDROCARBON PROCESSING FEBRUARY 2012 I
81
discharge pressure of the pump. It is normal, then, to find a15 bar actual pressure in a seal chamber, although the seal isselected and designed for 200 bar. We are encouraged to begoverned by API-682, which clearly states that HP-rated sealsshould not be used in applications where they are actually oper-ating at much lower pressures. The framers of API-682 realizethat HP seals prove problematic if they are continually subjected
to much lower operating pressures. Although not mentioned inthe API standard, HP seals and their support systems tend tobe very expensive.
The underlying reasons as to why such seals may have beenselected in the past are of interest. Seals were sometimes rated fordischarge pressure because multiple pumps made up the processloop. If pumps feed into a common header system, then thereexists the remote possibility of the discharge of one pump pres-surizing another pump in the loop.
However, when the pumps are connected to the commonheader or ring main, reliability-focused users generally install acheck valve—also known as a non-return valve (NRV)—down-stream of the pump discharge nozzle. Figs. 5 and 6 show NRV
installations in the discharge lines close to and/or adjacent to thepump discharge nozzle.
It is generally known that older NRV designs had the potentialfor the swing plate to get dislodged, in which case non-runningpumps could be pressurized by running pumps. This led to speci-fication requirements that all components associated with suchpumps be rated to the discharge pressure of the pump. Unfortu-nately, this has often led to short seal life and extremely expensiveseals. The majority of oil companies are now using more reliableNRVs. This allows them to use API 682-compliant mechanicalseals designed to operate at lower pressures.
We should always remind ourselves that it is better to addressthe causes of problems instead of wasting effort treating their
symptoms. This is the strategy applied here by reliability-focusedengineering contractors and users that select reliable NRVs andbest-available sealing technology.
Sealing produced water. Sealing of produced water andfluids with high salt contents is quite straightforward if we donot overlook basic principles. Of course, all mechanical seals runon a fluid film, as shown in Fig. 7. Also present is heat generatedby friction and solids (or the potential for solids formation).Longer seal life is achieved as long as a stable fluid film separatesthe seal faces.
Seawater is probably the best quality water found at some PWIsites; however, land-based PWI systems use water drawn from
underground aquifers, or they re-inject produced water separatedfrom the extracted oil. This produced water or aquifer water isnot generally highly abrasive, but it is full of is dissolved solidsor salts. Salt crystals can be seen around the splash guard and thefront support, as shown in Fig. 8. These salt deposits accumulatedue to continual slight leakage from the seal.
PWI pumps operate with relatively high pressures and havefairly large diameters. They generate a measure of heat that mustbe removed. Produced water has a high dissolved salt content, which, upon evaporation, reverts back to its crystalline solidphase. Heat removal and crystal formation must be well-con-trolled. Both will affect seal performance.
Neither fresh water nor continuous flushing or quench sys-
tems are practical options. However, two self-contained sealingarrangements are available and the method chosen depends on
customer preference. Option 1 is a single seal—which is thelowest cost option, but it will only provide a maximum two-yearservice life with potable water. Option 2 is a dual-seal arrange-ment, which should reliably provide over three to five years of service if correctly maintained. Of course, the dual seal systemis considerably more expensive. Each option will be discussed in
greater detail in Part 2. HP
LITERATURE CITED
1 “Flush Plan Booklet,” AESSEAL Inc., Training Literature.2 API-682, American Petroleum Institute.
Seal chamber
Process fluid
Stationary
Emissions
Rotary
Soft/hard depositscrystallization
Dry-running wear Evaporationdue to heat
Pressure drop
Mechanical seals need a fluid film to separate the faces.FIG. 7
Seawater leakage caused crystals to form.FIG. 8
Lee Gooch has been with AESSEAL for 14 years. He has held
various positions within the company including project engineer
and senior sales engineer. He now is responsible for business devel-
opment and applications engineering role for AESSEAL and special-
izes in the upstream sector of oil and gas industry. Before joining
AESSEAL, he worked for Fisher Rosemount in the control valve division and Mono
Pumps where he served a mechanical technicians apprenticeship and went on to hold
a project applications engineer’s position in UK sales.

5/16/2018 Hydrocarbon Processing February 2012 - slidepdf.com
http://slidepdf.com/reader/full/hydrocarbon-processing-february-2012 83/93
Don’t miss your industry’s most
important gathering of the year!
Manchester Grand Hyatt Hotel
San Diego, CaliforniaMarch 11 – 13, 2012
In 2012, we’re changing ourname from NPRA to AFPM,American Fuel & PetrochemicalManufacturers to better describewho we are and what we do.And you can still count on usto bring you the most compre-hensive conference program forthe refining and petrochemical
industries.
SERVING YOU
WITH PRIDETHE 2012 AFPM (NPRA)ANNUAL MEETING
This year’s program hassomething for everyonefrom process and operationsengineers to senior manage-
ment. Keynote sessionsfeature top governmentofficials and corporate CEOs.Breakouts cover nearly everyfacet of refining technology.And networking opportunitiesabound at our receptionsand affiliate-hostedevents. Help us celebrateour new beginning.
Register at www.afpm.org or
www.npra.org.
afpm.org
Select 97 at www.HydrocarbonProcessing.com/RS
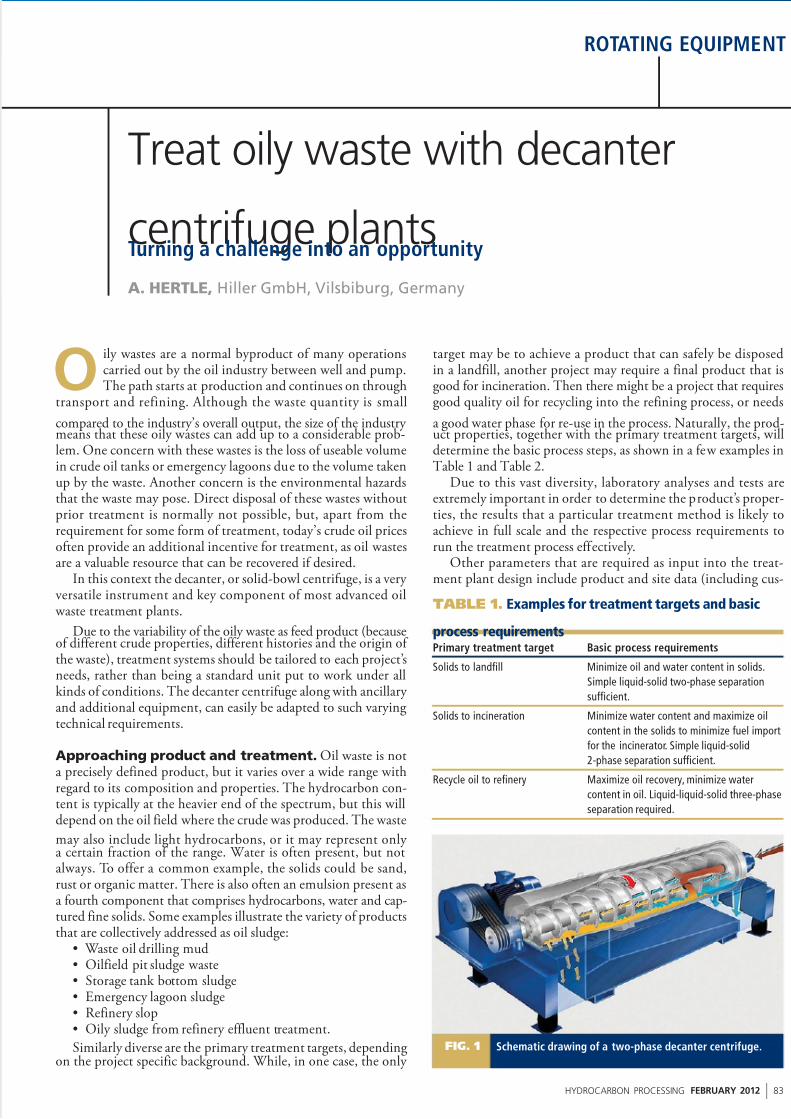
5/16/2018 Hydrocarbon Processing February 2012 - slidepdf.com
http://slidepdf.com/reader/full/hydrocarbon-processing-february-2012 84/93
ROTATING EQUIPMENT
HYDROCARBON PROCESSING FEBRUARY 2012 I
83
Oily wastes are a normal byproduct of many operationscarried out by the oil industry between well and pump.The path starts at production and continues on through
transport and refining. Although the waste quantity is small
compared to the industry’s overall output, the size of the industry means that these oily wastes can add up to a considerable prob-lem. One concern with these wastes is the loss of useable volumein crude oil tanks or emergency lagoons due to the volume takenup by the waste. Another concern is the environmental hazardsthat the waste may pose. Direct disposal of these wastes withoutprior treatment is normally not possible, but, apart from therequirement for some form of treatment, today’s crude oil pricesoften provide an additional incentive for treatment, as oil wastesare a valuable resource that can be recovered if desired.
In this context the decanter, or solid-bowl centrifuge, is a very versatile instrument and key component of most advanced oil waste treatment plants.
Due to the variability of the oily waste as feed product (becauseof different crude properties, different histories and the origin of the waste), treatment systems should be tailored to each project’sneeds, rather than being a standard unit put to work under allkinds of conditions. The decanter centrifuge along with ancillary and additional equipment, can easily be adapted to such varyingtechnical requirements.
Approaching product and treatment. Oil waste is nota precisely defined product, but it varies over a wide range withregard to its composition and properties. The hydrocarbon con-tent is typically at the heavier end of the spectrum, but this willdepend on the oil field where the crude was produced. The waste
may also include light hydrocarbons, or it may represent only a certain fraction of the range. Water is often present, but notalways. To offer a common example, the solids could be sand,rust or organic matter. There is also often an emulsion present asa fourth component that comprises hydrocarbons, water and cap-tured fine solids. Some examples illustrate the variety of productsthat are collectively addressed as oil sludge:
• Waste oil drilling mud• Oilfield pit sludge waste• Storage tank bottom sludge• Emergency lagoon sludge• Refinery slop• Oily sludge from refinery effluent treatment.
Similarly diverse are the primary treatment targets, dependingon the project specific background. While, in one case, the only
target may be to achieve a product that can safely be disposedin a landfill, another project may require a final product that isgood for incineration. Then there might be a project that requiresgood quality oil for recycling into the refining process, or needs
a good water phase for re-use in the process. Naturally, the prod-uct properties, together with the primary treatment targets, willdetermine the basic process steps, as shown in a few examples inTable 1 and Table 2.
Due to this vast diversity, laboratory analyses and tests areextremely important in order to determine the product’s proper-ties, the results that a particular treatment method is likely toachieve in full scale and the respective process requirements torun the treatment process effectively.
Other parameters that are required as input into the treat-ment plant design include product and site data (including cus-
Treat oily waste with decanter
centrifuge plantsTurning a challenge into an opportunity
A. HERTLE, Hiller GmbH, Vilsbiburg, Germany
TABLE 1. Examples for treatment targets and basic
process requirementsPrimary treatment target Basic process requirements
Solids to landfill Minimize oil and water content in solids.
Simple liquid-solid two-phase separation
sufficient.
Solids to incineration Minimize water content and maximize oil
content in the solids to minimize fuel import
for the incinerator. Simple liquid-solid
2-phase separation sufficient.
Recycle oil to refinery Maximize oil recovery, minimize water
content in oil. Liquid-liquid-solid three-phase
separation required.
Schematic drawing of a two-phase decanter centrifuge.FIG. 1

5/16/2018 Hydrocarbon Processing February 2012 - slidepdf.com
http://slidepdf.com/reader/full/hydrocarbon-processing-february-2012 85/93
ROTATING EQUIPMENT
84 I FEBRUARY 2012 HydrocarbonProcessing.com
tomer regulations) relevant for explosion protection, available heatsources and general installation requirements.
Operating principle of decanter centrifuges. Thesolid-bowl or decanter centrifuge is the machine of choicefor treatment of oil wastes. While other products often leave
the option to use belt-filter presses or plate-and-frame pressesinstead, those types of machines are not suitable for oil wastetreatment. Even at low oil contents, the sludge will stick to thefilter cloth and will eventually blind it. Similarly, three-phaseseparation, where the solids are separated from the liquid phaseand the liquid phase is split into oil and water, is impossible toachieve with presses.
Contrary to presses, which work on the principle of filtra-tion, decanter centrifuges are separating via the principle of sedi-mentation by making use of the different specific gravity of theoil sludge’s components. The decanter’s operating principle isanalogous to a continuously fed sedimentation tank with a bot-tom scraper. In such a tank, solids will settle on the bottom and
oil will float on top of the water under natural gravity, providedthe hydraulic retention time in the tank is long enough for the
separation to take place. This simple principle is also often usedin various places in the petroleum industry.
For fine solids and/or viscous hydrocarbons, the time requiredto achieve separation under natural gravity may be too long tobe economical, or the separation result may be less than desired.This is typically the case with oil sludges, and, therefore, sedi-mentation is enhanced in the decanter centrifuge by increasingthe driving force by three orders of magnitude, spinning the
product so fast that centrifugal accelerations of up to severalthousand times g (= gravitational acceleration; average = 9.81m/s2) are created.
Using the analogy of the sedimentation tank again, the tank may be rolled into a cylinder with the tank bottom becomingthe cylinder wall, and the water body and scraper being locatedinside the cylinder. This cylinder, called the cylindrical bowl, isrotated with several thousand rpm around its longitudinal axis tocreate the required centrifugal acceleration. Feed into this systemis continuous via a fixed pipe extending from the outside into thecenter of the cylinder. In this system, the solids will move radialy outward and settle on the inner surface of the cylinder’s wall. Water will form a layer sitting on top of this sediment layer, and
oil (if present) will form a third layer further inward (toward thecenter) on top of the water layer. The shape of the bottom scraper will be changed to that of a screw conveyor, also called the scroll, which will rotate with a slightly different speed to the cylinder inorder to convey the sediment toward the outlet.
To one end of the cylinder, a truncated cone (also called thebeach) is added in order to block this end for the liquids. It isover this beach that the solids are conveyed and discharged outof the bowl. The other end of the cylindrical bowl is closed with a head wall that has outlet openings with adjustable weirsfor discharge of the liquid. Further devices can be added to thedecanter centrifuge to separately extract a second liquid phaseif present. Fig. 1 shows a schematic drawing of a two-phase
decanter centrifuge.
Tailoring the decanter centrifuge to the task. In orderto be able to perform most efficiently and economically under siteconditions, tailoring the decanter centrifuge to the project specificrequirements is required. This includes:
• Materials of construction for wetted parts, taking intoaccount corrosion, abrasion, operating temperatures and operat-ing/maintenance regime
• Wear-protection level and system, taking into account abra-siveness of the product, the size and nature of the solid particlescontained in the product, the operating and maintenance regimeand available repair capabilities
• Liquid-phase extraction devices, in the case of three-phaseseparation, taking into account the variability of the content of
Explosion-proof (ATEX) two-phase decanter with hydraulicscroll drive.
FIG. 2
Explosion-proof (ATEX) three-phase decanter with electro-mechanical regenerative backdrive.
FIG. 3
TABLE 2. Product examples and associated basic considerations for process layout
Product Considerations for process layout
Oilfield pit sludge, lagoon sludge Very high content of coarse debris, sand, etc. Very in-homogenous. Pay special attention to mechanical pretreatment.
If treatment target requires three-phase separation, consider two centrifuge steps. Hydrocarbons may entail a very high
proportion of heavy hydrocarbons. Heating and splitting of emulsions essential for three-phase separation.
Refinery slop Typically rather low in solids and high in oil content. Composition may change quickly with regard to hydrocarbon, water,
and solids content, and hydrocarbon fractions present. Three-phase separation. Heating and splitting of emulsions essential.
Oily refinery sludge Oil content may be too low to justify recovery; simple two-phase separation without heating of the product is often sufficient.
Refinery explosion protection guidelines may require a higher degree of explosion protection than the product itself.

5/16/2018 Hydrocarbon Processing February 2012 - slidepdf.com
http://slidepdf.com/reader/full/hydrocarbon-processing-february-2012 86/93
ROTATING EQUIPMENT
HYDROCARBON PROCESSING FEBRUARY 2012 I
85
both liquid phases, quality requirements for the separated liquidphases and downstream plant/equipment
• Explosion protection measures, taking into account ambientconditions and product properties at operating conditions andnational and/or customer specific requirements
• Drive system for bowl and scroll, taking into account prod-uct and process requirements and site conditions.
While these choices will only marginally affect the capitalexpenditure for the decanter centrifuge compared to the cost of the entire treatment plant, their effect on the operability, avail-ability and efficiency of the decanter centrifuge as the core pieceof the plant can be considerable. Therefore, special care has tobe taken that these options in all their breadth are indeed avail-able and considered in depth, and eventually the right choice ismade and implemented. Two examples for decanter centrifugesare shown in Fig. 2 and Fig. 3 to demonstrate some of the dif-ferences in design.
Examples for oil waste treatment plants. The follow-ing two examples of oil waste treatment systems are discussed in
order to illustrate the aspects outlined above and thus provide thelink between theory and practice.
Example 1. A treatment system for lagoon sludge in Siberia was installed in several containers to be placed onsite outdoors(Fig. 4). The core piece is a three-phase decanter for separationof oil, water and solids in one device. The oil is fed back into therefinery’s crude stock, while the water phase receives further treat-ment in the refinery’s effluent treatment plant.
Due to the harsh climate and the limited choice of processchemicals (polymeric flocculant and demulsifier), special care hasbeen taken to provide sufficient flexibility and hydraulic retentiontime (external tanks, built by the customer) for the chemicals toreact properly, and to provide sufficient space inside the contain-
ers to serve as dry and heated storage, as well as a workplace formaintenance and repairs. The product is heated in several stepsusing indirect steam heating.
Explosion protection was designed in accordance with poten-tially explosive atmospheres (ATEX) Directive 94/9/EC. Explo-sion protection required that all high voltage electrical equip-ment be installed onsite in a separate container placed outsidethe hazardous area. The electrical container also included basiclaboratory facilities in order to allow the plant operators to assessthe properties of the feed and treated products and carry outadjustments as required.
Example 2. A skid-mounted treatment system for oilfield waste in China was placed indoors and connected to an extensive
mechanical pretreatment system delivered separately (Fig. 5).This plant had to be designed for a feed product with high
sand content, and for the production of high quality oil (sold toa refinery nearby) and water (reused internally as process water).Solid phase quality requirements were also rather strict, as they were to be fed into a soil treatment plant.
In view of these requirements, the separation process was splitinto two steps. The first step featured a two-phase decanter centri-fuge with the sole task of removing solids. The next step utilized athree-phase high speed disc stack separator to separate and cleanthe oil and water phases. Similar to the decanter centrifuge, adisc stack separator also uses differences in specific gravity forseparation. However, it provides even higher centrifugal accelera-
tion and a higher settling area, with the “1xg equivalent” being alamella settler.
As the treatment facility is situated in a remote location, nosteam was readily available and a thermal oil heating system wasused instead to provide heat to all parts of the plant. Similar toExample 1, explosion protection is based on ATEX, and all highvoltage equipment is installed outside the hazardous area, in thecentral electrical room of the facility.
Turning challenge into opportunity. The large quanti-ties of oily waste produced by the oil industry worldwide are asignificant economical burden. In order to treat this waste in themost economical way, a detailed study of the product and of theexternal factors surrounding the project is required. Advancedtreatment methods are centered around decanter centrifuges for
liquid-solid separation. These machines have proven to be themost reliable and flexible to separate these complex oil-water-solids mixtures under the harsh conditions typically met onsite.
Decanter centrifuges and the treatment plants in which they are operating should be designed to the specific requirements of each project in order to make the best use of the versatility of thedecanter and thus achieve optimal performance. By following thisgroundwork, a refiner can turn a challenge into an opportunity. HP
Containerized treatment system with three-phase decantergetting prepared for shipment.
FIG. 4
Skid-mounted treatment system with two-phase decanterplus three-phase separator before shipment to China.
FIG. 5
Arnim Hertle is the manager of sales for Hiller GmbH in Vils-
biburg, Germany. He is a chemical engineer with a special focus
on treatment processes for liquid wastes and slurries. In his 20 plus
year career, he has worked for a broad spectrum of companies,
including those involved in applied sciences, consulting, engineer-
ing and equipment supply.

5/16/2018 Hydrocarbon Processing February 2012 - slidepdf.com
http://slidepdf.com/reader/full/hydrocarbon-processing-february-2012 87/93
86 I FEBRUARY 2012 HydrocarbonProcessing.com
HPI MARKETPLACE
SURPLUS GAS PROCESSING/REFINING EQUIPMENT25 MMCFD x 1100 PSIG PROPAK REFRIGERATION PLANT
28 TPD SELECTOX SULFUR RECOVERY UNIT
1100 BPD LPG CONTACTOR x 7.5 GPM CAUSTIC REGENNGL/LPG PLANTS: 10–600 MMCFD
AMINE PLANTS: 60–3300 GPMSULFUR PLANTS: 10–180 TPD
FRACTIONATION: 1000–25,000 BPDHELIUM RECOVERY: 75 & 80 MMCFD
NITROGEN REJECTION: 25–100 MMCFDMANY OTHER REFINING/GAS PROCESSING UNITSWe offer engineered surplus equipment solutions.
Bexar Energy Holdings, Inc.Phone 210-342-7106 Fax 210-223-0018
www.bexarenergy.com Email: [email protected]
Select 202 at www.HydrocarbonProcessing.com/RS
WABASH SELLS & RENTS
BOILERS & DIESEL GENERATORS
FAST EMERGENCY SERVICE
www.wabashpower.com
800-704-2002
FAX: 847-541-1279
847-541-5600
Select 203 at www.HydrocarbonProcessing.com/RS
Select 201 at www.HydrocarbonProcessing.com/RS
CUSTOM REPRINTS
For additional information, please contact
Foster Printing Service, the official reprint
provider for ydrocarbon Processing.
Call 866-879-9144
Take advantage of your editorial exposure.
New Version! Now includes Plate FinExchangers. For the designer or operatorin the petroleum and chemical industry.
Using over 40 years of design andoperating experience by the author, theprogram calculates units that enable theinexperienced technical user to determineaccurate design or evaluate operations.
For the design and evaluation of processequipment:
Air, water, steam and amine properties;
and/or vents;
(MEA/DEA/MDEA/DGA);
and rating;
calculations);
Price: $3,295
programs written in Basic and three
reservoir engineering programs are linked
menus. However, each program is self-contained and can be used independently.
for their usefulness in day-to-day operationsthat fall into six main categories:
comprehensive user manual.
Author: M.A. MianPrice: $250
SOFTWARE VIDEO BOOKS
*Applicable tax, shipping and handling apply
Visit our website to see all thatGul Publishing Company ofers
www.GulfPub.com
Phone: +1 713-520-4426
Email: [email protected]
PROCESS TOOLS
Simulations and Design
Calculations for the Petro-
chemical Processing Industry
PEPAC 1
Reservoir Engineering Programs
and Economic EvaluationSpreadsheets

5/16/2018 Hydrocarbon Processing February 2012 - slidepdf.com
http://slidepdf.com/reader/full/hydrocarbon-processing-february-2012 88/93
HYDROCARBON PROCESSING FEBRUARY 2012 I 87
HPI MARKETPLACE
HFP Acoust ical ConsultantsHouston TX Calgary AB
(888) 789-9400 (888) 259-3600(713) 789-9400 (403) 259-6600
E-mail: [email protected]
Internet: www.hfpacoustical.com
NOISECONTROL ENGINEERING
Select 205 at www.HydrocarbonProcessing.com/RS
Call 713-520-4449
for details about
Hydrocarbon Processing’s
Recruitment Advertising
Program Use a combination of print,recruitment e-newsletter,plus Website to reach our
total audience circulation of
more than 100,000!Select 208 at www.HydrocarbonProcessing.com/RS
Engineering Services
Call us about your Turbomachinery questions and problems. We
would be more than happy to you help with:
A. Turbomachinery training courses
B. Troubleshooting of Turbomachinery mechanical problems & root
cause failure analysis.
C. Rotordynamic analysis.D. Overhaul assistance Inspection and test witness services.
E. Commissioning & startup.
F. Compressor & turbine performance analysis.
G. Compressor and turbine gas path design.
H. Compressor and turbine efficiency enhancements and rerates.I. Sleeve seal leakage problems
J. Temporary technical employees
1-724-527-3911
®
Flexware® Turbomachinery Engineers
HTRI X changer Suite® – an integrated, easy-to-use suite of tools that
delivers accurate design calculations for
• shell-and-tube heat exchangers • fired heaters
• jacketed-pipe heat exchangers • air coolers
• hairpin heat exchangers • economizers
• plate-and-frame heat exchangers • tube layouts
• spiral plate heat exchangers • vibration analysis
Interfaces with many process simulator and physical property
packages either directly or via CAPE-OPEN.
C A P E - O P E N C o m p l i a n t !
Heat Transfer Research, Inc. [email protected]
150 Venture Drive www.HTRI.net
College Station, Texas 77845, USA
Select 206 at www.HydrocarbonProcessing.com/RS
Select 204 at www.HydrocarbonProcessing.com/RS
Select 207 at www.HydrocarbonProcessing.com/RS

5/16/2018 Hydrocarbon Processing February 2012 - slidepdf.com
http://slidepdf.com/reader/full/hydrocarbon-processing-february-2012 89/93
88 I FEBRUARY 2012 HydrocarbonProcessing.com
HPI MARKETPLACE
Industry Gears Up for 2012 International Refining and Petrochemical Conference
Leading hydrocarbon processing industry (HPI)
executives and technical experts will come together in
Milan, Italy, June 12–14 to share ideas and knowledge
relating to the refining and petrochemical industries at
Hydrocarbon Processing’s third annual International
Refining and Petrochemical Conference (IRPC).
Returning to Italy—the 2010 event was held in
Rome —IRPC will emphasize the latest technological
and operational advances rom both a local and
global perspective.
“We will ocus this year on unconventional eedstocks, as
well as a wide variety o subjects o practical importance
to refiners in markets around the world,” President and
CEO o Gul Publishing Company, John Royall, said.
With changes in crude supply around the world, refiners
and technology companies will be able to present the
latest developments and technologies. Presentation
topics or IRPC 2012 include, but are not limited to: energy
policy, middle distillate developments, renewable/
biouels, plant saety, gas treatment technologies and
ef uence management.
eni, the Italian-based, multinational integrated
energy company, will be the 2012 event host
sponsor. The company was also the sponsor
o the inaugural IRPC two years ago.
“eni is a recognized leader in a number o downstream
technologies, including heavy oil conversion and biouels,
so we are very happy to have eni as the host o the 2012
conerence. They will present and lead the development
o the technical program, so we know that we will havemarket-leading content in the IRPC,” Royall, said.
For more information on the conference, contact
Stephany Romanow, Editor, Hydrocarbon Processing
at +1 (713) 520-4484 or [email protected]
For sponsorship opportunities, contact Bill Wageneck,
Vice President and Publisher, Hydrocarbon Processing
at +1 (713) 520-4421 or [email protected]
Bill Wageneck, PublisherPhone: +1 (713) 529-4301Fax: +1 (713) 520-4433E-mail: [email protected]
SALES OFFICES—NORTH AMERICA
IL, LA, MO, OK, TXJosh MayerPhone: +1 (972) 816-6745, Fax: +1 (972) 767-4442E-mail: [email protected]
AK, AL, AR, AZ, CA, CO, FL, GA, HI, IA, ID,IN, KS, KY, MI, MN, MS, MT, ND, NE, NM,NV, OR, SD, TN, TX, UT, WA, WI, WY,WESTERN CANADA
Laura KanePhone: +1 (713) 520-4449, Fax: +1 (713) 520-4459Mobile: +1 (713) 412-2389E-mail: [email protected]
CT, DC, DE, MA, MD, ME, NC, NH, NJ, NY,OH, PA, RI, SC, VA, VT, WV,EASTERN CANADA
Merrie LynchPhone: +1 (617) 357-8190, Fax: +1 (617) 357-8194Mobile: +1 (617) 594-4943
E-mail: [email protected]
CLASSIFIED SALES
Gerry MayerPhone: +1 (972) 816-3534, Fax: +1 (972) 767-4442E-mail: [email protected]
DATA PRODUCTS
Lee NicholsPhone: +1 (713) 525-4626, Fax: +1 (713) 520-4433E-mail: [email protected]
SALES OFFICES—EUROPE
FRANCE, GREECE, NORTH AFRICA, MIDDLEEAST, SPAIN, PORTUGAL, SOUTHERNBELGIUM, LUXEMBOURG, SWITZERLAND,GERMANY, AUSTRIA, TURKEY
Catherine WatkinsTél.: +33 (0)1 30 47 92 51Fax: +33 (0)1 30 47 92 40E-mail: [email protected]
ITALY, EASTERN EUROPEFabio Potestá
Mediapoint & Communications SRLPhone: +39 (010) 570-4948Fax: +39 (010) 553-0088E-mail: [email protected]
RUSSIA/FSULilia FedotovaAnik International & Co. Ltd.Phone: +7 (495) 628-10-333E-mail: [email protected]
UNITED KINGDOM/SCANDINAVIA,NORTHERN BELGIUM, THE NETHERLANDS
Michael BrownPhone: +44 161 440 0854Mobile: +44 79866 34646E-mail: [email protected]
SALES OFFICES—OTHER AREAS
AUSTRALIA—PerthBrian ArnoldPhone: +61 (8) 9332-9839Fax: +61 (8) 9313-6442E-mail: [email protected]
CHINA—Hong KongIris YuenPhone: +86 13802701367, (China)Phone: +852 69185500, (Hong Kong)E-mail: [email protected]
BRAZIL—São PauloAlfred BilykPhone/Fax: 11 23 37 42 40Mobile: 11 85 86 52 59E-mail: [email protected]
INDIAManav KanwarPhone: +91-22-2837 7070/71/72Fax: +91-22-2822 2803Mobile: +91-98673 67374E-mail: [email protected]
INDONESIA, MALAYSIA, SINGAPORE,THAILANDPeggy ThayPublicitas Singapore Pte LtdPhone: +65 6836-2272Fax: +65 6634-5231E-mail: [email protected]
JAPAN—TokyoYoshinori IkedaPacific Business Inc.Phone: +81 (3) 3661-6138Fax: +81 (3) 3661-6139E-mail: [email protected]
KOREAD. S. ChaiDongmyung Communications, Inc.Phone: +82 (2) 391 4254Fax: +82 (2) 391 4255E-mail: [email protected]
PAKISTAN—KarachiS. E. AhmedIntermedia CommunicationsPhone: +92 (21) 663-4795Fax: +92 (21) 663-4795
REPRINTS
Rhona Brown, Foster Printing ServicePhone: +1 (866) 879-9144 ext. 194E-mail: [email protected]

5/16/2018 Hydrocarbon Processing February 2012 - slidepdf.com
http://slidepdf.com/reader/full/hydrocarbon-processing-february-2012 90/93
HYDROCARBON PROCESSING FEBRUARY 2012 I 89
AFPM (NPRA) . . . . . . . . . . . . . . . 82 (97)
www.info.hotims.com/41425-97
Amistco . . . . . . . . . . . . . . . . . . . 74 (60)
www.info.hotims.com/41425-60
Axens . . . . . . . . . . . . . . . . . . . . . 92 (53)
www.info.hotims.com/41425-53
Baker Hughes Inc . . . . . . . . . . . . 37 (56)
www.info.hotims.com/41425-56
Baldor Electric Company . . . . . . . 68 (62)
www.info.hotims.com/41425-62
BASF Ag . . . . . . . . . . . . . . . . . . . 27 (100)
www.info.hotims.com/41425-100
BASF Corporation . . . . . . . . . . . . 18 (96)
www.info.hotims.com/41425-96
BIC Alliance . . . . . . . . . . . . . . . . . 36 (157)
www.info.hotims.com/41425-157
Cameron . . . . . . . . . . . . . . . . . . . . 2 (55)
www.info.hotims.com/41425-55
Cansolv . . . . . . . . . . . . . . . . . . . . 64 (99)
www.info.hotims.com/41425-99
CB&I . . . . . . . . . . . . . . . . . . . . . . 40 (58)
www.info.hotims.com/41425-58
Chemstations Inc. . . . . . . . . . . . . 14 (152)
www.info.hotims.com/41425-152
CIPPE . . . . . . . . . . . . . . . . . . . . . 48
Colfax Americas . . . . . . . . . . . . . 12 (86)
www.info.hotims.com/41425-86
Eidos Sap SRL . . . . . . . . . . . . . . . 59 (162)
www.info.hotims.com/41425-162
Elliott Group . . . . . . . . . . . . . . . . 22 (52)
www.info.hotims.com/41425-52
Flexitallic LP . . . . . . . . . . . . . . . . . 5 (93)
www.info.hotims.com/41425-93
Foster Wheeler . . . . . . . . . . . . . . 43 (88)
www.info.hotims.com/41425-88
FourQuest Energy . . . . . . . . . . . . 26 (154)
www.info.hotims.com/41425-154
Gastech Conference & Exhibition . 78
Greene, Tweed & Co. . . . . . . . . . . 28 (82)
www.info.hotims.com/41425-82
Gulf Publishing Company
Construction Boxscore . . . . . . . . 38
Events—IRPC . . . . . . . . . . . . . . 88
Events—IRPC . . . . . . . . . . . . . . 91
HPI Market Data 2012. . . . . . . . 38
HPI Marketplace . . . . . . . . . 86–87
Workforce Survey . . . . . . . . . . . 56
Haldor Topsoe A/S . . . . . . . . . . . . 39 (69)
www.info.hotims.com/41425-69
Inpro/Seal Company . . . . . . . . . . . 4 (151)
www.info.hotims.com/41425-151
Johnson Screens . . . . . . . . . . . . . 15 (91)
www.info.hotims.com/41425-91
Kobelco/Kobe Steel Ltd. . . . . . . . 50 (68)
www.info.hotims.com/41425-68
Koch-Glitsch . . . . . . . . . . . . . . . . 21 (153)
www.info.hotims.com/41425-153
Linde Process Plants, Inc. . . . . . . . 35 (85)
www.info.hotims.com/41425-85
Merichem Company . . . . . . . . . . 49 (84)
www.info.hotims.com/41425-84
Mustang, A Wood Group . . . . . . . 73 (90)
www.info.hotims.com/41425-90
Paratherm Corporation . . . . . . . . 34 (156)
www.info.hotims.com/41425-156
Sabin Metals Corporation . . . . . . 33 (81)
www.info.hotims.com/41425-81
Saint-Gobain NorPro . . . . . . . . . . . 8 (64)
www.info.hotims.com/41425-64
Samson GmbH . . . . . . . . . . . . . . 77 (163)
www.info.hotims.com/41425-163
Selas Fluid Subsidiaryof The Linde Group . . . . . . . . . . 16 (73)
www.info.hotims.com/41425-73
Siemens AG . . . . . . . . . . . . . . . . . 25 (101)
www.info.hotims.com/41425-101
Sulzer Chemtech, USA Inc. . . . . . . 31 (74)www.info.hotims.com/41425-74
Team Industrial Services . . . . . . . 60 (95)
www.info.hotims.com/41425-95
ThyssenKrupp Uhde . . . . . . . . . . . 6 (102)
www.info.hotims.com/41425-102
Trachte USA . . . . . . . . . . . . . . . . 55 (160)
www.info.hotims.com/41425-160
Worley Parsons . . . . . . . . . . . . . . 30 (155)
www.info.hotims.com/41425-155
FREE Product and Service Information—FEBRUARY 2012
For information about subscribing to HYDROCARBON PROCESSING, please visit www.HydrocarbonProcessing.com
HOW TO USE THE INDEX: The FIRST NUMBER after the company name is the page on which anadvertisement appears. The SECOND NUMBER, appearing in parentheses, after the companyname, is the READER SERVICE NUMBER. There are several ways readers can obtain information:
1. The quickest way to request information from an advertiser or about an editorial item is to go towww.HydrocarbonProcessing.com/RS. If you follow the instructions on the screen your requestwill be forwarded for immediate action.
2. Go online to the advertiser's Website listed below.
3. Circle the Reader Service Number below and fax this page to +1 (416) 620-9790. Include your name, company, completeaddress, phone number, fax number and e-mail address, and check the box on the right for your division of industry and
job title.
Name _________________________________________ _______________ Company ______________________________________________ __________
Address _______________________________________________ _______ City/State/Zip __________________________________________ __________
Country _______________________________________________ _______ Phone No. _____________________________________________ __________
FAX No. ________________________________________ ______________ e-mail ________________________________________ ___________________
This Advertisers’ Index and procedure for securing additional information is provided as a service to Hydrocarbon
Processing advertisers and a convenience to our readers. Gulf Publishing Company is not responsible for omissions or errors.
This information must be pro-vided to process your request:
PRIMARY DIVISION OF INDUSTRY(check one only):A -Refining CompanyB -Petrochemical Co.C -Gas Processing Co.F -Equipment ManufacturerG -Supply CompanyH -Service Company
J -Chemical Co.P -Engrg./Construction Co.
JOB FUNCTION(check one only):B -Company Official, ManagerE -Engineer or ConsultantF -Supt. or Asst.G -Foreman or Asst.I -ChemistJ -Purchasing Agt.
ADVERTISERS in this issue of HYDROCARBON PROCESSINGCompany Page RS#
Website
Company Page RS#
Website
Company Page RS#
Website

5/16/2018 Hydrocarbon Processing February 2012 - slidepdf.com
http://slidepdf.com/reader/full/hydrocarbon-processing-february-2012 91/93
Y. ZAK FRIEDMAN, CONTRIBUTING EDITOR
HPIN CONTROL
90 I FEBRUARY 2012 HydrocarbonProcessing.com
How difficult is it to control absorber columns?
The absorber-stripper configuration is common for gas plants.If we are to apply advanced process control (APC) systems on a gasplant, it better to address the control problem—maximizing recov-ery of propane or propylene (C3) while minimizing C2 at propanecontamination limits. Absorber/strippers work like the rectifyingand stripping sections of any distillation column, but the presenceof lean-oil makes it more complex. The absorber preferentially absorbs and returns C3 to the stripper, whereas the stripper prefer-entially evaporates C2 in the absorber. However, it is impossible to
absorb C3 without some C2, and likewise, it is impossible to boil C2 without evaporating some C3. That creates a large recycle of C2 andC3 between the two columns. Separation gets better with increasedrecycle as long as the columns do not flood.
System conditions. The feed comes in usually from the over-head accumulator. The liquid part of the feed, i.e., naphtha, servesas the lean oil in the absorber. Vapor from the accumulator iscompressed and sent to the feed drum. Absorber-rich oil is alsosent to the feed drum, thus recycling the absorbed C3 and C2. Thestripper overhead vapor is partially condensed in the feed drum,thus recycling uncondensed lights back to the absorber. Now, thefeed drum contains a mixture of three very different streams. The
feed-drum vapor flows to the absorber, and the liquid feeds thestripper. Often following the main absorber, there is a small spongeabsorber to trap the small flow of heavier liquefied petroleum gascomponents in the main absorber overhead.
What’s a good way to control such a configuration?Usually the stripper has a vapor flow measurement system, or wecan calculate vapor flow from the heat balance. Knowledge of thevapor flow helps maintain the stripper loading below the flood-ing constraint. The manipulated variable for controlling stripperload is the lean-oil flow, i.e., how much of the overhead naphtha isdirected to the absorber vs. the stripper feed drum.
But managing the lean-oil and stripper loading is not enough.
We must also set the reboiler correctly to remove all but a traceof C2, and such a control strategy would rely on an inferentialmodel or analyzer. Typically, a temperature indicator on Tray 5or so exists, and would provide a rough inference of bottom C 2 penetration. However, the heavy naphtha components distort thistemperature reading. Naphtha itself does not boil at column condi-tions. But being a diluent, it increases the boiling temperatures forthe lighter components.
Careful selection of inferential inputs can improve the infer-ence, even if that is a regression inference.1 In this case (absorber/stripper combination,) it is not a good way to handle the inferenceproblem without a knowledge-based model.1 We should resort tofirst principles inferential modeling; the problem set up is:
• Define four stripper bottom components: Light key com-ponent: C2, heavy key component: C3, intermediate heavy com-
ponent: C4, mostly not volatile at column conditions and naphthadiluent: C5
+; not volatile at all column conditions• Apply four principles to solve the four unknowns: 1.
Bottom mass balance, 2. Bottom equilibrium, 3. Section separa-
tion performance: ratio of component on Tray 5 to the bottomconcentration and 4. Tray 5 equilibrium.
The stripper-bottom stream is further separated downstreaminto propane, butane and naphtha, whereas the C2 specifica-tion is on the propane. The control variable becomes not simply the bottom C2 but the ratio of bottom C2/C3. The ability toinfer stripper C2 penetration from the four-component model isshown in Fig. 1 and it is a four-month trend of the inference of C2 in propane vs. lab measurements. This figure shows several C2 breakthroughs, which could have been avoided. The agreementbetween the model and lab is not poor, but not essential. Whatis essential is that the inference is can identify C2 breakthroughand pass this information to the controller. From Fig. 1, it can be
translated into a substantial increase of FCC propylene recovery,in the order of 0.5% yield. HP
LITERATURE CITED1 Friedman, Y. Z., “Inferential model input selection,” Hydrocarbon Processing,
February 2011, p. 94.
The author is a principal consultant in advanced process control and online
optimization with Petrocontrol. He specializes in the use of first-principles models
for inferential process control and has developed a number of distillation and reactor
models. Dr. Friedman’s experience spans over 30 years in the hydrocarbon industry,
working with Exxon Research and Engineering, KBC Advanced Technology and, since
1992 with Petrocontrol. He holds a BS degree from the Israel Institute of Technology(Technion) and a PhD from Purdue University.
0.0
0.5
1.0
1.5
2.0
2.5
Four months of data
C 2
i n C
3 %
C2 in propane−lab
C2 in propane model
Percent C2 in C3 stream.FIG. 1

5/16/2018 Hydrocarbon Processing February 2012 - slidepdf.com
http://slidepdf.com/reader/full/hydrocarbon-processing-february-2012 92/93
2012 IRPC Advisory Board:
Andrea AmorosoVice President,
Process Technologyeni
John BaricLicensing Technology ManagerShell Global Solutions
International B.V.
Eric BenazziMarketing Director Axens
Carlos CabreraExecutive Co-ChairmanIvanhoe Energy
Dr. Charles CameronHead o Research & TechnologyBP
Antonio Di PasqualeVice President,
Refning Product LineTechnip
Giacomo Fossataro Technical and Operation ManagerWalter Tosto S.p.A.
Dr. Madhukar Onkarnath GargFNAE DirectorIndian Institute o Petroleum
in Dehradun
Rajkumar GhoshExecutive Director
Indian Oil
Andrea GragnaniRefning Product Line DirectorTechnip
Dr. Syamal PoddarPresidentPoddar & Associates
Giacomo RispoliSenior Vice President,
Research & Development
IRPC Advisory Board Chaireni–Refning & Marketing Division
Stephany Romanow
EditorHydrocarbon Processing
Michael StockleChie Engineer,Refning TechnologyFoster Wheeler
Submit: Abstracts deadline has been extended to
February 10, 2012. E-mail [email protected]
For more information on the conference: Stephany
Romanow, Editor, Hydrocarbon Processing at+1 (713) 520-4484 or [email protected]
Exhibit or sponsor: Bill Wageneck, Vice President
and Publisher, Hydrocarbon Processing at
+1 (713) 520-4421 or [email protected]
Register: www.HPIRPC.com
BE A PART OF SOMETHING GRANDE!You are invited to submit an abstract for Hydrocarbon Processing’s third annual International Refining and Petrochemical
Conference (IRPC) that will be held 12–14 June 2012 in Milan, Italy. IRPC is a leading-edge technical conference, providing an
elite forum within which industry leaders can share knowledge and ideas relating to the international refining and petrochemical
industries. This year’s theme is Unconventional Feedstocks and Heavy Oil Conversions. For a look at more topics to be covered
at IRPC 2012, please visit www.HPIRPC.com. Here’s how you can participate:
MILAN, ITALY | 12–14 JUNE

5/16/2018 Hydrocarbon Processing February 2012 - slidepdf.com
http://slidepdf.com/reader/full/hydrocarbon-processing-february-2012 93/93
The winning catalyst combinationfor your hydrocracker
www.axens.net


![Hydrocarbon Processing Refining Processes 2000[2]](https://img.dokumen.tips/doc/110x75/577cb99d1a28aba7118d7d9a/hydrocarbon-processing-refining-processes-20002.jpg)


