Embed Size (px)
Citation preview

Hydrocarbon management
Refinery Measurement Database Committee HMC-2A membership guide

HYDROCARBON MANAGEMENT
REFINERY MEASUREMENT DATABASE COMMITTEE
HMC-2A MEMBERSHIP GUIDE
1st edition
September 2014
Published byENERGY INSTITUTE, LONDON
The Energy Institute is a professional membership body incorporated by Royal Charter 2003Registered charity number 1097899

The Energy Institute (EI) is the chartered professional membership body for the energy industry, supporting over 16 000 individuals working in or studying energy and 250 energy companies worldwide. The EI provides learning and networking opportunities to support professional development, as well as professional recognition and technical and scientific knowledge resources on energy in all its forms and applications.
The EI’s purpose is to develop and disseminate knowledge, skills and good practice towards a safe, secure and sustainable energy system. In fulfilling this mission, the EI addresses the depth and breadth of the energy sector, from fuels and fuels distribution to health and safety, sustainability and the environment. It also informs policy by providing a platform for debate and scientifically-sound information on energy issues.
The EI is licensed by: − the Engineering Council to award Chartered, Incorporated and Engineering Technician status; − the Science Council to award Chartered Scientist status, and − the Society for the Environment to award Chartered Environmentalist status.
It also offers its own Chartered Energy Engineer, Chartered Petroleum Engineer and Chartered Energy Manager titles.
A registered charity, the EI serves society with independence, professionalism and a wealth of expertise in all energy matters.
This publication has been produced as a result of work carried out within the Technical Team of the EI, funded by the EI’s Technical Partners. The EI’s Technical Work Programme provides industry with cost-effective, value-adding knowledge on key current and future issues affecting those operating in the energy sector, both in the UK and internationally.
For further information, please visit http://www.energyinst.org
The EI gratefully acknowledges the financial contributions towards the scientific and technical programmefrom the following companies
BG Group Premier OilBP Exploration Operating Co Ltd RWE npowerBP Oil UK Ltd Saudi AramcoCentrica Scottish PowerChevron SGSConocoPhillips Ltd Shell UK Oil Products LimitedDana Petroleum Shell U.K. Exploration and Production LtdDONG Energy SSEEDF Energy StatkraftENI StatoilE. ON UK Talisman Sinopec Energy UK LtdExxonMobil International Ltd Total E&P UK LimitedInternational Power Total UK LimitedKuwait Petroleum International Ltd TullowMaersk Oil North Sea UK Limited ValeroMurco Petroleum Ltd VattenfallNexen VitolPhillips 66 World Fuel Services
However, it should be noted that the above organisations have not all been directly involved in the development of this publication, nor do they necessarily endorse its content.
Copyright © 2014 by the Energy Institute, London.The Energy Institute is a professional membership body incorporated by Royal Charter 2003.Registered charity number 1097899, EnglandAll rights reserved
No part of this book may be reproduced by any means, or transmitted or translated into a machine language without the written permission of the publisher.
Published by the Energy Institute
The information contained in this publication is provided for general information purposes only. Whilst the Energy Institute and the contributors have applied reasonable care in developing this publication, no representations or warranties, express or implied, are made by the Energy Institute or any of the contributors concerning the applicability, suitability, accuracy or completeness of the information contained herein and the Energy Institute and the contributors accept no responsibility whatsoever for the use of this information. Neither the Energy Institute nor any of the contributors shall be liable in any way for any liability, loss, cost or damage incurred as a result of the receipt or use of the information contained herein.

HYDROCARBON MANAGEMENT REFINERY MEASUREMENT DATABASE COMMITTEE HMC-2A MEMBERSHIP GUIDE
3
CONTENTSPage
1 Introduction . . . . . . . . . . . . . . . . . . . . . . . . . . . . . . . . . . . . . . . . . . . . . . . . . . . . . . . . . . . 4
2 Committee membership. . . . . . . . . . . . . . . . . . . . . . . . . . . . . . . . . . . . . . . . . . . . . . . . . . 5
3 The independent consultant . . . . . . . . . . . . . . . . . . . . . . . . . . . . . . . . . . . . . . . . . . . . . . 6
4 Confidentiality . . . . . . . . . . . . . . . . . . . . . . . . . . . . . . . . . . . . . . . . . . . . . . . . . . . . . . . . . 7
5 Fees . . . . . . . . . . . . . . . . . . . . . . . . . . . . . . . . . . . . . . . . . . . . . . . . . . . . . . . . . . . . . . . . . . 8
6 Meetings . . . . . . . . . . . . . . . . . . . . . . . . . . . . . . . . . . . . . . . . . . . . . . . . . . . . . . . . . . . . . . 9
7 Refinery data . . . . . . . . . . . . . . . . . . . . . . . . . . . . . . . . . . . . . . . . . . . . . . . . . . . . . . . . . 10 7.1 Introduction . . . . . . . . . . . . . . . . . . . . . . . . . . . . . . . . . . . . . . . . . . . . . . . . . . . . . . 10 7.2 Data submission . . . . . . . . . . . . . . . . . . . . . . . . . . . . . . . . . . . . . . . . . . . . . . . . . . . 10 7.3 Data format. . . . . . . . . . . . . . . . . . . . . . . . . . . . . . . . . . . . . . . . . . . . . . . . . . . . . . . 10 7.4 Units . . . . . . . . . . . . . . . . . . . . . . . . . . . . . . . . . . . . . . . . . . . . . . . . . . . . . . . . . . . . 10 7.5 Incomplete data . . . . . . . . . . . . . . . . . . . . . . . . . . . . . . . . . . . . . . . . . . . . . . . . . . . 10
8 Committee issues and reports . . . . . . . . . . . . . . . . . . . . . . . . . . . . . . . . . . . . . . . . . . . . 11 8.1 Technical issues . . . . . . . . . . . . . . . . . . . . . . . . . . . . . . . . . . . . . . . . . . . . . . . . . . . . 11 8.2 Sample report content. . . . . . . . . . . . . . . . . . . . . . . . . . . . . . . . . . . . . . . . . . . . . . . 11
9 Conclusion. . . . . . . . . . . . . . . . . . . . . . . . . . . . . . . . . . . . . . . . . . . . . . . . . . . . . . . . . . . . 19
Annexes
Annex A Committee terms of reference . . . . . . . . . . . . . . . . . . . . . . . . . . . . . . . . . . . . . . 20
Annex B Data submission guide. . . . . . . . . . . . . . . . . . . . . . . . . . . . . . . . . . . . . . . . . . . . . 23

HYDROCARBON MANAGEMENT REFINERY MEASUREMENT DATABASE COMMITTEE HMC-2A MEMBERSHIP GUIDE
4
1 INTRODUCTION
HMC-2A, the Refinery Measurement Database Committee of the Energy Institute (EI) was established in 1985 as the PML-5 Refinery Loss Control Committee and began data collection and analysis to an agreed format in 1989. The committee is made up of refinery operators from the main HMC-2 Refinery and Downstream Measurement Committee.
The main committee develops and maintains metering and proving standards and addresses issues relating to static and dynamic measurement, facilities balances, product quality control/management, emissions and the environment. A key publication is EI HM 32 Guide to product hydrocarbon management at marketing terminals. This document provides advice on operations and procedures for the control of both apparent loss (i.e. that caused by measurement errors and incorrect or inadequate accounting procedures) and physical loss at petroleum storage installations, including airports, where product is received, stored and despatched by pipeline, sea, road or rail systems.
The general aim of the database committee is to improve refinery loss control through better understanding and through production of benchmark loss figures. The committee encourages adoption of improved and harmonised measurement standards and procedures and maintains EI HM 31 Guide to product hydrocarbon management in petroleum refinery operations, which is accepted by most major oil companies as the industry standard for refinery oil accounting and loss control.
The committee acts as a forum to share best practices and review new equipment relevant to loss control. Members are also kept informed of new developments in relevant international standards.
Each committee Member submits measurement data annually (and generally in accordance with HM 31) on a confidential basis. This data is analysed to provide a confidential report to individual Members which shows their losses in various categories compared with those for other refineries in the database. Individual Members are not able to identify refineries in the report other than their own. The analysis is confidential to Members but, with Members’ approval, data is extracted from this report for publication.
With its focus on accounting, measurement and loss, the HMC-2A report compliments other industry data gathering and comparison initiatives which consider performance and efficiency, usually through comparison of volumetric gain. The separation of accounted and unaccounted losses offers further insight into measurement and loss control operations and can indicate opportunities for improvement.
Historically, assembly of some of the mass based emissions data required additional effort at the refineries but this data is now collected for environmental monitoring reports for government authorities and is readily available.
The Committee operates in accordance with competition law and under written Terms of Reference (Annex A). The database is maintained and reports are prepared by an independent Consultant.
Access to pooled data and information derived from a number of refineries adds to the knowledge and can improve the operation of individual loss control groups, providing benchmarks for key losses (measurement differences).
This document describes how the committee operates and is produced as a guide to existing and potential new Members. In addition to the operation of the committee, data submission requirements and report contents are discussed in detail together with the confidentiality arrangements under which the data is handled.

HYDROCARBON MANAGEMENT REFINERY MEASUREMENT DATABASE COMMITTEE HMC-2A MEMBERSHIP GUIDE
5
2 COMMITTEE MEMBERSHIP
Membership of the committee is open to all companies who have refinery loss data to contribute. However, membership applications are considered by the committee, who vote to approve new Members.
Each Member company nominates one representative who will receive the reports and meeting minutes and who will have voting rights at committee meetings. However the meeting forum is flexible and Members are welcome to send additional representative(s) to participate in discussions, etc.
Where Member companies have a number of refineries, representatives are expected to use best efforts to collect data from their associates. Where Member companies have more than one refinery submitting data they will receive a report for each refinery and representatives from each refinery will be entitled to attend meetings. However, the Member company will have only a single vote in committee ballots.
A Chair is elected every three years from amongst the Members.The Consultant who carries out the analysis and maintains the database also attends
meetings. However, the Consultant is not a Member and does not have voting rights.

HYDROCARBON MANAGEMENT REFINERY MEASUREMENT DATABASE COMMITTEE HMC-2A MEMBERSHIP GUIDE
6
3 THE INDEPENDENT CONSULTANT
The Consultant is appointed by the committee, working through the Chair. There is no 'term of office' as the Consultant is engaged annually on a commercial basis. It is in the interests of the panel to maintain continuity and there have been only two consultants used since the committee was established.
All data resides with the Consultant and is not retained at the EI.

HYDROCARBON MANAGEMENT REFINERY MEASUREMENT DATABASE COMMITTEE HMC-2A MEMBERSHIP GUIDE
7
4 CONFIDENTIALITY
Committee Members and the Consultant work under strict confidentiality agreements such that no information relating to individual companies can be passed to other companies, whether or not they are Members, and no anonymous information derived from the database is passed outside Member companies other than in the form of articles for publication which are approved by the panel.
HYDROCARBON MANAGEMENT REFINERY MEASUREMENT DATABASE COMMITTEE HMC-2A MEMBERSHIP GUIDE
8
5 FEES
Fees are payable annually by each Member company directly to the Consultant. Invoices are normally issued as the annual reports are distributed.
Fees are calculated each year in advance on the basis of day rates and expenses for attendance at meetings. These are negotiated and agreed with the committee and are fixed in advance of each years’ work.
Each Member is charged the same basic fee for each refinery. As an indication of costs the basic fee for 2013 was GBP £1 045 (approx USD $1 600).
Individual Members are free to request additional reports or studies from the Consultant for which they will negotiate their own additional fees.
HYDROCARBON MANAGEMENT REFINERY MEASUREMENT DATABASE COMMITTEE HMC-2A MEMBERSHIP GUIDE
9
6 MEETINGS
The main meeting is usually held in June when a presentation of the analysis of previous years’ data is made. Annual reports covering the previous years’ data are issued in advance of this meeting.
If required, a second meeting is held in November to discuss any interim work, changes to the data required or the format of the next years’ report.
The meetings provide an excellent forum for discussion of loss control topics, bringing together specialists from a number of the major oil companies.
Meetings are normally run immediately before or after meetings of the main HMC-2 Refinery and Distribution Measurement Committee as most Members sit on both committees.
Meetings are hosted by the EI in London. However, it is the intention of the committee to hold meetings in the various Member countries whenever possible.
It is not mandatory for Members to attend meetings.

HYDROCARBON MANAGEMENT REFINERY MEASUREMENT DATABASE COMMITTEE HMC-2A MEMBERSHIP GUIDE
10
7 REFINERY DATA
7.1 INTRODUCTION
The objective of the committee is to obtain as much data as possible for analysis as this will add to the value of the resulting reports. While it is preferable for data to be submitted in accordance with the data submission sheet (Annex B), the input system can be flexible. The intention being that in most cases Members will be able to submit data direct from existing in-house files without the need for significant manipulation.
The quality of the information produced depends heavily on the consistency of the data going in. Members are therefore asked to ensure that data submitted complies strictly with the descriptions in Annex B and definitions in HM 31.
The Consultant should be contacted directly if any questions arise.
7.2 DATA SUBMISSION
The data is stored and analysed on an annual basis. Data for each year up to December 31 must reach the Consultant by February 1 of the following year. The submission date must be met otherwise data may be excluded from the database. The Consultant should be contacted directly if there are any problems with data submission.
Membership is conditional on submission of data. Members who do not submit data for a given year will not receive a report and will not be admitted to meetings in the year concerned. No fee will be charged. Membership can be resumed provided data is submitted in the following year.
Data may be submitted by e-mail on an attached file.
7.3 DATA FORMAT
Data should preferably be submitted in spreadsheet form (Excel, or equivalent).
7.4 UNITS
The database is run on a mass basis; tonnes.
7.5 INCOMPLETE DATA
If all the requested data is not available, or perhaps not collected for a particular refinery, it may be possible to use estimated figures based on industry averages for missing values. Assistance can be provided in such cases.

HYDROCARBON MANAGEMENT REFINERY MEASUREMENT DATABASE COMMITTEE HMC-2A MEMBERSHIP GUIDE
11
8 COMMITTEE ISSUES AND REPORTS
8.1 TECHNICAL ISSUES
Potential sources of mass balance error based on Members’ experience include but are not limited to the following, which have all been addressed and are discussed regularly:
− The impact of density errors on month-end stock accounting and the timing of the testing and update of densities in inventory systems.
− Problems associated with obtaining representative density data from layered tank contents.
− The effect of water and sediment content variations on crude oil density data. − Free water tank dip measurement errors due to emulsion in slop tanks. − The handling of shipments in progress over month-end. − Inventory issues due to tanks being shown in incorrect product service, inventory
in tanks not being reported and inventory being reported in tanks that are out of service.
− Deliveries or receipts being over or understated. − Internal fuel consumption being over or understated. − Problems with accounting satisfactorily for coke inventory.
Other technical areas that have been or are being looked at by the Committee are: − Issues relating to slop volatile organic compounds (VOCs), and accounting for
received ship’s ballast. − Procedures for monitoring for custody transfer meter drift and re-proving frequencies. − The relationship of refinery loss to Solomon Complexity. − The use of changes in flare gas analysis data to identify the likely source of increased
flaring. − New developments in closed and restricted sampling equipment. − Experience with pipeline leak detection systems. − Experience with data reconciliation systems.
8.2 TYPICAL REPORT CONTENT
Report content has developed over the years and is modified from time to time in order to include investigation of issues which become of particular interest to Members. However, reports will generally include analysis as shown in the following example for six refineries, nominally for 2011. The refinery receiving the report is Refinery X.
Overall losses
The 2011 database comprises data from six member refineries.The average refinery loss represents 0,44 % of processed inputs (Figure 1). There
is a wide variation between refineries (0,32 % to 0,67 %). Average loss was equivalent to 0,44 % of processed inputs. Refinery X matched the average in 2011.

HYDROCARBON MANAGEMENT REFINERY MEASUREMENT DATABASE COMMITTEE HMC-2A MEMBERSHIP GUIDE
12
2011 Loss as % of Processed Inputs
0.32
0.37
0.44
0.54
0.67
0.43 0.44
0.00
0.10
0.20
0.30
0.40
0.50
0.60
0.70
0.80
Z Y X W V U AVG
Refinery
% L
oss
Figure 1: 2011 loss as % of processed inputs
Comparison with previous years
Figure 2 shows the data reported by Refinery X in comparison with the calculated overall average loss. Whilst performances in 2000 and 2003 was noticeably worse than the average, the performance in recent years has generally been better than average (with the exception of 2010). Historical Losses for Refinery X
compared against the Overall Average
0.68
0.44
0.54
0.72
0.29
0.40
0.51
0.40
0.340.37
0.52
0.440.47
0.43
0.56
0.49
0.41
0.45
0.50
0.46
0.530.50
0.45 0.44
0.00
0.10
0.20
0.30
0.40
0.50
0.60
0.70
0.80
2000 2001 2002 2003 2004 2005 2006 2007 2008 2009 2010 2011
Year
Loss
% o
f Pro
cess
ed In
puts
Refinery X Overall Average
Figure 2: Historical losses for Refinery X compared against the overall average
When compared with the overall average for the other member refineries excluding the data from Refinery X, Figure 3 shows that the overall performance of Refinery X has been better than the average of other Members.
0.500.51
HYDROCARBON MANAGEMENT REFINERY MEASUREMENT DATABASE COMMITTEE HMC-2A MEMBERSHIP GUIDE
13
EI HMC-2A 2011 Refinery Loss Survey Historical trend data for Refinery X
0.40
0.51
0.40
0.340.37
0.52
0.440.46
0.50
0.47
0.56
0.52
0.43 0.44
0.00
0.10
0.20
0.30
0.40
0.50
0.60
2004 2005 2006 2007 2008 2009 2010 2011 2012
Year
Loss
as
% o
f Pro
cess
ed In
puts
Refinery X Overall Average excluding Refinery X
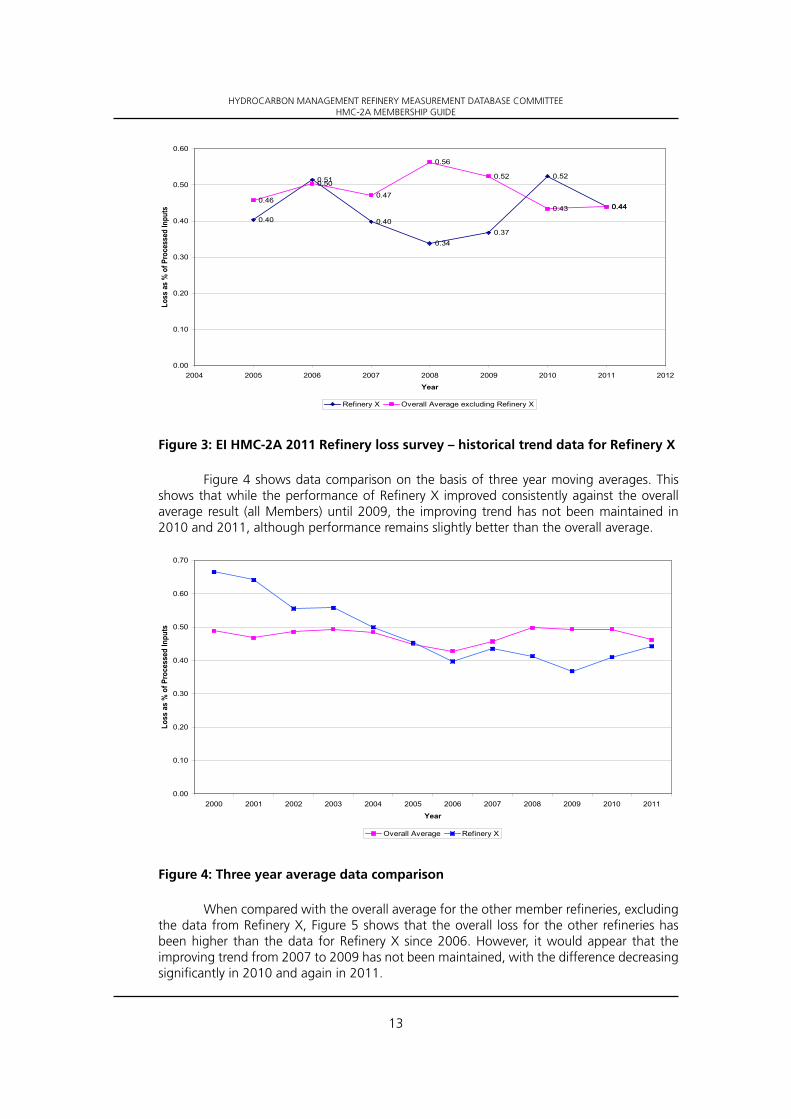
Figure 3: EI HMC-2A 2011 Refinery loss survey – historical trend data for Refinery X
Figure 4 shows data comparison on the basis of three year moving averages. This shows that while the performance of Refinery X improved consistently against the overall average result (all Members) until 2009, the improving trend has not been maintained in 2010 and 2011, although performance remains slightly better than the overall average.
Three Year Average Data Comparison
0.00
0.10
0.20
0.30
0.40
0.50
0.60
0.70
2000 2001 2002 2003 2004 2005 2006 2007 2008 2009 2010 2011
Year
Loss
as
% o
f Pro
cess
ed In
puts
Overall Average Refinery X
Figure 4: Three year average data comparison
When compared with the overall average for the other member refineries, excluding the data from Refinery X, Figure 5 shows that the overall loss for the other refineries has been higher than the data for Refinery X since 2006. However, it would appear that the improving trend from 2007 to 2009 has not been maintained, with the difference decreasing significantly in 2010 and again in 2011.

HYDROCARBON MANAGEMENT REFINERY MEASUREMENT DATABASE COMMITTEE HMC-2A MEMBERSHIP GUIDE
14
Three Year Average Loss Data
0.45
0.40
0.440.41
0.37
0.41
0.440.42
0.45
0.50
0.54 0.550.52
0.48
0.00
0.10
0.20
0.30
0.40
0.50
0.60
2004 2005 2006 2007 2008 2009 2010 2011 2012
for 3 years ending
Loss
as
% o
f Pro
cess
ed In
puts
Refinery X Overall Average excluding Refinery X
Figure 5: Three year average loss data
Accounted losses
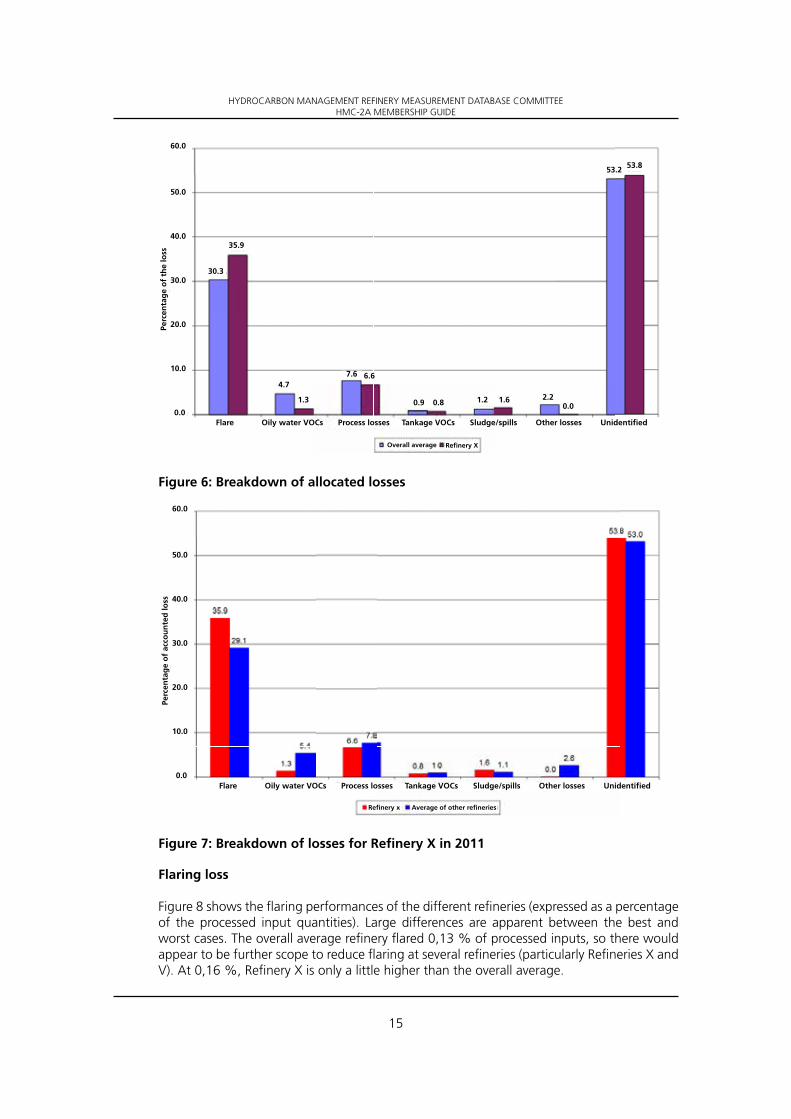
The data show that Refinery X was able to account for a total of 46,2 % of its recorded loss for 2011 whereas the overall average for all six refineries was 46,8 %. This compares with an accounted loss of 47,0 % of the recorded loss for the average excluding Refinery X.
Generally, flaring represents the major accounted loss in almost every refinery, usually followed by either process fugitives or drainage VOCs as the next largest source. Refinery X matches this pattern. The comparison against the average of all the refineries is shown in Figure 6 while the comparison against the average of the other five refineries is shown in Figure 7.
HYDROCARBON MANAGEMENT REFINERY MEASUREMENT DATABASE COMMITTEE HMC-2A MEMBERSHIP GUIDE
15
Figure 6: Breakdown of allocated losses
Figure 7: Breakdown of losses for Refinery X in 2011
Flaring loss
Figure 8 shows the flaring performances of the different refineries (expressed as a percentage of the processed input quantities). Large differences are apparent between the best and worst cases. The overall average refinery flared 0,13 % of processed inputs, so there would appear to be further scope to reduce flaring at several refineries (particularly Refineries X and V). At 0,16 %, Refinery X is only a little higher than the overall average.
60.0
50.0
40.0
30.0
20.0
10.0
0.0
30.3
35.9
4.7
1.3
7.6 6.6
0.9 0.8 1.2 1.6 2.20.0
53.2 53.8Pe
rcen
tag
e o
f th
e lo
ss
Flare Oily water VOCs Process losses Tankage VOCs Sludge/spills Other losses Unidentified
Overall average Refinery X
Flare Oily water VOCs Process losses Tankage VOCs Sludge/spills Other losses Unidentified
Refinery x Average of other refineries
60.0
50.0
40.0
30.0
20.0
10.0
0.0
Perc
enta
ge
of
acco
un
ted
loss

HYDROCARBON MANAGEMENT REFINERY MEASUREMENT DATABASE COMMITTEE HMC-2A MEMBERSHIP GUIDE
16
Figure 8: 2011 Refinery loss control survey – flare data
Figure 9 shows the historical flare losses as a percentage of processed inputs for Refinery X and the overall average of all the refineries. There have been some significant variations in flaring at some member refineries, with the result that the average flare percentage apparently increased significantly from 2006 to 2007, but has then decreased again in recent years. In contrast, flaring at Refinery X had been fairly consistent at around 0,35 % of processed inputs (± 0,03 %) but was significantly reduced during 2009 (to 0,26 %). Whilst this reduction was not maintained in 2010, the reported flare losses have decreased further in 2011, and at 0,16 % Refinery X is now finally close to the overall average (that has also been reducing since 2007).
Figure 9: Historical flare data comparison
Z Y X W V U AVG
Refinery
0.00
0.05
0.10
0.15
0.20
0.25
0.30
Flar
e %
of
pro
cess
esse
d in
pu
ts
0.02
0.18
0.16
0.19
0.25
0.120.13
Processed inputsFlare %
2005 2006 2007 2008 2009 2010 2011
Year
Overall average Refinery X
0.15
0.35
0.15
0.34
0.36
0.38
0.230.22 0.22
0.26
0.29
0.19
0.16
0.13
Flar
e as
% o
f p
roce
sses
sed
inp
uts
0.00
0.05
0.10
0.15
0.20
0.25
0.30
0.35
0.40

HYDROCARBON MANAGEMENT REFINERY MEASUREMENT DATABASE COMMITTEE HMC-2A MEMBERSHIP GUIDE
17
When the data are compared with the average of the member refineries but excluding Refinery X (Figure 10), the same conclusion is apparent. From 2005 to 2008, flaring at Refinery X was consistently higher than at the other current member refineries, but that improved performance was achieved in both 2009 and 2011, so that the flare loss has been very substantially decreased and the flare performance of Refinery X is now comparable with the average of the other member refineries.
Figure 10: Historical flare loss comparisons
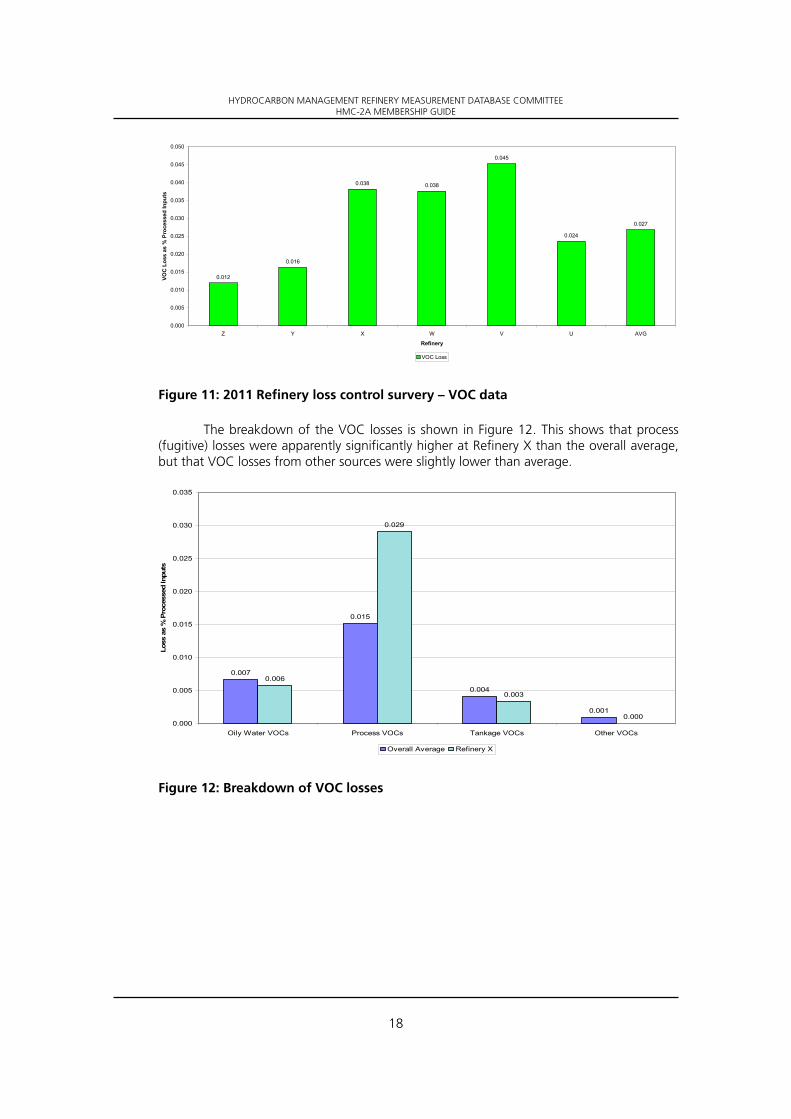
Loss of VOCs
Figure 11 shows some large differences in the VOC losses reported by the different refineries (expressed as a percentage of the processed input quantities) with almost a four-fold difference between the best and worst cases.
The overall average refinery VOC loss was 0,027 % of processed inputs, while Refinery X reported VOC losses of 0,038 %. Whilst this was not the highest VOC loss reported, several other Members were apparently able to control their VOC losses better than this; so there would appear to be scope for Refinery X to reduce VOC losses.
0.00
0.05
0.10
0.15
0.20
0.25
0.30
0.35
0.40
2005 2007 2008 2009 2010 2011
Year
201220062004
Refinery X Average excluding Refinery X
Loss
es %
of
pro
cess
esse
d in
pu
ts
HYDROCARBON MANAGEMENT REFINERY MEASUREMENT DATABASE COMMITTEE HMC-2A MEMBERSHIP GUIDE
18
2011 REFINERY LOSS CONTROL SURVEY - VOC DATA
0.012
0.016
0.038 0.038
0.045
0.024
0.027
0.000
0.005
0.010
0.015
0.020
0.025
0.030
0.035
0.040
0.045
0.050
Z Y X W V U AVG
Refinery
VOC
Los
s as
% P
roce
ssed
Inpu
ts
VOC Loss
Figure 11: 2011 Refinery loss control survery – VOC data
The breakdown of the VOC losses is shown in Figure 12. This shows that process (fugitive) losses were apparently significantly higher at Refinery X than the overall average, but that VOC losses from other sources were slightly lower than average.
Breakdown of VOC losses
0.007
0.015
0.004
0.001
0.006
0.029
0.003
0.0000.000
0.005
0.010
0.015
0.020
0.025
0.030
0.035
Oily Water VOCs Process VOCs Tankage VOCs Other VOCs
Loss
as
% P
roce
ssed
Inpu
ts
Overall Average Refinery X
Figure 12: Breakdown of VOC losses
HYDROCARBON MANAGEMENT REFINERY MEASUREMENT DATABASE COMMITTEE HMC-2A MEMBERSHIP GUIDE
19
9 CONCLUSION
It is hoped that readers will find the above description of HMC-2A committee activities and typical report content of interest and relevant to their own refinery accounting and loss control operations. For further details and membership enquiries please contact:
Technical DepartmentHydrocarbon ManagementEnergy Institute61 New Cavendish StreetLondonW1G 7ARUKw: http://www.energyinst.org

HYDROCARBON MANAGEMENT REFINERY MEASUREMENT DATABASE COMMITTEE HMC-2A MEMBERSHIP GUIDE
20
ANNEX ACOMMITTEE TERMS OF REFERENCE
The Refinery Measurement Database Committee HMC-2A terms of referenceThe Committee is constituted under the auspices of the EI and reports to the
Hydrocarbon Management Committee (HMC).
Objectives
The Committee’s objectives are:1. To develop and maintain a database of refinery measurement data for statistical analysis.2. To improve industry’s understanding of the extent and causes of refinery losses, both real
and apparent.3. To encourage the adoption of improved measurement standards and procedures through
dissemination and publication of results.4. Through its sister committee, HMC-2, to identify work items (document development or
practical projects) aimed at improving refinery hydrocarbon management.
Membership
The Committee is open to all oil companies who are willing to submit data for analysis and who agree to abide by the confidentiality agreement. Oil refinery personnel are required to submit the loss accounting data for their refinery (ies) annually, using the agreed EI HMC-2A format to permit meaningful comparative analysis.
Members’ representatives should preferably be refinery based with day-to-day responsibility for hydrocarbon loss control.
To broaden the scope of discussion and to add value to the work of the committee, invitees may be asked to attend and participate at meetings.
Data submission and confidentiality
Data from each Member will be submitted on a confidential basis to an independent Consultant (the consultant) for analysis.
Members and the Consultant are to abide by the respective confidentiality clauses below:
Members agreement
The maintenance of confidentiality shall be a condition of membership. The following statement is to be printed on the cover of all minutes and reports:
This Report is CONFIDENTIAL to the Members of the Energy Institute HMC-2(A) Refinery Measurement Database Committee. On receipt of this report it is agreed that the information it contains will be shared only within the company submitting the data and affiliated companies. Member companies shall not circulate information obtained as a result of committee membership outside of said Member companies if it is not in the public domain and/or was obtained only as a direct result of committee membership.

HYDROCARBON MANAGEMENT REFINERY MEASUREMENT DATABASE COMMITTEE HMC-2A MEMBERSHIP GUIDE
21
Consultants agreement
The following statement shall be signed by the Consultant and held by the Chief Executive of the EI:
I hereby affirm that I shall maintain the CONFIDENTIALITY of all individual company data submitted for analysis.
I shall not pass information submitted by individual Member companies to other companies except in the form of cumulative reports which will be composed in a manner approved by the Membership and submitted to Member companies only.
I shall not pass on any information which is not in the public domain and which has come to my attention in my capacity as Consultant without the prior consent of the Committee. In no case will I release specific information about a company without written permission of that company’s HMC-2A Committee representative.
I shall not include in any report or otherwise disclose any individual company data which I could reasonably expect would enable the submitting company to be identified.
Work and publication of results
Publication of general information and extracts from reports will be encouraged, but will require the unanimous agreement of the Committee Members.
Meetings
The Committee will normally meet in the spring of each year to review the analysis of the previous year’s data. A second meeting may be held in the autumn. Meetings will be linked appropriately with meetings of HMC-2; the Refinery and Distribution Measurement Committee.
Meetings will be attended by Members’ representatives (one per refinery) who may be accompanied by a colleague. Attendance of additional observers will be at the discretion of the Chair.
The EI may participate at Committee meetings as observers, normally through the attendance of the Technical Manager, Standards who will receive meeting minutes and general reports on progress. Any EI representatives attending meetings will be subject to the same confidentiality requirements as the Members.
Representatives of prospective new Members may be invited to attend one meeting as guests at the discretion of the Chair, but shall not attend sessions where the confidential loss performance data from other refineries is presented or discussed without the prior consent of the refinery Members concerned.
Committee officers
Chair and Vice Chair
The Chair and Vice Chair will be selected every three years by the Committee (majority vote), before the Autumn meeting in accordance with the procedure detailed in Appendix 1. The new officers will take up their positions immediately following the Autumn meeting.

HYDROCARBON MANAGEMENT REFINERY MEASUREMENT DATABASE COMMITTEE HMC-2A MEMBERSHIP GUIDE
22
Consultant
The independent Consultant will be selected by Committee Members. Fees will be agreed by the Committee annually and divided equally between Members. Each Member will be responsible for settling the Consultant’s invoice for their portion of the fee.
Secretary
The duties of Secretary will be undertaken by a representative from EI staff.
Voting
Each Member shall have one vote on matters considered by the Committee. The vote will be exercised by the Member’s nominated representative.
Amendments to these Terms of Reference will require the approval of at least two thirds of the Committee Members.
The quorum for meetings will be a minimum of 50 % of Committee Members. Consensus will be sought for decisions but where a vote is called the outcome will be based on a simple majority of those in attendance.
Changes to the Terms of Reference, election of committee officers and all documents for publication will be subject to email ballot to allow all Members to participate.
Appendix 1
Selection Procedure for Chair and/or Vice Chair1. All candidates for either of the two positions must submit their names to the Secretary
approximately six weeks before the Spring meeting. There will be no nomination or seconding process. Representatives from ALL Member companies are eligible to stand.
2. The Secretary will then send out candidates’ names to Members’ representatives, again by email. Approximately one month will be allowed for voting with the closing date set approximately two weeks before the Autumn meeting. This will allow time for a second round of voting if necessary.
3. Each Member company will have one vote for Chair and one vote for Vice Chair.4. Where there is only one candidate for a post, Members will be asked to approve or
object.5. In the event of a tie and where there are three or more candidates there will be a second
vote between the two tied candidates.6. In the event of a tie between only two candidates and where both candidates continue
to wish to stand the outgoing Chair will have a casting vote.7. The result will be advised by email and announced at the start of the Spring meeting8. Votes will be confidential but will be retained by the Secretary for inspection by another
independent party in case of any dispute.

HYDROCARBON MANAGEMENT REFINERY MEASUREMENT DATABASE COMMITTEE HMC-2A MEMBERSHIP GUIDE
23
ANNEX BDATA SUBMISSION GUIDE
HMC-2A Refinery Database Committee Data submission requirements
Data to be submitted
Calculated within spreadsheet
From previous year
Optional
Example of average refinery
Refinery ID code = Z units 2010 Data 2011 Data
Solomon complexity factor 9,2 9,0
EDC(i) [Equivalent distillation capacity (installed)]
mbbl/day 1 921 1 928
Inputs
Input – dry crude tonnes 7 855 233 7 575 053
Input – process feedstocks tonnes 1 097 860 920 750
Input – blending stocks tonnes 319 073 339 728
Input – additives tonnes 2 257 2 187
Input – hydrogen tonnes 237 2 595
Input – imported slops tonnes 20 444 2 127
Imported fuel oil tonnes 8 000 8 682
Imported fuel gas tonnes 16 935 25 896
Other imported gas tonnes 7 813 13 844
Sub-total, receipts tonnes 9 327 852 8 890 862
Feedstock inventory
Opening stocks as at 1 January tonnes 400 000 395 191
Closing stocks as at 31 December tonnes 395 191 341 884
Inventory change (opening – closing) tonnes 4 809 53 307
Total processed inputs tonnes 9 332 661 8 944 169
Imported finished products tonnes 273 865 364 229
Total inputs tonnes 9 606 526 9 308 398

HYDROCARBON MANAGEMENT REFINERY MEASUREMENT DATABASE COMMITTEE HMC-2A MEMBERSHIP GUIDE
24
Refinery ID code = Z units 2010 Data 2011 Data
Outputs and fuel
Output – despatches (including export of imported finished products)
tonnes 8 759 971 8 500 430
Output – feed to chemicals tonnes 177 749 174 182
Output – other/zero value (please state) tonnes 6 019 3 472
Sub-total, outputs tonnes 8 943 739 8 678 084
Fuel – fuel oil tonnes 171 868 157 796
Fuel – fuel gas (net of inerts) tonnes 312 108 298 315
Fuel – FCC coke tonnes 112 237 106 051
Fuel – sour gas tonnes 610 684
Fuel – other tonnes 25 198 31 554
Sub-total, fuel tonnes 622 021 594 400
Fuel used for exported power tonnes 50 071 45 898
Fuel used in refinery tonnes 571 950 548 502
Product inventory
Opening stocks as at 1 January tonnes 390 000 385 937
Closing stocks as at 31 December tonnes 385 937 380 223
Inventory change (closing – opening) tonnes -4 063 -5 714
Total output + fuel + inventory change tonnes 9 561 697 9 266 770
Loss (TSI+FIC) - (PD+PIC+F) tonnes 44 829 4 1628
Processed input tonnes tonnes 9 332 661 8 944 169
Loss as % processed input tonnes 0,48 0,47
Total site input tonnes tonnes 9 606 526 9 308 398
Loss as % total site input tonnes 0,47 0,45
Losses
Flare – for economic reasons tonnes 1 364 1 205
Flare – for environmental reasons tonnes 408 139
Flare – for all other reasons tonnes 17 184 16 778
Flare – purge gas used tonnes 970 759
Flare – pilot gas used tonnes 298 335
Sub-total flare tonnes 20 224 19 216
HYDROCARBON MANAGEMENT REFINERY MEASUREMENT DATABASE COMMITTEE HMC-2A MEMBERSHIP GUIDE
25
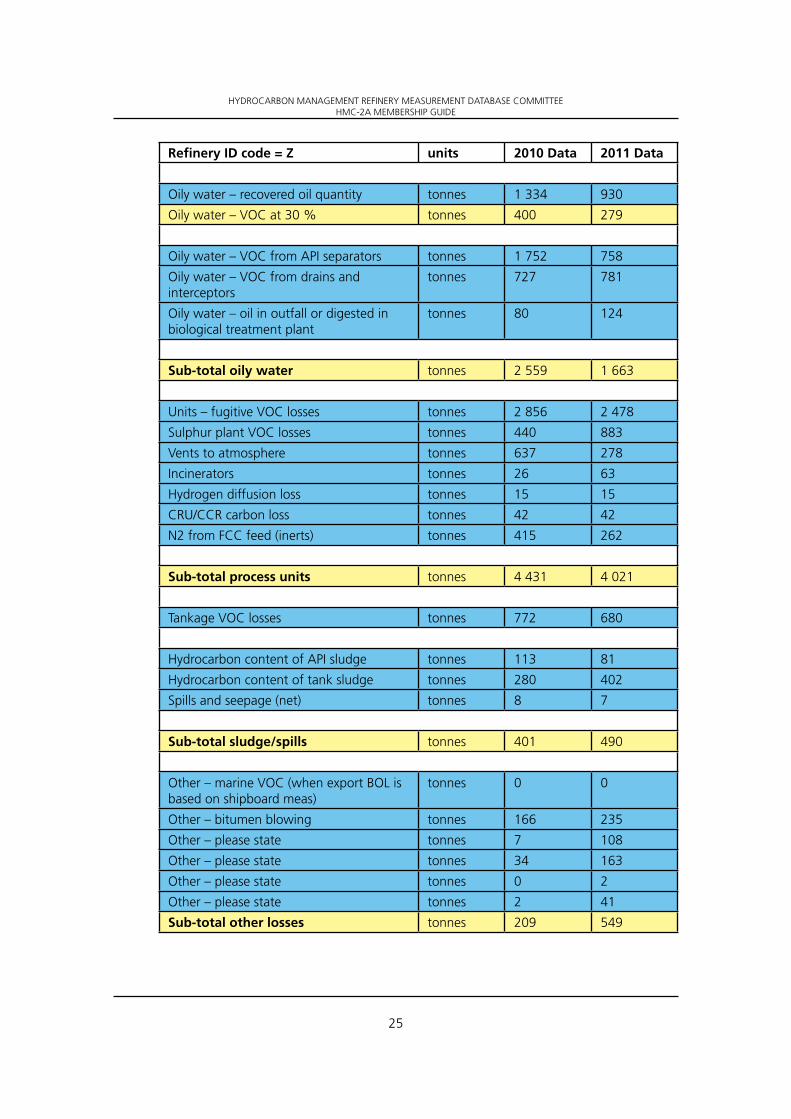
Refinery ID code = Z units 2010 Data 2011 Data
Oily water – recovered oil quantity tonnes 1 334 930
Oily water – VOC at 30 % tonnes 400 279
Oily water – VOC from API separators tonnes 1 752 758
Oily water – VOC from drains and interceptors
tonnes 727 781
Oily water – oil in outfall or digested in biological treatment plant
tonnes 80 124
Sub-total oily water tonnes 2 559 1 663
Units – fugitive VOC losses tonnes 2 856 2 478
Sulphur plant VOC losses tonnes 440 883
Vents to atmosphere tonnes 637 278
Incinerators tonnes 26 63
Hydrogen diffusion loss tonnes 15 15
CRU/CCR carbon loss tonnes 42 42
N2 from FCC feed (inerts) tonnes 415 262
Sub-total process units tonnes 4 431 4 021
Tankage VOC losses tonnes 772 680
Hydrocarbon content of API sludge tonnes 113 81
Hydrocarbon content of tank sludge tonnes 280 402
Spills and seepage (net) tonnes 8 7
Sub-total sludge/spills tonnes 401 490
Other – marine VOC (when export BOL is based on shipboard meas)
tonnes 0 0
Other – bitumen blowing tonnes 166 235
Other – please state tonnes 7 108
Other – please state tonnes 34 163
Other – please state tonnes 0 2
Other – please state tonnes 2 41
Sub-total other losses tonnes 209 549
HYDROCARBON MANAGEMENT REFINERY MEASUREMENT DATABASE COMMITTEE HMC-2A MEMBERSHIP GUIDE
26
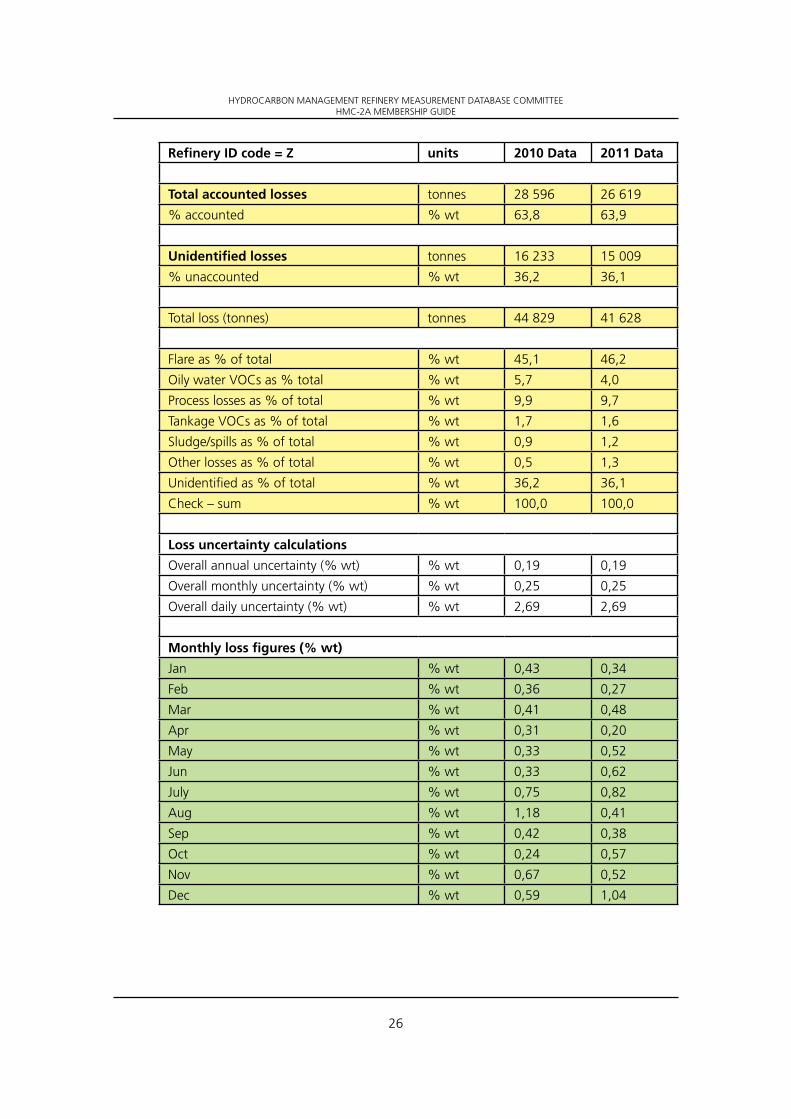
Refinery ID code = Z units 2010 Data 2011 Data
Total accounted losses tonnes 28 596 26 619
% accounted % wt 63,8 63,9
Unidentified losses tonnes 16 233 15 009
% unaccounted % wt 36,2 36,1
Total loss (tonnes) tonnes 44 829 41 628
Flare as % of total % wt 45,1 46,2
Oily water VOCs as % total % wt 5,7 4,0
Process losses as % of total % wt 9,9 9,7
Tankage VOCs as % of total % wt 1,7 1,6
Sludge/spills as % of total % wt 0,9 1,2
Other losses as % of total % wt 0,5 1,3
Unidentified as % of total % wt 36,2 36,1
Check – sum % wt 100,0 100,0
Loss uncertainty calculations
Overall annual uncertainty (% wt) % wt 0,19 0,19
Overall monthly uncertainty (% wt) % wt 0,25 0,25
Overall daily uncertainty (% wt) % wt 2,69 2,69
Monthly loss figures (% wt)
Jan % wt 0,43 0,34
Feb % wt 0,36 0,27
Mar % wt 0,41 0,48
Apr % wt 0,31 0,20
May % wt 0,33 0,52
Jun % wt 0,33 0,62
July % wt 0,75 0,82
Aug % wt 1,18 0,41
Sep % wt 0,42 0,38
Oct % wt 0,24 0,57
Nov % wt 0,67 0,52
Dec % wt 0,59 1,04

HYDROCARBON MANAGEMENT REFINERY MEASUREMENT DATABASE COMMITTEE HMC-2A MEMBERSHIP GUIDE
27
Refinery ID code = Z units 2010 Data 2011 Data
Monthly processed inputs (tonnes)
Jan tonnes 779 402 783 551
Feb tonnes 662 050 691 226
Mar tonnes 834 226 747 000
Apr tonnes 783 261 736 643
May tonnes 821 247 772 490
Jun tonnes 812 658 716 687
July tonnes 813 053 743 046
Aug tonnes 755 753 730 608
Sep tonnes 728 231 720 033
Oct tonnes 798 731 717 909
Nov tonnes 778 531 717 411
Dec tonnes 804 622 741 251
Monthly % wt loss (excluding major shutdown months)
Jan % wt 0,43 0,34
Feb % wt 0,36 0,27
Mar % wt 0,41 0,48
Apr % wt 0,31 0,20
May % wt 0,33 0,52
Jun % wt 0,33 0,62
July % wt 0,75 0,82
Aug % wt 1,18 0,41
Sep % wt 0,42 0,38
Oct % wt 0,24 0,57
Nov % wt 0,67 0,52
Dec % wt 0,59 1,04
This publication has been produced as a result of work carried out within the Technical Team of the Energy Institute (EI), funded by the EI’s Technical Partners and other stakeholders. The EI’s Technical Work Programme provides industry with cost effective, value adding knowledge on key current and future issues affecting those operating in the energy sector, both in the UK and beyond.
Registered Charity Number: 1097899
Energy Institute61 New Cavendish StreetLondon W1G 7AR, UK
t: +44 (0) 20 7467 7100f: +44 (0) 20 7255 1472e: [email protected]