Embed Size (px)
Citation preview
FINAL REPORT HYDROCARBON CHARACTERIZATION OF FACE AROMATIC STREAMS R. Gieleciak, D. Hager, C. Lay, and C. Fairbridge. CanmetENERGY–DEVON Work performed for: CanmetENERGY, Natural Resources Canada; Fuels for Advanced Combustion Engines Working Group AUGUST 2010 DIVISION REPORT 2010-082 (INT)
i PROTECTED BUSINESS INFORMATION
CanmetENERGY–Devon
DISCLAIMER
This report and its contents, the project in respect of which it is submitted, and
the conclusions and recommendations arising from it do not necessarily reflect the
views of the Government of Canada, its officers, employees, or agents.
ii PROTECTED BUSINESS INFORMATION
CanmetENERGY–Devon
EXECUTIVE SUMMARY
CanmetENERGY was asked by the Coordinating Research Council Fuels for
Advanced Combustion Engines (FACE) Working Group to provide standard and
advanced analytical characterization analyses of four samples used for FACE
research diesel fuel testing.
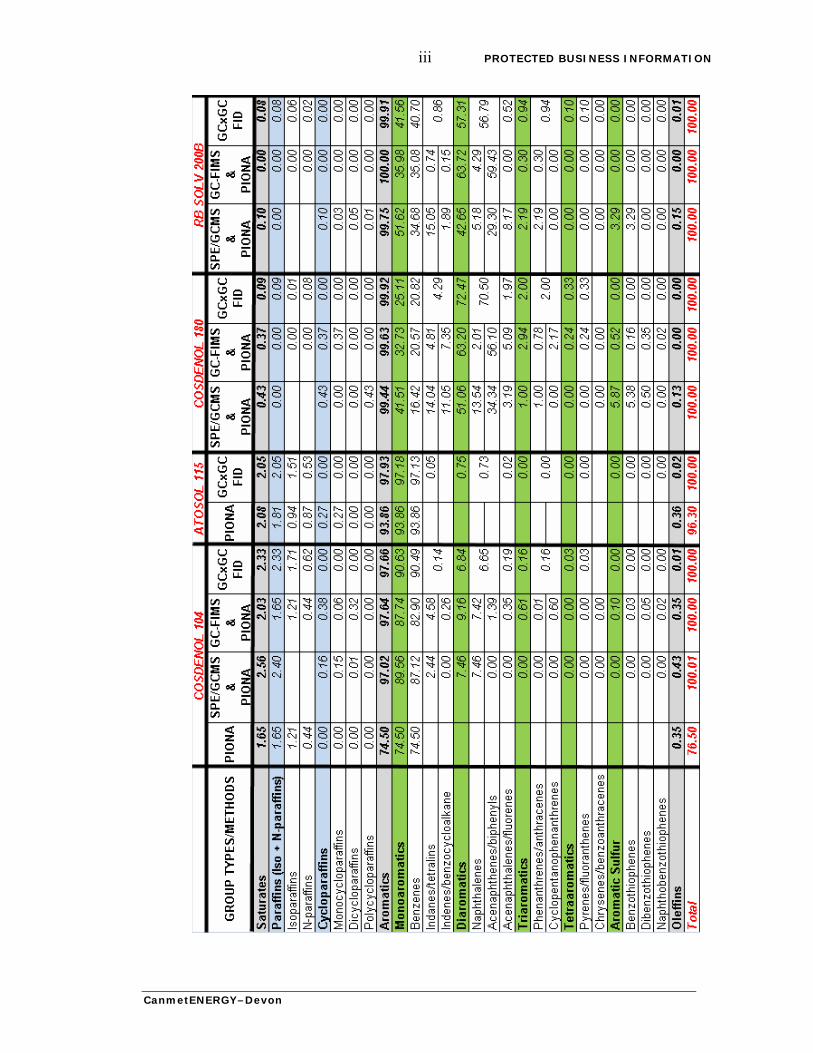
This report provides standard as well as detailed chemical and structural
hydrocarbon type information for the aromatic hydrocarbon streams. The results
presented in this report consist of data obtained using the following analytical
techniques: PIONA (n-paraffin, iso-paraffin, olefin, naphthene and aromatic, ASTM
D5443M), DHA (detailed hydrocarbon analysis, ASTM D6730), GC-FIMS (gas
chromatography-field ionization mass spectrometry), GC-MS (gas chromatography-
mass spectrometry, ASTM D2786 and D3239), and GCxGC (comprehensive two-
dimensional gas chromatography). The following table presents a summary of the
analyses.
iii PROTECTED BUSINESS INFORMATION
CanmetENERGY–Devon
iv PROTECTED BUSINESS INFORMATION
CanmetENERGY–Devon
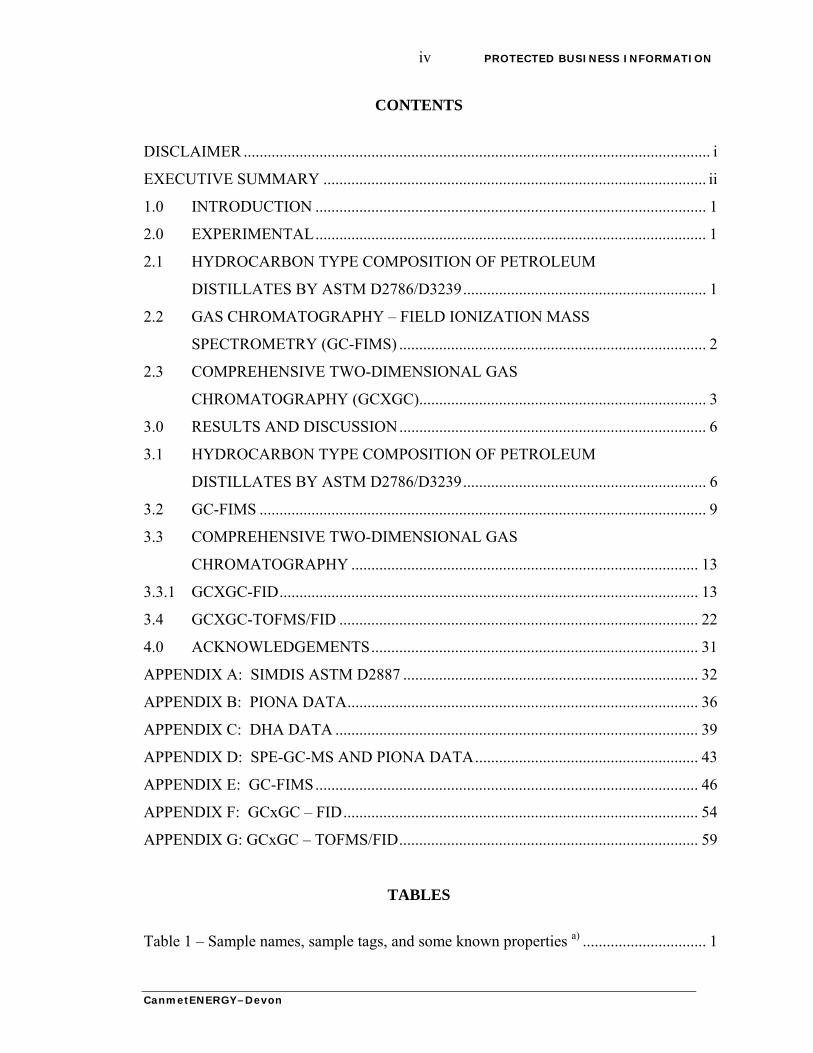
CONTENTS
DISCLAIMER ..................................................................................................................... i
EXECUTIVE SUMMARY ................................................................................................ ii
1.0 INTRODUCTION .................................................................................................. 1
2.0 EXPERIMENTAL.................................................................................................. 1
2.1 HYDROCARBON TYPE COMPOSITION OF PETROLEUM
DISTILLATES BY ASTM D2786/D3239............................................................. 1
2.2 GAS CHROMATOGRAPHY – FIELD IONIZATION MASS
SPECTROMETRY (GC-FIMS) ............................................................................. 2
2.3 COMPREHENSIVE TWO-DIMENSIONAL GAS
CHROMATOGRAPHY (GCXGC)........................................................................ 3
3.0 RESULTS AND DISCUSSION............................................................................. 6
3.1 HYDROCARBON TYPE COMPOSITION OF PETROLEUM
DISTILLATES BY ASTM D2786/D3239............................................................. 6
3.2 GC-FIMS ................................................................................................................ 9
3.3 COMPREHENSIVE TWO-DIMENSIONAL GAS
CHROMATOGRAPHY ....................................................................................... 13
3.3.1 GCXGC-FID......................................................................................................... 13
3.4 GCXGC-TOFMS/FID .......................................................................................... 22
4.0 ACKNOWLEDGEMENTS.................................................................................. 31
APPENDIX A: SIMDIS ASTM D2887 .......................................................................... 32
APPENDIX B: PIONA DATA........................................................................................ 36
APPENDIX C: DHA DATA ........................................................................................... 39
APPENDIX D: SPE-GC-MS AND PIONA DATA........................................................ 43
APPENDIX E: GC-FIMS................................................................................................ 46
APPENDIX F: GCxGC – FID......................................................................................... 54
APPENDIX G: GCxGC – TOFMS/FID........................................................................... 59
TABLES
Table 1 – Sample names, sample tags, and some known properties a) ............................... 1
v PROTECTED BUSINESS INFORMATION
CanmetENERGY–Devon
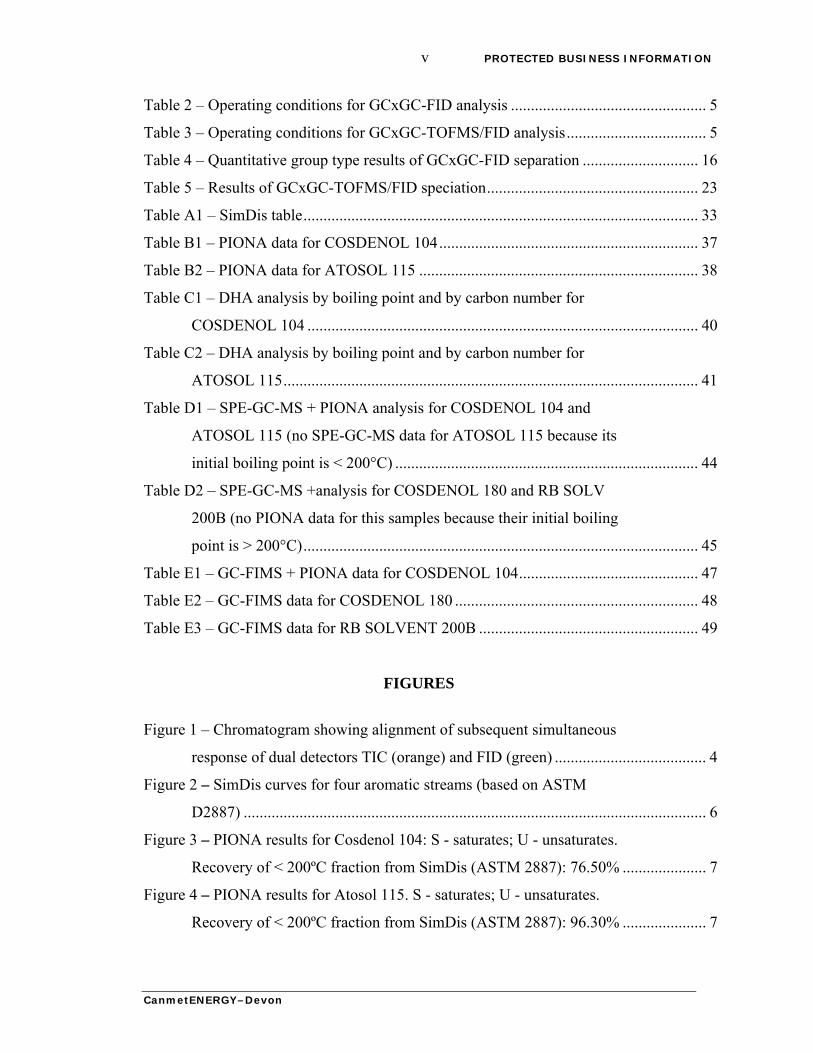
Table 2 – Operating conditions for GCxGC-FID analysis ................................................. 5
Table 3 – Operating conditions for GCxGC-TOFMS/FID analysis................................... 5
Table 4 – Quantitative group type results of GCxGC-FID separation ............................. 16
Table 5 – Results of GCxGC-TOFMS/FID speciation..................................................... 23
Table A1 – SimDis table................................................................................................... 33
Table B1 – PIONA data for COSDENOL 104................................................................. 37
Table B2 – PIONA data for ATOSOL 115 ...................................................................... 38
Table C1 – DHA analysis by boiling point and by carbon number for
COSDENOL 104 .................................................................................................. 40
Table C2 – DHA analysis by boiling point and by carbon number for
ATOSOL 115........................................................................................................ 41
Table D1 – SPE-GC-MS + PIONA analysis for COSDENOL 104 and
ATOSOL 115 (no SPE-GC-MS data for ATOSOL 115 because its
initial boiling point is < 200°C) ............................................................................ 44
Table D2 – SPE-GC-MS +analysis for COSDENOL 180 and RB SOLV
200B (no PIONA data for this samples because their initial boiling
point is > 200°C)................................................................................................... 45
Table E1 – GC-FIMS + PIONA data for COSDENOL 104............................................. 47
Table E2 – GC-FIMS data for COSDENOL 180 ............................................................. 48
Table E3 – GC-FIMS data for RB SOLVENT 200B ....................................................... 49
FIGURES
Figure 1 – Chromatogram showing alignment of subsequent simultaneous
response of dual detectors TIC (orange) and FID (green) ...................................... 4
Figure 2 – SimDis curves for four aromatic streams (based on ASTM
D2887) .................................................................................................................... 6
Figure 3 – PIONA results for Cosdenol 104: S - saturates; U - unsaturates.
Recovery of < 200ºC fraction from SimDis (ASTM 2887): 76.50% ..................... 7
Figure 4 – PIONA results for Atosol 115. S - saturates; U - unsaturates.
Recovery of < 200ºC fraction from SimDis (ASTM 2887): 96.30% ..................... 7
vi PROTECTED BUSINESS INFORMATION
CanmetENERGY–Devon
Figure 5 – SPE-GC-MS data for Cosdenol 104.................................................................. 8
Figure 6 – SPE-GC-MS data comparison for Cosdenol 180 and RB solv
200B........................................................................................................................ 9
Figure 7 – GC-FIMS and PIONA data comparison for (a) Cosdenol 104
and (b) Atosol 115 ................................................................................................ 10
Figure 8 – GC-FIMS and PIONA data comparison for (a) Cosdenol 180
and (b) RB Solvent 200B...................................................................................... 11
Figure 9 – Differentiation plots for (a) Cosdenol 104 & Atosol 115 and (b)
Cosdenol 180 & RB Solvent 200B ....................................................................... 12
Figure 10 – Schematic example of compound class distribution using
traditional column set combination. Meaning of symbols: a6 – 6
carbon aromatics, c5 – 5 carbon ring aliphatic, c6 – 6 carbon ring
aliphatic................................................................................................................. 14
Figure 11 – Examples of compounds assigned to groups used in GCxGC-
FID typing............................................................................................................. 15
Figure 12 – Graphic results of GCxGC-FID speciation ................................................... 17
Figure 13 – GCxGC-FID bubble plot chromatograms of (a) Cosdenol 104
and (b) Atosol 115 with selected groups............................................................... 18
Figure 14 – GCxGC-FID bubble plot chromatograms of (a) Cosdenol 180
and (b) RB Solvent 200B with selected groups ................................................... 19
Figure 15 – Differentiation plots for (a) Cosdenol 104 & Atosol 115 and
(b) Atosol 115 & Cosdenol 104............................................................................ 20
Figure 16 – Differentiation plots for (a) Cosdenol 180 & RB Solvent 200B
and (b) RB Solvent 200B & Cosdenol 180........................................................... 20
Figure 17 – (a) ‘global’ SimDis based on GCxGC for Cosdenol 104 (blue)
and Atosol 115 (red) (b) ‘group type’ SimDis based on selected
classification regions............................................................................................. 21
Figure 18 – (a) ‘global’ SimDis based on GCxGC for Cosdenol 180 (blue)
and RB Solvent 200B (red) (b) ‘group type’ SimDis based on
selected classification regions............................................................................... 21

vii PROTECTED BUSINESS INFORMATION
CanmetENERGY–Devon
Figure 19 – GCxGC-TOFMS/FID chromatograms of example sample: (a)
‘normal’ column combination (b) ‘reversed’ column combination...................... 22
Figure 20 – Example of identification of compounds in selected region for
RB Solvent 200B .................................................................................................. 24
Figure 21 – GCxGC-TOFMS/FID chromatograms of (a) Cosdenol 104
and (b) Atosol 115 with selected groups. Compound classes are
marked with different colors (e.g., C2-benzene <green>, C3-
benzene <red>, C4-benzene <yellow>) ................................................................ 25
Figure 22 – GCxGC-TOFMS/FID chromatograms of (a) Cosdenol 180
and (b) RB Solvent 200B with selected groups. Compound classes
are marked with different colors (e.g., naphthalenes <red>, C11-
benzene <brown>,cyclohexylbenzenes <pink., C1-C4-
dphenyethanes <dark blue>)................................................................................. 26
Figure 23 – Comparison of detailed GCxGC-TOFMS hydrocarbon type
analyses for Cosdenol 104 and Atosol 115........................................................... 27
Figure 24 – Comparison of detailed GCxGC-TOFMS hydrocarbon type
analyses for Cosdenol 180 and RB Solvent 200B ................................................ 28
Figure 25 – Examples of compounds used in GCxGC-TOFMS/FID
comparative analysis............................................................................................. 29
Figure 26 – Differentiation plots for (a) Cosdenol 104 & Atosol 115 and
(b) Atosol 115 & Cosdenol 104............................................................................ 30
Figure 27 – Differentiation plots for (a) Cosdenol 180 & RB Solvent 200B
and (b) RB Solvent 200B & Cosdenol 180........................................................... 30
Figure E1 – GC-FIMS and PIONA for COSDENOL 104 ............................................... 50
Figure E2 – GC-FIM and PIONA for ATOSOL 115 ....................................................... 51
Figure E3 – GC-FIMS and PIONA for COSDENOL 180 ............................................... 52
Figure E4 – GC-FIMS and PIONA for RB SOLV 200B ................................................. 53
Figure F1 – GCxGC-FID chromatograms of Cosdenol 104: (a) 2D view,
(b) 3D view, (c) 2D view together with classification regions ............................. 55
Figure F2 – GCxGC-FID chromatograms of Atosol 115: (a) 2D view, (b)
3D view, (c) 2D view together with classification regions................................... 56
viii PROTECTED BUSINESS INFORMATION
CanmetENERGY–Devon
Figure F3 – GCxGC-FID chromatograms of Cosdenol 180: (a) 2D view,
(b) 3D view, (c) 2D view together with classification regions ............................. 57
Figure F4 – GCxGC-FID chromatograms of RB Solvent 200B: (a) 2D
view, (b) 3D view, (c) 2D view together with classification regions ................... 58
Figure G1 – GCxGC-TOFMS/FID chromatograms of Cosdenol 104: (a)
2D view together with classification regions (b) 3 D view .................................. 60
Figure G 2 – GCxGC-TOFMS/FID chromatograms of Atosol 115: (a) 2D
view together with classification regions (b) 3 D view ........................................ 61
Figure G3 – GCxGC-TOFMS/FID chromatograms of Cosdenol 180: (a)
2D view together with classification regions (b) 3 D view .................................. 62
Figure G4 – GCxGC-TOFMS/FID chromatograms of RB Solvent 200B:
(a) 2D view together with classification regions (b) 3D view.............................. 63
PROTECTED BUSINESS INFORMATION 1
1.0 INTRODUCTION
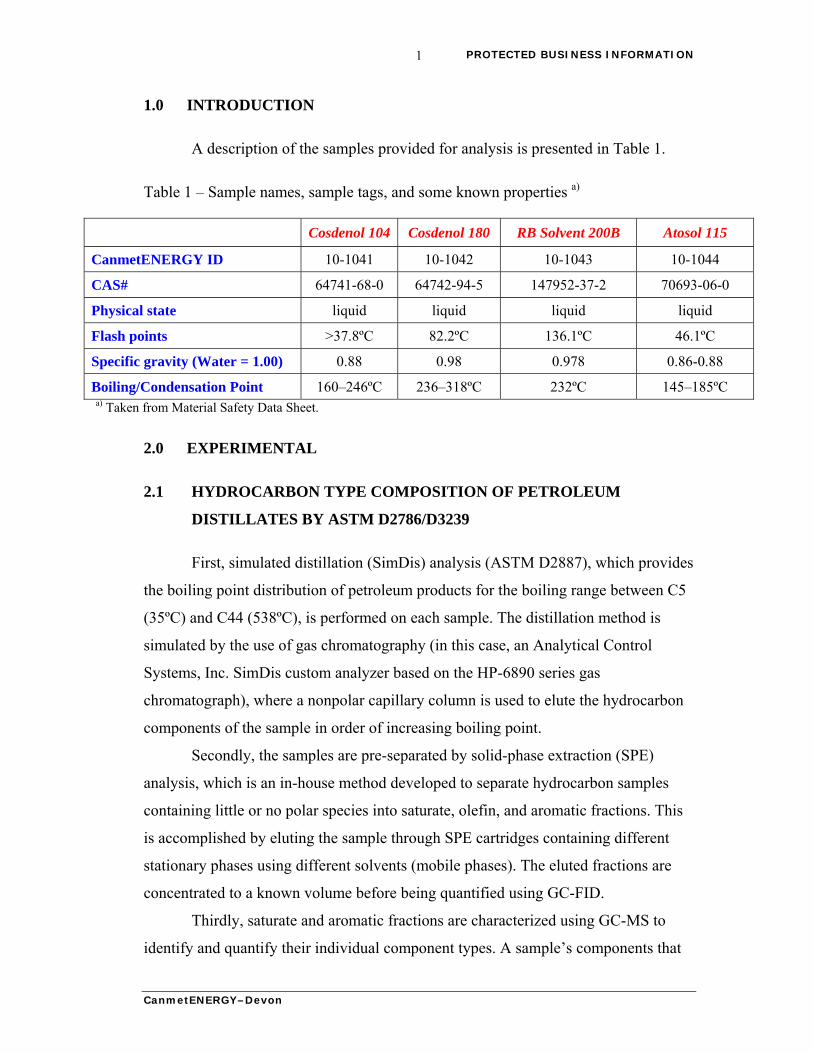
A description of the samples provided for analysis is presented in Table 1.
Table 1 – Sample names, sample tags, and some known properties a)
Cosdenol 104 Cosdenol 180 RB Solvent 200B Atosol 115
CanmetENERGY ID 10-1041 10-1042 10-1043 10-1044
CAS# 64741-68-0 64742-94-5 147952-37-2 70693-06-0
Physical state liquid liquid liquid liquid
Flash points >37.8ºC 82.2ºC 136.1ºC 46.1ºC
Specific gravity (Water = 1.00) 0.88 0.98 0.978 0.86-0.88
Boiling/Condensation Point 160–246ºC 236–318ºC 232ºC 145–185ºC a) Taken from Material Safety Data Sheet.
2.0 EXPERIMENTAL
2.1 HYDROCARBON TYPE COMPOSITION OF PETROLEUM
DISTILLATES BY ASTM D2786/D3239
First, simulated distillation (SimDis) analysis (ASTM D2887), which provides
the boiling point distribution of petroleum products for the boiling range between C5
(35ºC) and C44 (538ºC), is performed on each sample. The distillation method is
simulated by the use of gas chromatography (in this case, an Analytical Control
Systems, Inc. SimDis custom analyzer based on the HP-6890 series gas
chromatograph), where a nonpolar capillary column is used to elute the hydrocarbon
components of the sample in order of increasing boiling point.
Secondly, the samples are pre-separated by solid-phase extraction (SPE)
analysis, which is an in-house method developed to separate hydrocarbon samples
containing little or no polar species into saturate, olefin, and aromatic fractions. This
is accomplished by eluting the sample through SPE cartridges containing different
stationary phases using different solvents (mobile phases). The eluted fractions are
concentrated to a known volume before being quantified using GC-FID.
Thirdly, saturate and aromatic fractions are characterized using GC-MS to
identify and quantify their individual component types. A sample’s components that
CanmetENERGY–Devon
PROTECTED BUSINESS INFORMATION 2
boil above 200°C (392°F) are quantified and identified in terms of saturate and
aromatic percentages using GC-MS D2786 for the saturate fraction and ASTM
D3239 for the aromatic fraction. Those components boiling below 200ºC are
determined by PIONA to provide hydrocarbon types by carbon number.
2.2 GAS CHROMATOGRAPHY – FIELD IONIZATION MASS
SPECTROMETRY (GC-FIMS)
Samples are characterized by GC-FIMS, which characterizes hydrocarbon
types in the boiling range of 200 to 343°C (392 to 649°F). This method provides
detailed characterization of saturates (including iso-paraffins, n-paraffins, and
cylcoparaffins), aromatics (mono, di, and polyaromatics), and two aromatic
thiophenotypes. It does not require pre-separation of the sample. The results are
reported for the total product and by carbon number (up to C21 for the diesel range)
and/or by boiling point distribution. A full GC-FIMS report also consists of a series
of reports by carbon number in selected temperature intervals (usually 10°C
intervals). The analysis is performed using an Agilent 6890 gas chromatograph
configured with a GCT Micromass multi-channel plate detector. A semi-polar DB-
5HT capillary column (30 m long × 0.25 mm internal diameter × 0.10 μm film
thickness) is used for separation of the peaks, and identification of the components is
based on the accurately determined masses.
For the diesel components boiling below 200°C (392°F), the sample is
injected into a PIONA analyzer (Analytical Control PIONA analyzer-reformulizer)
and run according to ASTM D5443 and ASTM D6839 so that the data can be
presented by carbon number. The instrument has been equipped with a prefractionator
to vent off any material that boils above 200°C (392°F). The PIONA data reported for
the fraction that boils below 200°C are then combined with the GC-FIMS data for the
fraction that boils above 200°C to produce reports that capture the full boiling range
of the diesel fuel. Two assumptions were made in presenting the PIONA data:
cycloparaffins were all monocycloparaffins, and aromatics were all alkylbenzenes.
Similarly, diesel components boiling below 200°C (392°F) were also analyzed by
CanmetENERGY–Devon
PROTECTED BUSINESS INFORMATION 3
detailed hydrocarbon analysis (DHA, ASTM D6730) operated with a prefractionator
to eliminate hydrocarbons that boil above 200°C (392°F).
2.3 COMPREHENSIVE TWO-DIMENSIONAL GAS
CHROMATOGRAPHY (GCXGC)
Comprehensive two-dimensional gas chromatography (GCxGC) is a
hyphenated technique in which two different chromatographic separation mechanisms
act in series to greatly improve component separation and identification. The system
contains a jet-cool modulator between two chromatographic columns having different
selectivities. The modulator repeatedly focuses a small portion of the first column
eluate and injects it into the second column. All of the effluents from the second
column enter the detector. The main factors influencing usefulness of this method are:
high chromatographic resolution, high peak capacity, analyte detectability, and
chemical compound class ordering on the chromatogram.
The second dimension separation is very fast (usually 2 to 6 s), peaks are
narrow, typically, 0.1 to 0.5 s. Detectors used in this system must be characterized by
small internal volumes, short rise times, and high data acquisition rates. One of the
detectors meeting these demands, and used in CanmetENERGY GCxGC instruments,
is the flame ionization detector (FID). The FID response is linear over a very wide
range of concentrations and proportional to the mass flow rate of carbon. It therefore
may be considered as a general hydrocarbon detector. All quantitative analyses
provided in this report were based on the FID detector.
When structural information has to be provided to enable compound
identification, a mass spectrometer can be used as a detector. The TOFMS (time-of-
flight mass spectrometer) instrument can acquire up to 500 spectra per second, which
is more than enough for the accurate reconstruction of second-dimension peaks and
the deconvolution of overlapping peaks. The LECO ChromaTOF software allows
direct presentation of total ion current (TIC) and analytical ion current, and extracted-
ion two-dimensional chromatograms, which assists the interpretation process. In
addition to the mass spectrometer detector, the CanmetENERGY GCxGC-TOFMS is
equipped with a flame ionization detector. After matching both TOFMS and FID
CanmetENERGY–Devon
PROTECTED BUSINESS INFORMATION 4
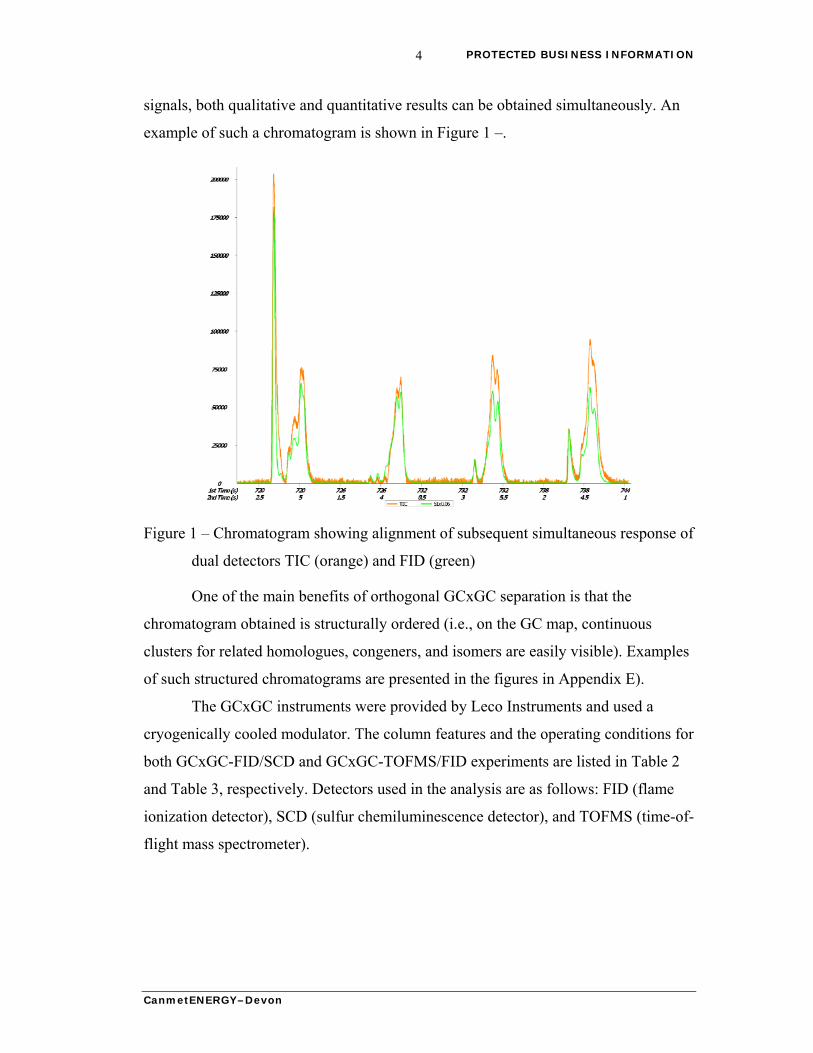
signals, both qualitative and quantitative results can be obtained simultaneously. An
example of such a chromatogram is shown in Figure 1 –.
Figure 1 – Chromatogram showing alignment of subsequent simultaneous response of
dual detectors TIC (orange) and FID (green)
One of the main benefits of orthogonal GCxGC separation is that the
chromatogram obtained is structurally ordered (i.e., on the GC map, continuous
clusters for related homologues, congeners, and isomers are easily visible). Examples
of such structured chromatograms are presented in the figures in Appendix E).
The GCxGC instruments were provided by Leco Instruments and used a
cryogenically cooled modulator. The column features and the operating conditions for
both GCxGC-FID/SCD and GCxGC-TOFMS/FID experiments are listed in Table 2
and Table 3, respectively. Detectors used in the analysis are as follows: FID (flame
ionization detector), SCD (sulfur chemiluminescence detector), and TOFMS (time-of-
flight mass spectrometer).
CanmetENERGY–Devon
PROTECTED BUSINESS INFORMATION 5
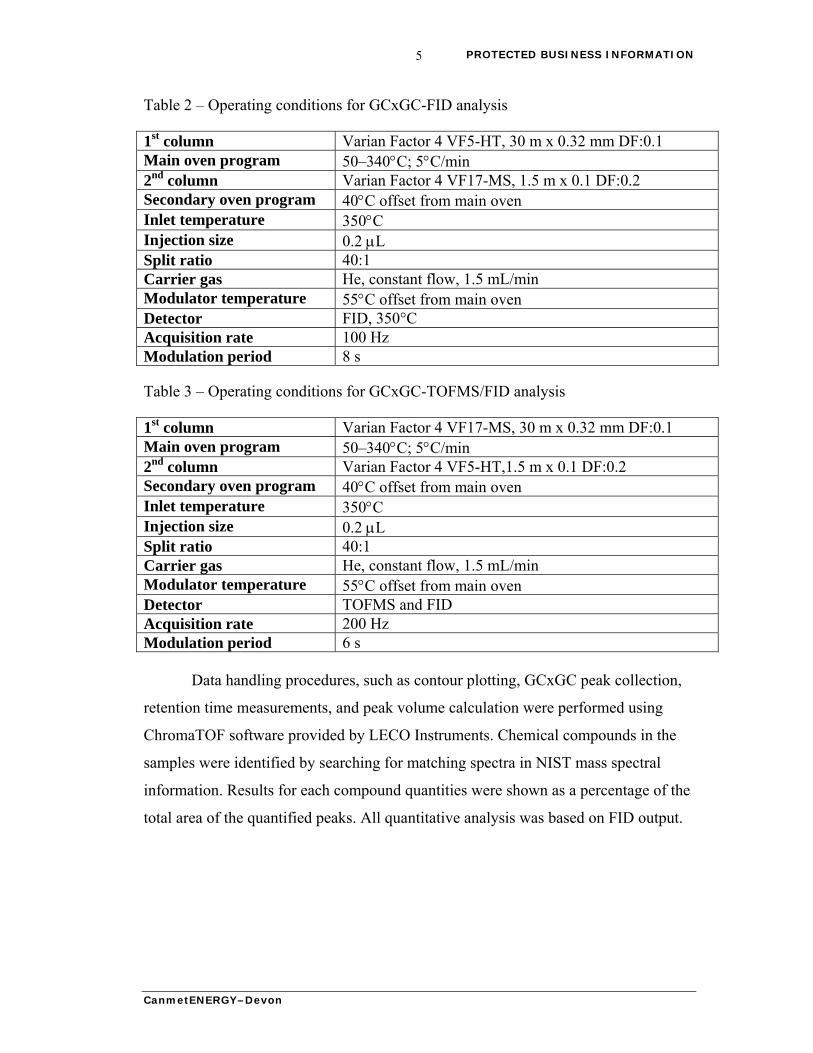
Table 2 – Operating conditions for GCxGC-FID analysis
1st column Varian Factor 4 VF5-HT, 30 m x 0.32 mm DF:0.1 Main oven program 50–340C; 5C/min 2nd column Varian Factor 4 VF17-MS, 1.5 m x 0.1 DF:0.2 Secondary oven program 40C offset from main oven Inlet temperature 350C Injection size 0.2 L Split ratio 40:1 Carrier gas He, constant flow, 1.5 mL/min Modulator temperature 55C offset from main oven Detector FID, 350°C Acquisition rate 100 Hz Modulation period 8 s
Table 3 – Operating conditions for GCxGC-TOFMS/FID analysis
1st column Varian Factor 4 VF17-MS, 30 m x 0.32 mm DF:0.1 Main oven program 50–340C; 5C/min 2nd column Varian Factor 4 VF5-HT,1.5 m x 0.1 DF:0.2 Secondary oven program 40C offset from main oven Inlet temperature 350C Injection size 0.2 L Split ratio 40:1 Carrier gas He, constant flow, 1.5 mL/min Modulator temperature 55C offset from main oven Detector TOFMS and FID Acquisition rate 200 Hz Modulation period 6 s
Data handling procedures, such as contour plotting, GCxGC peak collection,
retention time measurements, and peak volume calculation were performed using
ChromaTOF software provided by LECO Instruments. Chemical compounds in the
samples were identified by searching for matching spectra in NIST mass spectral
information. Results for each compound quantities were shown as a percentage of the
total area of the quantified peaks. All quantitative analysis was based on FID output.
CanmetENERGY–Devon
PROTECTED BUSINESS INFORMATION 6
3.0 RESULTS AND DISCUSSION
3.1 HYDROCARBON TYPE COMPOSITION OF PETROLEUM
DISTILLATES BY ASTM D2786/D3239
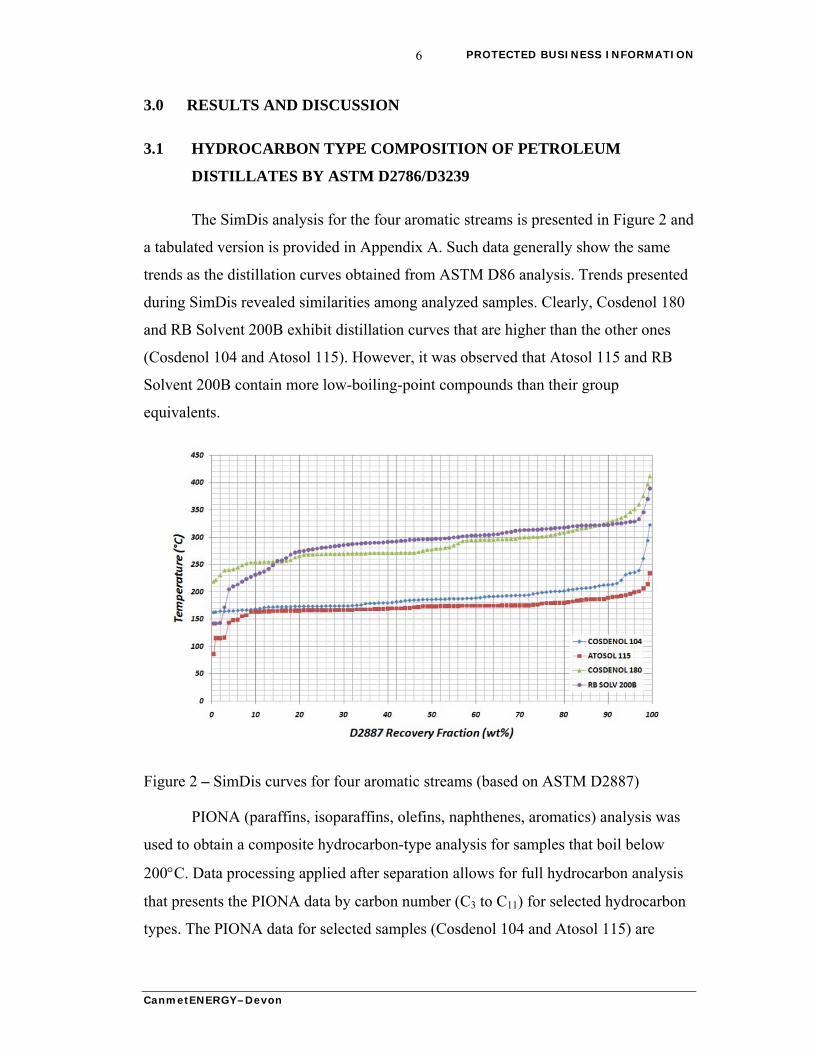
The SimDis analysis for the four aromatic streams is presented in Figure 2 and
a tabulated version is provided in Appendix A. Such data generally show the same
trends as the distillation curves obtained from ASTM D86 analysis. Trends presented
during SimDis revealed similarities among analyzed samples. Clearly, Cosdenol 180
and RB Solvent 200B exhibit distillation curves that are higher than the other ones
(Cosdenol 104 and Atosol 115). However, it was observed that Atosol 115 and RB
Solvent 200B contain more low-boiling-point compounds than their group
equivalents.
Figure 2 – SimDis curves for four aromatic streams (based on ASTM D2887)
PIONA (paraffins, isoparaffins, olefins, naphthenes, aromatics) analysis was
used to obtain a composite hydrocarbon-type analysis for samples that boil below
200C. Data processing applied after separation allows for full hydrocarbon analysis
that presents the PIONA data by carbon number (C3 to C11) for selected hydrocarbon
types. The PIONA data for selected samples (Cosdenol 104 and Atosol 115) are
CanmetENERGY–Devon
PROTECTED BUSINESS INFORMATION 7
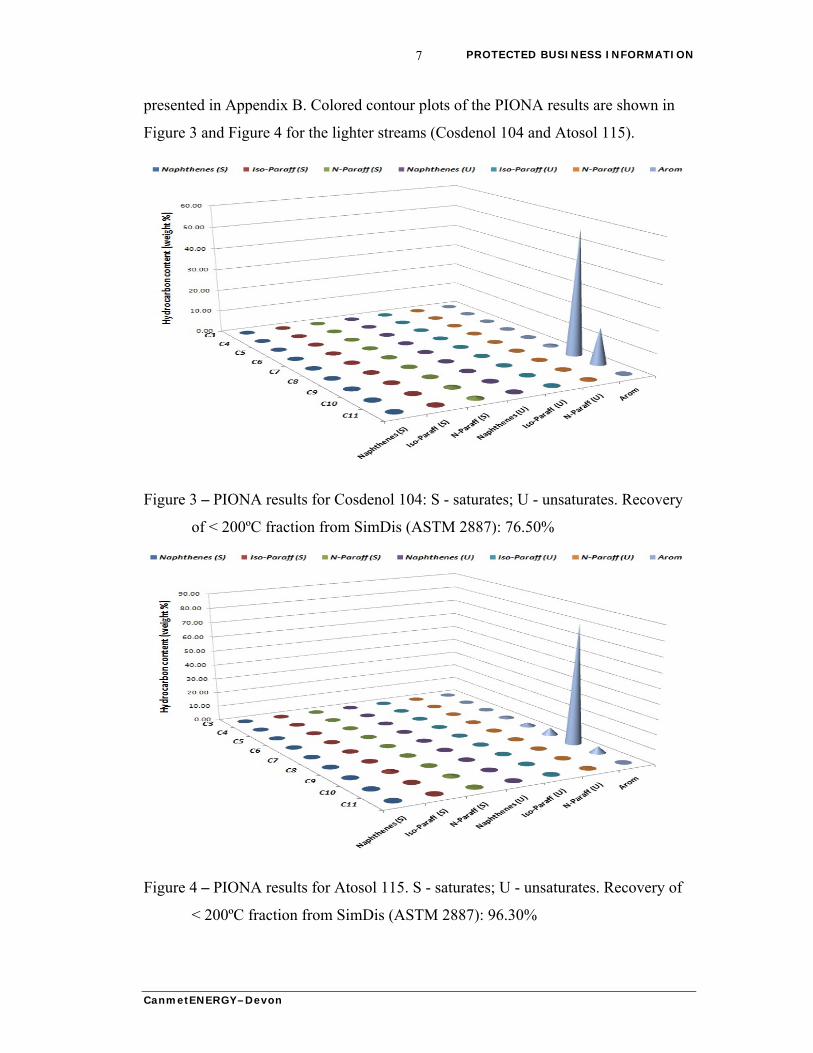
presented in Appendix B. Colored contour plots of the PIONA results are shown in
Figure 3 and Figure 4 for the lighter streams (Cosdenol 104 and Atosol 115).
Figure 3 – PIONA results for Cosdenol 104: S - saturates; U - unsaturates. Recovery
of < 200ºC fraction from SimDis (ASTM 2887): 76.50%
Figure 4 – PIONA results for Atosol 115. S - saturates; U - unsaturates. Recovery of
< 200ºC fraction from SimDis (ASTM 2887): 96.30%
CanmetENERGY–Devon
PROTECTED BUSINESS INFORMATION 8
Based on the SimDis plot (see Figure 2), the weight fractions that boiled
below 200ºC were 96.3% and 76.5% for Atosol 115 and Cosdenol 104, respectively.
Therefore, for Atosol 115, the hydrocarbon content is completely described by
PIONA alone.
In addition to PIONA analysis, DHA (detailed hydrocarbon analysis) was also
performed on the two light streams (Cosdenol 104 and Atosol 115). DHA results are
presented in Appendix C by both carbon number and boiling point distribution.
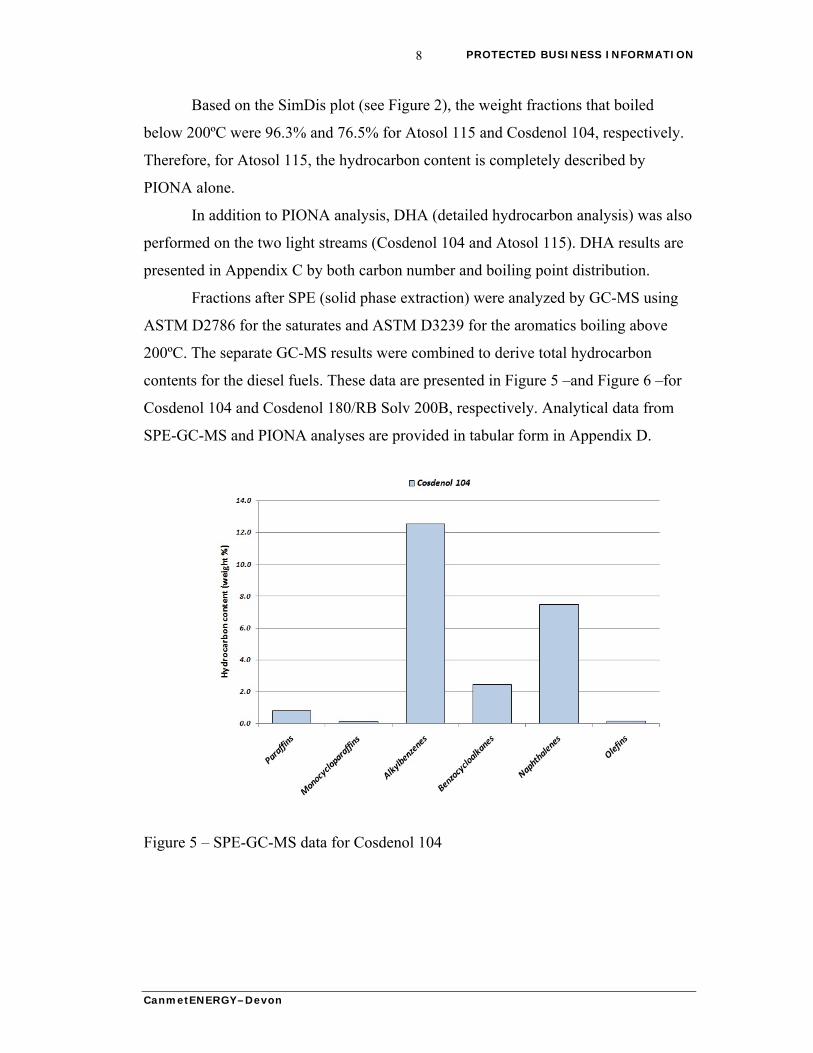
Fractions after SPE (solid phase extraction) were analyzed by GC-MS using
ASTM D2786 for the saturates and ASTM D3239 for the aromatics boiling above
200ºC. The separate GC-MS results were combined to derive total hydrocarbon
contents for the diesel fuels. These data are presented in Figure 5 –and Figure 6 –for
Cosdenol 104 and Cosdenol 180/RB Solv 200B, respectively. Analytical data from
SPE-GC-MS and PIONA analyses are provided in tabular form in Appendix D.
Figure 5 – SPE-GC-MS data for Cosdenol 104
CanmetENERGY–Devon
PROTECTED BUSINESS INFORMATION 9
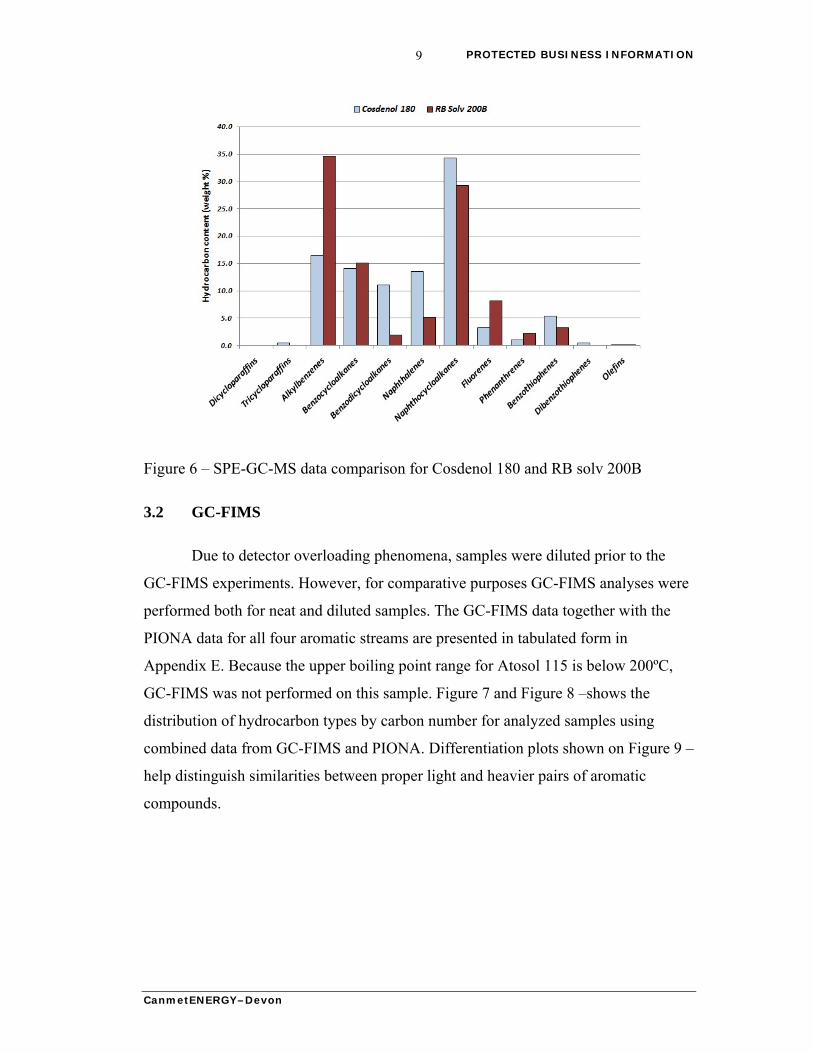
Figure 6 – SPE-GC-MS data comparison for Cosdenol 180 and RB solv 200B
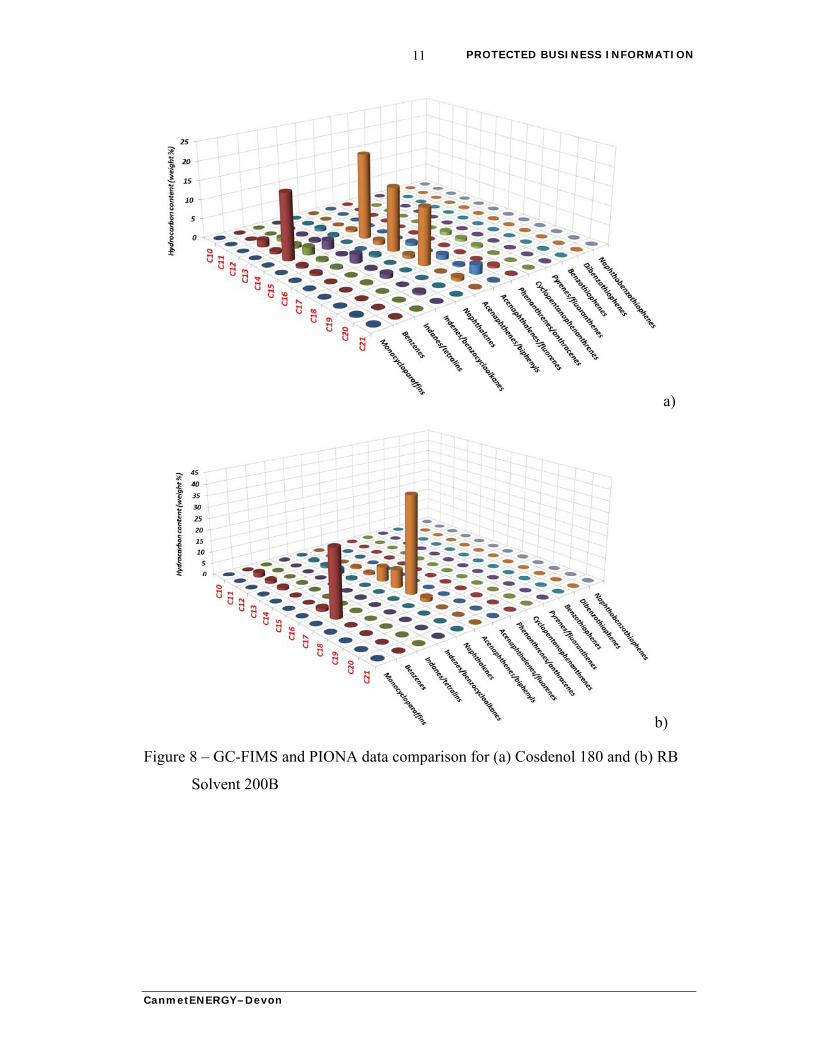
3.2 GC-FIMS
Due to detector overloading phenomena, samples were diluted prior to the
GC-FIMS experiments. However, for comparative purposes GC-FIMS analyses were
performed both for neat and diluted samples. The GC-FIMS data together with the
PIONA data for all four aromatic streams are presented in tabulated form in
Appendix E. Because the upper boiling point range for Atosol 115 is below 200ºC,
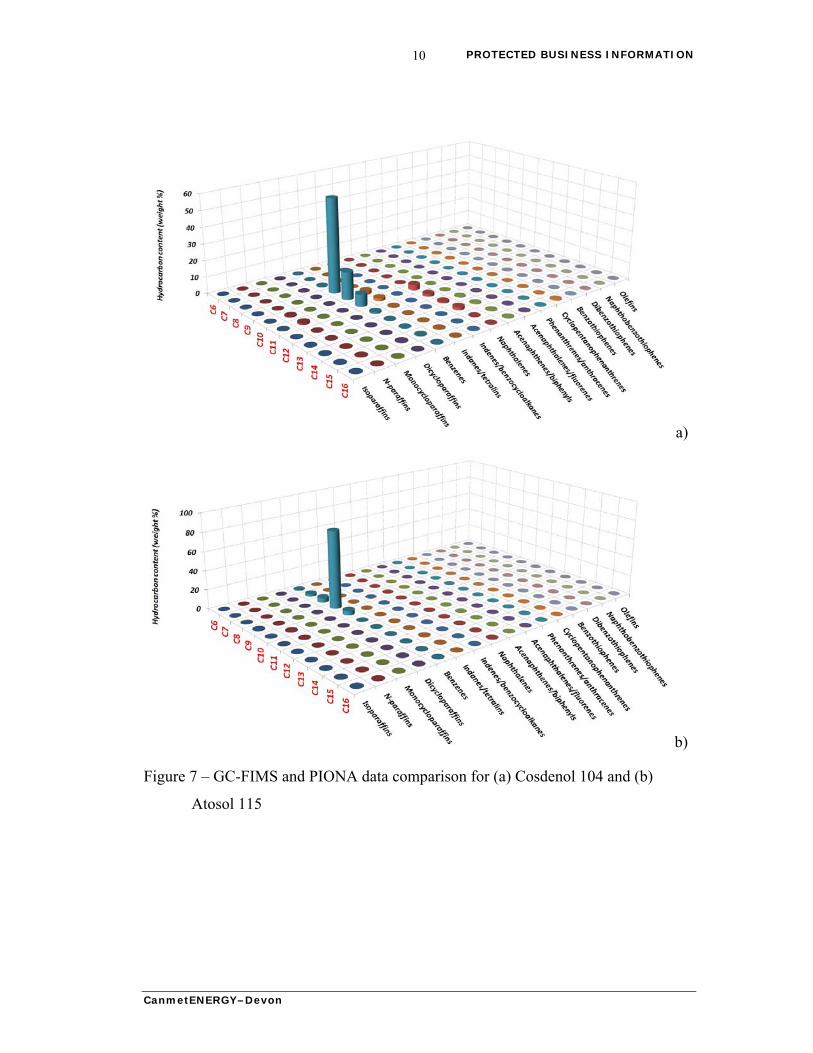
GC-FIMS was not performed on this sample. Figure 7 and Figure 8 –shows the
distribution of hydrocarbon types by carbon number for analyzed samples using
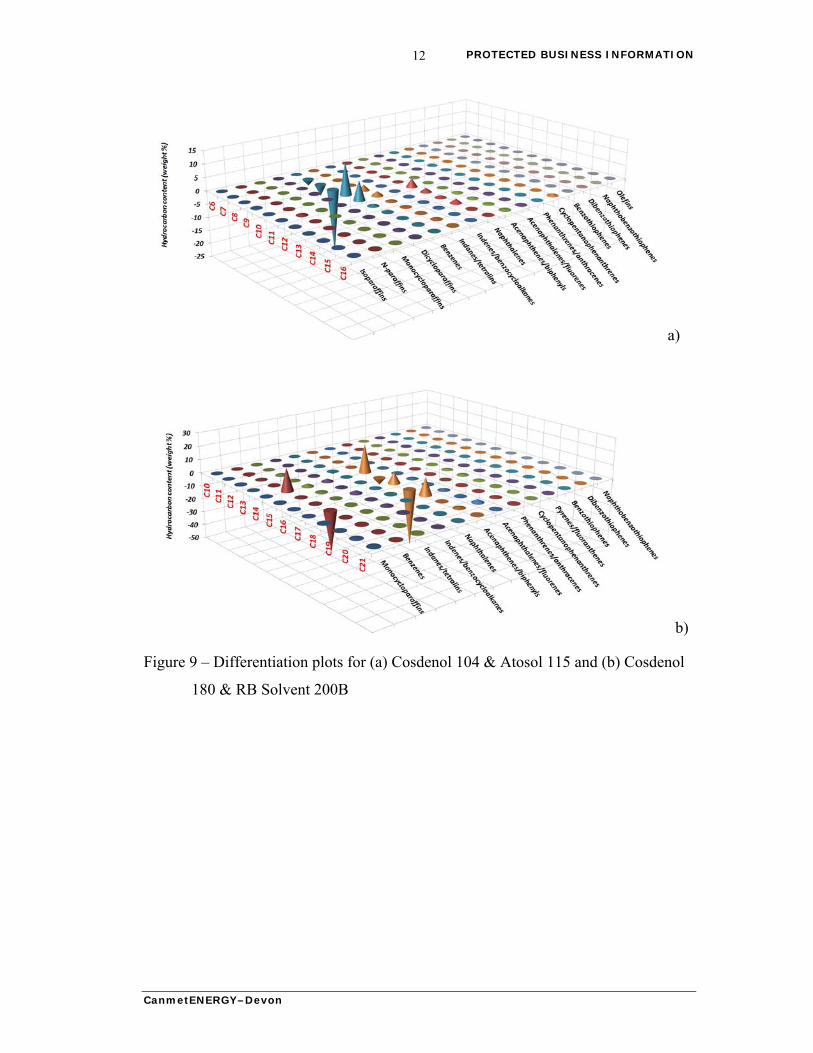
combined data from GC-FIMS and PIONA. Differentiation plots shown on Figure 9 –
help distinguish similarities between proper light and heavier pairs of aromatic
compounds.
CanmetENERGY–Devon
PROTECTED BUSINESS INFORMATION 10
a)
b)
Figure 7 – GC-FIMS and PIONA data comparison for (a) Cosdenol 104 and (b)
Atosol 115
CanmetENERGY–Devon
PROTECTED BUSINESS INFORMATION 11
a)
b)
Figure 8 – GC-FIMS and PIONA data comparison for (a) Cosdenol 180 and (b) RB
Solvent 200B
CanmetENERGY–Devon
PROTECTED BUSINESS INFORMATION 12
a)
b)
Figure 9 – Differentiation plots for (a) Cosdenol 104 & Atosol 115 and (b) Cosdenol
180 & RB Solvent 200B
CanmetENERGY–Devon
PROTECTED BUSINESS INFORMATION 13
3.3 COMPREHENSIVE TWO-DIMENSIONAL GAS
CHROMATOGRAPHY
Two-dimensional gas chromatography was used for both quantitative and
qualitative analysis. The following pages present the advanced characterization of
aromatic samples in more detail and include two-dimensional chromatograms from
both the GCxGC-FID and GCxGC-TOFMS/FID instruments.
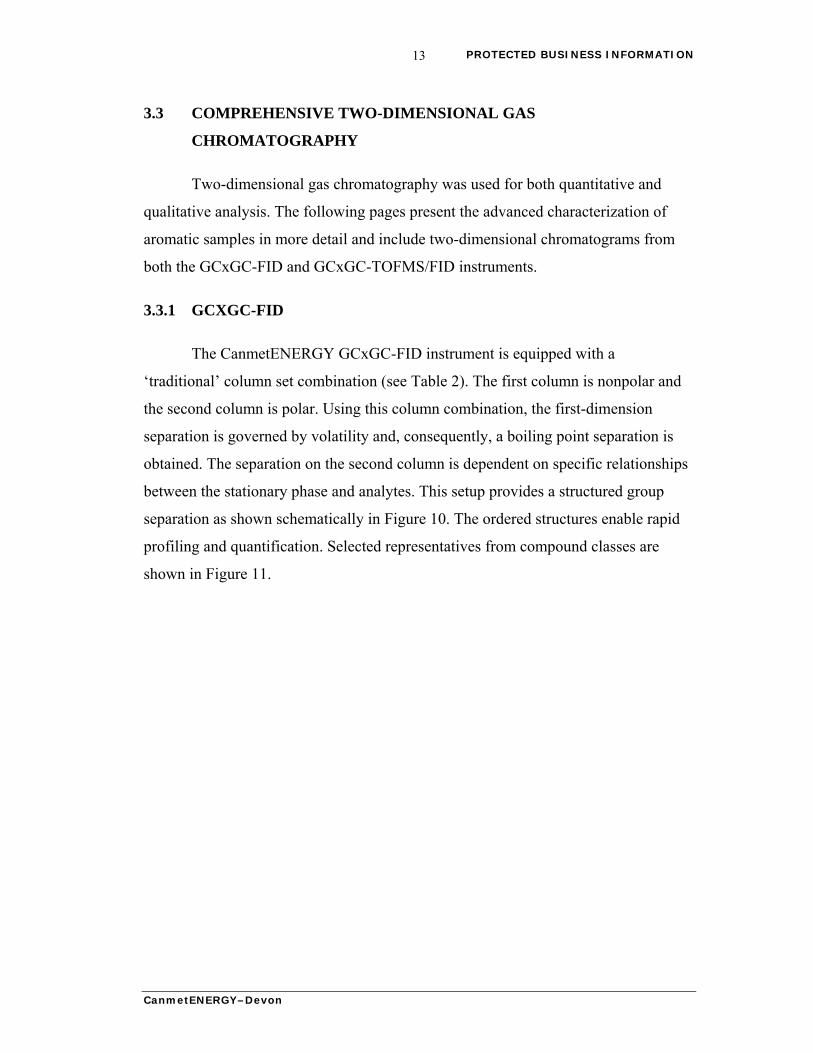
3.3.1 GCXGC-FID
The CanmetENERGY GCxGC-FID instrument is equipped with a
‘traditional’ column set combination (see Table 2). The first column is nonpolar and
the second column is polar. Using this column combination, the first-dimension
separation is governed by volatility and, consequently, a boiling point separation is
obtained. The separation on the second column is dependent on specific relationships
between the stationary phase and analytes. This setup provides a structured group
separation as shown schematically in Figure 10. The ordered structures enable rapid
profiling and quantification. Selected representatives from compound classes are
shown in Figure 11.
CanmetENERGY–Devon
PROTECTED BUSINESS INFORMATION 14
Figure 10 – Schematic example of compound class distribution using traditional
column set combination. Meaning of symbols: a6 – 6 carbon aromatics, c5 – 5
carbon ring aliphatic, c6 – 6 carbon ring aliphatic.
CanmetENERGY–Devon
PROTECTED BUSINESS INFORMATION 15
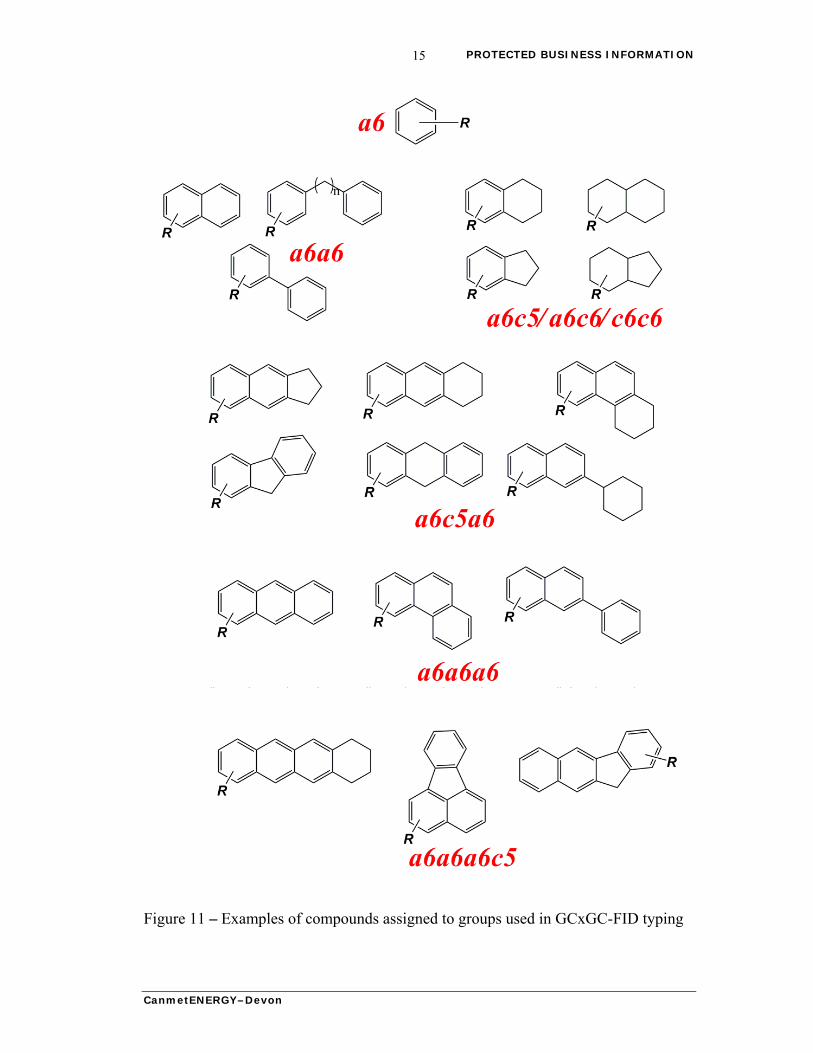
Figure 11 – Examples of compounds assigned to groups used in GCxGC-FID typing
CanmetENERGY–Devon

PROTECTED BUSINESS INFORMATION 16
All GCxGC-FID results presented in this report were based on neat (not
diluted) samples. The compound classes presented in Figure 10 and Figure 11 were
used for reporting the results of group type separations for all analyzed samples.
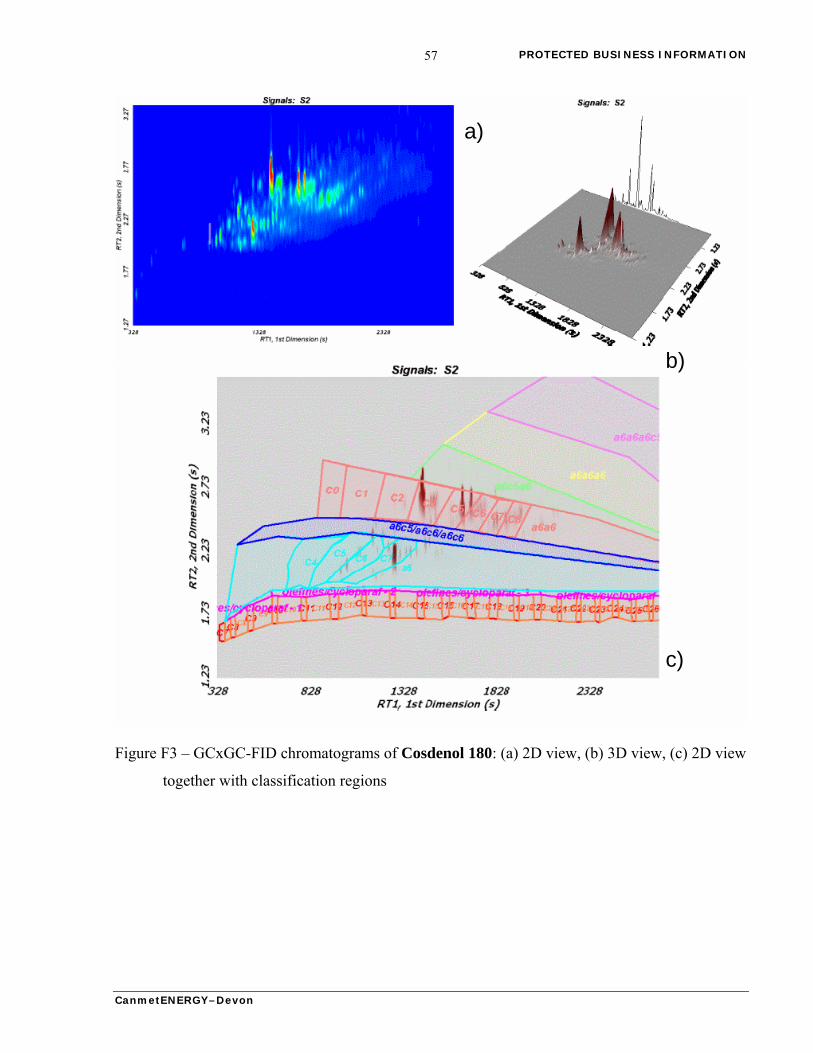
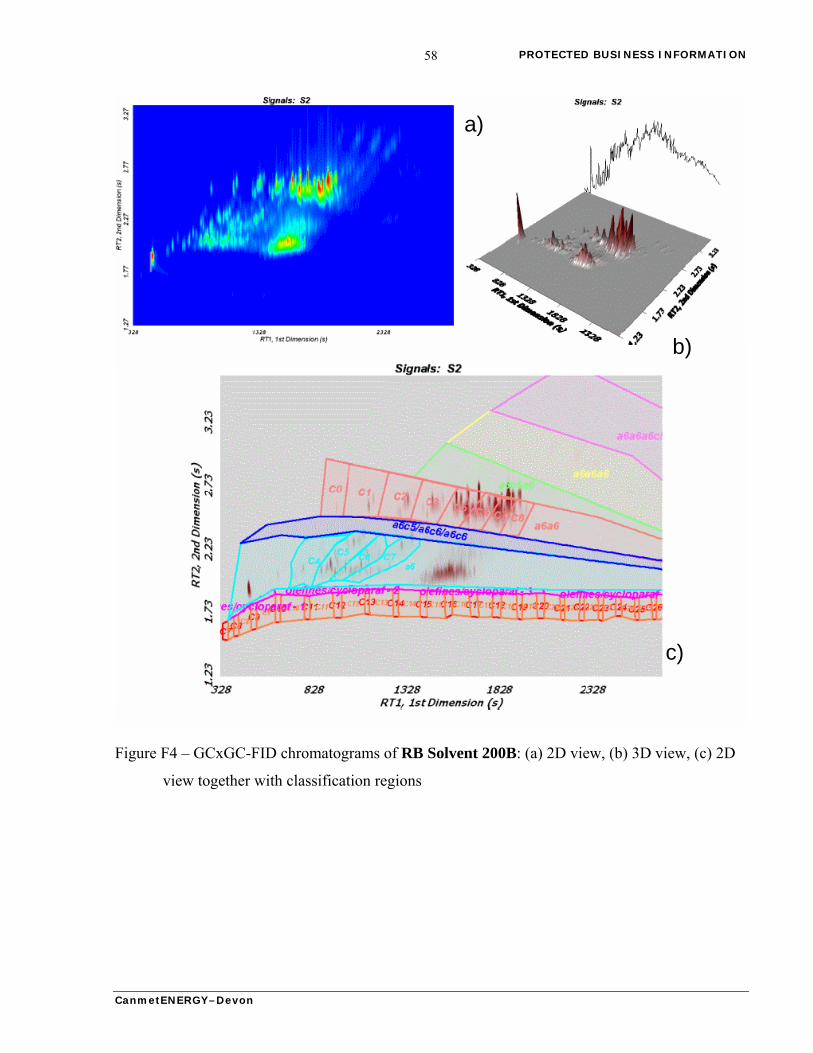
GCxGC-FID chromatograms obtained from the analysis of all four aromatic
samples are shown in Appendix F (Figures F1–F4). Retention time in the first
dimension is shown on the x-axis, and retention time in the second dimension is
shown on the y-axis. Signal intensity is illustrated on a color scale. For the first series
(Figures F1a–F4a), blue represents the baseline and red represents the most intense
peaks in the chromatogram. The second series (Figures F1b–F4b) shows two-
dimensional chromatograms together with classification regions. The third series of
pictures (Figures F1c–F4c) shows three-dimensional views of GCxGC separation.
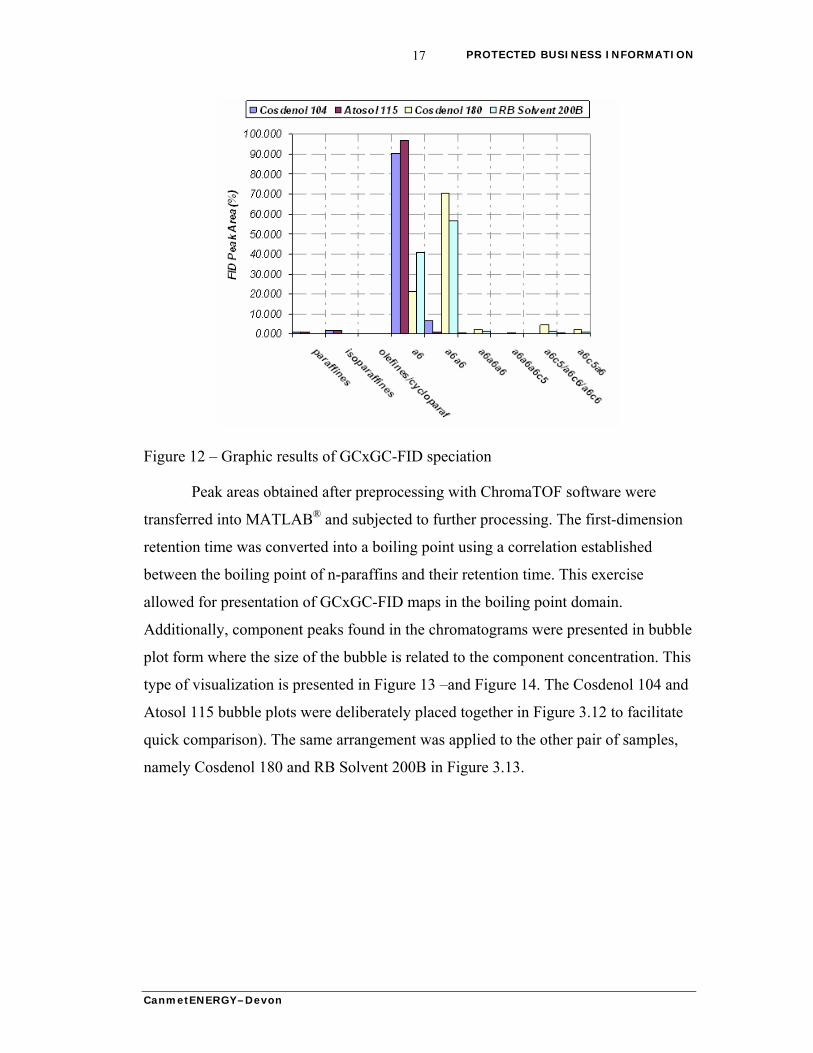
Table 3 gives detailed quantitative and structural information of group type
GCxGC-FID analysis. Figure 12 – presents the results from Table 4 in visual form.
Table 4 – Quantitative group type results of GCxGC-FID separation
Cosdenol 104 Atosol 115 Cosdenol 180 RB Solvent 200B
N-paraffins 0.622 0.534 0.082 0.023
Isoparaffins 1.711 1.512 0.003 0.057
olefins/cycloparaf 0.003 0.021 0.000 0.014
a6 a) 90.493 97.131 20.824 40.695
a6a6 6.654 0.725 70.495 56.785
a6a6a6 0.164 0.004 2.001 0.943
a6a6a6c5 0.027 0.000 0.334 0.100
a6c5/a6c6/a6c6 0.139 0.052 4.289 0.862
a6c5a6 0.186 0.020 1.972 0.522
a) Explanation of symbolic tags oin Figure 11.
CanmetENERGY–Devon
PROTECTED BUSINESS INFORMATION 17
Figure 12 – Graphic results of GCxGC-FID speciation
Peak areas obtained after preprocessing with ChromaTOF software were
transferred into MATLAB® and subjected to further processing. The first-dimension
retention time was converted into a boiling point using a correlation established
between the boiling point of n-paraffins and their retention time. This exercise
allowed for presentation of GCxGC-FID maps in the boiling point domain.
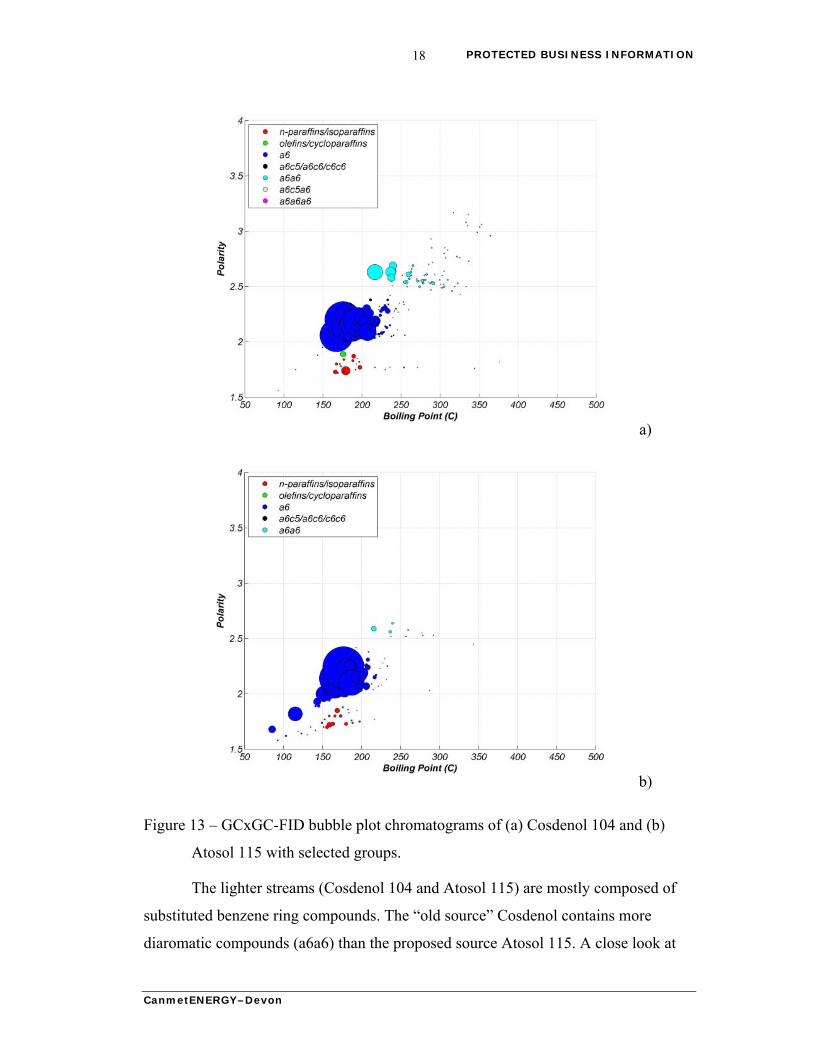
Additionally, component peaks found in the chromatograms were presented in bubble
plot form where the size of the bubble is related to the component concentration. This
type of visualization is presented in Figure 13 –and Figure 14. The Cosdenol 104 and
Atosol 115 bubble plots were deliberately placed together in Figure 3.12 to facilitate
quick comparison). The same arrangement was applied to the other pair of samples,
namely Cosdenol 180 and RB Solvent 200B in Figure 3.13.
CanmetENERGY–Devon
PROTECTED BUSINESS INFORMATION 18
a)
b)
Figure 13 – GCxGC-FID bubble plot chromatograms of (a) Cosdenol 104 and (b)
Atosol 115 with selected groups.
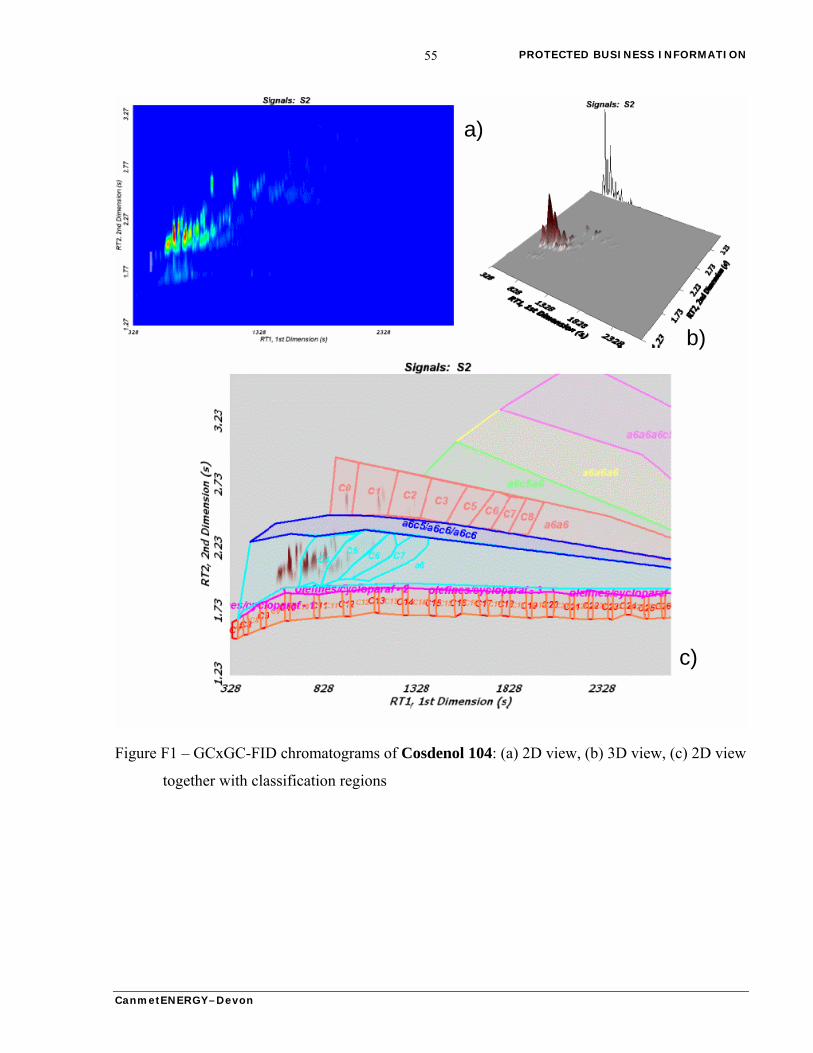
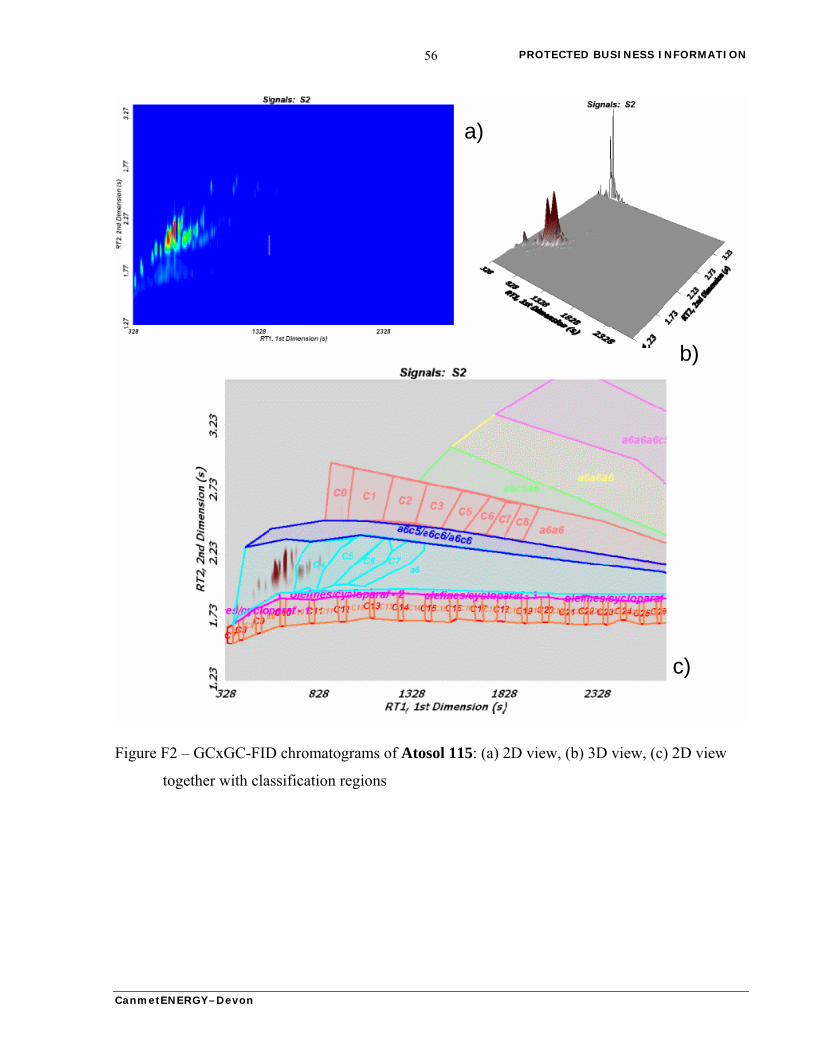
The lighter streams (Cosdenol 104 and Atosol 115) are mostly composed of
substituted benzene ring compounds. The “old source” Cosdenol contains more
diaromatic compounds (a6a6) than the proposed source Atosol 115. A close look at
CanmetENERGY–Devon
PROTECTED BUSINESS INFORMATION 19
Figure F1 and Figure F2 (in Appendix F) and the bubble plot (Figure 13 –) reveals
that the a6a6 group compounds are naphthalene and 1- and 2-methylnaphthalene.
a)
b)
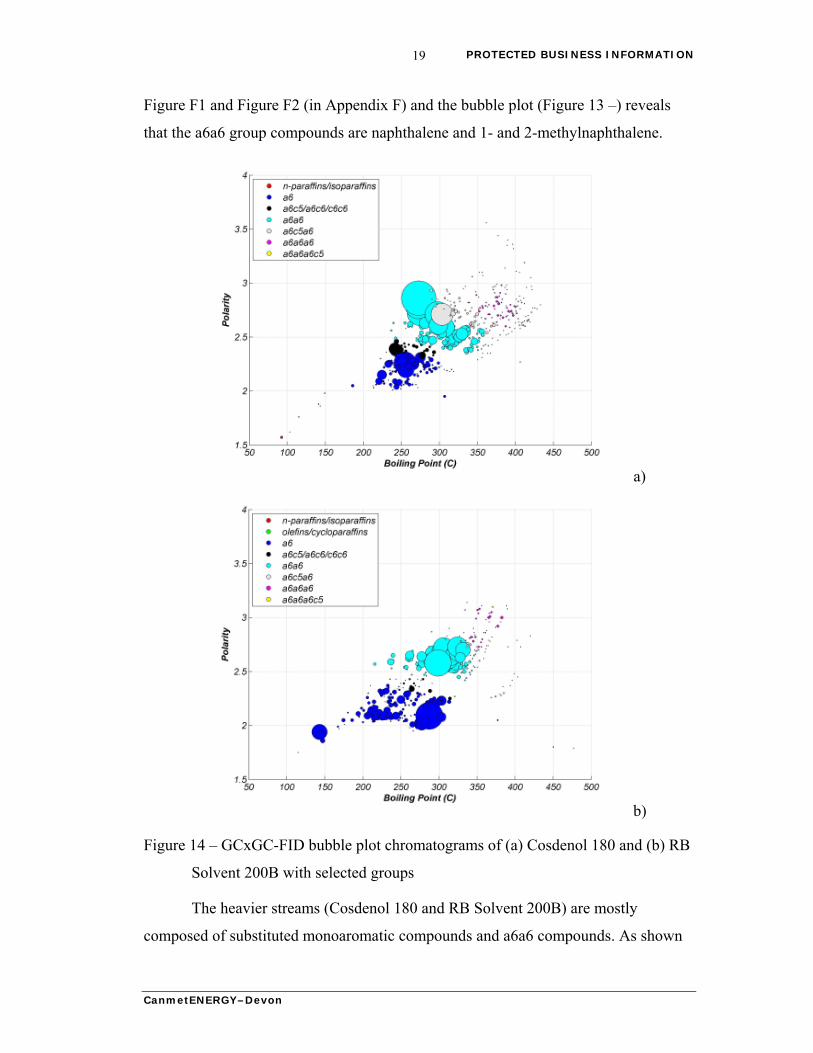
Figure 14 – GCxGC-FID bubble plot chromatograms of (a) Cosdenol 180 and (b) RB
Solvent 200B with selected groups
The heavier streams (Cosdenol 180 and RB Solvent 200B) are mostly
composed of substituted monoaromatic compounds and a6a6 compounds. As shown
CanmetENERGY–Devon
PROTECTED BUSINESS INFORMATION 20
in Figure 11, the a6a6 group could be biphenyl, naphthalene, or 1,1’-diphenylethane
derivatives. However, further GCxGC-TOFMS analysis showed that this group of
compounds is mostly composed of diphenyl alkanes.
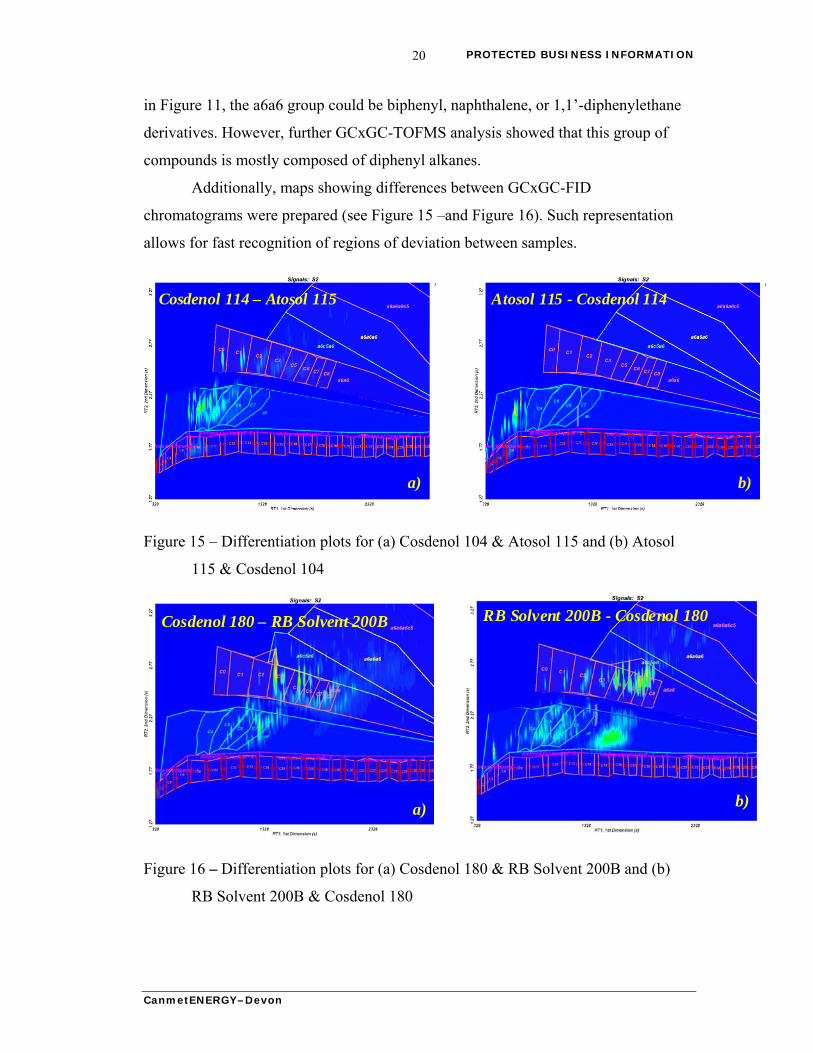
Additionally, maps showing differences between GCxGC-FID
chromatograms were prepared (see Figure 15 –and Figure 16). Such representation
allows for fast recognition of regions of deviation between samples.
Cosdenol 114 – Atosol 115 Atosol 115 - Cosdenol 114
a) b)
Cosdenol 114 – Atosol 115 Atosol 115 - Cosdenol 114
a) b)
Figure 15 – Differentiation plots for (a) Cosdenol 104 & Atosol 115 and (b) Atosol
115 & Cosdenol 104
Cosdenol 180 – RB Solvent 200B
a)
RB Solvent 200B - Cosdenol 180
b)
Cosdenol 180 – RB Solvent 200B
a)
RB Solvent 200B - Cosdenol 180
b)
RB Solvent 200B - Cosdenol 180
b)
Figure 16 – Differentiation plots for (a) Cosdenol 180 & RB Solvent 200B and (b)
RB Solvent 200B & Cosdenol 180
CanmetENERGY–Devon
PROTECTED BUSINESS INFORMATION 21
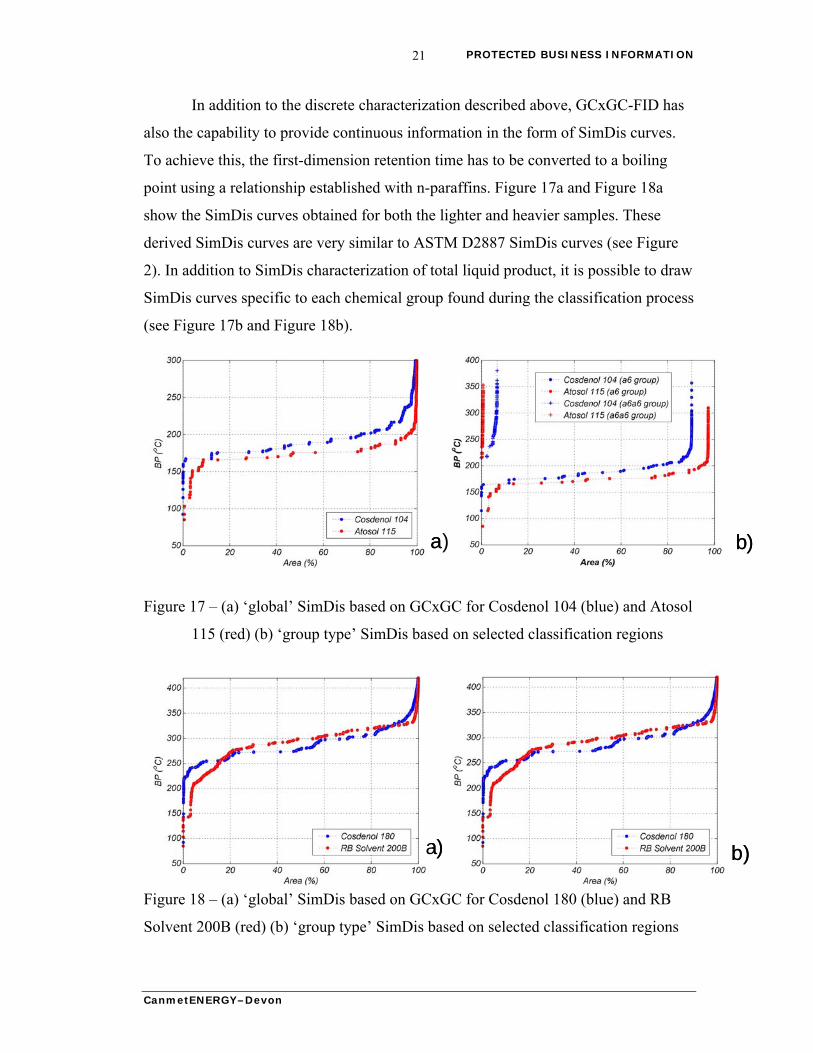
In addition to the discrete characterization described above, GCxGC-FID has
also the capability to provide continuous information in the form of SimDis curves.
To achieve this, the first-dimension retention time has to be converted to a boiling
point using a relationship established with n-paraffins. Figure 17a and Figure 18a
show the SimDis curves obtained for both the lighter and heavier samples. These
derived SimDis curves are very similar to ASTM D2887 SimDis curves (see Figure
2). In addition to SimDis characterization of total liquid product, it is possible to draw
SimDis curves specific to each chemical group found during the classification process
(see Figure 17b and Figure 18b).
a) b)a) b)
Figure 17 – (a) ‘global’ SimDis based on GCxGC for Cosdenol 104 (blue) and Atosol
115 (red) (b) ‘group type’ SimDis based on selected classification regions
a) b)a) b)
Figure 18 – (a) ‘global’ SimDis based on GCxGC for Cosdenol 180 (blue) and RB
Solvent 200B (red) (b) ‘group type’ SimDis based on selected classification regions
CanmetENERGY–Devon
PROTECTED BUSINESS INFORMATION 22
CanmetENERGY–Devon
3.4 GCXGC-TOFMS/FID
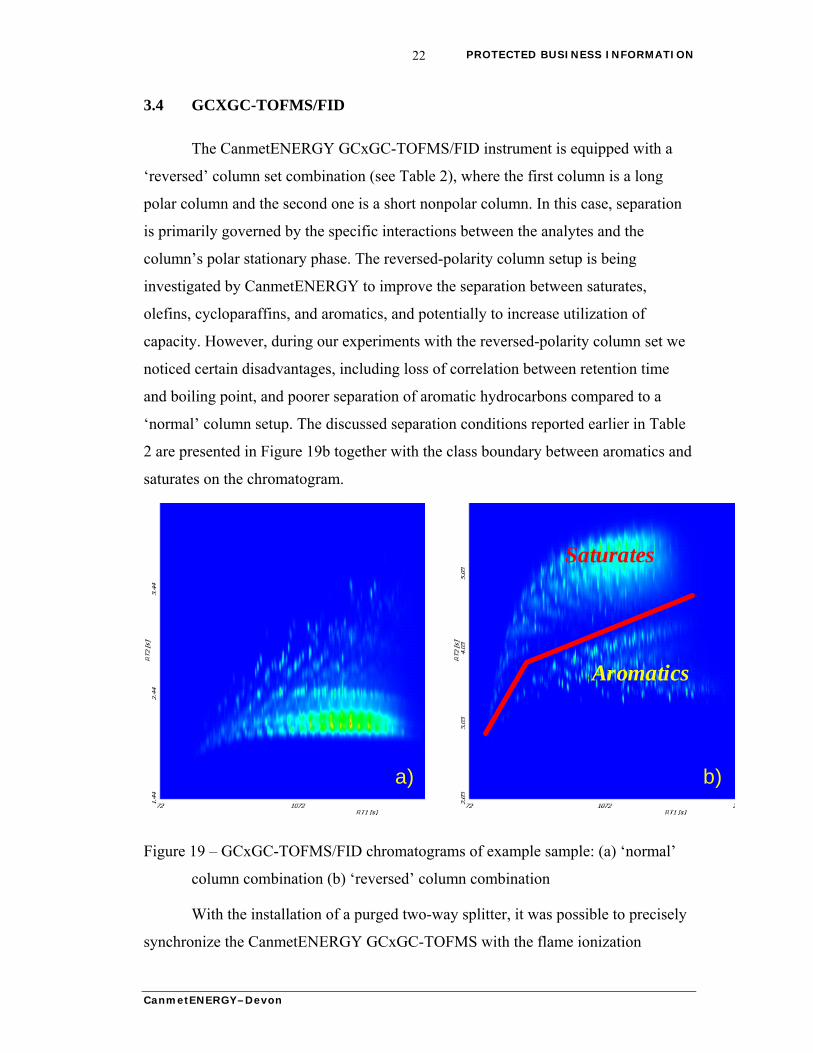
The CanmetENERGY GCxGC-TOFMS/FID instrument is equipped with a
‘reversed’ column set combination (see Table 2), where the first column is a long
polar column and the second one is a short nonpolar column. In this case, separation
is primarily governed by the specific interactions between the analytes and the
column’s polar stationary phase. The reversed-polarity column setup is being
investigated by CanmetENERGY to improve the separation between saturates,
olefins, cycloparaffins, and aromatics, and potentially to increase utilization of
capacity. However, during our experiments with the reversed-polarity column set we
noticed certain disadvantages, including loss of correlation between retention time
and boiling point, and poorer separation of aromatic hydrocarbons compared to a
‘normal’ column setup. The discussed separation conditions reported earlier in Table
2 are presented in Figure 19b together with the class boundary between aromatics and
saturates on the chromatogram.
Saturates
Aromatics
a) b)
Saturates
Aromatics
a) b)
Figure 19 – GCxGC-TOFMS/FID chromatograms of example sample: (a) ‘normal’
column combination (b) ‘reversed’ column combination
With the installation of a purged two-way splitter, it was possible to precisely
synchronize the CanmetENERGY GCxGC-TOFMS with the flame ionization
PROTECTED BUSINESS INFORMATION 23
detector to greatly enhance the reliability of both the quantitative and qualitative
results.
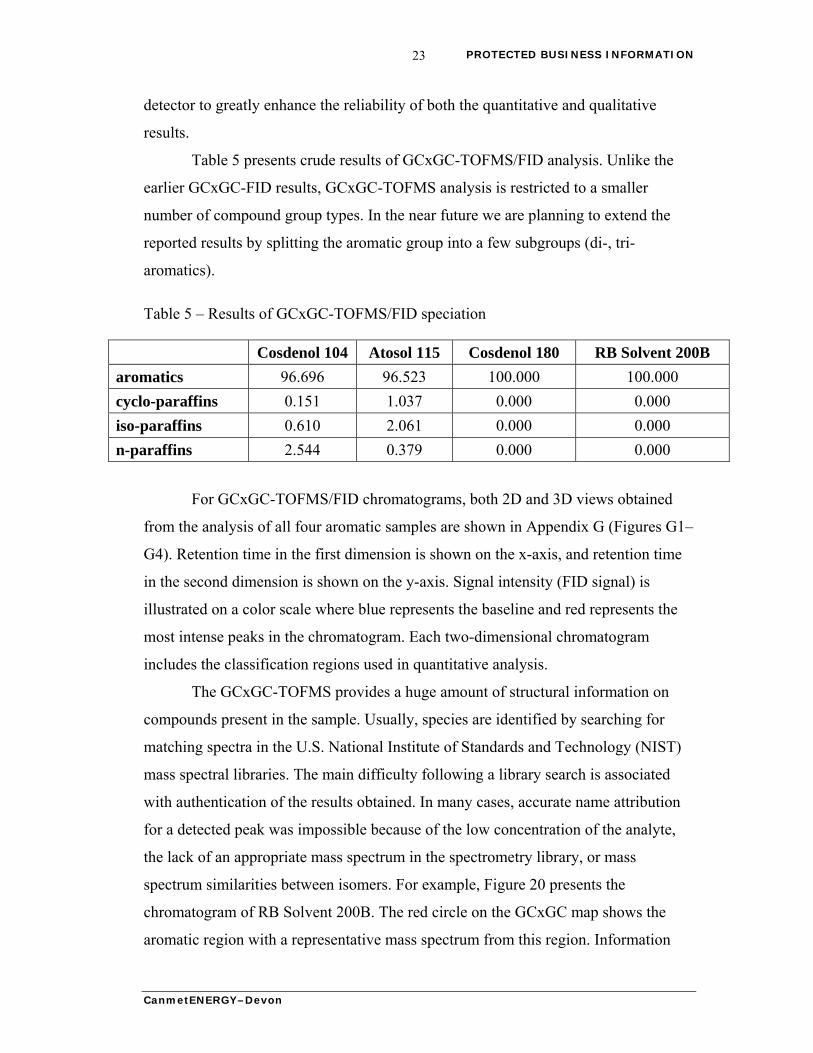
Table 5 presents crude results of GCxGC-TOFMS/FID analysis. Unlike the
earlier GCxGC-FID results, GCxGC-TOFMS analysis is restricted to a smaller
number of compound group types. In the near future we are planning to extend the
reported results by splitting the aromatic group into a few subgroups (di-, tri-
aromatics).
Table 5 – Results of GCxGC-TOFMS/FID speciation
Cosdenol 104 Atosol 115 Cosdenol 180 RB Solvent 200B
aromatics 96.696 96.523 100.000 100.000
cyclo-paraffins 0.151 1.037 0.000 0.000
iso-paraffins 0.610 2.061 0.000 0.000
n-paraffins 2.544 0.379 0.000 0.000
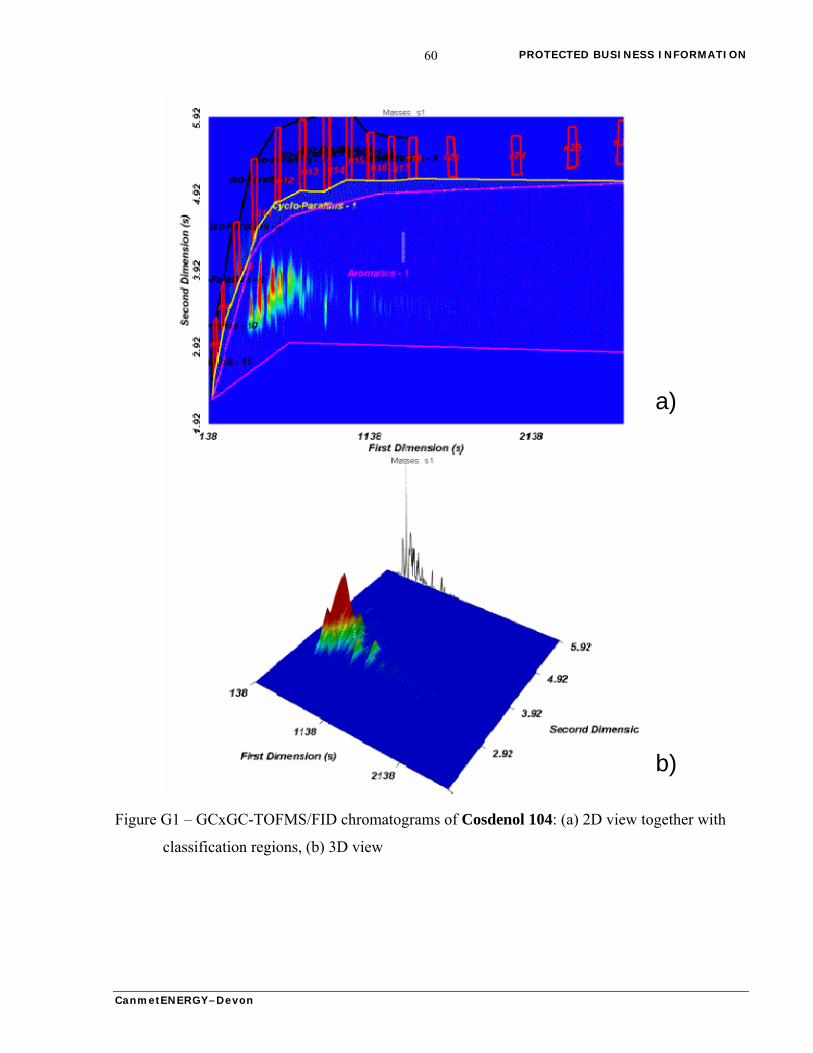
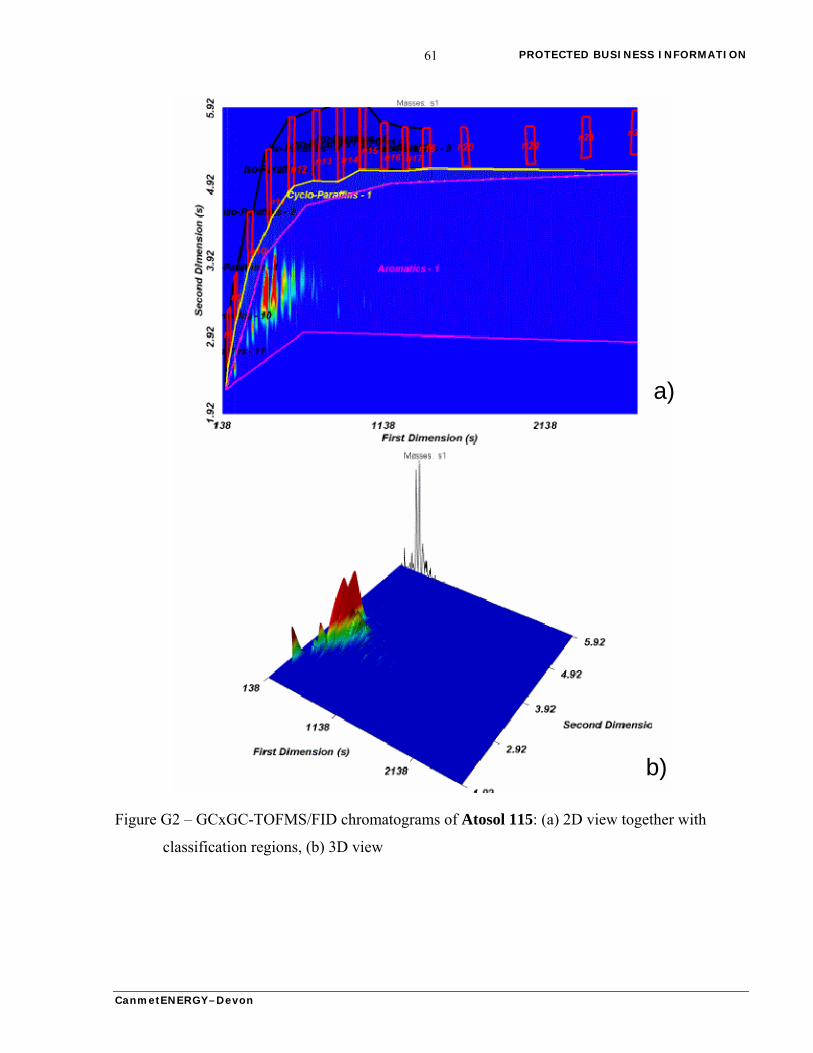
For GCxGC-TOFMS/FID chromatograms, both 2D and 3D views obtained
from the analysis of all four aromatic samples are shown in Appendix G (Figures G1–
G4). Retention time in the first dimension is shown on the x-axis, and retention time
in the second dimension is shown on the y-axis. Signal intensity (FID signal) is
illustrated on a color scale where blue represents the baseline and red represents the
most intense peaks in the chromatogram. Each two-dimensional chromatogram
includes the classification regions used in quantitative analysis.
The GCxGC-TOFMS provides a huge amount of structural information on
compounds present in the sample. Usually, species are identified by searching for
matching spectra in the U.S. National Institute of Standards and Technology (NIST)
mass spectral libraries. The main difficulty following a library search is associated
with authentication of the results obtained. In many cases, accurate name attribution
for a detected peak was impossible because of the low concentration of the analyte,
the lack of an appropriate mass spectrum in the spectrometry library, or mass
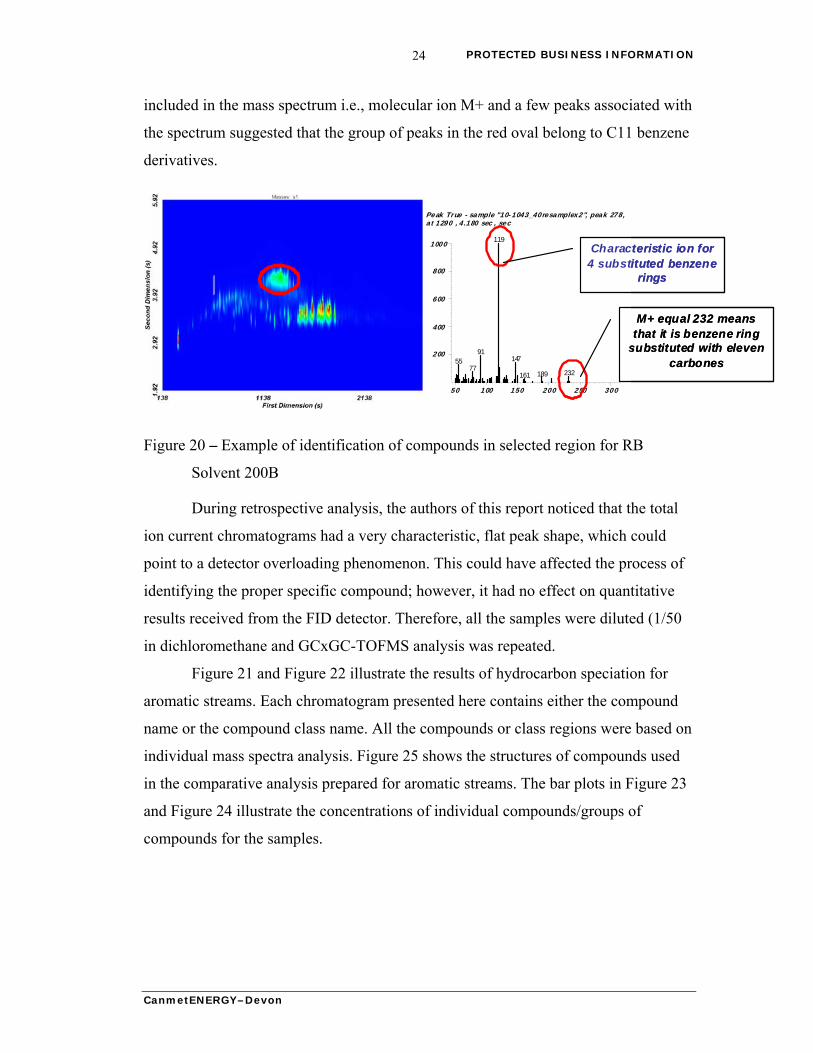
spectrum similarities between isomers. For example, Figure 20 presents the
chromatogram of RB Solvent 200B. The red circle on the GCxGC map shows the
aromatic region with a representative mass spectrum from this region. Information
CanmetENERGY–Devon
PROTECTED BUSINESS INFORMATION 24
included in the mass spectrum i.e., molecular ion M+ and a few peaks associated with
the spectrum suggested that the group of peaks in the red oval belong to C11 benzene
derivatives.
50 100 150 200 250 300
200
400
600
800
1000 119
91 147 55
77 232 189 161
Peak True - sample "10-1043_40resamplex2", peak 278, at 1290 , 4.180 sec , sec
M+ equal 232 means that it is benzene ring
substituted with eleven carbones
Characteristic ion for 4 substituted benzene
rings
50 100 150 200 250 300
200
400
600
800
1000 119
91 147 55
77 232 189 161
Peak True - sample "10-1043_40resamplex2", peak 278, at 1290 , 4.180 sec , sec
M+ equal 232 means that it is benzene ring
substituted with eleven carbones
Characteristic ion for 4 substituted benzene
rings
Figure 20 – Example of identification of compounds in selected region for RB
Solvent 200B
During retrospective analysis, the authors of this report noticed that the total
ion current chromatograms had a very characteristic, flat peak shape, which could
point to a detector overloading phenomenon. This could have affected the process of
identifying the proper specific compound; however, it had no effect on quantitative
results received from the FID detector. Therefore, all the samples were diluted (1/50
in dichloromethane and GCxGC-TOFMS analysis was repeated.
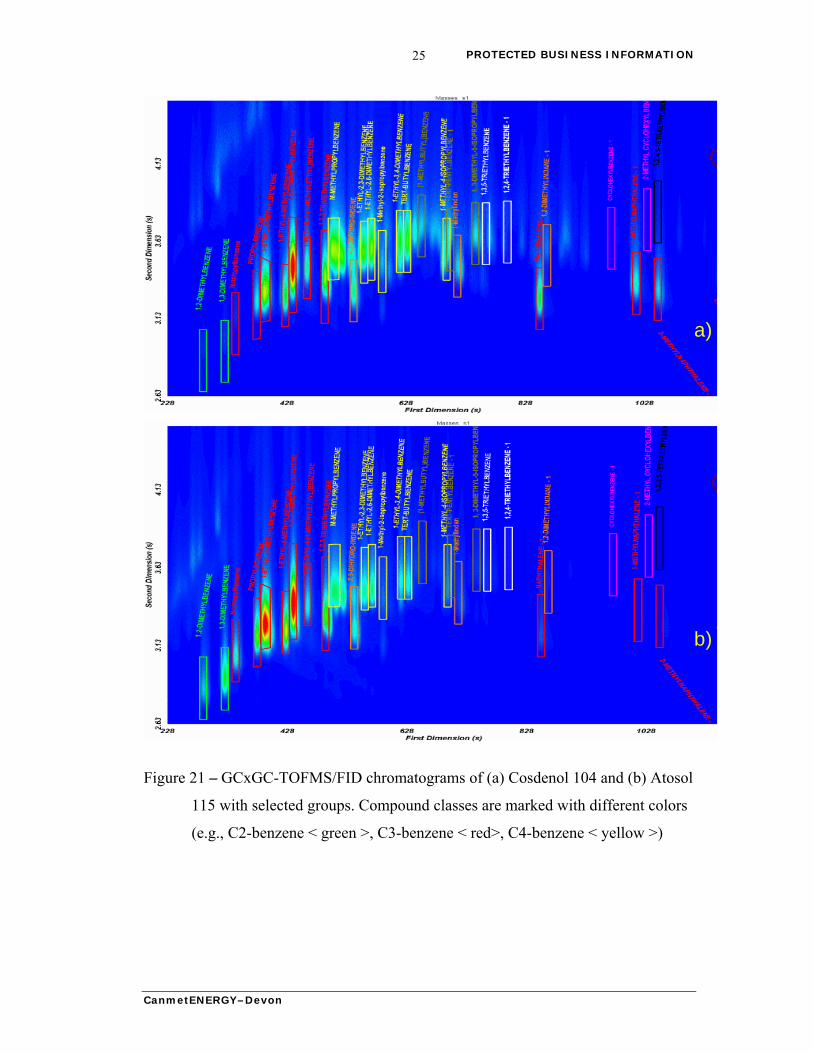
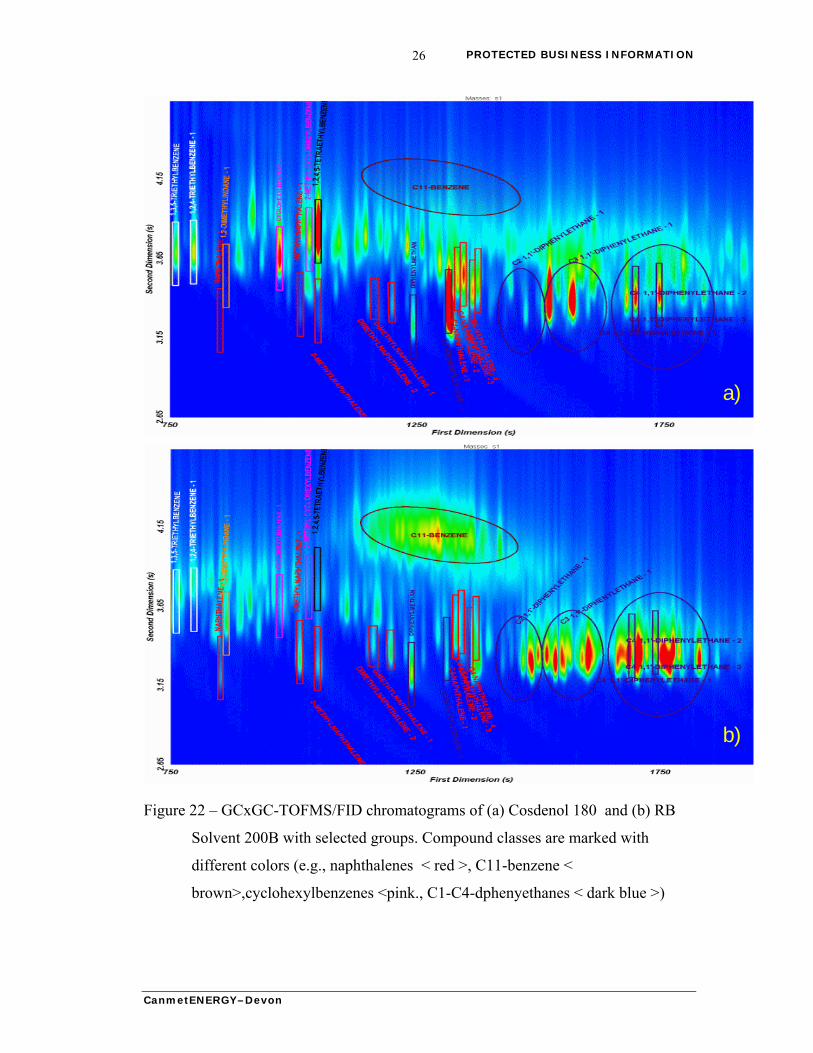
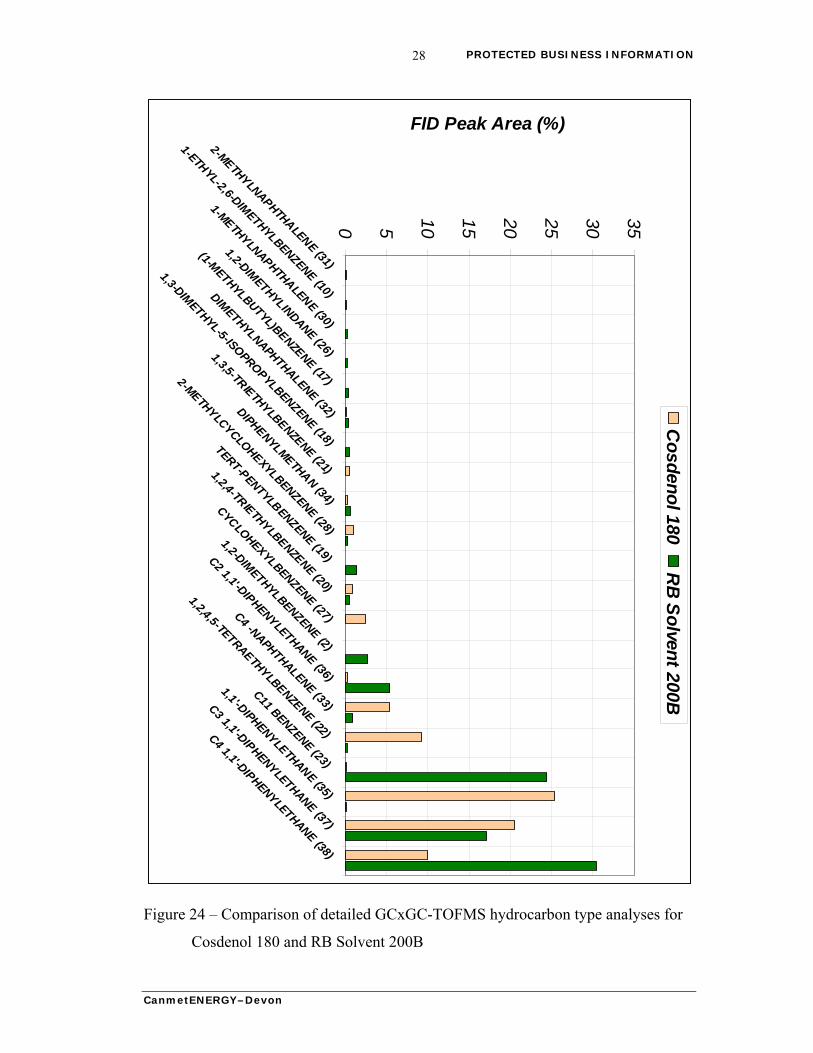
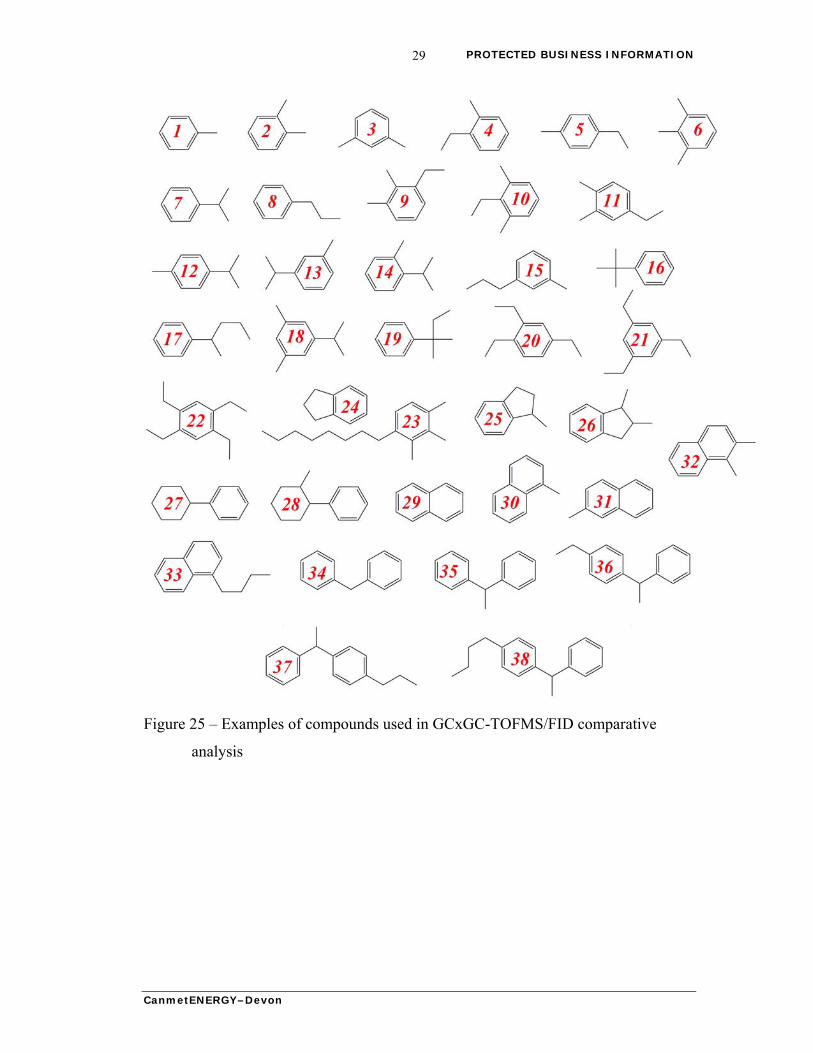
Figure 21 and Figure 22 illustrate the results of hydrocarbon speciation for
aromatic streams. Each chromatogram presented here contains either the compound
name or the compound class name. All the compounds or class regions were based on
individual mass spectra analysis. Figure 25 shows the structures of compounds used
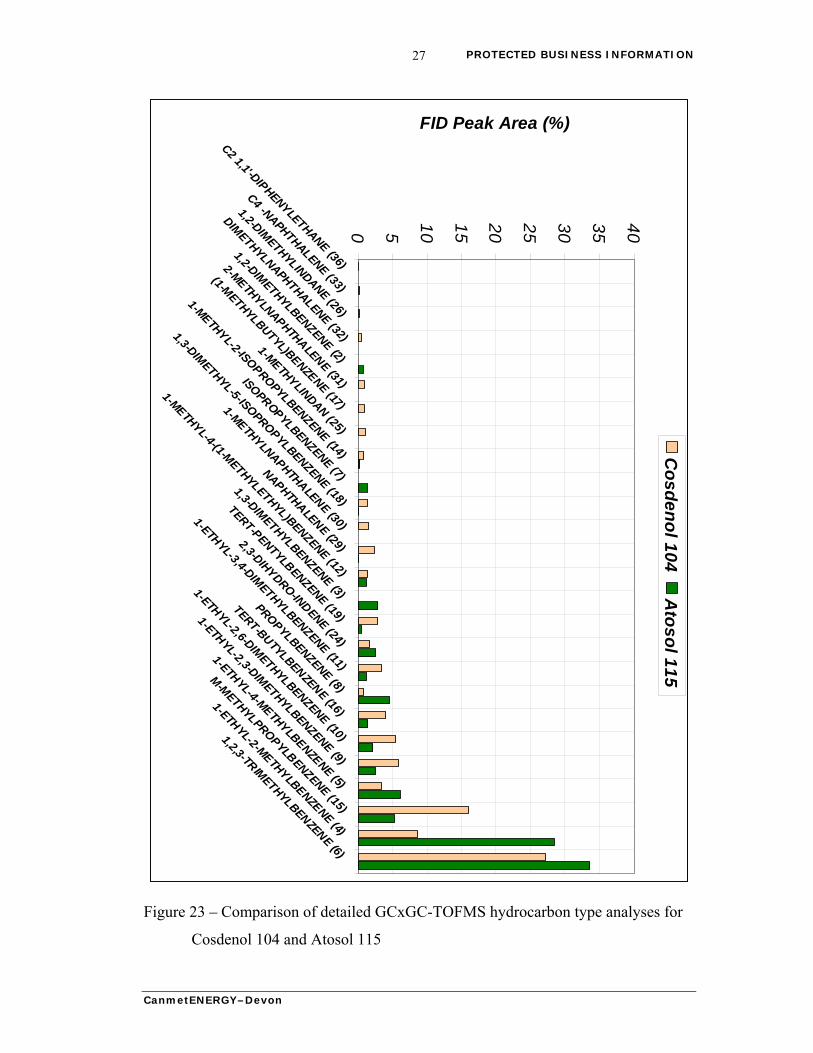
in the comparative analysis prepared for aromatic streams. The bar plots in Figure 23
and Figure 24 illustrate the concentrations of individual compounds/groups of
compounds for the samples.
CanmetENERGY–Devon
PROTECTED BUSINESS INFORMATION 25
a)
b)
a)
b)
Figure 21 – GCxGC-TOFMS/FID chromatograms of (a) Cosdenol 104 and (b) Atosol
115 with selected groups. Compound classes are marked with different colors
(e.g., C2-benzene < green >, C3-benzene < red>, C4-benzene < yellow >)
CanmetENERGY–Devon
PROTECTED BUSINESS INFORMATION 26
a)
b)
a)
b)
Figure 22 – GCxGC-TOFMS/FID chromatograms of (a) Cosdenol 180 and (b) RB
Solvent 200B with selected groups. Compound classes are marked with
different colors (e.g., naphthalenes < red >, C11-benzene <
brown>,cyclohexylbenzenes <pink., C1-C4-dphenyethanes < dark blue >)
CanmetENERGY–Devon
PROTECTED BUSINESS INFORMATION 27
CanmetENERGY–Devon
Figure 23 – Comparison of detailed GCxGC-TOFMS hydrocarbon type analyses for
Cosdenol 104 and Atosol 115
0 5
10
15
20
25
30
35
40
C2 1,1'-DIPHENYLETHANE (36)
C4 -NAPHTHALENE (33)
1,2-DIMETHYLINDANE (26)
DIMETHYLNAPHTHALENE (32)
1,2-DIMETHYLBENZENE (2)
2-METHYLNAPHTHALENE (31)
(1-METHYLBUTYL)BENZENE (17)
1-METHYLINDAN (25)
1-METHYL-2-ISOPROPYLBENZENE (14)
ISOPROPYLBENZENE (7)
1,3-DIMETHYL-5-ISOPROPYLBENZENE (18)
1-METHYLNAPHTHALENE (30)
NAPHTHALENE (29)
1-METHYL-4-(1-METHYLETHYL)BENZENE (12)
1,3-DIMETHYLBENZENE (3)
TERT-PENTYLBENZENE (19)
2,3-DIHYDRO-INDENE (24)
1-ETHYL-3,4-DIM
ETHYLBENZENE (11)
PROPYLBENZENE (8)
TERT-BUTYLBENZENE (16)
1-ETHYL-2,6-DIMETHYLBENZENE (10)
1-ETHYL-2,3-DIM
ETHYLBENZENE (9)
1-ETHYL-4-METHYLBENZENE (5)
M-M
ETHYLPROPYLBENZENE (15)
1-ETHYL-2-METHYLBENZENE (4)
1,2,3-TRIM
ETHYLBENZENE (6)
FID Peak Area (%)C
os
de
no
l 10
4A
tos
ol 1
15
PROTECTED BUSINESS INFORMATION 28
CanmetENERGY–Devon
Figure 24 – Comparison of detailed GCxGC-TOFMS hydrocarbon type analyses for
Cosdenol 180 and RB Solvent 200B
0 5 10 15 20 25 30 35
2-METHYLNAPHTHALEN
E (31)
1-ETHYL-2,6-DIMETHYLBENZENE (10)
1-METHYLNAPHTHALENE (30)
1,2-DIMETHYLINDANE (26)
(1-METHYLBUTYL)BENZENE (17)
DIMETHYLNAPHTHALENE (32)
1,3-DIMETHYL-5-ISOPRO
PYLBENZENE (18)
1,3,5-TRIETHYLBENZENE (21)
DIPHENYLMETHA
N (34)
2-METHYLCYCLOHEXYLBENZENE (28)
TERT-PENTYLBENZENE (19)
1,2,4-TRIETHYLBENZENE (20)
CYCLOHEXYLBENZENE (27)
1,2-DIMETHYLBENZENE (2)
C2 1,1'-DIPHENYLETHANE (36)
C4 -NAPHTHALENE (33)
1,2,4,5-TETRAETHYLBENZENE (22)
C11 BENZENE (23)
1,1'-DIPHENYLETHANE (35)
C3 1,1'-DIPHENYLETHANE (37)
C4 1,1'-DIPHENYLETHANE (38)
FID Peak Area (%)C
osd
eno
l 180R
B S
olven
t 200B
PROTECTED BUSINESS INFORMATION 29
Figure 25 – Examples of compounds used in GCxGC-TOFMS/FID comparative
analysis
CanmetENERGY–Devon
PROTECTED BUSINESS INFORMATION 30
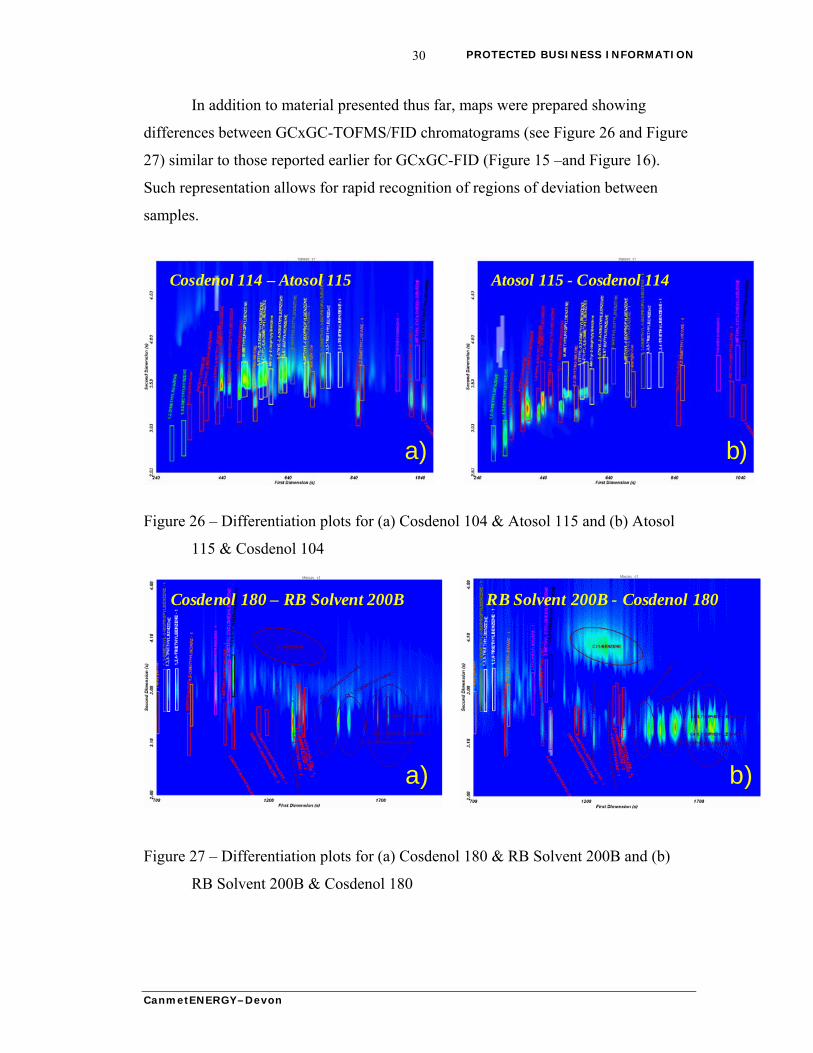
In addition to material presented thus far, maps were prepared showing
differences between GCxGC-TOFMS/FID chromatograms (see Figure 26 and Figure
27) similar to those reported earlier for GCxGC-FID (Figure 15 –and Figure 16).
Such representation allows for rapid recognition of regions of deviation between
samples.
Cosdenol 114 – Atosol 115 Atosol 115 - Cosdenol 114
a) b)
Cosdenol 114 – Atosol 115 Atosol 115 - Cosdenol 114
a) b)
Figure 26 – Differentiation plots for (a) Cosdenol 104 & Atosol 115 and (b) Atosol
115 & Cosdenol 104
Cosdenol 180 – RB Solvent 200B RB Solvent 200B - Cosdenol 180
a) b)
Cosdenol 180 – RB Solvent 200B RB Solvent 200B - Cosdenol 180
a) b)
Figure 27 – Differentiation plots for (a) Cosdenol 180 & RB Solvent 200B and (b)
RB Solvent 200B & Cosdenol 180
CanmetENERGY–Devon
PROTECTED BUSINESS INFORMATION 31
4.0 ACKNOWLEDGEMENTS
The authors would like to acknowledge partial funding from the Government
of Canada’s Interdepartmental Program of Energy Research and Development, PERD
1.1.3. Petroleum Conversion for Cleaner Air.
CanmetENERGY–Devon
PROTECTED BUSINESS INFORMATION 32
APPENDIX A: SIMDIS ASTM D2887
CanmetENERGY–Devon
PROTECTED BUSINESS INFORMATION 33
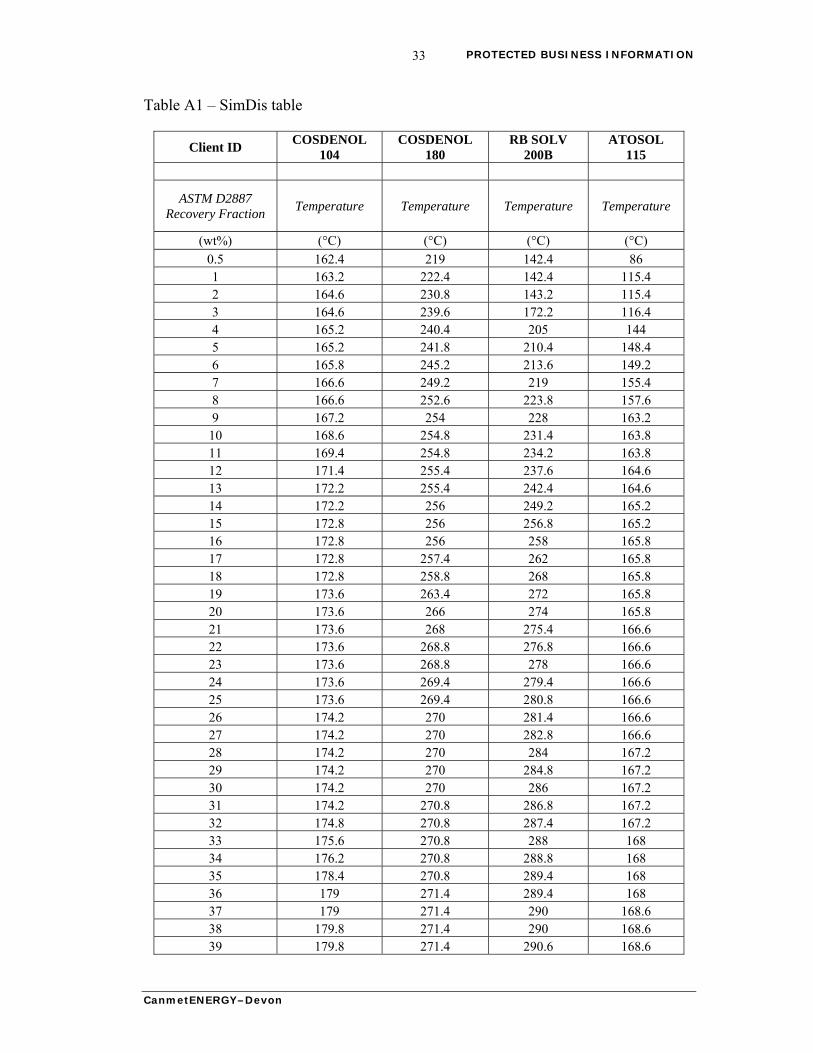
Table A1 – SimDis table
Client ID COSDENOL
104 COSDENOL
180 RB SOLV
200B ATOSOL
115
ASTM D2887 Recovery Fraction
Temperature Temperature Temperature Temperature
(wt%) (°C) (°C) (°C) (°C)
0.5 162.4 219 142.4 86 1 163.2 222.4 142.4 115.4 2 164.6 230.8 143.2 115.4 3 164.6 239.6 172.2 116.4 4 165.2 240.4 205 144 5 165.2 241.8 210.4 148.4 6 165.8 245.2 213.6 149.2 7 166.6 249.2 219 155.4 8 166.6 252.6 223.8 157.6 9 167.2 254 228 163.2
10 168.6 254.8 231.4 163.8 11 169.4 254.8 234.2 163.8 12 171.4 255.4 237.6 164.6 13 172.2 255.4 242.4 164.6 14 172.2 256 249.2 165.2 15 172.8 256 256.8 165.2 16 172.8 256 258 165.8 17 172.8 257.4 262 165.8 18 172.8 258.8 268 165.8 19 173.6 263.4 272 165.8 20 173.6 266 274 165.8 21 173.6 268 275.4 166.6 22 173.6 268.8 276.8 166.6 23 173.6 268.8 278 166.6 24 173.6 269.4 279.4 166.6 25 173.6 269.4 280.8 166.6 26 174.2 270 281.4 166.6 27 174.2 270 282.8 166.6 28 174.2 270 284 167.2 29 174.2 270 284.8 167.2 30 174.2 270 286 167.2 31 174.2 270.8 286.8 167.2 32 174.8 270.8 287.4 167.2 33 175.6 270.8 288 168 34 176.2 270.8 288.8 168 35 178.4 270.8 289.4 168 36 179 271.4 289.4 168 37 179 271.4 290 168.6 38 179.8 271.4 290 168.6 39 179.8 271.4 290.6 168.6
CanmetENERGY–Devon
PROTECTED BUSINESS INFORMATION 34
CanmetENERGY–Devon
Client ID COSDENOL
104 COSDENOL
180 RB SOLV
200B ATOSOL
115
ASTM D2887 Recovery Fraction
Temperature Temperature Temperature Temperature
(wt%) (°C) (°C) (°C) (°C)
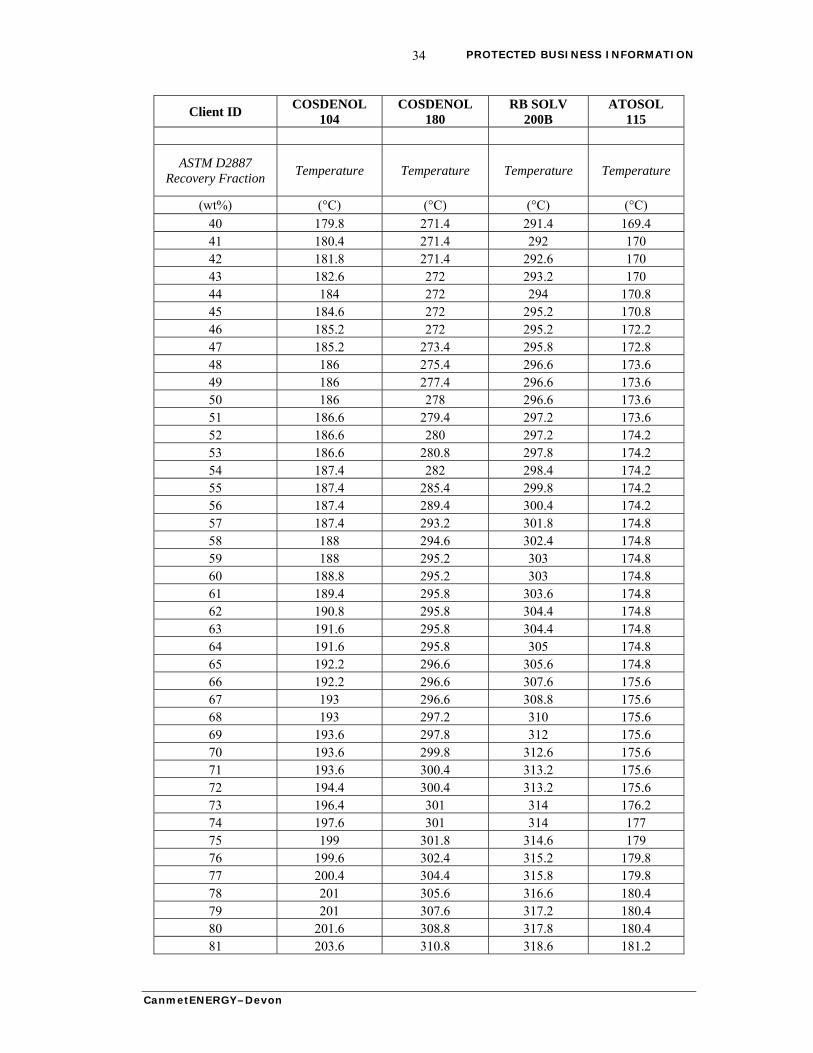
40 179.8 271.4 291.4 169.4 41 180.4 271.4 292 170 42 181.8 271.4 292.6 170 43 182.6 272 293.2 170 44 184 272 294 170.8 45 184.6 272 295.2 170.8 46 185.2 272 295.2 172.2 47 185.2 273.4 295.8 172.8 48 186 275.4 296.6 173.6 49 186 277.4 296.6 173.6 50 186 278 296.6 173.6 51 186.6 279.4 297.2 173.6 52 186.6 280 297.2 174.2 53 186.6 280.8 297.8 174.2 54 187.4 282 298.4 174.2 55 187.4 285.4 299.8 174.2 56 187.4 289.4 300.4 174.2 57 187.4 293.2 301.8 174.8 58 188 294.6 302.4 174.8 59 188 295.2 303 174.8 60 188.8 295.2 303 174.8 61 189.4 295.8 303.6 174.8 62 190.8 295.8 304.4 174.8 63 191.6 295.8 304.4 174.8 64 191.6 295.8 305 174.8 65 192.2 296.6 305.6 174.8 66 192.2 296.6 307.6 175.6 67 193 296.6 308.8 175.6 68 193 297.2 310 175.6 69 193.6 297.8 312 175.6 70 193.6 299.8 312.6 175.6 71 193.6 300.4 313.2 175.6 72 194.4 300.4 313.2 175.6 73 196.4 301 314 176.2 74 197.6 301 314 177 75 199 301.8 314.6 179 76 199.6 302.4 315.2 179.8 77 200.4 304.4 315.8 179.8 78 201 305.6 316.6 180.4 79 201 307.6 317.2 180.4 80 201.6 308.8 317.8 180.4 81 203.6 310.8 318.6 181.2
PROTECTED BUSINESS INFORMATION 35
CanmetENERGY–Devon
Client ID COSDENOL
104 COSDENOL
180 RB SOLV
200B ATOSOL
115
ASTM D2887 Recovery Fraction
Temperature Temperature Temperature Temperature
(wt%) (°C) (°C) (°C) (°C)
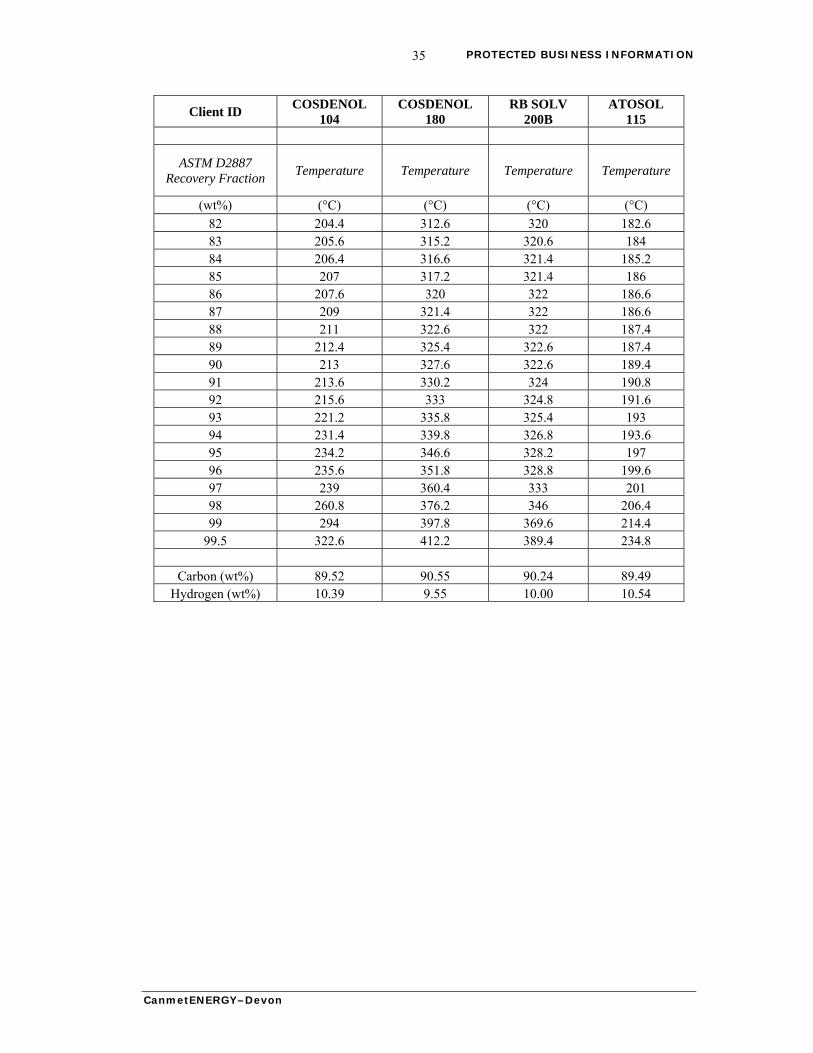
82 204.4 312.6 320 182.6 83 205.6 315.2 320.6 184 84 206.4 316.6 321.4 185.2 85 207 317.2 321.4 186 86 207.6 320 322 186.6 87 209 321.4 322 186.6 88 211 322.6 322 187.4 89 212.4 325.4 322.6 187.4 90 213 327.6 322.6 189.4 91 213.6 330.2 324 190.8 92 215.6 333 324.8 191.6 93 221.2 335.8 325.4 193 94 231.4 339.8 326.8 193.6 95 234.2 346.6 328.2 197 96 235.6 351.8 328.8 199.6 97 239 360.4 333 201 98 260.8 376.2 346 206.4 99 294 397.8 369.6 214.4
99.5 322.6 412.2 389.4 234.8
Carbon (wt%) 89.52 90.55 90.24 89.49 Hydrogen (wt%) 10.39 9.55 10.00 10.54

PROTECTED BUSINESS INFORMATION 36
APPENDIX B: PIONA DATA
CanmetENERGY–Devon
PROTECTED BUSINESS INFORMATION 37
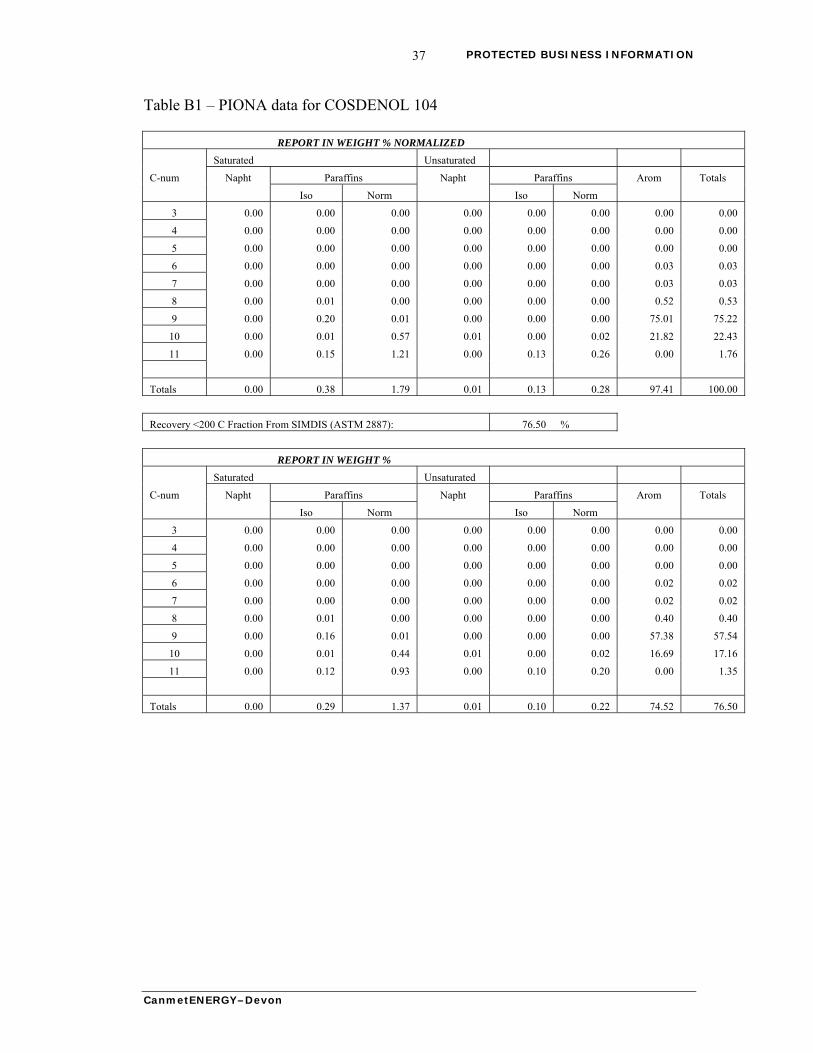
Table B1 – PIONA data for COSDENOL 104
REPORT IN WEIGHT % NORMALIZED
Saturated Unsaturated
C-num Napht Paraffins Napht Paraffins Arom Totals
Iso Norm Iso Norm
3 0.00 0.00 0.00 0.00 0.00 0.00 0.00 0.00
4 0.00 0.00 0.00 0.00 0.00 0.00 0.00 0.00
5 0.00 0.00 0.00 0.00 0.00 0.00 0.00 0.00
6 0.00 0.00 0.00 0.00 0.00 0.00 0.03 0.03
7 0.00 0.00 0.00 0.00 0.00 0.00 0.03 0.03
8 0.00 0.01 0.00 0.00 0.00 0.00 0.52 0.53
9 0.00 0.20 0.01 0.00 0.00 0.00 75.01 75.22
10 0.00 0.01 0.57 0.01 0.00 0.02 21.82 22.43
11 0.00 0.15 1.21 0.00 0.13 0.26 0.00 1.76
Totals 0.00 0.38 1.79 0.01 0.13 0.28 97.41 100.00
Recovery <200 C Fraction From SIMDIS (ASTM 2887): 76.50 %
REPORT IN WEIGHT %
Saturated Unsaturated
C-num Napht Paraffins Napht Paraffins Arom Totals
Iso Norm Iso Norm
3 0.00 0.00 0.00 0.00 0.00 0.00 0.00 0.00
4 0.00 0.00 0.00 0.00 0.00 0.00 0.00 0.00
5 0.00 0.00 0.00 0.00 0.00 0.00 0.00 0.00
6 0.00 0.00 0.00 0.00 0.00 0.00 0.02 0.02
7 0.00 0.00 0.00 0.00 0.00 0.00 0.02 0.02
8 0.00 0.01 0.00 0.00 0.00 0.00 0.40 0.40
9 0.00 0.16 0.01 0.00 0.00 0.00 57.38 57.54
10 0.00 0.01 0.44 0.01 0.00 0.02 16.69 17.16
11 0.00 0.12 0.93 0.00 0.10 0.20 0.00 1.35
Totals 0.00 0.29 1.37 0.01 0.10 0.22 74.52 76.50
CanmetENERGY–Devon
PROTECTED BUSINESS INFORMATION 38
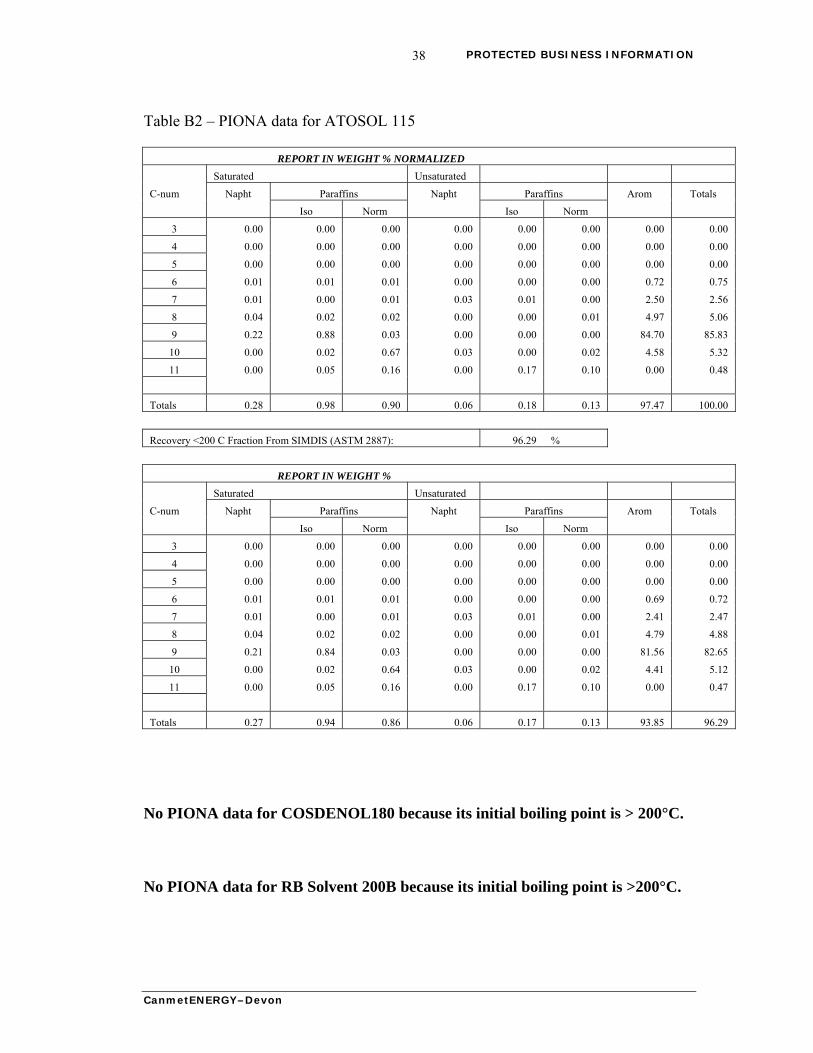
Table B2 – PIONA data for ATOSOL 115
REPORT IN WEIGHT % NORMALIZED
Saturated Unsaturated
C-num Napht Paraffins Napht Paraffins Arom Totals
Iso Norm Iso Norm
3 0.00 0.00 0.00 0.00 0.00 0.00 0.00 0.00
4 0.00 0.00 0.00 0.00 0.00 0.00 0.00 0.00
5 0.00 0.00 0.00 0.00 0.00 0.00 0.00 0.00
6 0.01 0.01 0.01 0.00 0.00 0.00 0.72 0.75
7 0.01 0.00 0.01 0.03 0.01 0.00 2.50 2.56
8 0.04 0.02 0.02 0.00 0.00 0.01 4.97 5.06
9 0.22 0.88 0.03 0.00 0.00 0.00 84.70 85.83
10 0.00 0.02 0.67 0.03 0.00 0.02 4.58 5.32
11 0.00 0.05 0.16 0.00 0.17 0.10 0.00 0.48
Totals 0.28 0.98 0.90 0.06 0.18 0.13 97.47 100.00
Recovery <200 C Fraction From SIMDIS (ASTM 2887): 96.29 %
REPORT IN WEIGHT %
Saturated Unsaturated
C-num Napht Paraffins Napht Paraffins Arom Totals
Iso Norm Iso Norm
3 0.00 0.00 0.00 0.00 0.00 0.00 0.00 0.00
4 0.00 0.00 0.00 0.00 0.00 0.00 0.00 0.00
5 0.00 0.00 0.00 0.00 0.00 0.00 0.00 0.00
6 0.01 0.01 0.01 0.00 0.00 0.00 0.69 0.72
7 0.01 0.00 0.01 0.03 0.01 0.00 2.41 2.47
8 0.04 0.02 0.02 0.00 0.00 0.01 4.79 4.88
9 0.21 0.84 0.03 0.00 0.00 0.00 81.56 82.65
10 0.00 0.02 0.64 0.03 0.00 0.02 4.41 5.12
11 0.00 0.05 0.16 0.00 0.17 0.10 0.00 0.47
Totals 0.27 0.94 0.86 0.06 0.17 0.13 93.85 96.29
No PIONA data for COSDENOL180 because its initial boiling point is > 200°C. No PIONA data for RB Solvent 200B because its initial boiling point is >200°C.
CanmetENERGY–Devon
PROTECTED BUSINESS INFORMATION 39
APPENDIX C: DHA DATA
CanmetENERGY–Devon
PROTECTED BUSINESS INFORMATION 40
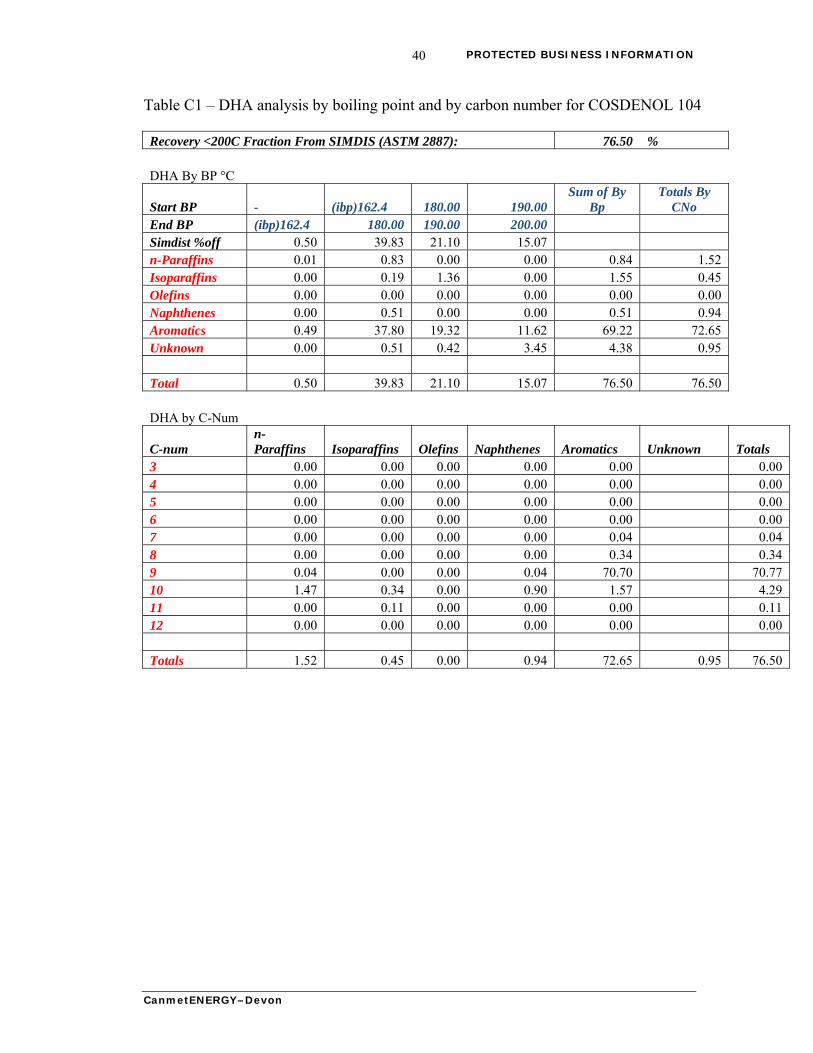
Table C1 – DHA analysis by boiling point and by carbon number for COSDENOL 104
Recovery <200C Fraction From SIMDIS (ASTM 2887): 76.50 % DHA By BP °C
Start BP - (ibp)162.4 180.00 190.00 Sum of By
Bp Totals By
CNo End BP (ibp)162.4 180.00 190.00 200.00 Simdist %off 0.50 39.83 21.10 15.07 n-Paraffins 0.01 0.83 0.00 0.00 0.84 1.52 Isoparaffins 0.00 0.19 1.36 0.00 1.55 0.45 Olefins 0.00 0.00 0.00 0.00 0.00 0.00 Naphthenes 0.00 0.51 0.00 0.00 0.51 0.94 Aromatics 0.49 37.80 19.32 11.62 69.22 72.65 Unknown 0.00 0.51 0.42 3.45 4.38 0.95 Total 0.50 39.83 21.10 15.07 76.50 76.50 DHA by C-Num
C-num n-Paraffins Isoparaffins Olefins Naphthenes Aromatics Unknown Totals
3 0.00 0.00 0.00 0.00 0.00 0.00 4 0.00 0.00 0.00 0.00 0.00 0.00 5 0.00 0.00 0.00 0.00 0.00 0.00 6 0.00 0.00 0.00 0.00 0.00 0.00 7 0.00 0.00 0.00 0.00 0.04 0.04 8 0.00 0.00 0.00 0.00 0.34 0.34 9 0.04 0.00 0.00 0.04 70.70 70.77 10 1.47 0.34 0.00 0.90 1.57 4.29 11 0.00 0.11 0.00 0.00 0.00 0.11 12 0.00 0.00 0.00 0.00 0.00 0.00 Totals 1.52 0.45 0.00 0.94 72.65 0.95 76.50
CanmetENERGY–Devon
PROTECTED BUSINESS INFORMATION 41
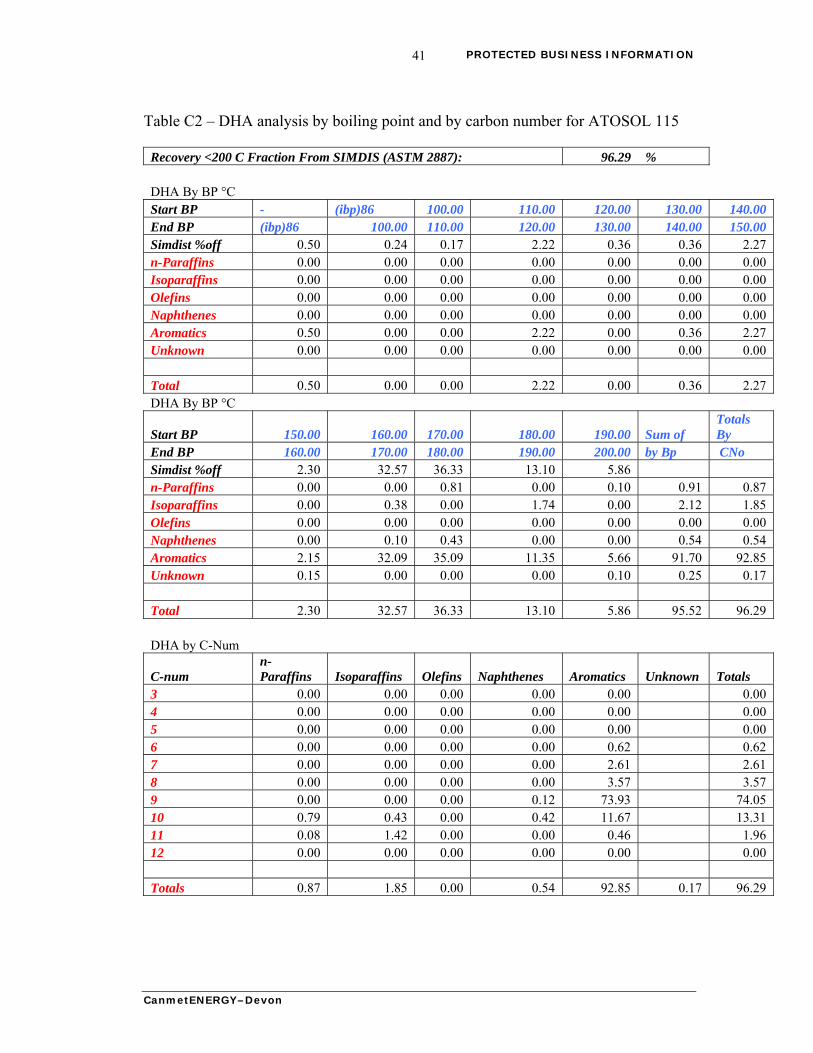
Table C2 – DHA analysis by boiling point and by carbon number for ATOSOL 115
Recovery <200 C Fraction From SIMDIS (ASTM 2887): 96.29 % DHA By BP °C Start BP - (ibp)86 100.00 110.00 120.00 130.00 140.00 End BP (ibp)86 100.00 110.00 120.00 130.00 140.00 150.00 Simdist %off 0.50 0.24 0.17 2.22 0.36 0.36 2.27 n-Paraffins 0.00 0.00 0.00 0.00 0.00 0.00 0.00 Isoparaffins 0.00 0.00 0.00 0.00 0.00 0.00 0.00 Olefins 0.00 0.00 0.00 0.00 0.00 0.00 0.00 Naphthenes 0.00 0.00 0.00 0.00 0.00 0.00 0.00 Aromatics 0.50 0.00 0.00 2.22 0.00 0.36 2.27 Unknown 0.00 0.00 0.00 0.00 0.00 0.00 0.00 Total 0.50 0.00 0.00 2.22 0.00 0.36 2.27 DHA By BP °C
Start BP 150.00 160.00 170.00 180.00 190.00 Sum of Totals By
End BP 160.00 170.00 180.00 190.00 200.00 by Bp CNo Simdist %off 2.30 32.57 36.33 13.10 5.86 n-Paraffins 0.00 0.00 0.81 0.00 0.10 0.91 0.87 Isoparaffins 0.00 0.38 0.00 1.74 0.00 2.12 1.85 Olefins 0.00 0.00 0.00 0.00 0.00 0.00 0.00 Naphthenes 0.00 0.10 0.43 0.00 0.00 0.54 0.54 Aromatics 2.15 32.09 35.09 11.35 5.66 91.70 92.85 Unknown 0.15 0.00 0.00 0.00 0.10 0.25 0.17 Total 2.30 32.57 36.33 13.10 5.86 95.52 96.29 DHA by C-Num
C-num n-Paraffins Isoparaffins Olefins Naphthenes Aromatics Unknown Totals
3 0.00 0.00 0.00 0.00 0.00 0.00 4 0.00 0.00 0.00 0.00 0.00 0.00 5 0.00 0.00 0.00 0.00 0.00 0.00 6 0.00 0.00 0.00 0.00 0.62 0.62 7 0.00 0.00 0.00 0.00 2.61 2.61 8 0.00 0.00 0.00 0.00 3.57 3.57 9 0.00 0.00 0.00 0.12 73.93 74.05 10 0.79 0.43 0.00 0.42 11.67 13.31 11 0.08 1.42 0.00 0.00 0.46 1.96 12 0.00 0.00 0.00 0.00 0.00 0.00 Totals 0.87 1.85 0.00 0.54 92.85 0.17 96.29
CanmetENERGY–Devon
PROTECTED BUSINESS INFORMATION 42
No DHA data for COSDENOL180 because its initial boiling point is > 200°C. No DHA data for RB Solvent 200B because its initial boiling point is > 200°C.
CanmetENERGY–Devon

PROTECTED BUSINESS INFORMATION 43
APPENDIX D: SPE-GC-MS AND PIONA DATA
CanmetENERGY–Devon
PROTECTED BUSINESS INFORMATION 44
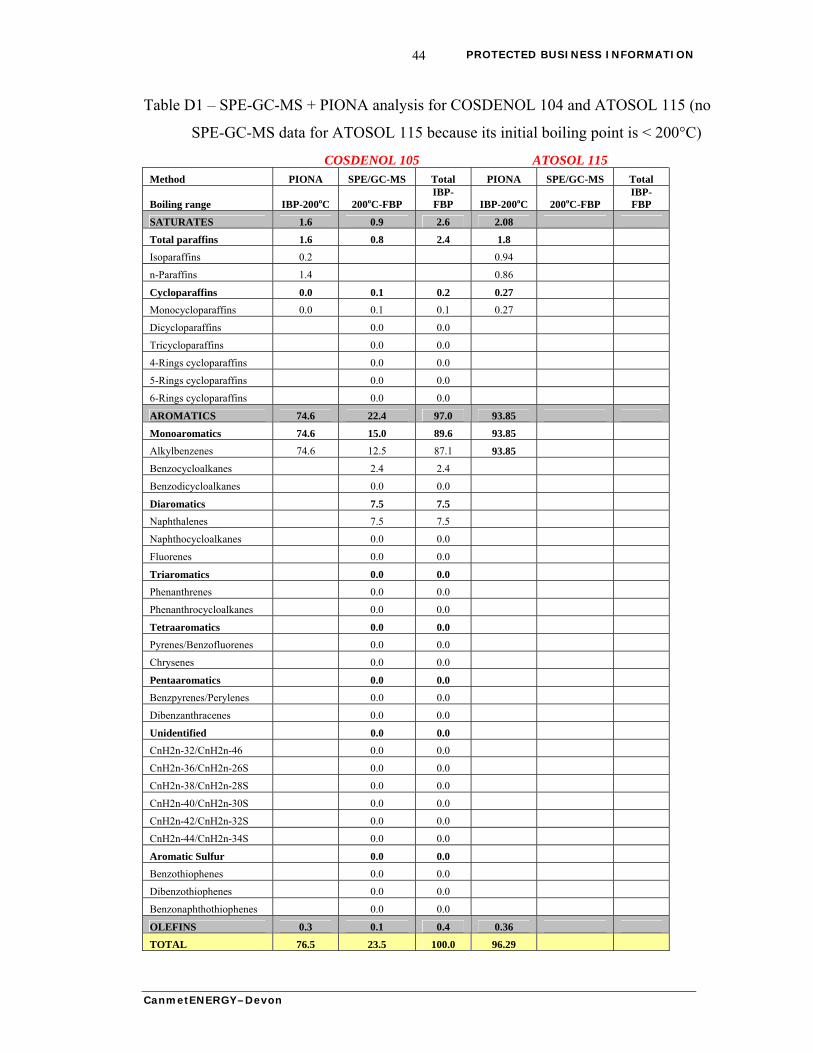
Table D1 – SPE-GC-MS + PIONA analysis for COSDENOL 104 and ATOSOL 115 (no
SPE-GC-MS data for ATOSOL 115 because its initial boiling point is < 200°C)
COSDENOL 105 ATOSOL 115 Method PIONA SPE/GC-MS Total PIONA SPE/GC-MS Total
Boiling range IBP-200oC 200oC-FBP IBP-FBP IBP-200oC 200oC-FBP
IBP-FBP
SATURATES 1.6 0.9 2.6 2.08
Total paraffins 1.6 0.8 2.4 1.8
Isoparaffins 0.2 0.94
n-Paraffins 1.4 0.86
Cycloparaffins 0.0 0.1 0.2 0.27
Monocycloparaffins 0.0 0.1 0.1 0.27
Dicycloparaffins 0.0 0.0
Tricycloparaffins 0.0 0.0
4-Rings cycloparaffins 0.0 0.0
5-Rings cycloparaffins 0.0 0.0
6-Rings cycloparaffins 0.0 0.0
AROMATICS 74.6 22.4 97.0 93.85
Monoaromatics 74.6 15.0 89.6 93.85
Alkylbenzenes 74.6 12.5 87.1 93.85
Benzocycloalkanes 2.4 2.4
Benzodicycloalkanes 0.0 0.0
Diaromatics 7.5 7.5
Naphthalenes 7.5 7.5
Naphthocycloalkanes 0.0 0.0
Fluorenes 0.0 0.0
Triaromatics 0.0 0.0
Phenanthrenes 0.0 0.0
Phenanthrocycloalkanes 0.0 0.0
Tetraaromatics 0.0 0.0
Pyrenes/Benzofluorenes 0.0 0.0
Chrysenes 0.0 0.0
Pentaaromatics 0.0 0.0
Benzpyrenes/Perylenes 0.0 0.0
Dibenzanthracenes 0.0 0.0
Unidentified 0.0 0.0
CnH2n-32/CnH2n-46 0.0 0.0
CnH2n-36/CnH2n-26S 0.0 0.0
CnH2n-38/CnH2n-28S 0.0 0.0
CnH2n-40/CnH2n-30S 0.0 0.0
CnH2n-42/CnH2n-32S 0.0 0.0
CnH2n-44/CnH2n-34S 0.0 0.0
Aromatic Sulfur 0.0 0.0
Benzothiophenes 0.0 0.0
Dibenzothiophenes 0.0 0.0
Benzonaphthothiophenes 0.0 0.0
OLEFINS 0.3 0.1 0.4 0.36
TOTAL 76.5 23.5 100.0 96.29
CanmetENERGY–Devon
PROTECTED BUSINESS INFORMATION 45
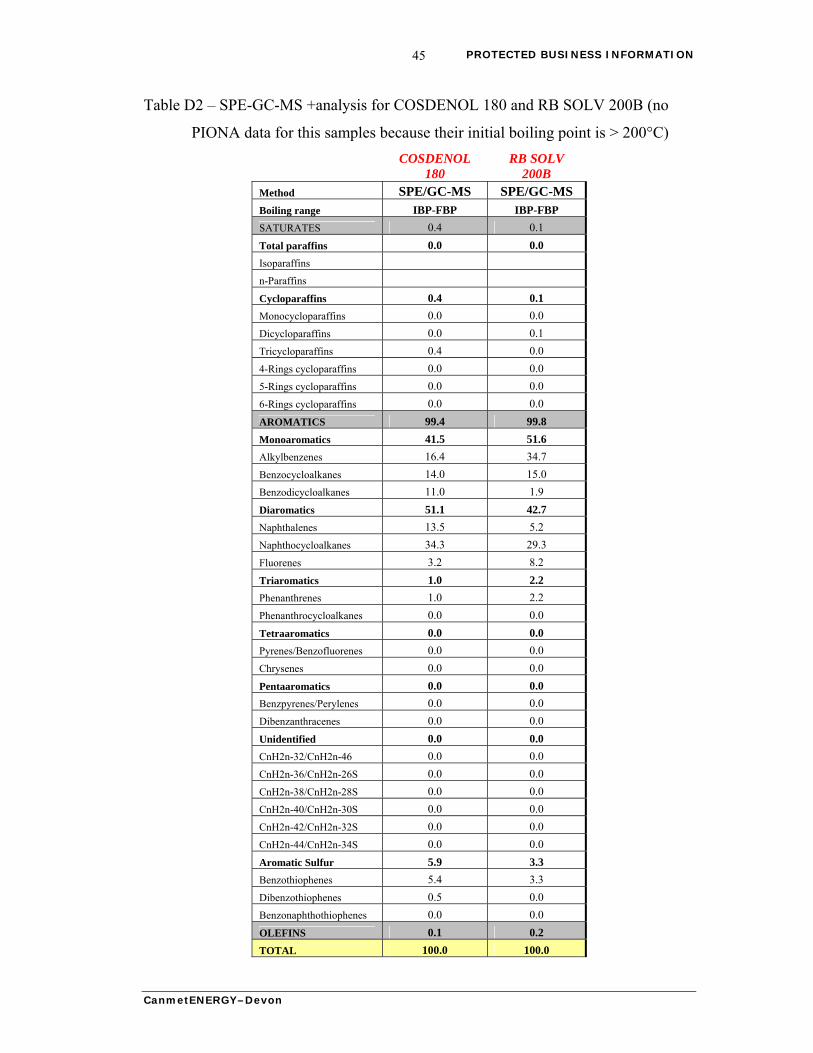
Table D2 – SPE-GC-MS +analysis for COSDENOL 180 and RB SOLV 200B (no
PIONA data for this samples because their initial boiling point is > 200°C)
COSDENOL
180 RB SOLV
200B Method SPE/GC-MS SPE/GC-MS Boiling range IBP-FBP IBP-FBP
SATURATES 0.4 0.1
Total paraffins 0.0 0.0
Isoparaffins
n-Paraffins
Cycloparaffins 0.4 0.1
Monocycloparaffins 0.0 0.0
Dicycloparaffins 0.0 0.1
Tricycloparaffins 0.4 0.0
4-Rings cycloparaffins 0.0 0.0
5-Rings cycloparaffins 0.0 0.0
6-Rings cycloparaffins 0.0 0.0
AROMATICS 99.4 99.8
Monoaromatics 41.5 51.6
Alkylbenzenes 16.4 34.7
Benzocycloalkanes 14.0 15.0
Benzodicycloalkanes 11.0 1.9
Diaromatics 51.1 42.7
Naphthalenes 13.5 5.2
Naphthocycloalkanes 34.3 29.3
Fluorenes 3.2 8.2
Triaromatics 1.0 2.2
Phenanthrenes 1.0 2.2
Phenanthrocycloalkanes 0.0 0.0
Tetraaromatics 0.0 0.0
Pyrenes/Benzofluorenes 0.0 0.0
Chrysenes 0.0 0.0
Pentaaromatics 0.0 0.0
Benzpyrenes/Perylenes 0.0 0.0
Dibenzanthracenes 0.0 0.0
Unidentified 0.0 0.0
CnH2n-32/CnH2n-46 0.0 0.0
CnH2n-36/CnH2n-26S 0.0 0.0
CnH2n-38/CnH2n-28S 0.0 0.0
CnH2n-40/CnH2n-30S 0.0 0.0
CnH2n-42/CnH2n-32S 0.0 0.0
CnH2n-44/CnH2n-34S 0.0 0.0
Aromatic Sulfur 5.9 3.3
Benzothiophenes 5.4 3.3
Dibenzothiophenes 0.5 0.0
Benzonaphthothiophenes 0.0 0.0
OLEFINS 0.1 0.2
TOTAL 100.0 100.0
CanmetENERGY–Devon

PROTECTED BUSINESS INFORMATION
CanmetENERGY–Devon
46
APPENDIX E: GC-FIMS
Can
metE
NE
RG
Y –
Devo
n
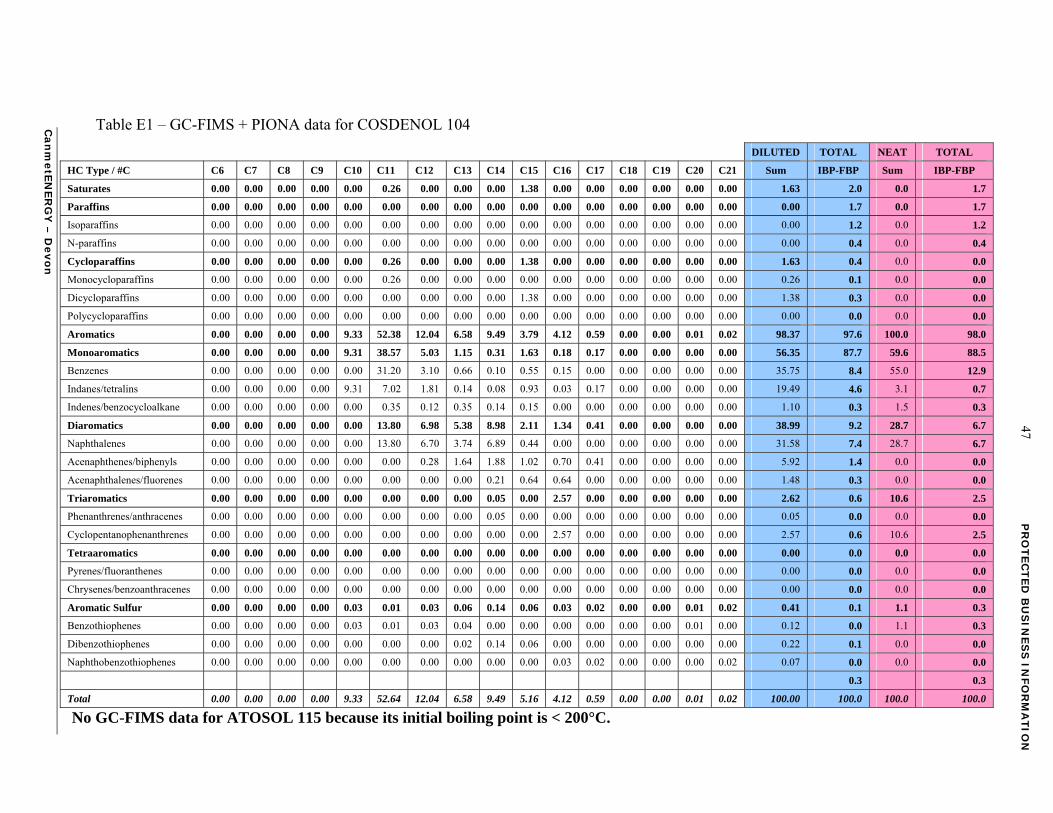
Table E1 – GC-FIMS + PIONA data for COSDENOL 104
DILUTED TOTAL NEAT TOTAL
HC Type / #C C6 C7 C8 C9 C10 C11 C12 C13 C14 C15 C16 C17 C18 C19 C20 C21 Sum IBP-FBP Sum IBP-FBP
Saturates 0.00 0.00 0.00 0.00 0.00 0.26 0.00 0.00 0.00 1.38 0.00 0.00 0.00 0.00 0.00 0.00 1.63 2.0 0.0 1.7
Paraffins 0.00 0.00 0.00 0.00 0.00 0.00 0.00 0.00 0.00 0.00 0.00 0.00 0.00 0.00 0.00 0.00 0.00 1.7 0.0 1.7
Isoparaffins 0.00 0.00 0.00 0.00 0.00 0.00 0.00 0.00 0.00 0.00 0.00 0.00 0.00 0.00 0.00 0.00 0.00 1.2 0.0 1.2
N-paraffins 0.00 0.00 0.00 0.00 0.00 0.00 0.00 0.00 0.00 0.00 0.00 0.00 0.00 0.00 0.00 0.00 0.00 0.4 0.0 0.4
Cycloparaffins 0.00 0.00 0.00 0.00 0.00 0.26 0.00 0.00 0.00 1.38 0.00 0.00 0.00 0.00 0.00 0.00 1.63 0.4 0.0 0.0
Monocycloparaffins 0.00 0.00 0.00 0.00 0.00 0.26 0.00 0.00 0.00 0.00 0.00 0.00 0.00 0.00 0.00 0.00 0.26 0.1 0.0 0.0
Dicycloparaffins 0.00 0.00 0.00 0.00 0.00 0.00 0.00 0.00 0.00 1.38 0.00 0.00 0.00 0.00 0.00 0.00 1.38 0.3 0.0 0.0
Polycycloparaffins 0.00 0.00 0.00 0.00 0.00 0.00 0.00 0.00 0.00 0.00 0.00 0.00 0.00 0.00 0.00 0.00 0.00 0.0 0.0 0.0
Aromatics 0.00 0.00 0.00 0.00 9.33 52.38 12.04 6.58 9.49 3.79 4.12 0.59 0.00 0.00 0.01 0.02 98.37 97.6 100.0 98.0
Monoaromatics 0.00 0.00 0.00 0.00 9.31 38.57 5.03 1.15 0.31 1.63 0.18 0.17 0.00 0.00 0.00 0.00 56.35 87.7 59.6 88.5
Benzenes 0.00 0.00 0.00 0.00 0.00 31.20 3.10 0.66 0.10 0.55 0.15 0.00 0.00 0.00 0.00 0.00 35.75 8.4 55.0 12.9
Indanes/tetralins 0.00 0.00 0.00 0.00 9.31 7.02 1.81 0.14 0.08 0.93 0.03 0.17 0.00 0.00 0.00 0.00 19.49 4.6 3.1 0.7
Indenes/benzocycloalkane 0.00 0.00 0.00 0.00 0.00 0.35 0.12 0.35 0.14 0.15 0.00 0.00 0.00 0.00 0.00 0.00 1.10 0.3 1.5 0.3
Diaromatics 0.00 0.00 0.00 0.00 0.00 13.80 6.98 5.38 8.98 2.11 1.34 0.41 0.00 0.00 0.00 0.00 38.99 9.2 28.7 6.7
Naphthalenes 0.00 0.00 0.00 0.00 0.00 13.80 6.70 3.74 6.89 0.44 0.00 0.00 0.00 0.00 0.00 0.00 31.58 7.4 28.7 6.7
Acenaphthenes/biphenyls 0.00 0.00 0.00 0.00 0.00 0.00 0.28 1.64 1.88 1.02 0.70 0.41 0.00 0.00 0.00 0.00 5.92 1.4 0.0 0.0
Acenaphthalenes/fluorenes 0.00 0.00 0.00 0.00 0.00 0.00 0.00 0.00 0.21 0.64 0.64 0.00 0.00 0.00 0.00 0.00 1.48 0.3 0.0 0.0
Triaromatics 0.00 0.00 0.00 0.00 0.00 0.00 0.00 0.00 0.05 0.00 2.57 0.00 0.00 0.00 0.00 0.00 2.62 0.6 10.6 2.5
Phenanthrenes/anthracenes 0.00 0.00 0.00 0.00 0.00 0.00 0.00 0.00 0.05 0.00 0.00 0.00 0.00 0.00 0.00 0.00 0.05 0.0 0.0 0.0
Cyclopentanophenanthrenes 0.00 0.00 0.00 0.00 0.00 0.00 0.00 0.00 0.00 0.00 2.57 0.00 0.00 0.00 0.00 0.00 2.57 0.6 10.6 2.5
Tetraaromatics 0.00 0.00 0.00 0.00 0.00 0.00 0.00 0.00 0.00 0.00 0.00 0.00 0.00 0.00 0.00 0.00 0.00 0.0 0.0 0.0
Pyrenes/fluoranthenes 0.00 0.00 0.00 0.00 0.00 0.00 0.00 0.00 0.00 0.00 0.00 0.00 0.00 0.00 0.00 0.00 0.00 0.0 0.0 0.0
Chrysenes/benzoanthracenes 0.00 0.00 0.00 0.00 0.00 0.00 0.00 0.00 0.00 0.00 0.00 0.00 0.00 0.00 0.00 0.00 0.00 0.0 0.0 0.0
Aromatic Sulfur 0.00 0.00 0.00 0.00 0.03 0.01 0.03 0.06 0.14 0.06 0.03 0.02 0.00 0.00 0.01 0.02 0.41 0.1 1.1 0.3
Benzothiophenes 0.00 0.00 0.00 0.00 0.03 0.01 0.03 0.04 0.00 0.00 0.00 0.00 0.00 0.00 0.01 0.00 0.12 0.0 1.1 0.3
Dibenzothiophenes 0.00 0.00 0.00 0.00 0.00 0.00 0.00 0.02 0.14 0.06 0.00 0.00 0.00 0.00 0.00 0.00 0.22 0.1 0.0 0.0
Naphthobenzothiophenes 0.00 0.00 0.00 0.00 0.00 0.00 0.00 0.00 0.00 0.00 0.03 0.02 0.00 0.00 0.00 0.02 0.07 0.0 0.0 0.0
0.3 0.3
Total 0.00 0.00 0.00 0.00 9.33 52.64 12.04 6.58 9.49 5.16 4.12 0.59 0.00 0.00 0.01 0.02 100.00 100.0 100.0 100.0
47 P
RO
TE
CT
ED
BU
SIN
ES
S IN
FO
RM
AT
ION
No GC-FIMS data for ATOSOL 115 because its initial boiling point is < 200°C.
Can
metE
NE
RG
Y –
Devo
n
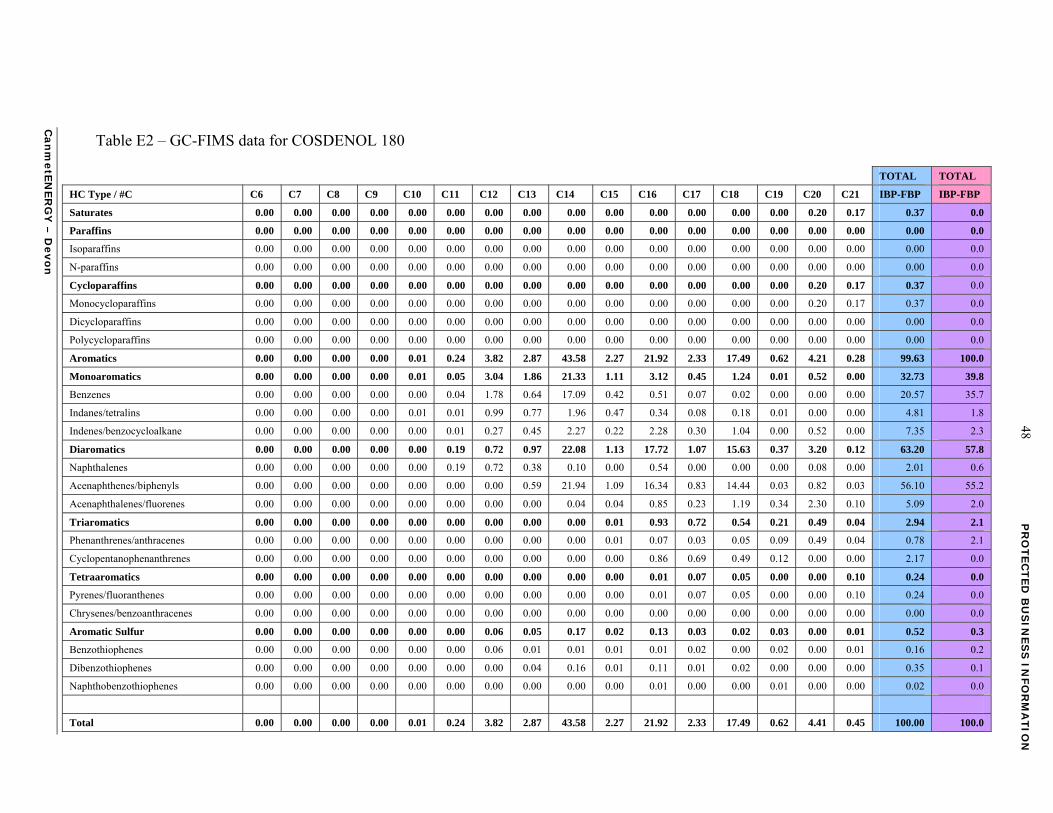
Table E2 – GC-FIMS data for COSDENOL 180
48 P
RO
TE
CT
ED
BU
SIN
ES
S IN
FO
RM
AT
ION
TOTAL TOTAL
HC Type / #C C6 C7 C8 C9 C10 C11 C12 C13 C14 C15 C16 C17 C18 C19 C20 C21 IBP-FBP IBP-FBP
Saturates 0.00 0.00 0.00 0.00 0.00 0.00 0.00 0.00 0.00 0.00 0.00 0.00 0.00 0.00 0.20 0.17 0.37 0.0
Paraffins 0.00 0.00 0.00 0.00 0.00 0.00 0.00 0.00 0.00 0.00 0.00 0.00 0.00 0.00 0.00 0.00 0.00 0.0
Isoparaffins 0.00 0.00 0.00 0.00 0.00 0.00 0.00 0.00 0.00 0.00 0.00 0.00 0.00 0.00 0.00 0.00 0.00 0.0
N-paraffins 0.00 0.00 0.00 0.00 0.00 0.00 0.00 0.00 0.00 0.00 0.00 0.00 0.00 0.00 0.00 0.00 0.00 0.0
Cycloparaffins 0.00 0.00 0.00 0.00 0.00 0.00 0.00 0.00 0.00 0.00 0.00 0.00 0.00 0.00 0.20 0.17 0.37 0.0
Monocycloparaffins 0.00 0.00 0.00 0.00 0.00 0.00 0.00 0.00 0.00 0.00 0.00 0.00 0.00 0.00 0.20 0.17 0.37 0.0
Dicycloparaffins 0.00 0.00 0.00 0.00 0.00 0.00 0.00 0.00 0.00 0.00 0.00 0.00 0.00 0.00 0.00 0.00 0.00 0.0
Polycycloparaffins 0.00 0.00 0.00 0.00 0.00 0.00 0.00 0.00 0.00 0.00 0.00 0.00 0.00 0.00 0.00 0.00 0.00 0.0
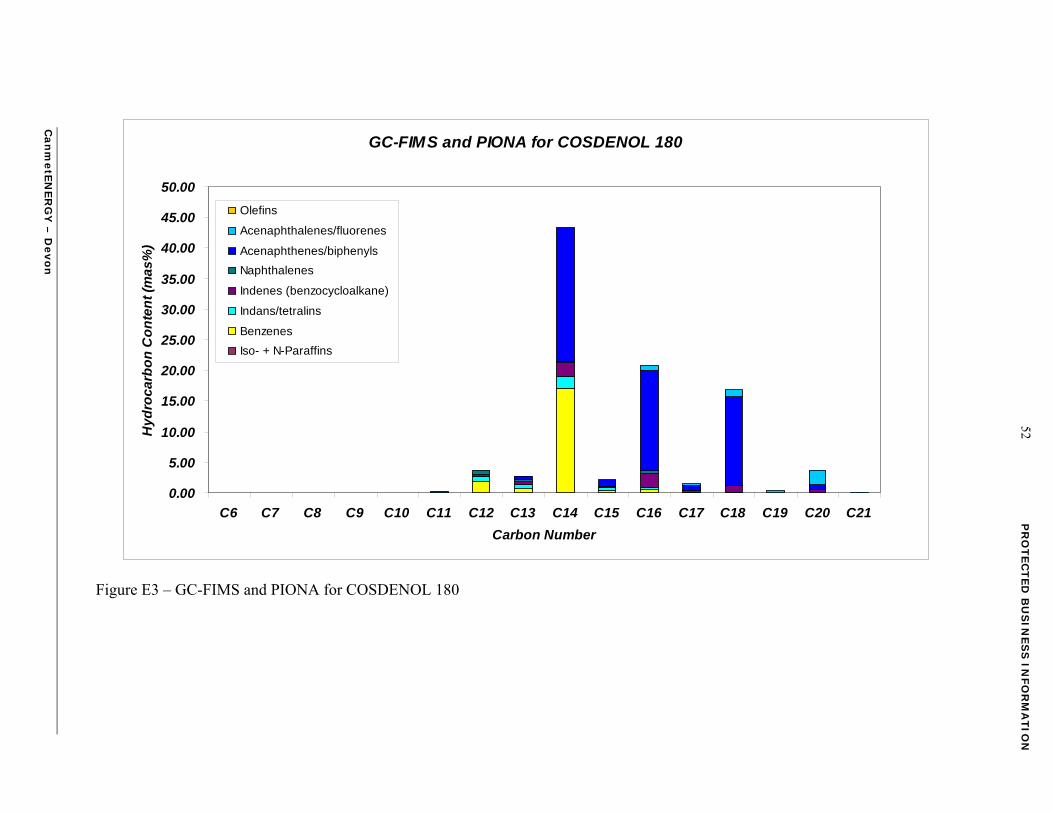
Aromatics 0.00 0.00 0.00 0.00 0.01 0.24 3.82 2.87 43.58 2.27 21.92 2.33 17.49 0.62 4.21 0.28 99.63 100.0
Monoaromatics 0.00 0.00 0.00 0.00 0.01 0.05 3.04 1.86 21.33 1.11 3.12 0.45 1.24 0.01 0.52 0.00 32.73 39.8
Benzenes 0.00 0.00 0.00 0.00 0.00 0.04 1.78 0.64 17.09 0.42 0.51 0.07 0.02 0.00 0.00 0.00 20.57 35.7
Indanes/tetralins 0.00 0.00 0.00 0.00 0.01 0.01 0.99 0.77 1.96 0.47 0.34 0.08 0.18 0.01 0.00 0.00 4.81 1.8
Indenes/benzocycloalkane 0.00 0.00 0.00 0.00 0.00 0.01 0.27 0.45 2.27 0.22 2.28 0.30 1.04 0.00 0.52 0.00 7.35 2.3
Diaromatics 0.00 0.00 0.00 0.00 0.00 0.19 0.72 0.97 22.08 1.13 17.72 1.07 15.63 0.37 3.20 0.12 63.20 57.8
Naphthalenes 0.00 0.00 0.00 0.00 0.00 0.19 0.72 0.38 0.10 0.00 0.54 0.00 0.00 0.00 0.08 0.00 2.01 0.6
Acenaphthenes/biphenyls 0.00 0.00 0.00 0.00 0.00 0.00 0.00 0.59 21.94 1.09 16.34 0.83 14.44 0.03 0.82 0.03 56.10 55.2
Acenaphthalenes/fluorenes 0.00 0.00 0.00 0.00 0.00 0.00 0.00 0.00 0.04 0.04 0.85 0.23 1.19 0.34 2.30 0.10 5.09 2.0
Triaromatics 0.00 0.00 0.00 0.00 0.00 0.00 0.00 0.00 0.00 0.01 0.93 0.72 0.54 0.21 0.49 0.04 2.94 2.1
Phenanthrenes/anthracenes 0.00 0.00 0.00 0.00 0.00 0.00 0.00 0.00 0.00 0.01 0.07 0.03 0.05 0.09 0.49 0.04 0.78 2.1
Cyclopentanophenanthrenes 0.00 0.00 0.00 0.00 0.00 0.00 0.00 0.00 0.00 0.00 0.86 0.69 0.49 0.12 0.00 0.00 2.17 0.0
Tetraaromatics 0.00 0.00 0.00 0.00 0.00 0.00 0.00 0.00 0.00 0.00 0.01 0.07 0.05 0.00 0.00 0.10 0.24 0.0
Pyrenes/fluoranthenes 0.00 0.00 0.00 0.00 0.00 0.00 0.00 0.00 0.00 0.00 0.01 0.07 0.05 0.00 0.00 0.10 0.24 0.0
Chrysenes/benzoanthracenes 0.00 0.00 0.00 0.00 0.00 0.00 0.00 0.00 0.00 0.00 0.00 0.00 0.00 0.00 0.00 0.00 0.00 0.0
Aromatic Sulfur 0.00 0.00 0.00 0.00 0.00 0.00 0.06 0.05 0.17 0.02 0.13 0.03 0.02 0.03 0.00 0.01 0.52 0.3
Benzothiophenes 0.00 0.00 0.00 0.00 0.00 0.00 0.06 0.01 0.01 0.01 0.01 0.02 0.00 0.02 0.00 0.01 0.16 0.2
Dibenzothiophenes 0.00 0.00 0.00 0.00 0.00 0.00 0.00 0.04 0.16 0.01 0.11 0.01 0.02 0.00 0.00 0.00 0.35 0.1
Naphthobenzothiophenes 0.00 0.00 0.00 0.00 0.00 0.00 0.00 0.00 0.00 0.00 0.01 0.00 0.00 0.01 0.00 0.00 0.02 0.0
Total 0.00 0.00 0.00 0.00 0.01 0.24 3.82 2.87 43.58 2.27 21.92 2.33 17.49 0.62 4.41 0.45 100.00 100.0

Can
metE
NE
RG
Y –
Devo
n
Table E3 – GC-FIMS data for RB SOLVENT 200B
49 P
RO
TE
CT
ED
BU
SIN
ES
S IN
FO
RM
AT
ION
TOTAL TOTAL
HC Type / #C C6 C7 C8 C9 C10 C11 C12 C13 C14 C15 C16 C17 C18 C19 C20 C21 IBP-FBP IBP-FBP
Saturates 0.00 0.00 0.00 0.00 0.00 0.00 0.00 0.00 0.00 0.00 0.00 0.00 0.00 0.00 0.00 0.00 0.00 0.0
Paraffins 0.00 0.00 0.00 0.00 0.00 0.00 0.00 0.00 0.00 0.00 0.00 0.00 0.00 0.00 0.00 0.00 0.00 0.0
Isoparaffins 0.00 0.00 0.00 0.00 0.00 0.00 0.00 0.00 0.00 0.00 0.00 0.00 0.00 0.00 0.00 0.00 0.00 0.0
N-paraffins 0.00 0.00 0.00 0.00 0.00 0.00 0.00 0.00 0.00 0.00 0.00 0.00 0.00 0.00 0.00 0.00 0.00 0.0
Cycloparaffins 0.00 0.00 0.00 0.00 0.00 0.00 0.00 0.00 0.00 0.00 0.00 0.00 0.00 0.00 0.00 0.00 0.00 0.0
Monocycloparaffins 0.00 0.00 0.00 0.00 0.00 0.00 0.00 0.00 0.00 0.00 0.00 0.00 0.00 0.00 0.00 0.00 0.00 0.0
Dicycloparaffins 0.00 0.00 0.00 0.00 0.00 0.00 0.00 0.00 0.00 0.00 0.00 0.00 0.00 0.00 0.00 0.00 0.00 0.0
Polycycloparaffins 0.00 0.00 0.00 0.00 0.00 0.00 0.00 0.00 0.00 0.00 0.00 0.00 0.00 0.00 0.00 0.00 0.00 0.0
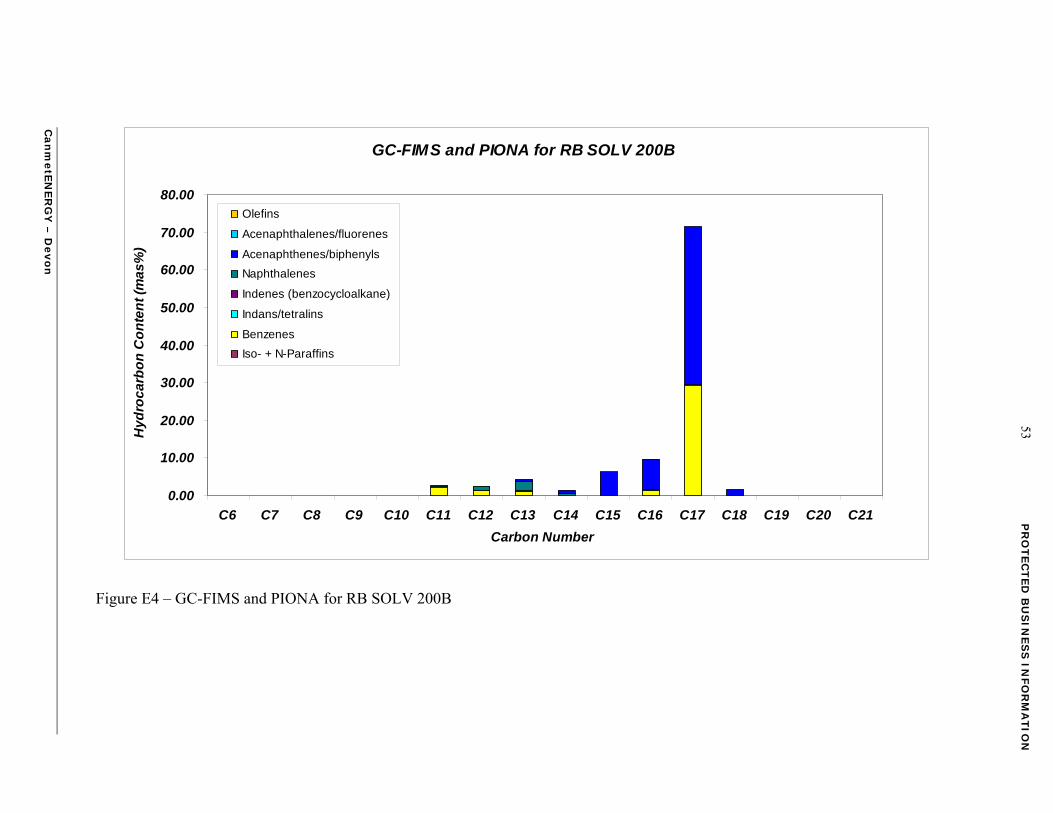
Aromatics 0.00 0.00 0.00 0.00 0.00 2.76 2.51 4.20 1.31 6.32 9.60 71.62 1.68 0.02 0.00 0.00 100.00 100.0
Monoaromatics 0.00 0.00 0.00 0.00 0.00 2.25 1.42 1.30 0.07 0.00 1.64 29.30 0.00 0.00 0.00 0.00 35.98 32.8
Benzenes 0.00 0.00 0.00 0.00 0.00 2.06 1.36 1.08 0.04 0.00 1.41 29.13 0.00 0.00 0.00 0.00 35.08 29.2
Indanes/tetralins 0.00 0.00 0.00 0.00 0.00 0.19 0.05 0.22 0.02 0.00 0.08 0.18 0.00 0.00 0.00 0.00 0.74 2.5
Indenes/benzocycloalkane 0.00 0.00 0.00 0.00 0.00 0.00 0.00 0.00 0.00 0.00 0.15 0.00 0.00 0.00 0.00 0.00 0.15 1.1
Diaromatics 0.00 0.00 0.00 0.00 0.00 0.50 1.09 2.89 1.25 6.32 7.90 42.17 1.60 0.00 0.00 0.00 63.72 65.8
Naphthalenes 0.00 0.00 0.00 0.00 0.00 0.50 1.09 2.21 0.48 0.00 0.00 0.00 0.00 0.00 0.00 0.00 4.29 7.3
Acenaphthenes/biphenyls 0.00 0.00 0.00 0.00 0.00 0.00 0.00 0.68 0.77 6.32 7.90 42.17 1.60 0.00 0.00 0.00 59.43 57.9
Acenaphthalenes/fluorenes 0.00 0.00 0.00 0.00 0.00 0.00 0.00 0.00 0.00 0.00 0.00 0.00 0.00 0.00 0.00 0.00 0.00 0.6
Triaromatics 0.00 0.00 0.00 0.00 0.00 0.00 0.00 0.00 0.00 0.00 0.06 0.14 0.08 0.02 0.00 0.00 0.30 1.3
Phenanthrenes/anthracenes 0.00 0.00 0.00 0.00 0.00 0.00 0.00 0.00 0.00 0.00 0.06 0.14 0.08 0.02 0.00 0.00 0.30 1.3
Cyclopentanophenanthrenes 0.00 0.00 0.00 0.00 0.00 0.00 0.00 0.00 0.00 0.00 0.00 0.00 0.00 0.00 0.00 0.00 0.00 0.0
Tetraaromatics 0.00 0.00 0.00 0.00 0.00 0.00 0.00 0.00 0.00 0.00 0.00 0.00 0.00 0.00 0.00 0.00 0.00 0.0
Pyrenes/fluoranthenes 0.00 0.00 0.00 0.00 0.00 0.00 0.00 0.00 0.00 0.00 0.00 0.00 0.00 0.00 0.00 0.00 0.00 0.0
Chrysenes/benzoanthracenes 0.00 0.00 0.00 0.00 0.00 0.00 0.00 0.00 0.00 0.00 0.00 0.00 0.00 0.00 0.00 0.00 0.00 0.0
Aromatic Sulfur 0.00 0.00 0.00 0.00 0.00 0.00 0.00 0.00 0.00 0.00 0.00 0.00 0.00 0.00 0.00 0.00 0.00 0.2
Benzothiophenes 0.00 0.00 0.00 0.00 0.00 0.00 0.00 0.00 0.00 0.00 0.00 0.00 0.00 0.00 0.00 0.00 0.00 0.0
Dibenzothiophenes 0.00 0.00 0.00 0.00 0.00 0.00 0.00 0.00 0.00 0.00 0.00 0.00 0.00 0.00 0.00 0.00 0.00 0.1
Naphthobenzothiophenes 0.00 0.00 0.00 0.00 0.00 0.00 0.00 0.00 0.00 0.00 0.00 0.00 0.00 0.00 0.00 0.00 0.00 0.0
Total 0.00 0.00 0.00 0.00 0.00 2.76 2.51 4.20 1.31 6.32 9.60 71.62 1.68 0.02 0.00 0.00 100.00 100.0
Can
metE
NE
RG
Y –
Devo
n
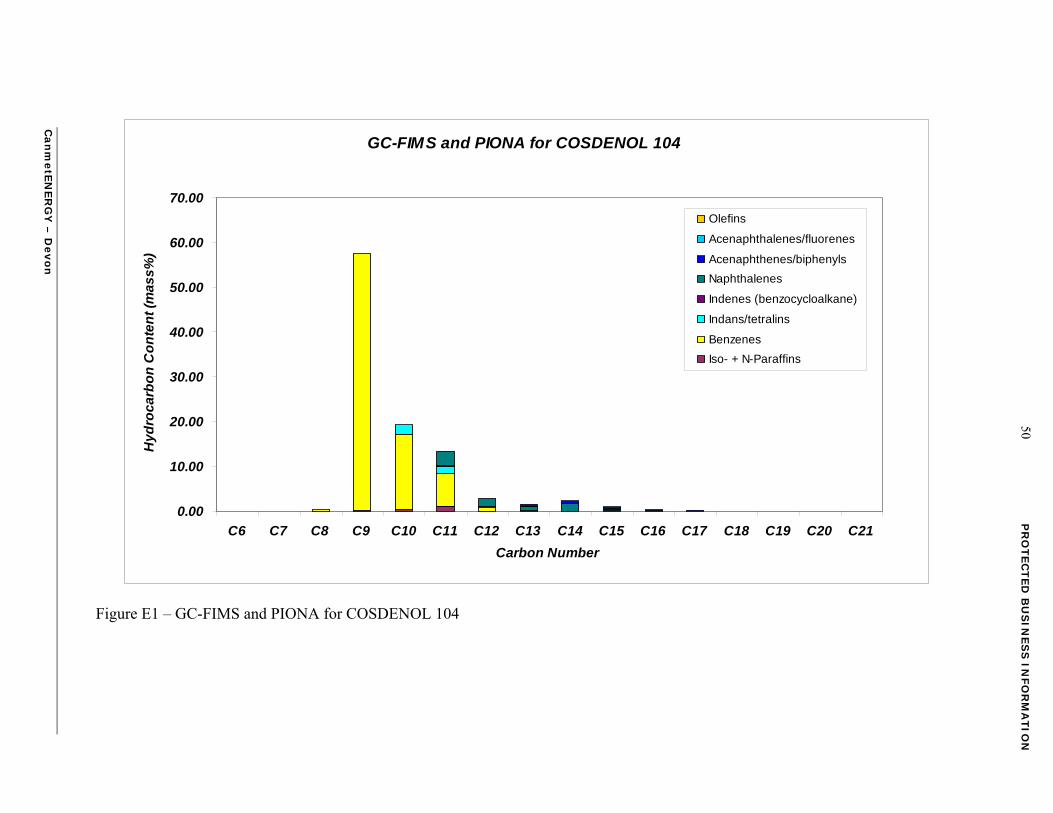
GC-FIMS and PIONA for COSDENOL 104
0.00
10.00
20.00
30.00
40.00
50.00
60.00
70.00
C6 C7 C8 C9 C10 C11 C12 C13 C14 C15 C16 C17 C18 C19 C20 C21
Carbon Number
Hy
dro
ca
rbo
n C
on
ten
t (m
as
s%
)
Olefins
Acenaphthalenes/fluorenes
Acenaphthenes/biphenyls
Naphthalenes
Indenes (benzocycloalkane)
Indans/tetralins
Benzenes
Iso- + N-Paraffins
50 P
RO
TE
CT
ED
BU
SIN
ES
S IN
FO
RM
AT
ION
Figure E1 – GC-FIMS and PIONA for COSDENOL 104
Can
metE
NE
RG
Y –
Devo
n
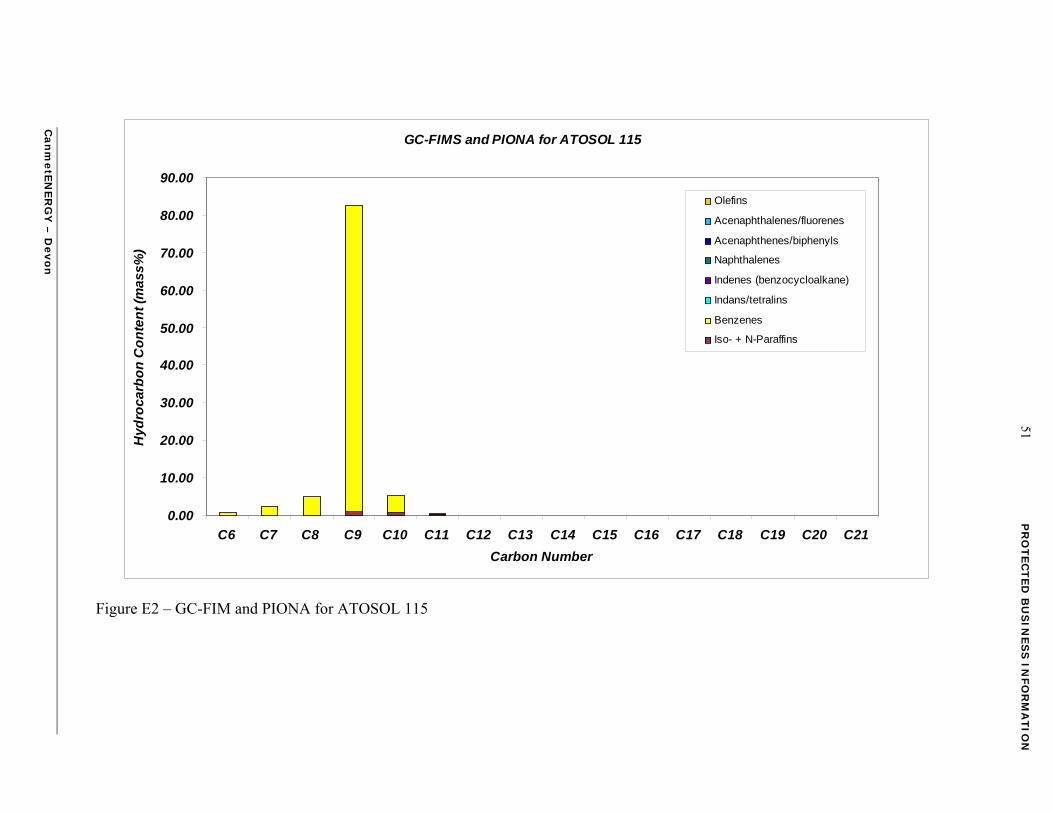
GC-FIMS and PIONA for ATOSOL 115
0.00
10.00
20.00
30.00
40.00
50.00
60.00
70.00
80.00
90.00
C6 C7 C8 C9 C10 C11 C12 C13 C14 C15 C16 C17 C18 C19 C20 C21
Carbon Number
Hy
dro
ca
rbo
n C
on
ten
t (m
as
s%
)
Olefins
Acenaphthalenes/fluorenes
Acenaphthenes/biphenyls
Naphthalenes
Indenes (benzocycloalkane)
Indans/tetralins
Benzenes
Iso- + N-Paraffins
51 P
RO
TE
CT
ED
BU
SIN
ES
S IN
FO
RM
AT
ION
Figure E2 – GC-FIM and PIONA for ATOSOL 115
Can
metE
NE
RG
Y –
Devo
n
GC-FIMS and PIONA for COSDENOL 180
0.00
5.00
10.00
15.00
20.00
25.00
30.00
35.00
40.00
45.00
50.00
C6 C7 C8 C9 C10 C11 C12 C13 C14 C15 C16 C17 C18 C19 C20 C21
Carbon Number
Hy
dro
ca
rbo
n C
on
ten
t (m
as
%)
Olefins
Acenaphthalenes/fluorenes
Acenaphthenes/biphenyls
Naphthalenes
Indenes (benzocycloalkane)
Indans/tetralins
Benzenes
Iso- + N-Paraffins
52 P
RO
TE
CT
ED
BU
SIN
ES
S IN
FO
RM
AT
ION
Figure E3 – GC-FIMS and PIONA for COSDENOL 180
53 P
RO
TE
CT
ED
BU
SIN
ES
S IN
FO
RM
AT
ION
GC-FIMS and PIONA for RB SOLV 200B
0.00
10.00
20.00
30.00
40.00
50.00
60.00
70.00
80.00
C6 C7 C8 C9 C10 C11 C12 C13 C14 C15 C16 C17 C18 C19 C20 C21
Carbon Number
Hy
dro
ca
rbo
n C
on
ten
t (m
as
%)
Olefins
Acenaphthalenes/fluorenes
Acenaphthenes/biphenyls
Naphthalenes
Indenes (benzocycloalkane)
Indans/tetralins
Benzenes
Iso- + N-Paraffins
Figure E4 – GC-FIMS and PIONA for RB SOLV 200B
Can
metE
NE
RG
Y –
Devo
n

PROTECTED BUSINESS INFORMATION 54
APPENDIX F: GCXGC – FID
CanmetENERGY–Devon
PROTECTED BUSINESS INFORMATION 55
c)
b)
a)
Figure F1 – GCxGC-FID chromatograms of Cosdenol 104: (a) 2D view, (b) 3D view, (c) 2D view
together with classification regions
CanmetENERGY–Devon
PROTECTED BUSINESS INFORMATION 56
c)
b)
a)
Figure F2 – GCxGC-FID chromatograms of Atosol 115: (a) 2D view, (b) 3D view, (c) 2D view
together with classification regions
CanmetENERGY–Devon
PROTECTED BUSINESS INFORMATION 57
c)
b)
a)
Figure F3 – GCxGC-FID chromatograms of Cosdenol 180: (a) 2D view, (b) 3D view, (c) 2D view
together with classification regions
CanmetENERGY–Devon
PROTECTED BUSINESS INFORMATION 58
c)
b)
a)
Figure F4 – GCxGC-FID chromatograms of RB Solvent 200B: (a) 2D view, (b) 3D view, (c) 2D
view together with classification regions
CanmetENERGY–Devon

PROTECTED BUSINESS INFORMATION 59
APPENDIX G: GCXGC – TOFMS/FID
CanmetENERGY–Devon
PROTECTED BUSINESS INFORMATION 60
b)
a)
Figure G1 – GCxGC-TOFMS/FID chromatograms of Cosdenol 104: (a) 2D view together with
classification regions, (b) 3D view
CanmetENERGY–Devon
PROTECTED BUSINESS INFORMATION 61
b)
a)
Figure G2 – GCxGC-TOFMS/FID chromatograms of Atosol 115: (a) 2D view together with
classification regions, (b) 3D view
CanmetENERGY–Devon
PROTECTED BUSINESS INFORMATION 62
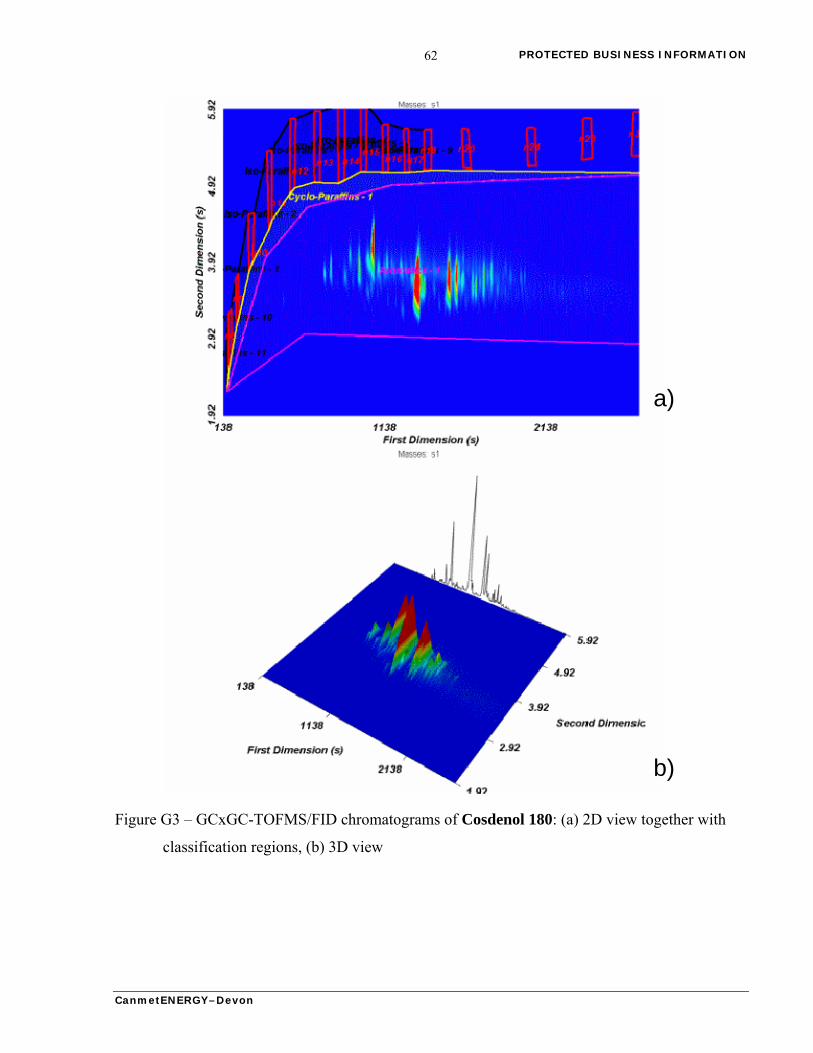
b)
a)
Figure G3 – GCxGC-TOFMS/FID chromatograms of Cosdenol 180: (a) 2D view together with
classification regions, (b) 3D view
CanmetENERGY–Devon
PROTECTED BUSINESS INFORMATION
CanmetENERGY–Devon
63
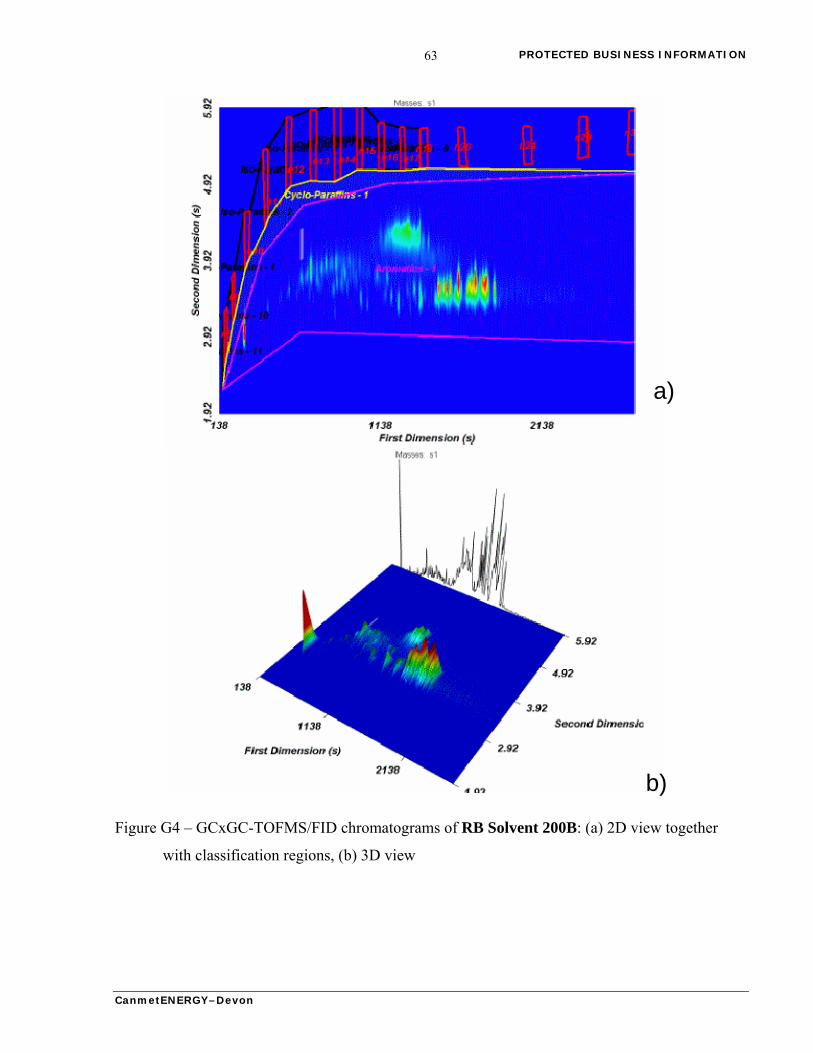
b)
a)
Figure G4 – GCxGC-TOFMS/FID chromatograms of RB Solvent 200B: (a) 2D view together
with classification regions, (b) 3D view