Embed Size (px)
Citation preview

J0261.06
HYDRAULIC MODEL
UPDATE REPORT
KENT COUNTY
WATER AUTHORITY WEST WARWICK, RHODE ISLAND
Prepared By:
C&E Engineering Partners, Inc. 342 Park Avenue
Woonsocket, RI 02895
February 2006
Printed on Recycled Paper

Table of Contents Section Page 1.0 Introduction 1
1.1 Project Background 1 1.2 Purpose and Scope 2
2.0 Water System Updates 4
2.1 General Service Area Description 4 2.2 Distribution and Transmission Pipeline Updates 5 2.3 Pressure Zone Updates 7 2.4 Sources of Supply Updates 8 2.5 Interconnection Updates 9 2.6 Water Storage Facility Updates 10 2.7 Pumping Facility Updates 10
3.0 System Demand Updates 13
3.1 Large User Demand Updates 13 3.2 Approved Developments 14
4.0 Hydraulic Model Simulation Updates 17
4.1 Simulations Overview 17 4.2 Average Day Simulation 17 4.3 Maximum Day Simulation 20 4.4 Peak Hour Simulation 22 4.5 Summary and Conclusions 25
Appendix A – Average Day Summary Results Pipeline Database Results Junction Node Database Results Appendix B – Maximum Day Summary Results Appendix C – Peak Hour Summary Results Attachment No. 1 – Model Node and Pipeline Plan (under separate cover)

1
1.0 Introduction
1.1 Project Background
C&E Engineering Partners, Inc. (C&E) in June 2004 completed a computerized hydraulic model
of the Kent County Water Authority’s (KCWA) Supply, Transmission and Distribution System.
The project consisted of the development of an accurate and calibrated computerized hydraulic
model of the major infrastructure facilities and pipelines of the water transmission and
distribution system.
All of the major facilities of the KCWA water distribution system are represented in this
hydraulic model. This includes all sources of supply (including wholesale interconnections),
booster pumping and storage facilities, well stations, pressure reducing valve stations, and
transmission and distribution pipelines. Information describing the characteristics of each of the
water system facilities was acquired from available records of the KCWA and from field surveys
of infrastructure facilities. This also included information derived from KCWA staff during
development of the model to verify system geometry including water main layout and
configuration, size, age, material, etc. A general overview of the operation of the system
including pump sequencing, booster pump operation, manual and automatic operation of
facilities, etc. was also obtained from KCWA staff in order to properly establish initial operating
conditions for model scenarios.
Since completion, the hydraulic model has been successfully utilized to complete various studies
for the KCWA water supply system involving future planning, infrastructure sizing,
development analysis, future demand analysis, and evaluation of fire flow capability.
At the request of the KCWA, C&E has performed an update to the computer model whereby
new and replaced infrastructure components, changes in operation, etc. were included in the
computer model. This included incorporating all water facility improvement(s) that have taken
place since completion of the original model and updating the geometry of the hydraulic model.
It should be noted that this update did not include an update of consumer demand data, which is

2
typically performed at 3 –5 year intervals and is considered premature at this time as it will not
affect the model results. The update did however review the major users (i.e. those singly
identified consumers that use upwards of several million gallons of water per year) and the water
demand for these users was updated accordingly.
In addition, all of the water mains that were incorporated in the model update were also included
in the spreadsheets that represent the full system pipeline database maintained by the KCWA as
part of the Clean Water Infrastructure Replacement Plan (CWIRP). This is provided under
separate cover. This pipeline database is utilized by the KCWA to assist in identifying pipeline
infrastructure replacement projects and provides for a comprehensive cataloging of all pipelines
in the water system by location, size, material, year of installation and length.
1.2 Purpose and Scope
The performance of this computer hydraulic model update consisted of the following specific
tasks:
• Meet with KCWA staff to gather information relating to water system improvements
including obtaining copies of available record drawings, design plans and sketches for water
system improvement projects.
• Review with the KCWA staff any changes to system operations and procedures that may
alter the manner in which the water system is operated and maintained.
• Obtain the most current list of KCWA Board approved projects and include in the model
update. These projects are included (even if not yet constructed or operational) as they are
considered to be an allocation of water demands and should be considered when performing
future analysis with the model. Appropriately, the consumer demands associated with these
developments are also included.
• Modify the hydraulic model geometry and pipeline and junction node database files. This
was performed consistent with the naming and identification sequence that was developed as
part of the original model.

3
• Review the most recent consumer demand data for the large water users in the model
database and revise accordingly in the model demand database file.
• Perform average day, maximum day and peak hour simulations with the latest modifications
to the system geometry and system operational changes.
• Update the model Node and Pipeline Plan and provide hard copy of the plan at suitable scale
which is color-coded by pipe diameter.
• Prepare a report that presents the work completed and results of completed computer
modeling. Summarize the update and modifications to the hydraulic model including results
presentation and summary for each scenario.
It is intended that this updated hydraulic model will accurately depict the Average Day,
Maximum Day, and Peak Hour demand conditions of the KCWA existing water supply and
distribution system.

4
2.0 Water System Updates
2.1 General Service Area Description
The KCWA serves customers in the Towns of Coventry, East Greenwich, West Greenwich,
West Warwick and the City of Warwick. In addition, the KCWA serves customers in isolated
areas of Cranston, North Kingston, and Scituate. There are approximately 26,000 service
accounts (including residential, commercial/industrial, and governmental users) in these locales.
Two primary sources of water supply for the KCWA system are wholesale interconnections
through Providence Water and the City of Warwick (which also receives water from Providence
Water) and groundwater from wellfields that are owned and operated by KCWA.
KCWA’s existing piping system consists of approximately 377 miles of water main with pipe
sizes ranging from 2-inches to 24-inches in diameter (exclusive of customer service
connections). For purposes of the model, transmission mains are defined as water mains of 16-
inches or greater in diameter.
Elevations throughout the KCWA water system range from 15 feet Mean Sea Level (MSL) along
coastal areas to 400 feet MSL in West Greenwich in the southwestern portion of the system.
There are two (2) main transmission booster pump stations and six (6) system booster pump
stations in the KCWA system. The transmission pump stations boost water from the wholesale
interconnections into the system while the system booster pump stations increase pressure in
localized areas with high elevations to prevent these areas from experiencing low pressure
problems.
Based on historical data, the KCWA serves a residential population of approximately 70,000
people. A total of twenty (20) of the largest water consumers (i.e. consumers that use upward of
several million gallons of water or greater per year) were identified and included in the original
model. A majority of the large users consist of residential entities (trailer parks, condominium
associations, etc.), large industrial enterprises, a hospital, laundromats, etc.

5
2.2 Distribution and Transmission Pipeline Updates
C&E met with KCWA staff to identify those water mains that have been abandoned or replaced
as part of the ongoing Infrastructure Replacement Plan. In addition, new water mains, which
have been installed as part of the Capital Improvement Program, were also identified.
Information relating to the location, size, length, interconnection of the main into the system, etc.
were obtained from available record drawings, design plans, sketches, etc. This information was
then utilized to update the geometry of the hydraulic model in the computer model. Pipelines
that were added to the system were also included in the hydraulic model database and pipelines
that were removed from the system were completely removed from the hydraulic model
database. The following represents the significant changes in pipeline infrastructure broken
down by City and Town that was updated in the geometry of the hydraulic model.
COVENTRY LOCATION DESCRIPTION FROM TO
Sandy Bottom Rd. (Bridge) Replaced 111 feet of 8" CI pipe with 8" DI pipe Main St. South on Sandy Bottom Rd.Howard Ave. Replaced 100 feet of 6" CI pipe with 8" DI pipe Mumford St. Birch St. Pulaski St. Replaced 2,300 feet of 6" CI pipe with 12" DI pipe Washington St. WW Town Line Whitford St. Replaced 360 feet of 2" PVC pipe with 8" DI pipe Pulaski St. Washington St. Installed 450 feet of 8" DI pipe Pulaski St. Washington St. Colvintown Rd. Installed 6,850 feet of 8" DI pipe Meadowbrook Farm Rd. Hope Furnace Rd. Clarke Rd. Installed 655 feet of 20" DI pipe Clarke Rd. Knotty Oak Rd. Knotty Oak Rd. Replaced 9,584 feet of 20" AC pipe with 20" DI pipe Clarke Rd. Gervais St. Gervais St. Installed 4,121 feet of 20" DI pipe Knotty Oak Rd. Blackrock Rd. Replaced 3,747 feet of 8" AC pipe with 12" DI pipe Knotty Oak Rd. Blackrock Rd. Blackrock Rd. Replaced 787 feet of 8" AC pipe with 12" DI pipe Gervais St. Boston St. Removed 1,672 feet of 4" CI pipe, Fairview Ave. Congdon St. Replaced 3,723 feet of 8" AC pipe with 24" DI pipe Hill St. Fairview Ave. Installed 6,615 feet of 24" DI pipe Congdon St. Hornbeam Rd. Hill St. Replaced 4,336 feet of 8" AC pipe with 24" DI pipe Howard Ave. Blackrock Rd. Installed 1,674 feet of 24" DI pipe Colvin St. Howard Ave.

6
EAST GREENWICH LOCATION DESCRIPTION FROM TO
Courthouse Ln. Replaced 175' 4" CI pipe with 6" DI pipe Main St. Pierce St. First Ave. Replaced 80' 10" AC pipe with 12" DI pipe Cliff St. Second St. Main St. Replaced 1,360' 10" CI pipe with 10" DI pipe, London St. Vine St. Replaced 1,300' 10" AC pipe with 10" DI pipe, Cedar Ave. Sixth Ave. Replaced 225' 10" CI pipe with 10" DI pipe Vine St. Sixth Ave. Middle Rd. (Bridge) Replaced 280' 12" Steel pipe with 12" Steel pipe Spring Valley Dr. Cindy Ann Dr. Vine St. Replaced 175' 1" PE pipe with 6" DI pipe Marlborough St. Crompton Ave. Proctor Ave. Installed 172' new DI pipe Spring St. Hyland Ave.
SCITUATE LOCATION DESCRIPTION FROM TO
Seven Mile Rd. Replaced 1,200 feet of 16" AC pipe with 16" DI pipe Hope Rd. Seven Mile Rd. Reservoirs Replaced 45 feet of 16" AC pipe with 12" DI pipe Hope Rd. Hope Ave. Hope Ave. Installed 1,980 feet of 24" DI pipe Clinton Ave. Main St. Main St. Installed 5,151 feet of 24" DI pipe Clarke Rd. Hope Ave. Colvin St. Installed 1,250 feet of 24" DI pipe Clarke Rd. Hill St. Replaced 2,871 feet of 20" AC pipe with 24" DI pipe Clarke Rd. Jackson Flat Rd. Jackson Flat Rd. Installed 85 feet of 24" DI pipe Colvin St. Clinton Ave. Clinton Ave. Replaced 886 feet of 20" AC pipe with 24" DI pipe Jackson Flat Rd. Clinton Ave. PS Installed 1,387 feet of 24" DI pipe Clinton Ave. PS Hope Ave.
WARWICK LOCATION DESCRIPTION FROM TO
Love Ln. Replaced 441 feet of 8" CI pipe with 12" DI pipe Cowesett Rd. Bay View Ave. Replaced 1,034 feet of 8" AC pipe with 12" DI pipe Cowesett Rd. Bay View Ave. Creamer Ave. Replaced 15 feet of 6" AC pipe with 6" DI pipe Gerald St. East on Creamer Ave. Shattock Ave. Installed 241 feet of 6" DI pipe Arnolds Neck Dr. Hallworth Dr.
CRANSTON LOCATION DESCRIPTION FROM TO
Exchange St. Replaced 290' 8" CI pipe with 8" DI pipe Searle Ave. Wilbur Ave. Vinton Ave. Replaced 1,300' 6" CI pipe with 8" DI pipe, Searle Ave. Harrison Ave. Installed 300' new 8" DI pipe Harrison Ave. Oriole Ave. Turner Ave. Replaced 1,920' 6" CI pipe with 8" DI pipe Cranston St. Searle Ave. Olive Ave. Replaced 250' 6" AC pipe with 8" DI pipe, Angell Ave. Turner Ave. Installed 240' new 8" DI pipe Turner Ave. Vinton Ave. Searle Ave. Replaced 650' 6" AC pipe with 8" DI pipe, Lincoln Park Ave. Vinton Ave. Installed 510' new 8" DI Pipe Angell Ave. Turner Ave. Wheelock Ave. Replaced 150' 6" AC pipe with 8" DI pipe, Searle Ave. Wilbur Ave. Installed 320' new 8" DI pipe Searle Ave. Wilbur Ave. Angell Ave. Replaced 1,640' 6" AC pipe with 8" DI pipe Cranston St. Searle Ave. Harrison Ave. Replaced 480' 6" AC pipe with 8" DI pipe Angell Ave. Vinton Ave. Oriole Ave. Replaced 750' 6" AC pipe with 8" DI pipe Vinton Ave. Lincoln Park Ave.

7
WEST WARWICK LOCATION DESCRIPTION FROM TO
Highland Ave. Replaced 178 feet of 2" Galvanized pipe with 6" DI pipe Pleasant St. Douglas St.
Main St. (Clyde Bridge) Replaced 64 feet of 10" CI pipe with 10" DI pipe Maple Ave. East Main St.
Hay St. Replaced 357 feet of 2" Galvanized pipe with 8" DI pipe Junior St. North on Hay St.
Robinson Way Replaced 1,475 feet of 6" AC pipe with 8" DI pipe Orrin St. Pulaski St. Installed 255 feet of 8" DI pipe Orrin St. Pulaski St. Harbour Ave. Installed 550 feet of 8" DI pipe Bell St. North on Harbour Ave. Moretti St. Replaced 300 feet of 6" AC pipe with 8" DI pipe Robinson Way Pawtuxet Ter.
Pawtuxet Ter. Replaced 450 feet of 2" Galvanized pipe with 12" DI pipe West Warwick Ave. Harbour Ave.
Replaced 2,300 feet of 6" AC pipe with 12" DI pipe Pulaski St. Bleach Ave. Replaced 100 feet of 8" AC pipe with 12" DI pipe Bleach Ave. Matteson Ave. Installed 150 feet of 12" DI pipe Matteson Ave. Harbour Ave. Pulaski St. Replaced 3,700 feet of 6" CI pipe with 12" DI pipe Main St. Coventry Town Line Pine St. Installed 320 feet of 6" DI pipe Sunset Ave. Sunrise Ave.
2.3 Pressure Zone Updates
The existing KCWA water distribution system is divided into eight (8) distinct pressure zones
operating at varying hydraulic pressure gradients and five (5) of which service the majority of
the KCWA service territory. These five (5) pressure zones are as follows:
- Low Service (334 foot) Pressure Gradient
- Reduced Low Service (280 foot) Pressure Gradient
- High Service (500 foot) Pressure Gradient
- Reduced High Service (430 foot) Pressure Gradient
- Read School House Road (430 foot) Pressure Gradient
There also exist three (3) pressure service areas that provide service to isolated areas of the
system and include the following:
- Warwick Tanks (231 foot) Pressure Gradient
- Oaklawn Service (231 foot) Pressure Gradient
- Hope Road Booster Service (510 foot) Pressure Gradient

8
Since completion of the model, a new ninth pressure zone was created which is supplied directly
from the Low Service Pressure Gradient. The new pressure zone isolates the area in and around
the existing Tiogue Water Storage Tank that has an overflow elevation of 350 feet, which is
approximately 16 feet higher than the overflow of the remaining existing tanks in the Low
Service Pressure Gradient. The new pressure zone is roughly defined as the area located to the
north of Tiogue Avenue between Pembroke Lane and Wesleyan Avenue and to the south of
Tiogue Avenue between Ferris Drive and North Road.
A total of fifty (50) junction nodes and their corresponding pipe sections were converted to this
new pressure zone. A booster pump station located in proximity to the tank, which was designed
to boost water from the Low Service into the Tiogue Tank pressure zone, was also installed.
This duplex booster station contains two pumps each with a rated capacity of 400 gpm at 42 feet
TDH and was incorporated into the model. Control of the pump(s) is by the water level in the
Tiogue Tank.
2.4 Sources of Supply Updates
The KCWA maintains three (3) wellfields within its water supply and distribution system and
two (2) primary interconnections that supply one hundred percent of the source water to the
system. These well fields include the Mishnock Wells, the Spring Lake Well and the East
Greenwich Well that are owned and operated by the Authority. The two (2) interconnections
include the Clinton Avenue Booster Pump Station, which is supplied from Providence Water and
the Bald Hill Booster Pump Station, which is supplied from the City of Warwick (indirectly from
Providence Water). It should also be noted that the Clinton Avenue Pump Station is under
construction for the rehabilitation to increase the pumping capacity to the Low Service Gradient
from 12 MGD to 22 MGD. The new facility will be on line in June 2006 and the improvements
to the pumping supply have been included in this update. The improvements that involve
installing the two (2) new Read School House Road pumps in the Clinton Avenue Booster Pump
Station are not included in this update as it will be dependent upon the construction of related
infrastructure (i.e. new tank and water mains).

9
KCWA personnel have also indicated that the Mishnock Wells have been taken out of service
due to water quality issues and the Spring Lake Well has been taken out of service for well
reconstruction / redevelopment. These well stations are currently not utilized in any of the
hydraulic model simulations and will continue to remain as such in the model until further notice
from the KCWA. The following table describes the capacity of each supply source (wells and
pump stations) and the total supply available to the water system. The Spring Lake and
Mishnock Wells are included as it is anticipated that they will be returned to service in a timely
manner. It should be noted that all sources directly supply water to the Low Service Gradient.
TRANSMISSION SUPPLY SYSTEM PUMPING STATIONS
SUPPLY SOURCE PUMP / WELL CAPACITY SUPPLY CAPACITY
IN GPM (MGD)
Mishnock Wells 1 at 370 gpm 1 at 700 gpm 1,070 gpm (1.54 MGD)
Spring Lake/Coventry Well 1 at 350 gpm 350 gpm (0.50 MGD)
East Greenwich Well (b) 1 at 1,700 gpm 1,100 gpm (1.58 MGD) Clinton Avenue Pump Station (a) 5 at 3,820 gpm 15,280 gpm (22.0 MGD)
Bald Hill Road Pump Station (a, b)
3 at 2,400 gpm 1 at 2,100 gpm 5,000 gpm (7.20 MGD)
TOTAL SUPPLY
22,800 gpm (32.8 MGD)
a One of the largest pumps at these facilities is considered to be an in line spare / backup and is
not considered in the total available supply capacity. b Pump station capacity limited due to pump curve head conditions.
2.5 Interconnection Updates
The primary source of water supply for the KCWA is through wholesale interconnections
through Providence Water and the City of Warwick. The wholesale interconnections directly
through Providence Water include the Clinton Avenue Pump Station and the Oaklawn Avenue
10
Interconnection. The Oaklawn Avenue Interconnection provides service to a segregated small
portion of the system in Cranston. The wholesale interconnections through the City of Warwick
consist of the Bald Hill Road Pump Station and the Potowomut Interconnection. The
Potowomut Interconnection is for the sale of water to Warwick. No updates were required (with
exception to the Clinton Avenue Pump Station) to the model as there have been no modifications
to these interconnection facilities.
The Clinton Avenue Pump Station is under construction for the rehabilitation to increase the
pumping capability to the Low Service Gradient. The new facility is anticipated to be on line in
June 2006 and the improvements to the Low Service Gradient pumping supply have been
included in this update.
2.6 Water Storage Facility Updates
The KCWA water supply system contains a total of ten (10) water storage facilities. The West
Street Tank is offline and isolated from the system and the Seven Mile Road Reservoirs
(Fiskeville Tanks) remain full due to inherent pump head conditions in the model (i.e. “locked
up” condition) and maintain similar status in this update.
As indicated in Section 2.3, the KCWA has completed a project to create a new pressure zone in
and around the Tiogue Tank so that the pressure gradient is maintained with the overflow
elevation of the Tiogue Tank. The Tiogue Tank is located within this new temporary pressure
zone and has been updated in the model.
2.7 Distribution System Pumping Facility Updates
The KCWA owns and operates a total of six (6) distribution system booster pump stations
(Setian Lane, West Warwick Industrial Park, Johnson Boulevard, Knotty Oak, Hope Road and
Tiogue) and two (2) transmission booster pump stations located at the primary wholesale
interconnections. The supply capacity of the transmission pumping stations was previously
discussed in Section 2.4. As previously indicated, the addition of the Tiogue Booster Pump
Station was included in this model update. The Tiogue Booster Pump Station contains two (2)
pumps each with a rated capacity of 400 gpm. This pump station boosts water from the Low

11
Service Pressure Gradient directly into the Tiogue Pressure Gradient. The following tables
depict the capacity of each distribution system pumping facility including the pressure zone to
which it supplies. The total available source of supply was previously evaluated under Sections
2.4 and 2.5. These facilities are not considered a source of supply to the system as they are
utilized to boost pressure from the Low Service Gradient to the identified Pressure Service
Gradients.
DISTRIBUTION SYSTEM PUMPING STATIONS
High Service (500 foot) Pressure Gradient
BOOSTER PUMP
STATION * TOTAL PUMP CAPACITY
RATED CAPACITY
IN GPM (MGD)
Johnson Boulevard Pump Station
1 at 1,200 gpm 2 at 2,300 gpm 3,500 gpm (5.04 MGD)
W. Warwick Business Park Pump Station 2 at 750 gpm 750 gpm (1.08 MGD)
Setian Lane Pump Station 2 at 750 gpm 750 gpm (1.08 MGD)
TOTAL PUMPING
5,000 gpm (7.20 MGD)
Intermediate Service (430 foot) Pressure Gradient
BOOSTER PUMP
STATION * TOTAL PUMP CAPACITY
RATED CAPACITY
IN GPM (MGD)
Knotty Oak Pump Station 2 at 1,300 GPM pumps
1,300 gpm (1.87 MGD)
TOTAL PUMPING
1,300 gpm (1.87 MGD)

12
Tiogue Tank Service (350 foot) Pressure Gradient
BOOSTER PUMP
STATION * TOTAL PUMP CAPACITY
RATED CAPACITY
IN GPM (MGD)
Tiogue Tank Pump Station
2 at 400 gpm
400 gpm (0.576 MGD)
TOTAL PUMPING
400 gpm (0.576 MGD)
Hope Road Service (510 foot) Pressure Gradient
BOOSTER PUMP
STATION * TOTAL PUMP CAPACITY
RATED CAPACITY
IN GPM (MGD)
Hope Road Pump Station
2 at 10 gpm
10 gpm (0.014 MGD)
TOTAL PUMPING
10 gpm (0.014 MGD)
* One of the largest pumps at these facilities is considered to be an in line spare / backup and is
not considered in the total available supply capacity.

13
3.0 System Demand Updates 3.1 Large User Demand Updates
The demand database in the model for the previously identified large users was reviewed and
updated as appropriate based on the latest demand data information. This list was reviewed and
any large users which were no longer within the water system were removed from the model and
any new large users were included in the model update. There were no new large users nor were
there any previous large users which had been removed from the latest list. The following table
details each of the large users with their previous total annual usage and their current total annual
usage. The model was updated with the most current demand data information.
WATER SYSTEM LARGE USERS
2002 TOTAL ANNUAL USAGE
(GAL)
2005 TOTAL ANNUAL USAGE
(GAL)
% CHANGE +/-
Riverpoint Lace Works 24,491,764 24,469,324 -0.09% Soluol Chemical Co. 11,335,192 11,756,316 +3.6% Bradford Soap Works 8,660,942 14,335,719 +39.6% Kent County Hospital 36,521,743 36,056,629 -1.3%
Cowesett Hills 20,023,960 18,288,600 -8.7% Briarwood Meadows 19,051,560 23,404,920 +18.6% Vishay Electro Films 24,654,080 9,555,700 -61.2%
AIMCO Warwick LLC 19,714,288 14,601,708 -25.9% Amgen 68,507,824 177,261,040 +61.4% G-Tech 16,074,520 13,538,800 -15.8%
ON Semiconductor 194,761,248 157,333,572 -19.2% Amtrol Inc. 19,103,920 29,014,920 +34.2%
Edens & Avent. 9,925,960 11,893,200 +16.5% Arkwright Interlaken 12,056,309 11,636,950 -3.5%
Clariant 158,473,524 131,449,032 -17.1% Westwood Trailer Park 26,711,080 26,494,160 -0.81% Quaker Valley Condo 16,270,496 7,240,640 -55.5%
Equity Residential Prop. Trust 9,110,640 10,068,080 +9.5% Haven Eldercare of New England 9,646,956 12,606,044 +23.5%
Sherwood Valley Trailer Park 9,113,632 7,649,796 -16.1% TOTALS 714,209,638 748,655,150 +4.6%
The total cumulative demand from the large users increased by 4.6% or approximately 34.5
million gallons a year. The most significant increase in water use occurred for Amgen and
which was approximately 108.6 million gallons per year. The most significant decrease in water
use occurred for ON Semiconductor and which was approximately 37.4 million gallons per year,

14
or approximately 100,000 gallons per day. It anticipated that the water use from this customer
will continue to decline in the future.
KCWA’s wholesale interconnection to the City of Warwick is represented in the hydraulic
model as a wholesale large user and is not identified in the largest consumer users in the table
above. The KCWA wholesales water to the City of Warwick at the Potowomut interconnection
on Post Road. This wholesale volume of water was not modified in this model update.
3.2 Approved Developments
The model update included incorporating all significant KCWA Board approved developments
within the service territory since completion of the original model. This included all new water
piping infrastructure, interconnection(s) to the water system and consumer demands for average
day, maximum day and peak hour simulations. The following table depicts the specific
developments that have been approved by the KCWA, their location in the system, descriptive
use (i.e. residential, commercial, etc.), pressure zone location and anticipated demand.
The KCWA Regulations require that specific hydraulic model assessments be performed for all
proposed residential developments containing ten (10) or more residences or condominium units,
all industrial facilities and all commercial facilities, or the equivalent thereof. The assessments
are performed to ensure that the KCWA water system has adequate supply and water utility
infrastructure in order to provide these developments with sufficient domestic and fire flow at
adequate pressure. Hydraulic model assessments have been performed for the developments
listed in the table.
DEVELOPMENT LOCATION DESCRIPTION PRESSURE ZONE
AVG. DAY
DEMAND (GPM)
MAX. DAY
DEMAND (GPM)
Signal Ridge EG Re-service, EG Residential High Service 141.1 324.5 Rose Farm Frenchtown Rd., EG Residential High Service 1.11 2.6 Birchwood Glen Kulus Rd., WW Residential High Service 2.78 6.4 Middle Woods Middle Rd., EG Residential High Service 27.8 63.9 Shippeetown Rd. Subdivision
Shippeetown Rd., EG Residential High Service 6.67 15.3
Amgen Technology Way, Industrial High Service 833.3 1,500.0

15
DEVELOPMENT LOCATION DESCRIPTION PRESSURE ZONE
AVG. DAY
DEMAND (GPM)
MAX. DAY
DEMAND (GPM)
WG Sandra Court Reservoir Rd., COV Residential High Service 1.81 4.2 Chole Court Clark Rd., COV Residential High Service 2.08 4.8 Hawk Crest Est. Hill Farm Rd., COV Residential High Service 12.2 28.1 Crystal Creek Middle Rd., EG Residential High Service 9.58 22.0 Long Meadow Frenchtown Rd., EG Residential High Service 8.33 19.2 Middle Hollow Middle Rd., EG Residential High Service 2.78 6.4 Blueberry Hill Shippeetown Rd., EG Residential High Service 7.78 17.9 Hidden Ridge
Shippeetown Rd., EG Residential High Service 8.89 20.4
Green Farm Squirrel Ln./Tillinghast Rd., EG
Residential High Service 6.67 13.3
Dunkin Donuts New London Turnpike
Commercial High Service 1.3 2.0
Chiropractic Center Nooseneck Hill Rd., WG
Commercial High Service 0.63 0.9
Randolph Bank Center of New England, COV
Commercial High Service 1.0 1.5
Leisure Condo Nooseneck Hill Rd., COV
Condominiums High Service 13.9 27.8
Coventry Lumber Nooseneck Hill Rd., COV
Commercial High Service 1.0 1.5
Home Depot Center of New England, COV
Commercial High Service 1.7 2.6
Arlington RV Division Rd., WG Commercial High Service 3.5 5.3 Brooks Pharmacy Division Rd., EG Commercial High Service 10.4 15.6 Pine Ridge Hopkins Hill Rd.,
COV Residential High Service 28.8 66.2
Westwood Apartments
Reservoir Rd., COV Apartments High Service 4.9 9.8
Wingate Hotel CNE Universal Blvd., COV
Hotel High Service 2.0 4.0
Wal-Mart CNE Boulevard, COV
Commercial High Service 1.7 2.6
Dunkin Donuts Hopkins Hill Rd., WG
Commercial High Service 1.3 2.0
Maple Root Center Nooseneck Hill Rd., COV
Commercial High Service 1.7 2.6
Deer Run Carr Pond Rd., WG Residential High Service 13.0 29.9 Gentry Glen Condos
Crompton Rd., WW Condominiums High Service 13.0 25.8
Retail Pad A Center of New England, COV
Commercial High Service 1.3 2.0
GrandVille @ Center of New Condominiums High Service 31.1 77.8

16
DEVELOPMENT LOCATION DESCRIPTION PRESSURE ZONE
AVG. DAY
DEMAND (GPM)
MAX. DAY
DEMAND (GPM)
Greenwich England, WG 184 Homes Maude Ave., COV Residential High Service 19.7 45.3 Carriage House Condos
Reservoir Rd., COV Condominiums Reduced High Service
3.3 6.7
Greenview Condominiums
Prospect Hill Ave., WW
Condominiums Low Service 12.5 26.7
Guillemette Place Sunrise Ave., WW Residential Low Service 3.34 7.12 Sunrise View 2 Sunrise Ave., WW Residential Low Service 4.17 8.9 Sunrise View 3 Sunrise Ave., WW Residential Low Service 6.67 14.2 Sun Valley Mobile Homes
South County Tr., EG Residential Low Service 13.3 28.5
DeGraide Farms Hornbeam Rd., COV Residential Low Service 17.9 38.3 Royal Mills Providence St., WW Apartments Low Service 60.7 151.8 EG Medical Center South County Tr., EG Commercial Low Service 2.36 5.43 Legris Ave. Condos Legris Ave., WW Condominiums Low Service 7.5 17.25 TOTAL APPROVED
DEMAND (GPM) 1,356.55 2,679.10

17
4.0 Hydraulic Model Simulation Updates 4.1 Simulations Overview
Hydraulic model simulations were performed for average day, maximum day and peak hour
demand scenarios with the latest modifications to the system geometry and updates in system
operations included in the hydraulic model. The following sections describe the simulations for
each demand scenario and the results of the simulations.
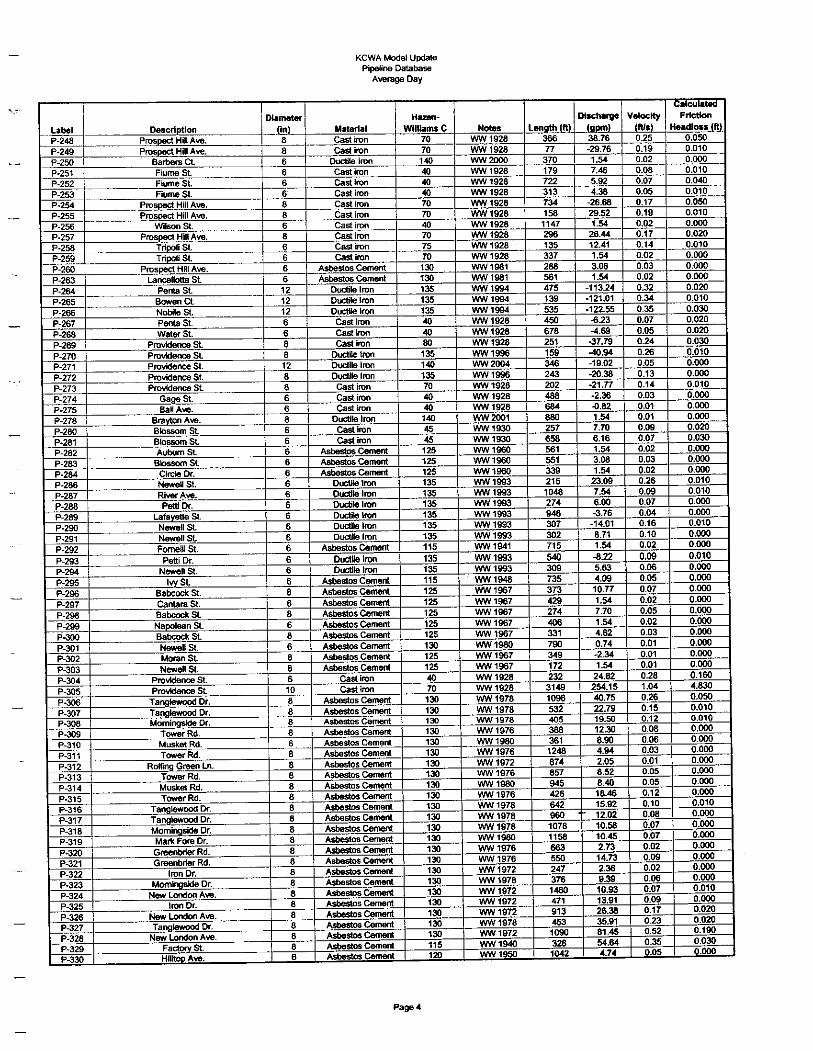
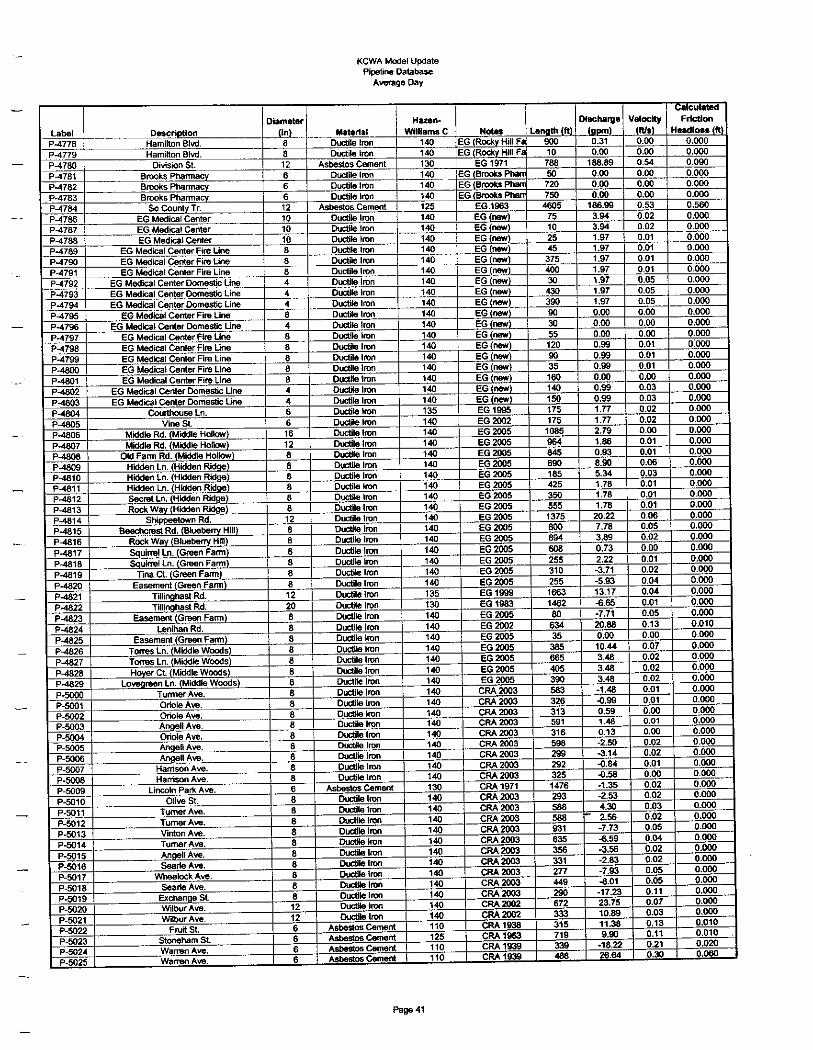
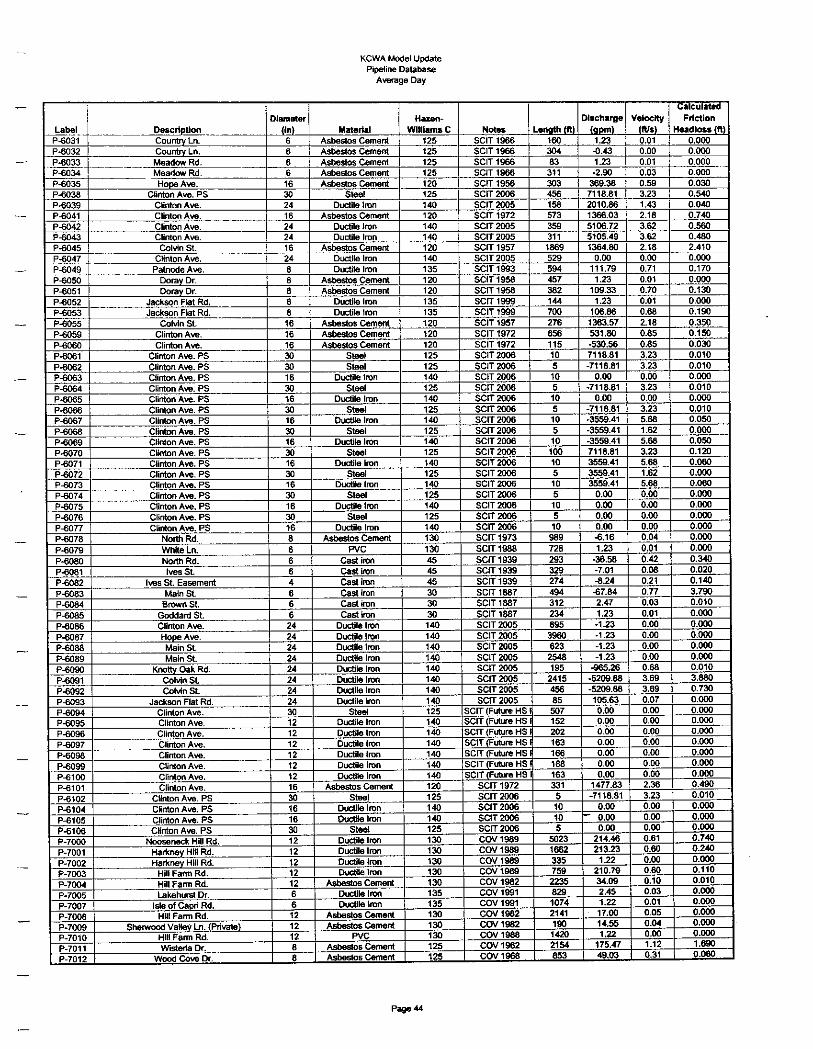
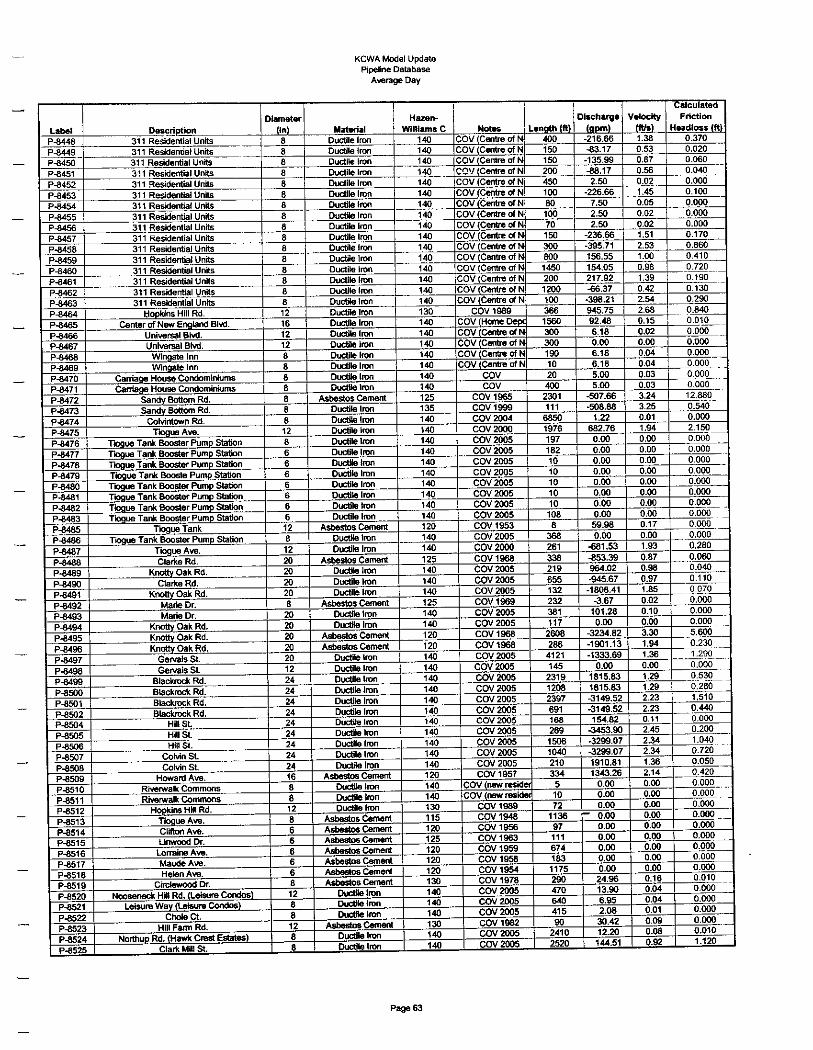
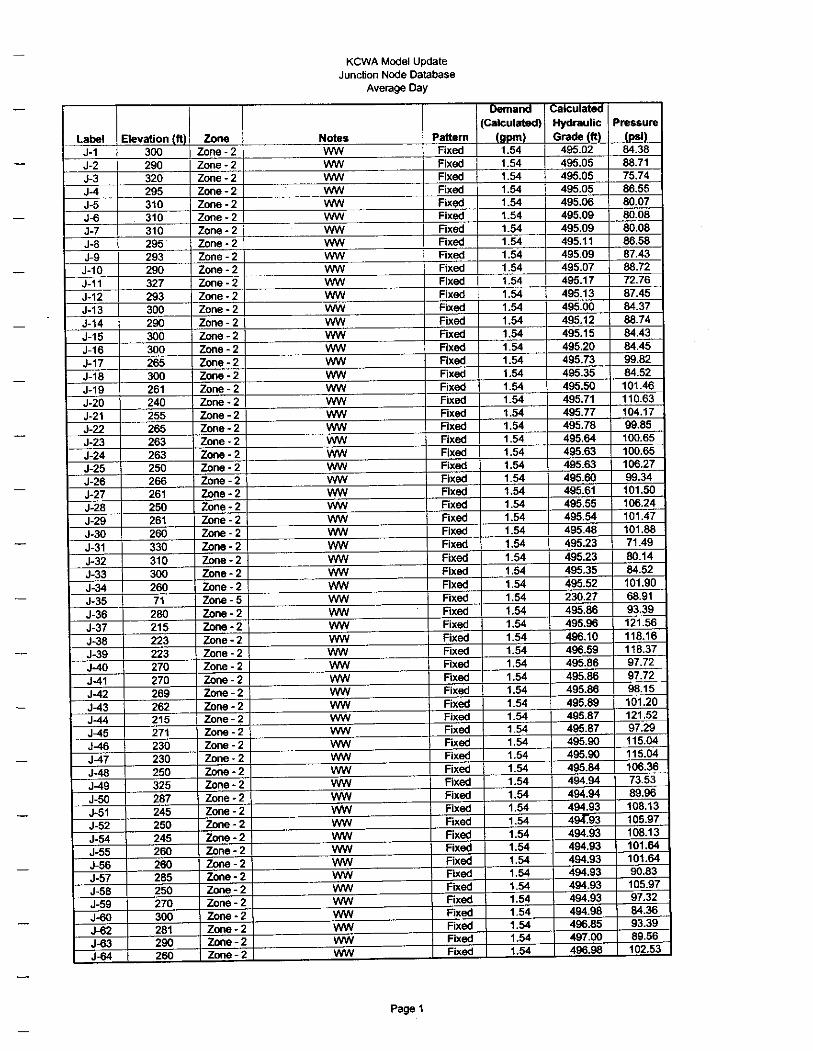
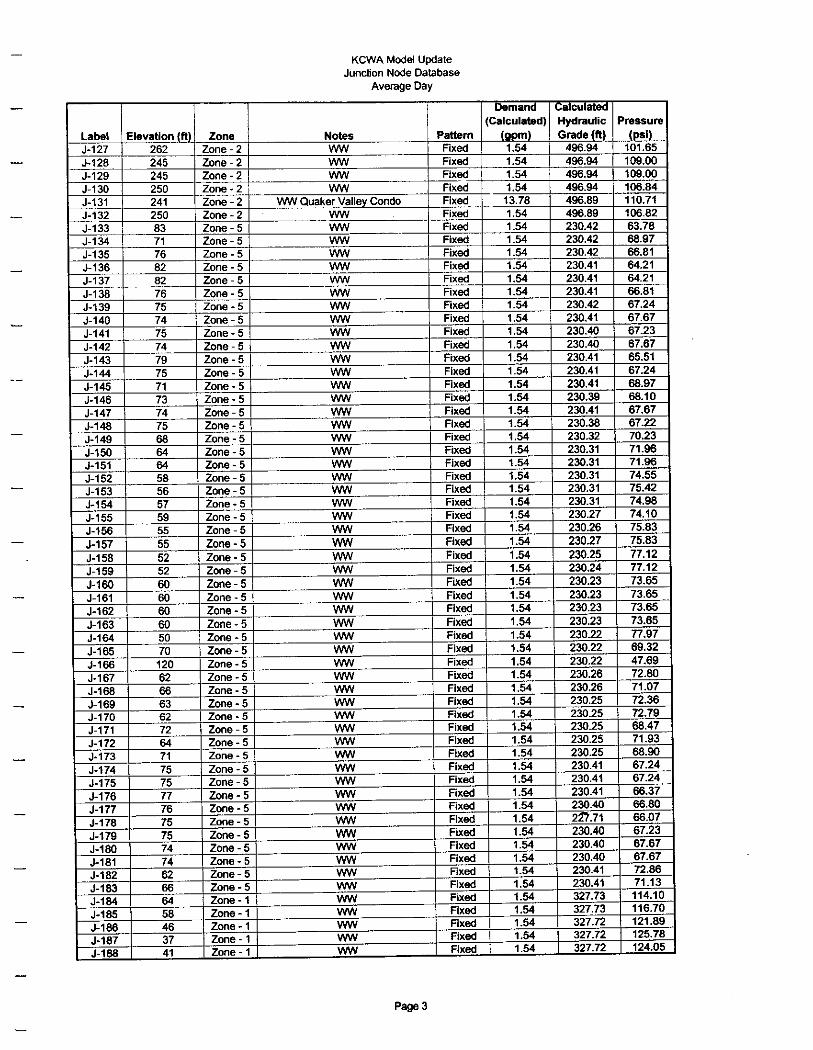
4.2 Average Day Simulation A complete summary of this simulation is provided in Appendix A. Average Day Initial Modeling Conditions:
The following is a summary of the initial model conditions (i.e. tank levels, pumps on / off, etc.)
categorized by the various pressure gradients. The “status” provides indication if the facility is
either on/off for this simulation. A designation of “off” implies that it is not active during the
simulation but is available for service. A designation of “offline” or “out of service” implies that
this facility cannot be used for service.
Facility Status Low Service (334’) Gradient - Setian Lane Tank 332 feet - Seven Mile Road Reservoirs “Locked Up” – pressure head from
pump station - Frenchtown Road Tank 332 feet - Wakefield Street Tank 327 feet - West Street Tank Out of Service - Offline - Mishnock Wells Off - East Greenwich Well On - Spring Lake (Coventry) Well Off - Clinton Avenue Pump Station On – Two Pumps Active - Bald Hill Road Pump Station On – One Pump Active Tiogue Tank (350’) Gradient - Tiogue Avenue Tank 345 feet - Tiogue Booster Pump Station Off

18
Intermediate High (430’) Gradient - Read School House Road Tank 427 feet - Knotty Oak Pump Station On – One Pump Active High Service (500’) Gradient - Technology Park Tank 495 feet - Carrs Pond Tank 495 feet - Johnson Boulevard Pump Station On – One Pump Active (small pump) - West Warwick Business Park Pump Station Off - Setian Lane Booster Pump Station On – One Pump Active Low Service Reduced (334’) Gradient - Centerville Road PRV Station Active - Open - Division Road PRV Station Active - Open - Middle Road PRV Station Active - Open - Cowesett Road PRV Station Active - Open - Love Lane PRV Station Active - Open - Post Road PRV Station Active - Open High Service (500’) Reduced Gradient - Mishnock Road PRV Station Active – Open - Helen Ave. PRV Station Active – Open Warwick Wholesale Interconnection (232’) Gradient - Wholesale Connection to Warwick/Bald Hill PS Active - Open Hope Road (510’) Gradient - Hope Road Booster Pump Station Active – Hydro Pneumatic Tank Oaklawn (231’) Gradient - Wholesale Connection to Providence Water Active - Open Average Day Results Summary:
This scenario was premised on a total consumer system demand of 8,074 gpm (11.6 MGD),
which is the total system demand including “unaccounted” water volume. The scenario indicates
that the total volume of flow being stored in the tanks (aggregate volume going to storage tanks)
is equal to 2,426 gpm (3.5 MGD). Overall, the hydraulic gradients for the various pressure zones
were calculated to be in the range in which these pressure zones are normally operated.
Facility Output Results Summary Low Service (334’) Gradient - Setian Lane Tank Filling 307 gpm

19
- Seven Mile Road Reservoirs “Locked Up” – pressure head from pump station - Frenchtown Road Tank Filling 338 gpm - Wakefield Street Tank Filling 853 gpm - West Street Tank Out of Service - Offline - Mishnock Wells Off - East Greenwich Well 1,129 gpm output - Spring Lake (Coventry) Well Off - Clinton Avenue Pump Station 7,119 gpm output - Bald Hill Road Pump Station 1,998 gpm output Tiogue Tank (350’) Gradient - Tiogue Avenue Tank Draining 60 gpm - Tiogue Booster Pump Station Off Intermediate High (430’) Gradient - Read School House Road Tank Filling 1,093 gpm - Knotty Oak Pump Station 1,369 gpm output High Service (500’) Gradient - Technology Park Tank Filling 102 gpm - Carrs Pond Tank Draining 208 gpm - Johnson Boulevard Pump Station 1,198 gpm output - West Warwick Business Park Pump Station Off - Setian Lane Booster Pump Station 834 gpm output Low Service Reduced (334’) Gradient - Centerville Road PRV Station Open 173 gpm - Division Road PRV Station Open 330 gpm - Middle Road PRV Station Open 275 gpm - Cowesett Road PRV Station Open 197 gpm - Love Lane PRV Station Open 326 gpm - Post Road PRV Station Inactive - Closed High Service (500’) Reduced Gradient - Mishnock Road PRV Station Open 279 gpm - Helen Ave. PRV Station Open 88 gpm Warwick Wholesale Interconnection (232’) Gradient - Wholesale Connection to Warwick/Bald Hill PS 2,001 gpm Hope Road (510’) Gradient - Hope Road Booster Pump Station 4.44 gpm output Oaklawn (231’) Gradient - Wholesale Connection to Providence Water 251 gpm

20
4.3 Maximum Day Simulation A complete summary of this simulation is provided in Appendix B. Maximum Day Initial Modeling Conditions:
The following is a summary of the initial model conditions (i.e. tank levels, pumps on / off, etc.)
categorized by the various pressure gradients:
Facility Status Low Service (334’) Gradient - Setian Lane Tank 332 feet - Seven Mile Road Reservoirs “Locked Up” – pressure head from pump station - Frenchtown Road Tank 332 feet - Wakefield Street Tank 327 feet - West Street Tank Out of Service - Offline - Mishnock Wells Off - East Greenwich Well On - Spring Lake (Coventry) Well Off - Clinton Avenue Pump Station On – Three Pumps Active - Bald Hill Road Pump Station On – Three Pumps Active Tiogue Tank (350’) Gradient - Tiogue Avenue Tank 345 feet - Tiogue Booster Pump Station Off Intermediate High (430’) Gradient - Read School House Road Tank 427 feet - Knotty Oak Pump Station On – One Pump Active High Service (500’) Gradient - Technology Park Tank 495 feet - Carrs Pond Tank 495 feet - Johnson Boulevard Pump Station On – Two Pumps Active (1 small, 1 large) - West Warwick Business Park Pump Station On – One Pump Active - Setian Lane Booster Pump Station On – One Pump Active Low Service Reduced (334’) Gradient - Centerville Road PRV Station Active - Open - Division Road PRV Station Active - Open - Middle Road PRV Station Active - Open - Cowesett Road PRV Station Active - Open - Love Lane PRV Station Active - Open

21
- Post Road PRV Station Active - Open High Service (500’) Reduced Gradient - Mishnock Road PRV Station Active – Open - Helen Ave. PRV Station Active – Open Warwick Wholesale Interconnection (232’) Gradient - Wholesale Connection to Warwick Active - Open Hope Road (510’) Gradient - Hope Road Booster Pump Station Active – Hydro Pneumatic Tank Oaklawn (231’) Gradient - Wholesale Connection to Providence Water Active - Open Maximum Day Results Summary:
This scenario was premised on a total consumer system demand of 15,465 gpm (22.3 MGD),
which is the system demand including “unaccounted” water volume. The scenario indicates that
the total volume of flow being stored in the tanks (aggregate volume going to storage tanks) is
equal to 997 gpm (1.4 MGD). Overall, the hydraulic gradients for the various pressure zones
were calculated to be in the range in which these pressure zones are normally operated.
Facility Output Results Summary Low Service (334’) Gradient - Setian Lane Tank Draining 17 gpm - Seven Mile Road Reservoirs “Locked Up” – pressure head from pump station - Frenchtown Road Tank Draining 307 gpm - Wakefield Street Tank Filling 179 gpm - West Street Tank Out of Service - Offline - Mishnock Wells Off - East Greenwich Well 1,144 gpm output - Spring Lake (Coventry) Well Off - Clinton Avenue Pump Station 9,716 gpm output - Bald Hill Road Pump Station 5,083 gpm output Tiogue Tank (350’) Gradient - Tiogue Avenue Tank Draining 122 gpm - Tiogue Booster Pump Station Off Intermediate High (430’) Gradient - Read School House Road Tank Filling 862 gpm

22
- Knotty Oak Pump Station 1,426 gpm output High Service (500’) Gradient - Technology Park Tank Draining 35 gpm - Carrs Pond Tank Filling 437 gpm - Johnson Boulevard Pump Station 2,908 gpm output - West Warwick Business Park Pump Station 872 gpm output - Setian Lane Booster Pump Station 823 gpm output Low Service Reduced (334’) Gradient - Centerville Road PRV Station Open 417 gpm - Division Road PRV Station Open 480 gpm - Middle Road PRV Station Open 365 gpm - Cowesett Road PRV Station Open 521 gpm - Love Lane PRV Station Open 272 gpm - Post Road PRV Station Open 535 gpm High Service (500’) Reduced Gradient - Mishnock Road PRV Station Open 312 gpm - Helen Ave. PRV Station Open 407 gpm Warwick Wholesale Interconnection (232’) Gradient - Wholesale Connection to Warwick/Bald Hill PS 5,090 gpm Hope Road (510’) Gradient - Hope Road Booster Pump Station 9.04 gpm output Oaklawn (231’) Gradient - Wholesale Connection to Providence Water 512 gpm 4.4 Peak Hour Simulation A complete summary of this simulation is provided in Appendix C. Peak Hour Initial Modeling Conditions:
The following is a summary of the initial model conditions (i.e. tank levels, pumps on / off, etc.)
categorized by the various pressure gradients:
Facility Status Low Service (334’) Gradient - Setian Lane Tank 332 feet - Seven Mile Road Reservoirs “Locked Up” – pressure head from pump station - Frenchtown Road Tank 332 feet

23
- Wakefield Street Tank 327 feet - West Street Tank Out of Service - Offline - Mishnock Wells Off - East Greenwich Well On - Spring Lake (Coventry) Well Off - Clinton Avenue Pump Station On – Three Pumps Active - Bald Hill Road Pump Station On – Three Pumps Active Tiogue Tank (350’) Gradient - Tiogue Avenue Tank 345 feet - Tiogue Booster Pump Station Off Intermediate High (430’) Gradient - Read School House Road Tank 427 feet - Knotty Oak Pump Station On – One Pump Active High Service (500’) Gradient - Technology Park Tank 495 feet - Carrs Pond Tank 495 feet - Johnson Boulevard Pump Station On – Two Pumps Active (1 small, 1 large) - West Warwick Business Park Pump Station On – One Pump Active - Setian Lane Booster Pump Station On – One Pump Active Low Service Reduced (334’) Gradient - Centerville Road PRV Station Active - Open - Division Road PRV Station Active - Open - Middle Road PRV Station Active - Open - Cowesett Road PRV Station Active - Open - Love Lane PRV Station Active - Open - Post Road PRV Station Active - Open High Service (500’) Reduced Gradient - Mishnock Road PRV Station Active – Open - Helen Ave. PRV Station Active – Open Warwick Wholesale Interconnection (232’) Gradient - Wholesale Connection to Warwick/Bald Hill PS Active - Open Hope Road (510’) Gradient - Hope Road Booster Pump Station Active – Hydro Pneumatic Tank Oaklawn (231’) Gradient - Wholesale Connection to Providence Water Active - Open

24
Peak Hour Results Summary:
This scenario was premised on a total system demand of 17,962 gpm (25.9 MGD), which is the
system demand including “unaccounted” water volume. The scenario indicates that the total
volume of flow being depleted from the tanks (aggregate volume draining out of storage tanks) is
equal to 1,030 gpm (1.5 MGD). Overall, the hydraulic gradients for the various pressure zones
were calculated to be in the range in which these pressure zones are normally operated.
Facility Output Results Summary Low Service (334’) Gradient - Setian Lane Tank Draining 414 gpm - Seven Mile Road Reservoirs “Locked Up” – pressure head from pump station - Frenchtown Road Tank Draining 687 gpm - Wakefield Street Tank Draining 193 gpm - West Street Tank Out of Service - Offline - Mishnock Wells Off - East Greenwich Well 1,149 gpm output - Spring Lake (Coventry) Well Off - Clinton Avenue Pump Station 10,025 gpm output - Bald Hill Road Pump Station 5,162 gpm output Tiogue Tank (350’) Gradient - Tiogue Avenue Tank Draining 139 gpm - Tiogue Booster Pump Station Off Intermediate High (430’) Gradient - Read School House Road Tank Filling 771 gpm - Knotty Oak Pump Station 1,413 gpm output High Service (500’) Gradient - Technology Park Tank Draining 436 gpm - Carrs Pond Tank Filling 68 gpm - Johnson Boulevard Pump Station 2,838 gpm output - West Warwick Business Park Pump Station 877 gpm output - Setian Lane Booster Pump Station 830 gpm output Low Service Reduced (334’) Gradient - Centerville Road PRV Station Open 496 gpm - Division Road PRV Station Open 538 gpm - Middle Road PRV Station Open 414 gpm - Cowesett Road PRV Station Open 626 gpm - Love Lane PRV Station Open 351 gpm

25
- Post Road PRV Station Open 579 gpm High Service (500’) Reduced Gradient - Mishnock Road PRV Station Open 385 gpm - Helen Ave. PRV Station Open 500 gpm Warwick Wholesale Interconnection (232’) Gradient - Wholesale Connection to Warwick/Bald Hill PS 5,171 gpm Hope Road (510’) Gradient - Hope Road Booster Pump Station 10.31 gpm output Oaklawn (231’) Gradient - Wholesale Connection to Providence Water 588 gpm 4.5 Summary and Conclusions The hydraulic model update consisted of modifying the model geometry to represent changes in
the water system infrastructure and changes in operation of the water system, updating the
consumer demand data for the large water users and including the consumer demands of all the
developments that were approved by the KCWA Board. Once these updates were completed,
average day, maximum day and peak hour model simulations were performed with the latest
modifications to the system geometry and system operational changes. The following table
summarizes the water system demand for the updated hydraulic model compared to the water
system demands contained in the original model.
MODELING SCENARIO
ORIGINAL MODEL MODEL UPDATE % CHANGE +/-
Average Day System Demand 7,244 gpm (10.4 MGD) 8,074 gpm (11.6 MGD) +10.3%
Maximum Day System Demand 13,543 gpm (19.5 MGD) 15,465 gpm (22.2 MGD) +12.4%
Peak Hour System Demand 15,315 gpm (22.1 MGD) 17,962 gpm (25.9 MGD) +14.7%
The results of the updated model simulations indicate that the KCWA water system demand has
increased under all of the demand scenarios (average day, maximum day, peak hour). On
average the increase is 12.5%. The following table summarizes the consumer demand for each
pressure zone under the various demand scenarios.

26
PRESSURE ZONE DEMAND SCENARIO DEMAND (GPM)
Low Service (334’) Gradient Average Day Maximum Day
Peak Hour
4,040 7,459 8,653
Tiogue Tank (350’) Gradient Average Day Maximum Day
Peak Hour
60 122 139
Intermediate High (430’) Gradient Average Day Maximum Day
Peak Hour
276 563 642
High Service (500’) Gradient Average Day Maximum Day
Peak Hour
1,773 3,487 4,037
Low Service Reduced (334’) Gradient
Average Day Maximum Day
Peak Hour
1,299 2,588 3,000
High Service (500’) Reduced Gradient
Average Day Maximum Day
Peak Hour
367 719 885
Warwick Wholesale Interconnection (232’) Gradient
Average Day Maximum Day
Peak Hour
4 7 8
Hope Road (510’) Gradient Average Day Maximum Day
Peak Hour
4 9 10
Oaklawn (231’) Gradient Average Day Maximum Day
Peak Hour
251 511 588