Embed Size (px)
Citation preview

Working with our communities for a better environment E mahi ngatahi e pai ake ai te taiao
Hydraulic Design of the Awarua DrainStopbanksPrepared by Peter West, Environmental Engineer
Environment Bay of PlentyOperations Publication 2007/04
5 Quay StreetP O Box 364WhakataneNEW ZEALAND
ISSN 1176 - 5550

Environment Bay of Plenty
Operations Publication 2007/04 Hydraulic Design of the Awarua Drain Stopbanks
i
Executive Summary
This report outlines recent computer modelling of the Awarua Drain for the purposes of designing flood protection works following the diversion of the Waitepuru Stream in May 2005.
Earlier modelling by Environment Bay of Plenty investigated the potential benefit of incorporating a flood detention pond and control gate structure into the Awarua Drain system. That modelling found that there was little to be gained by building a control gate and that the best method of improving flood protection was to increase flood storage of the Awarua Drain by building a stopbank along the right bank of the drain, the left bank being largely boundered by high ground.
Geotechnical advice was received in mid April 2007 that necessitated a major change to the alignment of the proposed stopbank. Also aerial survey data (LiDAR) became available for the entire subject site in early 2007. The system was remodelled in May 2007 to make use of the LiDAR data and to incorporate the design changes.
The new system is to contain floodwaters within the Awarua Drain channel during the critical 100 year ARI hydrological event with 300 mm operational freeboard. The design also includes allowances for anticipated sea level rise and increased rainfall intensities due to global climate change to the year 2080. The design was takes into account that much of the Waitepuru Stream catchment discharge will be diverted back through its previous channel to the north. This level of protection was directed by Environment Bay of Plenty’s Manager Technical Services and addresses floodwater only. This design work does not consider any effects due to sedimentation or debris type discharges into the system.
Modelling was also carried out to assess the over-design performance of the system should the critical 100 year event occur before the upstream Waitepuru Stream Diversion Works could be implemented or in the case of the full Waitepuru discharge being released for whatever reason some time in the future.
The critical 100 year ARI design event was found to be a 100 year ARI rainstorm in the local catchment combined with a 20 year ARI sea level and a 20 year ARI Tarawera River flow. The drainage system was found to be very sensitive to the timing of the rainfall peak, with higher water levels experienced if the rain peaked later in the event.
Design water levels were found to be 1.9m R.L. (above mean sea level, Moturiki Datum) over much of the drain’s length with 2.2m at the extreme upstream end.
It was found that even without the diversion structure on the Waitepuru Stream, i.e. if the entire Waitepuru Stream discharge contributed to the Awarua Drain system, then the proposed bank would not overtop during the currently estimated 100 year ARI event (no climate change factors).
For the 100 year ARI total discharge (non-diverted) scenario with global climate change (increased rainfall intensity and sea level rise) and maximum operational wear on the bank included in the estimate; approximately 25,000 m3 of floodwater would spill onto the farms during the critical 100 year ARI event. This compares with roughly 10,000 m3 per day per tractor mounted flood pump.


Environment Bay of Plenty
Operations Publication 2007/04 Hydraulic Design of the Awarua Drain Stopbanks
Contents
Chapter 1: Background ......................................................................................1
Chapter 2: Physical Representation ..............................................................3
2.1 Model Software.................................................................................................3
2.2 Conceptual Model.............................................................................................3
2.3 Network layout..................................................................................................9
2.3.1 Hydrologic Boundary Locations ........................................................................9
2.3.2 Connecting Features ........................................................................................9
2.4 Representing over-design spilling...................................................................10
2.5 Aerial Survey Data..........................................................................................10
2.6 Surveyed Cross Sections ...............................................................................11
2.7 Flood-water storage methods .........................................................................11
2.8 Tarawera River: Mouth and Bridge.................................................................12
2.9 Waterway Channel Roughness ......................................................................13
2.10 File Storage ....................................................................................................13
Chapter 3: Hydrological Basis .......................................................................15
3.1 Design Standard – Scenarios Tested .............................................................15
3.2 Combined Events ...........................................................................................16
3.3 Combination Probabilities ...............................................................................16
3.3.1 Coinciding Events ...........................................................................................16
3.4 Design Rainfall Event .....................................................................................16
3.4.1 Intensity Versus Duration................................................................................16

Environment Bay of Plenty
Hydraulic Design of the Awarua Drain Stopbanks Operations Publication 2007/04
3.4.2 Design Rainfall Intensity................................................................................. 17
3.4.3 Critical Rainstorm Duration ............................................................................ 17
3.4.4 Nested Hyetographs ...................................................................................... 18
3.4.5 Combined Duration Storms – Conservative Approach................................... 18
3.4.6 Timing of hyetograph nests............................................................................ 18
3.5 Awarua Drain Inflow Hydrograph ................................................................... 19
3.5.1 Catchment Parameters .................................................................................. 19
3.5.2 Routing - Hydrograph Shape ......................................................................... 19
3.6 Tarawera Duration Analysis ........................................................................... 20
3.7 Other Catchments .......................................................................................... 23
3.8 Sea level, tides, and storm surge. .................................................................. 23
Chapter 4: Results ............................................................................................. 25
Chapter 5: Model Outcomes .......................................................................... 27
5.1 Design Stopbank Crest Level......................................................................... 27
5.2 Total Catchment Contribution – No Climate Change Effect Scenario ............ 27
5.3 Scenario 3: Total Catchment Contribution with Climate Change Effects........ 28
5.4 Associated Works .......................................................................................... 30
References ........................................................................................................... 33

1
Operations Publication 2007/04 Hydraulic Design of the Awarua Drain Stopbanks
Chapter 1: Background In May 2007 a disastrous flood and debris-flow event severely damaged houses, roads and other infrastructure and natural features in the Eastern Bay of Plenty coastal settlement of Matata. Part of the extreme hydrological event involved the change in course of the Waitepuru Stream when its previous channel became blocked with sediment and other debris. The Waitepuru is situated on an alluvial fan, a roughly cone-shaped landscape feature that allowed the stream to head off in a completely new direction. Whereas before the event it had followed a Northerly course to the Matata Lagoon, on the morning after the flood event, it was found to be heading east across farmland to pond against the Tarawera River stopbanks and in the area served by the Awarua Drain (see the location diagram on page 2).
A proposed operation to re-establish the stream in its previous channel became delayed by the risk that it would pose to the more densely populated areas adjacent to the northern stream channel. A large bund was built at the head of the fan to divert any dangerous flows that could happen in the future away towards the more sparsely populated farmland to the east.
The Awarua Drain is administered by Environment Bay of Plenty as part of the Rangitaiki-Tarawera Rivers Scheme and it had served a 1.46 square kilometre area of largely flat farmland with some small hillside contributions. The drain soon showed that it did not have the capacity to adequately contain floodwaters from the additional 1.33 square kilometre steep bushy catchment of the Waitepuru Stream.
The nature of the Awarua Drain is that it skirts the high ground of the alluvial fan and the back of the coastal sand dune maintaining the elevation required to discharge into the Tarawera River. The farmland on the right bank falls gradually to levels approaching sea level. With the farm drain inverts below sea level, the only drainage for much of this farmland is from pumping. A significant spill event can overwhelm pumps, and lead to long duration ponding and loss of pasture. In 2005 approximately 20 hectares of pasture was covered to an average depth of about 1 metre. It took about 5 days to drain completely and much of the pasture was severely damaged.
Emergency works were carried out in the months following the event to augment the capacity of the drain. The works included topping up the informal stopbank on the true right bank of the drain and installing an additional flood overflow culvert near the downstream end of the drain, where it runs close to the Tarawera River Stopbank. While the drain has not been overtopped in the nearly 2 years since this work was undertaken, it has come close on at least one occasion. A portable tractor-mounted flood pump is continually on standby adjacent to the flood overflow culvert to augment the drain’s flood capacity during high downstream water level conditions.
In August 2006 Environment Bay of Plenty undertook a formal hydrological analysis of the drain to design part of a permanent solution. The proposal was to provisionally re-establish the Waitepuru Stream to its previous channel with a flood spillway to the Awarua Drain for larger flood events. A numerical computer based model of the Awarua Drain was established to test various methods of conveying the added floodwater to the Tarawera River without spilling onto the adjacent farmland.

2 Environment Bay of Plenty
Hydraulic Design of the Awarua Drain Stopbanks Operations Publication 2007/04
These preliminary concepts included a large flood detention structure on the upper Awarua Drain with automated control gates to release floodwaters as downstream water levels permitted. It was found however that the most cost effective and reliable system was simply to improve and augment the stopbank on the true right bank and allow the flood overflow culvert and the considerable natural flood storage within the drain channel to manage the floodwaters.
In March 2007 Environment Bay of Plenty undertook to gain resource consent and commence construction of the Awarua Drain Flood Protection Stopbank, and associated works. Part of the process included gaining geotechnical advice on the suitability of the foundation material. The geotechnical investigation by Riley Consultants Limited found that a large length of the proposed alignment beside the downstream portion of the drain was on unsuitable foundation material. This necessitated a major change in the proposed alignment. The new alignment is shown in Figure 2.
Aerial survey data LiDAR became available for the entire site in early 2007. This data provides more accuracy in measuring the all-important flood storage volumes of the drain. It was decided to remodel the drainage system to evaluate the effects of the newly proposed alignment and incorporate the additional aerial survey information.
Figure 1: Location Diagram of Awarua Drain at Matata, Eastern Bay of Plenty.

Operations Publication 2007/04 Hydraulic Design of the Awarua Drain Stopbanks
3
Chapter 2: Physical Representation
2.1 Model Software
The computer software used in this analysis is Mike 11 and Mike11 GIS from DHI, the Danish Hydrological Institute. Both of these applications are recognised throughout the world as being comprehensive packages for the design of waterways.
Mike 11 is a one dimensional hydrodynamic flow simulation package, which means it is capable of solving a network of discharge/level relationships within hydrologic boundaries that can change with time. The one dimensional aspect means that it works by describing flows in defined channels rather than water flowing across a two dimensional surface. The methods that were used for applying this software are outlined in section 2.3 below.
Mike 11 GIS is an application for linking the Mike 11 model with geo-spatial information. In this case it has been used for extracting water-storage volumes and floodplain cross sections from aerial ground survey information, and for generating flood-depth maps from the model results. Details of these processes are included in sections 2.5 and 2.7 below.
2.2 Conceptual Model
The Awarua Drain Model includes representations of the Awarua Drain, its floodplain, and part of the lower Tarawera River. Each of these waterways is represented within the model in terms of the potential for conveyance of water and for the storage of water at points along its length. Conceptually the model is a series of storage ponds with carefully calculated flows in between.
The model works within defined boundaries. As flows or water-levels at any boundary change (inflows or tides), the software calculates the changes that propagate throughout the system. For example, when the inflows at the upstream end of a branch suddenly increase during a flood, a wave of water propagates downstream, raising water levels and flows throughout the rest of the model.
The model network consists of a series of nodes linked by mathematical formula (A map of the model network showing cross sections and storage areas is shown in Figure 2 on page 5). The computer does not have any concept of what water is, but is merely solving mathematical formulae that describe the way that water moves. In spite of this, computer modelling is a very effective method for accurately representing the physical situation. By far the majority of all flood protection, drainage, irrigation, and hydropower works are designed using these methods.


Environment Bay of Plenty 5
Operations Publication 2007/04 Hydraulic Design of the Awarua Drain Stopbanks
Figure 1: Model Network Layout on May 2005 Aerial Photograph


Environment Bay of Plenty 7
Operations Publication 2007/04 Hydraulic Design of the Awarua Drain Stopbanks
Figure 2: Model Network Layout overlaid on a Digital Elevation Model


Environment Bay of Plenty 9
Operations Publication 2007/04 Hydraulic Design of the Awarua Drain Stopbanks
2.3 Network layout
Figure 2 on page 5 shows the model layout over an aerial photo taken in May 2005. The figure shows the channel network, cross sections, and floodwater storage areas. The proposed stopbank alignments and overtopping locations for modelling over-design events are also shown. Figure 3 shows the same information overlaid on a Digital Elevation Model. (DEMs are described in section 2.5)
2.3.1 Hydrologic Boundary Locations
The Awarua Drain upstream boundary is within the Muller property. This is where the catchment discharge from the 23 hectare catchment of the upper farm and the bush across the state highway from the Muller Farm contributes to the model.
The other inflow boundary to the Awarua Drain is represented immediately downstream of the Muller-Burt boundary where the Waitepuru Stream currently contributes to the drain. The reason for stopping the model at this point instead of representing the stream channel all the way up to the highway or beyond, is that this is where the rushing flow from the steeper slopes meets the slower ponded flow of the drain. It is in these slower ponding areas where this type of modelling is most helpful because of the relative influence of flood storage on the performance of the system. There are more effective methods of designing for the steep waterways upstream of the Awarua Drain.
The upstream end of the model on the Tarawera River is shown in Figure 1. The flows from the Awakaponga Canal, Awaiti Canal, and the Old Rangitaiki Channel along with representations for the plains catchments are lumped together at this point.
The downstream boundary is located where the Tarawera River meets the sea. Whereas the upstream boundaries are defined only by the flows that contribute to the model at those points, the downstream boundary is defined only by the water level at any given time.
2.3.2 Connecting Features
The main Awarua Drain channel links with the Tarawera River at two locations: via the original (and still existing) 1200mm diameter concrete culvert beneath the Thornton-Matata Road to join the river downstream near the Eastern Matata Lagoon; and via the new twin barrelled 1350mm diameter aluminium culvert through the stopbank upstream of the road bridge.
Four spill locations were modelled to estimate the effects during over-design events. These are intended to represent overtopping of the proposed stopbanks and are shown on Figure 2: At Chainage 830 metres on Awarua Drain to assess potential spilling to Arthur Burt’s farm (In this context Chainages are measured distances along the stream from a designated origin. The Awarua Drain is labelled with zero metres at the downstream confluence with the Tarawera River.); At Chainage 2120m to represent spilling onto Harry Burt’s lower paddocks; At Chainage 2510m for spilling across the Muller-Burt boundary stopbank; and at 2550 metres to assess over-design spilling into the Muller kiwifruit orchard.
These spill locations are linked to a “Floodplain” branch which represents the farm paddocks on the right bank of the drain. Although in reality this floodplain branch is connected to electric flood pumps and, in extreme events, probably tractor pumps, these were not included in the model to avoid complicating the results.

10 Environment Bay of Plenty
Hydraulic Design of the Awarua Drain Stopbanks Operations Publication 2007/04
2.4 Representing over-design spilling
As outlined in Section 2.3.2 above, spill locations were included to represent overtopping from the Awarua Drain during over-design events. The particular event scenario of interest was the currently estimated 100 year ARI rainstorm falling on the catchment before the proposed diversion works at the Waitepuru Stream fan-head could be implemented. A full discussion of hydrological scenarios is included in Section 3.1 below.
The component used within Mike 11 for these spilling locations is a Link Channel and in this context it functions as a weir, with the flow calculation based on understandings of how water flows over a defined crest or edge. As the Awarua Drain reaches capacity and overflows, the water is discharged over the stopbank crest in a similar way to a classic Broad Crested Weir.
The elevation of each weir crest (stopbank crest) was based on the design bank height minus half of the operational freeboard. Freeboard is the term for the difference between design water level and design bank crest level. Freeboard is used to allow for ongoing settlement and wear of the stopbank over time, and also to account for various uncertainties in the design calculations. In this case the design includes 300mm freeboard. It is Environment Bay of Plenty’s stated practice to only repair settlement or wear on stopbank crests once they reach the “half-freeboard” level. That is, when the bank crest is measured at only, in this case, 150mm above the design water level. Because of this it is feasible that over the long term a section of bank could be somewhat below design crest level at the time of the rainfall event. The weir crest dimensions used to model the over-design scenarios were 100m long at a level of 150mm above the design water level.
2.5 Aerial Survey Data
Accurate Aerial Survey Data became available for the whole of the subject site in early 2007 as part of a LiDAR survey that covered the Rangitaiki Plains. Up until that time the only aerial survey available for the whole site was the 1987 Post-Earthquake Photogrammetry. LiDAR data from 2005 was available for some areas but didn’t cover the lower parts or much of the floodplain.
The earlier 2006 modelling was based entirely on the ground-surveyed cross sections. With the advent of the LiDAR it became possible to improve the modelling of flood storage. Because of the tidal influence, flood storage is the most important component of flood protection in this drain.
LiDAR survey is a method using GPS and Laser sensing technology that enables an aeroplane to gather thousands of ground spot-heights per minute. The spots are usually spaced at several spots per metre compared with the older photogrammetry data for the plains which was spaced at 100m apart. Unfortunately LiDAR cannot penetrate water so it must be combined with manual ground-survey to be able to accurately represent drains and river channels. The LiDAR survey is usually carried out after a dry weather to capture as much river bank information as possible.
For this investigation the LiDAR data was used to build an accurate ground surface map (Digital Elevation Model, or DEM) to extract floodwater storage areas and floodplain cross sections. It was also used to map flood extents and depths from the model results at the end of the process.

Environment Bay of Plenty 11
Operations Publication 2007/04 Hydraulic Design of the Awarua Drain Stopbanks
Figure 4 shows the LiDAR spot heights overlaid with the 2m grid and an aerial photograph.
The channel cross sections for the Awarua Drain and the Tarawera River were taken from manual ground survey. The storage volumes attributed to these cross sections was from a combination of LiDAR and manual survey.
Figure 4: LiDAR spot heights and 2m DEM grid over aerial photo (areas of each layer have been cropped).
2.6 Surveyed Cross Sections
Manual ground survey of the Awarua Drain was carried out by Environment Bay of Plenty staff in July 2005 using Total-Station equipment. This involves channel cross sections at roughly 100m intervals. The Tarawera River is routinely surveyed on permanent cross section locations. The river cross sections used in this model were surveyed in February 2006.
2.7 Flood-water storage methods
Figure 3 on page 7 shows the storage areas attributed to each model cross section. Mike 11 GIS was used to extract this information from the DEM. For each delineated area the software measures the area of ground surface that would be covered with water over the range of possible water levels. This information is used by Mike 11 at each time step to account for flows into, out of, and stored in, each cross section location. Figure 5 shows a plot of stored flood volume for the cross section at Chainage 830m overlaid with plots of inflows to; and outflows from that point.
For this modelling the number of modelled cross sections was reduced from the original 22, to 7. The higher resolution had been necessary when calculating storage volume directly from the cross section shape. With the use of the 2m DEM grid, the cross sections do not need to be as closely spaced. Apart from a minor component of flood storage, they are used primarily to calculate the potential floodwater conveyance along the drain.

12 Environment Bay of Plenty
Hydraulic Design of the Awarua Drain Stopbanks Operations Publication 2007/04
Because the LiDAR survey cannot penetrate water bodies, the floodwater storage volumes below low-water level were calculated from the ground survey cross sections. To do this Mike 11 multiplies the cross section width at each level by the length of channel associated with that cross section. The processed cross section data was then manually clipped to seamlessly join the Storage Width (cross section based) values with the Additional Storage (DEM based) values.
11:15:007-1-2000
11:30:00 11:45:00 12:00:00 12:15:00 12:30:00 12:45:00 13:00:00
1000.0
2000.0
3000.0
4000.0
5000.0
6000.0
7000.0
8000.0
9000.0
10000.0
11000.0
12000.0
13000.0
[m^3]
0.0
0.5
1.0
1.5
2.0
2.5
3.0
3.5
4.0
4.5
5.0
5.5
6.0
[m^3/s]Time Series (AWA100DIVERTED_CC_TARA20_L20_SLR_ENDHDAdd.RES11)
Figure 5: Stored Volume (Black); Inflow (Blue) and Outflow (Red) for Chainage 830 m near the peak of the design scenario.
2.8 Tarawera River: Mouth and Bridge
The Tarawera River mouth is usually obstructed by a sand bar where it crosses the beach. Environment Bay of Plenty cross section surveys do not show this fully because the last section is set a short distance upstream of the beach. The sand bar was not included in the model because it was considered that with the Tarawera River being under a 20 year ARI flood; it would be largely eroded by the time of the peak of the event.
The Thornton Matata Road Bridge was not included in the model. The model showed that peak water levels do not reach close enough to the bridge soffit for debris to be an issue. The Pier losses alone were not considered to be significant enough to warrant specific modelling. Energy losses at the bridge are covered generally under the waterway roughness parameters.

Environment Bay of Plenty 13
Operations Publication 2007/04 Hydraulic Design of the Awarua Drain Stopbanks
2.9 Waterway Channel Roughness
A general Manning’s parameter channel roughness of n=0.033 was used throughout the model. This was based on work by Phil Wallace on the Tarawera River and Awaiti Canal system in 2002, and is in keeping with values for this type of channel from reference literature (Chow; Henderson). A sensitivity analysis was carried out as part of the earlier Awarua Drain modelling and the drain was found to be relatively insensitive to roughness changes. The majority of design flows in the system are slow with storage rather than conveyance being the main performance characteristic.
2.10 File Storage
Mike 11 and Mike 11 GIS operate on multiple files. The Awarua Design Modelling files have been stored on the Environment Bay of Plenty network hard drives in:
Designgroup on (Jupiter) R:\MIKEZero\Tarawera_Catchment\Awarua Drain\Awarua070511
All of the Mike 11 design scenarios run on a common Network file, Cross sections file, and Hydrodynamic Parameter file. The variation between them is in the Boundary files and Results files which are labelled as shown in Table 1 below. A simulation file is stored for each design scenario. A batch simulation file has been prepared to run all the scenarios without any extra operator input. The scenarios mentioned in this table are outlined in sections 3.1 and 3.4.
Table 1: Files Used in the Model.
Scenario Boundary File Results File
Diverted CC End-Focussed
Awa100Diverted_CC_Tara20_L20SLR_End.bnd11
AWA100DIVERTED_CC_TARA20_L20_SLR_END.RES11
Diverted CC Mid-focussed
Awa100Diverted_CC_Tara20_L20SLR_Mid.bnd11
AWA100DIVERTED_CC_TARA20_L20SLR_MID.RES11
Diverted CC Start Focussed
Awa100Diverted_CC_Tara20_L20SLR_Start.bnd11
AWA100DIVERTED_CC_TARA20_L20SLR_START.RES11
Diverted no-CC End-Focussed
Awa100Diverted_noCC_Tara20_L20noSLR_End.bnd11
AWA100DIVERTED_NOCC_TARA20_L20NOSLR_END.RES11
Diverted no-CC Mid-focussed
Awa100Diverted_noCC_Tara20_L20noSLR_Mid.bnd11
AWA100DIVERTED_NOCC_TARA20_L20NOSLR_MID.RES11
Diverted no-CC Awa100Diverted_noCC_Tara20_L20n AWA100DIVERTED_NOCC_TARA20_L20

14 Environment Bay of Plenty
Hydraulic Design of the Awarua Drain Stopbanks Operations Publication 2007/04
Scenario Boundary File Results File
Start Focussed
oSLR_Start.bnd11 NOSLR_START.RES11
Total Flow CC End-Focussed
Awa100Total_CC_Tara20_L20SLR_End.bnd11
AWA100TOTAL_CC_TARA20_L20SLR_END.RES11
Total Flow CC Mid-focussed
Awa100Total_CC_Tara20_L20SLR_Mid.bnd11
AWA100TOTAL_CC_TARA20_L20SLR_MID.RES11
Total Flow CC Start Focussed
Awa100Total_CC_Tara20_L20SLR_Start.bnd11
AWA100TOTAL_CC_TARA20_L20SLR_START.RES11
Total Flow no-CC End-Focussed
Awa100Total_noCC_Tara20_L20noSLR_End.bnd11
AWA100TOTAL_NOCC_TARA20_L20NOSLR_END.RES11
Total Flow no-CC Mid-focussed
Awa100Total_noCC_Tara20_L20noSLR_Mid.bnd11
AWA100TOTAL_NOCC_TARA20_L20NOSLR_MID.RES11
Total Flow no-CC Start Focussed
Awa100Total_noCC_Tara20_L20noSLR_Start.bnd11
AWA100TOTAL_NOCC_TARA20_L20NOSLR_START.RES11

Operations Publication 2007/04 Hydraulic Design of the Awarua Drain Stopbanks
15
Chapter 3: Hydrological Basis Any flood protection design is based within a hydrological context that describes the critical design event. Flood protection design is about reducing the probability of flooding to a level that the community would consider acceptable. It is seldom possible to totally eliminate all risk of flooding. The design is therefore based on a study of hydrological probabilities.
Usually probabilities of hydrological events are expressed as a percentage probability of exceedance in any one calendar year or Annual Exceedance Probability (AEP). In this report event probabilities are expressed as the Average Return Interval (ARI) in years because this is a format used more often in the New Zealand community. A storm probability expressed here as having an ARI of 100 years is considered to be the equivalent of a 1% AEP event.
3.1 Design Standard – Scenarios Tested
The design brief was for the Awarua Drain Flood Protection System to be resistant to overtopping during the critical 100 year ARI hydrological event. This was to include 300 mm operational freeboard and be based on the assumption that the Waitepuru Stream would only contribute any incremental flows over a 7.7m3/s threshold. This design brief was given verbally by the Manager Technical Services at Environment Bay of Plenty. The design brief specifically excluded any design for sediment or debris type effects.
Four main scenarios were modelled. All scenarios were based on the critical 100 year ARI event:
With the first 7.7m3/s of the Waitepuru Stream contribution removed from the model inflow boundary to represent the limited re-diversion of the stream; with increased storm rainfall intensities and sea levels that are expected due to global climate change (The Design Scenario)
With the Waitepuru Stream diverted as above but without the increased rainfall intensities and sea levels due to climate change.
With the total contribution of both the Waitepuru Stream and Awarua Drain catchments; with increased storm rainfall intensities and sea levels due to climate change.
With total flows as above but without the increased rainfall intensities and sea levels expected due to global climate change.

16 Environment Bay of Plenty
Hydraulic Design of the Awarua Drain Stopbanks Operations Publication 2007/04
3.2 Combined Events
Due to the nature of storms, the various components of weather that affect a flood protection system are not considered statistically independent. There is a reasonable probability that two adjacent waterbodies will be experiencing storm conditions at the same time. In the case of the Awarua Drain, it is reasonable to assume that both the Tarawera River and the localised Sea will be at higher than normal levels during a significant flood event in the Drain. The term Combined Event is used to describe these design situations.
3.3 Combination Probabilities
A concise analysis of combined event probabilities is a very involved process because the nature of the statistical relationship is dependant on such things as the size of each of the waterbodies, the distance between them, and whether they are a river, lake or part of an ocean. It is accepted practice in flood protection design to use assumed combination probabilities as in Table 2 below.
Table 2: Standard Design Combinations for Floods and Sea Level.
Overall Storm Event
Primary River Secondary River Sea Level
ARI (years) ARI (years) ARI (years) ARI (years) 100 100 20 20 100 20 100 20 100 20 20 100 20 20 2 2 20 2 20 2 20 2 2 20
Using this approach the designer must check each of the combinations to determine which is the Critical Event. This is the event which gives the highest flood level (or some other parameter such as water velocity in erosion protection design). During the modelling the Awarua Drain system was found to be much more sensitive to localised rainfall than downstream water levels, with the critical design event being a 100 year Awarua Drain Inflow combined with a 20 year ARI Tarawera River Flow and a 20 year ARI Sea Level.
3.3.1 Coinciding Events
For the design scenarios tested, it was assumed that the peak of the Tarawera River flood and the peak of the storm-surge and high spring tide, coincided with the peak inflow to the Awarua Drain.
3.4 Design Rainfall Event
3.4.1 Intensity Versus Duration
Rainstorm probability analysis involves rainfall intensity and storm duration. Any one storm can be measured in terms of how much rain fell (at one rain gauge) in the most intense 30 minutes, and also the most intense 30 hours. A storm could be found to be very intense (a very low probability, very rare event) over a short time period but when measured in terms of its longer duration rainfall be found to be only mediocre.

Environment Bay of Plenty 17
Operations Publication 2007/04 Hydraulic Design of the Awarua Drain Stopbanks
That type of rainstorm will cause more flood-related damage to smaller catchments, but leave larger catchments unscathed. Or the converse, a lot of rain may fall over a longer period, say 3 days, but without any short intensive bursts, causing widespread flooding on larger drainage systems.
For the Matata location the estimated 100 year ARI 30 minute duration rainstorm has average intensities of 127 mm/hour whereas the 100 year 3 day rainstorm has average intensities of 5.7 mm/hour. It is unlikely that both of these storms will happen during the same event (or if they did the overall probability would be somewhat less likely than a 100 year ARI event). Table 3 shows the 100 year ARI storm intensities for Matata against each storm duration increment.
Table 3: 100 year ARI Design Rainfall Intensities for Matata with Adjustments (average over storm duration).
Duration HIRDS v1.5b 1.3 x HIRDS With Climate
Change Factor mm/h mm/h mm/h
10 min 162 211 242 20 min 117 152 175 30 min 98 127 147 1 hour 72 94 108 2 hours 46 59 68 3 hours 36 46 53 6 hours 24 31 35 12 hours 15 20 22 24 hours 9.6 12.5 14.3 48 hours 5.9 7.7 8.9 72 hours 4.4 5.7 6.6
3.4.2 Design Rainfall Intensity
Table 3 is based on output from NIWA’s HIRDS software version 1.5b which gives location specific design rainfall intensities for a range of storm durations based on a nationwide analysis of rain gauge data. For this design the software output has been multiplied by two factors: 1.3 to bring the intensities into line with those for nearby locations further inland (Environment Bay of Plenty has recognised that the HIRDS data for Matata and the coastline to the west is inexplicably low by about this amount; pers coms P. Blackwood June 2005); and 1.15 to incorporate advice from the Ministry for the Environment’s New Zealand Climate Change Office that predicts a 15% increase in extreme rainfall intensities by the year 2080. While this seems a long planning horizon for what is largely an earth embankment in a rural setting, it is in keeping with Environment Bay of Plenty’s guideline document, the Hydrological and Hydraulic Guidelines.
3.4.3 Critical Rainstorm Duration
The designer must determine what the critical duration rainstorm would be for the system. Although it might be proven that the system will withstand a short duration 100 year rainstorm, it may be found later that the system is overwhelmed in even moderate longer duration storms due to lack of floodwater storage or some other factor. The Awarua Drain Flood Protection system has been tested by modelling all incremental storm durations from 30 minutes to 3 days. (Likewise the Tarawera River flow component of the model was evaluated for all durations to 10 days. (See section 3.6 below).

18 Environment Bay of Plenty
Hydraulic Design of the Awarua Drain Stopbanks Operations Publication 2007/04
3.4.4 Nested Hyetographs
To avoid vast numbers of model simulations, and to adequately represent the antecedent conditions for the model, it is necessary to “nest” rainstorms together when modelling a flood event. For this model a 30 minute (high intensity) rainstorm has been nested within a 1 hour rainstorm, within a 2 hour rainstorm and so on. This is shown in the design hyetographs shown in Figure 6 below.
3.4.5 Combined Duration Storms – Conservative Approach
Although it is unlikely that a single storm would generate both the 100 year ARI 30 minute average rainfall intensity and the 100 year 3 day average intensity (or any other duration), it has been assumed in the Awarua Drain design analysis that the design rainstorm generates the 100 year ARI level of intensity at all incremental durations. This means that the overall event has a probability considerably less than the stated 100 year ARI, giving a conservative result. Nevertheless it is a convenient way of testing each duration increment to ensure that the critical rainstorm was modelled. Economic gains could possibly be realised by a second iteration of modelling once the critical event duration has been determined however this was not done for the Awarua Drain Design.
3.4.6 Timing of hyetograph nests
It was found that the Awarua Drain system is sensitive to the temporal pattern of the design rainstorm, with an approximately 0.2m difference in peak water levels depending on whether the most intense band of rain fell at the end of the storm or near the start. Three different temporal patterns (as shown in Figure 6 below) were tested for each model scenario: with the rain concentrated at about 1/5th of the way through the storm; at half way through the storm and at a point 4/5ths through the storm.
0
20
40
60
80
100
120
140
160
6/01/2000 0:00 6/01/2000 12:00 7/01/2000 0:00 7/01/2000 12:00 8/01/2000 0:00 8/01/2000 12:00 9/01/2000 0:00
Time
Rai
nfal
l Int
ensi
ty (m
m/h
)
End Mid Start
Figure 6: Nested Hyetographs Showing Assumed Temporal Distributions for Design Rainfall Intensities

Environment Bay of Plenty 19
Operations Publication 2007/04 Hydraulic Design of the Awarua Drain Stopbanks
3.5 Awarua Drain Inflow Hydrograph
3.5.1 Catchment Parameters
The design rainfall events were converted into inflow discharges by applying catchment parameters.
Of the various parameter-based methods, the Rational Method was used because of its simplicity and its ability to accommodate storm durations longer than the catchment time of concentration. The Rational Method basically multiplies rainfall intensity by catchment area to give a flow. It accounts for ground soakage by applying a single Runoff Coefficient (C). Typical runoff coefficients (the proportion of rainfall that contributes to stream flow) for this type of soil, topography and vegetation type are around C=0.25.
The Awarua Drain catchment was measured at 1.46 square kilometres. This includes the farmland, steep bush, and sand dunes that drain by gravity into the waterway. It does not include the 1.33 km2 Waitepuru Stream catchment. The farmland is flatter than the hill catchments but with a lesser vegetation cover, therefore the same runoff coefficient (as above) was used for both areas.
3.5.2 Routing - Hydrograph Shape
The design rainfall hyetographs for this type of analysis are usually assumed to be rectangular, i.e. the rain is assumed to fall at a steady rate within each duration bracket instead of slowly increasing to a peak and then tapering off the way a stream does. Unlike rainfall, stream flow is affected by a time lag in the arrival of the water from the distributed catchment to the concentrated point of interest. Also a rectangular inflow hydrograph is unsuited to modelling because of the sudden “wave of water” that it represents.
However for longer storms where the flood duration is proportionally much longer than the catchment time of concentration, this lead-in becomes less meaningful. The inflow hydrographs used in the Awarua Drain design were rectangular for all except the representation of the 30 minute rainstorm, which was modified to a triangular shape. Therefore the hydrographs were effectively scaled versions of the hyetograph with a modified peak. Part of the Awarua Drain inflow hydrograph for the 1/5th (start) focussed event is shown in Figure 7 below. This modification did not alter the total amount of water delivered to the drain.

20 Environment Bay of Plenty
Hydraulic Design of the Awarua Drain Stopbanks Operations Publication 2007/04
0
5
10
15
20
25
0:00 2:00 4:00 6:00 8:00 10:00 12:00 14:00 16:00 18:00 20:00 22:00 0:00
Time
Dis
char
ge (m
3/s)
Figure 7: Design Inflow Hydrograph for Awarua Drain; Start-nested Scenario
3.6 Tarawera Duration Analysis
During times of heavy rain and high downstream water level, floodwater collects in the limited storage volumes of the Awarua Drain channel and over-berm areas. Because of this, the length of time that the Tarawera River is in flood has a large effect on design water level in the drain. The model includes a representation of the lower Tarawera River to account for this effect. An analysis was carried out to determine just how high the Tarawera River could be expected to stay and for how long.
The flow in the Tarawera River has been recorded at Awakaponga since 1949. A digital recorder was installed in August 1965. The duration analysis was carried out on the data collected between the start of 1966 and the end of 2005.
The analysis is similar to that for evaluating rainstorm-duration/depth-magnitude but with flow magnitude being the main measured variable. The maxima that were extracted from each year of data were the maximum flows that were exceeded for precisely the length of time of each duration increment. A new Script-file code for TIDEDA was required to do this. The standard EV1 and GEV frequency distributions were then fitted to each set of data using the L-Moments method (Hosking 1990). The resulting GEV frequency distribution curves are shown in Figure 8 below. In this way a relationship was determined between river flow, duration, and probability. The importance of this analysis is that it can now be stated with a high level of certainty that, for example, during the critical 20 year flood the river would not flow at higher than 74 m3/s for more than 24 hours.
The outcomes were used to generate a synthetic river hydrograph to represent the envelope described all of these discharge/duration couples. It was assumed that the peak occurred at 1/3rd of the flood duration for each duration increment. This hydrograph is shown in Figure 9 on page 22.

Environment Bay of Plenty 21
Operations Publication 2007/04 Hydraulic Design of the Awarua Drain Stopbanks
In a similar vein to section 3.4 for rainfall durations, a 100 year flood on the Tarawera River would really only touch this envelope in 1 or 2 places (or it would be somewhat greater than a 100 year event). Nevertheless adopting this envelope for the Tarawera River upstream boundary is a convenient, although conservative, method of ensuring that, among all possibilities, the critical event duration is tested by the model.
Figure 8: Tarawera River at Awakaponga: GEV Distributions fitted to annual maxima of flow exceeded for exactly each subject duration
22.
335
1020
5010
0
2000
0
3000
0
4000
0
5000
0
6000
0
7000
0
8000
0
9000
0
1000
00 -1.5
000
-0.5
000
0.50
001.
5000
2.50
003.
5000
4.50
00
Y
Flow exceeded for exactly the duration shown (L/s) 6 ho
ur G
EV12
hou
r GEV
24 h
our G
EV
48 h
our G
EV
72 h
our G
EV
120
hour
GEV
inst
GE
V6h
our
12 h
our
24 h
our
48 h
our
72 h
our
120
hour
inst
240
hour
GE
V24
0 ho
ur
ARI (
year
s)

22 Environment Bay of Plenty
Hydraulic Design of the Awarua Drain Stopbanks Operations Publication 2007/04
Figure 9: Design Hydrographs for Tarawera River.
020406080100
120
140
160
180
200
30/1
2/19
991/
01/2
000
3/01
/200
05/
01/2
000
7/01
/200
09/
01/2
000
11/0
1/20
0013
/01/
2000
15/0
1/20
00
Tim
e
Discharge (m3/s)
5% A
EP
1%AE
P5%
Des
ign
Tota
l at U
S b
ound
ary

Environment Bay of Plenty 23
Operations Publication 2007/04 Hydraulic Design of the Awarua Drain Stopbanks
3.7 Other Catchments
Other catchments that contribute to the lower Tarawera River include the Awakaponga Stream via Wilsons Canal, the Awakaponga Canal, the Awaiti Canal, and the Old Rangitaiki Channel.
The Awakaponga Stream contribution to the model was based on a TM61 analysis by Environment Bay of Plenty in 2005. It was assumed to contribute a 5 year ARI flow as a triangular hydrograph over 12 hours with the peak at the model Coincidence Time.
The remaining 88km2 of flat farmland that contribute either via the canals or is directly pumped into the river was accounted for at a rate of 28 mm specific runoff per day, which is the standard pump design rate adopted for much of the Rangitaiki Plains.
These additional catchment contributions were all added to the Tarawera River upstream boundary.
3.8 Sea level, tides, and storm surge.
The downstream water level boundary has a large effect on the model results with the water being largely held back in the system during the high sea level period of the design storm. The water level at the boundary is a summation of the Astronomical Tide, Storm Surge and the anticipated Sea Level Rise due to Global Warming. A plot of the modelled downstream water level boundary is shown in Figure 10 below.
The tide component that was used is a simple sinusoidal approximation of the spring tide at Whakatane from the New Zealand Navy Nautical Almanac. No attempt was made to approximate the effect of the change from springs to neaps even though the simulations would be long enough for this effect to be observed.
The storm surge estimates are based on recorded values from the Moturiki Sea Level Gauge at Mount Maunganui. The estimates are increased by 0.3m to allow for increased surge in the Eastern Bay of Plenty (Blackwood, 2000; Guidelines 2001/04).
The Sea Level Rise increment is from Environment Bay of Plenty’s Guidelines 2001/04 and is in keeping with the 2004 guideline document, Preparing for Climate Change, A guide for local government in New Zealand from the Ministry for the Environment’s New Zealand Climate Change Office.

24 Environment Bay of Plenty
Hydraulic Design of the Awarua Drain Stopbanks Operations Publication 2007/04
18:00:005-1-2000
00:00:006-1-2000
06:00:00 12:00:00 18:00:00 00:00:007-1-2000
06:00:00 12:00:00 18:00:00 00:00:008-1-2000
06:00:00 12:00:00 18:00:00 00:00:009-1-2000
-0.2
0.0
0.2
0.4
0.6
0.8
1.0
1.2
1.4
1.6
1.8
2.0
2.2
[meter] Time Series Water Level (AWA100DIVERTED_CC_TARA20_L20_SLR_END.RES11)
Figure 10: Downstream Water Level Boundary Showing 20 year Storm Surge and Spring Tides; with and without Sea Level Rise due to Global Warming.

Operations Publication 2007/04 Hydraulic Design of the Awarua Drain Stopbanks
25
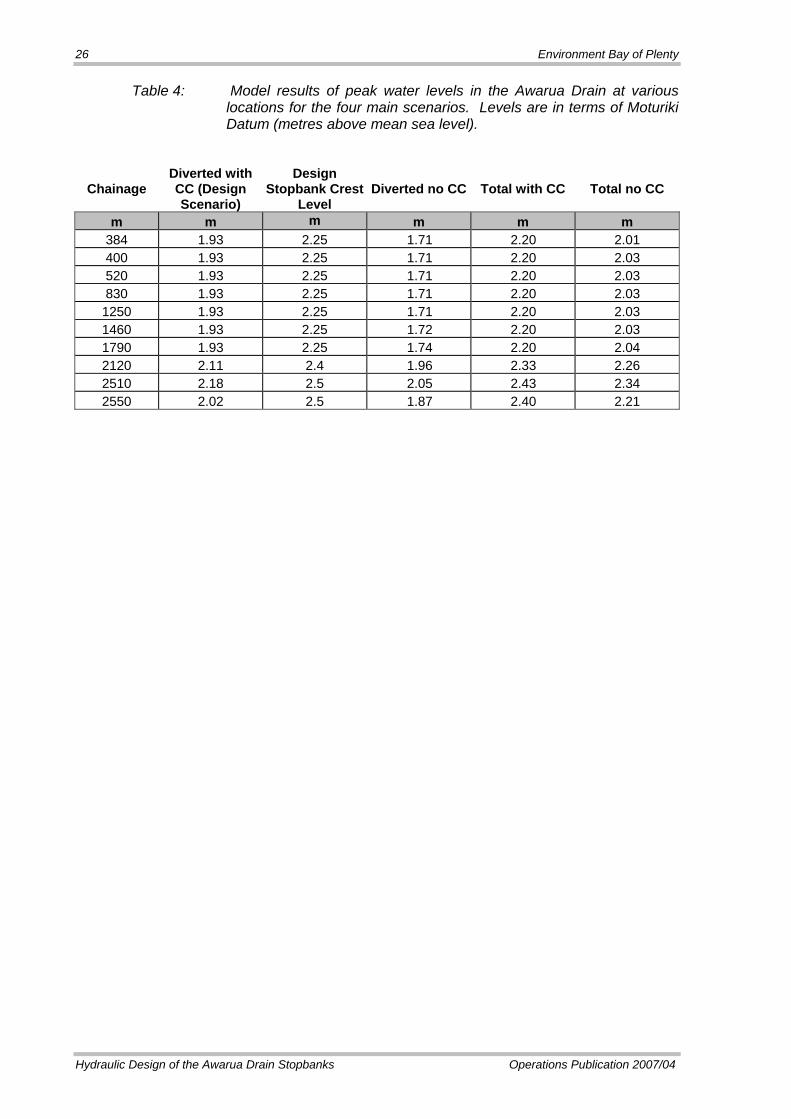
Chapter 4: Results Peak water levels in the Awarua Drain at each model cross section are shown in Table 4 below. The drain chainage locations are shown in Figure 2 on page 5. They represent metres of channel length from the downstream confluence with the Tarawera River. The four main modelled scenarios as described in section 3.1 on page 15 are labelled in the table as follows.
With the first 7.7m3/s of the Waitepuru Stream contribution removed from the model inflow boundary to represent the limited re-diversion of the stream; with increased storm rainfall intensities and sea levels that are expected due to global climate change.
Results File: AWA100DIVERTED_CC_TARA20_L20_SLR_END.RES11
Label: Diverted with CC
With the Waitepuru Stream diverted as above but without the increased rainfall intensities and sea levels due to climate change.
Results File: AWA100DIVERTED_NOCC_TARA20_L20_NOSLR_END.RES11
Label: Diverted no CC
With the total contribution of both the Waitepuru Stream and Awarua Drain catchments; with increased storm rainfall intensities and sea levels due to climate change.
Results File: AWA100TOTAL_CC_TARA20_L20_SLR_END.RES11
Label: Total with CC
With total flows as above but without the increased rainfall intensities and sea levels expected due to global climate change.
Results File: AWA100TOTAL_NOCC_TARA20_L20_NOSLR_END.RES11
Label: Total no CC
26 Environment Bay of Plenty
Hydraulic Design of the Awarua Drain Stopbanks Operations Publication 2007/04
Table 4: Model results of peak water levels in the Awarua Drain at various locations for the four main scenarios. Levels are in terms of Moturiki Datum (metres above mean sea level).
Chainage Diverted with CC (Design Scenario)
Design Stopbank Crest
Level Diverted no CC Total with CC Total no CC
m m m m m m 384 1.93 2.25 1.71 2.20 2.01 400 1.93 2.25 1.71 2.20 2.03 520 1.93 2.25 1.71 2.20 2.03 830 1.93 2.25 1.71 2.20 2.03 1250 1.93 2.25 1.71 2.20 2.03 1460 1.93 2.25 1.72 2.20 2.03 1790 1.93 2.25 1.74 2.20 2.04 2120 2.11 2.4 1.96 2.33 2.26 2510 2.18 2.5 2.05 2.43 2.34 2550 2.02 2.5 1.87 2.40 2.21

Operations Publication 2007/04 Hydraulic Design of the Awarua Drain Stopbanks
27
Chapter 5: Model Outcomes
5.1 Design Stopbank Crest Level
The main model outcome is the ability to set design stopbank crest levels with confidence.
The design stopbank crest levels are based on the original design brief from Peter Blackwood, who was Manager Technical Services at Environment Bay of Plenty until late 2006. This design scenario is represented in Scenario 1 above. The resulting stopbank crest levels in the table are approximately 300mm higher than the design water level to include the operational freeboard. It is Environment Bay of Plenty’s practice to build the stopbank formation to this height before adding topsoil. Stopbank topping up is triggered when routine surveys indicate that a stopbank crest has degraded to less than the half freeboard level i.e. 150mm above the design water level.
5.2 Total Catchment Contribution – No Climate Change Effect Scenario
The investigation found that although it was not designed to; the proposal is able to contain and convey the total discharge from the Waitepuru Stream and the Awarua Drain catchments to the level of the current estimate for the critical 100 year ARI event (not including climate change factors).
This Total Discharge scenario is an over-design event with an extra 103,000 cubic metres of water over the 3 day event (53% more) than the design scenario and a peak flow about 19% greater. It was therefore unexpected that the design would prove as effective at containing this scenario, with modelled peak water levels less than 0.2m higher than the design water level over most of the drain length.
After careful checking of the model two factors show up as key to the performance of the design for this scenario:
The effect of the climate change factors; which include 0.38m of additional sea level in the design scenario have a large effect on the rate at which the drain can discharge to the Tarawera River. Water level result traces like the one in Figure 11 on page 28 for chainage 520m show that it is only the short duration high inflow period of the flood where the two scenarios are dramatically different. In fact Figure 11 shows that the design event (Black Line) has a higher water level for much of the event. The regular dips in the trace are due to the tidal influence in the drain.

28 Environment Bay of Plenty
Hydraulic Design of the Awarua Drain Stopbanks Operations Publication 2007/04
The large storage areas available in the upper 0.2m of water depth. At the design water level the Awarua Drain water surface is nearly 14 hectares. A 0.2m increase in water level equates to roughly one 1/5th of the difference in total water volume between the two scenarios;
18:00:005-1-2000
00:00:006-1-2000
06:00:00 12:00:00 18:00:00 00:00:007-1-2000
06:00:00 12:00:00 18:00:00 00:00:008-1-2000
06:00:00 12:00:00 18:00:00 00:00:009-1-2000
0.1
0.2
0.3
0.4
0.5
0.6
0.7
0.8
0.9
1.0
1.1
1.2
1.3
1.4
1.5
1.6
1.7
1.8
1.9
2.0
2.1
2.2
[meter] Time Series Water Level (AWA100DIVERTED_CC_TARA20_L20_SLR_END.RES11)
Figure 11: Water Levels at Chainage 520m for the design scenario (black) and the Total Flow, no Climate Change scenario (red).
5.3 Scenario 3: Total Catchment Contribution with Climate Change Effects
This scenario was included to test the standard of long term protection that would be provided by the design in the case where the upstream diversion works on the Waitepuru Stream failed to operate adequately. The scenario involves the critical 100 year ARI hydrological event including the total discharge from both the Waitepuru Stream and the Awarua Drain catchments, and with allowance for climate change effects as advised by the International Panel of Climate Change. The scenario also includes the concession that the stopbank crest could have worn or settled to the half-freeboard level.
The investigation found that the stopbank would be overtopped during the peak of this scenario. Approximately 25,000 m3 of floodwater would spill onto the farms. A flood-depth map is shown in Figure 12 which shows the extent of flooding.
To put this flooding into context, a tractor mounted flood-pump would remove approximately 10,000 m3 of water per day. One of these pumps on each of the flood ponds shown in the floodmap would drain the area in less than two days.
This scenario also showed that floodwater would overtop the Muller-Burt boundary stopbank. However only 280 m3 is expected to spill from there over Muller’s Awarua Drain stopbank (proposed) to enter the kiwifruit areas. The model shows that most of this amount drains across the paddocks to low areas on Harry Burt’s farm (see floodmap overleaf).

Environment Bay of Plenty 29
Operations Publication 2007/04 Hydraulic Design of the Awarua Drain Stopbanks
Figure 12: 100 year ARI flood depth map for total catchment with climate change factors included

30 Environment Bay of Plenty
Hydraulic Design of the Awarua Drain Stopbanks Operations Publication 2007/04
5.4 Associated Works
An outcome of the model has been the identification of key associated works required to complete the flood protection system.
Along with the main stopbanks along the true right bank of the Awarua Drain and the short length along the Muller-Burt boundary, there are associated works needed to complete the system. The locations of these works are indicated on Figure 13.
The cattle race parallel to the Thornton Road linking the higher ground near the main farm gateway and the Tarawera River Stopbank should be raised to a level of 1.7 metres Moturiki Datum which is the 100 year ARI water level without including the estimated future effects of global climate change.
Some minor bunding may be required to provide 100 year ARI protection plus 500 mm freeboard to the Thornton-Matata Road as per the Environment Bay of Plenty guideline design standard for a Major Road.
The cattle race between the milking shed and the main farm gateway is to be augmented as for the main stopbanks, to a level of 2.25m Moturiki.
Two water supply pumps, one near chainage 500 m and one at 1800 m, need to be elevated to avoid damage during the design events.

Environment Bay of Plenty 31
Operations Publication 2007/04 Hydraulic Design of the Awarua Drain Stopbanks
Figure 13: Locations of works associated with the Awarua Stopbank Design Proposal


Operations Publication 2007/04 Hydraulic Design of the Awarua Drain Stopbanks
33
References Blackwood, P., Review of the Flood Carrying Capacity of the Rangitaiki River Below
Edgecumbe, Environment Bay of Plenty Operations Report 2000/09
Guidelines 2001/04, Hydrological and Hydraulic Guidelines, Environment Bay of Plenty, 2001
Hosking, J., 1990, L Moments: Analysis and Estimation of Distributions Using Linear Combinations of Order Statistics, Journal of the Royal Statistical Society, Series B, Vol 52, No.1
Ministry for the Environment, July 2004 Preparing for Climate Change, A guide for local government in New Zealand, ME number 534
Ministry of Works and Development, 1975, Metric Version of Technical Memorandum No.61, National Water and Soil Conservation Organisation
National Institute of Water and Atmospheric Research Ltd, 1995, High Intensity Rainfall Design System, (Electronic Database)
Operations Publication 2005/07 2001/01, Environmental Data Summaries, Environment Bay of Plenty.
Ven Te Chow, 1964, Handbook of Applied Hydrology, McGraw Hill Book Company
Wallace, P., 2002, Awaiti Omeheu Canal Modelling Study, Operations Report 2002/03, Environment Bay of Plenty