Embed Size (px)
Citation preview

Hydraulic Characteristics and Nutrient Transport and Transformation Beneath a Rapid Infiltration Basin, Reedy Creek Improvement District, Orange County, Florida
by D. M. Sumner and L. A. Bradner
U.S. GEOLOGICAL SURVEYWater-Resources Investigations Report 95-4281
Prepared in cooperation with the
Reedy Creek Improvement District
Tallahassee, Florida1996

U.S. DEPARTMENT OF THE INTERIOR
BRUCE BABBITT, Secretary
U.S. GEOLOGICAL SURVEY
Gordon P. Eaton, Director
For additional information write to: Copies of this report can be purchased from:
District Chief U.S. Geological SurveyU.S. Geological Survey Earth Science Information CenterSuite 3015 Open-File Reports Section227 North Bronough Street P.O. Box 25286, MS 517Tallahassee, Florida 32301 Denver, CO 80225-0425

Contents III
CONTENTS
Abstract ............................................................................................................................................................................. 1Introduction ....................................................................................................................................................................... 2
Purpose and Scope....................................................................................................................................................... 3Previous Studies .......................................................................................................................................................... 3
Hydrologic Setting ............................................................................................................................................................ 3Hydrogeology .............................................................................................................................................................. 5
Surficial Aquifer System ................................................................................................................................... 5Intermediate Confining Unit.............................................................................................................................. 6Floridan Aquifer System ................................................................................................................................... 6
Water Budget Components .......................................................................................................................................... 6Wastewater Treatment and Disposal at Reedy Creek Improvement District .................................................................... 6Hydraulic Characteristics of a Rapid Infiltration Basin .................................................................................................... 8
Hydraulic Response to Reclaimed-Water Disposal at a Rapid Infiltration Basin ....................................................... 8Moisture Characteristic Curves ................................................................................................................................... 17
Numerical Model of Flow System .................................................................................................................................... 19Boundary and Initial Conditions.................................................................................................................................. 20Model Layering ........................................................................................................................................................... 21Model Calibration........................................................................................................................................................ 21Application of the Model............................................................................................................................................. 29
Nutrient Transport and Transformation Beneath a Rapid Infiltration Basin..................................................................... 33Biogeochemistry of Nitrogen ...................................................................................................................................... 35Nitrogen Transport and Transformation Beneath Basin 50......................................................................................... 37Biogeochemistry of Phosphorus.................................................................................................................................. 41Phosphorus Transport and Transformation Beneath Basin 50 .................................................................................... 43
Summary and Conclusions................................................................................................................................................ 45Selected References........................................................................................................................................................... 48
FIGURES
1. Map showing location of Reedy Creek Improvement District rapid infiltration basins, Orange County, Florida . 42. Graph showing daily mean discharge of Whittenhorse Creek near Vineland, Florida, and monthly precipitation
at Orlando, Florida................................................................................................................................................... 73. Photograph showing reclaimed water application to rapid infiltration basin.......................................................... 94. Photograph showing rapid infiltration basins.......................................................................................................... 95. Map showing location of wells in vicinity of basin 50 ........................................................................................... 10
6-8. Graphs showing:6. Textural description and identification of model layers at basin 50 ................................................................ 117. Tensiometric measurements of matric potential at basin 50 during the time interval 5:40 a.m.
February 28, 1992, to 5:25 a.m. February 29, 1992......................................................................................... 138. Tensiometric measurements of total head at basin 50 during the time interval 5:45 a.m.
February 28, 1992, to 5:25 a.m. February 29, 1992......................................................................................... 139. Maps showing water table in the vicinity of basin 50 during and following the February-
March 1992 loading event ....................................................................................................................................... 1510. Hydrographs of wells within basin 50 during February-March 1992 loading event .............................................. 1711. Graphs showing lab-derived moisture characteristic curves for 2- and 10-foot depth soil samples from basin 50 1812. Diagram showing boundary conditions for radial flow model................................................................................ 1913. Diagram showing VS2D model grid ....................................................................................................................... 20

IV Contents
FIGURES--Continued
14-38. Graphs showing:14. Comparison of simulated and observed infiltration rate at basin 50 during
February-March 1992 loading event ............................................................................................................... 2215. Comparison of simulated and observed basin 50 cumulative infiltration for the February-March
1992 loading event .......................................................................................................................................... 2316. Model-simulated matric potential at several depths within basin 50 .............................................................. 2417. Model-simulated total head at several depths within basin 50........................................................................ 2418. Comparison of simulated and measured head deviations from background water-level trend....................... 2519. Model-estimated saturation profile at center of basin 50 during initial 3 days of February-March
1992 basin operation........................................................................................................................................ 3020. Model-estimated ground-water mounding distribution after conclusion of last day of
February-March 1992 loading event ............................................................................................................... 3121. Model-estimated head distribution along radial cross-section after conclusion of last day of
basin 50 loading during February-March 19922 loading event ...................................................................... 3222. Simulated basin infiltration rate under 20-hour wet/4-hour dry loading cycle for a range of rises
in water-table altitude above a base water-table depth of 37 feet at basin 50 ................................................. 3323. Model-simulated infiltration rate at basin 50 under various basin-ponding depths ........................................ 3424. Simulated head response to 40-day continuous basin loading at basin 50 with 96-foot
radius ponding ................................................................................................................................................. 3525. Profiles of organic nitrogen concentration at basin 50 during February-March 1992 loading event.............. 3726. Profiles of organic nitrogen concentration at basin 50 during May 1992 loading event................................. 3727. Near-surface nitrate concentrations at basin 50 during May 1992 loading event ........................................... 3828. Near-surface nitrate concentrations at basin 50 during May 1992 loading event ........................................... 3929. Profiles of ammonia concentration (fine fraction) at basin 50 during May 1992 loading event..................... 3930. Profiles of nitrate concentration at basin 50 during February-March 1992 loading event.............................. 4031. Profiles of nitrate concentration at basin 50 during May 1992 loading event................................................. 4032. Comparison of nitrogen and phosphorus concentrations in three point-sampler clusters at basin 50
during initial basin loading on February 25, 1992 .......................................................................................... 4233. Distribution of soil orthophosphate at various pH values ............................................................................... 4234. Profiles of total phosphorus concentration at basin 50 during February-March 1992 loading event ............. 4335. Profiles of total phosphorus concentrations at basin 50 during May 1992 loading event............................... 4336. Near-surface phosphorus concentration at basin 50 during May 1992 loading event..................................... 4437. Profiles of fine- and coarse-fraction orthophosphate at basin 50 during May loading event.......................... 4538. Profiles of fine- and coarse-fraction organic phosphorus at basin 50 during May 1992 loading event.......... 46
TABLES
1. Textural data for five soil samples obtained by split-spoon sampling beneath basin 50........................................ 52. Mineralogy of silt and clay fractions of samples obtained by split-spoon sampling beneath basin 50.................. 53. Results of chemical extractions of “free” oxides of iron and aluminum from samples obtained by
split-spoon sampling beneath basin 50................................................................................................................... 54. Typical Reedy Creek Improvement District wastewater treatment plant reclaimed water quality prior
to treatment plant expansion in 1993...................................................................................................................... 85. Station identification numbers and descriptions of data-collection sites in the vicinity of basin 50...................... 116. Volumetric moisture content in vicinity of basin 50 tensiometer site during early stages of soil
drainage................................................................................................................................................................... 147. Summary of calibration-inferred hydraulic parameters for radial-flow model of subsurface flow in
the vicinity of basin 50 ........................................................................................................................................... 21

Contents V
CONVERSION FACTORS, VERTICAL DATUM, ABBREVIATED WATER-QUALITY UNITS, AND ABBREVIATIONS
Sea level: In this report “sea level” refers to the National Geodetic Vertical Datum of 1929--a geodetic datum derived from a general adjustment of the first-order level nets of the United States and Canada, formerly called Sea Level Datum of 1929.
Altitude, as used in this report, refers to distance above or below sea level.Transmissivity: The standard unit for transmissivity is cubic foot per day per square foot times foot of aquifer thickness [(ft3/d)/ft2]ft.
In this report, the mathematically reduced form, foot squared per day (ft2/d), is used for convenience.Specific conductance is given in microsiemens per centimeter at 25 degrees Celsius (µS/cm at 25 °C).Leakance: The standard unit for leakance is foot per day per foot of confining unit thickness [(ft/d)/ft]. In this report, the mathematically
reduced form, per day (d-1), is used for convenience.Matric potential: The standard unit for matric potential is foot-pounds per pound [(ft-lb)/lb]. In this report, the mathematically reduced
form, feet (ft), is used for convenience.Concentrations of chemical constituents in water are given either in milligrams per liter (mg/L) or micrograms per liter (µg/L).Moisture content: The standard unit for moisture content is cubic foot per cubic foot [(ft3/ft3)]. In this report, the mathematically reduced
form, dimensionless, is used for convenience.
ADDITIONAL ABBREVIATIONS
DNRA = dissimilatory nitrate reduction to ammonium ft/ft = feet per foot
g = gramµm = micrometer
PVC = polyvinylchloride RIBs = rapid infiltration basins
RCID = Reedy Creek Improvement DistrictUSGS = United States Geological Survey
WWTP = Wastewater treatment plant
Multiply By To obtain
Lengthinch (in.) 2.54 centimeter
foot (ft) 0.3048 meter
foot per mile (ft/mi) 0.1894 meter per kilometer
mile (mi) 1.609 kilometer
Area
acre 0.4047 hectare
square mile (mi2) 2.590 square kilometer
Volume
million gallons (Mgal) 3,785 cubic meters
Flowfoot per day (ft/d) 0.3048 meter per day
cubic foot per second (ft3/s) 0.02832 cubic meter per second
million gallons per day (Mgal/d) 0.04381 cubic meter per second
inch per year (in/yr) 2.54 centimeter per year
Transmissivityfoot squared per day (ft2/d) 0.0929 meter squared per day
Leakance
foot per day per foot [(ft/d)/ft] 1.0 meter per day per meter
Matric potentialfeet of water (ft) 2.988 kilopascal
feet of water (ft) 0.02988 bar

SYMBOLS
VI Symbols List
Roman
C(ψ) specific moisture capacity as a function of matric potential, defined as the slope of the moisture characteristic curve, [L-1]
h total hydraulic head (z-ψ), [L]K(ψ) hydraulic conductivity as a function of
matric potential, [L/T]Kr(ψ) radial hydraulic conductivity as a function
of matric potential, [L/T]Kz(ψ) vertical hydraulic conductivity as a function
of matric potential, [L/T]Ks saturated hydraulic conductivity, [L/T](Ks)r radial saturated hydraulic conductivity,
[L/T](Ks)z vertical saturated hydraulic conductivity,
[L/T]m 1 - 1/n, [dimensionless]n empirical van Genuchten coefficient
descriptive of the slope of the moisture-characteristic curve between air entry and residual moisture content, [dimensionless]
r radial coordinate, [L]s liquid saturation, [L3/L3]Ss specific storage, [L-1]
t time, [T]Vr radial component of pore-water velocity,
[L/T]Vz vertical component of pore-water velocity,
[L/T]z vertical coordinate, positive upwards, [L]
Greek
α empirical van Genuchten coefficient, the reciprocal of which defines the matric potential at which liquid saturation is 0.5, [L-1]
φ porosity, [L3/L3]θ(ψ) volumetric moisture content as a function of
matric potential, defined as the moisture characteristic curve, [L3/L3]
θr residual volumetric moisture content, [L3/L3]
θs saturation volumetric moisture content, [L3/L3]
ψ matric potential, [L]

Abstract 1
Hydraulic Characteristics and Nutrient Transport and Transformation Beneath a Rapid Infiltration Basin, Reedy Creek Improvement District, Orange County, Florida
by D.M. Sumner and L.A. Bradner
Abstract
The Reedy Creek Improvement District disposes of about 7.5 million gallons per day (1992) of reclaimed water through 85 1-acre rapid infiltration basins within a 1,000-acre area of sandy soils in Orange County, Florida. The U.S. Geological Survey conducted field experiments in 1992 at an individual basin to examine and better understand the hydraulic characteristics and nutrient transport and transformation of reclaimed water beneath a rapid infiltration basin. At the time, concentrations of total nitrogen and total phosphorus in reclaimed water were about 3 and 0.25 milligrams per liter, respectively.
A two-dimensional, radial, unsaturated/saturated numerical flow model was applied to describe the flow system beneath a rapid infiltration basin under current and hypothetical basin loading scenarios and to estimate the hydraulic properties of the soil and sediment beneath a basin. The thicknesses of the unsaturated and saturated parts of the surficial aquifer system at the basin investigated were about 37 and 52 feet, respectively. The model successfully replicated the field-monitored infiltration rate (about 5.5 feet per day during the daily flooding periods of about 17 hours) and ground-water mounding response during basin operation. Horizontal and vertical hydraulic conductivity of the saturated part of the surficial aquifer system were estimated to be 150 and 45 feet per day, respectively. The field-saturated
vertical hydraulic conductivity of the shallow soil, estimated to be about 5.1 feet per day, was considered to have been less than the full-saturation value because of the effects of air entrapment. Specific yield of the surficial aquifer was estimated to be 0.41.
The upper 20 feet of the basin subsurface profile probably served as a system control on infiltration because of the relatively low field-saturated, vertical hydraulic conductivity of the sediments within this layer. The flow model indicates that, in the vicinity of the basin, flow in the deeper, saturated zone was relatively slow compared to the more vigorous flow in the shallow saturated zone. The large radial component of flow below the water table in the vicinity of the basin implies that reclaimed water moves preferentially in the shallow part of the saturated zone upon reaching the water table. Therefore, there may be some vertical stratification in the saturated zone, with recently infiltrated water overlying ambient water. The infiltration capacity at the basin would be unaffected by a small (less than 10 feet) increase in background water-table altitude, because the water table would remain below the system control on infiltration. However, water-table rises of 15 and 20 feet were estimated to reduce the infiltration capacity of the basin by 8 and 25 percent, respectively. Model simulations indicate that increasing ponded depth within the basin from 4 to 12 inches and from 4 to 24 inches

2 Hydraulic Characteristics and Nutrient Transport, Reedy Creek Improvement District, Orange County, Florida
would increase basin infiltration capacity by less than 6 and 11 percent, respectively. A loading strategy at the basin that relies on long, uninterrupted flooding was shown to offer the possibility of inducing a more anaerobic environment conducive to denitrification while maintaining reclaimed-water disposal capacity.
Field measurements indicated that transient, elevated concentrations or “spikes” of nitrate (as high as 33 milligrams per liter as nitrogen) occurred at the leading edge of the infiltrating water and in the shallow saturated zone following a prolonged basin rest period. This phenomenon probably is the result of mineralization and nitrification of organic nitrogen retained within the subsurface during earlier basin loading events. The organic nitrogen was retained in the shallow soil (due to adsorption/straining) and the shallow saturated zone (due to deposition under slacking pore-water velocity). The magnitude of the nitrate spikes appears to be influenced by the scheduling of basin loading, with short flooding and resting periods being most favorable to minimization of nitrate spikes. Removal of nitrogen by denitrification from the percolating reclaimed water is minimal in the vicinity of the basin, probably because of the lack of reducing conditions and a relative paucity of organic carbon substrates. It is speculated that longer flooding periods could induce reducing conditions that would be favorable for nitrogen removal from the system, but probably would lead to more pronounced nitrate spiking.
Phosphorus concentrations were decreased by about 90 percent from concentrations in reclaimed water after moving through the upper 15 feet of the soil profile. This most likely was a result of adsorption onto abundant iron and aluminum hydrous oxyhydroxide coatings on sand grains. However, some phosphorus (coarse fraction, organic) passes through the shallow soil and accumulates below the water table under slacking pore-water velocity. This phosphorus is immobilized by adsorption, fixation, or precipitation reactions during basin rest periods.
INTRODUCTION
Disposal of reclaimed water (treated wastewater) by means of rapid infiltration basins (RIBs) has become increasingly popular as an alternative to the traditional practice of disposal by discharging to surface waters. RIBs offer the possibility of cost-effective tertiary treat-ment through percolation of the reclaimed water within the biologically and chemically active soil environment. Additionally, the environmental impacts, principally eutrophication of downstream surface-water bodies, associated with the discharge of reclaimed water to sur-face waters are mediated with land-based disposal.
The Reedy Creek Improvement District (RCID), a State (Florida) chartered organization in southwestern Orange and northwestern Osceola Counties that includes the Walt Disney World complex, is an area of about 38 mi2. In compliance with directives of the Florida Department of Environmental Protection, RCID, in 1990, curtailed discharges of reclaimed water into a natural wetland treatment system and diverted most of the flow of reclaimed water to RIBs. In 1992, RCID disposed of 95 percent of the reclaimed water generated from its wastewater treatment plant through 85 1-acre RIBs within a 1,000-acre site constructed on sandy soils of the Lake Wales ridge. This site previously was used for citrus cultivation. The relatively high permeability of the soils of this site allows for “rapid” infiltration of applied reclaimed water. Reclaimed-water application rates in 1992 were about 7.5 Mgal/d. The concentrations of total nitrogen (as N) and total phosphorus (as P) in the reclaimed water in 1992 were about 3 mg/L and 0.25 mg/L, respectively.
The operation of RIBs in the United States and elsewhere has demonstrated the ability of the soil environment to reduce nutrient loads in reclaimed water. Nitrification/denitrification reactions, with suit-able cycling of aerobic and anaerobic conditions and organic carbon availability, serve to produce gaseous nitrogen compounds which can be lost to the atmo-sphere. Adsorption reactions can reduce concentra-tions of phosphorus in the soil water provided that an appropriate substrate is available–such as the oxyhy-droxides of iron and aluminum commonly present as coatings on sand grains within the vadose zone of much of central Florida’s upland soils.
The U. S. Geological Survey (USGS), in coop-eration with the RCID, performed this investigation from October 1990 through September 1994 in an effort to better understand the movement and chemical transformation of reclaimed water applied to RIBs.

Hydrologic Setting 3
Purpose and Scope
This report presents the results of a study to define (1) the flow system within the unsaturated and saturated zones beneath a RIB, and (2) nutrient trans-port and transformation within reclaimed water perco-lating beneath a RIB. The report describes the results of field and laboratory investigations and numerical flow modeling.
The investigation focused on a detailed analysis of a single basin (RCID basin 50) during 1992. Water-quality data was collected along a vertical profile dur-ing basin operation. Descriptions of nutrient transport and transformation consistent with the water chemis-try and the inferred flow system were developed. The nature of the flow system was evaluated through development of an unsaturated/saturated numerical flow model calibrated to approximately replicate the field-observed hydraulic features of the system. Labo-ratory analyses of the unsaturated hydraulic properties of basin soils were used as an aid to model calibration. The calibrated flow model was applied to hypothetical basin operation scenarios (higher water table, extended flooding periods, and increased ponded depth) to evaluate system performance.
Previous Studies
The first summary appraisal of the hydrologic conditions within RCID was presented by Putnam (1975), in which the effects of the development of Walt Disney World during the period 1966-73 were evaluated. German (1986) completed an updated appraisal for the period 1966-80. These reports provide an overview of the climatological conditions, ground- and surface-water quality, stream and lake characterization, the hydrogeologic setting, and the nature of ground-water flow within RCID. Hampson (1993) described the hydrology and quality of Reedy Creek during the period 1986-89.
An evaluation of the effect of spray irrigation of reclaimed water on the water quality of the surficial aquifer system at RCID was reported by German (1990). Nutrient migration and transformation were described based on the results of water-quality moni-toring within the saturated zone of the surficial aquifer system. Nitrification/denitrification and phosphorus immobilization reactions were postulated to explain some of the observed water-quality data.
A report prepared by the engineering consulting firm CH2M Hill (1989) summarized a pre-construction assessment of the suitability of the 1,000-acre RCID RIBs site for land-based reclaimed-water disposal. The nature of the surficial sediments was extensively exam-ined by means of numerous soil borings, aquifer tests, geophysical logging, and piezocone sounding tests. An areally two-dimensional, saturated ground-water flow model, constructed on the basis of the collected data, indicated that total capacity of the 85 basins was greater than 10 Mgal/d and possibly as much as 20 Mgal/d.
Other sites of disposal of reclaimed water in RIBs include the Boulder, Colo., system (Carlson and others, 1982), the Water Conserv II facility in Orange County, Fla. (Camp, Dresser, and McKee, Inc., 1983), the 23rd Avenue rapid infiltration project in Phoenix, Ariz. (Bouwer and Rice, 1984), and the Dan Region Project in Israel (Idelovitch and Michail, 1984).
The results of a regional numerical flow model of the Floridan aquifer system in east-central Florida, including RCID, were presented by Tibbals (1990). Flow characteristics of the Floridan aquifer system were discussed and quantified in that report.
The Soil Conservation Service soil survey of Orange County (Doolittle and Schellentrager, 1989) mapped and described the shallow soils of the surficial sediments within the RCID 1,000-acre reclaimed-water disposal facility.
HYDROLOGIC SETTING
The RCID RIB disposal facility is located within the Lake Wales Ridge physiographic district, a region characterized by sandy, droughty soils, hilly karstic topography, and relatively high altitudes. The wetlands adjacent to the facility are within the Osceola Plain, a low-lying, low-relief area of poorly drained soils (White, 1970, plate 1-B). Altitudes within the disposal site range from 100 ft to over 140 ft above sea level, whereas the adjacent wetlands are at an altitude of about 100 ft above sea level (fig. 1).
Whittenhorse Creek drains 12.4 mi2, including Bear Bay and part of the area encompassing the disposal facility. Mean flow over the period 1968-94 is 4.0 ft3/s as recorded by a gage at Hartzog Road (fig. 1). The annual mean flow ranged from 12.8 ft3/s in water year 1970 to 0.0 ft3/s in water year 1981. Whittenhorse Creek empties into the RCID perimeter canal which ultimately dis-charges to Reedy Creek. The area east of the disposal facility is drained by the perimeter and C-4 canals.

4 Hydraulic Characteristics and Nutrient Transport, Reedy Creek Improvement District, Orange County, Florida
Figure 1. Location of Reedy Creek Improvement District rapid infiltration basins, Orange County, Florida.
110
110120130
130
120110
110
120
130
140
110
100
110
120
110
120
130140
100
110110120
130140 100
100110120130
130
110100130
Bear Bay
ReedyLake
545
Har
tzog
Roa
d
120
WhittenhorseCreek
LAKE
WETLAND
STREAM/CANAL
100
C-4
EXPLANATION
RAPID INFILTRATION BASIN
0 500 1000 1500 2000 FEET
81o 38’ 81o 37’
28o 25’
28o 23’
0 100 200 300 400 500 600 METERS
STREAM GAGING STATION
110
Per
imet
er c
anal
Basin 50
ELEVATION OF LAND SURFACE CONTOUR --Datum is sea level. Contour interval 10 feet.Hachures indicate depressions.

Hydrologic Setting 5
Hydrogeology
The hydrogeologic profile in the vicinity of the RCID reclaimed-water disposal facility consists of (from land surface down): the surficial aquifer system, the intermediate confining unit, the Floridan aquifer system, the sub-Floridan confining unit, and basement rocks. Hydraulic head in the surficial system generally is at or above that of the Floridan aquifer system, defin-ing the surficial system as a source of recharge to the Floridan aquifer system. This situation prevailed before RCID basin loading began in 1990 (Tibbals, 1990), but the recharge rates probably were lower than at present.
Surficial Aquifer System
The surficial aquifer system consists of unsatur-ated and saturated zones, with the position of the water table (representing the upper boundary of the saturated zone) dependent on the recent history of basin loading, rainfall, evapotranspiration, and leakage to adjacent wetlands and to the Floridan aquifer system. The water table prior to development of basin loading probably was relatively flat because topographic control of water-table altitude is slight in the study area (A.M. O’Reilly, USGS, oral commun., 1994). With basin loading, the water table reflects the recent loading history. Water that enters the surficial aquifer system moves laterally to discharge at adjacent wetlands or flows downward through the intermediate confining unit to the Floridan aquifer system.
The thickness of the unsaturated zone varies from 0 ft in the wetland areas to over 40 ft in the upland areas. The thickness of the saturated zone is typically 40 to 50 ft, but can be greater near sinkhole breaches in the intermediate confining unit or near loaded basins. The surficial sediments are largely composed of fine-to-medium-grained sand, with minor amounts of silt and clay--primarily kaolinite (tables 1 and 2). Iron and alu-minum oxyhydroxides occur as coatings on sand grains and are abundant in the oxidizing environment of the unsaturated zone (table 3). Lenticular strata, several feet thick with clay and/or silt content as much as 40 percent and an areal extent of several thousand feet, are present in the surficial sediments (CH2M Hill, 1989). These strata may allow for the development of a perched water table in some areas. Near-surface trenching revealed that even sandy soils contain lenticular lenses of darker-colored, finer-textured (but still sandy) material a few feet in areal extent embedded in the sand matrix. These lenses probably are capable of imparting an anisotropic nature to subsurface hydraulic properties.
Table 1. Textural data for five soil samples obtained by split-spoon sampling beneath basin 50
[Source: W.G. Harris, University of Florida, Soil and Water Science Department, written commun., 1993. Soil classification based on Unified Soil Classification System (American Society for Testing Materials, 1985)]
Soil classificationDepth(feet)
SandSilt
(percent)Clay
Poorly-graded sand 3 96.0 1.2 2.8
Clayey sand 11 84.4 2.5 13.1
Poorly-graded sand with clay
19 91.5 2.4 6.1
Poorly-graded sand 39 96.8 2.2 1.0
Poorly-graded sand 63 96.6 2.1 1.4
Poorly-graded sand with clay
79 89.0 2.2 8.8
Table 2. Mineralogy of silt and clay fractions of samples obtained by split-spoon sampling beneath basin 50
[(Source: W.G. Harris, University of Florida, Soil and Water Science Department, written commun., 1993.) X-ray diffraction identification of minerals based on diagnostic d-spacing under specified conditions of cat-ion saturation, glycerol solvation, and temperature (Whittig and Allardice, 1986). Minerals are reported in the order of their estimated relative abun-dance based on relative x-ray diffraction peaks. Ka, kaolinite; HIV, hydroxy-interlayered vermiculite; Gi, gibbsite; Ha, halloysite; Qz, quartz; Sm, smectite; Mi, mica. =, similar amounts; >, more abundant than; >>, much more abundant than. Thermogravimetry analysis performed on clay fraction (Tan and others, 1986). --, negligible quantity]
Depth(feet)
X-ray diffractionThermogravimetry
Kaolinite Gibbsite
Silt Clay(percent of clay
fraction)
3 Qz>Ka=Gi Ka>HIV>Gi>Qz 49 2011 Qz>Ka>Gi Ka>Gi>HIV 53 2219 Qz=Ka Ka>>Qz 91 --39 Qz>Ka Ka>Qz>Ha 85 --63 Qz>Ka Ka>Qz>Gi>Ha 74 779 Qz=Ka>>Mi Ka>>Sm=Qz 83 --
Table 3. Results of chemical extractions of “free” oxides of iron and aluminum from samples obtained by split-spoon sampling beneath basin 50
[(Source: W.G. Harris, University of Florida, Soil and Water Science Depart-ment, written commun., 1993). Concentrations were determined by citrate-dithionite extraction (Olson and Ellis, 1982). µg/g, micrograms of element per gram of dry soil]
Depth(feet)
Iron(µg/g)
Aluminum(µg/g)
3 1630 92011 7950 170019 550 25039 680 27063 250 22079 30 130

6 Hydraulic Characteristics and Nutrient Transport, Reedy Creek Improvement District, Orange County, Florida
Intermediate Confining Unit
The intermediate confining unit consists of the marine, phosphatic sands, silts, and clays of the Haw-thorn Formation. This unit is less permeable than the adjacent surficial and Floridan aquifer systems and impedes the downward flow of water. The thickness of the intermediate confining unit over the RCID disposal facility generally ranges from 20 to 60 ft. However, the unit is absent in some areas of sinkhole breaches, leav-ing the surficial sands in direct contact with the Floridan aquifer system. The leakance (flow per unit area per unit head difference across the confining unit) of the intermediate confining unit in the vicinity of the RCID reclaimed-water disposal facility has been estimated in a recent investigation to be about 0.0003 d-1 (L. C. Mur-ray, USGS, oral commun., 1994). Tibbals (1990) esti-mated a similar value of leakance for this area.
Floridan Aquifer System
The Floridan aquifer system is a thick sequence of carbonate strata that supplies most of the potable water in Florida. The thickness of this unit in the vicin-ity of the RCID reclaimed-water disposal facility is about 2,300 ft. The Floridan aquifer system is under-lain by the sub-Floridan confining unit—low-perme-ability gypsiferous and anhydritic carbonate beds. The Floridan aquifer system is divided into two more per-meable units—the Upper and Lower Floridan aquifers, which are separated by a zone of lower permeability, the middle semiconfining unit. The Upper Floridan aquifer directly underlies the intermediate confining unit and receives water leaking from the surficial aqui-fer system. The transmissivity of the Upper Floridan aquifer (estimated at 80,000 ft2/d in the study area by L. C. Murray, USGS, oral commun., 1994) is more than an order of magnitude higher than that of the surf-icial aquifer. For this reason, little local mounding due to basin loading is expected in the Upper Floridan aquifer or underlying units. The hydraulic head within the Upper Floridan aquifer in the vicinity of the reclaimed-water disposal facility decreases to the northeast with a gradient of about 4 ft/mi (Sumner and others, 1992).
Water Budget Components
Principal components of the water budget of the surficial aquifer system include infiltration of reclaimed water, rainfall, evapotranspiration, runoff,
and leakage to the underlying aquifer. Average annual rainfall over the study area is about 50 in., with 55 per-cent of this total occurring during June, July, August, and September (Tibbals, 1990). Evapotranspiration ranges from a potential rate of 48 in/yr to a rate of about 30 in/yr as a function of depth to the water table. Evapotranspiration also exhibits a strong seasonal component, with maximum rates in the wetter and warmer summer months. Leakage from the surficial aquifer system to the Upper Floridan aquifer was on the order of 4 to 9 in/yr prior to the initiation of basin loading (Tibbals, 1990). In 1992, the rate of reclaimed-water infiltration was 7.5 Mgal/d (about 100 in/yr over the 1,000-acre disposal facility). The increase in surfi-cial aquifer head as a result of reclaimed-water dis-posal is estimated to increase leakage to the Upper Floridan aquifer 1.3 (in/yr)/ft of increase in surficial aquifer head (based on an intermediate confining unit leakance of 0.0003 d-1). Runoff rates from the Whit-tenhorse Creek drainage basin (including water that enters the surficial aquifer system and then moves lat-erally to discharge in wetland areas) averaged about 4 in/yr prior to reclaimed-water disposal in the area. Fol-lowing the commencement of basin loading in 1991, the ground-water contribution to runoff has probably increased, as suggested by a comparison of the pre- and post-basin loading discharge record of Whitten-horse Creek (fig. 2). The relatively low frequency of zero-flow conditions in Whittenhorse Creek following commencement of basin loading is better explained by basin loading than by the rainfall record.
WASTEWATER TREATMENT AND DISPOSAL AT REEDY CREEK IMPROVEMENT DISTRICT
Wastewater generated within RCID was (prior to 1993) subjected to secondary treatment (activated sludge with denitrification process) at a wastewater treatment plant (WWTP) operated by Reedy Creek Energy Services, Inc. to produce reclaimed water. The WWTP was expanded in 1993 to include a five-stage, modified Bardenpho system to enhance nitrogen and phosphorus removal (Harkness and Otta, 1994). Typi-cal RCID WWTP reclaimed-water quality prior to implementation of the plant expansion is summarized in table 4. Reclaimed water is stored in two 5-Mgal concrete ground-storage tanks prior to routing to RIBs.

Wastewater Treatment and Disposal at Reedy Creek Improvement District 7
Reclaimed water is pumped from storage tanks at the WWTP approximately 2.5 mi through a 48-in. diameter, reinforced concrete pipe to the 1,000-acre RIB disposal site and then routed to the center of selected basins where the reclaimed water spills over a vertical section of pipe into a RIB (figs. 3 and 4). Basins are approximately 1 acre in surface area with side slopes consisting of stabilized soil cement over-lain with a geotextile liner (McKim, 1993). Basins are
Figure 2. Daily mean discharge of Whittenhorse Creek near Vineland, Florida, and monthly precipitation at Orlando, Florida.
1970 1980 19901975 1985
20
15
10
5
0
CALENDAR YEAR
0
10
20
30
40
50
60
70
DIS
CH
AR
GE
, IN
CU
BIC
FE
ET
PE
R S
EC
ON
DWHITTENHORSE CREEK
MO
NT
HLY
PR
EC
IPIT
AT
ION
,IN
INC
HE
S
Com
men
cem
ent b
asin
load
ing
ORLANDO AIRPORT RAINFALL
constructed in native soils--fine-grained sand of the Candler Series (Doolittle and Schellentrager, 1989). The soil profile is undisturbed at depths greater than about 1 to 1.5 ft. The upper profile of a basin is tilled between extended uses to disrupt the surface-filter cake formed by deposition of fine materials and algal growth. The tillage operation incorporates the surface-filter cake within the upper profile, perhaps leading to long-term degradation of basin infiltration capacity.

8 Hydraulic Characteristics and Nutrient Transport, Reedy Creek Improvement District, Orange County, Florida
Reclaimed water usually is applied to eight selected basins during an approximately 15- to 20-hour period, with a rest period of about 4 to 9 hours between applications. Generally, daily loading is continued in this fashion at a given set of basins for 1 week, followed by 4 weeks of basin rest during which the reclaimed water is routed to other sets of basins. More extended loading and resting periods were applied to the basins prior to and during the February-March 1992 hydraulic test discussed in this report. Basin infiltration capacity ranges from 0.5 to 2.0 Mgal/d, with an average of about 1.25 Mgal/d (McKim, 1993). Infiltration capacity for most basins is such that loading rates are not sufficient to cover the entire basin bottom. Rather, the ponded area assumes an irregular shape in conformance with basin topography.
Table 4. Typical Reedy Creek Improvement District wastewater treatment plant reclaimed water quality prior to treatment plant expansion in 1993 (Kohl and Bedford, 1993)
[All values expressed in milligrams per liter unless otherwise noted. °C, degrees Celsius; µS./cm at 25 °C, microsiemens per centimeter at 25 degrees Celsius; NTU, Nephelometric turbidity units; Pt-Co Units, Plat-inum cobalt units; <, less than]
ParameterDesign
concentrationRange
Alkalinity (as CaCO3) 69 29 - 125Bicarbonate 84 52 - 150Carbon dioxide 7.7 6.6 - 36Calcium 30 25 - 35Magnesium 7.6 5 - 10Sodium 57 45 - 80Chloride 110 60 - 155Dissolved solids (at 180 °C)
347288
-400
Specific conductance (µS/cm at 25 °C)
510480
-550
Turbidity (NTU) 3.5 0.5 - 5.0Color (Pt-Co Units) 7.5 5 - 25pH (units) 7.26 5.9 - 8.17Temperature (°C) 26 20 - 28Aluminum 0.075 <0.05 - 0.24Iron (total) 0.46 0.16 - 0.72Ammonia (as N) 0.5 <0.03 - 35.5Nitrate (as N) 6.0 <0.02 - 9.17Nitrite (as N) 0.05 <0.02 - 0.67Total Kjeldahl nitrogen (as N)
3.00.04
-18.0
Orthophosphate (as P) 0.13 <0.01 - 1.11Total phosphorus (as P) 0.27 0.07 - 2.15Total suspended solids 7.0 1.0 - 12.0Total organic carbon 7.2 <1.0 - 21.6
HYDRAULIC CHARACTERISTICS OF A RAPID INFILTRATION BASIN
The hydraulic characteristics of RIB disposal of reclaimed water were evaluated from field and labora-tory data obtained in conjunction with a field experi-ment conducted at RCID basin 50 (figs. 1 and 5) in February-March 1992. The results of this experiment were used to define soil and aquifer hydraulic parame-ters. A subsurface flow model was used to simulate the system response to the field-experiment conditions (includes infiltration rates, rate and direction of sub-surface movement of reclaimed water, ground-water mounding), as well as for hypothetical scenarios of basin operation.
Hydraulic Response to Reclaimed-Water Disposal at a Rapid Infiltration Basin
Reclaimed water was applied to basin 50 in a controlled and metered fashion beginning at 10:20 a.m. on February 25, 1992, and ending at 10:00 p.m. on March 10, 1992. Similar to normal basin operation, nightly basin rest periods several hours in length were maintained, during which the basin floor dried within the initial 1.5 hours. Berms were constructed to restrict the ponding area to a circular shape to produce radial symmetry. Pond radius was maintained at 66 ft during the initial 6 days of the experiment and was expanded to 96 ft for the following 8 days, after which the basin was dry during the remainder of the experiment. Initial daily flooding of the bermed area usually required 1 to 2 hours with a fully open flow valve. After full-basin flooding, the flow rate was decreased incre-mentally throughout the day to maintain a nearly constant depth of ponding (averaging 4 in.). Metered flow rate allowed for estimation of basin infiltration rate. To monitor the transient nature of ground-water mounding and recession beneath the basin (fig. 5 and table 5), wells in the vicinity of basin 50 were periodically measured before and during basin operation and for a 2-week period after operation ceased. Inside the basin, where vertical head gradients were expected to be most pro-nounced, wells have relatively short screen lengths (2 ft) to define the vertical head distribution beneath the basin. Outside the basin, where vertical head gradients were expected to be relatively small, wells have longer screen lengths (10 ft).

Hydraulic Characteristics of a Rapid Infiltration Basin 9
Figure 3. Reclaimed water application to rapid infiltration basin.
Figure 4. Rapid infiltration basins.

10 Hydraulic Characteristics and Nutrient Transport, Reedy Creek Improvement District, Orange County, Florida
Reclaimed water was applied to basin 50 during the daily loading cycle at the rate of about 0.3 and 0.9 Mgal/d for the initial 6 days and final 9 days, respec-tively. A total of almost 10 Mgal of reclaimed water was applied over the 15-day loading period of the field exper-iment. The average basin-infiltration rate (flow rate per unit area) was about 5.5 ft/d, both before and after the flooded area was increased on March 2, 1992. This lack
Figure 5. Location of wells in vicinity of basin 50.
1
2-7
8-9
1011
12
13
14
15
17
18
19
21-2627-3233-38
20
16
50
48
49
51
525354
Har
tzog
Roa
dN
16
EXPLANATION
SURFICIAL AQUIFER WELL -- Location and reference number (see table 5)
POINT SAMPLERS -- Location and reference number (see table 5)
CIRCULAR FLOODED AREAS OF FEBRUARY-MARCH 1992FIELD EXPERIMENT -- 66 and 96 feet radius
21
0 50 100 150 METERS
0 100 200 300 400 500 FEET
50 RAPID INFILTRATION BASIN -- Delineation and basin number
of flux response to changes in ponded area indicates that lateral components of flow in the unsaturated zone are small relative to the magnitude of vertical flow. Relatively finer-textured material present at the site at depths from 7 to 20 ft (fig. 6, and represented by 11-ft depth sample in table 1) apparently is not of suffi-ciently low hydraulic conductivity to produce perch-ing adequate to induce significant lateral flow.

Hydraulic Characteristics of a Rapid Infiltration Basin 11
Table 5. Station identification numbers and descriptions of data-collection sites in the vicinity of basin 50
[Reference numbers are shown in figure 3. --, no data]
Station numberReferencenumber
Depth(feet)
Screen length(feet)
Reclaimed water
282358081371700 -- -- --
Surficial aquifer wells
282358081371601 1 62 10282358081371707 2 25 2282358081371708 3 35 2282358081371709 4 45 2
282358081371710 5 60 2282358081371711 6 75 2282358081371712 7 89 2282358081372201 8 35 2282358081372202 9 48 2282358081371801 10 60 10
282358081371802 11 60 10282357081371701 12 56 10282356081371701 13 55 10282358081371501 14 60 10282358081372001 15 48 10282359081371701 16 56 10
282400081371701 17 55 10282359081371801 18 60 10282352081371601 19 45 10
Upper Floridan aquifer well
282402081371701 20 406 open hole
Point samplers
282358081371701 21 1 0.25282358081371702 22 3 0.25
282358081371703 23 5 0.25282358081371704 24 7 0.25282358081371705 25 10 0.25282358081371706 26 15 0.25282358081371713 27 1 0.25282358081371714 28 3 0.25
282358081371715 29 5 0.25282358081371716 30 7 0.25282358081371717 31 9 0.25282358081371718 32 10 0.25282358081371719 33 1 0.25282358081371720 34 3 0.25
282358081371721 35 5 0.25282358081371722 36 7 0.25282358081371723 37 9 0.25282358081371724 38 12 0.25
If the ground-water mound remains below this layer of fine-textured material, the layer probably serves as the system control on basin infiltration. This observation appears at odds with the textural differences between the fine-textured layer and the overlying coarser mate-rial, but probably is explained by the field-observed air entrapment in the coarser soils. Air entrapment in soils can result in significant reduction in hydraulic conduc-tivity because air-filling occurs preferentially in the larger pores. Additionally, the constant infiltration rate under a variable flooded area indicates that spatial variability in near-basin soil hydraulic properties prob-ably is not extreme or is small-scale.
Point samplers, intended primarily for water-quality sampling in the upper 15 ft, served a secondary role as binary pressure sensors. The ability to produce water from a point sampler is indicative of positive pressure conditions. Inability to produce water is
Figure 6. Textural description and identification of model layers at basin 50. Note: Particle size data determined from 2-foot length split-spoon samples obtained during drilling of 89-foot depth intra-basin well. z = depth of more complete textural (table 1) and mineralogical analysis (table 2).
0 0.50.1 0.2 0.3 0.4
PARTICLE FRACTION BY WEIGHT SMALLER
0
90
10
20
30
40
50
60
70
80
DE
PT
H, I
N F
EE
T B
ELO
W L
AN
D S
UR
FA
CELAYER 1
LAYER 2
LAYER 3
THAN 0.075 MILLIMETER

12 Hydraulic Characteristics and Nutrient Transport, Reedy Creek Improvement District, Orange County, Florida
indicative of soil-water tension. Positive water pres-sures were noted in the upper 15 ft of the profile fol-lowing basin flooding, as evidenced by the ability of the point samplers to produce water during this period. However, positive pressures were never noted in the 25-ft depth well, indicating that the base of the system control on infiltration lies between 15 and 25 ft and probably occurs at about 20 ft based on textural con-siderations (fig. 6). If the ground-water mound remains below this layer of fine-textured material, the surface material (0-20 ft) probably serves as the sys-tem control on basin infiltration. If the ground-water mound is above the base of this layer, the ability of the aquifer to laterally dissipate the infiltrating water becomes the control on basin infiltration.
Surface clogging-induced reduction of basin infiltration rate has been a recurring problem in many instances of recharge basin operation (Bouwer and others, 1974; Jones and others, 1974; Schuh and Shaver, 1988). However, the constant infiltration capacity at basin 50 during the field experiment indi-cates that soil clogging probably is a minor factor, pos-sibly due to the relatively low suspended-sediment load in the reclaimed water and a maintenance sched-ule involving basin disking after each 1- or 2-week period of use. An additional factor that could have pre-vented soil clogging is detachment of algal growth noticed during the experiment. Rice (1974) showed through laboratory experiments that oxygen bubbles produced by algae can cause the algal mat to become buoyant and break loose from the soil surface, disrupt-ing formation of a surface-clogging layer.
Observations during the experiment indicated that air entrapment within the soil during infiltration is a prominent feature of the system. Mechanical distur-bance of flooded soil resulted in the release of signifi-cant numbers of gas bubbles. Air trapped within the soil can cause large reductions in hydraulic conductiv-ity, and therefore infiltration rate, from that of a fully saturated soil. The operation schedule (1992) allowed for nightly basin rest periods, permitting reentry of air and preventing the gradual disappearance of entrapped air through dissolution. Additionally, a mobile gaseous phase exists in the soil, particularly during the initial stages of basin loading. Gas bubbles were seen exiting the subsurface at several points in the basin.
Tensiometric measurements of soil-water matric potential were made in basin 50 over a 24-hour basin flooding and drying period on February 28-29, 1992. Soil-water matric potential reflects the energy status of the soil water resulting from both pressure and adsorp-
tive forces. In this report, matric potential is reported on an energy-per-unit weight basis (units of length). Some soil physicists prefer to use the term “matric potential” only in the case of unsaturated conditions (soil-water pressure less than atmospheric pressure) and to use the term “pressure potential” in the case of saturated conditions (soil-water pressure greater than atmospheric pressure). In this report, the suggestion of Hillel (1980, p. 143-144) to universally apply the term “matric potential” was adopted. In this convention, matric potential assumes positive values under unsat-urated conditions and negative values under saturated conditions.
Water wells are only capable of measuring nega-tive matric potential (positive water pressure). Tensi-ometers can measure both positive (at values less than about 32 ft) and negative values of matric potential (Hillel, 1980, p.156-158). Tensiometers consist of a water-filled tube that is allowed to equilibrate with the energy status of soil water across a ceramic cup. Manometer- or transducer-assisted measurement of tube water pressure allows an inference of soil-water matric potential based on hydrostatic principles.
The tensiometers were placed within RCID basin 50 at 1-ft intervals to a depth of 4 ft with dupli-cate tensiometers at each depth. The tensiometers were arrayed symmetrically along a 3-ft diameter cir-cle with equal-depth tensiometers on opposite sides of the circle. The tensiometers were constructed of 1/2-in. diameter PVC pipe. A sight tube was con-nected with epoxy to the upper end of the pipe. A Soil-moisture Equipment Corporation model 655 1 bar, high-flow ceramic cup was connected with epoxy to the lower end of the pipe. A rubber stopper, perforated with 1/8-in. purge and pressure-monitoring tubes, was placed in the sight tube. Holes were hand-augered with a 4-in. diameter auger. The tensiometers were filled with water and placed with the ceramic cup at the desired depths. The holes were backfilled with silica flour around the ceramic cup, with native soil to within 1 ft of land surface, and with a bentonite cap to land surface. Water levels within the tensiometers were monitored using the sight tubes and then maintained as necessary. Tensiometer pressure was monitored with a mercury manometer. Average matric potential and total head for one 24-hour period at the four monitored depths are shown in figures 7 and 8, respectively.

Hydraulic Characteristics of a Rapid Infiltration Basin 13
Figure 7. Tensiometric measurements of matric potential at basin 50 during the time interval 5:40 a.m. February 28, 1992, to 5:25 a.m. February 29, 1992. Note: Plotted values reflect average of two measurements obtained from two tensiometers at each of the monitored depths, laterally separated by 3 feet. Curve annotation indicates depth of tensiometer, in feet. Ponded depth during flooded period was about 0.33 foot. Basin 50 loading began at time = 0 hours. Positive and negative values of matric potential correspond to soil-water tension and positive pressure conditions, respectively.
-2.5
1.5
-2.0
-1.5
-1.0
-0.5
0
0.5
1.0
MA
TR
IC P
OT
EN
TIA
L, IN
FE
ET
OF
WA
TE
R
0 240 5 10 15 20
TIME, IN HOURS
3
2
1
4
Tensiometers flooded
Loading ends
Ponding dissipated;drying begins
Figure 8. Tensiometric measurements of total head at basin 50 during the time interval 5:45 a.m. February 28, 1992, to 5:25 a.m. February 29, 1992. Note: Plotted values reflect average of two measurements obtained from two tensiometers at each of the monitored depths, laterally separated by 3 feet. Curve annotation indicates depth of tensiometer, in feet. Ponded depth during flooded period was about 0.33 foot. Basin 50 loading began at time = 0 hours. Positive and negative values of matric potential correspond to soil-water tension and positive pressure conditions, respectively.
-6
1
-6
-5
-4
-3
-2
-1
0
TO
TA
L H
EA
D, I
N F
EE
T O
F W
AT
ER
0 240 5 10 15 20
TIME, IN HOURS
1
2
3
4
Tensiometers flooded
Loading ends Ponding dissipated;drying begins

14 Hydraulic Characteristics and Nutrient Transport, Reedy Creek Improvement District, Orange County, Florida
Following an 11-hour basin rest period, matric potential was about 1 ft in the three deeper monitoring locations and about 1.3 ft at the 1-ft depth (time from 0 to 0.7 hour, fig. 7). Upon basin flooding, matric poten-tial was reduced as the wetting front progressed down-ward. The unexpectedly fast response by the tensiometers at all depths indicates the likelihood of a transient, pneumatic effect due to compression of the soil gases ahead of the infiltration front. Ponded depth was maintained at about 4 in. A few hours after field saturation was achieved, matric potential below a depth of 2 ft was relatively constant and the vertical hydraulic gradient below a depth of 2 ft was approxi-mately 1 ft/ft, indicative of an infiltration rate close to the field-saturated hydraulic conductivity of the 2- to 4-ft depth interval. Above a depth of 2 ft, the hydraulic gradient following saturation was less than 1 ft/ft. Pond head was only slightly greater than the measured head at a depth of 1 ft, indicating that little head loss occurs over the upper foot of soil. The measured head, at a depth of 2 ft, was only about 0.5 ft less than the pond head. These effects reflect the presence of rela-tively high-permeability soil in the upper 1.5 ft of the profile. Structural changes in the soil caused by earth-moving during basin construction and by disking between basin operations are the cause of the high per-meability of these soils. Drainage occurred rapidly over the monitored profile for 2 to 3 hours following the end of flooding, followed by a period of much slower drainage, during which matric potential returned to values observed prior to flooding. Under unsaturated conditions, little difference existed between duplicate tensiometers at equal depth; how-ever, differences in matric potential of as much as 0.3 ft existed during saturated conditions. These dif-ferences probably reflect small-scale variations in hydraulic properties, the effects of which were ampli-fied during saturated (relatively high flow) conditions.
Sampling of the soil profile with a Soilmoisture Equipment Corporation Model 0200 core sampler was completed at six depths for gravimetric determination of moisture content. Two cores, laterally separated by 4 to 5 ft, were taken at each depth. The moisture content of the soil profile during periods of basin flooding is of particular interest and was expected to be less than porosity based on field-observed air entrapment. Intact core removal is difficult under near-saturated conditions, but is practical when the soil water is under tension (positive matric potential). However, if core samples are taken after matric poten-
tial exceeds air entry values, significant desaturation will have occurred. Sampling was timed in an attempt to procure cores in low tension environments. To this end, sampling progressed downward with the drainage front over a 2-hour period, sampling a given depth when intact core removal was possible. Acknowledg-ing that some slight soil desaturation might have taken place before core removal, the resulting estimates of field-saturated moisture content represent a lower bound (table 6). Volumetric moisture content ranged from 0.21 to 0.31, compared to a porosity range of 0.43 to 0.46 for the soil samples, indicating the possi-bility of significant air entrapment.
Water-level measurements, made throughout the period of basin loading and for 2 weeks thereafter, were made in 19 surficial aquifer wells of 2-in. diame-ter and 1 Upper Floridan well (fig. 5 and table 5). Prior to basin loading, the water table was relatively flat (fig. 9) and about 37 ft below the basin floor. A ground-water mound began forming beneath the basin about 1.5 days after basin loading commenced (fig. 10). The mound was asymmetric, probably due to heterogeneity in aquifer hydraulic properties (fig. 9). Maximum mound height was about 7 ft in the 35-ft depth well. The water table remained below the 25-ft depth well throughout the basin-loading event. Diurnal variations in mound height resulting from the daily basin loading and resting cycles were pronounced near the basin (fig. 10) and were evident as far as 195 ft from the basin center. Large vertical hydraulic gradi-ents were apparent in the upper saturated zone in the vicinity of the basin. However, in the deeper saturated zone (below about 75 ft depth), vertical head gradients were small, indicating a relatively minor amount of vertical flow in this zone. Thus, the predominant movement of infiltrated water seemed to be lateral after the water entered the shallow saturated zone, rather than vertical through the lower saturated zone and the intermediate confining unit, and into the Upper Floridan aquifer. Upon infiltration reaching the water table, pore-water velocity is expected to have declined substantially as head gradients declined and the cross-sectional pore space available for flow increased.
Table 6. Volumetric moisture content in vicinity of basin 50 tensiometer site during early stages of soil drainage
Core sample number
Sample depth (feet)1 2 3 4 5 6
Location 1 0.21 0.24 0.27 0.26 0.25 0.27Location 2 0.20 0.25 0.28 0.31 0.24 0.23

Hydraulic Characteristics of a Rapid Infiltration Basin 15
Water levels in wells within the basin began to decline about 4 hours after the end of basin loading on March 10. The mound dissipated and the water table again became flat within 2 weeks after the end of basin loading (fig. 9).
The potentiometric surface of the Upper Floridan aquifer remained at a nearly constant level during the field experiment—about 100 ft above sea level—as
Figure 9. Water table in the vicinity of basin 50 during and following the February-March 1992 loading event. Note: Some water-level measurements are not honored by contour lines due to relatively large vertical gradients immediately beneath the basin. Elevation of the basin floor is about 140.5 feet.
February 24, 1992
EXPLANATION
103
50
48
49
51
525354
Har
tzog
Roa
d
N
0 50 100 150 meters
0 100 200 300 400 500 feet
CIRCULAR FLOODED AREAS OF FEBRUARY-MARCH 1992FIELD EXPERIMENT -- 66 and 96 feet radius
50 RAPID INFILTRATION BASIN -- Delineation and basin number
WATER TABLE ALTITUDE CONTOUR --Contour interval varies
WELL SITE -- Number is altitude of water level in feet above sea level
103.5
103.25
103.38103.35
103.34103.33
103.39
103.40
103.24
103.32
103.37103.35
103.59
103.29
103.17
103.59
indicated by water-level measurements made in the Upper Floridan aquifer well 20 (fig. 5 and table 5), about 500 ft from the center of basin 50. The effect of basin loading on the potentiometric surface of the Upper Floridan aquifer is thought to be minimal, even directly beneath the basin, due to the relatively high transmissivity of this aquifer—about 80,000 ft2/d (L.C. Murray, USGS, oral commun., 1994) in this area.

16 Hydraulic Characteristics and Nutrient Transport, Reedy Creek Improvement District, Orange County, Florida
Figure 9. Water table in the vicinity of basin 50 during and following the February-March 1992 loading event. Note: Some water-level measurements are not honored by contour lines due to relatively large vertical gradients immediately beneath the basin. Elevation of the basin floor is about 140.5 feet--Continued.
104
103
March 2, 1992
50
48
49
51
525354
N
0 50 100 150 meters
0 100 200 300 400 500 feet
102.19
103.37103.38
103.61103.89
104.23
104.20103.69
103.79
103.67
105.39104.97104.42104.44
103.81
103.36 Har
tzog
Roa
d
106
104103
March 11, 1992
50
48
49
51
525354
N
Har
tzog
Roa
d
0 50 100 150 meters
0 100 200 300 400 500 feet
108.18107.81107.31106.54106.65105.22
105.77
105.54 105.62106.42
106.75105.84
105.02105.62
104.77104.12104.10
102.35
105
103
March 16, 1992
50
48
49
51
525354
N
0 50 100 150 meters
0 100 200 300 400 500 feet
Har
tzog
Roa
d
103.25103.5
103.75
104.14104.05103.88103.93
102.45
103.54
103.74
103.86103.70
103.81
103.94
104.01
104.19104.00103.89
103.77103.74
104
March 24, 1992
50
48
49
51
525354
N
0 50 100 150 meters
0 100 200 300 400 500 feet
Har
tzog
Roa
d103
102.75
102.5
102.25
102.89102.85102.76102.78
102.97
102.52
102.67102.55
102.72
102.63
102.15
103.08103.07
103.03102.96
103.03
103.02

Hydraulic Characteristics of a Rapid Infiltration Basin 17
soil moisture-characteristic data was limited to the wet range (0 to 2.5 ft-water matric potential) prevalent dur-ing RIB operation. The soil moisture-characteristic data reflect desorption (drainage) conditions only. Hysteresis (Hillel, 1980, p. 152-155) can produce vari-ation between desorption and sorption (wetting) soil moisture-characteristic properties; however, this effect was not evaluated.
A parameterized form of the moisture-character-istic curves was developed by van Genuchten (1980). Unlike saturated-flow settings in which hydraulic con-ductivity at a given location is constant (assuming unchanging fluid viscosity and density), unsaturated hydraulic conductivity values change with the satura-tion of the soil as the cross-sectional area available for flow changes. Likewise, the storage characteristics of the system are not defined by a saturation-invariant value. The van Genuchten parameterization accommo-dates the description of both moisture-characteristic and hydraulic conductivity curves (as well as specific capacity, the slope of the moisture-characteristic curve).
The functional forms of hydraulic conductivity, specific moisture capacity, and volumetric moisture content were parameterized in the manner of van Genuchten (1980).
Moisture Characteristic Curves
Laboratory determination of soil-moisture char-acteristic data was made for two soil samples from basin 50 (fig. 11). The samples were collected at depths of 2 and 10 ft and were intended to be represen-tative of the undisturbed, near-surface soil (poorly graded sand) and the relatively fine-textured layer from about 7 to 20 ft (clayey sand), respectively. The degree to which spatial variability affects the represen-tativeness of these samples was not examined. The 1.18-in. length, 2.125-in. diameter cylindrical samples were extracted with a Soilmoisture Equipment Corpo-ration Model 0200 core sampler. The samples were placed in a Soilmoisture Equipment Corporation Model 1400 Tempe cell and, within a few minutes, sat-urated from the bottom up. The relatively fast satura-tion was intended to simulate, in a gross fashion, the manner of field saturation during basin operation. With this method of saturation, air entrapment is expected. The Tempe cell was attached by a tube to a buret, forming a hanging water column. The samples were drained over about a week’s time, incrementally increasing the imposed suction, and monitoring the water released from the sample. The determination of
3 354 455 606 757 89
Note: Hydrographs arranged sequentially from most shallowwell at top to deepest well onbottom. Hydrographs for 75-and 89-foot wells are almost
(figure 5; table 5)
coincident.
Well reference number Depth, in feet
Figure 10. Hydrographs of wells within basin 50 during February-March 1992 loading event. Note: Elevation of basin floor is about 140.5 feet. The 35-foot well screen was above the water table before March 4.
110
109
108
107
106
105
104
103
102
WA
TE
R L
EV
EL,
IN F
EE
T A
BO
VE
SE
A L
EV
EL
slope = -0.06 foot per day
24 1 10 20
FEBRUARY MARCH 199227
Note: February 24 head estimated based on nearby water level measurementsE
nd o
f bas
in lo
adin
g
Bas
in lo
aded

18 Hydraulic Characteristics and Nutrient Transport, Reedy Creek Improvement District, Orange County, Florida
α is empirical van Genuchten coefficient, the reciprocal of which defines the matric poten-tial at which effective saturation is 0.5, [L-1];
n is empirical van Genuchten coefficient descriptive of the slope of the moisture characteristic curve between air entry and residual moisture content, [dimensionless];
m is 1 - 1/n, [dimensionless];
θr is residual volumetric moisture content, [L3/L3];
θs is saturation volumetric moisture content, [L3/L3]; and
ψ is matric potential, [L].
Differences were detected in the moisture-char-acteristic data of the two samples. The more gradual desaturation of the clayey sand was symptomatic of the relatively fine texture of this sample. The poorly graded sand exhibited rapid desaturation beyond air entry. The residual moisture content of the clayey sand (0.13) also was significantly higher than that of the poorly graded sand (0.06), which was expected due to the textural differences between the two samples. For both samples, saturation moisture content was less than porosity, indicating air entrapment. However, the poorly graded sand exhibited a greater volumetric air content (0.13) than the clayey sand (0.05) during lab “saturation.”
Hydraulic conductivity:
Specific moisture capacity:
Volumetric moisture content:
where
Ks is saturated hydraulic conductivity, [L/T];
K ψ( ) KS
1 αψ( )n 1–1 αψ( )n+( )
m––
2
1 αψn+
m/2--------------------------------------------------------------------------------- if ψ 0>,=
K ψ( ) KS ifψ 0≤,=
C ψ( ) ∂θ∂ψ-------
mnα θs θr–( ) αψ( )n 1–
1 αψ( )n+( )
m 1+---------------------------------------------------------------,–= = if ψ > 0
C ψ( ) 0 if ψ 0≤,=
Figure 11. Lab-derived moisture characteristic curves for 2- and 10-foot depth soil samples from basin 50. Data fit to van Genuchten formulation (1980) with Powell’s algorithm (Press and others, 1989). Positive values of matric potential correspond to soil-water tension conditions--Continued.
0 0.5 1.0 1.5 2.0 2.5
MATRIC POTENTIAL, IN FEET OF WATER
VO
LUM
ET
RIC
MO
IST
UR
E C
ON
TE
NT 0.5
0.4
0.3
0.2
0.1
00 0.5 1.0 1.5 2.0 2.5
MATRIC POTENTIAL, IN FEET OF WATER
0.5
0.4
0.3
0.2
0.1
0
Basin 50: 2-foot depth - poorly-graded sand
saturation moisture content, θs = 0.28residual moisture content, θr = 0.06
van Genuchten parameter, α = 1.13 per footvan Genuchten parameter, n = 7.4porosity, φ = 0.41
Basin 50: 10-foot depth - clayey sand
saturation moisture content, θs = 0.34residual moisture content, θr = 0.13
van Genuchten parameter, α = 1.08 per footvan Genuchten parameter, n = 3.9porosity, φ = 0.39
θ ψ( ) θs θr–( ) 1
1 αψ( )n+------------------------
m θr if ψ 0>,+=
θ ψ( ) θs ifψ 0>,=

Hydraulic Characteristics of a Rapid Infiltration Basin 19
NUMERICAL MODEL OF FLOW SYSTEM
The model chosen for subsurface flow simula-tion was the numerical code VS2D (Lappala and oth-ers, 1987). VS2D is a finite-difference model capable of simulating both unsaturated and saturated transient-flow conditions in a two-dimensional lateral (either radial or cartesian) and vertical (cartesian) setting. The model assumes that only a single, isothermal liquid phase is mobile and that any gaseous phase is at a uni-form, constant pressure. The state (dependent) variable of the flow system is matric potential. The spatial and temporal distribution of matric potential is determined by solution of the unsaturated/saturated flow equation, under appropriate boundary conditions. The flow equation is solved numerically in VS2D through appli-cation of the equation to discrete points in space and time and simultaneous solution of the resulting set of equations. In radial coordinates, the unsaturated/satu-rated, two-dimensional flow equation assumes the fol-lowing form:
where z is vertical coordinate, positive
upwards, [L]; r is radial coordinate, [L]; t is time, [T];
ψ is matric potential, [L];
Figure 12. Boundary conditions for radial flow model.
Saturated zone
Unsaturated zone
Specified pressure over flooded basin area during basin loading
No-flow during basin rest periods
No-flow outside basin
No-flow
Spe
cifie
d he
ad
No-
flow
Bas
in c
ente
rline
sSs C ψ( )–( )∂ψ∂t-------=
∂∂z----- KZ ψ( ) ∂ψ
∂z------- 1–
+
∂∂r----- Kr ψ( )∂ψ
∂r-------
+Kr ψ( )
r---------------
∂ψ∂r-------
Kr(ψ), Kz(ψ) are hydraulic conductivity as a function of matric potential for radial and verti-cal directions, respectively, [L/T];
C(ψ) is specific moisture capacity as a func-tion of matric potential, defined as the slope of the moisture characteristic curve, [L-1];
θ(ψ) is volumetric moisture content as a function of matric potential, defined as the moisturecharacteristic curve, [L3/L3];
Ss is specific storage, [L-1]; and
s is liquid saturation, [L3/L3].
The above equation is a modified version of the Richards’ equation (Richards, 1931) for unsaturated soil-water flow. The modifications extend the equation to include saturated flow and a radial setting.
The subsurface domain simulated was a radial slice from the basin center line and included the unsat-urated and saturated parts of the surficial aquifer sys-tem (fig. 12). Spatial discretization (fig. 13) was finest (as fine as 0.5 ft vertical by 3 ft radial) in areas of relatively steep hydraulic gradients (directly beneath the basin and particularly in the unsaturated zone). The model grid is assumed to be aligned with respect to the principal directions of hydraulic conductivity. Because anisotropy in hydraulic conductivity is usually associ-ated with horizontally-oriented bedding planes, this assumption is probably met with the gravity-aligned model grid (fig. 13) used in this study.
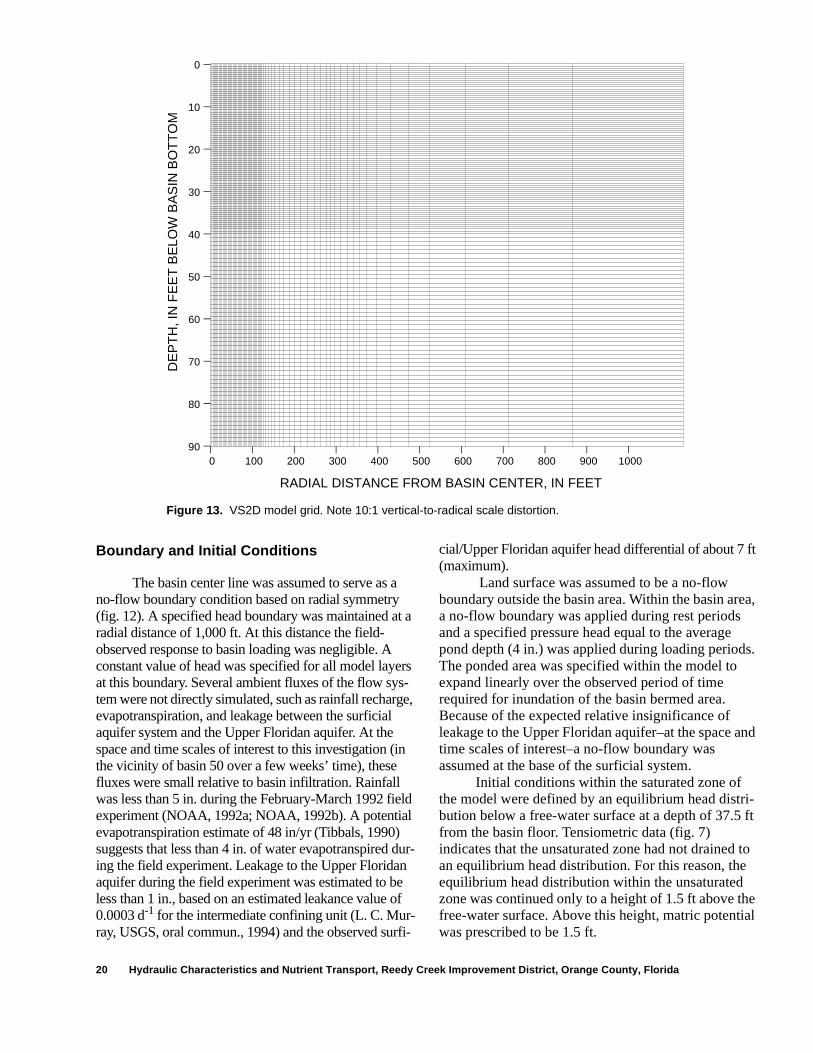
20 Hydraulic Characteristics and Nutrient Transport, Reedy Creek Improvement District, Orange County, Florida
Boundary and Initial Conditions
The basin center line was assumed to serve as a no-flow boundary condition based on radial symmetry (fig. 12). A specified head boundary was maintained at a radial distance of 1,000 ft. At this distance the field-observed response to basin loading was negligible. A constant value of head was specified for all model layers at this boundary. Several ambient fluxes of the flow sys-tem were not directly simulated, such as rainfall recharge, evapotranspiration, and leakage between the surficial aquifer system and the Upper Floridan aquifer. At the space and time scales of interest to this investigation (in the vicinity of basin 50 over a few weeks’ time), these fluxes were small relative to basin infiltration. Rainfall was less than 5 in. during the February-March 1992 field experiment (NOAA, 1992a; NOAA, 1992b). A potential evapotranspiration estimate of 48 in/yr (Tibbals, 1990) suggests that less than 4 in. of water evapotranspired dur-ing the field experiment. Leakage to the Upper Floridan aquifer during the field experiment was estimated to be less than 1 in., based on an estimated leakance value of 0.0003 d-1 for the intermediate confining unit (L. C. Mur-ray, USGS, oral commun., 1994) and the observed surfi-
Figure 13. VS2D model grid. Note 10:1 vertical-to-radical scale distortion.
0 100 200 300 400 500 600 700 800 900 1000
RADIAL DISTANCE FROM BASIN CENTER, IN FEET
DE
PT
H, I
N F
EE
T B
ELO
W B
AS
IN B
OT
TO
M
0
10
20
30
40
50
60
70
80
90
cial/Upper Floridan aquifer head differential of about 7 ft (maximum).
Land surface was assumed to be a no-flow boundary outside the basin area. Within the basin area, a no-flow boundary was applied during rest periods and a specified pressure head equal to the average pond depth (4 in.) was applied during loading periods. The ponded area was specified within the model to expand linearly over the observed period of time required for inundation of the basin bermed area. Because of the expected relative insignificance of leakage to the Upper Floridan aquifer–at the space and time scales of interest–a no-flow boundary was assumed at the base of the surficial system.
Initial conditions within the saturated zone of the model were defined by an equilibrium head distri-bution below a free-water surface at a depth of 37.5 ft from the basin floor. Tensiometric data (fig. 7) indicates that the unsaturated zone had not drained to an equilibrium head distribution. For this reason, the equilibrium head distribution within the unsaturated zone was continued only to a height of 1.5 ft above the free-water surface. Above this height, matric potential was prescribed to be 1.5 ft.

Hydraulic Characteristics of a Rapid Infiltration Basin 21
Model Layering
The vertical distribution of hydraulic properties (model layering) was developed through a combina-tion of textural analysis and model calibration. The surficial system was divided into three distinct layers (fig. 6). The relatively fine-textured (table 1), iron- and aluminum-rich (table 3) zone between a depth of about 7 to 20 ft was identified as a distinct layer (layer 2, fig. 6). This impeding layer seems to have lateral continuity, based on drilling observations near basin 50, and a probable surface expression several hundred feet from the basin. Soil texture above and below the impeding layer are similar. Air entrapment, which was expected (and was observed) above the impeding layer, was not expected below the impeding layer because of the expected unsaturated status of a coarser layer underlying a finer layer. For this reason, the sediments above the impeding layer (layer 1, fig. 6) are distinguished from the sediments below the impeding layer (layer 3, fig. 6). The lower part of layer 3 (below a depth of 70 ft) is finer and more kaolinite-rich than the upper part of that layer.
Model Calibration
Data from field and lab experiments were used to calibrate the numerical flow model. These data included measured infiltration rate, field-measured hydraulic head in the surficial aquifer system, field-measured transit time for the moisture front, labora-tory-derived soil moisture-characteristic curves, field-observed soil/aquifer textural patterns, field-observed tensiometric data from shallow soil, and literature-derived estimates of subsurface hydraulic properties.
The numerical flow model simulated the flow sys-tem as affected by the loading of a single basin (RCID basin 50). However, about 6.7 Mgal of reclaimed water was applied to a nearby basin (RCID basin 52, fig. 5) during the 1-week period immediately preceding the field experiment. Other basins more distant from basin 50 also were loaded during the experiment. Therefore, the effects of the multiple basin loadings were filtered from ground-water level observations so that the mea-surements reflected only the effects of basin 50 loading. This filtering was accomplished by estimating a “back-ground” ground-water level trend prevalent during the field experiment. This trend, estimated based on water levels during a 2-day period prior to the loading of basin 50, indicated a water-level decline rate of 0.06 ft/d (fig. 10). Error in estimation of the background ground-water level trend has a progressively greater effect with increasing time. For this reason, primary emphasis was
placed on obtaining acceptable model replication of the observed growth, rather than decay, of the ground-water mound beneath basin 50.
Based on the calibration criteria, a model was developed which approximately replicated the observed measurements of the field experiment. The hydraulic parameters that reflect this calibration are summarized in table 7. Model calibration was simpli-fied to some extent by the lack of feedback from the deep, saturated zone to the shallow unsaturated zone. Therefore, estimation of the shallow hydraulic param-eters was attempted with little regard for the properties of the deeper zone. A successful calibration of the shallow zone provided the proper infiltration flux to the saturated zone, whereupon the deeper hydraulic properties were estimated based on replication of ground-water mound growth and dissipation.
Model calibration indicated that the ability of basin 50 to accept water primarily is a function of (Ks)z of the shallow soils. As mentioned earlier, the lack of a reduction in basin infiltration rate with an increase in ponded area during the February-March 1992 field experiment indicates that lateral flow components in the unsaturated zone probably are relatively small in magnitude, which implies that (Ks)z is vertically fairly uniform above the base (estimated to be at a depth of 20) of the system control. That is, the field-saturated hydraulic conductivity of layer 2 is approximately equal to the field-saturated hydraulic conductivity of layer 1, precluding perching over layer 2 and the result-ing lateral flow. Based on the above rationale, both layers 1 and 2 were assigned a value of 5.1 ft/d for (Ks)z. Estimation of (Ks)r for the shallow layers was not possible, given the relatively minor amount of radial flow in this zone and the resulting lack of model sensi-tivity to this parameter (a value of 5.1 ft/d was used in model simulations). Observed infiltration data were
Table 7. Summary of calibration-inferred hydraulic parameters for radial-flow model of subsurface flow in the vicinity of basin 50
[(Ks)r, radial saturated hydraulic conductivity; (Ks)z, vertical saturated hydraulic conductivity; θs, saturation volumetric moisture content; θr, residual volumetric moisture content; α, van Genuchten coefficient; n, van Genuchten coefficient; --, parameter not reliably estimated by model owing to a lack of sensitivity; ft/d, feet per day; ft3/ft3, cubic feet per cubic foot].
Layer(Ks)r (ft/d)
(Ks)z (ft/d)
θs (ft3/ft3)
θr (ft3/ft3)
α (ft-1)
n(dimen-
sion-less)
1 -- 5.1 0.28 0.06 1.1 72 -- 5.1 .35 .13 1.1 43 150 45 .45 .04 1.1 7

22 Hydraulic Characteristics and Nutrient Transport, Reedy Creek Improvement District, Orange County, Florida
replicated reasonably well by the model (figs. 14 and 15). Although only the daily average field-observed infiltration rate was determined, model-simulated infil-tration indicated that a relatively high infiltration rate should occur during basin filling when the gradient in matric potential is relatively large. Later, the flow is thought to have been driven almost exclusively by gravity and the model indicates that the flux decreased to a lower and time-invariant value.
Some features of the tensiometric data (figs. 7 and 8) were replicated through trial-and-error manipu-lation of the van Genuchten parameters for layer 1. As with the observed data, simulated values of matric potential were reduced after a few hours of fast drain-age to about 1.0 ft, after which followed a period of slow drainage (figs. 7 and 16). This effect probably was due to the dramatic, sharp change in moisture con-tent, and therefore hydraulic conductivity, in sandy soils undergoing drainage. An appreciable vertical head gradient existed during the period of slow drain-age (figs. 8 and 17); however, the relatively low values
Figure 14. Comparison of simulated and observed infiltration rate at basin 50 during February-March 1992 loading event. Note: Observed flux shown is daily mean value. Unrecorded basin flow interruptions suspected to have occurred on March 4, 1994.
SIMULATED INFILTRATION RATE
OBSERVED INFILTRATION RATE
24 1 11
10
9
8
7
6
5
4
3
2
1
0
INF
ILT
RA
TIO
N R
AT
E, I
N F
EE
T P
ER
DA
Y
FEBRUARY MARCH 1992 25 26 27 28 29 2 3 4 5 6 7 8 9 10
EXPLANATION
of hydraulic conductivity at the ambient matric poten-tial limited flow. The comparison of model results and field observations during the initial stages of basin flooding were complicated by the suspected pneu-matic response in tensiometer data during this period. The model (VS2D) is based on an assumption of a constant-pressure soil gas and is therefore incapable of simulating air pressurization caused by an advancing wetting front. During ponded conditions, observed values of matric potential were about 1.5 ft lower (pressure was 1.5 ft higher) than simulated values. This effect probably was caused by the lack of inclu-sion in the model of a high hydraulic conductivity upper layer (about 1 to 1.5 ft thick) representing the mechanically disturbed soil. The disturbed layer has little effect on system infiltration, which is governed by the hydraulic gradient in the underlying relatively low-permeability soil. The vertical hydraulic gradient during ponding was approximately one, below a depth of 2 ft, in both observed data and simulated values (figs. 8 and 17). The van Genuchten parameters

Hydraulic Characteristics of a Rapid Infiltration Basin 23
summarized in table 7 provided model results reason-ably consistent with laboratory-derived moisture-char-acteristic data (fig. 11), field-derived estimates of saturated moisture content (table 6), literature values for similar soils (Lappala and others, 1987, table 1), and some aspects of observed tensiometric data.
Although there were no direct measurements of the hydraulic status of layer 2, indirect measurements (infiltration rate, water-table response), textural defini-tion, and the moisture-characteristic curve obtained for a sample at 10-ft depth (fig. 11), were used to infer the hydraulic properties of this layer. The van Genuchten parameters - α and n - for layer 3 cannot be reliably estimated because of a lack of model sensitivity to these parameters, but were inferred based on textural similarities with layer 1. Model simulations that attempted to acknowledge the textural differences within layer 3 (fig. 6) were unsuccessful in reproduc-ing the observed response. Specifically, the observed low vertical hydraulic gradient in the lower zone of the
Figure 15. Comparison of simulated and observed basin 50 cumulative infiltration for the February-March 1992 loading event. Note: Observed cumulative infiltration shown is based on daily mean flux values. Unrecorded basin flow interruptions suspected to have occurred on March 4, 1992.
SIMULATED CUMULATIVE INFILTRATION
OBSERVED CUMULATIVE INFILTRATION
10
9
8
7
6
5
4
3
2
1
0
EXPLANATION
24 1 11
FEBRUARY MARCH 1992
25 26 27 28 29 2 3 4 5 6 7 8 9 10
surficial aquifer system during basin loading (fig. 10) was not reproduced with a model division of layer 3. The most successful simulations in this respect assumed homogeneous properties within layer 3. This phenomenon might be indicative of (1) little hydraulic difference between the two zones, (2) vertical hetero-geneity that is not laterally extensive, or (3) inaccura-cies in model assumptions.
An additional appraisal of model reliability that incorporates the entire unsaturated-zone profile involved a comparison of observed and simulated transit time for the initial moisture front. For a given infiltration rate, this transit time is largely a function of specific yield. A large specific yield implies a large amount of pore space for the infiltrating water to fill and therefore, a relatively slow-moving moisture front. The model produced a transit time from land surface to water table reasonably close to that inferred from hydrographs of wells within basin 50 (fig. 18).

24 Hydraulic Characteristics and Nutrient Transport, Reedy Creek Improvement District, Orange County, Florida
Figure 16. Model-simulated matric potential at several depths within basin 50. Note: Curve annotation refers to depth in feet. Positive and negative values of matric potential correspond to soil-water tension and positive pressure conditions, respectively.
TIME, IN DAYS
MA
TR
IC P
OT
EN
TIA
L, IN
FE
ET
OF
WA
TE
R
25
10
43
2
1
0 1 2 3
2
1.5
1
0.5
0
-0.5
Figure 17. Model-simulated total head at several depths within basin 50. Note: Curve annotation refers to depth in feet. Datum is land surface.
TIME, IN DAYS
TO
TA
L H
EA
D, I
N F
EE
T O
F W
AT
ER
4
2
1
3
0 1 2 3
1
0
-1
-2
-3
-4
-5
-6

Hydraulic Characteristics of a Rapid Infiltration Basin 25
Figure 18. Comparison of simulated and measured head deviations from background water-level trend. Note: Background water level trend assumed to be -0.060 foot per day. Well locations shown in figure 5.
SIMULATED
MEASURED
Well 4 - radial distance of 17 feet; 45-foot depth
Bas
in lo
aded
24 1 10 20
FEBRUARY
8
7
6
5
4
3
2
1
0
HE
AD
AB
OV
E B
AC
KG
RO
UN
D T
RE
ND
, IN
FE
ET
30
End
of b
asin
load
ing
MARCH 1992
Figure 18. Comparison of simulated and measured head deviations from background water-level trend. Note: Background water level trend assumed to be -0.060 foot per day. Well locations shown in figure--Continued.
SIMULATED
MEASURED
Well 5 - radial distance of 20 feet; 60-foot depth
basi
n lo
aded
8
7
6
5
4
3
2
1
0
HE
AD
AB
OV
E B
AC
KG
RO
UN
D T
RE
ND
, IN
FE
ET
24 1 10 20
FEBRUARY30
end
of b
asin
load
ing
MARCH 1992

26 Hydraulic Characteristics and Nutrient Transport, Reedy Creek Improvement District, Orange County, Florida
Figure 18. Comparison of simulated and measured head deviations from background water-level trend. Note: Background water level trend assumed to be -0.060 foot per day. Well locations shown in figure 5--Continued.
SIMULATED
MEASURED
Well 6 - radial distance of 24 feet; 75-foot depth
basi
n lo
aded
8
7
6
5
4
3
2
1
0
HE
AD
AB
OV
E B
AC
KG
RO
UN
D T
RE
ND
, IN
FE
ET
24 1 10 20
FEBRUARY30
end
of b
asin
load
ing
MARCH 1992
Figure 18. Comparison of simulated and measured head deviations from background water-level trend. Note: Background water level trend assumed to be -0.060 foot per day. Well locations shown in figure 5--Continued.
SIMULATED
MEASUREDWell 7 - radial distance of 29 feet; 89-foot depth
8
7
6
5
4
3
2
1
0
HE
AD
AB
OV
E B
AC
KG
RO
UN
D T
RE
ND
, IN
FE
ET
24 1 10 20 30
basi
n lo
aded
end
of b
asin
load
ing
FEBRUARY MARCH 1992

Hydraulic Characteristics of a Rapid Infiltration Basin 27
Figure 18. Comparison of simulated and measured head deviations from background water-level trend. Note: Background water level trend assumed to be -0.060 foot per day. Well locations shown in figure 5--Continued.
SIMULATED
MEASUREDWell 1 - radial distance of 125 feet; 55-foot depth
8
7
6
5
4
3
2
1
0
HE
AD
AB
OV
E B
AC
KG
RO
UN
D T
RE
ND
, IN
FE
ET
24 1 10 20 30
basi
n lo
aded
FEBRUARY
end
of b
asin
load
ing
MARCH 1992
Figure 18. Comparison of simulated and measured head deviations from background water-level trend. Note: Background water level trend assumed to be -0.060 foot per day. Well locations shown in figure 5--Continued.
SIMULATED
-- Well 10 -- Well 12 -- Well 16
- radial distance of 150 feet; 55-foot depth
basi
n lo
aded
8
7
6
5
4
3
2
1
0
HE
AD
AB
OV
E B
AC
KG
RO
UN
D T
RE
ND
, IN
FE
ET
MEASURED
24 1 10 20
FEBRUARY30
end
of b
asin
load
ing
MARCH 1992

28 Hydraulic Characteristics and Nutrient Transport, Reedy Creek Improvement District, Orange County, Florida
SIMULATED
- radial distance of 195 feet; 55-foot depth
basi
n lo
aded
8
7
6
5
4
3
2
1
0
HE
AD
AB
OV
E B
AC
KG
RO
UN
D T
RE
ND
, IN
FE
ET
-- Well 11 -- Well 14 -- Well 18
MEASURED
24 1 10 20
FEBRUARY30
end
of b
asin
load
ing
MARCH 1992
Figure 18. Comparison of simulated and measured head deviations from background water-level trend. Note: Background water level trend assumed to be -0.060 foot per day. Well locations shown in figure 5--Continued.
SIMULATED
- radial distance of 240 feet; 55-foot depth
basi
n lo
aded
8
7
6
5
4
3
2
1
0
HE
AD
AB
OV
E B
AC
KG
RO
UN
D T
RE
ND
, IN
FE
ET
-- Well 13 -- Well 17
MEASURED
24 1 10 20
FEBRUARY30
end
ofba
sin
load
ing
MARCH 1992
Figure 18. Comparison of simulated and measured head deviations from background water-level trend. Note: Background water level trend assumed to be -0.060 foot per day. Well locations shown in figure 5--Continued.

Hydraulic Characteristics of a Rapid Infiltration Basin 29
The ability of the model to replicate the field-observed ground-water mounding beneath and in the vicinity of the RIB was predominantly governed by the following hydraulic parameters (all within layer 3): (Ks)r, (Ks)z, θs, and θr. Replication of the observed water-level response to basin loading was reasonably good (fig. 18). The disparity between (Ks)r and (Ks)z in layer 3 implies significant anisotropy (3.3 to 1), although noticeably less pronounced than that estimated for the surficial aquifer system (39 to 1) in an area about 25 mi northeast of the study area (Bush, 1979). The estimated value of (Ks)r of 150 ft/d is near the high end of the range (25 to 160 ft/d) estimated by slug tests in ten wells throughout the 1,000-acre RCID disposal facility (CH2M Hill, 1989). Thus, this value (150 ft/d) may not be representative of areas that are distant from basin 50. Model sensitivity to (Ks)r was evaluated by changing the value of this parameter. Changing (Ks)r to values of 100 and 200 ft/d resulted in changes in maximum ground-water mound height of about +2 and -1 ft, respectively, from that of the cal-ibrated model. The van Genuchten parametrization of unsaturated hydraulic variables is not a function of θs and θr individually, but of their difference, which was estimated to be 0.41 for layer 3. This difference is an upper bound on aquifer specific yield and represents the value of specific yield under conditions of full gravity drainage of the subsurface profile. The specific yield is less than this difference in cases in whichpro-file drainage to residual moisture content is not com-plete. Because the sands of the surficial aquifer drain relatively quickly to values of moisture content close to residual moisture content, the value of (θs - θr) of 0.41 is a reasonably good estimate of specific yield. This value of specific yield is indicative of a high porosity, low moisture-retention sediment with little air entrapment. The model did not exhibit sensitivity to Ss, precluding estimation of this parameter.
Application of the Model
The calibrated model incorporates a physics-based framework of the subsurface flow system. This understanding allows for an inference regarding the nature of the unmeasured parts of the system. Addi-tionally, the model can be used to estimate system response to operational strategies other than that employed during the February-March 1992 field experiment.
The model-simulated saturation of the basin center-line profile for the initial 3 days of basin opera-tion is shown in figure 19. The initial moisture front moved through the unsaturated zone and reached the water table in about 1.5 days. The effects of basin rest periods between daily loading events are exhibited in diurnal fluctuations in the water table and substantial drainage of the subsurface profile, particularly within the upper 10 ft. Following initial wetting, the fine-tex-tured layer between 7 and 20 ft deep remains relatively close to full field-saturation. The sediments underlying the fine-textured layer never obtained saturation, which is to be expected with a fine-overlying-coarse sequence of sediments.
The simulated distribution of total head (relative to the initial water-table elevation) at the conclusion of the last day of basin flooding during February-March 1992 is shown in figure 20. The head gradient was rel-atively steep and predominantly vertical above the water table, but decreased sharply in magnitude below the water table. The hydraulic gradient became progressively more radial below the water table with increasing distance from the basin centerline. Additionally, the magnitude of the hydraulic gradient in the vicinity of the basin was greater in the shallow satu-rated zone than in the deep saturated zone. The effects of this head distribution on the subsurface pore-water velocity were estimated using VS2DT (Healy, 1990), which is a companion program to VS2D. Based on Darcy’s law, VS2DT determines the compo-nents of pore-water velocity in both radial and vertical directions:
wherevr is radial component of pore-water velocity,
[L/T];vz is the vertical component of pore-water
velocity, [L/T];h is total hydraulic head (z - ψ), [L].
The direction and magnitude of pore-water velocity were calculated from the component veloci-ties based on the principles of vector geometry.
The model-estimated velocity distribution after conclusion of the last day of basin 50 flooding during the February-March 1992 field experiment is shown in
vr
Kr ψ( )θ ψ( )---------------
dhdr------=
vz
Kz ψ( )θ ψ( )---------------
dhdz------=

30 Hydraulic Characteristics and Nutrient Transport, Reedy Creek Improvement District, Orange County, Florida
Figure 19. Model-estimated saturation profile at center of basin 50 during initial 3 days of February-March 1992 basin operation. Note: Saturation defined in this figure as volumetric moisture content divided by field-saturated moisture content.
EXPLANATION
Saturation < .20
.20 < Saturation < .40
.40 < Saturation < .60
.60 < Saturation < .80
Saturation > .80
0
10
20
30
40
DE
PT
H, I
N F
EE
T B
ELO
W L
AN
D S
UR
FA
CE
0 10 20 30 40 60 7050
TIME SINCE INITIAL BASIN LOADING, IN HOURS
Flood
Water table
Rest Flood Rest Flood Rest Flood

Hydraulic Characteristics of a Rapid Infiltration Basin 31
figure 21. Pore-water velocity above the water tabledi-rectly beneath the basin was determined to have been relatively high–about 20 ft/d–and predominantly verti-cal in direction. As infiltrating water reached the water table, pore-water velocity was estimated to have changed markedly in both magnitude (decreased to less than 10 ft/d) and direction (substantial radial com-ponent, particularly with increasing depth and radial distance). The model indicated that the magnitude of pore-water velocity and the relative importance of ver-tical flow decreased with depth in the saturated zone. Flow was estimated to have been radial at distances greater than about 125 ft from the basin centerline (about 30 ft beyond the edge of the flooded area) and to have decreased in magnitude with radial distance from the basin.
The large radial component of flow below the water table (fig. 21) implies that reclaimed water moves preferentially in the shallow saturated zone after reaching the water table. Therefore, there exists the possibility of some vertical stratification of water within the saturated zone, with recently-infiltrated reclaimed water overlying ambient water. With increasing distance from the basin, little advective mixing of the upper and lower parts of the saturated zone occurs because of the predominantly radial flow. However, dispersion transverse to the radial flow direction could contribute to a reduction in vertical stratification.
Figure 20. Model-estimated ground-water mounding distribution after conclusion of last day of February-March 1992 loading event (347.6 hours after initiation of basin 50 loading). Note: Curve annotation indicates head change, in feet-water, above initial water table elevation.
RADIAL DISTANCE FROM BASIN CENTERLINE, IN FEET
0 50 100 150 200
0
10
20
40
50
60
70
80
90
3
4
5
6
30water table
DE
PT
H, I
N F
EE
T B
ELO
W L
AN
D S
UR
FA
CE
7
An areal, two-dimensional, saturated flow model (CH2M Hill, 1989) has indicated that the water-table altitude at the RCID RIB facility could rise substantially following an increase in reclaimed-water disposal. The water table is expected to rise to a height of as much as 124 ft above sea level in the upland areas for a disposal rate of 20 Mgal/d. This rise in the background water level at basin 50 represents about a 21 ft increase from the water level prior to the February-March 1992 field experiment. An increase in background water-level altitude can impact basin infil-tration capacity because of the effect this increase would have on the altitude of the superimposed ground-water mound formed beneath the basin during loading. If the mound remains beneath the impeding layer (the base of fine-textured sediments at a depth of 20 ft beneath basin 50 which is thought to act as the system control), the hydraulic gradient within the shal-low sediments–and therefore basin infiltration–would be unaffected. However, if the background water-table altitude is sufficiently high that the ground-water mound intersects the system control, a “back pressure” is transmitted to the surface, reducing the hydraulic gradient, and therefore the basin infiltration rate.
The effect of a rise in water table on infiltration rates at basin 50 was estimated by the calibrated model. A week-long basin loading, with a daily pat-tern of 20 hours wet/4 hours dry, was tested using the

32 Hydraulic Characteristics and Nutrient Transport, Reedy Creek Improvement District, Orange County, Florida
flow model. For a relatively small rise in water-table altitude (less than 10 ft), the infiltration rate was unaf-fected (fig. 22). However, for greater increases in water-table altitude, the effect on the infiltration rate could be substantial. Rises in water-table altitude of 15 and 20 ft at basin 50 produced reductions in infiltra-tion capacity of 8 and 25 percent, respectively. In con-ditions of ground-water mound development above the base of the system control, enhanced lateral flow within this layer would be expected. An additional sensitivity analysis was performed because the lateral hydraulic conductivity derived from model calibration was not strongly defined due to relatively little model sensitivity to this parameter for the deep water table conditions of the calibration period. Lateral hydraulic conductivity of the system control was changed in the model from a value reflecting an isotropic assumption (5.1 ft/d) to a value reflecting a 3.3 to 1 anisotropy (17 ft/d), similar to that estimated for the deeper layer at basin 50. Basin infiltration was relatively insensi-tive (less than 3 percent) to this change in lateral
Figure 21. Model-estimated velocity distribution along radial cross-section after conclusion of last day of basin 50 flooding during February-March 1992 loading event (347.6 hours after initiation of loading event)
EXPLANATIONArrow direction indicates the direction of water flow.Arrow length is linearly proportional to pore water velocity.
velocity = 20 feet per day
velocity = 10 feet per day
1 foot per day < velocity < 5 feet per day
velocity < 1 foot per day
RADIAL DISTANCE FROM BASIN CENTERLINE, IN FEET
0
10
20
30
40
50
60
70
80
90
0 50 100 150 200
water table
DE
PT
H, I
N F
EE
T B
ELO
W L
AN
D S
UR
FA
CE
hydraulic conductivity of the system control for deep water-table conditions. Rises in water-table altitude of 15 and 20 ft at basin 50 produced reductions in infil-tration capacity of 7 and 22 percent, respectively, in model simulations incorporating an anisotropic system control layer.
Manipulation of basin ponded depth is a possi-ble management practice to increase infiltration capac-ity. The relative magnitudes of ponded depth, surface system control thickness, and matric potential at the base of the system control determine the effectiveness of changes in ponded depth on infiltration rate (Sumner and others, 1991, p. 6). If ponded depth is large relative to the sum of the thickness of the surface system control and the value of basal matric potential, the infiltration response to a change in ponded depth will approach a 1:1 proportionality (for example, dou-bling ponded depth will double infiltration rate). If ponded depth is small in relation to this sum, the infil-tration response to a change in ponded depth will be negligible. The system control at basin 50 is made up

Nutrient Transport and Transformation Beneath a Rapid Infiltration Basin 33
of layers 1 and 2 (relatively low permeability layers) and has a thickness of about 20 ft. The matric potential at the base of the system control is about 1 ft. Ponded depth was maintained at about 4 in. during basin oper-ation, but basin geometry would allow use of a ponded depth of 2 ft. The possible values of ponded depths available to a manager are small relative to the sum of the thickness of the system control and basal matric potential, implying that infiltration response to a change in ponded depth will be small. To investigate the magnitude of the infiltration response, model sim-ulations under varying ponded depths were made. Simulations indicate that increasing ponded depth from 4 to 12 in. and from 4 to 24 in. will increase basin infiltration capacity by 6 and 11 percent, respectively (fig. 23). Because of the lack of the model’s inclusion of the high-permeability, disturbed soil in the upper 1 to 1.5 ft of the subsurface profile, these values of percent-age increase in infiltration capacity under increasing ponded depth represent upper bounds. These simula-tions assume that any potential enhancement of biologi-cal clogging of basin soils due to increased water detention time and any change in the size of entrapped air bubbles due to pressure increases are negligible.
Figure 22. Simulated basin infiltration rate under 20-hour wet/4-hour dry loading cycle for a range of rises in water-table altitude above a base water-table depth of 37 feet at basin 50. Note: Curve annotation refers to rise in water table elevation in feet. Isotropic conditions are assumed in upper 20 feet of subsurface profile.
TIME, IN DAYS
INF
ILT
RA
TIO
N, I
N F
EE
T P
ER
DA
Y
<10
10
9
8
7
6
5
4
3
2
1
00 1 2 3 4 5 6 7
15
20
Basin-loading strategies that rely on long, unin-terrupted flooding, rather than daily wet/dry cycles, offer operational simplicity and the possibility of inducing a more anaerobic environment conducive to denitrification reactions. Model simulations indicated that basin 50 infiltration capacity would not be dimin-ished even after 40 days of continuous loading (assuming a pre-loading water-table depth of 37.5 ft). Ground-water mounding at the 45-ft depth would be about 10 ft after this period of loading (fig. 24). This simulation was based on an assumption that the lack of basin disking/drying and the dissolution of entrapped air during this extended loading period would have a negligible effect on basin infiltration.
NUTRIENT TRANSPORT AND TRANSFORMATION BENEATH A RAPID INFILTRATION BASIN
Nutrient transport and transformation beneath RIBs used for disposal of reclaimed water was evalu-ated based on two field experiments conducted at

34 Hydraulic Characteristics and Nutrient Transport, Reedy Creek Improvement District, Orange County, Florida
basin 50 in February-March and May 1992. Nitrogen and phosphorus are two nutrients of particular envi-ronmental concern because of their potential for pro-ducing eutrophic conditions in surface water. In the upper profile (15 ft and above), samples were obtained by KVA Analytical Systems miniature shield-point samplers. The samplers consist of a 1/2-in. diameter slotted aluminum point with a 1/8-in. diameter polypropylene tube to land surface. The sampler was driven into place by a 7/8-in. diameter shaft and the annular space was filled with sand and a bentonite cap. These samplers depend on positive pressure for opera-tion, limiting sampling to periods of basin flooding. Sampling in the upper profile was of both “tracer” and “snapshot” varieties. Tracer-type sampling followed the infiltrating water through the profile, with sam-pling beginning as infiltrating water first reached a given point sampler and sampling progressing down-ward with time at depths of 1, 3, 5, 7, 10, and 15 ft (table 5). Some compositing of infiltrating and ambi-ent water is expected in these samples. Snapshot-type sampling involved sampling all point samplers at approximately the same time. Spatial variability in nutrient concentrations was evaluated through three
Figure 23. Model-simulated infiltration rate at basin 50 under various basin-ponding depths. Note: Curve annotation refers to basin ponding depth in inches.
TIME, IN DAYS
INF
ILT
RA
TIO
N, I
N F
EE
T P
ER
DA
Y
0 1 2 3 4 5 6 7
10
9
8
7
6
5
4
3
2
1
0
24124
sets of point samplers, about 80 ft from each other, within the basin. In the lower profile (below 15 ft), samples were obtained from 2-in. wells at depths of 35 (when saturated), 45, 60, 75, and 89 ft within approxi-mately 2-hour windows. Thus, upper profile samples were obtained through both tracer and snapshot tech-niques, whereas lower profile samples provide water-quality snapshots.
Water samples were obtained from wells and point samplers using standard USGS collection methods (Brown and others, 1970). The point sam-plers, installed above the water table, were sampled with a peristaltic pump. Initially, wells were purged with a submersible pump. Samples were collected after clearing three casing volumes of water from the well. Because of pump failure following 1 week of sampling during the February-March 1992 field exper-iment, samples were thereafter obtained by a bailer. The pump failure was associated with high concentra-tions of suspended solids that developed in purge water during basin loading, as pumped or bailed water became orange-colored and milky turbid. Between flooding events, water pumped or bailed from basin wells generally was clear, indicative of few mobile,

Nutrient Transport and Transformation Beneath a Rapid Infiltration Basin 35
suspended solids. Bailing can cause overestimation of colloidal/particulate matter and slow pumping is the preferred method of sample extraction (Backus and others, 1993). The high concentrations of suspended solids in the ground-water samples probably resulted from the high velocity of the infiltrating water and the resulting particulate leaching from the unsaturated zone. Ground-water turbidity resulting from artificial recharge also was noted by Nightingale and Bianchi (1977).
Water samples were mixed in a sample-splitting churn after recovery from wells, split to sample bot-tles, and immediately preserved. Water samples for the dissolved or “fine-fraction” analyses were filtered through a 0.45-micron filter and immediately preserved. Unfiltered samples also were collected and immediately preserved for use in quantifying the “coarse fraction” of a given constituent. This differen-tiation of a constituent into fine and coarse fractions was based on the expected differences in the transport characteristics of the two fractions. Water samples were analyzed using USGS methods described by Wershaw and others (1983) and Fishman and Friedman (1985). Quality assurance included collec-
Figure 24. Simulated head response to 40-day continuous basin loading at basin 50 with 96-foot radius ponding. Note: Curve annotation refers to intra-basin observation well depth, in feet. Datum is land surface.
TIME, IN DAYS
TO
TA
L H
EA
D, I
N F
EE
T W
AT
ER 35
4560 75
89
0 5 10 15 20 25 30 35 40
-25
-30
-35
-40
tion of split and duplicate samples. Water-quality data for this investigation were published in a USGS water-data report (USGS, 1992). Organic phosphorus con-centrations were estimated from the difference between the concentrations of total and orthophos-phate phosphorus.
Biogeochemistry of Nitrogen
The principal forms of nitrogen in the subsur-face environment are nitrate, organic nitrogen, nitrite, ammonia, ammonium, and gaseous forms of nitrogen (elemental nitrogen, nitric oxide, and nitrous oxide). Organic nitrogen can exist in either particulate (subject to settling), colloidal (remains suspended indefinitely), or dissolved forms. The size ranges of colloids and particulates overlap - particulates are larger than about 0.8 µm, whereas colloids are smaller than about 10 µm (Stumm, 1977).
Previous investigators have described several reactions and mechanisms important in the transport and transformation of nitrogen in the subsurface environment. A brief description of some of the more important mechanisms follows.

36 Hydraulic Characteristics and Nutrient Transport, Reedy Creek Improvement District, Orange County, Florida
Mineralization (Jansson and Persson, 1982; Brady, 1984) involves the breakdown of organic forms of nitrogen through enzymatic hydrolysis by a variety of soil organisms, both aerobic and anaerobic. The product of this reaction is ultimately ammonium, as exemplified by the hydrolysis of an amino compound below:
R-NH2 + HOH › R-OH + NH3 + energy
2NH3 + H2CO3 › (NH4)2CO3 ÷ 2NH4+ +
CO3-2
Nitrification (Schmidt, 1982; Brady, 1984) is the enzymatic oxidation of ammonium to nitrate. The reaction consists of two principal steps, both of which are facilitated by autotrophic bacteria. The relatively slow Nitrosomonas-facilitated conversion of ammo-nium to nitrite is followed by a relatively fast Nitro-bacter-facilitated conversion of nitrite to nitrate. Because of the relative speed of the two reactions, nitrite does not accumulate.
2NH4+ + 3O2 › 2NO2
- + 2H20 + 4H+ + energy
2NO2- + O2 › 2NO3
- + energy
As an oxidation process, nitrification is strongly affected by oxygen availability. Nitrification rates are temperature dependent, obtaining optimal values between 27 and 32 oC.
Denitrification (Firestone, 1982; Brady, 1984; Korom, 1992) is the enzymatic reduction of nitrate to nitrite and gaseous nitrogen compounds, which may escape to the atmosphere, removing nitrate from sub-surface water.
NO3- › NO2
- › NO › N2O › N2
Denitrification is a dissimilatory process in that the reduced nitrogen is not incorporated into microbial biomass and energy is produced for cell growth and maintenance. A variety of bacteria are effective at facilitating nitrate reduction, particularly species of Pseudomonas. All denitrifiers are facultative anaer-obes, which, although preferring elemental oxygen as an electron acceptor, will use nitrogen as the electron acceptor under conditions of inadequate aeration. The extent of denitrification is influenced by the quantity and type of electron donor available.
Heterotrophic denitrification requires a carbon source to serve as an electron donor, as exemplified below, showing an arbitrary organic compound, C, as the carbon source:
5C + 4NO3- + 2H2O › 2N2 + 4HCO3
- + CO2
Because of the wide range of carbon oxidation states in organic compounds, a single stoichiometric carbon/nitrogen ratio appropriate for denitrification does not exist. Additionally, other microbial reactions generally compete with denitrification for available carbon. However, Leach (1980) has reported that approximately 2 g of wastewater carbon are required to denitrify 1 g of nitrate nitrogen.
Autotrophic denitrification relies on a non-car-bon electron donor, such as reduced sulfur, iron, or manganese. This type of reaction is exemplified by the oxidation of ferrous disulfide, facilitated by the bacte-ria Thiobacillus denitrificans:
5FeS2 + 14NO3- + 4H+ › 7N2 + 10SO4
-2 + 5Fe+2 + 2H2O
Whether heterotrophic or autotrophic, denitrifi-cation requires anaerobic conditions, suitable bacterial populations, and ample amounts of electron donors to proceed. Denitrification is known to occur in anaero-bic microsites of otherwise aerobic media (Rice and Gilbert, 1978).
Dissimilatory nitrate reduction to ammonium (DNRA) (Tiedje and others, 1981; Korom, 1992) is a nitrogen-conserving process, in contrast to denitrifica-tion which results in a loss of nitrogen from the system. Similar to denitrification, DNRA requires anaerobic conditions. DNRA can compete with denitrification for nitrate; DNRA is favored over denitrification in a nitrate-limiting environment and disfavored in a carbon-limiting environment. The ammonium produced by DNRA is susceptible to reconversion to nitrate through nitrification under oxygenated conditions.
Several mechanisms can serve to retard the transport of nitrogen species, including adsorption, colloid attachment, straining, flushing, and sedimenta-tion. Adsorption involves the electrostatic attachment of an ion or colloid onto a soil or colloidal surface (Brady, 1984). The positively charged ammonium ion can participate in cation exchange-adsorption reac-tions with the predominantly negatively charged sur-faces of clay or organic material. Colloids (clay or

Nutrient Transport and Transformation Beneath a Rapid Infiltration Basin 37
organic) can attach to soil surfaces based on the interplay between London-van der Waals forces (attractive), electrostatic double layer forces (attrac-tive/repulsive), ionic strength (high ionic strength favors colloid attachment), and soil water velocity (shear forces associated with fluid movement can detach colloids) (McDowell-Boyer, 1992). Colloids mobilized by relatively high flow rates or flushing with low ionic-strength water can serve to transport adsorbed ions, a process known as colloid-facilitated transport (Huling, 1989). Straining is a process in which particles or flocculations of colloids are lodged within smaller pores. Particulate forms of nitrogen (non-dissolved organic nitrogen or particulate-adsorbed ammonium) are particularly susceptible to this process. Similar to colloidal forms, particulate forms of nitrogen are subject to the flushing action of high velocity pore water. Sedimentation of particulate forms of nitrogen can occur due to density effects, par-ticularly in microsites of slack water (Ives, 1970).
Nitrogen Transport and Transformation Beneath Basin 50
Total organic nitrogen concentrations generally decreased by roughly 50 percent from concentrations in reclaimed water in the upper 15 ft of the soil profile (figs. 25, 26, and 27). This effect probably results from colloid attachment to soil surfaces for the largely colloi-dal, finer fraction of organic nitrogen; and from strain-ing, sedimentation, and colloid attachment for the mixed colloidal/particulate coarser fraction. Bennet and Leach (1983) report similar observations of organic nitrogen removal. Mineralization reactions, which are relatively slow-acting, probably are not a dominant mechanism behind the rapid reduction in organic nitro-gen concentrations in the upper 15 ft of the soil profile.
Snapshot-type samples were collected several times during the first two days of the May 1992 flooding event. Organic nitrogen concentrations in the upper 15 ft exhibited several time-variant features: (1) a large decrease in concentration from the start of flooding to the end of flooding each day and (2) a rejuvenation of
Figure 25. Profiles of organic nitrogen concentration at basin 50 during February-March 1992 loading event. Note: Tracer-type sampling used in upper 15 feet of profile. Snapshot-type sampling used in lower profile.
0
90
0
10
20
30
40
50
60
70
80
DE
PT
H, I
N F
EE
T B
ELO
W L
AN
D S
UR
FA
CE
0.2 1.40.2 0.4 0.6 0.8 1.0 1.2 1.4
TOTAL ORGANIC NITROGEN AS N,IN MILLIGRAMS PER LITER
2/25/92
3/3/92
3/10/92
measurement
pre-loadingwater table2/24/92
Following cycle of:3 weeks loading 20 weeks dry
Figure 26. Profiles of organic nitrogen concentration at basin 50 during May 1992 loading event. Note: Tracer-type sampling used in upper 15 feet of profile. Snapshot-type sampling used in lower profile.
measurement
pre-loadingwater table5/18/92
Following cycle of:1 week loading 4 weeks dry
ORGANIC NITROGEN AS N, IN MILLIGRAMS PER LITER
DE
PT
H, I
N F
EE
T B
ELO
W L
AN
D S
UR
FA
CE
90
0
10
20
30
40
50
60
70
80
0 0.2 0.4 0.6 0.8 1.0
fine fraction5/19/92
coarse fraction5/19/92
fine fraction5/26/92
coarse fraction5/26/92

38 Hydraulic Characteristics and Nutrient Transport, Reedy Creek Improvement District, Orange County, Florida
relatively high concentration at the beginning of the second day, although at a lower concentration than at the beginning of the first day (fig. 27). These effects proba-bly were the result of several factors: (1) straining effec-tiveness increased during basin loading due to accumulation of particulates in pore spaces, (2) a decrease in pore-water velocity during a daily flooding period as matric potential gradients became smaller, leading to an increase in sedimentation, straining, and colloid attachment, and (3) mineralization processes occurring between basin-loading events degraded strain-ing capacity. The latter probably was a minor process between daily loading events, because nitrate concentra-tions in the upper 15 ft were not elevated on May 20, 1992, after only a several-hour rest period following basin operation (fig. 28). However, based on elevated nitrate concentrations in water samples on May 19, 1992, the longer rest periods (several weeks) between basin rotation allowed for significant mineralization (followed by nitrification) (fig. 28). On May 19, 1992, the first day of basin flooding following an extended rest period, organic nitrogen concentrations at a depth of 3 ft (fig. 27) were substantially higher than concentrations in reclaimed water and were slightly higher than concentra-tions in reclaimed water on the second day of flooding. This effect was probably caused by decomposition pro-cesses during the extended rest period, which contrib-uted to creation of a more mobile form of organic
Figure 27. Near-surface nitrate concentrations at basin 50 during May 1992 loading event.
2400 0400 0800 1200 1600 2000 2400 0400 0800 1200 1600 2000 24002
10
4
6
8
TO
TA
L N
ITR
AT
E N
ITR
OG
EN
AS
N,
IN M
ILLI
GR
AM
S P
ER
LIT
ER
EXPLANATION
3-ft well
7-ft well
15-ft well
Reclaimed water
May 19, 1992 May 20, 1992
Loadingperiod
Loadingperiod
nitrogen that was subject to flushing upon basin re-flooding. By the eighth day of basin operation (May 26, 1992), the total organic nitrogen concentration in the soil water (sample collected at a depth of 3 ft after initial daily flooding) was 0.62 mg/L, slightly less than the 0.78 mg/L concentration in reclaimed water.
Ammonium concentrations decreased by more than 50 percent in the upper 3 ft of the soil profile (fig. 29), probably the result of ammonium adsorption onto the soil clay fraction as suggested by other inves-tigators (Lance and Whisler, 1972; Bouwer, 1974). Of the clay minerals, vermiculite has the greatest capacity to adsorb ammonium (Brady, 1984) and occurs in the soil of the RIB under investigation (table 2). Elevated concentrations of ammonia in the lower part of the surficial aquifer system were perhaps indicative of dis-similatory nitrate reduction to ammonia in this rela-tively anoxic zone.
Transient nitrate “spikes” (constituent concen-trations in infiltrating water that are higher than con-centrations in applied reclaimed water) occurred in the upper 15 ft of the soil profile (figs. 28, 30, and 31) and sometimes exceeded 30 mg/L as N. This condition was caused by organic nitrogen retention during basin loading, followed by mineralization and nitrification in the pore water during basin rest. Additionally, ammonium adsorbed during loading could have been nitrified during rest periods, contributing to nitrate

Nutrient Transport and Transformation Beneath a Rapid Infiltration Basin 39
spiking. The intervals between basin loading were ideal for both mineralization and nitrification reactions to proceed because the soils drained and became aer-ated. Nitrate, generated by mineralization and nitrifi-cation, was relatively immobile during these rest periods because the pore water was relatively static after draining to field capacity. However, upon basin re-flooding, the nitrate was mobilized, moving essen-tially as a conservative ion with the infiltrating reclaimed water, thereby generating a nitrate spike. The nitrate peak in the upper 15 ft of the soil profile was short-lived (a few hours) (fig. 28) and was subject to the dissipating action of dispersion and dilution with further downward and lateral movement of the infiltrating water. Nitrate spiking commonly has been observed during the operation of RIBs (Lance and Whisler, 1972; Bouwer and others, 1974; Carlson and Linstedt, 1982; Leach and Enfield, 1983; Diab and Shilo, 1988). Snapshot-type sampling of the saturated zone was made prior to basin flooding. The elevated concentrations of nitrate observed in the shallow satu-rated zone on the first day of both the February-March 1992 and May 1992 events were not due to downward movement of the nitrate spike in the upper 15 ft of the profile. An explanation for the observed nitrate con-centrations within the saturated zone is discussed later in this report.
Figure 28. Near-surface organic nitrogen concentrations at basin 50 during May 1992 loading event.
2400 0400 0800 1200 1600 2000 2400 0400 0800 1200 1600 2000 2400
May 19, 1992 May 20, 1992
0.2
1.0
0.4
0.6
0.8T
OT
AL
OR
GA
NIC
NIT
RO
GE
N A
S N
,IN
MIL
LIG
RA
MS
PE
R L
ITE
R
EXPLANATION
3-foot well
7-foot well
15-foot well
Reclaimed water
Loadingperiod
Loadingperiod
Figure 29. Profiles of ammonia concentration (fine fraction) at basin 50 during May 1992 loading event. Note: Coarse fraction concentrations of ammonia are negligible. Tracer-type sampling used in upper 15 feets of profile. Snapshot-type sampling used in lower profile.
0
90
0
10
20
30
40
50
60
70
80DE
PT
H, I
N F
EE
T B
ELO
W L
AN
D S
UR
FA
CE
0 0.150.05 0.10
AMMONIA (FINE FRACTION) AS N, IN MG/L
May 19
May 26
measurement
pre-loadingwater table5/18/92
Following cycle of:1 week loading 4 weeks dry

40 Hydraulic Characteristics and Nutrient Transport, Reedy Creek Improvement District, Orange County, Florida
The magnitude of the nitrate spike within the upper profile depended on the length of basin loading and resting. The long loading and resting periods (3 and 20 weeks, respectively) before the February 25, 1992, loading event produced nitrate spikes as high as 33 mg/L as N. However, the short loading and resting periods (1 and 4 weeks, respectively) of May 1992 produced nitrate spiking only as high as 9 mg/L as N. Longer flooding periods allowed more accumulation of organic nitrogen and ammonium, whereas the longer resting periods provided more time for the pro-cesses of mineralization and nitrification to proceed, producing a nitrate product.
Following a rest period of several weeks, nitrate concentrations in the shallow saturated zone were ele-vated above concentrations in reclaimed water (figs. 30 and 31). Nitrate concentrations (prior to the February-March 1992 loading event) were as high as 11 mg/L as N in the 45-ft well. This nitrate could have formed a second nitrate spike which was radially flushed away from the basin upon basin flooding. This effect probably was the result of mineralization and
nitrification of organic nitrogen which accumulated in the saturated zone, particularly near the water table, during the previous loading event. Because the pore-water velocity lessened as the infiltrating water reached the water table (fig. 21), the part of the partic-ulate and colloidal organic nitrogen that passed through the unsaturated zone was prone to retention in the shallow saturated zone. Shallow saturated-zone organic nitrogen concentrations therefore increased over the course of basin loading (figs. 25 and 26). The effect of the reduction in pore-water velocity in the vicinity of the water table had a greater impact on the transport of the coarse fraction of organic nitrogen than on that of the fine fraction. Coarse-fraction organic nitrogen was preferentially retained in the shallow saturated zone disproportionate to the relative concentration of the coarse fraction in the reclaimed water (fig. 26). The retained organic nitrogen was sub-ject to mineralization and nitrification in the relatively shallow saturated zone during basin rest periods. The aerobic conditions which enhance these processes likely exist in the shallow saturated zone. Smith and
Figure 30. Profiles of nitrate concentration at basin 50 during February-March 1992 loading event. Note: Tracer-type sampling used in upper 15 feet of profile. Snapshot-type sampling used in lower profile.
0 355 10 15 20 25 30
TOTAL NITRATE NITROGEN AS N, IN MILLIGRAMS PER LITER
0
90
10
20
30
40
50
60
70
80
DE
PT
H, I
N F
EE
T B
ELO
W L
AN
D S
UR
FA
CE
2/25/92
3/3/92
3/10/92measurementpre-loadingwater table2/24/92
Following cycle of:3 weeks loading 20 weeks dry
Figure 31. Profiles of nitrate concentration at basin 50 during May 1992 loading event. Note: Tracer-type sampling used in upper 15 feet of profile. Snapshot-type sampling used in lower profile.
0 355 10 15 20 25 30
TOTAL NITRATE NITROGEN AS N,IN MILLIGRAMS PER LITER
0
90
10
20
30
40
50
60
70
80
5/19/92
5/26/92
DE
PT
H, I
N F
EE
T B
ELO
W L
AN
D S
UR
FA
CE
measurement
pre-loadingwater table5/18/92
Following cycle of:1 week loading 4 weeks dry

Nutrient Transport and Transformation Beneath a Rapid Infiltration Basin 41
Duff (1988) observed dissolved oxygen concentrations greater than 0.6 mg/L down to a depth of about 8 ft below the water table in a shallow aquifer that was subject to reclaimed-water disposal from overlying infiltration beds. The relatively low concentrations of soil-solution organic nitrogen measured at the end of a flooding event in the shallow saturated zone (figs. 25 and 26) did not fully account for the concentrations of nitrate measured in this zone following a rest period (figs. 30 and 31). This discrepancy could result from the fact that soil solution samples are only an indicator of the amount of organic nitrogen within the solid and liquid matrix. Most of the organic nitrogen present probably was attached to the solid phase and was not directly measured with a soil-solution sample.
After passage of the nitrate spike, nitrate con-centrations within the unsaturated zone were roughly equal to those of the applied reclaimed water, indicat-ing little denitrification within this zone. This lack of significant nitrate renovation within the unsaturated zone probably was due to the schedule of daily basin cycling through wet and dry periods (typically 17 hours flooded and 7 hours dry). This schedule probably allows the soil to be reaerated daily, hinder-ing the creation of a reducing environment needed for denitrification. Additionally, the method of reclaimed water application to RCID basins (fig. 3) likely pro-vided substantial aeration to the applied water. Bouwer and others (1974) noted that negligible nitrate removal occurred if short, frequent flooding periods (2 days flooded and 5 to 10 days dry) were used; however, they discovered that longer periods of flooding and drying (10 days flooded and 2 weeks dry) produced overall nitrogen removal of about 30 percent. It is likely that longer flooding periods at the RCID RIBs also would lead to greater nitrate removal beneath the basins, particularly in the upper 15 ft of the subsurface where conditions probably alternated between satu-rated and unsaturated under the imposed loading schedule (fig. 19). However, longer flooding cycles also could lead to a greater accumulation of organic nitrogen and ammonium in the soil profile, possibly producing more pronounced nitrate spikes. Thus, basin management requires judgement regarding the importance of maximizing nitrogen removal as opposed to minimization of nitrogen spikes.
An additional factor that could limit denitrifica-tion under reducing conditions is the availability of electron donors, generally carbon. The carbon-to-nitrate ratio in the applied reclaimed water averaged about 1.7. However, presence of substantial organic nitrogen, which is subject to conversion to nitrate,
implies an “effective” carbon-to-nitrate ratio of 1.3. Both of these values are below the empirical minimum ratio of 2 suggested by Leach (1980) for complete denitrification. Lance and Whisler (1976) achieved nitrogen removal of 90 percent in column studies in which the applied reclaimed water was amended with dextrose to provide a carbon-to-nitrate ratio of 6. Sludge also has been shown to be an effective carbon source to stimulate denitrification (Lance, 1986). The low carbon-to-nitrate ratio of the reclaimed water also was indicative of a system preference for denitrifica-tion rather than dissimilatory nitrate reduction to ammonium.
Spatial variability in soil properties can lead to corresponding variability in nutrient concentrations. Variation in the three point-sampler clusters are shown in figure 32. Although the general form of the profiles were similar, variability was evident.
Biogeochemistry of Phosphorus
The principal forms of phosphorus in the sub-surface environment are orthophosphate species (pri-marily H2PO4
- and HPO4-2 in a pH range of 4 to 10),
organic phosphorus, and condensed forms of phos-phate. Organic phosphorus can exist in particulate, colloidal, or dissolved forms.
Mineralization reactions rely on microbes to decompose organic forms of phosphorus in a manner similar to that of organic nitrogen mineralization (Brady, 1984). Inorganic orthophosphate species are the products of these reactions.
The nitrogen-retarding mechanisms mentioned above--adsorption, colloid attachment, straining, and sedimentation--also are effective in retarding the trans-port of phosphorus. Additionally, pH-dependent pre-cipitation reactions are important to phosphorus chemistry (fig. 33) (Brady, 1984).
Above a pH of 6, orthophosphate precipitates from the soil solution as calcium phosphates (Brady, 1984), and becomes progressively less soluble with increasing pH and time. Silicate minerals, such as kaolinite, have been shown to be effective in the fixa-tion of orthophosphate in moderately acid conditions, although the actual mechanism is not completely understood. Chemical precipitation of orthophosphate by iron, aluminum, and manganese ions can occur in low pH (less than about 5.4) conditions as exemplified for the case of aluminum ion below:
Al+3 + H2PO4- + 2H2O ÷ 2H+ + Al(OH)2H2PO4
(insoluble)

42 Hydraulic Characteristics and Nutrient Transport, Reedy Creek Improvement District, Orange County, Florida
Adsorption of orthophosphate onto oxyhydrox-ides of iron, aluminum, and manganese can occur below a pH of 7.8. Similarly, organic phosphorus is retained by adsorption through orthophosphate groups to oxyhydroxides (Bohn and others, 1985, p. 194). Orthophosphate adsorption is exemplified below in which an orthophosphate ion undergoes anion exchange with a hydroxide ion:
Figure 32. Comparison of nitrogen and phosphorus concentrations in three point-sampler clusters at basin 50 during initial basin flooding on February 25, 1992. Note: Tracer-type sampling used.
0 1.20.2 0.4 0.6 0.8 1.0
TOTAL PHOSPHORUS AS P,IN MILLIGRAMS PER LITER
0
16
2
4
6
8
10
12
14
DE
PT
H, I
N F
EE
T B
ELO
W L
AN
D S
UR
FA
CE
0 355 10 15 20 25 30
TOTAL NITRATE NITROGEN AS N,IN MILLIGRAMS PER LITER
0
16
2
4
6
8
10
12
14
0.4 0.6 0.8 1.0 1.2 1.4
TOTAL ORGANIC NITROGEN AS N,IN MILLIGRAMS PER LITER
0
16
2
4
6
8
10
12
14
cluster 1cluster 2cluster 3measurement
Figure 33. Distribution of soil orthophosphate at various pH values (modified from Brady, 1984).
4 5 6 7 80
50
100
DIS
TR
IBU
TIO
N, I
N P
ER
CE
NT
SOIL pH
Calcium phosphates
Soil solution
Adsorption by hydrous oxides
of Fe, Al, and Mn
Precipitation
with Fe, Al, and Mn
Silicate
reaction
Al(OH)3 + H2PO4- ÷ Al(OH)2H2PO4 (insoluble) +
OH-
With “aging” of the adsorbed orthophosphate, the phosphorus penetrates deeper into the hydrous oxide by means of solid-state diffusion and forms a more stable bonding arrangement. In this process, the phosphorus becomes less available to the soil solution

Nutrient Transport and Transformation Beneath a Rapid Infiltration Basin 43
and surface-adsorption sites are re-exposed, allowing additional phosphorus adsorption (Mansell and Selim, 1981). The initial adsorption reaction is relatively fast compared to the following aging reaction (Syers and Iskandar, 1981). Because of the kinetic nature of phosphorus adsorption, phosphorus removal during rapid-water flow in sandy soils generally is less than estimates based on equilibrium batch sorption studies (Mansell and Selim, 1981).
Phosphorus Transport and Transformation Beneath Basin 50
Phosphorus concentrations were reduced about 90 percent (from a concentration of about 0.25 mg/L to a concentration of about 0.02 mg/L) from concen-trations in reclaimed water in the upper 15 ft of the soil profile (figs. 34, 35, and 36). Other investigators have reported similar phosphorus reductions during operation of RIBs: Bouwer and Rice (1984) reported a phosphorus removal of 93 percent, which was attrib-uted to precipitation of calcium phosphates; Carlson
and Linstedt (1982) reported 60 to 90 percent removal of phosphorus, which was attributed to adsorption. The abundance of iron and aluminum oxyhydroxides (table 3) in the unsaturated zone indicates that adsorp-tion probably is an effective mechanism for phospho-rus removal at the RCID RIBs. The possibility exists of future degradation in the ability of sub-basin soils to remove phosphorus. This condition will occur if reju-venation of oxyhydroxide adsorption sites accompany-ing aging of adsorbed phosphorus proceeds at a rate sufficiently slow that adsorption site saturation is reached and phosphorus is therefore not retained by adsorption. The relatively high phosphorus concentra-tions that developed in the shallow saturated zone at a depth of 45 ft as basin loading continued (fig. 34 and 35) probably indicated an accumulation of the small fraction of phosphorus that eludes “clean-up” within the unsaturated zone, which will be discussed later in this section.
Phosphorus concentrations in the upper 15 ft exhibited a temporal pattern in concentration (fig. 36) similar to that of organic nitrogen, probably due to
Figure 34. Profiles of total phosphorus concentration at basin 50 during February-March 1992 loading event. Note: Tracer-type sampling used in upper 15 feet of profile. Snapshsot-type sampling used in lower profile.
0 1.00.2 0.4 0.6 0.8
0
90
10
20
30
40
50
60
70
80DE
PT
H, I
N F
EE
T B
ELO
W L
AN
D S
UR
FA
CE
2/25/92
3/3/92
3/10/92
measurement
pre-loadingwater table2/24/92
Following cycle of:3 weeks loading 20 weeks dry
TOTAL PHOSPHORUS AS P,IN MILLIGRAMS PER LITER
Figure 35. Profiles of total phosphorus concentrations at basin 50 during May 1992 loading event. Note: Tracer-type sampling used in upper 15 feet of profile. Snapshot-type sampling used in lower profile.
0 1.00.2 0.4 0.6 0.8
TOTAL PHOSPHORUS AS P,IN MILLIGRAMS PER LITER
0
90
10
20
30
40
50
60
70
80
5/19/92
5/26/92
measurement
pre-loadingwater tableD
EP
TH
, IN
FE
ET
BE
LOW
LA
ND
SU
RF
AC
E
5/18/92
Following cycle of:1 week loading 4 weeks dry

44 Hydraulic Characteristics and Nutrient Transport, Reedy Creek Improvement District, Orange County, Florida
similar processes. As in the case of organic nitrogen, these processes could include variations in pore-water velocity, variations in straining effectiveness, and min-eralization of the organic component during basin rest periods. Concentrations of phosphorus at a depth of 3 ft were elevated above concentrations in reclaimed water on the first day of flooding following an extended rest period (figs. 34, 35, and 36). In a manner similar to the observed nitrate spiking, the magnitude of the phosphorus spike is affected by the length of basin loading and rest periods, as shown by a compari-son of phosphorus profiles for the February-March 1992 (following 3 weeks loading/20 weeks resting cycle) and May 1992 (following 1 week loading/4 weeks resting cycle) events (figs. 34 and 35).These phosphorus spikes were limited to the coarser fraction of phosphorus (figs. 37 and 38). The fine-fraction orthophosphate, which was the dominant phosphorus constituent in the reclaimed water, was not a component of the spike, probably because of strong orthophosphate adsorption to immobile soil matrix. As with nitrogen, spatial variability was evident in phosphorus concentrations within the upper 15 ft of the profile, although the general form of the profiles was similar at each sampling cluster (fig. 32).
Although the reclaimed water was dominated by the finer fraction of orthophosphate, the coarser frac-tion of organic phosphorus dominated in the saturated
2400 0400 0800 1200 1600 2000 2400 0400 0800 1200 1600 2000 24000
0.5
0.1
0.2
0.3
0.4
TO
TA
L P
HO
SP
HO
RU
S A
S P
,IN
MIL
LIG
RA
MS
PE
R L
ITE
R
EXPLANATION
3-ft well
7-ft well
15-ft well
Reclaimed water
May 19, 1992 May 20, 1992
Loadingperiod
Loadingperiod
Figure 36. Near-surface phosphorus concentration at basin 50 during May 1992 loading event.
zone (figs. 37 and 38), indicating that orthophosphate was preferentially retained in the unsaturated zone. Coarse-fraction phosphorus concentrations in the shal-low saturated zone increased during basin loading. This effect was analogous to that of organic nitrogen. The coarse-fraction phosphorus accumulated in the shallow saturated zone because of slacking pore-water velocity. The change in the nature of saturated-zone water samples following the commencement of basin loading (from clear to turbid, orange-colored) was indicative of movement of particulate- and colloidal-size oxyhydroxides of iron. However, the small quan-tities of orthophosphate measured below the water table indicate that particulate- or colloidal-facilitated transport of orthophosphate to the saturated zone was negligible (fig. 37). In contrast to the case of nitrogen in which basin rest periods allowed for mineralization and nitrification to produce nitrate spikes in the shal-low saturated zone, phosphorus spikes in the saturated zone were not apparent following rest periods, even though mineralization of organic phosphorus probably occurred during this period. The elevated concentra-tions of phosphorus in the shallow saturated zone at the end of basin loading appeared to be immobilized during extended basin rest periods (figs. 34 and 35). Based on a measured pH range of 6.4 to 7.0 in the 45-ft depth well during basin rest periods, these immo-bilization processes likely include adsorption reactions

Summary and Conclusions 45
(in the hydrous oxide-rich zone above the pre-loading water table), fixation by silicate clays (probably kaolinite), and precipitation as calcium phosphates (fig. 33). The possibility of calcium phosphate precipi-tation was supported by an application of the chemical speciation program SOLMINEQ.88 (Kharaka and oth-ers, 1988) to a water sample from the shallow satu-rated zone at the beginning of a basin rest period (45-ft well sampled on March 10, 1992). The results of this analysis (G. F. Huff, USGS, written commun., 1995) indicate that the water sample was oversaturated with at least three calcium phosphate minerals: chlorapatite (Ca5(PO4)3Cl), flurapatite (Ca5(PO4)3F), and hydrox-ylapatite (Ca5(PO4)3(OH)). Although oversaturation does not prove the precipitation of calcium phosphate, it does establish the possibility of formation.
Figure 37. Profiles of fine- and coarse-fraction orthophosphate at basin 50 during May 1992 loading event.Note: Tracer-type sampling used in upper 15 feet of profile. Snapshot-type sampling used in lower profile.
0
90
0
10
20
30
40
50
60
70
80
DE
PT
H, I
N F
EE
T B
ELO
W L
AN
D S
UR
FA
CE
0 0.200 0.05 0.10 0.15
May 19
May 21
May 26
0
90
0
10
20
30
40
50
60
70
80
0 0.060 0.02 0.04
ORTHOPHOSPHATE
AS P, IN MILLIGRAMS PER LITER
measurementpre-loadingwater table5/18/92
Following cycle of:1 week loading 4 weeks dry
(COARSE FRACTION) CONCENTRATIONORTHOPHOSPHATE
AS P, IN MILLIGRAMS PER LITER(COARSE FRACTION) CONCENTRATION
SUMMARY AND CONCLUSIONS
The Reedy Creek Improvement District dis-posed of about 7.5 million gallons per day of reclaimed water in 1992 through 85 1-acre rapid infil-tration basins within a 1,000-acre site that consists of sandy soils in Orange County, Florida. The objective of this technique of reclaimed-water disposal is the further enhancement of water quality through the remedial action of chemical and physical processes on infiltrating water in the soil and aquifer. Nitrogen and phosphorus are the two constituents most likely to cause eutrophication in downstream surface-water bodies. In 1992, concentrations of total nitrogen and total phosphorus in reclaimed water were about 3 and 0.25 milligrams per liter, respectively. Nitrogen within

46 Hydraulic Characteristics and Nutrient Transport, Reedy Creek Improvement District, Orange County, Florida
the reclaimed water was primarily in the nitrate and organic forms. Phosphorus primarily occurred in orthophosphate and organic forms. Reclaimed water applied to basins moves through as much as 40 feet of unsaturated zone before entering the surficial aquifer system. Water from the surficial aquifer system moves laterally and discharges to wetland areas or moves downward through the intermediate confining unit into the Upper Floridan aquifer.
The U.S. Geological Survey conducted field experiments in 1992 at Reedy Creek Improvement District basin 50 to examine and better understand the hydraulic characteristics and nutrient transport and transformation beneath a rapid infiltration basin. The basin was flooded in a controlled fashion in February-
Figure 38. Profiles of fine- and coarse-fraction organic phosphorus at basin 50 during May loading event. Note: Tracer-type sampling used in upper 15 feet of profile. Snapshot-type sampling used in lower profile.
0
90
0
10
20
30
40
50
60
70
80
DE
PT
H, I
N F
EE
T B
ELO
W L
AN
D S
UR
FA
CE
0 0.080 0.02 0.04 0.06
0
90
0
10
20
30
40
50
60
70
80
0 0.30 0.1 0.2
May 19
May 21
May 26
measurement
pre-loadingwater table5/18/92
Following cycle of:1 week loading 4 weeks dry
ORGANIC PHOSPHORUS (COARSE FRACTION)CONCENTRATION AS P,
IN MILLIGRAMS PER LITER
ORGANIC PHOSPHORUS (COARSE FRACTION)CONCENTRATION AS P,
IN MILLIGRAMS PER LITER
March and May 1992 and water samples were extracted from wells and point samplers to define evo-lution of reclaimed water as it percolates through the soil/aquifer system. Hydraulic and biogeochemical processes were postulated to explain the observed changes in nutrient chemistry with depth. During the February-March flooding event, the hydraulic response of the subsurface system was monitored. An unsaturated/saturated numerical flow model, using the numerical code VS2D, of the subsurface flow system was constructed and calibrated to approximate the observed hydraulic response. The model was used to provide a more complete description of the flow sys-tem than that available solely from field observations,

Summary and Conclusions 47
as well as to predict system response to untested basin-loading scenarios.
The basin infiltration rate was about 5.5 feet per day (averaged over daily flooding periods of about 17 hours in length) throughout the 2-week period of basin loading during which about 10 million gallons of reclaimed water were applied. This flux was undimin-ished with time, indicating that surface clogging was not significant under the imposed loading and mainte-nance schedule. A lack of flux response to a change in ponded area was indicative of a largely vertical flow system in the shallow soil. Additionally, this phenome-non implies that a relatively fine-textured layer within the unsaturated zone is characterized by a field-satu-rated hydraulic conductivity equal to or greater than the overlying coarse-textured material, possibly caused by air entrapment within the latter. Air entrap-ment within the shallow soil was inferred based on field-estimated moisture content under basin flooding conditions and visual observations. The infiltration rate was controlled by the upper 20 feet of the soil pro-file, rather than by back-pressure from a ground-water mound. Because of the less-permeable soils above it, the relatively coarser-textured unsaturated zone (below a depth of 20 feet) was not thought to have become field-saturated from above by the infiltrating water. However, the lower part of this zone was satu-rated from below as a result of ground-water mound-ing. This coarse-textured layer was not subject to the effects of air-entrapment as evidenced by the relatively high value of specific yield (0.41).
The hydraulic characteristics (hydraulic conduc-tivity, moisture content, and specific moisture capac-ity) were placed within the framework of a van Genuchten parameterization. Hydraulic parameters were inferred based on laboratory determination of moisture-characteristic curves for basin samples; soil core-based estimates of air entrapment effects; and field-observed tensiometric, water level, and textural data. The hydraulic properties of three subsurface lay-ers were estimated: the shallow coarse zone (0 to 7-feet depth), the fine-textured zone (7- to 20-feet depth), and a deeper coarse zone (below 20-feet depth). The effects of air entrapment were reflected in the hydraulic parameters of the uppermost layer, par-ticularly in the relatively low value of field-saturated hydraulic conductivity (5.1 feet per day) and the discrepancy between field-saturation moisture content (0.28) and porosity (0.41). The coarser layers exhib-ited rapid desaturation under tension and lower resid-
ual moisture content (0.04 and 0.06) than the fine-textured layer (0.13). The estimated radial and vertical values of saturated hydraulic conductivity for the deeper coarse zone are 150 and 45 feet per day, indica-tive of surficial aquifer system anisotropy.
About 1.5 days were required for the initial infiltration front to reach the water table following the commencement of basin loading on February 25, 1992. Thereafter, ground-water mounding within the saturated zone began to develop and reached a maxi-mum value of about 7 feet in the 35-foot depth obser-vation well during the 2-week basin loading. Pore-water velocity above the water table directly beneath the basin was relatively high—about 20 feet per day—and predominantly vertical in direction. As infiltrating water reached the water table, pore-water velocity was estimated to have changed markedly in both magni-tude (reduced to less than 10 feet per day) and direc-tion (substantial radial component, particularly with increasing depth and radial distance). In the vicinity of the basin, flow in the deeper, saturated zone was deter-mined to be relatively slow compared to the more vig-orous flow in the shallow saturated zone. The large radial component of flow below the water table in the vicinity of the basin implies that reclaimed water moves preferentially in the shallow part of the satu-rated zone after reaching the water table. Therefore, there exists the possibility of some vertical stratifica-tion within the saturated zone, with recently-infiltrated reclaimed water overlying ambient water. This phe-nomenon has implications in regards to screen place-ment of monitoring wells. Water samples obtained from a well screened in the shallow part of the satu-rated zone are more likely representative of recently infiltrated, non-ambient water than are samples obtained from a well screened in a deeper part of the surficial aquifer system.
Rainfall, evapotranspiration, and leakage of water from the surficial aquifer system to the Upper Floridan aquifer were negligible compared to the basin loading rate at the space and time scales (in the vicinity of a single basin during and for a few weeks following basin loading) of consequence to the field experiment. However, at the scale of the 1,000-acre disposal facility, these terms are not negligible compared to the total basin loading of 101 inches per year (1992) over the facility area. Leakage is estimated to have been 4 to 9 inches per year prior to basin loading and is expected to have increased (1.3 inches per year per foot of increase in the head difference between the surficial

48 Hydraulic Characteristics and Nutrient Transport, Reedy Creek Improvement District, Orange County, Florida
aquifer system and the Upper Floridan aquifer) follow-ing the commencement of loading in 1991. Rainfall and evapotranspiration annual averages are 50 inches per year and 30 to 48 inches per year, respectively.
The flow model indicates that infiltration capac-ity at basin 50 will be unaffected by a small (less than 10 ft) increase in background water-table altitude. However, rises in background water-table altitude of 15 and 20 feet produced a reduction in the infiltration capacity of basin 50 of 8 and 25 percent, respectively. The altitude of the base of the dominant impeding layer is expected to have an important role in basin response to changing background water-table altitude. A relatively deep impeding layer allows only a small interval in which the ground-water mound can develop before intersecting the base of the impeding layer and creating a “back pressure” reduction of hydraulic gra-dient and, therefore, infiltration rate.
Variation of ponded depth within basins does not offer much promise for increasing basin infiltration capacity. Model simulations indicate that increasing the ponded depth from 4 to 12 inches and from 4 to 24 inches will increase basin infiltration capacity by less than 6 and 11 percent, respectively. This minor response is the result of the small ponded depth (which serves as the system control on infiltration) relative to the thickness of the upper 20 feet of the subsurface pro-file.
The flow model indicates that basin 50 infiltra-tion capacity would not be diminished, even after 40 days of continuous loading (based on an assump-tion that the lack of basin disking/drying during the 40-day period would have a negligible effect on basin infiltration). Therefore, a basin-loading strategy that relies on long, uninterrupted flooding offers the possi-bility of inducing a more anaerobic environment con-ducive to denitrification while maintaining reclaimed-water disposal capacity.
Transient, elevated concentrations of nitrate (as high as 33 milligrams per liter as N) were observed at the leading edge of the front of infiltrating water and in the shallow, saturated zone following a prolonged rest period. This phenomenon probably was the result of mineralization and nitrification of organic nitrogen retained within the subsurface during prior basin-loading events. The organic nitrogen was retained in the shallow soil (due to adsorption/straining) and the shallow saturated zone (due to deposition under slack-ing pore-water velocity). The magnitude of the nitrate spikes seemed to be influenced by the scheduling of
basin loading. Short loading (1 week) and resting (4 weeks) cycles reduced this effect (maximum con-centration about 9 milligrams per liter as N) as com-pared to long loading (3 weeks) and resting (20 weeks) cycles (maximum concentration about 33 milligrams per liter as N). Removal of nitrogen by denitrification from the percolating reclaimed water appeared to be minimal in the vicinity of the basin, probably as a result of the lack of reducing conditions and low amounts of organic carbon. Longer flooding periods could create reducing conditions favorable for nitrogen removal from the system, but would probably lead to more pronounced nitrate spiking.
Phosphorus concentrations were reduced about 90 percent from concentrations in reclaimed water in the upper 15 ft of the soil profile, probably due to adsorption onto abundant iron and aluminum oxyhy-droxides. However, some phosphorus—predominantly the coarse, organic fraction—was carried to the water table by the relatively high-velocity pore water of the unsaturated flow system. Phosphorus that reached the water table accumulated under slacking pore-water velocity, but was immobilized by adsorption or precip-itation reactions during basin rest periods.
Selected References
American Society for Testing and Materials, 1985, Standard test method for classification of soils for engineering purposes, D 2487-83, 1985 Annual Book of ASTM Standards, 04.08:395-408: American Society for Testing and Materials, Philadelphia.
Backus, D.A., Ryan, J.N., Groher, D.M., MacFarlane, J.K., and Gschwend, P.M., 1993, Sampling colloids and colloid-associated contaminants in ground water: Ground Water, v. 31, no. 3, p. 466-479.
Bennet, E.R. and Leach, L.E., 1983, Field studies of rapid infiltration treatment of primary effluent, in Proceedings of the ASCE National Conference on Environmental Engineering, July, 1983, p. 41-49.
Bohn, H.L., McNeal, B.L., O’Connor, G.A., 1985, Soil Chemistry (2nd ed.): John Wiley and Sons, New York, 341 p.
Bouwer, Herman, 1974, Infiltration-percolation systems, in Land application of wastewater, Proceedings of a research symposium sponsored by the USEPA, Region III, Newark, Delaware, December 1974: p. 85-92.
Bouwer, Herman, Lance, J.C., and Riggs, M S., 1974, High-rate land treatment II: Water quality and economic aspects of the Flushing Meadows project: Journal of the Water Pollution Control Federation, v. 46, no. 5, p. 844-859.

Summary and Conclusions 49
Bouwer, Herman, and Rice, R.C., 1984, Renovation of wastewater at the 23rd Avenue rapid infiltration project: Journal of the Water Pollution Control Federation, v. 56, no. 1, p. 76-83.
Bouwer, Herman, Rice, R.C., and Escarcega, E.D., 1974, High-rate land treatment I: Infiltration and hydraulic aspects of the Flushing Meadows project, Journal of the Water Pollution Control Federation, v. 46, no. 5, p. 834-843.
Brady, N.C., 1984, The nature and properties of soils: MacMillan Publishing Company, New York, 750 p.
Broadbent, F.E. and Reisenauer, H.M., 1984, Fate of wastewater constituents in soil and groundwater: nitrogen and phosphorus, in Irrigation with reclaimed municipal wastewater - a guidance manual, Pettygrove, G.S. and Asano, Takashi, eds.: Lewis Publishers, Inc., Chelsea, Mich., p. 12-1 - 12-16.
Brown, E., Slougstad, M.W., and Fishman, M.J., 1970, Methods for collection and analyses of water samples for dissolved minerals and gases: U.S. Geological Survey Techniques of Water-Resources Investigations, book 5, chap. A1, 170 p.
Bush, P.W., 1979, Connector well experiment to recharge the Floridan aquifer, east Orange County, Florida: U.S. Geological Survey Water-Resources Investigations 78-73, 40 p.
Camp, Dresser, and McKee, Inc., 1983, Design development report for southwest Orange County regional wastewater treatment facilities water conservation project for the Board of County Commissioners: Orange County, Florida, Technical Report and two appendices.
Carlson, R.R., and Linstedt, K.D., 1982, Rapid infiltration treatment of primary and secondary effluents: Journal of the Water Pollution Control Federation, v. 54, no. 3, p. 270-280.
CH2M Hill, 1989, Wastewater management program of the 1,000 acre site: prepared for the Reedy Creek Improvement District, Lake Buena Vista, Fla.
Diab, Shaher, and Shilo, Moshe, 1988, Nitrogen transformation in wastewater reclamation: Water Research, v. 22, no. 5, p. 557-563.
Doolittle, J.A. and Schellentrager, G., 1989, Soil Survey of Orange County, Florida: U.S. Soil Conservation Service, 175 p. and 88 pls.
Firestone, M.K., 1982, Denitrification, in Nitrogen in agricultural soils, Stevenson, F.J., ed., American Society of Agronomy, Inc.: Madison, Wis., number 22 in Agronomy series, p. 289-326.
Fishman, M.J. and Friedman, L.C. (eds.), 1985, Methods for determination of inorganic substances in water and fluvial sediments: U. S. Geological Survey Techniques of Water-Resources Investigations, book 5, chap. A1, Open-File Report 85-495, 706 p.
German, E.R., 1986, Summary of hydrologic conditions in the Reedy Creek Improvement District, central Florida: U.S. Geological Survey Water-Resources Investigations Report 84-4250, 109 p.
———1990, Effect of spray irrigation of treated wastewa-ter on water quality of the surficial aquifer system, Reedy Creek Improvement District, central Florida: U.S. Geological Survey Water-Resources Investiga-tions Report 88-4174, 43 p.
Hampson, P.S., 1993, Hydrology and water quality of Reedy Creek in the Reedy Creek Improvement District, central Florida 1986-89: U. S. Geological Survey Water-Resources Investigations Report 93-4006, 57 p.
Harkness, Gregg, and Otta, Jimmy, 1994, Water reuse and reclamation at Walt Disney World: Florida Water Resources Journal, June 1994, p. 28-30.
Healy, R.W., 1990, Simulation of solute transport in variably saturated porous media with supplemental information on modifications to the U.S. Geological Survey’s computer program VS2D: U.S. Geological Survey Water-Resources Investigations Report 90-4025, 125 p.
Hillel, Daniel, 1980, Fundamentals of soil physics: Academic Press, Inc., Orlando, Fla., 413 p.
Huling, S.G., 1989, Facilitated transport, Superfund Ground Water Issue, EPA/540/4-89/003, Superfund Technology Support Center for Ground Water: Robert S. Kerr Environmental Research Laboratory, Ada, Okla.
Idelovitch, Emanuel, and Michail, Medy, 1984, Soil-aquifer treatment - A new approach to an old method of wastewater reuse: Journal of the Water Pollution Control Federation, v. 56, no. 8, p. 936-943.
Ives, K.J., 1970, Rapid filtration: Water Research, v. 4, p. 201-223.
Jansson, S.L. and Persson, J., 1982, Mineralization and immobilization of soil nitrogen, in Nitrogen in agricultural soils, Stevenson, F. J., ed.,: American Society of Agronomy, Inc.: Madison, Wis., number 22 in Agronomy series, p. 229-252.
Jones, O.R., Goss, D.W., and Schneider, A.D., 1974, Surface plugging during basin recharge with turbid water: Transactions of the American Association of Agricultural Engineers, v. 17, p. 1011-1019.
Kharaka, Y.K., Gunter, W.D., Aggarwal, P.K., Perkins, E.H., and DeBraal, J.D., 1988, SOLMINEQ.88: A computer program for geochemical modeling of water-rock interactions: U S. Geological Survey Water-Resources Investigations Report 88-4227, 420 p.

50 Hydraulic Characteristics and Nutrient Transport, Reedy Creek Improvement District, Orange County, Florida
Kohl, H.R., McKim, Ted, Smith, Dan, and Bedford, Dean, Lozier, James, and Fulgham, Brent, 1993, Reclamation of secondary effluent with membrane processes. in Innovative environmental solutions, May 12, 1993, Lake Buena Vista, Florida: published by University of Central Florida Department of Civil and Environmental Engineering, p. 7-34.
Korom, S.F., 1992, Natural denitrification in the saturated zone: a review: Water Resources Research, v. 28, no. 6, p. 1657-1668.
Lance, J.C., 1986, Effect of sludge additions on nitrogen removal in soil columns flooded with secondary effluent: Journal of Environmental Quality, v. 15, no. 3, p. 298-301.
Lance, J.C. and Whisler, F.D., 1972, Nitrogen balance in soil columns intermittently flooded with secondary sewage effluent: Journal of Environmental Quality, v. 1, no. 2, p. 180-186.
———1976, Stimulation of denitrification in soil columns by adding organic carbon to wastewater: Journal of Water Pollution Control Federation, v. 48, no. 2, p. 346-356.
Lappala, E.G., Healy, R.W., and Weeks, E.P., 1987, Documentation of computer program VS2D to solve the equations of fluid flow in variably saturated porous media: U. S. Geological Survey Water-Resources Investigations Report 83-4099, 184 p.
Leach, L.E., Enfield, C.G., and Haslin, C.C., 1980, Summary of long-term rapid infiltration system studies: U. S. Environmental Protection Agency, EPA-600/2-90-165, 50 p.
Leach, L.E. and Enfield, C.G., 1983, Nitrogen control in domestic wastewater rapid infiltration systems: Journal of the Water Pollution Control Federation, v. 55, no. 9, p. 1150-1157.
Mansell, R.S. and Selim, H.M., 1981, Mathematical models for predicting reactions and transport of phosphorus applied to soils, in Modeling wastewater renovation, Iskandar, I. K. (ed.): Wiley-Interscience, New York, p. 600-646.
McDowell-Boyer, L.M., 1992, Chemical mobilization of micron-sized particles in saturated porous media under steady flow conditions: Environmental Science Technology, v. 26, no. 3, p. 586-593.
McKim, T.W., 1993, Effluent management, in Innovative environmental solutions, May 12, 1993, Lake Buena Vista, Florida: University of Central Florida Department of Civil and Environmental Engineering, p. 49-69.
National Oceanic and Atmospheric |Administration, 1992a, Climatological data, Florida, February 1992: v. 96, no. 2, 23 p.
———1992b, Climatological data, Florida, March 1992: v. 96, no. 3, 23 p.
Nightingale, H.I. and Bianchi, W.C., 1977, Ground-water turbidity resulting from artificial recharge: Ground Water, v. 15, no. 2, p. 146-152.
Olson, R.V. and Ellis, Roscoe, Jr., 1982, Iron, in Methods of Soil Analysis, pt. 2, Klute, Arnold, ed.: American Society of Agronomy, Madison, Wisconsin, no. 9 in Agronomy series, p. 301-312.
Press, W.H., Flannery, B.P., Teukolsky, S.A., and Vetterling, W.T., 1989, Numerical recipes - The art of scientific computing: Cambridge University Press, 702 p.
Putnam, A.I., 1975, Summary of hydrologic conditions and effects of Walt Disney World development in the Reedy Creek Improvement District, 1966-73: Florida Bureau of Geology Report of Investigations 79, 115 p.
Rice, R.C., 1974, Soil clogging during infiltration of secondary effluent: Journal of the Water Pollution Control Federation, v. 46, no. 4, p. 708-716.
Rice, R.C. and Gilbert, R.G., 1978, Land treatment of primary sewage effluent: water and energy conservation, in Proceedings of the 1978 meetings of the Arizona Section of the American Water Resources Association and the Hydrology Section of the Arizona Academy of Science: Flagstaff, Ariz., April 14-15, 1978, p. 33-35.
Richards, L.A., 1931, Capillary conduction of liquids in porous mediums: Physics, v. 1, p. 318-333.
Schmidt, E.L., 1982, Nitrification in soil, in Nitrogen in agricultural soils, Stevenson, F.J., ed.: American Society of Agronomy, Inc., Madison, Wisconsin, no. 22 in Agronomy series, p. 253-288.
Schuh, W.M., and Shaver, R.B., 1988, Feasibility of artificial recharge to the Oakes aquifer, southeastern North Dakota: Evaluation of experimental recharge basins, North Dakota State Water Commission: Water Resources Investigation no. 7, 248 p.
Smith, R.L., and Duff, J.H., 1988, Denitrification in a sand and gravel aquifer: Applied and Environmental Microbiology, v. 54, no. 5, p. 1071-1078.
Stumm, Werner, 1977, Chemical interaction in partical separation: Environmental Science Technology, v. 11, p. 1066-1069.
Sumner, D.M., Phelps, G.G., Spechler, R.M., Bradner, L.A., and Murray, L.C., 1992, Potentiometric surface of the Upper Floridan aquifer in the St. Johns River Water Management District and vicinity, September, 1991: U. S. Geological Survey Open-file Report 92-68, map report.
Sumner, D.M., Schuh, W.M., and Cline, R.L., 1991, Field experiments and simulations of infiltration-rate response to changes in hydrologic conditions for an artificial-recharge test basin near Oakes, southeastern North Dakota: U.S. Geological Survey Water-Resources Investigations Report 91-4127, 46 p.

Summary and Conclusions 51
Syers, J.K. and Iskandar, I.K., 1981, Soil-phosphorus chemistry, in Modeling wastewater renovation, Iskandar, I. K., ed.: Wiley-Interscience, New York, p. 571-599.
Tan, K.H., Hajek, B.F., and Barshad, I., 1986, Thermal analysis techniques, in Methods of Soil Analysis, pt. 1, Klute, Arnold, ed.: American Society of Agronomy, Madison, Wisconsin, number 9 in Agronomy series, p. 151-183.
Tibbals, C.H., 1990, Hydrology of the Floridan aquifer system in east-central Florida: U. S. Geological Survey Professional Paper 1403-E, 98 p.
Tiedje, J.M., Sorensen, J. and Chang, Y.Y.L., 1981, Assimilatory and dissimilatory nitrate reduction perspectives and methodology for simultaneous measurement of several nitrogen cycle processes, in Terrestrial nitrogen cycles, Clark, F.E. and Rosswall, T., eds.: Ecological Bulletin (Stockholm), no. 33, p. 331-342.
U.S. Geological Survey, 1992, Water resources data - Florida - water year 1992, v. 1B, northeast Florida ground water: U.S. Geological Survey Water-Data Report FL-92-1B, 322 p.
van Genuchten, M.T., 1980, A closed-form equation for predicting the hydraulic conductivity of unsaturated soils: Soil Science Society of America Proceedings, v. 44, no. 5, p. 892-898.
Wershaw, R.L., Fishman, M.J., Grabbe, R.R., and Lowe, L.E., eds., 1983, Methods for the determination of organic substances in water and fluvial sediments: U.S. Geological Survey Techniques of Water-Resources Investigations, book 5, chap. A3, Open-File Report 82-1004, 173 p.
White, W.A., 1970, The geomorphology of the Florida peninsula: Florida Bureau of Geology Geological Bulletin no. 51, 164 p.
Whittig, L.D., and Allardice, W.R., 1986, X-ray diffraction techniques, in Methods of Soil Analysis, pt. 1, Klute, Arnold, ed.: American Society of Agronomy, Madison, Wis., no. 9 in Agronomy series, p. 331-362.