Embed Size (px)
Citation preview

NUREGCR- NISTIR 7947
httpdxdoiorg106028NISTIR7947
Hydrated Phases in Blended Cement Systems and Synthetic Saltstone Grouts
Prepared by
Kenneth A Snyder Paul E Stutzman
National Institute of Standards and Technology Engineering Laboratory 100 Bureau Drive Gaithersburg MD 20899-8615
Manuscript Completed Date Published
Jacob Philip NRC Program Manager
NRC Job Code XX-
Office of Nuclear Regulatory Research
NISTIR 7947
Hydrated Phases in Blended Cement Systems and Synthetic Saltstone Grouts
Kenneth A Snyder Paul E Stutzman
Materials and Structural Systems Division Engineering Laboratory
httpdxdoiorg106028NISTIR7947
June 2013
US Department of Commerce Cameron F Kerry Acting Secretary
National Institute of Standards and Technology Patrick D Gallagher Under Secretary of Commerce for Standards and Technology and Director
ii
ABSTRACT
A blended binder system (10 portland cement 45 fly ash and 45 slag) is characterized as part of a broader study of its long-term effectiveness in stabilizing treated salt waste at the Savannah River Site The binder system is reproduced in the laboratory using a simulated salt solution and the hydrated phases are identified and quantified out through one year of hydration The phases are identified through the use of thermogravimetric analysis and X-ray diffraction Supporting information is obtained from scanning electron microscopy and pore solution analysis by inductively coupled plasma optical spectroscopy The evidence suggests that the phases being formed are the types one would expect given the starting materials Moreover even though the salt solution adds considerable sulfate to the system there is no evidence of excess sulfate bearing phases indicative of expansive sulfate attack Furthermore the data out to one year of hydration suggests that the phases observed are stable
iii
iv
TABLE OF CONTENTS
ABSTRACT III
LIST OF FIGURES VI
LIST OF TABLES VIII
EXECUTIVE13 SUMMARY XI
ABBREVIATIONS XIII
1 INTRODUCTION 1 11 EXPERIMENTAL PLAN 1 12 CHARACTERIZATION13 TECHNIQUES 2 121 Isothermal Calorimetry 2 122 Thermogravimetric Analysis 2123 Quantitative X-shy‐ray Powder13 Diffraction 4124 Scanning Electron Microscopy 5 125 Image Segmentation 6126 Inductively-shy‐Coupled13 Plasma13 Spectroscopy 14127 Thermodynamic Modeling 15
2 BLENDED13 CEMENT13 PASTES 1621 EXPERIMENTAL PLAN 17 22 RESULTS 1823 THERMODYNAMIC CALCULATIONS 2124 IMAGE SEGMENTATION 2325 DISCUSSION 2526 SUMMARY 25
3 SALTSTONE GROUT 2631 EXPERIMENTAL PLAN 27 32 SURROGATE WASTE SOLUTION13 (SWS) 2733 CEMENTING13 MATERIALS 28331 Portland Cement 28332 Fly Ash 32333 Slag 33334 Previous Reports 33
34 MIXTURE DESIGNS 3435 RESULTS 35351 Calorimetry 35352 Thermogravimetric Analysis 36353 X-shy‐ray Powder13 Diffraction 38354 Nitratine 40355 Rietveld Analysis 41356 Pores Solution13 Analysis 43357 Total Sulfur 45
36 DISCUSSION 4637 SUMMARY 46
4 CONCLUSION 48
5 REFERENCES 49
v
LIST OF FIGURES
Figure 1 The backscattered electron image and a segmented color-composite image derived from a set of X-ray and the BEI illustrate the chemical and compositional complexity of cement and use of the image set to assign phase classes (lower-right) to a segmented image 6
Figure 2 Backscattered electron image (BEI) of hydrated cement paste after 3 months of hydration 7
Figure 3 Original elemental maps of the major components for Mix 1 at 3 months hydration 8Figure 4 A summary of image processing techniques used in the segmentation The bottom row
demonstrates before (left) and after (right) images of the despeckle and median filter algorithms 9Figure 5 Processed element images from Figure 3 9
Figure 6 Phase identification color maps only a portion of the entire image is shown to enhance detail The three element labels that appear over each image represent (from left to right) the red green and blue channels respectively 10
Figure 7 Phase training sets for the cement paste shown in Figure 2 11
Figure 8 Statistics reported by MultiSpec software after a segmentation analysis 11Figure 9 The segmented image when using processed starting images 12
Figure 10 Segmentation statistics using the same training set locations and the original (unprocessed) images 13
Figure 11 Comparison of the segmented image using unprocessed starting images and the original BEI image 13
Figure 12 Calorimetry data for Mixes 1-4 (l) and for Mixes 5-8 (r) Inset shows data from Mix 8 until 800 hours of hydration 18
Figure 13 Thermogravimetric data for Mix 1-4 (l) and Mix 5-8 (r) after 12 weeks of hydration 19
Figure 18 Relative remaining mass micro as a function of temperature for the portland cement Individual peaks are labeled the mass loss near 100 is due to water loss from C-S-H and other hydrated phases 30
Figure 19 Analysis of the portlandite peak in the cement (left) regression to the TGA data showing the background function b(T) and the peak function p(T) (right) the measured data minus the background function compared with the peak function (the two lie nearly on top of one another) 30
Figure 20 Analysis of the syngenite peak in the cement (left) regression to the TGA data showing the background function b(T) and the peak function p(T) (right) the measured data minus the background function compared with the peak function (the two lie nearly on top of one another) 31
Figure 14 XRD scans for all 8 mixes The consecutive upper curves are displaced from the immediately lower curve by a value of 5 20
Figure 15 Backscattered electron image (BEI) and segmented image of the fly ash cement paste in Mix 1 after 3 months hydration 23
Figure 16 Backscattered electron image (BEI) and segmented image of the fly ash cement paste in Mix 2 after 3 months hydration 23
Figure 17 Backscattered electron image (BEI) and segmented image of the slag cement paste in Mix 3 after 3 months hydration 24
vi
Figure 21 Analysis of the limestone peak in the cement (left) regression to the TGA data showing the background function b(T) and the two peak functions p1(T) and p2(T) (right) the measured data minus the background function compared with the sum of the two peak functions (the two lie nearly on top of one another) 32
Figure 22 Heat generation rates (Wg) as a function of time (hours) for the 040 wcm pastes (left) and the 060 wcm pastes (right) 35
Figure 23 Differential relative mass loss (dmicrodT) as a function of temperature () for pastes made with portland cement and water wcm=04 (left) wcm=060 (right) Each line corresponds to a different age 7 d 14 d 28 d and 56 d 36
Figure 24 Differential relative mass loss (dmicrodT) as a function of temperature () for pastes made with portland cement and surrogate waste solution wcm=04 (left) wcm=060 (right) Each line corresponds to a different age 7 d 14 d and 28 d 36
Figure 25 Differential relative mass loss (-dmicrodT) as a function of temperature () for pastes made with portland cement paste fly ash slag and surrogate waste solution wcm=04 (left) wcm=060 (right) Each line corresponds to a different age 7 d 14 d and 28 d 37
Figure 26 X-ray powder diffraction data showing counts as a function of angle 2120579 for pastes made with portland cement and water wcm=04 (left) wcm=060 (right) Data after 7 d are offset for comparison purposes 39
Figure 27 X-ray powder diffraction data showing counts as a function of angle 2θ for pastes made with portland cement and surrogate waste solution wcm=04 (left) wcm=060 (right) Data after 7 d are offset for comparison purposes 39
Figure 28 X-ray powder diffraction data showing counts as a function of angle 2θ for pastes made with portland cement fly ash slag and surrogate waste solution wcm=04 (left) wcm=060 (right) Data after 7 d are offset for comparison purposes 40
Figure 29 Six successive X-ray powder diffraction scans of the 60-1-055 mixture after 16 weeks of hydration Successive scans are 20 minutes apart The nitratine peaks are near 29deg 2θ 32deg 2θ and 39deg 2θ 41
vii
LIST OF TABLES
Table 1 The volume fraction (VF) and mass fraction (MF) of the phases identified in the segmented images for the processed and unprocessed starting images 14
Table 2 The composition of the three different standard solutions used to analyze the extracted pore solutions from the OPC pastes (Standard A) and the saltstone waste forms (Standard B1 and Standard B2) 14
Table 3 Mixture mass fractions of the cementitious binders in each mixture 17
Table 4 Oxide mass fractions for the binders The cement calcite content and the slag sulfide content are also given 17
Table 5 Estimated portlandite mass fraction as calculated from TGA data The parameter coefficient of variation reported by the regression software was typically less than 03 and other comparisons to XRD data were generally within 2 19
Table 6 Hydrated phase mass fractions after 3 months hydration at 25 as determined by Rietveld analysis Mix 1 through Mix 7 use the portlandite content (see Table 5) as the internal standard Mix 8 uses corundum as an internal standard 21
Table 7 Estimated phase mass fractions after 3 months hydration as calculated using the Lothenbach et al [15] thermodynamic hydration model 21
Table 8 Estimated mass fractions from quantitative XRD (QXRD) and imaging 25
Table 9 Binder proportions for mixtures at two watercementitious material mass ratios (wcm) neglecting the dissolved salts in the surrogate waste solution The quantity of cement fly ash and slag are designated by the corresponding mass fraction 27
Table 10 Composition of the surrogate waste solution there are 08866 kg of water in each liter of solution 27
Table 11 The component composition of the surrogate waste solution The numbers between parentheses represent the oxidation state this is the notation used in a number of thermodynamic databases 28
Table 12 Oxide composition of the ASTM Type III cement from the mill certificate report based on a single measurement 28
Table 13 Portland cement mineral phase composition as determined by X-ray diffraction with Rietveld analysis (ASTM C1365) uncertainty expresses one standard deviation 29
Table 14 Fly ash oxide composition reported in the mill certificate based on a single measurement 32
Table 15 Fly ash mineral phase composition as determined by X-ray powder diffraction and Rietveld analysis 33
Table 16 Oxide percentages reported by Harbour et al [24 (Table 3-5)] for the portland cement the fly ash and the slag 33
Table 17 Mixture designs for wcm=040 pastes 34Table 18 Mixture designs for wcm=060 pastes 34
Table 19 Portlandite mass fraction as determined by TGA analysis for the four portland cement mixtures The uncertainty represents the measurement uncertainty having a coverage factor of one standard deviation 37
viii
Table 20 Results of Rietveld analysis for the six mixtures The values reported are the mass fractions and the numbers in parentheses represent the uncertainty (one standard deviation) in the last two digits 42
Table 21 Pore solution composition of the 040 wcm paste made with only portland cement numbers in parentheses indicate one standard deviation of uncertainty 44
Table 22 Pore solution composition of the 060 wcm paste made with only portland cement numbers in parentheses indicate one standard deviation of uncertainty 44
Table 23 Pore solution composition of the 040 wcm paste made with fly ash slag and surrogate waste solution numbers in parentheses indicate one standard deviation of uncertainty 44
Table 24 Pore solution composition of the 060 wcm paste made with fly ash slag and surrogate waste solution numbers in parentheses indicate one standard deviation of uncertainty 45
ix
x
EXECUTIVE SUMMARY
A novel cementitious blend of portland cement fly ash and slag (mass ratio ndash 104545) has been developed for stabilizing a salt waste for disposal at Savannah River Site (SRS) and the mixture of binder and treated salt solution is referred to as a saltstone grout The blend exploits the reduced state of sulfur (sulfide) in the slag to help immobilize radionuclides the high alkalinity of the treated salt solution to help activate the hydration reaction and the lower heat of hydration of fly ash to achieve construction requirements Because the formulation and the application are novel studies are needed to forecast the long-term performance of these engineered materials A key parameter in the assessment of the long-term performance of these materials is the identification and quantification of the hydrated phases This information serves as the initial conditions to computer models that can simulate the effects of different environments on the long-term performance of cementitious materials
Understanding the long-term performance of cementitious engineered barriers is an important challenge because these materials account for much of the components within disposal facilities To help meet this challenge the Department of Energy (DOE) the National Institute of Standards and Technology (NIST) and the US Nuclear Regulatory Commission (NRC) formed the Cementitious Barriers Partnership (CBP) to develop tools that facilitate performance assessment of cementitious engineered structures A requirement of these tools is to predict the chemical and physical state of the hydrated binder over time the chemical state can change due to both the hydration processes (the chemical reaction between the liquid and powder) and the chemical degradation processes that arise from interactions with the environment An important challenge for these tools is predicting the initial chemical state of the material ie the type and quantity of mineral phases present and the chemical composition of the pore solution that remains behind in the microscopic pores after the hydration reaction
Although the cement and concrete industries have considerable experience working with blended binders the proposed saltstone mixture is considerably different than those used in the concrete construction industry In construction binary mixtures of portland cement and either fly ash or slag are common practice and ternary mixtures (that may alternately contain silica fume or limestone) are also used but to a lesser extent As a rule however the portland cement component of the cementitious binder in these commercial applications is almost always 50 or more by mass Moreover the mixtures used in the concrete construction industry are almost always made with potable water By comparison the treated salt solution is a highly concentrated (more than 5 molL) alkaline solution containing among other species sulfate ions which are associated with a concrete degradation mechanism known as sulfate attack that leads to expansion and the loss of material
To aid in the development of these tools to accurately predict the properties and performance of saltstone grouts the NIST used a number of techniques for characterizing the hydrated phases in the saltstone The characterization techniques included quantitative X-ray powder diffraction thermogravimetric analysis scanning electron microscope imaging coupled with scanning electron micro-probe elemental analysis imaging and inductively-coupled plasma elemental analysis of the pore solution
After one year of hydration the mineral phases present and the composition of the pore solution are generally consistent with the expectations based on thermodynamic modeling The phases that are formed appear to be stable after one year Also even though the salt solution includes sulfates there do not appear to be sufficient expansive sulfate phases present to cause degradation The reason for this is because the high alkalinity of the salt solution appears to suppress the formation of these sulfate phases Based on this assumption as long as the alkalinity is maintained in these systems one would not expect expansion over the long-term
xi
xii
ABBREVIATIONS
BEI Backscattered Electron Image
CBP Cementitious Barriers Partnership (httpwwwcementbarriersorg)
C-S-H Calcium Silicate Hydrate (gel)
DOE Department of Energy
GGBFS Ground Granulated Blast Furnace Slag
HDPE High-Density Polyethylene
ICP-OES Inductively-Coupled Plasma Optical Emission Spectroscopy
NIST National Institute of Standards and Technology
NRC US Nuclear Regulatory Commission
OPC Ordinary Portland Cement
QXRD Quantitative X-ray Powder Diffraction
PA Performance Assessment
SEM Scanning Electron Microscope
SRM (NIST) Standard Reference Materialreg
SRNL Savannah River National Laboratory
SWS Surrogate Waste Solution
TGA Thermogravimetric Analysis
wcm watercementitious material (mass ratio)
XR X-ray Microanalysis
XRD X-ray Diffraction
xiii
xiv
1 INTRODUCTION
The various infrastructure elements of future nuclear facilities may be composed of the broad range of cementitious binder proportions structural elements may be composed entirely of portland cement concrete massive concrete elements may contain large quantities of fly ash andor ground granulated blast furnace slag (GGBFS) and saltstone grouts [1] may contain less than 10 percent portland cement with fly ash and slag making up the remainder Improved performance assessment (PA) tools are needed for predicting the performance of all these systems because existing tools were developed for systems composed mostly of portland cement An important aspect of these tools is the ability to estimate the type and quantity of hydrated phases present and the pore solution composition as these factors impact overall performance because they control among other things the buffering capacity of the material the mobility of certain radionuclides and the chemical composition of any effluent
Sophisticated computer tools for predicting transport and reaction in cementitious systems incorporate thermodynamic data for the mineral phases present Transport of ions from the external ground water changes the chemical equilibrium and the thermodynamic model adjusts the quantity of phases to maintain equilibrium Therefore an accurate assessmentprediction of the initial hydrated phases and pore solution composition is vital component to an accurate PA tool
Standard test methods exist for characterizing the raw materials used to make mortars and concretes (eg ASTM C1365 ndash X-ray diffraction analysis of portland cement paste) By comparison there are few standardized techniques for quantifying the hydrated phases There are however a number of characterization techniques that could be applicable to these blended cement systems The principle objective when considering these techniques is the ability to identify and quantify the hydration phases or the composition of the pore solution Although these techniques have been used to identify and quantify phases and solutions for other applications they have not been evaluated for use with these unique blended cement systems
11 Experimental Plan
The experimental plan was composed of two parts The first part investigated blended cements mixed with water and the second part replicated the saltstone mixture using binder materials obtained from Savannah River Site (SRS) and approximated the treated salt solution using previously published formulations The objective of the first part of the plan was to use familiar materials to develop characterization techniques for hydrated systems composed of large quantities of glassy binders Because no single characterization technique could provide a complete description a combination of techniques was needed
The specific techniques that were used differed between the two parts of the plan The first part which characterized blended cements mixed with water used calorimetry quantitative X-ray powder diffraction thermogravimetric analysis and electron micro-probe X-ray image analysis The second part which characterized the saltstone binder mixed with surrogate waste solution (SWS) used calorimetry quantitative X-ray powder diffraction thermogravimetric analysis and inductively-coupled plasma ndash optical emission spectroscopy to characterize the hydrated paste and the pore solution
1
12 Characterization Techniques
The initial conditions of a comprehensive PA tool for engineered cementitious barriers are the type and quantity of mineral phases present and the chemical composition of the pore solution both of which are the result of the hydration reactions For cementitious materials composed largely of portland cement existing tools can reliably predict the composition of the hydrated system The novel mixtures used to make saltstone however use very low portland cement content and a concentrated ldquomix waterrdquo solution and there are few if any data with which to validate these prediction models
A number of experimental techniques were used to characterize the saltstone mixture Each technique had advantages and disadvantages and it was only when looking at combinations of techniques that one could make sound inferences from the results
121 Isothermal Calorimetry
Isothermal calorimetry is a measure of the heat generated by a chemical reaction For these systems the binders react with water to form a hardened paste and this reaction is exothermic The technique requires that the sample be maintained at a constant temperature and the amount of energy required to maintain a constant temperature is a measure of the heat either given off or consumed by the chemical reaction This characterization method has been standardized in ASTM C1679 [2] but only for the first few weeks of reaction Although calorimetry does not give specific information about the type and quantity of phases created by the hydration reaction it is a qualitative measure of the overall hydration reaction process
The isothermal calorimetry was performed on paste (water and binder) specimens (approximately 10 g) Immediately after mixing in the laboratory the samples were transferred to the calorimeter maintained at 25 The system was brought to equilibrium over a period of 45 minutes prior to data collection The rate of heat output was reported per gram of cementitious binder
122 Thermogravimetric Analysis
Thermogravimetric analysis (TGA) consists of monitoring the mass of a sample during heating in an inert atmosphere A number of the phases present in a hydrated cementitious system contain chemically bound water which is released at a temperature that is specific to that phase alternatively some phases may contain carbonate (bound carbon dioxide) that is also released at a specific temperature If the temperature range over which the chemically bound water or carbon dioxide is released is isolated from the mass loss from other phases one can use TGA to identify and quantify certain phases that may be present
The thermogravimetric data reported here were scaled so that mass losses would be a direct measure of the relative mass The data collection process consisted of recording the mass 119898 of the sample at a temperature 119879 The relative mass 120583 expresses the ratio of the mass 119898(119879) to the initial mass 1198980
119898(119879)120583 119879 = (1) 119898
2
The initial value of the relative mass 120583 is one and it decreases monotonically as water and (sometimes) carbon dioxide (from limestone) are liberated from the sample The differential relative mass (minus119889120583119889119879) gives an indication of how much mass is lost at a particular temperature which is usually represented by a peak Although the temperature at which a relatively large mass is lost can be indicative of a particular phase that is decomposing and the precise temperature at which the mass loss occurs can also depend upon experimental parameters such as the heating rate and the size of the sample
The TGA measurements were performed on samples that were cut from small cylindrical specimen that were approximately 25 mm in diameter and 25 mm long A diamond saw was used to cut 15 mm (approx) thick circular wafer using ethanol as the cutting fluid The wafer was broken into small pieces two of which were placed into the TGA sample cup The typical total sample mass was between 50 mg and 75 mg The sample was equilibrated at 30 and then the temperature increased at 5 min up to 950 During testing the sample chamber was purged with high purity (99995 ) nitrogen
An advantage of TGA is that it can be used to quantify the portlandite (calcium hydroxide) present in the system because its decomposition occurs at a temperature that few other phases are decomposing This information can be coupled with X-ray powder diffraction analysis and can eliminate the need for adding an internal standard Although portlandite decomposition occurs at temperatures that are isolated from the decomposition of other phases there is a background mass loss that occurs (but at a much slower rate) so the analysis of the portlandite peak must account for this background mass loss
At a mineral decomposition temperature 1198790 for each identifiable phase (eg portlandite limestone) there is an increase in the rate of mass loss resulting in a peak in the differential relative mass curve The quantity of mass loss associated with this peak is estimated by fitting the measured mass data (near the peak) to an equation 119891(119879) that is a sum of a background function 119887(119879) and a peak function 119901(119879) 119891 119879 = 119887 119879 + 119901(119879)
The functional forms of the background and peak functions were chosen to allow sufficient flexibility For these analyses the background was assumed to be quadratic
119887 119879 = 119860 + 119860 119879 minus 119879 + 119860 (119879 minus 119879 ) (2)
The parameter 119879b is a fitting parameter and has no physical meaning in the estimation of the mass loss There are two peak functions used one for symmetrical peaks and the other for asymmetric peaks For symmetrical peaks that are centered on the decomposition temperature 1198790 the relative mass data are modeled by the complementary error function [3]
(3) 119901 119879 = 1198612 erfc 119861 (119879 minus 119879 )
The parameter 1198611 is related to the Gaussian standard deviation 119904 (1198611 = 1119904radic2) For asymmetrical peaks the data are modeled by the asymmetric sigmoidal logistic function
119861oeBlBz(T-Ta) = (4) 119901 119879 1 + e-=-(=-=-) --
For both peak functions the parameter 1198610 is an estimate for the mass loss due to decomposition The uncertainty in the mass loss is estimated from the uncertainty of the fitted parameter 1198610
3
123 Quantitative X-ray Powder Diffraction
X-ray powder diffraction (XRD) measures the angular-dependent X-ray reflection from crystalline phases within a powder sample If there are crystallographic structural models for the crystalline materials being analyzed one can identify the component mass ratios that would best agree with the measured reflections This process of estimating mass fractions using the crystallographic structural models is part of the Rietveld analysis that is the basis of quantitative X-ray powder diffraction (QXRD) If there are only crystalline phases present in the sample and there are structural models for each phase the mass ratios obtained by the Rietveld analysis can be used to determine the mass fractions of each phase
If there are amorphous phases present an internal standard must be used to determine the mass fractions Amorphous components do not exhibit distinguishable peaks in the XRD data Rather they typically contribute a broad background ldquohumprdquo to the data Although a quantitative Rietveld analysis can still be used to estimate the mass ratios of the remaining crystalline phases the total mass fraction of the amorphous phase is still unknown To overcome this challenge one can add an internal standard which is a unique crystalline phase that is added to the sample at a known mass fraction Using the known mass fraction of the internal standard QXRD can be used to determine the total mass fraction of the crystalline phases and to determine the mass fraction of total amorphous content by subtraction
For analysis of the portland cement a 5 g powder sample of material was wet-ground in 20 mL of ethanol to a mean particle size of about 7 microm Vacuum filtration removes the ethanol then the powder is dried at 60 Analysis by XRD was performed on three sub-samples run in triplicate a potassium hydroxide-sucrose extraction residue composed essentially of the silicates and periclase a salicylic acid-methanol extraction residue containing the interstitial phases periclase and alkali sulfates and a bulk (untreated) sample Selective extractions aid the phase identification 1) there are fewer phases due to the selective dissolution making identification of the remaining phases simpler 2) concentrating the remaining phases makes low-abundance phases easier to identify and include in the subsequent quantitative analysis and 3) quantitative chemical extraction provides additional data for the final quantitative analysis estimates This XRD characterization technique has been standardized in the ASTM 1365 [4] standard test method for quantitative phase abundance analysis of portland cement
By contrast identifying and quantifying the hydrated phases using X-ray diffraction techniques requires special considerations Portland cement contains virtually no amorphous material obviating the need for an internal crystalline standard Hydrated cementitious systems by contrast can contain a majority mass fraction of amorphous material The approach of adding an inert crystalline material at the time of mixing may have an unanticipated effect on the rate of hydration Alternatively adding a known amount of an internal standard to a sample of hydrated paste requires moisture stabilization to reach equilibrium with the laboratory atmosphere and this can affect the structure of those phases that are sensitive to changes in temperature and humidity (eg ettringite monosulfate etc)
In these studies these challenges were overcome in two ways For mixtures that would create portlandite from the hydration reaction TGA was used to determine the mass fraction of portlandite For the other mixtures in which the portlandite was consumed by the fly ash or slag hydration an internal standard (corundum) was added at the time of mixing To avoid moisture loss due to grinding a sample to a powder the XRD specimen was prepared by cutting a thin (2 mm) specimen and polishing the cut
4
surface The solid specimen was loaded into the XRD sample holder such that the polished surface was flush with the top of the sample holder and the sample was rotated to increase the sampling volume
The quantitative X-ray powder diffraction analysis was performed with a commercial diffractometer in reflection mode with a step size of 0016deg 2120579 For the starting powder binder materials the scans were preformed from approximately 10deg 2120579 to 77deg 2120579 (Cu Kα) with a total scan time of approximately 70 minutes For the hydrated systems the scans were performed from approximately 5deg 2120579 to 80deg 2120579 (Cu Kα) with a total scan time of approximately 80 minutes The Rietveld analysis was performed using the commercial software supplied with the X-ray diffractometer Preferred orientation corrections were limited to the portlandite and the ettringite phases
Attenuation contrast between phases and the matrix introduces a potential for bias through a complex combination of chemistry and particle size resulting in a systematic underestimation of materials that are high absorbers and an overestimation of those that are low absorbers [5] Given that the estimates of the internal standard are crucial in assessing the glassy (amorphous) fraction of the specimens matching the absorption characteristics and particle size are important as well as knowledge of the crystalline fraction of the internal standard NIST produces a set of powder diffraction standards for quantitative analysis that span the range of absorption characteristics and with a known crystalline content providing flexibility in selection of an appropriate material [6 7] The most suitable match for the cement is rutile with zincite for the fly ash and corundum for the slag
124 Scanning Electron Microscopy
Specimens for scanning electron microscopy were impregnated in epoxy cut on a diamond saw using ethanol as a lubricant polished to a mirror finish and then coated with carbon to avoid charging The scanning electron microscope (SEM) used an electron accelerating voltage 10 kV accelerating voltage approximately 3 nA probe current (adjusted to keep an X-ray dead time below 40 ) 5 min per frame scan rate to minimize backscattered electron (BE) noise and a working distance of approximately 12 mm The magnification was adjusted to retain a spatial resolution of 050 microm to 075 microm per pixel The SEM was equipped with an energy-dispersive detector to collect secondary electrons for microprobe analysis The sample was imaged using backscattered electrons (grey scale is proportional to density) and the electron micro-probe elemental analysis (grey scale is proportional to elemental content) with one image for each element analyzed
The backscattered electron image (BEI) and the X-ray microanalysis (XR) images of polished cross-sections are used for image processing (feature extraction) and image analysis (measurements) [8 9 10] Once the images are segmented a variety of measurements such as phase abundance and surface area may be determined In the BEI local brightness is proportional to the backscattered electron coefficient η [11] The reported coefficients are approximate as substitution affects the average atomic number X-ray imaging captures the element spatial distribution over the same field of view as the BEI Phase identifications are made upon the basis of relative BEI brightness bulk chemistry from X-ray imaging and morphology A partial SEM image set for the cement is presented in Figure 1 The contrast between alite (η asymp 0176) and belite (η asymp 0171) is relatively strong and their distinction is clear while that between belite and cubic aluminate (η asymp 0168) is generally too weak to distinguish these constituents However aluminate and belite have distinct chemical compositions so use of the aluminum X-ray image serves to distinguish these phases Similarly the mullite phase in the fly ash has a η similar to that of quartz but the aluminum will also serve to distinguish between the phases This may be visualized
5
through a process whereby the images are merged into a red-green-blue composite image This process will be useful in reconciling the QXRD data with fly ash and slag image sets
Figure 1 The backscattered electron image and a segmented color-composite image derived from a set of X-ray and the BEI illustrate the chemical and compositional complexity of cement and use of the image set to assign phase classes (lower-right) to a segmented image
125 Image Segmentation
Image segmentation is a process by which common elements within an image can be identified and the area fractions quantified A common use for image segmentation is the study of satellite images of farmland whereby different crop types (corn wheat oats etc) are identified and the relative areas quantified In general information is gathered using multiple ldquofiltersrdquo and the combined information is sufficient to ensure identification For example the satellite images can be taken with red green blue and infrared filters from which the composite data are used to identify the different crops in an image
The most straightforward way of segmenting the image is to use a training set of data from which to classify the remaining portion of the image For example a few of the crop types in a satellite image that can be identified with near certainty are ldquooutlinedrdquo and classified The relative contributions from each filter (red green blue and infrared) are characterized statistically and all the pixels in the image are classified depending upon the degree to which its filter components agree with the classification from the
6
training set it is possible that pixels from a training set will be re-classified and the degree to which this occurs is an indication of the robustness of the training set
For cementitious systems image segmentation is performed on images created on an SEM The ldquofiltersrdquo include the BEI where the brightness is proportional to electron density and the different elemental maps that are created using electron microprobe analysis The combination of the BEI and the chemical information gleaned from the elemental maps provide very effective means of identifying certain phases with a high degree of confidence
The entire image segmentation process is performed with the assistance of publicly available software Because the elemental maps have relatively few counts phase identification for developing a training set is facilitated by enhancing the starting images through eliminating noise and increasing the contrast This was accomplished using the ImageJ software [12] from the National Institutes of Health The segmentation was performed using the MultiSpec software [13] from Purdue University
Figure 2 is a BEI of a polished section taken from cement paste that had hydrated for 3 months In the image one can see the features of individual phases identifiable (primarily) from the greyscale Segmenting by greyscale alone however is not reliable and additional information is helpful
Figure 2 Backscattered electron image (BEI) of hydrated cement paste after 3 months of hydration
The polished section in Figure 2 is also analyzed with electron microprobe analysis For identifying phases commonly found in hydrated pastes there are six primary elements of interest calcium (Ca) silicon (Si) aluminum (Al) iron (Fe) magnesium (Mg) and sulfur (S) These ldquoelemental mapsrdquo are
7
given in Figure 3 and correspond to the entire field of view in Figure 2 From these elemental maps one can observe that some elements are distributed throughout the paste (Ca Si and S) and a number of elements appear to be localized in certain phases (Al Fe and Mg)
Ca Si Al
Fe Mg S
Figure 3 Original elemental maps of the major components for Mix 1 at 3 months hydration
The original elemental map images in Figure 3 have relative low intensity counts making phase identification difficult To reduce noise and improve contrast the following procedure summarized in Figure 4 was used to enhance each elemental map First the contrast was enhanced by expanding the recorded counts to extend throughout the 0 to 255 dynamic range and then by eliminating the pixels having an intensity less than the modal value Then noise was removed using the ImageJ despeckle filter to eliminate isolated pixels Finally to enhance the perception of uniform phases a 3x3 median filter was used to smooth out neighboring pixels
8
Original Autoscale Signal-to-Noise
Despeckle 3x3 Median Filter
Figure 4 A summary of image processing techniques used in the segmentation The bottom row demonstrates before (left) and after (right) images of the despeckle and median filter algorithms
The resulting enhanced elemental images are shown below in Figure 5 The enhanced images exhibit more distinct regions which facilitates individual phase identification These resulting images are then combined with the BEI image in Figure 2 to identify individual phases
Ca Si Al
Fe Mg S
Figure 5 Processed element images from Figure 3
9
BEI Ca Si Al Al Ca Si
Ca Ca Mg Ca Al Fe Al Ca S
Figure 6 Phase identification color maps only a portion of the entire image is shown to enhance detail The three element labels that appear over each image represent (from left to right) the red green and blue channels respectively
Using the enhanced elemental maps and the BEI MultiSpec is used to identify distinct phases and create training sets MultiSpec allows the user to overlay different combinations of three images using the red green and blue channels to represent three different images Useful combinations of elements are used like those shown in Figure 6 to ensure accurate phase identification the BEI can also be used as one of the color channels
For each three-color combination different phases are identified to create a training set for segmentation The best examples found for each phase are outlined and labeled in the image and multiple regions can be used as part of the training set for a particular phase The training set for the paste is shown in Figure 7
10
Figure 7 Phase training sets for the cement paste shown in Figure 2
Once the training set has been established the software classifies all the pixels based on the training set Each pixel is characterized by the contributions from all seven input images the BEI and the six elemental maps At each pixel the relative contribution from each image forms a type of ldquofingerprintrdquo A global ldquofingerprintrdquo is created from all the pixels in a phase training set The segmentation software then classifies all the pixels in the image including the pixels in training sets based on how ldquocloserdquo a pixels resembles the global fingerprint of the a training set All pixels are assigned to a phase and some pixels from a training set may be ldquoreassignedrdquo to a different phase The degree to which this occurs is a measure of the accuracy of the training set
Phase Assignment Sample 1 2 3 4 5 6 7 8 9 10
1 C2SC3S 0996 447 445 0 0 2 0 0 0 0 0 0 2 C4AF 1000 81 0 81 0 0 0 0 0 0 0 0 3 C-S-H 1000 131 0 0 131 0 0 0 0 0 0 0 4 CH 1000 297 0 0 0 297 0 0 0 0 0 0 5 Periclase 1000 80 0 0 0 0 80 0 0 0 0 0 6 Limestone 1000 254 0 0 0 0 0 254 0 0 0 0 7 AFt 1000 40 0 0 0 0 0 0 40 0 0 0 8 AFm 1000 88 0 0 0 0 0 0 0 88 0 0 9 Hydrotalcite 1000 29 0 0 0 0 0 0 0 0 29 0
10 Void 1000 203 0 0 0 0 0 0 0 0 0 203
Totals 1650 445 81 131 299 80 254 40 88 29 203
Accuracy 1000 1000 1000 0993 1000 1000 1000 1000 1000 1000
Figure 8 Statistics reported by MultiSpec software after a segmentation analysis
11
The segmentation analysis results based on the training set in Figure 7 are reported in Figure 8 The numbers (ldquo1rdquo through ldquo10rdquo) along the top row correspond to the numbered phases in the leftmost column The second column from the left is an indication of what fraction of the training set for that phase was ultimately classified in that phase (ie the ldquopurityrdquo of the training set) The ldquoAccuracyrdquo along the bottom row is an indication of the certainty to which phases are being classified In general enhanced images result in relatively high purity and accuracy
The resulting segmented image is shown below in Figure 9 The image shows well-defined component phases By comparison to the original BEI the segmentation appears to be consistent with what one would arrive at if using only a BEI
Figure 9 The segmented image when using processed starting images
Upon closer inspection one realizes that the image processing has eliminated a lot of fine detail associated with the sulfur-bearing phases such as monosulfate (AFm) and ettringite (AFt) These phases tend to be finely divided and uniformly distributed throughout the cement paste which is consistent with being formed through precipitation of diffusing sulfur and aluminum species
To remedy this the segmentation was repeated using the same locations of the training set of pixels but using the original (unprocessed) images The segmentation statistics given below in Figure 10 indicate a lower purity of the training set and a lower overall accuracy in the segmentation
12
Figure 10 Segmentation statistics using the same training set locations and the original (unprocessed) images
The resulting segmented image shown in Figure 11 however has identified far more AFm and AFt and these are more finely distributed throughout the paste
Figure 11 Comparison of the segmented image using unprocessed starting images and the original BEI image
The area fractions of the segmented phases are an estimate for the phase volume fraction For comparison to XRD analysis the volume fractions are converted to mass fractions using the density of the phase The volume and mass fractions for both segmented images using either the processed or the unprocessed starting images are shown in Table 1 The data in the table suggest that using the unprocessed images (based on training sets created from processed images) increases the detection limit of the more finely distributed lower volume fraction phases For the combined mass fraction of AFt and AFm the segmentation performed using the original images doubled the quantity detected
13
Table 1 The volume fraction (VF) and mass fraction (MF) of the phases identified in the segmented images for the processed and unprocessed starting images
PROCESSED UNPROCESSED VF MF VF MF
C2SC3S 0022 0028 0020 0027 C4AF 0015 0023 0021 0033 C-S-H 0648 0705 0520 0572 CH 0137 0130 0138 0133 Periclase 0007 0006 0006 0005 Limestone 0014 0016 0079 0091 AFt 0004 0003 0075 0052 AFm 0066 0086 0063 0084 Hydrotalcite 0002 0002 0004 0004
Therefore it appears that using processed starting images to identify a training set and then obtaining segmentation statistics using the original image is a viable means of identifying hydrated phases especially those that are finely distributed throughout the cement paste like AFm and AFt
126 Inductively-Coupled Plasma Spectroscopy
Inductively-coupled plasma optical emission spectroscopy (ICP-OES) was used to characterize the elemental composition of the saltstone grout pore solution This method is coupled with pore expression [14] whereby the material is cast into a 50 mm (dia) x 100 mm (long) sealable plastic cylindrical molds that were stored in re-sealable plastic bags that were kept in a walk-in chamber maintained at 25 At the desired age the specimen was removed from the plastic mold and pressed in a die using a compressive testing machine to expel the liquid remaining in the pore space the press is flushed with nitrogen to prevent carbonation during the process The captured liquid was filtered (less than 05 microm) to remove suspended particles and then diluted with water and 5 (by mass) nitric acid (HNO3)
The solutions used to standardize the ICP analysis were made with the same atomic elements that were expected in the extracted samples In addition to the elements supplied by the SWS the hydrating cementitious materials will contribute potassium calcium and silicon The Standard A solution was developed for analyzing mixtures that were made with water A separate standard was developed for systems made with the SWS Initially the expectation was that the high pH would reduce the silicon concentration to very low values Subsequent thermodynamic modeling indicated the opposite As a result there were two standard solutions developed for systems made with the SWS the initial Standard B1 (without silicon) and the subsequent Standard B2 (with silicon) In addition assuming that a significant fraction of the nitrate and nitrite concentrations of the ldquomix waterrdquo would remain in the pore solution nitrates were added to Standard B The composition of both of these standard solutions appears below in Table 2
Table 2 The composition of the three different standard solutions used to analyze the extracted pore solutions from the OPC pastes (Standard A) and the saltstone waste forms (Standard B1 and Standard B2)
14
Element Standard A (molkgw)
Standard B1 (molkgw)
Standard B2 (molkgw)
Na 004360 07329 07482 K 002597 009304 01871 S 003119 01054 008563
Ca 002451 000018 000018 Al 003719 000008 Mg 004115 Si 000408 N 03195
The solutions used to standardize the ICP were made using de-ionized water (18 MΩ-cm) and by diluting the standard solution by factors of 10 20 and 40 using a 5 (by mass) nitric acid (HNO3) solution The unknown sample measurements were repeated 3 4 or 5 times depending on the volume of sample obtained
127 Thermodynamic Modeling
Thermodynamic modeling has been developing as a tool for analyzing both hydration reactions and degradation reactions One of the most advanced thermodynamic models is a combination of thermodynamic data for the phases that may occur during hydration [15] and a Gibbs free energy minimization solver (GEMS) [16] The analyst provides these models with a type and quantity of components present (each element and if appropriate the various oxidation states of these elements) and the model determines the equilibrium distribution of species (in solution) and precipitated mineral phases Because thermodynamic models are equilibrium calculations they cannot model hydration without additional information regarding the rate that mineral phases react For a hydrating system like portland cement the analyst would supplement the thermodynamic model with a kinetic model for rate of hydration for each of the phases in a cement (ie alite belite aluminate ferrite) In addition cementitious systems typically incorporate dissolved species into the hydration products so the thermodynamic model must also have a model (eg partitioning coefficients surface complexation models) to account for these species
The thermodynamic hydration model of Lothenbach et al [17] was used to estimate the type and quantity of phases present after 3 months hydration of cementitious pastes made with water The model has equations characterizing the rate of portland cement hydration By contrast there are no established rate equations for fly ash or slag and a complementary experimental program would be required to identify the relevant material properties for establishing a model
15
2 BLENDED CEMENT PASTES
The various infrastructure elements of future nuclear facilities may be composed of the broad range of cementitious binder proportions structural elements may be composed entirely of portland cement concrete massive concrete elements may contain large quantities of fly ash andor ground granulated blast furnace slag (GGBFS) and saltstone grouts [1] may contain less than 10 percent portland cement with fly ash and slag making up the remainder Improved performance assessment (PA) tools are needed for predicting the performance of all these systems because existing tools were developed for systems composed mostly of portland cement An important component of these tools is the ability to estimate the type and quantity of hydrated phases present and the pore solution composition as these factors impact overall performance because they control among other things the buffering capacity of the material the mobility of certain radionuclides and the chemical composition of the effluent
Sophisticated computer tools for predicting transport and reaction in cementitious systems incorporate thermodynamic data for the mineral phases present Transport of ions from the external ground water changes the chemical equilibrium and the thermodynamic model adjusts the quantity of phases to maintain equilibrium Therefore an accurate assessmentprediction of the initial hydrated phases and pore solution composition is vital component to an accurate PA tool
To validate the hydrated phases prediction component of PA tools standardized materials characterization techniques are needed to identify the phases in existing materials In addition system characterization data are required for model validation Two very useful characterization tools are X-ray powder diffraction (XRD) and thermogravimetric analysis (TGA)
X-ray diffraction characterization techniques for quantifying hydrated cementitious phases differ from that for quantifying portland cement Portland cement contains virtually no amorphous material obviating the need for an internal crystalline standard Also a standardized method for portland cement characterization has been documented [4] Hydrated cementitious systems by contrast contain a considerable mass fraction of amorphous material The approach of adding an inert crystalline powder at the time of mixing may have an undesirable effect on the rate of hydration Alternatively adding a known amount of an internal standard to a sample of hydrated paste requires moisture stabilization to reach equilibrium with the laboratory atmosphere and this can affect the structure of those phases that are sensitive to changes in temperature and humidity (eg ettringite monosulfate etc)
As an alternative to adding an internal standard TGA is used to quantify the calcium hydroxide (portlandite) present in the system The water loss during conversion of portlandite to calcium oxide (lime) happens at a distinct and identifiable temperature Because other hydrated phases are losing water over the same temperature range (but at a much slower rate) the analysis of the portlandite peak must account for the background mass loss
The type and quantity of hydrated phases in paste samples are estimated by combining XRD and TGA data for systems made with blended cementitious powders for which the portland cement mass fraction varied from 100 to 10 The XRD data are used to identify the mineral phases present and the relative mass fractions of each phase TGA is used to estimate the portlandite content from which the absolute mass fraction of each phase is estimated The results are compared to estimates from a thermodynamic hydration model
Image segmentation is also considered as an alternative approach to estimating the type and quantity of hydrated phases present Backscattered electron imaging is used to indicate the phase density and
16
electron probe microanalysis images represent the relative concentration of elements The various images are used to identify individual phases within the field of view and a training set is used to classify all the pixels within the image The results are compared to phase estimates from QXRD
21 Experimental Plan
Eight cement paste mixtures were developed to span the range of cementitious binder mixtures anticipated for a saltstone grout The mass fractions of cement fly ash ground granulated blast furnace slag (GGBFS) and silica fume for each of the eight mixtures are given in Table 3 The watercementitious materials (wcm) mass ratio for all mixtures was 040
Table 3 Mixture mass fractions of the cementitious binders in each mixture
Mix Cement Fly Ash GGBFS Silica Fume 1 100 2 070 030 3 070 030 4 070 020 010 5 050 050 6 050 050 7 030 035 035 8 010 045 045
All the materials are commercial products The ASTM Type III portland cement contained 35 limestone by mass and had a Blaine fineness of 372 m2kg The fly ash is an ASTM Type C and the GGBFS and the silica fume were commercial products The oxide mass fractions were measured at a commercial laboratory using X-ray fluorescence and the values are given in Table 4 The slag contained no crystalline phases and the fly ash contained 7 quartz 5 mullite and 2 hematite by mass Also given in the table are the cement calcite content and the slag sulfide content
Table 4 Oxide mass fractions for the binders The cement calcite content and the slag sulfide content are also given
Phase Cement Fly Ash GGBFS Silica Fume CaO 0605 0246 0371 0005 SiO2 0191 0370 0373 0962 Al2O3 0050 0200 0104 0003 Fe2O3 0033 0053 0005 0000 MgO 0041 0048 0116 0001 SO3 0031 0014 0022 0000 Na2O 0001 0015 0002 0001 K2O 0007 0006 0003 0005 TiO2 0003 0016 0005 0000 CaCO3 0034 Sulfide 0010
17
The paste specimens were made by combining the dry binder adding distilled water mixing in a blender and then casting into 25 mm diameter 25 mm tall cylinders The cylinders were placed into re-sealable bags and kept in a walk-in environmental chamber maintained at 25 The samples were demolded after 24 hours (48 hours for Mix 7 and Mix 8) and placed into a sealed jar that was stored in the walk-in environmental chamber At (12 plusmn 1) weeks of hydration individual samples approximately 1 mm thick were cut from the specimen on a diamond saw using ethanol as the cutting lubricant the first 1 mm at the surface was discarded After cutting each sample the surface was cleaned with a soft plastic-bristled brush and rinsed with ethanol
22 Results
Calorimetry data for each mixture is given below in Figure 12 below Mixes 1-4 and Mix 6 had a primary exothermic peak occurring between 10 h and 15 h and each curve exhibited very slight peak separation Mix 5 Mix 7 and Mix 8 exhibited distinct secondary sulfate peak separation The response of Mix 8 was particularly unique because the primary heat peak occurred at 100h and the secondary peak occurred near 500 h
Figure 12 Calorimetry data for Mixes 1-4 (l) and for Mixes 5-8 (r) Inset shows data from Mix 8 until 800 hours of hydration
The differential scaled mass loss (minus119889120583119889119879) for each of the eight mixes after 12 weeks of hydration is given in Figure 13 The broad overlapping peaks below approximately 150 are from water being liberated from multiple hydration products containing chemically bound water Isolated individual peaks begin to appear at temperatures above approximately 150
0 50 100 150 200 Time (hr)
0
1
2
3
4
5
mW
g
Mix 1 Mix 2 Mix 3 Mix 4
0 100 200 300 Time (hr)
0
1
2
3
4 m
Wg
Mix 5 Mix 6 Mix 7 Mix 8
0 200 400 600 80000
02
04
06
08
18
Figure 13 Thermogravimetric data for Mix 1-4 (l) and Mix 5-8 (r) after 12 weeks of hydration
The peak at approximately 425 is due to loss of water in the conversion of portlandite to lime The portlandite peak prominence and separation is exploited to obtain an estimate for the portlandite content This value is then used to establish the quantity of portlandite for the XRD Rietveld analysis The portlandite mass fractions for the mixtures are reported in Table 5
Table 5 Estimated portlandite mass fraction as calculated from TGA data The parameter coefficient of variation reported by the regression software was typically less than 03 and other comparisons to XRD data were generally within 2
Mix Portlandite Mass Fraction 1 0119 2 0064 3 0063 4 0049
Mix Portlandite Mass Fraction 5 0031 6 0039 7 0019 8 -
No portlandite was detected in Mix 8 Therefore corundum (87 crystalline) was added as an internal standard To stabilize the powder mass prior to adding the corundum the sample was dried briefly in a 60 oven Prior to adding the corundum a small portion was taken and analyzed by TGA to estimate the adjusted water content so that the corundum mass fraction could be expressed as a mass fraction of the original sample
The XRD data from all 8 mixes are shown in Figure 14 after hydration for 12 weeks Sequential repetitions on a single sample showed no measurable difference in the XRD data so only a single scan is shown
19
Figure 14 XRD scans for all 8 mixes The consecutive upper curves are displaced from the immediately lower curve by a value of 5
Rietveld analysis was performed using the data from the range 8deg le 2120579 le 80deg The structural model for each cement phase was taken from Stutzman and Leigh [18] The available structural models for the hydrated phases were obtained from public web sites [19] The structural model for hemicarbonate was created using structural information from Taylor [20] The amorphous lsquohumprsquo in the range 0deg le 2120579 le 40deg was approximated by amorphous silica using the approach of Le Bail [21] Quartz was the only crystalline phase from the fly ash that remained after 12 weeks of hydration The final results of the Rietveld analysis are given in Table 6 and the refinement estimated standard deviation for each crystalline phase was rarely greater than 0002
Mix 8 required special consideration The XRD data range was expanded to 6deg le 2120579 le 80deg to quantify the straumltlingite To accommodate changes in Mix 8 that occurred while drying to prepare for the corundum addition the amounts of C2S and periclase were assumed to remain unchanged allowing the Rietveld analysis results to be expressed as a mass fraction of the original material
Furthermore the nearly equal mass fractions of unhydrated C3S in both Mix 1 and Mix 8 suggests that the uncertainty in the determination of low mass fraction phases may be greater than the 10 relative error reported by the Rietveld software Therefore phases with mass fractions below approximately 2 may be better categorized as lsquotracersquo
20
euro
euro
Table 6 Hydrated phase mass fractions after 3 months hydration at 25 as determined by Rietveld analysis Mix 1 through Mix 7 use the portlandite content (see Table 5) as the internal standard Mix 8 uses corundum as an internal standard
Mix 1 Mix 2 Mix 3 Mix 4 Mix 5 Mix 6 Mix 7 Mix 8 Amorphous 0600 0691 0674 0749 0730 0785 0751 0816 C3S 0013 0014 0041 0023 0033 0021 0017 0014 β -C2S 0060 0037 0037 0027 0040 0014 0028 0016 C3A 0002 0001 0003 0001 0008 C4AF 0027 0017 0019 0011 0009 0006 0013 0013 Portlandite 0119 0064 0063 0049 0031 0039 0019 Ettringite 0075 0041 0052 0052 0015 0019 0034 0016 Calcite 0014 0014 0018 0019 0011 0024 0016 0013 Monocarbonate 0058 0042 0040 0028 0051 0030 0038 0028 Periclase 0012 0009 0008 0007 0006 0003 0006 0006 Hemicarbonate 0015 0032 0015 0016 0016 0008 0006 0007 Quartz 0015 0003 0010 0025 0002 0017 0026 Monosulfate 0007 0018 0008 0011 0029 0018 0028 0018 Hydrotalcite 0004 0024 0032 0026 0019 Straumltlingite 0009
23 Thermodynamic Calculations
The thermodynamic calculations require an assumption for the rate of hydration for the slag and the fly ash To achieve this the fraction of each supplemental material that was ldquoconsumedrdquo was the value that resulted in the best agreement with the measured quantities of the hydration products Results from the calculations are given in Table 7
Table 7 Estimated phase mass fractions after 3 months hydration as calculated using the Lothenbach et al [17] thermodynamic hydration model
Mix 1 Mix 2 Mix 3 Mix 4 Mix 5 Mix 6 Mix 7 Mix 8 Amorphous 0362 0544 0531 0605 0673 0652 0796 0886 C3S 0026 0016 0016 0016 0012 0012 0007 0002 β -C2S 0069 0049 0049 0049 0035 0035 0021 0007 C3A 0002 0001 0001 0001 0001 0001 0001 0000 C4AF 0017 0011 0011 0011 0008 0008 0005 0002 Portlandite 0127 0054 0064 0013 0030 0027 0006 Ettringite 0144 0080 0109 0100 0041 0079 0045 0017 Calcite 0008 0003 0002 Monocarbonate 0102 0101 0085 0092 0072 0072 0015 0014 Periclase Hemicarbonate 0056 Quartz Monosulfate 0036 0051 0008
21
Hydrotalcite 0020 0009 0039 0006 0002 Straumltlingite 0037
There is general agreement between the observed and the predicted phases present The thermodynamic model assumed a greater degree of reactivity for the periclase and the calcite than otherwise expected and the quantity of quartz could have been approximated by assuming zero reactivity Although the quantity of each phase differs between the measured and predicted values this is due in large part to uncertainty in estimating the degree of reactivity for each of the supplementary materials
22
24 Image Segmentation
The approach of developing training sets using processed images and performing the segmentation using the original images was repeated for Mix 1 (OPC paste) Mix 2 (30 fly ash) and Mix 3 (30 slag) The BEI image and the segmented image (using non-processed images for the training set) for all three mixtures are shown in Figure 15 Figure 16 and Figure 17 For all three mixtures the segmentation process is able to identify the more finely distributed phases within the hardened cement paste
Figure 15 Backscattered electron image (BEI) and segmented image of the fly ash cement paste in Mix 1 after 3 months hydration
Figure 16 Backscattered electron image (BEI) and segmented image of the fly ash cement paste in Mix 2 after 3 months hydration
23
Figure 17 Backscattered electron image (BEI) and segmented image of the slag cement paste in Mix 3 after 3 months hydration
A comparison of the result for the mass fraction as determined by XRD to the mass fraction estimated from image segmentation is given in Table 8 There is general agreement between the two methods For the sulfate-bearing phases however the difference between the estimated values is nearly a factor of ten for Mix 1 and Mix 2
24
Table 8 Estimated mass fractions from quantitative XRD (QXRD) and imaging
QXRD Imaging Mix 1 Mix 2 Mix 3 Mix 1 Mix 2 Mix 3
25 Discussion The methods used here for characterizing hydrated phases will require further development and refinement Using amorphous silica to approximate the amorphous phases is useful in representing the XRD data background and the results generally agree with SEM image segmentation Also using TGA to estimate portlandite content will have limited applicability in the study of blended systems with very little portland cement because hydration processes in these mixes will eventually consume all the portlandite
The advantage of the image segmentation procedure is the ability to classify a number of amorphous phases By comparison the XRD process estimates total amorphous content by subtraction of the crystalline phases More specifically XRD can only lump together all amorphous phases where as image segmentation can classify cementing glassy phases (fly ash or slag) differently from the calcium silicate hydrate gel (C-S-H) However because the effort required for SEM image segmentation is very large in relation to the information obtained this technique will not be used to characterize the saltstone mixtures
26 Summary
Combining thermogravimetric data with X-ray diffraction data shows promise for characterizing the type and quantity of hydrated phases in blended cement systems The phases identified are consistent with current thermodynamic models but further research is needed to quantify the rate of reaction of fly ash and slag Further experimentation is needed however to independently validate the quantity of phases observed through XRD and TGA Image segmentation shows promise in being able to quantity the degree of fly ash and slag hydration but independent chemical analysis is needed to validate the results
25
3 SALTSTONE GROUT
There exist a number of computer tools that can be used to assess the performance of a cementitious barrier The most useful models are those like 4sight [22] that incorporate the relevant physics and chemistry of the interactions between the material and its environment These processes include both transport (through a non-ideal aqueous pore solution) and reaction (with ion-exchange surface complexation etc) For these types of models the material composition (type and quantity of phases) constitutes the initial condition and the environment (temperature humidity dissolved species in the groundwater etc) constitutes the (potentially time-dependent) boundary condition
An important part of the predictive nature of these computer tools is the ability to predict the initial material composition due to hydration The thermodynamic ldquohydration modelsrdquo convert the mineral phase composition of the binding phases and along with an additional model for the rate of hydration for each phase predict the type and quantity of phases produced this differs from a hydration model that can also predict the microstructure There exist models for the rate that cement phases hydrate [23] and for the rate of slag hydration [17] but there are no reliable models for the rate of fly ash hydration These models have been validated for mixtures composed mostly of portland cement
Some engineered barrier applications however use cementitious blends composed of very little portland cement and may use a treated salt solution as the ldquomix waterrdquo The concentrated salt supernate and crystallized saltcake are to be treated and then stabilized as a cementitious saltstone grout [1] formulated by the Savannah River National Laboratory (SRNL) for final disposal in vaults at the Saltstone Disposal Facility at the Savannah River Site (SRS) These grout mixtures may contain as little as 5 portland cement with the remainder of the binder being equal portions of (ASTM Class F) fly ash and slag Moreover the supernate contains among other salts sodium hydroxide sodium nitrate and sodium nitrite [24] Therefore not only is this solution highly alkaline it contains nitrates and nitrites which are typically not found in thermodynamic databases for cementitious systems
In anticipation of these challenges the NRC has become a member of the Cementitious Barriers Partnership (CBP) [25] The CBP works to improve the understanding and develop tools for predicting the long-term structural hydraulic and chemical performance of cementitious materials and waste forms used primarily in nuclear waste disposal The CBP objective is to develop a set of computational software tools that are expected to reduce the uncertainties of current methodologies for performance assessment As part of the CBP program there are software tools for estimating the mineral phase composition of the starting material but none of these tools have been validated on mixtures having such low portland cement contribution to the total binder
In support of the CBP program the National Institute of Standards and Technology (NIST) characterized the mineral composition of a set of pastes that mimic the type of saltstone grout being developed for SRS These pastes contained the same cement slag and fly ash used at SRNL and the ldquomix waterrdquo was an approximation to the SRNL surrogate waste for physical testing [24] that contains no radionuclides The raw materials and the hydrated pastes were characterized using quantitative X-ray powder diffraction (QXRD) and thermogravimetric analysis (TGA) to provide direct estimates of the bulk mineralogical composition and texture of the materials The pore solution composition was characterized by elemental analysis using inductively-coupled plasma optical emission spectroscopy The results represent a validation data set for the THAMES [26] microstructural development model that is used to compute realistic transport and mechanical properties for cement paste microstructures as a function of time
26
31 Experimental Plan
The portland cement fly ash and slag were obtained from SRNL and the composition of the surrogate waste solution was based on a SRNL report on the properties of the saltstone grouts [24] These mixtures are different from typical portland cement concrete formulations in two important ways very low cement content and a ldquomix waterrdquo that is a concentrated solution Anticipating the effects due to either of these differences is a formidable challenge to the computer models To bridge the gap paste mixtures were developed having two levels of cement content and two levels of ldquomix waterrdquo composition (water or SWS)
In addition two series of pastes were made having different watercementitious mass ratio (wcm) The grout formulated by SRNL [24] had a wcm (neglecting the dissolved solids in the waste solution) of 060 At this water content there can be considerable sedimentation and bleed water If sedimentation and bleeding do occur there will be a gradient of properties through the paste as the effective wcm decreases with depth Therefore mixtures were also made with a 040 wcm ratio so that comparisons could be made to systems for where there should have been relatively little bleeding The binder compositions of all mixture designs considered are given in Table 9 and the composition of the SWS is described below
Table 9 Binder proportions for mixtures at two watercementitious material mass ratios (wcm) neglecting the dissolved salts in the surrogate waste solution The quantity of cement fly ash and slag are designated by the corresponding mass fraction
wcm Water SWS Cement Fly Ash Slag Sample Name
040 Water 100 40-0-100 SWS 100 40-1-100 SWS 010 045 045 40-1-055
060 Water 100 60-0-100 SWS 100 60-1-100 SWS 010 045 045 60-1-055
32 Surrogate Waste Solution (SWS)
The composition of the SWS was based on that used by Dixon et al [24] The salts used and the corresponding concentrations are given in Table 10 Using the reported solution specific gravity of 1248 [24] the molar (molL) concentrations were converted to molal (molkgw) units to facilitate thermodynamic calculations
Table 10 Composition of the surrogate waste solution there are 08866 kg of water in each liter of solution
Salt molL molkgw NaOH 2866 3233 NaNO3 1973 2225 NaNO2 0485 0547
27
Na2CO3 0118 0133 Na2SO4 0055 0062 Al(NO3)3 9H2O 0114 0129 Na2H(PO4) 12H2O 0007 0008
The component composition of the SWS is given in Table 11 The component concentrations are provided to facilitate thermodynamic modeling because the calculations are performed on a component basis
Table 11 The component composition of the surrogate waste solution The numbers between parentheses represent the oxidation state this is the notation used in a number of thermodynamic databases
Component Molarity (molL) Molality (molkgw) Na 5684 6411 N(5) 2315 2611 N(3) 0485 0547 C 0118 0133 S(6) 0055 0062 Al 0114 0129 P(5) 0007 0008 H 0007 0008
33 Cementing Materials
The portland cement the fly ash and the slag obtained from SRNL included the certification report that the material producer supplies with the material The materials were the same as those used to develop the saltstone mixture and they have been characterized by SRNL [27]
The primary means of characterizing the cementing materials are the oxide contents and the crystalline mineral content The oxide content can be determined from X-ray fluorescence measurement and the crystalline phase identification and quantification can be determined from X-ray diffraction coupled with Rietveld analysis
331 Portland Cement The portland cement was an ASTM Type III containing 18 limestone (93 as CaCO3) The Blaine fineness was 393 m2kg and the loss on ignition was 18 The chemical composition provided in the mill certificate is given in Table 12 below
Table 12 Oxide composition of the ASTM Type III cement from the mill certificate report based on a single measurement
Oxide Mass Fraction () CaO 643 SiO2 203
28
Al2O3 50 Fe2O3 38 SO3 30 MgO 12 CO2 07 Na2Oe 048
The cement was analyzed to determine the mineral phases present The analysis was conducted using X-ray powder diffraction according to the standardized procedure described in ASTM C1365 [4] The results of the analysis are shown in Table 13 below The detection of syngenite was confirmed by the thermogravimetric analysis (discussed below)
Table 13 Portland cement mineral phase composition as determined by X-ray diffraction with Rietveld analysis (ASTM C1365) uncertainty expresses one standard deviation
Phase (XRD) Mass Fraction () C3S 562 plusmn 24 C2S 151 plusmn 16 C3A 34 plusmn 05 C4AF 131 plusmn 06 Gypsum 19 plusmn 03 Bassanite 10 plusmn 05 Calcite 27 plusmn 04 Syngenite 17 plusmn 01 Portlandite 10 plusmn 08 Amorphous 49 plusmn 14
Additional analysis of the portland cement was conducted using the TGA data shown in Figure 18 In the figure the distinguishable peaks for syngenite portlandite and limestone are denoted by arrows For the analysis the portlandite and limestone peaks are modeled using the symmetrical error function and the syngenite peak is modeled using the asymmetrical logistic function
29
0985
0987
0988
Figure 18 Relative remaining mass micro as a function of temperature for the portland cement Individual peaks are labeled the mass loss near 100 is due to water loss from C-S-H and other hydrated phases
The presence of syngenite (K2Ca(SO4)2middot(H2O)) and portlandite (Ca(OH)2) suggest that the cement has been exposed to a humid environment for an extended period The extent to which this has occurred however was characterized through a TGA regression analysis The results of the regression analysis for each peak are shown below in Figure 19 through Figure 21 below
0003
0002
micro-b
(T) p(T)
350 400 450 500 Temperature (oC)
b(T)
p(T)
b(T)+B0
350 400 450 500 Temperature (oC)
0986micro
0001
0000
Figure 19 Analysis of the portlandite peak in the cement (left) regression to the TGA data showing the background function b(T) and the peak function p(T) (right) the measured data minus the background function compared with the peak function (the two lie nearly on top of one another)
30
0984
0990
The result of the regression of the portlandite peak is shown in Figure 19 The error function was chosen for the peak function because the data appear symmetrical Upon determining the best fit to the data the left figure in Figure 19 shows the measured data (fuzzy line) the background function (along the lower flat portion of the curve) the background function plus the parameter 1198610 (dashed line) the peak function 119901(119879) and the overall function 119891(119879) the function 119891(119879) lies nearly on top of the measured data and is difficult to see The right figure in Figure 19 shows the measured data minus the background function 119887(119879) and the peak function 119901(119879) the two lie nearly on top of one another For portlandite (7409268 gmol) the mass loss is due to water (1801528 gmol) evaporation Therefore the mass fraction of portlandite is equal to 1198610(74092681801528)
An advantage of using regression is that the regression software reports estimated parameters along with the associated uncertainty Based on the estimated value for 1198610 and its uncertainty the estimated mass fraction of portlandite was (00107 plusmn 00002) where the uncertainty represents one standard deviation and the decomposition temperature 1198790 was equal to approximately 411 For comparison purposes the estimated portlandite mass fraction determined by XRD (Table 13) was (0010 plusmn 0008)
000150991
00010
150 200 250 300 350 Temperature (oC)
b(T) + B0
p(T)b(T)
150 200 250 300 350
micro-b
(T) p(T)
00005
0988
000000987
Temperature (oC)
Figure 20 Analysis of the syngenite peak in the cement (left) regression to the TGA data showing the background function b(T) and the peak function p(T) (right) the measured data minus the background function compared with the peak function (the two lie nearly on top of one another)
The result of the regression of the syngenite peak is shown in Figure 20 The curves in Figure 20 are the same as those shown in Figure 19 For these data however the peak was fit with the logistic function because the peak was not symmetric Using the same regression analysis as for the portlandite peak the estimated mass fraction of syngenite was (00208 plusmn 00003) and the parameter 1198790 was equal to approximately 227 For comparison purposes the estimated syngenite mass fraction determined by XRD (Table 13) was (0017 plusmn 0001)
0989micro
31
0975
0980
0985
micro-b
(T) p 1
(T)+p 2
(T)
500 600 700 Temperature (oC)
micro
b(T)
p1(T) p2(T)
b(T) + B0
0015
500 600 700 Temperature (oC)
0010
0005
0970 0000
Figure 21 Analysis of the limestone peak in the cement (left) regression to the TGA data showing the background function b(T) and the two peak functions p1(T) and p2(T) (right) the measured data minus the background function compared with the sum of the two peak functions (the two lie nearly on top of one another)
The result of the regression of the limestone peak is shown in Figure 21 The mass loss due to the decomposition of the limestone was resolved into two distinct peak functions both regressed against individual complementary error functions This double-peak mass loss is attributed to the presence of a dolomitic limestone The estimated mass fraction of limestone (as calcite) was (00315 plusmn 00005) and the peak location parameters were approximately 605 and 663 For comparison purposes the estimated calcite mass fraction determined by XRD (Table 13) was (0027 plusmn 0004)
332 Fly Ash
The fly ash was an ASTM Class F with a specific gravity of 238 and 178 (by mass) was retained on a 325 (45 microm) sieve The chemical composition data provided by the material supplier are provided in Table 14 below According to these values more than 90 of the total mass is composed of silicon aluminum and iron oxides
Table 14 Fly ash oxide composition reported in the mill certificate based on a single measurement
Oxide Mass Fraction () SiO2 5309 Al2O3 2797 Fe2O3 1012 CaO 139 MgO 163 SO3 010 Na2Oe 059
32
The fly ash was also analyzed at NIST using X-ray powder diffraction to identify and quantify the crystalline mineral composition and the results are shown in Table 15 below The major crystalline minerals are mullite and quartz
Table 15 Fly ash mineral phase composition as determined by X-ray powder diffraction and Rietveld analysis
Phase (XRD) Mass Fraction ()
Assumed Chemical Composition
Mullite 183 plusmn 04 (A2O3)2(SiO2) Quartz 73 plusmn 04 SiO2 Hematite 22 plusmn 01 Fe2O3 Magnetite 10 plusmn 00 (Fe3O4) Amorphous 712 plusmn 08
333 Slag The slag certification report did not include the oxide content and a lack of any quantifiable peaks in the XRD data suggested that the material lacked crystalline phases
334 Previous Reports
For comparison purposes and to provide supplementary information about the slag the oxide analysis of Harbour et al [27] for all three materials is repeated in Table 16 below The values for portland cement and fly ash are in agreement with the mill certificates
Table 16 Oxide percentages reported by Harbour et al [27 (Table 3-5)] for the portland cement the fly ash and the slag
Oxide Portland Cement Fly Ash Slag
Batch 1 Batch 2 Batch 1 Batch 2 Batch 1 Batch 2 Al2O3 54 52 286 286 84 66 CaO 649 630 07 06 385 350 Fe2O3 37 38 60 56 04 03 K2O 05 07 26 25 03 05 MgO 12 12 09 08 129 131 Na2O 01 02 03 04 03 03 SO3 32 33 01 03 10 25 SiO2 205 203 542 568 379 404 TiO2 03 03 16 14 04 03 Volatiles 00 00 25 14 00 00 Total 998 980 975 984 1001 990
33
34 Mixture Designs
The saltstone grout to be used is a combination of cement fly ash slag and an alkaline solution for which there is relatively little engineering experience in the concrete construction industry As a result hydrated phase models would have to make a dramatic leap between typical mixes used today and the proposed mixture To help span this conceptual gap a progressive series of mixture designs was chosen starting from mixtures that existing models could use as a frame of reference
The mixture designs were divided between two waterbinder (mass basis) ratios The reference mixtures were ordinary portland cement (OPC) and water The three spanning mixtures were OPC and synthetic waste solution (SWS) a ternary blend and water and a ternary blend and SWS The mixture designs are shown in Table 17 and Table 18 and are proportioned to make approximately 500 mL of paste
Table 17 Mixture designs for wcm=040 pastes
Mass (g)
40-0-100 40-1-100 40-0-055 40-1-055 Water 2807 2560 2633 2411
NaOH 00 339 00 319 NaNO3 00 495 00 467 NaNO2 00 99 00 93 Na2CO3 00 37 00 35 Na2SO4 00 23 00 22 Al(NO3)3 9H2O 00 126 00 119 Na2H(PO4) 12H2O 00 07 00 07
Cement 7018 6547 658 617 Fly Ash 0 00 2962 2776 Slag 0 00 2962 2776
Table 18 Mixture designs for wcm=060 pastes
Mass (g)
60-0-100 60-1-100 60-0-055 60-1-055 Water 3288 2964 3127 2830
NaOH 00 392 00 374 NaNO3 00 574 00 548 NaNO2 00 114 00 109 Na2CO3 00 43 00 41 Na2SO4 00 27 00 26 Al(NO3)3 9H2O 00 146 00 140 Na2H(PO4) 12H2O 00 09 00 08
Cement 5479 5054 521 483 Fly Ash 00 00 2345 2171 Slag 00 00 2345 2171
34
The fresh pastes hydrated under sealed curing conditions to the extent possible Each mixture was cast into 25 mm diameter 25 mm tall cylindrical plastic molds The molds were sealed in plastic bags and the samples were demolded after 24 hours placed into airtight plastic jars and stored at 25 until the time of testing The wcm=060 pastes were rotated (at approximately 1 rotation every 10 seconds) during the first 24 hours and then demolded The demolded samples were placed into sealed high-density polyethylene (HDPE) jars and stored in a walk-in environmental chamber maintained at 25
35 Results
351 Calorimetry
The calorimetry results for these mixtures are shown in Figure 22 and are similar to the results from the previous study shown in Figure 12 The ordinary portland cement (OPC) systems (0-100) displayed the common overlapping peaks The OPC pastes containing SWS (1-100) were accelerated by the alkalinity of the SWS as one would expect The saltstone mixtures (1-055) exhibited a heat peak at approximately the same time as the OPC peak but the peak was much lower and much wider The water and ternary blend is only included for the 040 wcm mixture because the corresponding 060 wcm mixture did not react appreciably during the same time frame (as might be expected) The 040 wcm water and ternary blend paste exhibits a significantly delayed peak suggesting that the material would remain in a liquid state for a very long time
Figure 22 Heat generation rates (Wg) as a function of time (hours) for the 040 wcm pastes (left) and the 060 wcm pastes (right)
Because the blended systems made with water (0-055) were so significantly delayed in the hydration data from these mixtures is omitted from the subsequent results The very low portland cement content contributed to a very low alkalinity that delayed the hydration of the Class F fly ash and the slag Therefore there is very little to glean from any subsequent analysis of these systems
35
352 Thermogravimetric Analysis
The hydrated pastes were cut on a diamond saw using ethanol as a lubricant to create discs that were 1 mm to 2 mm thick These discs were gently broken into pieces using a mortar and pestle Two of these pieces were selected (total mass approximately 50 mg) and placed into the TGA sample holder
The TGA data for the mixtures are shown in Figure 23 through Figure 25 Each figure shows a series of TGA curves for a particular mixture with each curve representing a different age The large peak below 250 is the loss of free water and the decomposition of most of the hydration products The peak between 400 and 500 is due to portlandite (Ca(OH)2) decomposition The barely perceptible peak at 650 in Figure 23 is due to limestone calcination
040 040
40-0-100 60-0-100 030 030
-dmicro
dT
(1 o C
)
020 -dmicro
dT
(1 o C
)
010
020
010
0000000 200 400 600 800 1000 0 200 400 600 800 1000
Temperature Temperature
Figure 23 Differential relative mass loss (dmicrodT) as a function of temperature () for pastes made with portland cement and water wcm=04 (left) wcm=060 (right) Each line corresponds to a different age 7 d 14 d 28 d and 56 d
040 040
40-1-100 60-1-100 030 030
-dmicro
dT
(1 o C
)
-dmicro
dT
(1 o C
)
020
010
020
010
0000000 200 400 600 800 1000 0 200 400 600 800 1000
Temperature Temperature
Figure 24 Differential relative mass loss (dmicrodT) as a function of temperature () for pastes made with portland cement and surrogate waste solution wcm=04 (left) wcm=060 (right) Each line corresponds to a different age 7 d 14 d and 28 d
36
The portlandite content of the OPC mixtures were estimated using the process described previously and the results are given in Table 19 The regression process reports an uncertainty for the mass loss that is propagated to the estimated portlandite content After 8 weeks of hydration at 25 the mass fraction of portlandite is relatively constant
Table 19 Portlandite mass fraction as determined by TGA analysis for the four portland cement mixtures The uncertainty represents the measurement uncertainty having a coverage factor of one standard deviation Age 40-0-100 60-0-100 40-1-100 60-1-100 7d 01321 plusmn 00003 01350 plusmn 00004 01050 plusmn 00028 01146 plusmn 00000 14d 01375 plusmn 00005 01502 plusmn 00007 01081 plusmn 00016 01224 plusmn 00006 28d 01350 plusmn 00003 01568 plusmn 00006 01248 plusmn 00013 01416 plusmn 00009 56d 01433 plusmn 00004 01502 plusmn 00004 01370 plusmn 00009 01458 plusmn 00008
The TGA data for the mixtures that were composed of the ternary mixtures are shown in Figure 25 Because of the supplemental mineral admixtures present there are no peaks corresponding to portlandite Moreover there would be far too little limestone present to use it as an internal standard
000
010
020
030
040
-dmicro
dT
(1 o C
)
40-1-055
000
010
020
030
040
-dmicro
dT
(1 o C
)
60-1-055
0 200 400 600 800 1000 0 200 400 600 800 1000
Temperature Temperature Figure 25 Differential relative mass loss (-dmicrodT) as a function of temperature () for pastes made with portland cement paste fly ash slag and surrogate waste solution wcm=04 (left) wcm=060 (right) Each line corresponds to a different age 7 d 14 d and 28 d
For the samples containing the SWS there is a significant peak located near 600 that does not appear in samples without the SWS Upon studying the corresponding X-ray diffraction data for these samples it was determined that these peaks correspond to the decomposition of nitratine (sodium nitrate) The temperature at which this mass loss occurred was consistent with reported decomposition temperatures [28]
37
353 X-ray Powder Diffraction
The X-ray powder diffraction samples were cut from the smaller cylindrical samples using a diamond saw with ethanol as the lubricant A circular disc approximately 2 mm thick was cut from the specimen and the tested surface was gently polished with a 600-grit abrasive paper using ethanol as the lubricant The polished sample was mounted onto a sample holder and the sample was rotated to maximize the sampling area The X-ray diffraction data for the different mixtures with the data from each age offset from one another are shown in Figure 26 through Figure 28 below
38
Figure 26 X-ray powder diffraction data showing counts as a function of angle 2120579 for pastes made with portland cement and water wcm=04 (left) wcm=060 (right) Data after 7 d are offset for comparison purposes
A number of the peaks appearing in the ordinary portland cement pastes in Figure 26 also appear in the portland cement and SWS mixtures in Figure 27 The most prominent peaks are the portlandite peaks near 18deg 1205792 and 35deg 2 120579120579 Also although the monocarbonate peaks (below 12deg 2 ) appear in both of these mixtures the effect of the SWS is to suppress these peaks
Figure 27 X-ray powder diffraction data showing counts as a function of angle 2120579 for pastes made with portland cement and surrogate waste solution wcm=04 (left) wcm=060 (right) Data after 7 d are offset for comparison purposes
39
Figure 28 X-ray powder diffraction data showing counts as a function of angle 2120579 for pastes made with portland cement fly ash slag and surrogate waste solution wcm=04 (left) wcm=060 (right) Data after 7 d are offset for comparison purposes
The data in Figure 28 for specimens having both low portland cement content and SWS exhibit had certain unique features The higher glass content of these specimens is evident by the more prominent ldquohumprdquo between 20deg 2120579 and 35deg 2120579 Moreover the structure of the peaks below 12deg 2120579 has changed in character the two peaks have become one peak and an extension of the scan angle (uppermost scan on the left side of Figure 28) reveals yet another ldquopeakrdquo The peak near 12deg 2 is in a location that is 120579consistent with tobermorite but the peak width is much broader than would be expected for tobermorite The peak found near 6deg 2120579 has not been identified and further study is needed
The excessive peaks near 30deg 2120579 and 35deg 2120579 correspond to nitratine [29] These peaks were consistent with the appearance of the TGA peaks near 600 The existence of nitratine was consistent with chemical shrinkage (consumption of free water) during hydration that would increase the concentration of nitrate species possibly bringing it near a concentration sufficient to precipitate nitratine because the initial sodium nitrate concentration within the SWS was already very large A subsequent analysis of the hydrated system by successive rapid XRD scans is discussed below
354 Nitratine
Further analysis was made of the peak near 29deg 2120579 In hydrated systems made from only portland cement the broader peak near this angle would be attributed to an ldquoorderedrdquo C-S-H or to calcite (for a cement made with limestone) The ldquosharprdquo peak that extends above the broader peak is consistent with the presence of nitratine (sodium nitrate) [29] A contribution from nitratine in the XRD data is consistent with the appearance of the TGA peaks near 600 To determine whether the nitratine existed within the hardened paste prior to sample preparation repeated rapid XRD scans were conducted on a freshly cut specimen (mixture 60-1-055 after 16 weeks of hydration) and the results are shown in Figure 28 The six successive scans shown in the figure are each 20 minutes apart representing a total duration of approximately 100 minutes The growing nitratine peaks are located near 29deg 2120579 32deg 2120579 and 39deg 2120579 the precipitation of nitratine leads to preferred orientation due to its rhombohedral habit Moreover the estimated nitratine mass fraction based on Rietveld analysis was less than 3 for the scan with the
40
most prominent nitratine peak so the XRD method is sensitive to nitratine Given that each of the scans in the previous XRD figures occurred over a span of 80 minutes the height of the nitratine peak in those scans was a function of how long the specimen was exposed to the laboratory environment prior to being analyzed by XRD Therefore it was concluded that the appearance of nitratine peaks in both the TGA and the XRD data are artifacts of the sample drying during testing and not due to the presence of nitratine within the paste prior to testing
Figure 29 Six successive X-ray powder diffraction scans of the 60-1-055 mixture after 16 weeks of hydration Successive scans are 20 minutes apart The nitratine peaks are near 29deg 2120579 32deg 2120579 and 39deg 2120579
355 Rietveld Analysis
The results of the Rietveld analyses are shown in Table 20 below One important observation is that the phases that were identified are commonly seen in different types of cementitious materials that have been studied in the past Another important observation is the extent of sulfate hydration phases in the saltstone mixtures Particularly there are relatively normal quantities of ettringite and monocarbonate present even though the SWS contained a significant quantity of sulfate It is quite likely that the high pH (which suppresses the calcium and aluminum concentrations in the pore solution) coupled with the high ionic strength of pore solution contributed to decreased ettringite and monocarbonate precipitation
41
Table 20 Results of Rietveld analysis for the six mixtures The values reported are the mass fractions and the numbers in parentheses represent the uncertainty (one standard deviation) in the last two digits
40-0-100 7d 14d 28d 56d 12w Alite 00494 (34) 00499 (32) 00369 (31) 00291 (29) 00303 (28) Belite 00886 (60) 00588 (48) 00623 (53) 00443 (46) 00298 (39) Aluminate Ferrite 00844 (61) 00835 (65) 00835 (61) 00826 (59) 00690 (54) Portlandite 01321 (32) 01375 (43) 01350 (40) 01433 (34) 01390 (33) Ettringite 00679 (30) 00812 (36) 00647 (34) 00719 (32) 00712 (31) Hemicarbonate 00148 (12) 00171 (12) 00160 (14) 00161 (14) 00107 (13) Monocarbonate 00384 (59) 00365 (45) 00458 (47) 00582 (45) 00502 (41) Amorphous 05244 (118) 05357 (113) 05559 (112) 05546 (104) 05998 (96)
60-0-100c 7d 14d 28d 56d 12w Alite 00366 (32) 00354 (46) 00184 (48) Belite 00740 (65) 00347 (65) 00411 (78) Aluminate 00028 (12) 00029 (12) 00024 (11) Ferrite 00764 (57) 00778 (62) 00727 (57) Portlandite 01406 (29) 01441 (40) 01448 (32) Ettringite 00788 (30) 00839 (35) 00909 (34) Hemicarbonate 00207 (11) 00237 (12) 00176 (11) Monocarbonate 00521 (42) 00664 (44) 00705 (39) Corundum 00579 (19) 00520 (21) 00562 (20) Amorphous 04600 (112) 04792 (125) 04853 (126)
40-1-100 7d 14d 28d 56d 12w Alite 01275 (43) 01206 (41) 00896 (36) 00735 (30) 00576 (27) Belite 00604 (65) 00443 (55) 00605 (51) 00385 (41) 00285 (32) Aluminate 00029 (11) 00039 (10) 00046 (10) 00039 (99) Ferrite 00569 (59) 00576 (57) 00593 (55) 00603 (54) 00532 (49) Portlandite 01050 (33) 01081 (32) 01248 (39) 01370 (37) 01222 (33) Ettringite 00044 (26) 00038 (20) 00096 (35) 00032 (28) 00117 (36) Hemicarbonate 00053 (12) 00065 (13) 00027 (13) Monocarbonate 00199 (38) 00189 (45) 00109 (44) Amorphous 06429 (107) 06617 (97) 06517 (107) 06836 (140) 07268 (93)
60-1-100c 7d 14d 28d 56d 16w Alite 01010 (40) 00639 (34) 00499 (31) 00375 (66) Belite 00551 (67) 00556 (75) 00427 (75) 00060 (23) Aluminate Ferrite 00687 (60) 00449 (69) 00441 (58) 00435 (59) Portlandite 01085 (34) 01122 (37) 01184 (36) 01258 (38) Ettringite 00043 (29) 00108 (39) 00023 (18) 00043 (31)
42
Hemicarbonate 00109 (15) 00071 (14) 00084 (14) 00057 (13) Monocarbonate 00568 (44) 00530 (49) 00543 (47) 00492 (41) Corundum 00513 (22) 00431 (22) 00407 (19) 00421 (19) Amorphous 05364 (130) 06084 (143) 06324 (128) 06942 (124)
40-1-055c 7d 14d 28d 56d 16w Alite 00216 (19) 00216 (24) 00209 (26) 00170 (56) Belite 00069 (24) 00041 (25) 00026 (27) 00059 (36) Aluminate Ferrite 00174 (36) 00103 (28) 00105 (31) 00136 (32) Portlandite Ettringite Hemicarbonate 00077 (12) 00094 (13) 00091 (14) 00092 (16) Monocarbonate 00208 (36) 00164 (36) 00203 (38) 00165 (35) Corundum 00449 (21) 00449 (15) 00449 (18) 00449 (61) Quartz 00289 (15) 00216 (11) 00234 (12) 00232 (32) Mullite 21 00638 (32) 00509 (23) 00543 (27) 00541 (74) Amorphous 08250 (81) 08594 (69) 08522 (78) 08539 (142)
60-1-055c 7d 14d 28d 56d 16w Alite 00261 (30) 00200 (34) 00259 (30) 00192 (18) Belite 00090 (99) 00072 (99) 00072 00052 (99) Aluminate Ferrite 00056 (30) 00060 (26) 00067 (24) 00048 (31) Portlandite Ettringite Hemicarbonate 00081 (14) 00086 (17) 00079 (13) 00141 (18) Monocarbonate 00143 (41) 00108 (35) 00148 (38) 00134 (45) Corundum 00890 (46) 00890 (14) 00890 (34) 00890 (44) Quartz 00164 (13) 00173 (28) 00173 (15) 00178 (12) Mullite 21 00378 (27) 00423 (67) 00385 (35) 00413 (27) Amorphous 08238 (128) 06685 (136) 05447 (118) 08255 (127)
356 Pores Solution Analysis
The results from the pore solution analyses of the OPC pastes appear in Table 21 and Table 22 The limited number of observations from the 040 wcm OPC paste is due in part to the limited ability to extract useable samples from these relatively low wcm systems By comparison the 060 wcm OPC pastes yielded useable samples after 113 days of hydration
43
Table 21 Pore solution composition of the 040 wcm paste made with only portland cement numbers in parentheses indicate one standard deviation of uncertainty
40-0-100 (mmolkgw)
Element 7 days 16 days K 4633 (28) 4072 (17) Na 1416 (13) 16735 (086) S 1248 (042) 1441 (004) Ca 363 (011) 1924 (0023) Al 0079 (0005) 00910 (00015)
Table 22 Pore solution composition of the 060 wcm paste made with only portland cement numbers in parentheses indicate one standard deviation of uncertainty
60-0-100 (mmolkgw)
Element 8 days 16 days 28 days 113 days 360 days K 2621 (30) 2301 (18) 2506 (15) 2811 (12) Na 7374 (047) 9805 (092) 16932 (099) 10177 (014) S 324 (011) 4327 (0078) 811 (021) 4194 (0057) Ca 3112 (0026) 2396 (0026) 2761 (0027) 2765 (0041) Al 0069 (0002) 00637 (00003) 00141 (00019) 00752 (00018) Mg 00085 (0001)
The results from the pore solution analyses of the saltstone waste forms appear in Table 23 and Table 24 For saltstone waste form samples the challenge in collecting usable samples was the converse of the OPC pastes The solid microstructure developed sufficiently slowly that useable samples could not be obtained until there was sufficient mechanical strength to resist the entire sample from flowing through the outlet tube on the die For the 040 wcm waste forms usable samples were not attainable until after 14 d hydration and the 060 wcm waste forms did not yield usable samples until after 90 d hydration The advantage of this slower microstructural development was that samples could be obtained at later ages than for the OPC pastes In the case of the 06 wcm waste form samples were obtained out past one year of hydration
Table 23 Pore solution composition of the 040 wcm paste made with fly ash slag and surrogate waste solution numbers in parentheses indicate one standard deviation of uncertainty
40-1-055 (mmolkgw)
Element 14 days 34 days (HNO3)
34 days (DI Water)
86 days
K 1861 (25) 2114 (38) 1985 (19) 2389 (49) Na 2482 (46) 3380 (48) 3478 (63) 3284 (16) S 1677 (13) 1810 (20) 1865 (39) 1974 (64) Ca 0335 (0006) 0151 (002) 0179 (005) 0205 (0002) Al - -Si 887 (15) 9078 (037)
44
Table 24 Pore solution composition of the 060 wcm paste made with fly ash slag and surrogate waste solution numbers in parentheses indicate one standard deviation of uncertainty
60-1-055 (mmolkgw)
Element 91 days 126 days (HNO3)
126 days (DI Water)
391 days (HNO3)
391 days (DI Water)
K 1524 (63) 1994 (17) 19813 (82) 23588 (81) 23766 (58) Na 3267 (30) 3260 (40) 3311 (44) 3287 (45) 3381 (79) S 1720 (70) 1862 (14) 2018 (13) 2266 (21) 2454 (16) Ca 1154 (0009) 0546 (0) 0262 (003) 167 (11) 0195 (003) Al -Si 12890 (35) 13911 (22) 7873 (29) 8531 (23)
There were two notable observations from the elemental concentration data The sodium concentration in pore solution of all the mixtures made with SWS was considerably lower than the more than 5 molkgw sodium concentration in the SWS solution There are a number of plausible explanations for this The very high concentration is a challenging measurement challenge one must reproduce the background accurately The lower than expected concentration may also be due to a greater than expected amount of sodium binding in the calcium silicate hydrate (C-S-H) This is plausible because the alkali binding increases with increasing cement replacement (resulting in lower CaSi molar ratios in the C-S-H) [30] and there are few data on binding at these sodium concentrations By contrast the silicon concentration was consistent with thermodynamic modeling prediction of a relatively significant silicon concentration in the pore solution
357 Total Sulfur
Determining the total sulfur content of the pore solution may be complicated by the two different forms in which it may be present Sulfates are commonly available in portland cement it is often added as gypsum during grinding It has been known for some time that blast furnace slag contributes sulfides to the pore solution of cementitious systems In principle the ICP-OES method will detect both forms of sulfur In practice however diluting the pore solution with nitric acid could convert some or all the sulfide to hydrogen sulfide (HS) which could be released as a gas If this were to occur the total quantity of sulfur detected by ICP would be less than the true value due to some of the sulfur being lost as a gas before the ICP measurement took place
On a few of the samples taken from mixtures made using surrogate waste solution two different dilution protocols were used The collected pore solution was filtered and divided into two sub-samples The first sample was diluted with nitric acid as described above The second sample was diluted using only water following the practice described by Lothenbach et al [31] These results have been included in the data in Table 23 and Table 24 with the dilution solution shown in parentheses From the data given in Table 23 and Table 24 there is no evidence that acid dilution removed much if any sulfur from the sample
45
One possible explanation for observing the same sulfur regardless of dilution type is that the sulfide had already oxidized prior to the pore expression resulting in all the sulfur being present as a sulfate This explanation however would be inconsistent with the samples being stored in air-tight plastic jars the observation of a dark green interior of the paste sample (the color saturation diminished upon exposure to air) and is inconsistent with detecting hydrogen sulfide gas (ldquorotten eggsrdquo) when cleaning a mortar and pestle with acid after the mortar and pestle had been used to crush small saltstone waste form samples
36 Discussion
As expected the blended binder systems (40-1-055 and 60-1-055) contained no measureable portlandite This is to be expected because in the absence of a source of additional calcium the alumina and silica in the fly ash and slag will consume the calcium in the portlandite (created by the portland cement hydration) to create additional C-S-H
There are two important points of comparison between the ordinary portland cement paste mixtures and the blended binders with SWS In the 040 wcm ordinary portland cement paste (40-0-100) the combined mass fraction of the hemicarbonate monocarbonate and ettringite phases is approximately 125 after 12 weeks of hydration In the 040 wcm pastes containing both blended binders and SWS (40-1-055) the same total was less then 25 and there was no ettringite detected In the 060 wcm ordinary portland paste (60-0-100) the same sum was more than 17 while in the 060 wcm paste containing both blended binders and SWS (60-1-055) the sum was below 2 and there was no ettringite detected Therefore although the SWS was contributing considerable sulfate to the mixture the overall chemistry was suppressing the formation of sulfate-bearing phases compared to the amount generated during the hydration of OPC pastes made with water
The pore solution analysis bears this out The sulfur content of the pore solution of the ordinary portland cement 40-0-100 specimen was approximately 15 mmolkgw and the sulfur content of the blended binder and SWS 40-1-055 specimen pore solution was nearly 200 mmolkgw This increase is consistent with having additional sulfur in the SWS and the simultaneous absence of sulfur-bearing minerals being formed during hydration For the 060 wcm specimens the corresponding difference was more dramatic The sulfur content of the pore solution of the ordinary portland cement 60-0-100 specimen was less than 10 mmolkgw and the sulfur content of the blended binder and SWS 60-1-055 specimen pore solution reached nearly 250 mmolkgw This greater difference between the ordinary portland cement system and the blended system is due largely to the greater ldquomix waterrdquo fraction of the 060 wcm mixture designs
After three months of hydration the type and quantity of mineral phases appear to be stable No unexpected phases are forming and the quantity of existing minerals is changing gradually Moreover the types of mineral phases observed are also commonly found in typical blended cement systems using in construction
37 Summary
In general the hydrated phases and pores solution composition of saltstone grouts is similar to what one might expect for these systems Despite the uniqueness of the binder proportions and the concentrated solution used as the mix water the observed phases and their proportions were not significantly different from what is observed in an analysis of an ordinary portland cement paste made with water
46
The most notable difference between the ordinary portland cement pastes and the synthetic saltstone was the absence of ettringite and the decreased production of hemicarbonate and monocarbonate even after one year of hydration The pore solution chemistry of the saltstone which is dominated by the contribution of the SWS appears to suppress the formation of sulfate-bearing mineral phases despite the contribution of additional sulfate in the SWS Moreover although solid sodium nitrate (nitratine) was detected in both the XRD and the TGA measurements it was determined that these observations were the result of an experimental artifact
The sodium concentration in the pore solution was less than expected most probably because the degree of sodium binding (into the hydration phases) has never been quantified at these very high concentrations and for the type of C-S-H formed by these blended systems Moreover after one year of hydration the mineral phases that were detected are found in blended cement concretes and these mineral phases appear to be relatively stable
47
4 CONCLUSION
Methods have been developed for characterizing the hydration phases and the pore solution composition of cementitious systems containing very little portland cement large quantities of fly ash and slag and a concentrated salt solution The material was characterized using isothermal calorimetry thermogravimetric analysis (TGA) quantitative X-ray powder diffraction (QXRD) image segmentation of elemental maps created by electron probe microanalysis performed on a scanning electron microscope (SEM) and aqueous phase analysis by inductively coupled plasma ndash optical emission spectroscopy (ICP-OES) In nearly all cases existing methodologies had to be modified or improved to work with these materials
The hydrated phase analysis by QXRD was facilitated to a degree by TGA For the mixtures having little or no fly ash or slag TGA analysis of the portlandite content was a useful means of establishing an internal standard for the QXRD analysis For the anticipated saltstone formulation however all of the portlandite is consumed by the fly ash and slag hydration so an internal crystalline standard (corundum) is required
A method using image segmentation was developed and shown to be a useful method of hydrated phase identification and quantification The image segmentation process may have its greatest strength in classifying the glassy phases of these blended systems because the relevant glassy phases (fly ash slag and C-S-H) appear differently By comparison quantitative X-ray diffraction can only determine total mass fraction of glassy phases by using an internal standard and subtracting out the mass fraction of the crystalline phases Before image segmentation can be used reliably however independent chemical analysis experiments are needed to validate the method
The hydrated samples were squeezed in a press to extract the pore solution which was then analyzed using ICP-OES to estimate the concentration of the atomic elements present The observed sodium concentration in the pore solution was approximately one-half the sodium concentration in the salt solution which was attributed in part to absorption of the sodium by the C-S-H The total sulfur concentration in the saltstone was approximately twenty times greater than the sulfur concentration in the portland cement pastes mixed with water and two different dilution methods were used to confirm that reduced sulfur (sulfide) was not being lost as hydrogen sulfide gas during sample preparation The higher alkalinity in the saltstone pore solution resulted in a factor of ten lower calcium concentration in the saltstone waste This fact was associated with a decrease in the quantity of sulfate phases being formed in the saltstone From this it was concluded that as long as the saltstone pore solution remains alkaline there is a low expectation of finding the types of sulfate phases that one associates with expansive sulfate attack
Ultimately these data and techniques will support the development of new tools for performance assessments of cementitious materials used in the nuclear infrastructure These tools will need to accurately predict the mineralogy and pore solution composition for a wide range of cementitious systems including saltstone waste forms Because these mixtures with their very low portland cement content and concentrated wastes solutions are not common practice within the concrete construction industry these data will help to develop a basis of understanding for these systems Specifically they will support models to accurately predict the type and quantity of hydrated phases and the equilibrium pore solution of blended cement systems This information coupled with detailed information about the environment can then be used to predict the long-term performance of these materials
48
5 REFERENCES
1 Bradford A Esh D Ridge A Thaggard M Whited R Treby S Flanders S and Camper LW ldquoUS Nuclear Regulatory Commission Technical Evaluation Report for the US Department of Energy Savannah River Site Draft Section 3116 Waste Determination for Salt Waste Disposalrdquo Technical Report (US Nuclear Regulatory Commission Washington DC 2005)
2 ASTM C 1679 ldquoStandard Practice for Measuring Hydration Kinetics of Hydraulic Cementitious Mixtures Using Isothermal Calorimetryrdquo Annual Book of ASTM Standards Vol 0402 ASTM International West Conshohocken PA (2010)
3 M Abramowitz and IA Stegun Handbook of Mathematical Functions Dover Publications Inc New York (1972)
4 ASTM C 1365 ldquoStandard Test Method for Determination of the Proportion of Phases in Portland Cement and Portland Cement Clinker Using X-Ray Powder Diffraction Analysisrdquo Annual Book of ASTM Standards Vol 0401 ASTM International West Conshohocken PA (2010)
5 HP Klug and LE Alexander X-Ray Diffraction Procedures Wiley-Interscience New York 966 pp (1974)
6 Certificate of Analysis Standard Reference Materialreg 674b X-Ray Powder Diffraction Intensity Set for Quantitative Analysis by X-Ray Powder Diffraction National Institute of Standards and Technology (2007)
7 Certificate of Analysis Standard Reference Materialreg 676 Alumina Internal Standard for Quantitative Analysis by X-Ray Powder Diffraction National Institute of Standards and Technology (2005)
8 P Stutzman ldquoMultispectral Imaging of Cementitious Materialsrdquo in Proceedings of the 29th
International Cement Microscopy Association Conference pp 20-24 Quebec City Canada (2007) 9 P Stutzman ldquoScanning Electron Microscopy Imaging of Hydraulic Cement Microstructurerdquo Cement
and Concrete Composites 26 (8) 957-966 (2004) 10 DP Bentz and PE Stutzman ldquoSEM Analysis and Computer Modeling of Hydration of Portland
Cement Particlesrdquo in Dehayes SM Stark D Eds Petrography of Cementitious Materials ASTM STP 1215 pp 60-73 ASTM International West Conshohocken PA (1994)
11 JI Goldstein DE Newbury P Echlin AD Romig Jr CE Lyman C Fiori and E Lifshin Scanning Electron Microscopy and X-Ray Microanalysis second edition Plenum Press New York (1981)
12 httprsbwebnihgovij
13 httpsengineeringpurdueedu~biehlMultiSpec 14 RS Barneyback Jr and S Diamond ldquoExpression and analysis of pore fluid from hardened cement
paste and mortarsrdquo Cement and Concrete Research 11 279-285 (1981) 15 B Lothenbach and F Winnefeld ldquoThermodynamic modelling of the hydration of portland cementrdquo
Cement and Concrete Research 36(2) 209-226 (2006) 16 T Wagner DA Kulik FF Hingerl SV Dmytriev ldquoGEM-Selektor geochemical modeling
package TSolMod library and data interface for multicomponent phase modelsrdquo Canadian Mineralogist 50(5) 1173-1195 (2012)
49
17 B Lothenbach B G Le Saout E Gallucci and K Scrivener ldquoInfluence of limestone on the hydration of Portland cementsrdquo Cement and Concrete Research 38 848-860 (2008)
18 Stutzman P and Leigh S ldquoPhase Composition Analysis of the NIST Reference Clinkers by Optical Microscopy and X-ray Powder Diffractionrdquo NIST Technical Note 1441 National Institute of Standards and Technology Gaithersburg MD (2002)
19 httprruffgeoarizonaeduAMSamcsdphp amp httpdatabaseiemacrumincryst
20 HFW Taylor Cement Chemistry Academic Press New York (1990) 21 A Le Bail lsquoModelling the silica glass structure by the Rietveld methodrsquo J Non-Cryst Solids 183
39-42 (1995) 22 httpcikscbtnistgov4sight
23 LJ Parrott and DC Killoh ldquoPrediction of cement hydrationrdquo Br Ceram Proc 35 41-53(1984) 24 K Dixon J Harbour and M Phifer ldquoHydraulic and Physical Properties of Saltstone Grouts and
Vault Concretesrdquo SRNL-STI-2008-00421 Savannah River National Laboratory (November 2008) 25 httpwwwcementbarriersorg
26 JW Bullard PE Stutzman KA Snyder EJ Garboczi ldquoTask 7 THAMES Demonstration (NIST)rdquo CBP-TR-2010-00007-C2 Rev 00 DOE Savannah River National Laboratory Aiken SC (2010)
27 JR Harbour EK Hansen TB Edwards VJ Williams RE Eibling DR Best and DM Missimer ldquoCharacterization of Slag Fly Ash and Portland Cement for Saltstonerdquo WSRC-TR-2006-00067 Savannah River National Laboratory Aiken SC (February 2006)
28 BD Bond and PWM Jacobs J Chem Soc A 1265-1268 (1966)
29 GL Paul and AW Pryor Acta Cryst Section B 28 2700-2702 (1972) 30 S-Y Hong and FP Glasser ldquoAlkali binding in cement pastes Part I The C-S-H phaserdquo Cement
and Concrete Research 29 1893-1903 (1999) 31 B Lothenbach G LeSaout M Ben Haha R Figi and E Wieland ldquoHydration of low-alkali CEM
IIIB-SiO2 cement (LAC)rdquo Cement and Concrete Research 42 (2) 410-423 (2012)
50
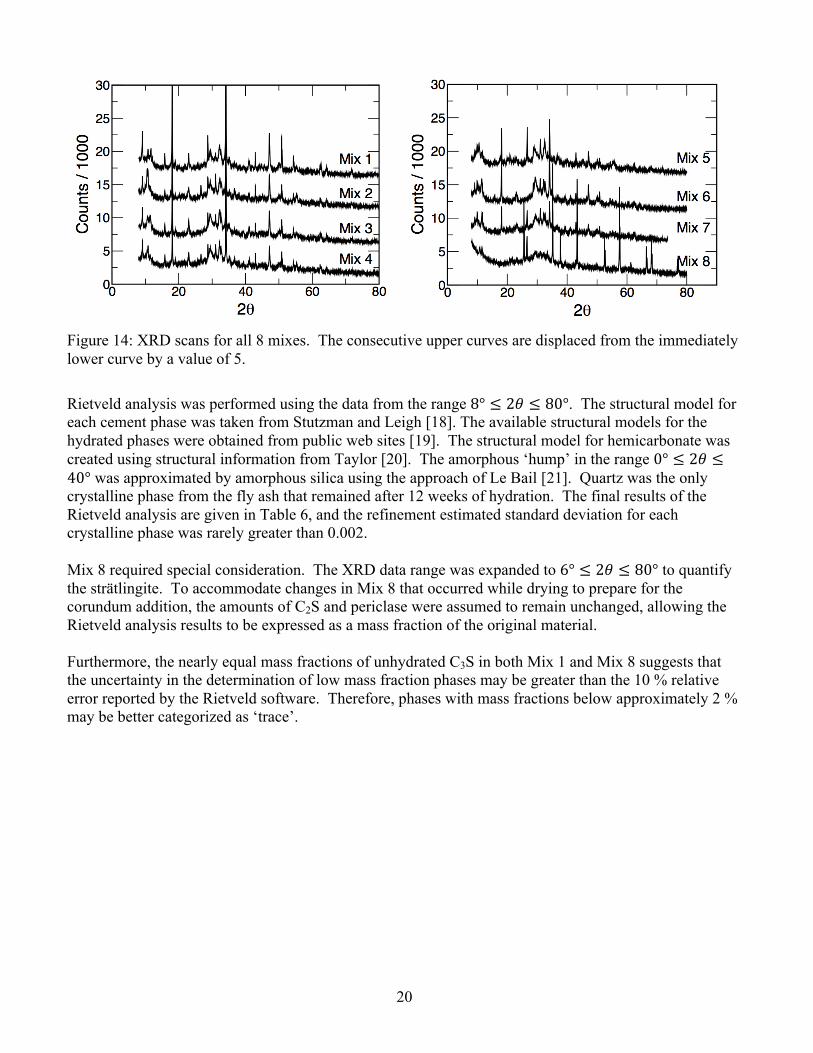
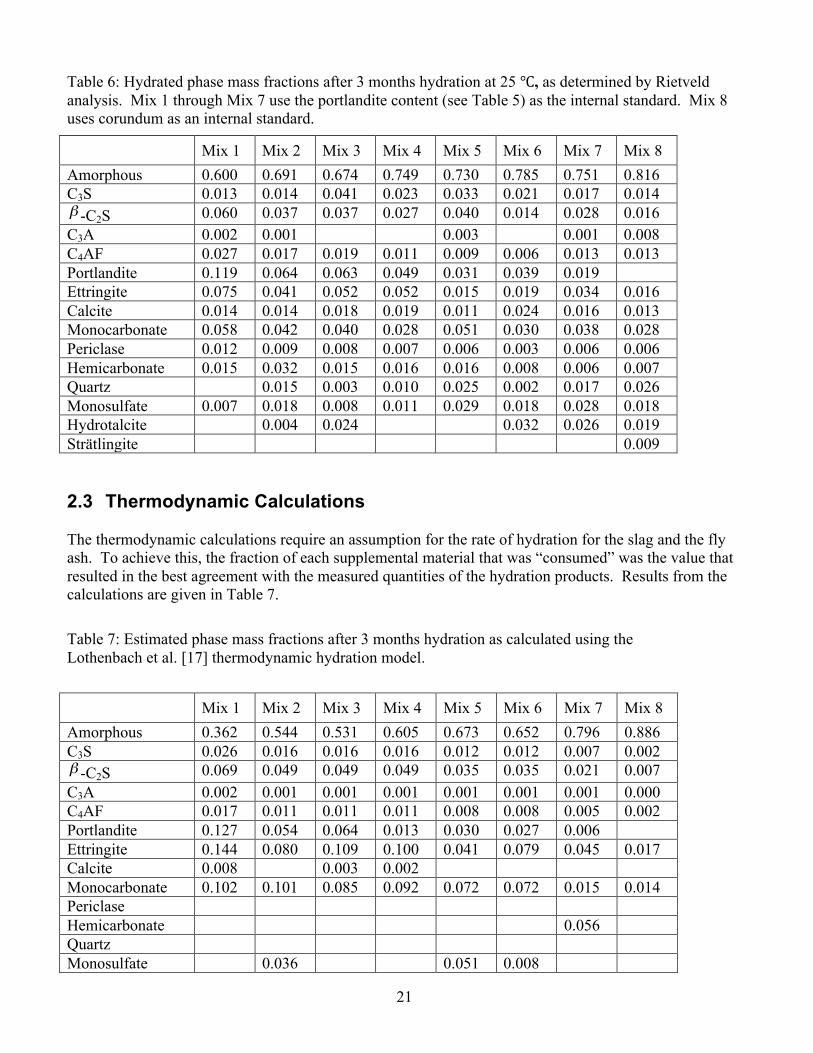
euro
euro
Table 6 Hydrated phase mass fractions after 3 months hydration at 25 as determined by Rietveld analysis Mix 1 through Mix 7 use the portlandite content (see Table 5) as the internal standard Mix 8 uses corundum as an internal standard
Mix 1 Mix 2 Mix 3 Mix 4 Mix 5 Mix 6 Mix 7 Mix 8 Amorphous 0600 0691 0674 0749 0730 0785 0751 0816 C3S 0013 0014 0041 0023 0033 0021 0017 0014 β -C2S 0060 0037 0037 0027 0040 0014 0028 0016 C3A 0002 0001 0003 0001 0008 C4AF 0027 0017 0019 0011 0009 0006 0013 0013 Portlandite 0119 0064 0063 0049 0031 0039 0019 Ettringite 0075 0041 0052 0052 0015 0019 0034 0016 Calcite 0014 0014 0018 0019 0011 0024 0016 0013 Monocarbonate 0058 0042 0040 0028 0051 0030 0038 0028 Periclase 0012 0009 0008 0007 0006 0003 0006 0006 Hemicarbonate 0015 0032 0015 0016 0016 0008 0006 0007 Quartz 0015 0003 0010 0025 0002 0017 0026 Monosulfate 0007 0018 0008 0011 0029 0018 0028 0018 Hydrotalcite 0004 0024 0032 0026 0019 Straumltlingite 0009
23 Thermodynamic Calculations
The thermodynamic calculations require an assumption for the rate of hydration for the slag and the fly ash To achieve this the fraction of each supplemental material that was ldquoconsumedrdquo was the value that resulted in the best agreement with the measured quantities of the hydration products Results from the calculations are given in Table 7
Table 7 Estimated phase mass fractions after 3 months hydration as calculated using the Lothenbach et al [17] thermodynamic hydration model
Mix 1 Mix 2 Mix 3 Mix 4 Mix 5 Mix 6 Mix 7 Mix 8 Amorphous 0362 0544 0531 0605 0673 0652 0796 0886 C3S 0026 0016 0016 0016 0012 0012 0007 0002 β -C2S 0069 0049 0049 0049 0035 0035 0021 0007 C3A 0002 0001 0001 0001 0001 0001 0001 0000 C4AF 0017 0011 0011 0011 0008 0008 0005 0002 Portlandite 0127 0054 0064 0013 0030 0027 0006 Ettringite 0144 0080 0109 0100 0041 0079 0045 0017 Calcite 0008 0003 0002 Monocarbonate 0102 0101 0085 0092 0072 0072 0015 0014 Periclase Hemicarbonate 0056 Quartz Monosulfate 0036 0051 0008
21
Hydrotalcite 0020 0009 0039 0006 0002 Straumltlingite 0037
There is general agreement between the observed and the predicted phases present The thermodynamic model assumed a greater degree of reactivity for the periclase and the calcite than otherwise expected and the quantity of quartz could have been approximated by assuming zero reactivity Although the quantity of each phase differs between the measured and predicted values this is due in large part to uncertainty in estimating the degree of reactivity for each of the supplementary materials
22
24 Image Segmentation
The approach of developing training sets using processed images and performing the segmentation using the original images was repeated for Mix 1 (OPC paste) Mix 2 (30 fly ash) and Mix 3 (30 slag) The BEI image and the segmented image (using non-processed images for the training set) for all three mixtures are shown in Figure 15 Figure 16 and Figure 17 For all three mixtures the segmentation process is able to identify the more finely distributed phases within the hardened cement paste
Figure 15 Backscattered electron image (BEI) and segmented image of the fly ash cement paste in Mix 1 after 3 months hydration
Figure 16 Backscattered electron image (BEI) and segmented image of the fly ash cement paste in Mix 2 after 3 months hydration
23
Figure 17 Backscattered electron image (BEI) and segmented image of the slag cement paste in Mix 3 after 3 months hydration
A comparison of the result for the mass fraction as determined by XRD to the mass fraction estimated from image segmentation is given in Table 8 There is general agreement between the two methods For the sulfate-bearing phases however the difference between the estimated values is nearly a factor of ten for Mix 1 and Mix 2
24
Table 8 Estimated mass fractions from quantitative XRD (QXRD) and imaging
QXRD Imaging Mix 1 Mix 2 Mix 3 Mix 1 Mix 2 Mix 3
25 Discussion The methods used here for characterizing hydrated phases will require further development and refinement Using amorphous silica to approximate the amorphous phases is useful in representing the XRD data background and the results generally agree with SEM image segmentation Also using TGA to estimate portlandite content will have limited applicability in the study of blended systems with very little portland cement because hydration processes in these mixes will eventually consume all the portlandite
The advantage of the image segmentation procedure is the ability to classify a number of amorphous phases By comparison the XRD process estimates total amorphous content by subtraction of the crystalline phases More specifically XRD can only lump together all amorphous phases where as image segmentation can classify cementing glassy phases (fly ash or slag) differently from the calcium silicate hydrate gel (C-S-H) However because the effort required for SEM image segmentation is very large in relation to the information obtained this technique will not be used to characterize the saltstone mixtures
26 Summary
Combining thermogravimetric data with X-ray diffraction data shows promise for characterizing the type and quantity of hydrated phases in blended cement systems The phases identified are consistent with current thermodynamic models but further research is needed to quantify the rate of reaction of fly ash and slag Further experimentation is needed however to independently validate the quantity of phases observed through XRD and TGA Image segmentation shows promise in being able to quantity the degree of fly ash and slag hydration but independent chemical analysis is needed to validate the results
25
3 SALTSTONE GROUT
There exist a number of computer tools that can be used to assess the performance of a cementitious barrier The most useful models are those like 4sight [22] that incorporate the relevant physics and chemistry of the interactions between the material and its environment These processes include both transport (through a non-ideal aqueous pore solution) and reaction (with ion-exchange surface complexation etc) For these types of models the material composition (type and quantity of phases) constitutes the initial condition and the environment (temperature humidity dissolved species in the groundwater etc) constitutes the (potentially time-dependent) boundary condition
An important part of the predictive nature of these computer tools is the ability to predict the initial material composition due to hydration The thermodynamic ldquohydration modelsrdquo convert the mineral phase composition of the binding phases and along with an additional model for the rate of hydration for each phase predict the type and quantity of phases produced this differs from a hydration model that can also predict the microstructure There exist models for the rate that cement phases hydrate [23] and for the rate of slag hydration [17] but there are no reliable models for the rate of fly ash hydration These models have been validated for mixtures composed mostly of portland cement
Some engineered barrier applications however use cementitious blends composed of very little portland cement and may use a treated salt solution as the ldquomix waterrdquo The concentrated salt supernate and crystallized saltcake are to be treated and then stabilized as a cementitious saltstone grout [1] formulated by the Savannah River National Laboratory (SRNL) for final disposal in vaults at the Saltstone Disposal Facility at the Savannah River Site (SRS) These grout mixtures may contain as little as 5 portland cement with the remainder of the binder being equal portions of (ASTM Class F) fly ash and slag Moreover the supernate contains among other salts sodium hydroxide sodium nitrate and sodium nitrite [24] Therefore not only is this solution highly alkaline it contains nitrates and nitrites which are typically not found in thermodynamic databases for cementitious systems
In anticipation of these challenges the NRC has become a member of the Cementitious Barriers Partnership (CBP) [25] The CBP works to improve the understanding and develop tools for predicting the long-term structural hydraulic and chemical performance of cementitious materials and waste forms used primarily in nuclear waste disposal The CBP objective is to develop a set of computational software tools that are expected to reduce the uncertainties of current methodologies for performance assessment As part of the CBP program there are software tools for estimating the mineral phase composition of the starting material but none of these tools have been validated on mixtures having such low portland cement contribution to the total binder
In support of the CBP program the National Institute of Standards and Technology (NIST) characterized the mineral composition of a set of pastes that mimic the type of saltstone grout being developed for SRS These pastes contained the same cement slag and fly ash used at SRNL and the ldquomix waterrdquo was an approximation to the SRNL surrogate waste for physical testing [24] that contains no radionuclides The raw materials and the hydrated pastes were characterized using quantitative X-ray powder diffraction (QXRD) and thermogravimetric analysis (TGA) to provide direct estimates of the bulk mineralogical composition and texture of the materials The pore solution composition was characterized by elemental analysis using inductively-coupled plasma optical emission spectroscopy The results represent a validation data set for the THAMES [26] microstructural development model that is used to compute realistic transport and mechanical properties for cement paste microstructures as a function of time
26
31 Experimental Plan
The portland cement fly ash and slag were obtained from SRNL and the composition of the surrogate waste solution was based on a SRNL report on the properties of the saltstone grouts [24] These mixtures are different from typical portland cement concrete formulations in two important ways very low cement content and a ldquomix waterrdquo that is a concentrated solution Anticipating the effects due to either of these differences is a formidable challenge to the computer models To bridge the gap paste mixtures were developed having two levels of cement content and two levels of ldquomix waterrdquo composition (water or SWS)
In addition two series of pastes were made having different watercementitious mass ratio (wcm) The grout formulated by SRNL [24] had a wcm (neglecting the dissolved solids in the waste solution) of 060 At this water content there can be considerable sedimentation and bleed water If sedimentation and bleeding do occur there will be a gradient of properties through the paste as the effective wcm decreases with depth Therefore mixtures were also made with a 040 wcm ratio so that comparisons could be made to systems for where there should have been relatively little bleeding The binder compositions of all mixture designs considered are given in Table 9 and the composition of the SWS is described below
Table 9 Binder proportions for mixtures at two watercementitious material mass ratios (wcm) neglecting the dissolved salts in the surrogate waste solution The quantity of cement fly ash and slag are designated by the corresponding mass fraction
wcm Water SWS Cement Fly Ash Slag Sample Name
040 Water 100 40-0-100 SWS 100 40-1-100 SWS 010 045 045 40-1-055
060 Water 100 60-0-100 SWS 100 60-1-100 SWS 010 045 045 60-1-055
32 Surrogate Waste Solution (SWS)
The composition of the SWS was based on that used by Dixon et al [24] The salts used and the corresponding concentrations are given in Table 10 Using the reported solution specific gravity of 1248 [24] the molar (molL) concentrations were converted to molal (molkgw) units to facilitate thermodynamic calculations
Table 10 Composition of the surrogate waste solution there are 08866 kg of water in each liter of solution
Salt molL molkgw NaOH 2866 3233 NaNO3 1973 2225 NaNO2 0485 0547
27
Na2CO3 0118 0133 Na2SO4 0055 0062 Al(NO3)3 9H2O 0114 0129 Na2H(PO4) 12H2O 0007 0008
The component composition of the SWS is given in Table 11 The component concentrations are provided to facilitate thermodynamic modeling because the calculations are performed on a component basis
Table 11 The component composition of the surrogate waste solution The numbers between parentheses represent the oxidation state this is the notation used in a number of thermodynamic databases
Component Molarity (molL) Molality (molkgw) Na 5684 6411 N(5) 2315 2611 N(3) 0485 0547 C 0118 0133 S(6) 0055 0062 Al 0114 0129 P(5) 0007 0008 H 0007 0008
33 Cementing Materials
The portland cement the fly ash and the slag obtained from SRNL included the certification report that the material producer supplies with the material The materials were the same as those used to develop the saltstone mixture and they have been characterized by SRNL [27]
The primary means of characterizing the cementing materials are the oxide contents and the crystalline mineral content The oxide content can be determined from X-ray fluorescence measurement and the crystalline phase identification and quantification can be determined from X-ray diffraction coupled with Rietveld analysis
331 Portland Cement The portland cement was an ASTM Type III containing 18 limestone (93 as CaCO3) The Blaine fineness was 393 m2kg and the loss on ignition was 18 The chemical composition provided in the mill certificate is given in Table 12 below
Table 12 Oxide composition of the ASTM Type III cement from the mill certificate report based on a single measurement
Oxide Mass Fraction () CaO 643 SiO2 203
28
Al2O3 50 Fe2O3 38 SO3 30 MgO 12 CO2 07 Na2Oe 048
The cement was analyzed to determine the mineral phases present The analysis was conducted using X-ray powder diffraction according to the standardized procedure described in ASTM C1365 [4] The results of the analysis are shown in Table 13 below The detection of syngenite was confirmed by the thermogravimetric analysis (discussed below)
Table 13 Portland cement mineral phase composition as determined by X-ray diffraction with Rietveld analysis (ASTM C1365) uncertainty expresses one standard deviation
Phase (XRD) Mass Fraction () C3S 562 plusmn 24 C2S 151 plusmn 16 C3A 34 plusmn 05 C4AF 131 plusmn 06 Gypsum 19 plusmn 03 Bassanite 10 plusmn 05 Calcite 27 plusmn 04 Syngenite 17 plusmn 01 Portlandite 10 plusmn 08 Amorphous 49 plusmn 14
Additional analysis of the portland cement was conducted using the TGA data shown in Figure 18 In the figure the distinguishable peaks for syngenite portlandite and limestone are denoted by arrows For the analysis the portlandite and limestone peaks are modeled using the symmetrical error function and the syngenite peak is modeled using the asymmetrical logistic function
29
0985
0987
0988
Figure 18 Relative remaining mass micro as a function of temperature for the portland cement Individual peaks are labeled the mass loss near 100 is due to water loss from C-S-H and other hydrated phases
The presence of syngenite (K2Ca(SO4)2middot(H2O)) and portlandite (Ca(OH)2) suggest that the cement has been exposed to a humid environment for an extended period The extent to which this has occurred however was characterized through a TGA regression analysis The results of the regression analysis for each peak are shown below in Figure 19 through Figure 21 below
0003
0002
micro-b
(T) p(T)
350 400 450 500 Temperature (oC)
b(T)
p(T)
b(T)+B0
350 400 450 500 Temperature (oC)
0986micro
0001
0000
Figure 19 Analysis of the portlandite peak in the cement (left) regression to the TGA data showing the background function b(T) and the peak function p(T) (right) the measured data minus the background function compared with the peak function (the two lie nearly on top of one another)
30
0984
0990
The result of the regression of the portlandite peak is shown in Figure 19 The error function was chosen for the peak function because the data appear symmetrical Upon determining the best fit to the data the left figure in Figure 19 shows the measured data (fuzzy line) the background function (along the lower flat portion of the curve) the background function plus the parameter 1198610 (dashed line) the peak function 119901(119879) and the overall function 119891(119879) the function 119891(119879) lies nearly on top of the measured data and is difficult to see The right figure in Figure 19 shows the measured data minus the background function 119887(119879) and the peak function 119901(119879) the two lie nearly on top of one another For portlandite (7409268 gmol) the mass loss is due to water (1801528 gmol) evaporation Therefore the mass fraction of portlandite is equal to 1198610(74092681801528)
An advantage of using regression is that the regression software reports estimated parameters along with the associated uncertainty Based on the estimated value for 1198610 and its uncertainty the estimated mass fraction of portlandite was (00107 plusmn 00002) where the uncertainty represents one standard deviation and the decomposition temperature 1198790 was equal to approximately 411 For comparison purposes the estimated portlandite mass fraction determined by XRD (Table 13) was (0010 plusmn 0008)
000150991
00010
150 200 250 300 350 Temperature (oC)
b(T) + B0
p(T)b(T)
150 200 250 300 350
micro-b
(T) p(T)
00005
0988
000000987
Temperature (oC)
Figure 20 Analysis of the syngenite peak in the cement (left) regression to the TGA data showing the background function b(T) and the peak function p(T) (right) the measured data minus the background function compared with the peak function (the two lie nearly on top of one another)
The result of the regression of the syngenite peak is shown in Figure 20 The curves in Figure 20 are the same as those shown in Figure 19 For these data however the peak was fit with the logistic function because the peak was not symmetric Using the same regression analysis as for the portlandite peak the estimated mass fraction of syngenite was (00208 plusmn 00003) and the parameter 1198790 was equal to approximately 227 For comparison purposes the estimated syngenite mass fraction determined by XRD (Table 13) was (0017 plusmn 0001)
0989micro
31
0975
0980
0985
micro-b
(T) p 1
(T)+p 2
(T)
500 600 700 Temperature (oC)
micro
b(T)
p1(T) p2(T)
b(T) + B0
0015
500 600 700 Temperature (oC)
0010
0005
0970 0000
Figure 21 Analysis of the limestone peak in the cement (left) regression to the TGA data showing the background function b(T) and the two peak functions p1(T) and p2(T) (right) the measured data minus the background function compared with the sum of the two peak functions (the two lie nearly on top of one another)
The result of the regression of the limestone peak is shown in Figure 21 The mass loss due to the decomposition of the limestone was resolved into two distinct peak functions both regressed against individual complementary error functions This double-peak mass loss is attributed to the presence of a dolomitic limestone The estimated mass fraction of limestone (as calcite) was (00315 plusmn 00005) and the peak location parameters were approximately 605 and 663 For comparison purposes the estimated calcite mass fraction determined by XRD (Table 13) was (0027 plusmn 0004)
332 Fly Ash
The fly ash was an ASTM Class F with a specific gravity of 238 and 178 (by mass) was retained on a 325 (45 microm) sieve The chemical composition data provided by the material supplier are provided in Table 14 below According to these values more than 90 of the total mass is composed of silicon aluminum and iron oxides
Table 14 Fly ash oxide composition reported in the mill certificate based on a single measurement
Oxide Mass Fraction () SiO2 5309 Al2O3 2797 Fe2O3 1012 CaO 139 MgO 163 SO3 010 Na2Oe 059
32
The fly ash was also analyzed at NIST using X-ray powder diffraction to identify and quantify the crystalline mineral composition and the results are shown in Table 15 below The major crystalline minerals are mullite and quartz
Table 15 Fly ash mineral phase composition as determined by X-ray powder diffraction and Rietveld analysis
Phase (XRD) Mass Fraction ()
Assumed Chemical Composition
Mullite 183 plusmn 04 (A2O3)2(SiO2) Quartz 73 plusmn 04 SiO2 Hematite 22 plusmn 01 Fe2O3 Magnetite 10 plusmn 00 (Fe3O4) Amorphous 712 plusmn 08
333 Slag The slag certification report did not include the oxide content and a lack of any quantifiable peaks in the XRD data suggested that the material lacked crystalline phases
334 Previous Reports
For comparison purposes and to provide supplementary information about the slag the oxide analysis of Harbour et al [27] for all three materials is repeated in Table 16 below The values for portland cement and fly ash are in agreement with the mill certificates
Table 16 Oxide percentages reported by Harbour et al [27 (Table 3-5)] for the portland cement the fly ash and the slag
Oxide Portland Cement Fly Ash Slag
Batch 1 Batch 2 Batch 1 Batch 2 Batch 1 Batch 2 Al2O3 54 52 286 286 84 66 CaO 649 630 07 06 385 350 Fe2O3 37 38 60 56 04 03 K2O 05 07 26 25 03 05 MgO 12 12 09 08 129 131 Na2O 01 02 03 04 03 03 SO3 32 33 01 03 10 25 SiO2 205 203 542 568 379 404 TiO2 03 03 16 14 04 03 Volatiles 00 00 25 14 00 00 Total 998 980 975 984 1001 990
33
34 Mixture Designs
The saltstone grout to be used is a combination of cement fly ash slag and an alkaline solution for which there is relatively little engineering experience in the concrete construction industry As a result hydrated phase models would have to make a dramatic leap between typical mixes used today and the proposed mixture To help span this conceptual gap a progressive series of mixture designs was chosen starting from mixtures that existing models could use as a frame of reference
The mixture designs were divided between two waterbinder (mass basis) ratios The reference mixtures were ordinary portland cement (OPC) and water The three spanning mixtures were OPC and synthetic waste solution (SWS) a ternary blend and water and a ternary blend and SWS The mixture designs are shown in Table 17 and Table 18 and are proportioned to make approximately 500 mL of paste
Table 17 Mixture designs for wcm=040 pastes
Mass (g)
40-0-100 40-1-100 40-0-055 40-1-055 Water 2807 2560 2633 2411
NaOH 00 339 00 319 NaNO3 00 495 00 467 NaNO2 00 99 00 93 Na2CO3 00 37 00 35 Na2SO4 00 23 00 22 Al(NO3)3 9H2O 00 126 00 119 Na2H(PO4) 12H2O 00 07 00 07
Cement 7018 6547 658 617 Fly Ash 0 00 2962 2776 Slag 0 00 2962 2776
Table 18 Mixture designs for wcm=060 pastes
Mass (g)
60-0-100 60-1-100 60-0-055 60-1-055 Water 3288 2964 3127 2830
NaOH 00 392 00 374 NaNO3 00 574 00 548 NaNO2 00 114 00 109 Na2CO3 00 43 00 41 Na2SO4 00 27 00 26 Al(NO3)3 9H2O 00 146 00 140 Na2H(PO4) 12H2O 00 09 00 08
Cement 5479 5054 521 483 Fly Ash 00 00 2345 2171 Slag 00 00 2345 2171
34
The fresh pastes hydrated under sealed curing conditions to the extent possible Each mixture was cast into 25 mm diameter 25 mm tall cylindrical plastic molds The molds were sealed in plastic bags and the samples were demolded after 24 hours placed into airtight plastic jars and stored at 25 until the time of testing The wcm=060 pastes were rotated (at approximately 1 rotation every 10 seconds) during the first 24 hours and then demolded The demolded samples were placed into sealed high-density polyethylene (HDPE) jars and stored in a walk-in environmental chamber maintained at 25
35 Results
351 Calorimetry
The calorimetry results for these mixtures are shown in Figure 22 and are similar to the results from the previous study shown in Figure 12 The ordinary portland cement (OPC) systems (0-100) displayed the common overlapping peaks The OPC pastes containing SWS (1-100) were accelerated by the alkalinity of the SWS as one would expect The saltstone mixtures (1-055) exhibited a heat peak at approximately the same time as the OPC peak but the peak was much lower and much wider The water and ternary blend is only included for the 040 wcm mixture because the corresponding 060 wcm mixture did not react appreciably during the same time frame (as might be expected) The 040 wcm water and ternary blend paste exhibits a significantly delayed peak suggesting that the material would remain in a liquid state for a very long time
Figure 22 Heat generation rates (Wg) as a function of time (hours) for the 040 wcm pastes (left) and the 060 wcm pastes (right)
Because the blended systems made with water (0-055) were so significantly delayed in the hydration data from these mixtures is omitted from the subsequent results The very low portland cement content contributed to a very low alkalinity that delayed the hydration of the Class F fly ash and the slag Therefore there is very little to glean from any subsequent analysis of these systems
35
352 Thermogravimetric Analysis
The hydrated pastes were cut on a diamond saw using ethanol as a lubricant to create discs that were 1 mm to 2 mm thick These discs were gently broken into pieces using a mortar and pestle Two of these pieces were selected (total mass approximately 50 mg) and placed into the TGA sample holder
The TGA data for the mixtures are shown in Figure 23 through Figure 25 Each figure shows a series of TGA curves for a particular mixture with each curve representing a different age The large peak below 250 is the loss of free water and the decomposition of most of the hydration products The peak between 400 and 500 is due to portlandite (Ca(OH)2) decomposition The barely perceptible peak at 650 in Figure 23 is due to limestone calcination
040 040
40-0-100 60-0-100 030 030
-dmicro
dT
(1 o C
)
020 -dmicro
dT
(1 o C
)
010
020
010
0000000 200 400 600 800 1000 0 200 400 600 800 1000
Temperature Temperature
Figure 23 Differential relative mass loss (dmicrodT) as a function of temperature () for pastes made with portland cement and water wcm=04 (left) wcm=060 (right) Each line corresponds to a different age 7 d 14 d 28 d and 56 d
040 040
40-1-100 60-1-100 030 030
-dmicro
dT
(1 o C
)
-dmicro
dT
(1 o C
)
020
010
020
010
0000000 200 400 600 800 1000 0 200 400 600 800 1000
Temperature Temperature
Figure 24 Differential relative mass loss (dmicrodT) as a function of temperature () for pastes made with portland cement and surrogate waste solution wcm=04 (left) wcm=060 (right) Each line corresponds to a different age 7 d 14 d and 28 d
36
The portlandite content of the OPC mixtures were estimated using the process described previously and the results are given in Table 19 The regression process reports an uncertainty for the mass loss that is propagated to the estimated portlandite content After 8 weeks of hydration at 25 the mass fraction of portlandite is relatively constant
Table 19 Portlandite mass fraction as determined by TGA analysis for the four portland cement mixtures The uncertainty represents the measurement uncertainty having a coverage factor of one standard deviation Age 40-0-100 60-0-100 40-1-100 60-1-100 7d 01321 plusmn 00003 01350 plusmn 00004 01050 plusmn 00028 01146 plusmn 00000 14d 01375 plusmn 00005 01502 plusmn 00007 01081 plusmn 00016 01224 plusmn 00006 28d 01350 plusmn 00003 01568 plusmn 00006 01248 plusmn 00013 01416 plusmn 00009 56d 01433 plusmn 00004 01502 plusmn 00004 01370 plusmn 00009 01458 plusmn 00008
The TGA data for the mixtures that were composed of the ternary mixtures are shown in Figure 25 Because of the supplemental mineral admixtures present there are no peaks corresponding to portlandite Moreover there would be far too little limestone present to use it as an internal standard
000
010
020
030
040
-dmicro
dT
(1 o C
)
40-1-055
000
010
020
030
040
-dmicro
dT
(1 o C
)
60-1-055
0 200 400 600 800 1000 0 200 400 600 800 1000
Temperature Temperature Figure 25 Differential relative mass loss (-dmicrodT) as a function of temperature () for pastes made with portland cement paste fly ash slag and surrogate waste solution wcm=04 (left) wcm=060 (right) Each line corresponds to a different age 7 d 14 d and 28 d
For the samples containing the SWS there is a significant peak located near 600 that does not appear in samples without the SWS Upon studying the corresponding X-ray diffraction data for these samples it was determined that these peaks correspond to the decomposition of nitratine (sodium nitrate) The temperature at which this mass loss occurred was consistent with reported decomposition temperatures [28]
37
353 X-ray Powder Diffraction
The X-ray powder diffraction samples were cut from the smaller cylindrical samples using a diamond saw with ethanol as the lubricant A circular disc approximately 2 mm thick was cut from the specimen and the tested surface was gently polished with a 600-grit abrasive paper using ethanol as the lubricant The polished sample was mounted onto a sample holder and the sample was rotated to maximize the sampling area The X-ray diffraction data for the different mixtures with the data from each age offset from one another are shown in Figure 26 through Figure 28 below
38
Figure 26 X-ray powder diffraction data showing counts as a function of angle 2120579 for pastes made with portland cement and water wcm=04 (left) wcm=060 (right) Data after 7 d are offset for comparison purposes
A number of the peaks appearing in the ordinary portland cement pastes in Figure 26 also appear in the portland cement and SWS mixtures in Figure 27 The most prominent peaks are the portlandite peaks near 18deg 1205792 and 35deg 2 120579120579 Also although the monocarbonate peaks (below 12deg 2 ) appear in both of these mixtures the effect of the SWS is to suppress these peaks
Figure 27 X-ray powder diffraction data showing counts as a function of angle 2120579 for pastes made with portland cement and surrogate waste solution wcm=04 (left) wcm=060 (right) Data after 7 d are offset for comparison purposes
39
Figure 28 X-ray powder diffraction data showing counts as a function of angle 2120579 for pastes made with portland cement fly ash slag and surrogate waste solution wcm=04 (left) wcm=060 (right) Data after 7 d are offset for comparison purposes
The data in Figure 28 for specimens having both low portland cement content and SWS exhibit had certain unique features The higher glass content of these specimens is evident by the more prominent ldquohumprdquo between 20deg 2120579 and 35deg 2120579 Moreover the structure of the peaks below 12deg 2120579 has changed in character the two peaks have become one peak and an extension of the scan angle (uppermost scan on the left side of Figure 28) reveals yet another ldquopeakrdquo The peak near 12deg 2 is in a location that is 120579consistent with tobermorite but the peak width is much broader than would be expected for tobermorite The peak found near 6deg 2120579 has not been identified and further study is needed
The excessive peaks near 30deg 2120579 and 35deg 2120579 correspond to nitratine [29] These peaks were consistent with the appearance of the TGA peaks near 600 The existence of nitratine was consistent with chemical shrinkage (consumption of free water) during hydration that would increase the concentration of nitrate species possibly bringing it near a concentration sufficient to precipitate nitratine because the initial sodium nitrate concentration within the SWS was already very large A subsequent analysis of the hydrated system by successive rapid XRD scans is discussed below
354 Nitratine
Further analysis was made of the peak near 29deg 2120579 In hydrated systems made from only portland cement the broader peak near this angle would be attributed to an ldquoorderedrdquo C-S-H or to calcite (for a cement made with limestone) The ldquosharprdquo peak that extends above the broader peak is consistent with the presence of nitratine (sodium nitrate) [29] A contribution from nitratine in the XRD data is consistent with the appearance of the TGA peaks near 600 To determine whether the nitratine existed within the hardened paste prior to sample preparation repeated rapid XRD scans were conducted on a freshly cut specimen (mixture 60-1-055 after 16 weeks of hydration) and the results are shown in Figure 28 The six successive scans shown in the figure are each 20 minutes apart representing a total duration of approximately 100 minutes The growing nitratine peaks are located near 29deg 2120579 32deg 2120579 and 39deg 2120579 the precipitation of nitratine leads to preferred orientation due to its rhombohedral habit Moreover the estimated nitratine mass fraction based on Rietveld analysis was less than 3 for the scan with the
40
most prominent nitratine peak so the XRD method is sensitive to nitratine Given that each of the scans in the previous XRD figures occurred over a span of 80 minutes the height of the nitratine peak in those scans was a function of how long the specimen was exposed to the laboratory environment prior to being analyzed by XRD Therefore it was concluded that the appearance of nitratine peaks in both the TGA and the XRD data are artifacts of the sample drying during testing and not due to the presence of nitratine within the paste prior to testing
Figure 29 Six successive X-ray powder diffraction scans of the 60-1-055 mixture after 16 weeks of hydration Successive scans are 20 minutes apart The nitratine peaks are near 29deg 2120579 32deg 2120579 and 39deg 2120579
355 Rietveld Analysis
The results of the Rietveld analyses are shown in Table 20 below One important observation is that the phases that were identified are commonly seen in different types of cementitious materials that have been studied in the past Another important observation is the extent of sulfate hydration phases in the saltstone mixtures Particularly there are relatively normal quantities of ettringite and monocarbonate present even though the SWS contained a significant quantity of sulfate It is quite likely that the high pH (which suppresses the calcium and aluminum concentrations in the pore solution) coupled with the high ionic strength of pore solution contributed to decreased ettringite and monocarbonate precipitation
41
Table 20 Results of Rietveld analysis for the six mixtures The values reported are the mass fractions and the numbers in parentheses represent the uncertainty (one standard deviation) in the last two digits
40-0-100 7d 14d 28d 56d 12w Alite 00494 (34) 00499 (32) 00369 (31) 00291 (29) 00303 (28) Belite 00886 (60) 00588 (48) 00623 (53) 00443 (46) 00298 (39) Aluminate Ferrite 00844 (61) 00835 (65) 00835 (61) 00826 (59) 00690 (54) Portlandite 01321 (32) 01375 (43) 01350 (40) 01433 (34) 01390 (33) Ettringite 00679 (30) 00812 (36) 00647 (34) 00719 (32) 00712 (31) Hemicarbonate 00148 (12) 00171 (12) 00160 (14) 00161 (14) 00107 (13) Monocarbonate 00384 (59) 00365 (45) 00458 (47) 00582 (45) 00502 (41) Amorphous 05244 (118) 05357 (113) 05559 (112) 05546 (104) 05998 (96)
60-0-100c 7d 14d 28d 56d 12w Alite 00366 (32) 00354 (46) 00184 (48) Belite 00740 (65) 00347 (65) 00411 (78) Aluminate 00028 (12) 00029 (12) 00024 (11) Ferrite 00764 (57) 00778 (62) 00727 (57) Portlandite 01406 (29) 01441 (40) 01448 (32) Ettringite 00788 (30) 00839 (35) 00909 (34) Hemicarbonate 00207 (11) 00237 (12) 00176 (11) Monocarbonate 00521 (42) 00664 (44) 00705 (39) Corundum 00579 (19) 00520 (21) 00562 (20) Amorphous 04600 (112) 04792 (125) 04853 (126)
40-1-100 7d 14d 28d 56d 12w Alite 01275 (43) 01206 (41) 00896 (36) 00735 (30) 00576 (27) Belite 00604 (65) 00443 (55) 00605 (51) 00385 (41) 00285 (32) Aluminate 00029 (11) 00039 (10) 00046 (10) 00039 (99) Ferrite 00569 (59) 00576 (57) 00593 (55) 00603 (54) 00532 (49) Portlandite 01050 (33) 01081 (32) 01248 (39) 01370 (37) 01222 (33) Ettringite 00044 (26) 00038 (20) 00096 (35) 00032 (28) 00117 (36) Hemicarbonate 00053 (12) 00065 (13) 00027 (13) Monocarbonate 00199 (38) 00189 (45) 00109 (44) Amorphous 06429 (107) 06617 (97) 06517 (107) 06836 (140) 07268 (93)
60-1-100c 7d 14d 28d 56d 16w Alite 01010 (40) 00639 (34) 00499 (31) 00375 (66) Belite 00551 (67) 00556 (75) 00427 (75) 00060 (23) Aluminate Ferrite 00687 (60) 00449 (69) 00441 (58) 00435 (59) Portlandite 01085 (34) 01122 (37) 01184 (36) 01258 (38) Ettringite 00043 (29) 00108 (39) 00023 (18) 00043 (31)
42
Hemicarbonate 00109 (15) 00071 (14) 00084 (14) 00057 (13) Monocarbonate 00568 (44) 00530 (49) 00543 (47) 00492 (41) Corundum 00513 (22) 00431 (22) 00407 (19) 00421 (19) Amorphous 05364 (130) 06084 (143) 06324 (128) 06942 (124)
40-1-055c 7d 14d 28d 56d 16w Alite 00216 (19) 00216 (24) 00209 (26) 00170 (56) Belite 00069 (24) 00041 (25) 00026 (27) 00059 (36) Aluminate Ferrite 00174 (36) 00103 (28) 00105 (31) 00136 (32) Portlandite Ettringite Hemicarbonate 00077 (12) 00094 (13) 00091 (14) 00092 (16) Monocarbonate 00208 (36) 00164 (36) 00203 (38) 00165 (35) Corundum 00449 (21) 00449 (15) 00449 (18) 00449 (61) Quartz 00289 (15) 00216 (11) 00234 (12) 00232 (32) Mullite 21 00638 (32) 00509 (23) 00543 (27) 00541 (74) Amorphous 08250 (81) 08594 (69) 08522 (78) 08539 (142)
60-1-055c 7d 14d 28d 56d 16w Alite 00261 (30) 00200 (34) 00259 (30) 00192 (18) Belite 00090 (99) 00072 (99) 00072 00052 (99) Aluminate Ferrite 00056 (30) 00060 (26) 00067 (24) 00048 (31) Portlandite Ettringite Hemicarbonate 00081 (14) 00086 (17) 00079 (13) 00141 (18) Monocarbonate 00143 (41) 00108 (35) 00148 (38) 00134 (45) Corundum 00890 (46) 00890 (14) 00890 (34) 00890 (44) Quartz 00164 (13) 00173 (28) 00173 (15) 00178 (12) Mullite 21 00378 (27) 00423 (67) 00385 (35) 00413 (27) Amorphous 08238 (128) 06685 (136) 05447 (118) 08255 (127)
356 Pores Solution Analysis
The results from the pore solution analyses of the OPC pastes appear in Table 21 and Table 22 The limited number of observations from the 040 wcm OPC paste is due in part to the limited ability to extract useable samples from these relatively low wcm systems By comparison the 060 wcm OPC pastes yielded useable samples after 113 days of hydration
43
Table 21 Pore solution composition of the 040 wcm paste made with only portland cement numbers in parentheses indicate one standard deviation of uncertainty
40-0-100 (mmolkgw)
Element 7 days 16 days K 4633 (28) 4072 (17) Na 1416 (13) 16735 (086) S 1248 (042) 1441 (004) Ca 363 (011) 1924 (0023) Al 0079 (0005) 00910 (00015)
Table 22 Pore solution composition of the 060 wcm paste made with only portland cement numbers in parentheses indicate one standard deviation of uncertainty
60-0-100 (mmolkgw)
Element 8 days 16 days 28 days 113 days 360 days K 2621 (30) 2301 (18) 2506 (15) 2811 (12) Na 7374 (047) 9805 (092) 16932 (099) 10177 (014) S 324 (011) 4327 (0078) 811 (021) 4194 (0057) Ca 3112 (0026) 2396 (0026) 2761 (0027) 2765 (0041) Al 0069 (0002) 00637 (00003) 00141 (00019) 00752 (00018) Mg 00085 (0001)
The results from the pore solution analyses of the saltstone waste forms appear in Table 23 and Table 24 For saltstone waste form samples the challenge in collecting usable samples was the converse of the OPC pastes The solid microstructure developed sufficiently slowly that useable samples could not be obtained until there was sufficient mechanical strength to resist the entire sample from flowing through the outlet tube on the die For the 040 wcm waste forms usable samples were not attainable until after 14 d hydration and the 060 wcm waste forms did not yield usable samples until after 90 d hydration The advantage of this slower microstructural development was that samples could be obtained at later ages than for the OPC pastes In the case of the 06 wcm waste form samples were obtained out past one year of hydration
Table 23 Pore solution composition of the 040 wcm paste made with fly ash slag and surrogate waste solution numbers in parentheses indicate one standard deviation of uncertainty
40-1-055 (mmolkgw)
Element 14 days 34 days (HNO3)
34 days (DI Water)
86 days
K 1861 (25) 2114 (38) 1985 (19) 2389 (49) Na 2482 (46) 3380 (48) 3478 (63) 3284 (16) S 1677 (13) 1810 (20) 1865 (39) 1974 (64) Ca 0335 (0006) 0151 (002) 0179 (005) 0205 (0002) Al - -Si 887 (15) 9078 (037)
44
Table 24 Pore solution composition of the 060 wcm paste made with fly ash slag and surrogate waste solution numbers in parentheses indicate one standard deviation of uncertainty
60-1-055 (mmolkgw)
Element 91 days 126 days (HNO3)
126 days (DI Water)
391 days (HNO3)
391 days (DI Water)
K 1524 (63) 1994 (17) 19813 (82) 23588 (81) 23766 (58) Na 3267 (30) 3260 (40) 3311 (44) 3287 (45) 3381 (79) S 1720 (70) 1862 (14) 2018 (13) 2266 (21) 2454 (16) Ca 1154 (0009) 0546 (0) 0262 (003) 167 (11) 0195 (003) Al -Si 12890 (35) 13911 (22) 7873 (29) 8531 (23)
There were two notable observations from the elemental concentration data The sodium concentration in pore solution of all the mixtures made with SWS was considerably lower than the more than 5 molkgw sodium concentration in the SWS solution There are a number of plausible explanations for this The very high concentration is a challenging measurement challenge one must reproduce the background accurately The lower than expected concentration may also be due to a greater than expected amount of sodium binding in the calcium silicate hydrate (C-S-H) This is plausible because the alkali binding increases with increasing cement replacement (resulting in lower CaSi molar ratios in the C-S-H) [30] and there are few data on binding at these sodium concentrations By contrast the silicon concentration was consistent with thermodynamic modeling prediction of a relatively significant silicon concentration in the pore solution
357 Total Sulfur
Determining the total sulfur content of the pore solution may be complicated by the two different forms in which it may be present Sulfates are commonly available in portland cement it is often added as gypsum during grinding It has been known for some time that blast furnace slag contributes sulfides to the pore solution of cementitious systems In principle the ICP-OES method will detect both forms of sulfur In practice however diluting the pore solution with nitric acid could convert some or all the sulfide to hydrogen sulfide (HS) which could be released as a gas If this were to occur the total quantity of sulfur detected by ICP would be less than the true value due to some of the sulfur being lost as a gas before the ICP measurement took place
On a few of the samples taken from mixtures made using surrogate waste solution two different dilution protocols were used The collected pore solution was filtered and divided into two sub-samples The first sample was diluted with nitric acid as described above The second sample was diluted using only water following the practice described by Lothenbach et al [31] These results have been included in the data in Table 23 and Table 24 with the dilution solution shown in parentheses From the data given in Table 23 and Table 24 there is no evidence that acid dilution removed much if any sulfur from the sample
45
One possible explanation for observing the same sulfur regardless of dilution type is that the sulfide had already oxidized prior to the pore expression resulting in all the sulfur being present as a sulfate This explanation however would be inconsistent with the samples being stored in air-tight plastic jars the observation of a dark green interior of the paste sample (the color saturation diminished upon exposure to air) and is inconsistent with detecting hydrogen sulfide gas (ldquorotten eggsrdquo) when cleaning a mortar and pestle with acid after the mortar and pestle had been used to crush small saltstone waste form samples
36 Discussion
As expected the blended binder systems (40-1-055 and 60-1-055) contained no measureable portlandite This is to be expected because in the absence of a source of additional calcium the alumina and silica in the fly ash and slag will consume the calcium in the portlandite (created by the portland cement hydration) to create additional C-S-H
There are two important points of comparison between the ordinary portland cement paste mixtures and the blended binders with SWS In the 040 wcm ordinary portland cement paste (40-0-100) the combined mass fraction of the hemicarbonate monocarbonate and ettringite phases is approximately 125 after 12 weeks of hydration In the 040 wcm pastes containing both blended binders and SWS (40-1-055) the same total was less then 25 and there was no ettringite detected In the 060 wcm ordinary portland paste (60-0-100) the same sum was more than 17 while in the 060 wcm paste containing both blended binders and SWS (60-1-055) the sum was below 2 and there was no ettringite detected Therefore although the SWS was contributing considerable sulfate to the mixture the overall chemistry was suppressing the formation of sulfate-bearing phases compared to the amount generated during the hydration of OPC pastes made with water
The pore solution analysis bears this out The sulfur content of the pore solution of the ordinary portland cement 40-0-100 specimen was approximately 15 mmolkgw and the sulfur content of the blended binder and SWS 40-1-055 specimen pore solution was nearly 200 mmolkgw This increase is consistent with having additional sulfur in the SWS and the simultaneous absence of sulfur-bearing minerals being formed during hydration For the 060 wcm specimens the corresponding difference was more dramatic The sulfur content of the pore solution of the ordinary portland cement 60-0-100 specimen was less than 10 mmolkgw and the sulfur content of the blended binder and SWS 60-1-055 specimen pore solution reached nearly 250 mmolkgw This greater difference between the ordinary portland cement system and the blended system is due largely to the greater ldquomix waterrdquo fraction of the 060 wcm mixture designs
After three months of hydration the type and quantity of mineral phases appear to be stable No unexpected phases are forming and the quantity of existing minerals is changing gradually Moreover the types of mineral phases observed are also commonly found in typical blended cement systems using in construction
37 Summary
In general the hydrated phases and pores solution composition of saltstone grouts is similar to what one might expect for these systems Despite the uniqueness of the binder proportions and the concentrated solution used as the mix water the observed phases and their proportions were not significantly different from what is observed in an analysis of an ordinary portland cement paste made with water
46
The most notable difference between the ordinary portland cement pastes and the synthetic saltstone was the absence of ettringite and the decreased production of hemicarbonate and monocarbonate even after one year of hydration The pore solution chemistry of the saltstone which is dominated by the contribution of the SWS appears to suppress the formation of sulfate-bearing mineral phases despite the contribution of additional sulfate in the SWS Moreover although solid sodium nitrate (nitratine) was detected in both the XRD and the TGA measurements it was determined that these observations were the result of an experimental artifact
The sodium concentration in the pore solution was less than expected most probably because the degree of sodium binding (into the hydration phases) has never been quantified at these very high concentrations and for the type of C-S-H formed by these blended systems Moreover after one year of hydration the mineral phases that were detected are found in blended cement concretes and these mineral phases appear to be relatively stable
47
4 CONCLUSION
Methods have been developed for characterizing the hydration phases and the pore solution composition of cementitious systems containing very little portland cement large quantities of fly ash and slag and a concentrated salt solution The material was characterized using isothermal calorimetry thermogravimetric analysis (TGA) quantitative X-ray powder diffraction (QXRD) image segmentation of elemental maps created by electron probe microanalysis performed on a scanning electron microscope (SEM) and aqueous phase analysis by inductively coupled plasma ndash optical emission spectroscopy (ICP-OES) In nearly all cases existing methodologies had to be modified or improved to work with these materials
The hydrated phase analysis by QXRD was facilitated to a degree by TGA For the mixtures having little or no fly ash or slag TGA analysis of the portlandite content was a useful means of establishing an internal standard for the QXRD analysis For the anticipated saltstone formulation however all of the portlandite is consumed by the fly ash and slag hydration so an internal crystalline standard (corundum) is required
A method using image segmentation was developed and shown to be a useful method of hydrated phase identification and quantification The image segmentation process may have its greatest strength in classifying the glassy phases of these blended systems because the relevant glassy phases (fly ash slag and C-S-H) appear differently By comparison quantitative X-ray diffraction can only determine total mass fraction of glassy phases by using an internal standard and subtracting out the mass fraction of the crystalline phases Before image segmentation can be used reliably however independent chemical analysis experiments are needed to validate the method
The hydrated samples were squeezed in a press to extract the pore solution which was then analyzed using ICP-OES to estimate the concentration of the atomic elements present The observed sodium concentration in the pore solution was approximately one-half the sodium concentration in the salt solution which was attributed in part to absorption of the sodium by the C-S-H The total sulfur concentration in the saltstone was approximately twenty times greater than the sulfur concentration in the portland cement pastes mixed with water and two different dilution methods were used to confirm that reduced sulfur (sulfide) was not being lost as hydrogen sulfide gas during sample preparation The higher alkalinity in the saltstone pore solution resulted in a factor of ten lower calcium concentration in the saltstone waste This fact was associated with a decrease in the quantity of sulfate phases being formed in the saltstone From this it was concluded that as long as the saltstone pore solution remains alkaline there is a low expectation of finding the types of sulfate phases that one associates with expansive sulfate attack
Ultimately these data and techniques will support the development of new tools for performance assessments of cementitious materials used in the nuclear infrastructure These tools will need to accurately predict the mineralogy and pore solution composition for a wide range of cementitious systems including saltstone waste forms Because these mixtures with their very low portland cement content and concentrated wastes solutions are not common practice within the concrete construction industry these data will help to develop a basis of understanding for these systems Specifically they will support models to accurately predict the type and quantity of hydrated phases and the equilibrium pore solution of blended cement systems This information coupled with detailed information about the environment can then be used to predict the long-term performance of these materials
48
5 REFERENCES
1 Bradford A Esh D Ridge A Thaggard M Whited R Treby S Flanders S and Camper LW ldquoUS Nuclear Regulatory Commission Technical Evaluation Report for the US Department of Energy Savannah River Site Draft Section 3116 Waste Determination for Salt Waste Disposalrdquo Technical Report (US Nuclear Regulatory Commission Washington DC 2005)
2 ASTM C 1679 ldquoStandard Practice for Measuring Hydration Kinetics of Hydraulic Cementitious Mixtures Using Isothermal Calorimetryrdquo Annual Book of ASTM Standards Vol 0402 ASTM International West Conshohocken PA (2010)
3 M Abramowitz and IA Stegun Handbook of Mathematical Functions Dover Publications Inc New York (1972)
4 ASTM C 1365 ldquoStandard Test Method for Determination of the Proportion of Phases in Portland Cement and Portland Cement Clinker Using X-Ray Powder Diffraction Analysisrdquo Annual Book of ASTM Standards Vol 0401 ASTM International West Conshohocken PA (2010)
5 HP Klug and LE Alexander X-Ray Diffraction Procedures Wiley-Interscience New York 966 pp (1974)
6 Certificate of Analysis Standard Reference Materialreg 674b X-Ray Powder Diffraction Intensity Set for Quantitative Analysis by X-Ray Powder Diffraction National Institute of Standards and Technology (2007)
7 Certificate of Analysis Standard Reference Materialreg 676 Alumina Internal Standard for Quantitative Analysis by X-Ray Powder Diffraction National Institute of Standards and Technology (2005)
8 P Stutzman ldquoMultispectral Imaging of Cementitious Materialsrdquo in Proceedings of the 29th
International Cement Microscopy Association Conference pp 20-24 Quebec City Canada (2007) 9 P Stutzman ldquoScanning Electron Microscopy Imaging of Hydraulic Cement Microstructurerdquo Cement
and Concrete Composites 26 (8) 957-966 (2004) 10 DP Bentz and PE Stutzman ldquoSEM Analysis and Computer Modeling of Hydration of Portland
Cement Particlesrdquo in Dehayes SM Stark D Eds Petrography of Cementitious Materials ASTM STP 1215 pp 60-73 ASTM International West Conshohocken PA (1994)
11 JI Goldstein DE Newbury P Echlin AD Romig Jr CE Lyman C Fiori and E Lifshin Scanning Electron Microscopy and X-Ray Microanalysis second edition Plenum Press New York (1981)
12 httprsbwebnihgovij
13 httpsengineeringpurdueedu~biehlMultiSpec 14 RS Barneyback Jr and S Diamond ldquoExpression and analysis of pore fluid from hardened cement
paste and mortarsrdquo Cement and Concrete Research 11 279-285 (1981) 15 B Lothenbach and F Winnefeld ldquoThermodynamic modelling of the hydration of portland cementrdquo
Cement and Concrete Research 36(2) 209-226 (2006) 16 T Wagner DA Kulik FF Hingerl SV Dmytriev ldquoGEM-Selektor geochemical modeling
package TSolMod library and data interface for multicomponent phase modelsrdquo Canadian Mineralogist 50(5) 1173-1195 (2012)
49
17 B Lothenbach B G Le Saout E Gallucci and K Scrivener ldquoInfluence of limestone on the hydration of Portland cementsrdquo Cement and Concrete Research 38 848-860 (2008)
18 Stutzman P and Leigh S ldquoPhase Composition Analysis of the NIST Reference Clinkers by Optical Microscopy and X-ray Powder Diffractionrdquo NIST Technical Note 1441 National Institute of Standards and Technology Gaithersburg MD (2002)
19 httprruffgeoarizonaeduAMSamcsdphp amp httpdatabaseiemacrumincryst
20 HFW Taylor Cement Chemistry Academic Press New York (1990) 21 A Le Bail lsquoModelling the silica glass structure by the Rietveld methodrsquo J Non-Cryst Solids 183
39-42 (1995) 22 httpcikscbtnistgov4sight
23 LJ Parrott and DC Killoh ldquoPrediction of cement hydrationrdquo Br Ceram Proc 35 41-53(1984) 24 K Dixon J Harbour and M Phifer ldquoHydraulic and Physical Properties of Saltstone Grouts and
Vault Concretesrdquo SRNL-STI-2008-00421 Savannah River National Laboratory (November 2008) 25 httpwwwcementbarriersorg
26 JW Bullard PE Stutzman KA Snyder EJ Garboczi ldquoTask 7 THAMES Demonstration (NIST)rdquo CBP-TR-2010-00007-C2 Rev 00 DOE Savannah River National Laboratory Aiken SC (2010)
27 JR Harbour EK Hansen TB Edwards VJ Williams RE Eibling DR Best and DM Missimer ldquoCharacterization of Slag Fly Ash and Portland Cement for Saltstonerdquo WSRC-TR-2006-00067 Savannah River National Laboratory Aiken SC (February 2006)
28 BD Bond and PWM Jacobs J Chem Soc A 1265-1268 (1966)
29 GL Paul and AW Pryor Acta Cryst Section B 28 2700-2702 (1972) 30 S-Y Hong and FP Glasser ldquoAlkali binding in cement pastes Part I The C-S-H phaserdquo Cement
and Concrete Research 29 1893-1903 (1999) 31 B Lothenbach G LeSaout M Ben Haha R Figi and E Wieland ldquoHydration of low-alkali CEM
IIIB-SiO2 cement (LAC)rdquo Cement and Concrete Research 42 (2) 410-423 (2012)
50
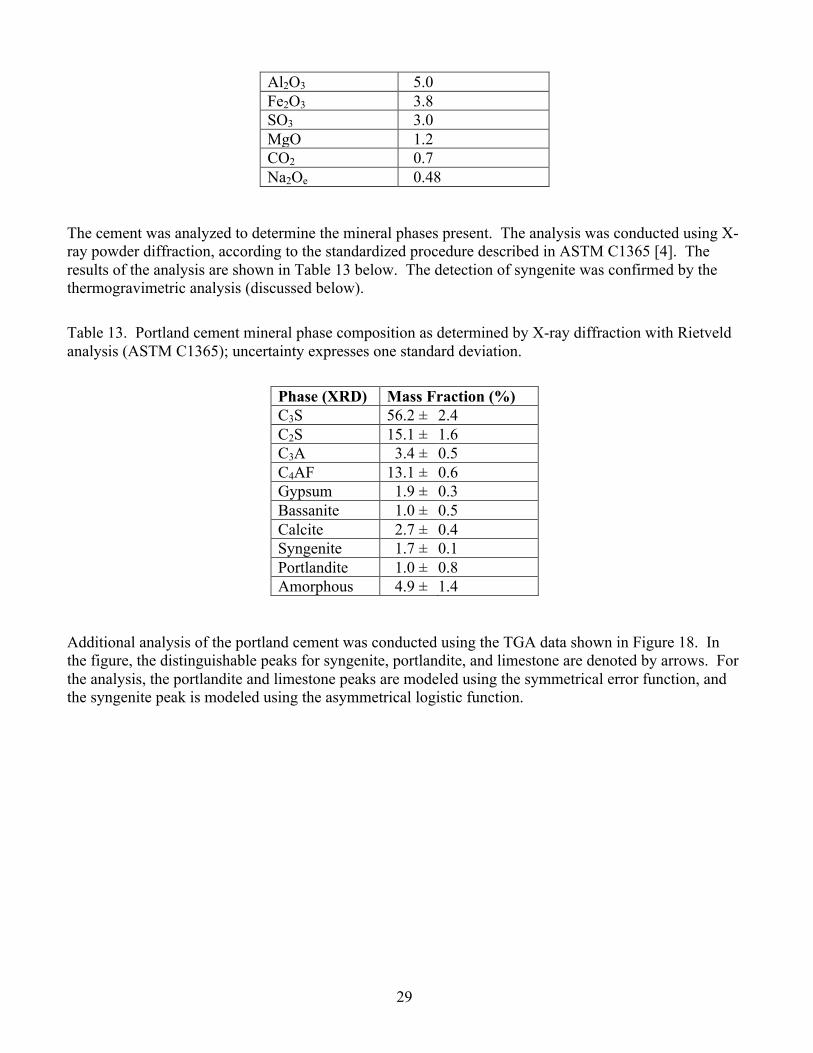

0985
0987
0988
Figure 18 Relative remaining mass micro as a function of temperature for the portland cement Individual peaks are labeled the mass loss near 100 is due to water loss from C-S-H and other hydrated phases
The presence of syngenite (K2Ca(SO4)2middot(H2O)) and portlandite (Ca(OH)2) suggest that the cement has been exposed to a humid environment for an extended period The extent to which this has occurred however was characterized through a TGA regression analysis The results of the regression analysis for each peak are shown below in Figure 19 through Figure 21 below
0003
0002
micro-b
(T) p(T)
350 400 450 500 Temperature (oC)
b(T)
p(T)
b(T)+B0
350 400 450 500 Temperature (oC)
0986micro
0001
0000
Figure 19 Analysis of the portlandite peak in the cement (left) regression to the TGA data showing the background function b(T) and the peak function p(T) (right) the measured data minus the background function compared with the peak function (the two lie nearly on top of one another)
30
0984
0990
The result of the regression of the portlandite peak is shown in Figure 19 The error function was chosen for the peak function because the data appear symmetrical Upon determining the best fit to the data the left figure in Figure 19 shows the measured data (fuzzy line) the background function (along the lower flat portion of the curve) the background function plus the parameter 1198610 (dashed line) the peak function 119901(119879) and the overall function 119891(119879) the function 119891(119879) lies nearly on top of the measured data and is difficult to see The right figure in Figure 19 shows the measured data minus the background function 119887(119879) and the peak function 119901(119879) the two lie nearly on top of one another For portlandite (7409268 gmol) the mass loss is due to water (1801528 gmol) evaporation Therefore the mass fraction of portlandite is equal to 1198610(74092681801528)
An advantage of using regression is that the regression software reports estimated parameters along with the associated uncertainty Based on the estimated value for 1198610 and its uncertainty the estimated mass fraction of portlandite was (00107 plusmn 00002) where the uncertainty represents one standard deviation and the decomposition temperature 1198790 was equal to approximately 411 For comparison purposes the estimated portlandite mass fraction determined by XRD (Table 13) was (0010 plusmn 0008)
000150991
00010
150 200 250 300 350 Temperature (oC)
b(T) + B0
p(T)b(T)
150 200 250 300 350
micro-b
(T) p(T)
00005
0988
000000987
Temperature (oC)
Figure 20 Analysis of the syngenite peak in the cement (left) regression to the TGA data showing the background function b(T) and the peak function p(T) (right) the measured data minus the background function compared with the peak function (the two lie nearly on top of one another)
The result of the regression of the syngenite peak is shown in Figure 20 The curves in Figure 20 are the same as those shown in Figure 19 For these data however the peak was fit with the logistic function because the peak was not symmetric Using the same regression analysis as for the portlandite peak the estimated mass fraction of syngenite was (00208 plusmn 00003) and the parameter 1198790 was equal to approximately 227 For comparison purposes the estimated syngenite mass fraction determined by XRD (Table 13) was (0017 plusmn 0001)
0989micro
31
0975
0980
0985
micro-b
(T) p 1
(T)+p 2
(T)
500 600 700 Temperature (oC)
micro
b(T)
p1(T) p2(T)
b(T) + B0
0015
500 600 700 Temperature (oC)
0010
0005
0970 0000
Figure 21 Analysis of the limestone peak in the cement (left) regression to the TGA data showing the background function b(T) and the two peak functions p1(T) and p2(T) (right) the measured data minus the background function compared with the sum of the two peak functions (the two lie nearly on top of one another)
The result of the regression of the limestone peak is shown in Figure 21 The mass loss due to the decomposition of the limestone was resolved into two distinct peak functions both regressed against individual complementary error functions This double-peak mass loss is attributed to the presence of a dolomitic limestone The estimated mass fraction of limestone (as calcite) was (00315 plusmn 00005) and the peak location parameters were approximately 605 and 663 For comparison purposes the estimated calcite mass fraction determined by XRD (Table 13) was (0027 plusmn 0004)
332 Fly Ash
The fly ash was an ASTM Class F with a specific gravity of 238 and 178 (by mass) was retained on a 325 (45 microm) sieve The chemical composition data provided by the material supplier are provided in Table 14 below According to these values more than 90 of the total mass is composed of silicon aluminum and iron oxides
Table 14 Fly ash oxide composition reported in the mill certificate based on a single measurement
Oxide Mass Fraction () SiO2 5309 Al2O3 2797 Fe2O3 1012 CaO 139 MgO 163 SO3 010 Na2Oe 059
32
The fly ash was also analyzed at NIST using X-ray powder diffraction to identify and quantify the crystalline mineral composition and the results are shown in Table 15 below The major crystalline minerals are mullite and quartz
Table 15 Fly ash mineral phase composition as determined by X-ray powder diffraction and Rietveld analysis
Phase (XRD) Mass Fraction ()
Assumed Chemical Composition
Mullite 183 plusmn 04 (A2O3)2(SiO2) Quartz 73 plusmn 04 SiO2 Hematite 22 plusmn 01 Fe2O3 Magnetite 10 plusmn 00 (Fe3O4) Amorphous 712 plusmn 08
333 Slag The slag certification report did not include the oxide content and a lack of any quantifiable peaks in the XRD data suggested that the material lacked crystalline phases
334 Previous Reports
For comparison purposes and to provide supplementary information about the slag the oxide analysis of Harbour et al [27] for all three materials is repeated in Table 16 below The values for portland cement and fly ash are in agreement with the mill certificates
Table 16 Oxide percentages reported by Harbour et al [27 (Table 3-5)] for the portland cement the fly ash and the slag
Oxide Portland Cement Fly Ash Slag
Batch 1 Batch 2 Batch 1 Batch 2 Batch 1 Batch 2 Al2O3 54 52 286 286 84 66 CaO 649 630 07 06 385 350 Fe2O3 37 38 60 56 04 03 K2O 05 07 26 25 03 05 MgO 12 12 09 08 129 131 Na2O 01 02 03 04 03 03 SO3 32 33 01 03 10 25 SiO2 205 203 542 568 379 404 TiO2 03 03 16 14 04 03 Volatiles 00 00 25 14 00 00 Total 998 980 975 984 1001 990
33
34 Mixture Designs
The saltstone grout to be used is a combination of cement fly ash slag and an alkaline solution for which there is relatively little engineering experience in the concrete construction industry As a result hydrated phase models would have to make a dramatic leap between typical mixes used today and the proposed mixture To help span this conceptual gap a progressive series of mixture designs was chosen starting from mixtures that existing models could use as a frame of reference
The mixture designs were divided between two waterbinder (mass basis) ratios The reference mixtures were ordinary portland cement (OPC) and water The three spanning mixtures were OPC and synthetic waste solution (SWS) a ternary blend and water and a ternary blend and SWS The mixture designs are shown in Table 17 and Table 18 and are proportioned to make approximately 500 mL of paste
Table 17 Mixture designs for wcm=040 pastes
Mass (g)
40-0-100 40-1-100 40-0-055 40-1-055 Water 2807 2560 2633 2411
NaOH 00 339 00 319 NaNO3 00 495 00 467 NaNO2 00 99 00 93 Na2CO3 00 37 00 35 Na2SO4 00 23 00 22 Al(NO3)3 9H2O 00 126 00 119 Na2H(PO4) 12H2O 00 07 00 07
Cement 7018 6547 658 617 Fly Ash 0 00 2962 2776 Slag 0 00 2962 2776
Table 18 Mixture designs for wcm=060 pastes
Mass (g)
60-0-100 60-1-100 60-0-055 60-1-055 Water 3288 2964 3127 2830
NaOH 00 392 00 374 NaNO3 00 574 00 548 NaNO2 00 114 00 109 Na2CO3 00 43 00 41 Na2SO4 00 27 00 26 Al(NO3)3 9H2O 00 146 00 140 Na2H(PO4) 12H2O 00 09 00 08
Cement 5479 5054 521 483 Fly Ash 00 00 2345 2171 Slag 00 00 2345 2171
34
The fresh pastes hydrated under sealed curing conditions to the extent possible Each mixture was cast into 25 mm diameter 25 mm tall cylindrical plastic molds The molds were sealed in plastic bags and the samples were demolded after 24 hours placed into airtight plastic jars and stored at 25 until the time of testing The wcm=060 pastes were rotated (at approximately 1 rotation every 10 seconds) during the first 24 hours and then demolded The demolded samples were placed into sealed high-density polyethylene (HDPE) jars and stored in a walk-in environmental chamber maintained at 25
35 Results
351 Calorimetry
The calorimetry results for these mixtures are shown in Figure 22 and are similar to the results from the previous study shown in Figure 12 The ordinary portland cement (OPC) systems (0-100) displayed the common overlapping peaks The OPC pastes containing SWS (1-100) were accelerated by the alkalinity of the SWS as one would expect The saltstone mixtures (1-055) exhibited a heat peak at approximately the same time as the OPC peak but the peak was much lower and much wider The water and ternary blend is only included for the 040 wcm mixture because the corresponding 060 wcm mixture did not react appreciably during the same time frame (as might be expected) The 040 wcm water and ternary blend paste exhibits a significantly delayed peak suggesting that the material would remain in a liquid state for a very long time
Figure 22 Heat generation rates (Wg) as a function of time (hours) for the 040 wcm pastes (left) and the 060 wcm pastes (right)
Because the blended systems made with water (0-055) were so significantly delayed in the hydration data from these mixtures is omitted from the subsequent results The very low portland cement content contributed to a very low alkalinity that delayed the hydration of the Class F fly ash and the slag Therefore there is very little to glean from any subsequent analysis of these systems
35
352 Thermogravimetric Analysis
The hydrated pastes were cut on a diamond saw using ethanol as a lubricant to create discs that were 1 mm to 2 mm thick These discs were gently broken into pieces using a mortar and pestle Two of these pieces were selected (total mass approximately 50 mg) and placed into the TGA sample holder
The TGA data for the mixtures are shown in Figure 23 through Figure 25 Each figure shows a series of TGA curves for a particular mixture with each curve representing a different age The large peak below 250 is the loss of free water and the decomposition of most of the hydration products The peak between 400 and 500 is due to portlandite (Ca(OH)2) decomposition The barely perceptible peak at 650 in Figure 23 is due to limestone calcination
040 040
40-0-100 60-0-100 030 030
-dmicro
dT
(1 o C
)
020 -dmicro
dT
(1 o C
)
010
020
010
0000000 200 400 600 800 1000 0 200 400 600 800 1000
Temperature Temperature
Figure 23 Differential relative mass loss (dmicrodT) as a function of temperature () for pastes made with portland cement and water wcm=04 (left) wcm=060 (right) Each line corresponds to a different age 7 d 14 d 28 d and 56 d
040 040
40-1-100 60-1-100 030 030
-dmicro
dT
(1 o C
)
-dmicro
dT
(1 o C
)
020
010
020
010
0000000 200 400 600 800 1000 0 200 400 600 800 1000
Temperature Temperature
Figure 24 Differential relative mass loss (dmicrodT) as a function of temperature () for pastes made with portland cement and surrogate waste solution wcm=04 (left) wcm=060 (right) Each line corresponds to a different age 7 d 14 d and 28 d
36
The portlandite content of the OPC mixtures were estimated using the process described previously and the results are given in Table 19 The regression process reports an uncertainty for the mass loss that is propagated to the estimated portlandite content After 8 weeks of hydration at 25 the mass fraction of portlandite is relatively constant
Table 19 Portlandite mass fraction as determined by TGA analysis for the four portland cement mixtures The uncertainty represents the measurement uncertainty having a coverage factor of one standard deviation Age 40-0-100 60-0-100 40-1-100 60-1-100 7d 01321 plusmn 00003 01350 plusmn 00004 01050 plusmn 00028 01146 plusmn 00000 14d 01375 plusmn 00005 01502 plusmn 00007 01081 plusmn 00016 01224 plusmn 00006 28d 01350 plusmn 00003 01568 plusmn 00006 01248 plusmn 00013 01416 plusmn 00009 56d 01433 plusmn 00004 01502 plusmn 00004 01370 plusmn 00009 01458 plusmn 00008
The TGA data for the mixtures that were composed of the ternary mixtures are shown in Figure 25 Because of the supplemental mineral admixtures present there are no peaks corresponding to portlandite Moreover there would be far too little limestone present to use it as an internal standard
000
010
020
030
040
-dmicro
dT
(1 o C
)
40-1-055
000
010
020
030
040
-dmicro
dT
(1 o C
)
60-1-055
0 200 400 600 800 1000 0 200 400 600 800 1000
Temperature Temperature Figure 25 Differential relative mass loss (-dmicrodT) as a function of temperature () for pastes made with portland cement paste fly ash slag and surrogate waste solution wcm=04 (left) wcm=060 (right) Each line corresponds to a different age 7 d 14 d and 28 d
For the samples containing the SWS there is a significant peak located near 600 that does not appear in samples without the SWS Upon studying the corresponding X-ray diffraction data for these samples it was determined that these peaks correspond to the decomposition of nitratine (sodium nitrate) The temperature at which this mass loss occurred was consistent with reported decomposition temperatures [28]
37
353 X-ray Powder Diffraction
The X-ray powder diffraction samples were cut from the smaller cylindrical samples using a diamond saw with ethanol as the lubricant A circular disc approximately 2 mm thick was cut from the specimen and the tested surface was gently polished with a 600-grit abrasive paper using ethanol as the lubricant The polished sample was mounted onto a sample holder and the sample was rotated to maximize the sampling area The X-ray diffraction data for the different mixtures with the data from each age offset from one another are shown in Figure 26 through Figure 28 below
38
Figure 26 X-ray powder diffraction data showing counts as a function of angle 2120579 for pastes made with portland cement and water wcm=04 (left) wcm=060 (right) Data after 7 d are offset for comparison purposes
A number of the peaks appearing in the ordinary portland cement pastes in Figure 26 also appear in the portland cement and SWS mixtures in Figure 27 The most prominent peaks are the portlandite peaks near 18deg 1205792 and 35deg 2 120579120579 Also although the monocarbonate peaks (below 12deg 2 ) appear in both of these mixtures the effect of the SWS is to suppress these peaks
Figure 27 X-ray powder diffraction data showing counts as a function of angle 2120579 for pastes made with portland cement and surrogate waste solution wcm=04 (left) wcm=060 (right) Data after 7 d are offset for comparison purposes
39
Figure 28 X-ray powder diffraction data showing counts as a function of angle 2120579 for pastes made with portland cement fly ash slag and surrogate waste solution wcm=04 (left) wcm=060 (right) Data after 7 d are offset for comparison purposes
The data in Figure 28 for specimens having both low portland cement content and SWS exhibit had certain unique features The higher glass content of these specimens is evident by the more prominent ldquohumprdquo between 20deg 2120579 and 35deg 2120579 Moreover the structure of the peaks below 12deg 2120579 has changed in character the two peaks have become one peak and an extension of the scan angle (uppermost scan on the left side of Figure 28) reveals yet another ldquopeakrdquo The peak near 12deg 2 is in a location that is 120579consistent with tobermorite but the peak width is much broader than would be expected for tobermorite The peak found near 6deg 2120579 has not been identified and further study is needed
The excessive peaks near 30deg 2120579 and 35deg 2120579 correspond to nitratine [29] These peaks were consistent with the appearance of the TGA peaks near 600 The existence of nitratine was consistent with chemical shrinkage (consumption of free water) during hydration that would increase the concentration of nitrate species possibly bringing it near a concentration sufficient to precipitate nitratine because the initial sodium nitrate concentration within the SWS was already very large A subsequent analysis of the hydrated system by successive rapid XRD scans is discussed below
354 Nitratine
Further analysis was made of the peak near 29deg 2120579 In hydrated systems made from only portland cement the broader peak near this angle would be attributed to an ldquoorderedrdquo C-S-H or to calcite (for a cement made with limestone) The ldquosharprdquo peak that extends above the broader peak is consistent with the presence of nitratine (sodium nitrate) [29] A contribution from nitratine in the XRD data is consistent with the appearance of the TGA peaks near 600 To determine whether the nitratine existed within the hardened paste prior to sample preparation repeated rapid XRD scans were conducted on a freshly cut specimen (mixture 60-1-055 after 16 weeks of hydration) and the results are shown in Figure 28 The six successive scans shown in the figure are each 20 minutes apart representing a total duration of approximately 100 minutes The growing nitratine peaks are located near 29deg 2120579 32deg 2120579 and 39deg 2120579 the precipitation of nitratine leads to preferred orientation due to its rhombohedral habit Moreover the estimated nitratine mass fraction based on Rietveld analysis was less than 3 for the scan with the
40
most prominent nitratine peak so the XRD method is sensitive to nitratine Given that each of the scans in the previous XRD figures occurred over a span of 80 minutes the height of the nitratine peak in those scans was a function of how long the specimen was exposed to the laboratory environment prior to being analyzed by XRD Therefore it was concluded that the appearance of nitratine peaks in both the TGA and the XRD data are artifacts of the sample drying during testing and not due to the presence of nitratine within the paste prior to testing
Figure 29 Six successive X-ray powder diffraction scans of the 60-1-055 mixture after 16 weeks of hydration Successive scans are 20 minutes apart The nitratine peaks are near 29deg 2120579 32deg 2120579 and 39deg 2120579
355 Rietveld Analysis
The results of the Rietveld analyses are shown in Table 20 below One important observation is that the phases that were identified are commonly seen in different types of cementitious materials that have been studied in the past Another important observation is the extent of sulfate hydration phases in the saltstone mixtures Particularly there are relatively normal quantities of ettringite and monocarbonate present even though the SWS contained a significant quantity of sulfate It is quite likely that the high pH (which suppresses the calcium and aluminum concentrations in the pore solution) coupled with the high ionic strength of pore solution contributed to decreased ettringite and monocarbonate precipitation
41
Table 20 Results of Rietveld analysis for the six mixtures The values reported are the mass fractions and the numbers in parentheses represent the uncertainty (one standard deviation) in the last two digits
40-0-100 7d 14d 28d 56d 12w Alite 00494 (34) 00499 (32) 00369 (31) 00291 (29) 00303 (28) Belite 00886 (60) 00588 (48) 00623 (53) 00443 (46) 00298 (39) Aluminate Ferrite 00844 (61) 00835 (65) 00835 (61) 00826 (59) 00690 (54) Portlandite 01321 (32) 01375 (43) 01350 (40) 01433 (34) 01390 (33) Ettringite 00679 (30) 00812 (36) 00647 (34) 00719 (32) 00712 (31) Hemicarbonate 00148 (12) 00171 (12) 00160 (14) 00161 (14) 00107 (13) Monocarbonate 00384 (59) 00365 (45) 00458 (47) 00582 (45) 00502 (41) Amorphous 05244 (118) 05357 (113) 05559 (112) 05546 (104) 05998 (96)
60-0-100c 7d 14d 28d 56d 12w Alite 00366 (32) 00354 (46) 00184 (48) Belite 00740 (65) 00347 (65) 00411 (78) Aluminate 00028 (12) 00029 (12) 00024 (11) Ferrite 00764 (57) 00778 (62) 00727 (57) Portlandite 01406 (29) 01441 (40) 01448 (32) Ettringite 00788 (30) 00839 (35) 00909 (34) Hemicarbonate 00207 (11) 00237 (12) 00176 (11) Monocarbonate 00521 (42) 00664 (44) 00705 (39) Corundum 00579 (19) 00520 (21) 00562 (20) Amorphous 04600 (112) 04792 (125) 04853 (126)
40-1-100 7d 14d 28d 56d 12w Alite 01275 (43) 01206 (41) 00896 (36) 00735 (30) 00576 (27) Belite 00604 (65) 00443 (55) 00605 (51) 00385 (41) 00285 (32) Aluminate 00029 (11) 00039 (10) 00046 (10) 00039 (99) Ferrite 00569 (59) 00576 (57) 00593 (55) 00603 (54) 00532 (49) Portlandite 01050 (33) 01081 (32) 01248 (39) 01370 (37) 01222 (33) Ettringite 00044 (26) 00038 (20) 00096 (35) 00032 (28) 00117 (36) Hemicarbonate 00053 (12) 00065 (13) 00027 (13) Monocarbonate 00199 (38) 00189 (45) 00109 (44) Amorphous 06429 (107) 06617 (97) 06517 (107) 06836 (140) 07268 (93)
60-1-100c 7d 14d 28d 56d 16w Alite 01010 (40) 00639 (34) 00499 (31) 00375 (66) Belite 00551 (67) 00556 (75) 00427 (75) 00060 (23) Aluminate Ferrite 00687 (60) 00449 (69) 00441 (58) 00435 (59) Portlandite 01085 (34) 01122 (37) 01184 (36) 01258 (38) Ettringite 00043 (29) 00108 (39) 00023 (18) 00043 (31)
42
Hemicarbonate 00109 (15) 00071 (14) 00084 (14) 00057 (13) Monocarbonate 00568 (44) 00530 (49) 00543 (47) 00492 (41) Corundum 00513 (22) 00431 (22) 00407 (19) 00421 (19) Amorphous 05364 (130) 06084 (143) 06324 (128) 06942 (124)
40-1-055c 7d 14d 28d 56d 16w Alite 00216 (19) 00216 (24) 00209 (26) 00170 (56) Belite 00069 (24) 00041 (25) 00026 (27) 00059 (36) Aluminate Ferrite 00174 (36) 00103 (28) 00105 (31) 00136 (32) Portlandite Ettringite Hemicarbonate 00077 (12) 00094 (13) 00091 (14) 00092 (16) Monocarbonate 00208 (36) 00164 (36) 00203 (38) 00165 (35) Corundum 00449 (21) 00449 (15) 00449 (18) 00449 (61) Quartz 00289 (15) 00216 (11) 00234 (12) 00232 (32) Mullite 21 00638 (32) 00509 (23) 00543 (27) 00541 (74) Amorphous 08250 (81) 08594 (69) 08522 (78) 08539 (142)
60-1-055c 7d 14d 28d 56d 16w Alite 00261 (30) 00200 (34) 00259 (30) 00192 (18) Belite 00090 (99) 00072 (99) 00072 00052 (99) Aluminate Ferrite 00056 (30) 00060 (26) 00067 (24) 00048 (31) Portlandite Ettringite Hemicarbonate 00081 (14) 00086 (17) 00079 (13) 00141 (18) Monocarbonate 00143 (41) 00108 (35) 00148 (38) 00134 (45) Corundum 00890 (46) 00890 (14) 00890 (34) 00890 (44) Quartz 00164 (13) 00173 (28) 00173 (15) 00178 (12) Mullite 21 00378 (27) 00423 (67) 00385 (35) 00413 (27) Amorphous 08238 (128) 06685 (136) 05447 (118) 08255 (127)
356 Pores Solution Analysis
The results from the pore solution analyses of the OPC pastes appear in Table 21 and Table 22 The limited number of observations from the 040 wcm OPC paste is due in part to the limited ability to extract useable samples from these relatively low wcm systems By comparison the 060 wcm OPC pastes yielded useable samples after 113 days of hydration
43
Table 21 Pore solution composition of the 040 wcm paste made with only portland cement numbers in parentheses indicate one standard deviation of uncertainty
40-0-100 (mmolkgw)
Element 7 days 16 days K 4633 (28) 4072 (17) Na 1416 (13) 16735 (086) S 1248 (042) 1441 (004) Ca 363 (011) 1924 (0023) Al 0079 (0005) 00910 (00015)
Table 22 Pore solution composition of the 060 wcm paste made with only portland cement numbers in parentheses indicate one standard deviation of uncertainty
60-0-100 (mmolkgw)
Element 8 days 16 days 28 days 113 days 360 days K 2621 (30) 2301 (18) 2506 (15) 2811 (12) Na 7374 (047) 9805 (092) 16932 (099) 10177 (014) S 324 (011) 4327 (0078) 811 (021) 4194 (0057) Ca 3112 (0026) 2396 (0026) 2761 (0027) 2765 (0041) Al 0069 (0002) 00637 (00003) 00141 (00019) 00752 (00018) Mg 00085 (0001)
The results from the pore solution analyses of the saltstone waste forms appear in Table 23 and Table 24 For saltstone waste form samples the challenge in collecting usable samples was the converse of the OPC pastes The solid microstructure developed sufficiently slowly that useable samples could not be obtained until there was sufficient mechanical strength to resist the entire sample from flowing through the outlet tube on the die For the 040 wcm waste forms usable samples were not attainable until after 14 d hydration and the 060 wcm waste forms did not yield usable samples until after 90 d hydration The advantage of this slower microstructural development was that samples could be obtained at later ages than for the OPC pastes In the case of the 06 wcm waste form samples were obtained out past one year of hydration
Table 23 Pore solution composition of the 040 wcm paste made with fly ash slag and surrogate waste solution numbers in parentheses indicate one standard deviation of uncertainty
40-1-055 (mmolkgw)
Element 14 days 34 days (HNO3)
34 days (DI Water)
86 days
K 1861 (25) 2114 (38) 1985 (19) 2389 (49) Na 2482 (46) 3380 (48) 3478 (63) 3284 (16) S 1677 (13) 1810 (20) 1865 (39) 1974 (64) Ca 0335 (0006) 0151 (002) 0179 (005) 0205 (0002) Al - -Si 887 (15) 9078 (037)
44
Table 24 Pore solution composition of the 060 wcm paste made with fly ash slag and surrogate waste solution numbers in parentheses indicate one standard deviation of uncertainty
60-1-055 (mmolkgw)
Element 91 days 126 days (HNO3)
126 days (DI Water)
391 days (HNO3)
391 days (DI Water)
K 1524 (63) 1994 (17) 19813 (82) 23588 (81) 23766 (58) Na 3267 (30) 3260 (40) 3311 (44) 3287 (45) 3381 (79) S 1720 (70) 1862 (14) 2018 (13) 2266 (21) 2454 (16) Ca 1154 (0009) 0546 (0) 0262 (003) 167 (11) 0195 (003) Al -Si 12890 (35) 13911 (22) 7873 (29) 8531 (23)
There were two notable observations from the elemental concentration data The sodium concentration in pore solution of all the mixtures made with SWS was considerably lower than the more than 5 molkgw sodium concentration in the SWS solution There are a number of plausible explanations for this The very high concentration is a challenging measurement challenge one must reproduce the background accurately The lower than expected concentration may also be due to a greater than expected amount of sodium binding in the calcium silicate hydrate (C-S-H) This is plausible because the alkali binding increases with increasing cement replacement (resulting in lower CaSi molar ratios in the C-S-H) [30] and there are few data on binding at these sodium concentrations By contrast the silicon concentration was consistent with thermodynamic modeling prediction of a relatively significant silicon concentration in the pore solution
357 Total Sulfur
Determining the total sulfur content of the pore solution may be complicated by the two different forms in which it may be present Sulfates are commonly available in portland cement it is often added as gypsum during grinding It has been known for some time that blast furnace slag contributes sulfides to the pore solution of cementitious systems In principle the ICP-OES method will detect both forms of sulfur In practice however diluting the pore solution with nitric acid could convert some or all the sulfide to hydrogen sulfide (HS) which could be released as a gas If this were to occur the total quantity of sulfur detected by ICP would be less than the true value due to some of the sulfur being lost as a gas before the ICP measurement took place
On a few of the samples taken from mixtures made using surrogate waste solution two different dilution protocols were used The collected pore solution was filtered and divided into two sub-samples The first sample was diluted with nitric acid as described above The second sample was diluted using only water following the practice described by Lothenbach et al [31] These results have been included in the data in Table 23 and Table 24 with the dilution solution shown in parentheses From the data given in Table 23 and Table 24 there is no evidence that acid dilution removed much if any sulfur from the sample
45
One possible explanation for observing the same sulfur regardless of dilution type is that the sulfide had already oxidized prior to the pore expression resulting in all the sulfur being present as a sulfate This explanation however would be inconsistent with the samples being stored in air-tight plastic jars the observation of a dark green interior of the paste sample (the color saturation diminished upon exposure to air) and is inconsistent with detecting hydrogen sulfide gas (ldquorotten eggsrdquo) when cleaning a mortar and pestle with acid after the mortar and pestle had been used to crush small saltstone waste form samples
36 Discussion
As expected the blended binder systems (40-1-055 and 60-1-055) contained no measureable portlandite This is to be expected because in the absence of a source of additional calcium the alumina and silica in the fly ash and slag will consume the calcium in the portlandite (created by the portland cement hydration) to create additional C-S-H
There are two important points of comparison between the ordinary portland cement paste mixtures and the blended binders with SWS In the 040 wcm ordinary portland cement paste (40-0-100) the combined mass fraction of the hemicarbonate monocarbonate and ettringite phases is approximately 125 after 12 weeks of hydration In the 040 wcm pastes containing both blended binders and SWS (40-1-055) the same total was less then 25 and there was no ettringite detected In the 060 wcm ordinary portland paste (60-0-100) the same sum was more than 17 while in the 060 wcm paste containing both blended binders and SWS (60-1-055) the sum was below 2 and there was no ettringite detected Therefore although the SWS was contributing considerable sulfate to the mixture the overall chemistry was suppressing the formation of sulfate-bearing phases compared to the amount generated during the hydration of OPC pastes made with water
The pore solution analysis bears this out The sulfur content of the pore solution of the ordinary portland cement 40-0-100 specimen was approximately 15 mmolkgw and the sulfur content of the blended binder and SWS 40-1-055 specimen pore solution was nearly 200 mmolkgw This increase is consistent with having additional sulfur in the SWS and the simultaneous absence of sulfur-bearing minerals being formed during hydration For the 060 wcm specimens the corresponding difference was more dramatic The sulfur content of the pore solution of the ordinary portland cement 60-0-100 specimen was less than 10 mmolkgw and the sulfur content of the blended binder and SWS 60-1-055 specimen pore solution reached nearly 250 mmolkgw This greater difference between the ordinary portland cement system and the blended system is due largely to the greater ldquomix waterrdquo fraction of the 060 wcm mixture designs
After three months of hydration the type and quantity of mineral phases appear to be stable No unexpected phases are forming and the quantity of existing minerals is changing gradually Moreover the types of mineral phases observed are also commonly found in typical blended cement systems using in construction
37 Summary
In general the hydrated phases and pores solution composition of saltstone grouts is similar to what one might expect for these systems Despite the uniqueness of the binder proportions and the concentrated solution used as the mix water the observed phases and their proportions were not significantly different from what is observed in an analysis of an ordinary portland cement paste made with water
46
The most notable difference between the ordinary portland cement pastes and the synthetic saltstone was the absence of ettringite and the decreased production of hemicarbonate and monocarbonate even after one year of hydration The pore solution chemistry of the saltstone which is dominated by the contribution of the SWS appears to suppress the formation of sulfate-bearing mineral phases despite the contribution of additional sulfate in the SWS Moreover although solid sodium nitrate (nitratine) was detected in both the XRD and the TGA measurements it was determined that these observations were the result of an experimental artifact
The sodium concentration in the pore solution was less than expected most probably because the degree of sodium binding (into the hydration phases) has never been quantified at these very high concentrations and for the type of C-S-H formed by these blended systems Moreover after one year of hydration the mineral phases that were detected are found in blended cement concretes and these mineral phases appear to be relatively stable
47
4 CONCLUSION
Methods have been developed for characterizing the hydration phases and the pore solution composition of cementitious systems containing very little portland cement large quantities of fly ash and slag and a concentrated salt solution The material was characterized using isothermal calorimetry thermogravimetric analysis (TGA) quantitative X-ray powder diffraction (QXRD) image segmentation of elemental maps created by electron probe microanalysis performed on a scanning electron microscope (SEM) and aqueous phase analysis by inductively coupled plasma ndash optical emission spectroscopy (ICP-OES) In nearly all cases existing methodologies had to be modified or improved to work with these materials
The hydrated phase analysis by QXRD was facilitated to a degree by TGA For the mixtures having little or no fly ash or slag TGA analysis of the portlandite content was a useful means of establishing an internal standard for the QXRD analysis For the anticipated saltstone formulation however all of the portlandite is consumed by the fly ash and slag hydration so an internal crystalline standard (corundum) is required
A method using image segmentation was developed and shown to be a useful method of hydrated phase identification and quantification The image segmentation process may have its greatest strength in classifying the glassy phases of these blended systems because the relevant glassy phases (fly ash slag and C-S-H) appear differently By comparison quantitative X-ray diffraction can only determine total mass fraction of glassy phases by using an internal standard and subtracting out the mass fraction of the crystalline phases Before image segmentation can be used reliably however independent chemical analysis experiments are needed to validate the method
The hydrated samples were squeezed in a press to extract the pore solution which was then analyzed using ICP-OES to estimate the concentration of the atomic elements present The observed sodium concentration in the pore solution was approximately one-half the sodium concentration in the salt solution which was attributed in part to absorption of the sodium by the C-S-H The total sulfur concentration in the saltstone was approximately twenty times greater than the sulfur concentration in the portland cement pastes mixed with water and two different dilution methods were used to confirm that reduced sulfur (sulfide) was not being lost as hydrogen sulfide gas during sample preparation The higher alkalinity in the saltstone pore solution resulted in a factor of ten lower calcium concentration in the saltstone waste This fact was associated with a decrease in the quantity of sulfate phases being formed in the saltstone From this it was concluded that as long as the saltstone pore solution remains alkaline there is a low expectation of finding the types of sulfate phases that one associates with expansive sulfate attack
Ultimately these data and techniques will support the development of new tools for performance assessments of cementitious materials used in the nuclear infrastructure These tools will need to accurately predict the mineralogy and pore solution composition for a wide range of cementitious systems including saltstone waste forms Because these mixtures with their very low portland cement content and concentrated wastes solutions are not common practice within the concrete construction industry these data will help to develop a basis of understanding for these systems Specifically they will support models to accurately predict the type and quantity of hydrated phases and the equilibrium pore solution of blended cement systems This information coupled with detailed information about the environment can then be used to predict the long-term performance of these materials
48
5 REFERENCES
1 Bradford A Esh D Ridge A Thaggard M Whited R Treby S Flanders S and Camper LW ldquoUS Nuclear Regulatory Commission Technical Evaluation Report for the US Department of Energy Savannah River Site Draft Section 3116 Waste Determination for Salt Waste Disposalrdquo Technical Report (US Nuclear Regulatory Commission Washington DC 2005)
2 ASTM C 1679 ldquoStandard Practice for Measuring Hydration Kinetics of Hydraulic Cementitious Mixtures Using Isothermal Calorimetryrdquo Annual Book of ASTM Standards Vol 0402 ASTM International West Conshohocken PA (2010)
3 M Abramowitz and IA Stegun Handbook of Mathematical Functions Dover Publications Inc New York (1972)
4 ASTM C 1365 ldquoStandard Test Method for Determination of the Proportion of Phases in Portland Cement and Portland Cement Clinker Using X-Ray Powder Diffraction Analysisrdquo Annual Book of ASTM Standards Vol 0401 ASTM International West Conshohocken PA (2010)
5 HP Klug and LE Alexander X-Ray Diffraction Procedures Wiley-Interscience New York 966 pp (1974)
6 Certificate of Analysis Standard Reference Materialreg 674b X-Ray Powder Diffraction Intensity Set for Quantitative Analysis by X-Ray Powder Diffraction National Institute of Standards and Technology (2007)
7 Certificate of Analysis Standard Reference Materialreg 676 Alumina Internal Standard for Quantitative Analysis by X-Ray Powder Diffraction National Institute of Standards and Technology (2005)
8 P Stutzman ldquoMultispectral Imaging of Cementitious Materialsrdquo in Proceedings of the 29th
International Cement Microscopy Association Conference pp 20-24 Quebec City Canada (2007) 9 P Stutzman ldquoScanning Electron Microscopy Imaging of Hydraulic Cement Microstructurerdquo Cement
and Concrete Composites 26 (8) 957-966 (2004) 10 DP Bentz and PE Stutzman ldquoSEM Analysis and Computer Modeling of Hydration of Portland
Cement Particlesrdquo in Dehayes SM Stark D Eds Petrography of Cementitious Materials ASTM STP 1215 pp 60-73 ASTM International West Conshohocken PA (1994)
11 JI Goldstein DE Newbury P Echlin AD Romig Jr CE Lyman C Fiori and E Lifshin Scanning Electron Microscopy and X-Ray Microanalysis second edition Plenum Press New York (1981)
12 httprsbwebnihgovij
13 httpsengineeringpurdueedu~biehlMultiSpec 14 RS Barneyback Jr and S Diamond ldquoExpression and analysis of pore fluid from hardened cement
paste and mortarsrdquo Cement and Concrete Research 11 279-285 (1981) 15 B Lothenbach and F Winnefeld ldquoThermodynamic modelling of the hydration of portland cementrdquo
Cement and Concrete Research 36(2) 209-226 (2006) 16 T Wagner DA Kulik FF Hingerl SV Dmytriev ldquoGEM-Selektor geochemical modeling
package TSolMod library and data interface for multicomponent phase modelsrdquo Canadian Mineralogist 50(5) 1173-1195 (2012)
49
17 B Lothenbach B G Le Saout E Gallucci and K Scrivener ldquoInfluence of limestone on the hydration of Portland cementsrdquo Cement and Concrete Research 38 848-860 (2008)
18 Stutzman P and Leigh S ldquoPhase Composition Analysis of the NIST Reference Clinkers by Optical Microscopy and X-ray Powder Diffractionrdquo NIST Technical Note 1441 National Institute of Standards and Technology Gaithersburg MD (2002)
19 httprruffgeoarizonaeduAMSamcsdphp amp httpdatabaseiemacrumincryst
20 HFW Taylor Cement Chemistry Academic Press New York (1990) 21 A Le Bail lsquoModelling the silica glass structure by the Rietveld methodrsquo J Non-Cryst Solids 183
39-42 (1995) 22 httpcikscbtnistgov4sight
23 LJ Parrott and DC Killoh ldquoPrediction of cement hydrationrdquo Br Ceram Proc 35 41-53(1984) 24 K Dixon J Harbour and M Phifer ldquoHydraulic and Physical Properties of Saltstone Grouts and
Vault Concretesrdquo SRNL-STI-2008-00421 Savannah River National Laboratory (November 2008) 25 httpwwwcementbarriersorg
26 JW Bullard PE Stutzman KA Snyder EJ Garboczi ldquoTask 7 THAMES Demonstration (NIST)rdquo CBP-TR-2010-00007-C2 Rev 00 DOE Savannah River National Laboratory Aiken SC (2010)
27 JR Harbour EK Hansen TB Edwards VJ Williams RE Eibling DR Best and DM Missimer ldquoCharacterization of Slag Fly Ash and Portland Cement for Saltstonerdquo WSRC-TR-2006-00067 Savannah River National Laboratory Aiken SC (February 2006)
28 BD Bond and PWM Jacobs J Chem Soc A 1265-1268 (1966)
29 GL Paul and AW Pryor Acta Cryst Section B 28 2700-2702 (1972) 30 S-Y Hong and FP Glasser ldquoAlkali binding in cement pastes Part I The C-S-H phaserdquo Cement
and Concrete Research 29 1893-1903 (1999) 31 B Lothenbach G LeSaout M Ben Haha R Figi and E Wieland ldquoHydration of low-alkali CEM
IIIB-SiO2 cement (LAC)rdquo Cement and Concrete Research 42 (2) 410-423 (2012)
50
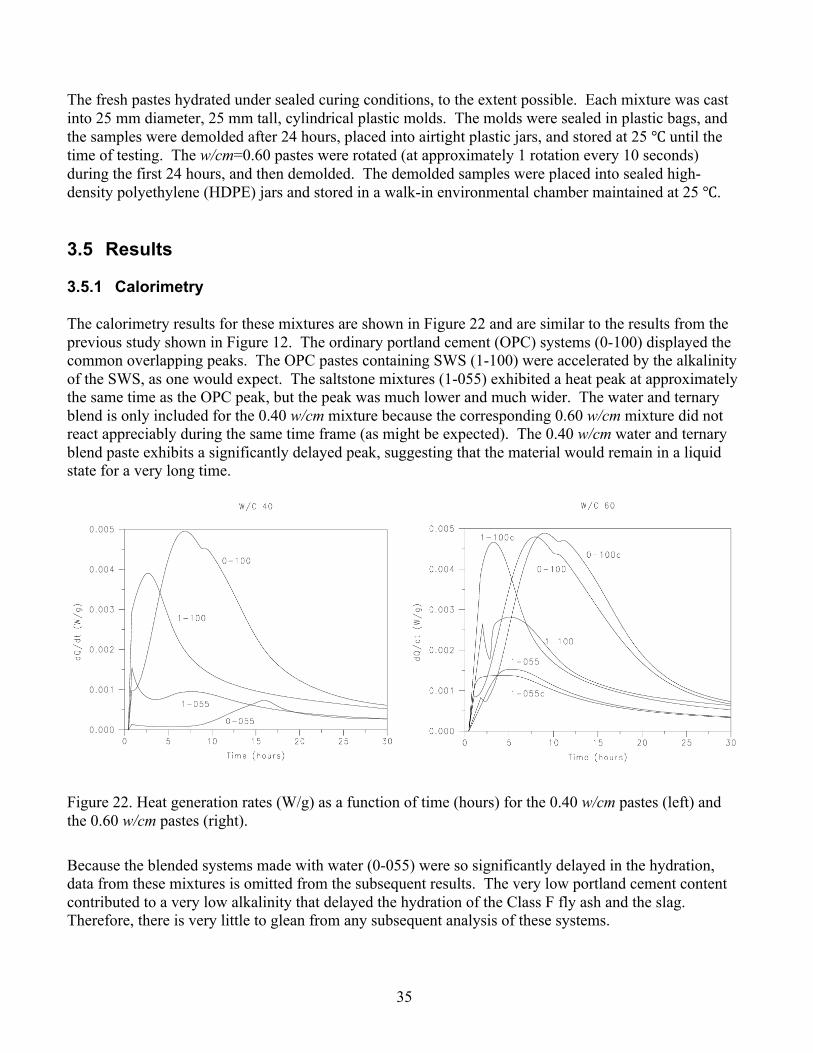
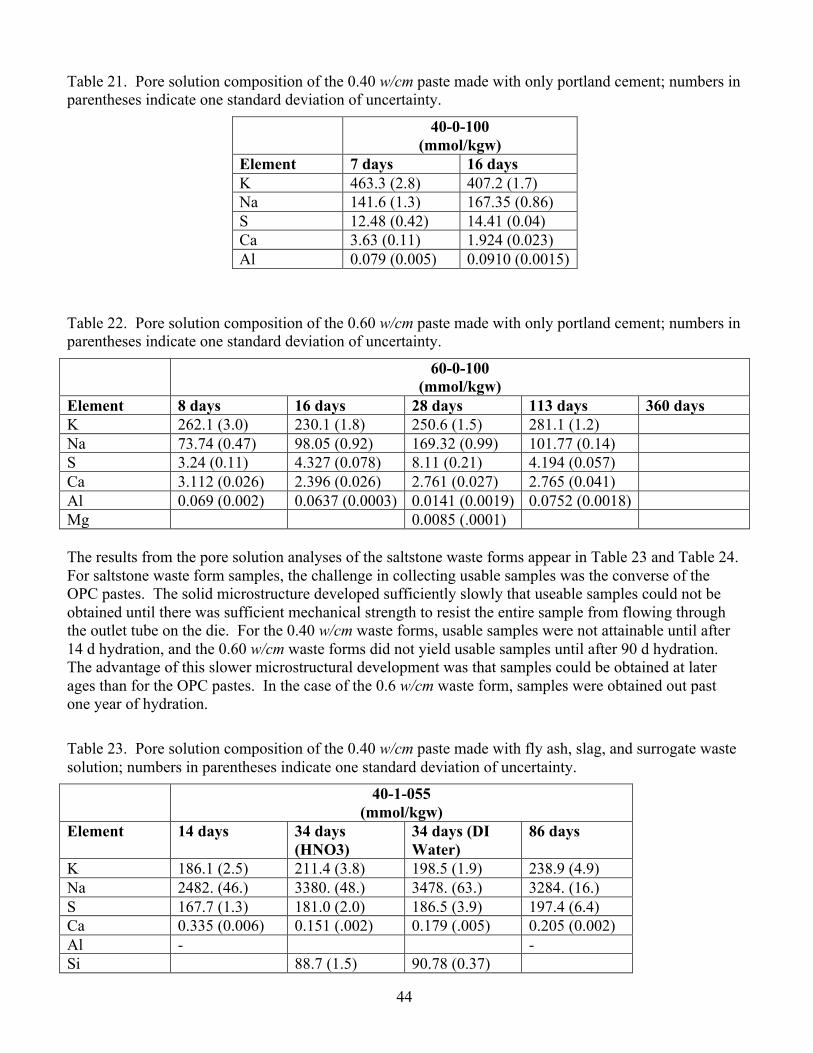