Embed Size (px)
Citation preview
OFFICE TRACTION@GLANCE
HYDERABAD OFFICETRACTION@GLANCEFebruary 2014
SECTORAL ANALYSIS GEOGRAPHIC ANALYSIS OUTLOOK

HYDERABAD MAP

4
Introduction
consulting and media grow over the
years and they constitute almost 14%
of the market today. Extremely
affordable rentals, ample availability of
quality real estate and a massive talent
pool make Hyderabad one of the most
attractive destinations for the IT/ITeS
sector in India.
The Hyderabad office market is
classified in to different business
districts. Locations like Begumpet,
Ameerpet, Somajiguda, Banjara Hills
and Jubilee Hills form the CBD & Off-
CBD office markets. Other key micro-
markets like Madhapur, Kondapur and
HITEC City form the Suburban Business
District (SBD) and primarily comprise
the IT/ITeS strength of the region.
Another key IT/ITeS hub, Gachibowli,
forms a part of the Peripheral Business
District-West (PBD W) micro-market.
Locations such as Uppal and Pocharam
towards the east that have the lowest
rents in Hyderabad constitute the
Peripheral Business District-East (PBD E)
micro-market. Extensive infrastructure
developments like Outer Ring Road and
radial roads have further led to office
space development in peripheral
locations like Shamshabad, Pocharam
and other HADA localities.
yderabad is the administrative, Hfinancial and economic capital
of Andhra Pradesh and the
largest contributor to the state's GDP.
This city whose commercial landscape
was predominantly made up of
engineering based industries and
trading companies has seen a dramatic
change over the last few decades.
With the IT boom, global IT/ITeS
leaders like Google, IBM, Accenture, CA,
HP, GE and Convergys set up offices in
Hyderabad and furthered the case for
large scale development of
infrastructure facilities and rapid
growth of contiguous locations
surrounding the HITEC City area which
is at the centre of the IT boom in
Hyderabad.
The office space market in Hyderabad
today is dominated by the IT/ITeS
sector that occupies almost 78% of the
stock while the manufacturing and BFSI
sectors occupy 6% and 4% respectively.
The prime factors working in favour of
the Hyderabad office market are its
reasonable rental values and better
infrastructure, as compared to other
IT/ITeS dominated cities. Hyderabad
has also seen the presence of other
service sector companies like
The Hyderabad office
market lost some traction
during 2013 as absorption
numbers were down by
approximately 9%
compared to 2012. These
depressed absorption
numbers coupled with over
6.7 mn.sq.ft. of office space
coming online during the
year have caused
vacancy levels to spike
considerably from 14% in
2012 to almost 18% at the
end of 2013. However, this
has not affected rentals yet
as the average rental rates
have stayed sticky over the
past year.
OFFICE TRACTION@GLANCE FEB 2014
Business District Classification
Business District Micro-markets
FIGURE 1
Source: Knight Frank Research
CBD & Off-CBD Banjara Hills, Jubilee Hills, Begumpet, Ameerpet, Somajiguda, Himayat nagar, Raj Bhavan Road, Punjagutta
SBD HITEC City, Kondapur, Madhapur, Manikonda, Kukatpally, Raidurg
PBD West Gachibowli, Kokapet, Madinaguda, Nanakramguda, Serilingampally
PBD East Uppal, Pocharam
Year New Completion Stock Vacancy Total Absorption (mn.sq.ft.) (mn.sq.ft.) (mn.sq.ft.)
2012 5.1 49.1 14% 4.1
2013 6.7 55.9 18% 3.7
2014E 3.4 59.3 16% 3.8
Source: Knight Frank Research
FIGURE 2

Currently, the total office space stock in
Hyderabad is 55.9 mn.sq.ft. of which
44.8 mn.sq.ft. is occupied resulting in a
vacancy level of 18%. Vacancy levels
have been on the rise since 2011 when
they were at 13% as absorption
numbers have fallen substantially in the
face of continuously increasing supply.
Hyderabad is endowed with all the
elements that can nurture the growth
of a vibrant office market much like
Bengaluru. However, the lack of political
will that has kept the Telangana issue
festering has rendered the business
environment uncertain enough to deter
fresh investments from corporates.
Consequently the real estate market
has suffered as the city was unable to
fulfil its potential as corporates waited
on the side lines for some measure of
closure on Telangana.
The Hyderabad office market witnessed
a contraction in absorption levels
during 2013 as the impact of regional
political upheaval and unfavourable
global economic conditions were felt
across sectors. Occupiers remained
cautious about their expansion plans
and refrained from expanding current
operations. 2013 saw corporates focus
largely on consolidating existing office
spaces to enhance operational
efficiencies and reduce costs.
The Hyderabad office market lost some
traction during 2013 as absorption
numbers were down by approximately
9% compared to 2012. These depressed
absorption numbers coupled with over
6.7 mn.sq.ft. of office space coming
online during the year have caused
vacancy levels to spike considerably
from 14% in 2012 to almost 18% at the
end of 2013. However, this has not
affected rentals yet as the average
rental rates have stayed sticky over the
past year.
Sectoral
Analysis
The IT/ITeS sector has been the primary
driver of the office space market in
Hyderabad and accounted for
approximately 2.84 mn.sq.ft. of
absorption in 2013. This sector forms
the backbone of the Hyderabad office
space market and consistently takes up
the lion's share of the transactions pie.
IT/ITeS sector companies such as
Cognizant, Google and Amazon were
among the companies that took up
large format office spaces during this
year.
A 0.35 mn.sq.ft. lease in Raheja
Mindspace at HITEC City inked by
IT/ITeS major Cognizant was the
largest transaction during 2013.
The manufacturing sector share lost
some ground over 2012 as it accounted
for 0.23 mn.sq.ft. in 2013. The bulk of
the space transacted by this sector was
concentrated in the SBD. A 65,000 sq.ft.
lease inked by pharmaceuticals major,
Aurobindo Pharma at Water Mark Tech
Park in HITEC City was the largest deal
signed by manufacturing sector
company during 2013. With the central
government's focus on increasing the
share of the manufacturing sector in
India's GDP, it is likely that this sector's
share will stay buoyant.
The market share of the BFSI sector
stayed constant over the analysis
period and most of the 0.14 mn.sq.ft.
taken up by this sector during 2013 was
concentrated in the SBD locations of
HITEC City and Raidurg. Invesco,
Andhra Bank and HDFC were among
the BFSI sector companies active during
2013.
The other services sector saw its market
share increase significantly as it
accounted for approximately
0.52 mn.sq.ft. in 2013, nearly 89% of
which was transacted in the SBD
business district. Consultancy firms like
Deloitte, Halcrow and Ernst & Young
and telecom service providers such as
AT&T and Beam Cables were among
the prominent other service sector
companies active in the market during
2013.
5
12%4%
19%
64%
FIGURE 4
Source: Knight Frank Research
Business District Wise Distributionof Stock
CBD & Off CBDSBD
PBD East PBD West
4%
78%
6%
13%
IT/ITeS Manufacturing
Other Services Sector*
FIGURE 3
Occupier Profile
Source: Knight Frank Research
BFSI
* Service sector companies besides those included in the
BFSI and IT/ ITeS category
OFFICE TRACTION@GLANCE FEB 2014
Distribution of Office Space Absorption Across Sectors
Source: Knight Frank Research
FIGURE 6
Broad Industry 2012 2013Classifications
BFSI 4% 4%
IT/ITeS 78% 76%
Manufacturing 9% 6%
Other Services Sector* 9% 14%
* Service sector companies besides those included in the
BFSI and IT/ ITeS category
A Comparison of Sale andLease Transactions
Total Area transacted
2012 2013
4.11 mn.sq.ft. 3.74 mn.sq.ft.
Average lease rate
2012 2013
`35-37/ sq.ft./ month `36-38/ sq.ft./ month
Source: Knight Frank Research
FIGURE 5

Business District and Year Wise
Absorption in Hyderabad
70%
60%
50%
40%
30%
20%
10%
0%
2012 2013
% S
hare
FIGURE 8
Source: Knight Frank Research
CBD & Off CBDSBD
PBD East PBD West
6
GeographicAnalysis
respectively. IT/ITeS majors Cognizant
and Google accounted for nearly 30%
of the sector's absorption volume while
a 0.26 mn.sq.ft. lease inked by Deloitte
at Meenakshi Tech Park in HITEC City
claimed more than half of the space
taken up by the other services sector
during 2013.
The SBD business district currently has
a stock of 29.4 mn.sq.ft. with vacancy
levels at a healthy 11%. However,
vacancy levels in the SBD rose from 9%
in 2012 to 11% in 2013 due to almost
4.4 mn.sq.ft. of office space coming
online during the year. Nearly half of
this space was constituted by IT SEZs
like Avance Business Hub and Divyasree
Orion while Divyasree Omega and The
Watermark Technopark were the
prominent IT Parks that became fully
operational during 2013.
The PBD West business district of
Hyderabad lies further west of the
SBD and is fast gaining prominence
as it offers a significant price
arbitrage and greater choice to the
office occupier without
compromising on overall project
quality.
It is the second largest business district
of Hyderabad having 13.2 mn.sq.ft. of
office stock and vacancy levels close to
26%. This business district saw its
market share spike YoY as it claimed
approximately 0.75 mn.sq.ft. of the
space absorbed during 2013. Almost all
of the space absorbed in this business
district was taken up by the IT/ITeS
sector and concentrated in the two
locations of Gachibowli and
Nanakramguda. Amazon, Capgemini,
Sutherland and Zensar Technologies
were among the most active companies
during the year while Jayabheri Orange
IT Towers and Waverock in
Nanakramguda and DLF SEZ and Lanco
SEZ in Gachibowli saw the most
traction.
The share of the CBD & Off-CBD
business district has fallen consistently
as its desirability as a premium office
space destination has reduced
considerably over time. Occupiers have
shifted to comparatively lower priced
options in the SBD that today offer
similar market dynamics as the
erstwhile CBD & Off-CBD. 2013
absorption numbers have stayed true
to the trend and fallen 44% YoY
clocking approximately 0.52 mn.sq.ft. in
2013. Over 72% of the transactions in
this business district took place in
Banjara Hills and nearly 80% of these
were accounted for by the IT/ITeS
sector. Pramati Technologies,
Intergraph, USM Business Systems,
The SBD accounts for over 60% of the
office stock in Hyderabad and easily
dominates its absorption pie. Its market
share has stayed practically the same
YoY as appproximately 64% of the
transactions during 2013 took place in
the SBD market.
Just HITEC City and Kondapur
accounted for a massive 91% of the
total space transacted in the SBD. The
IT/ITeS and other service sectors took
up 71% and 20% of the space
OFFICE TRACTION@GLANCE FEB 2014
Select Transactions in the Hyderabad Office Market
Location Building Company Industry Approx. Area (sq.ft.)
HITEC City Raheja Mind Space Cognizant IT/ITeS 350,000
HITEC City Meenakshi Tech Park Deloitte Other Services Sector 258,000 Nanakramguda Jayabheri Orange IT Towers Amazon IT/ITeS 253,000
Kondapur Divyasree Omega Google IT/ITeS 150,000
Nanakramguda Waverock Capgemini IT/ITeS 125,000
Banjara Hills P&P Pramati Technologies IT/ITeS 100,000
HITEC City NSL Arena Infotech enterprises IT/ITeS 96,000
Gachibowli Lanco SEZ Sutherland IT/ITeS 80,000
Gachibowli DLF SEZ Hinduja Group IT/ITeS 70,000
HITEC City Water Mark Techpark Aurobindo Pharma Manufacturing 65,000
HITEC City Raheja Mindspace Qualcomm IT/ITeS 64,000
Source: Knight Frank Research
FIGURE 7
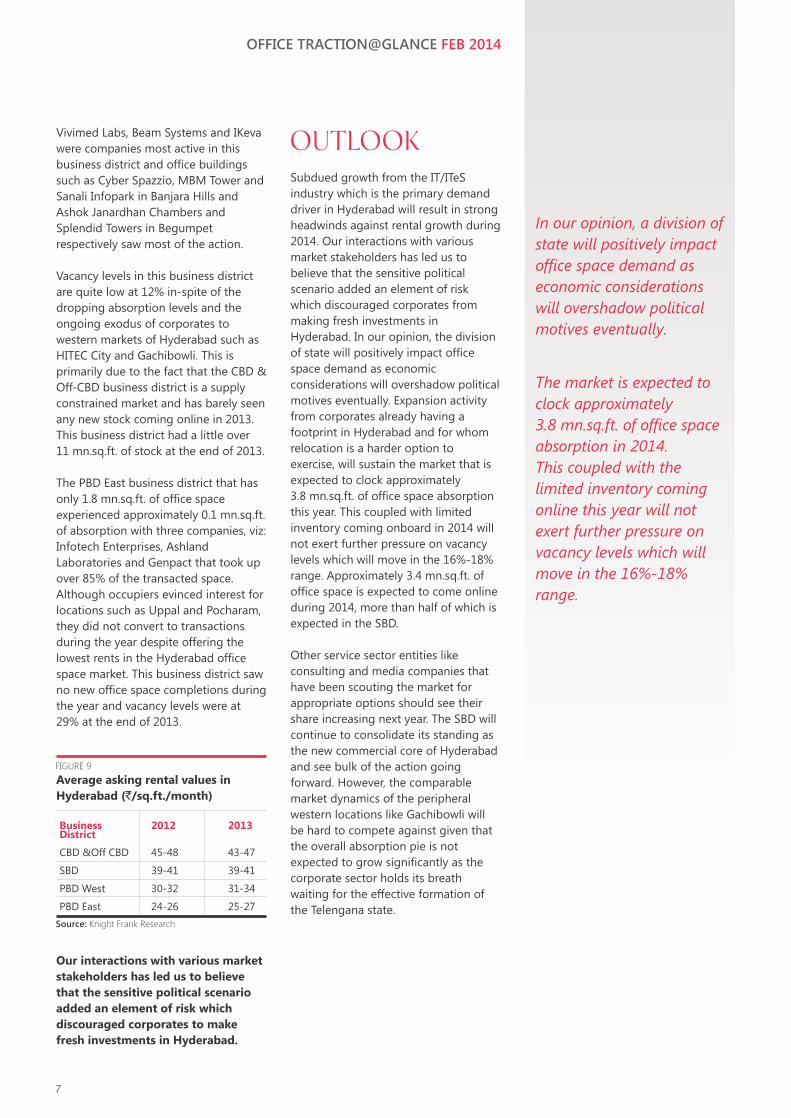
Subdued growth from the IT/ITeS
industry which is the primary demand
driver in Hyderabad will result in strong
headwinds against rental growth during
2014. Our interactions with various
market stakeholders has led us to
believe that the sensitive political
scenario added an element of risk
which discouraged corporates from
making fresh investments in
Hyderabad. In our opinion, the division
of state will positively impact office
space demand as economic
considerations will overshadow political
motives eventually. Expansion activity
from corporates already having a
footprint in Hyderabad and for whom
relocation is a harder option to
exercise, will sustain the market that is
expected to clock approximately
3.8 mn.sq.ft. of office space absorption
this year. This coupled with limited
inventory coming onboard in 2014 will
not exert further pressure on vacancy
levels which will move in the 16%-18%
range. Approximately 3.4 mn.sq.ft. of
office space is expected to come online
during 2014, more than half of which is
expected in the SBD.
Other service sector entities like
consulting and media companies that
have been scouting the market for
appropriate options should see their
share increasing next year. The SBD will
continue to consolidate its standing as
the new commercial core of Hyderabad
and see bulk of the action going
forward. However, the comparable
market dynamics of the peripheral
western locations like Gachibowli will
be hard to compete against given that
the overall absorption pie is not
expected to grow significantly as the
corporate sector holds its breath
waiting for the effective formation of
the Telengana state.
Vivimed Labs, Beam Systems and IKeva
were companies most active in this
business district and office buildings
such as Cyber Spazzio, MBM Tower and
Sanali Infopark in Banjara Hills and
Ashok Janardhan Chambers and
Splendid Towers in Begumpet
respectively saw most of the action.
Vacancy levels in this business district
are quite low at 12% in-spite of the
dropping absorption levels and the
ongoing exodus of corporates to
western markets of Hyderabad such as
HITEC City and Gachibowli. This is
primarily due to the fact that the CBD &
Off-CBD business district is a supply
constrained market and has barely seen
any new stock coming online in 2013.
This business district had a little over
11 mn.sq.ft. of stock at the end of 2013.
The PBD East business district that has
only 1.8 mn.sq.ft. of office space
experienced approximately 0.1 mn.sq.ft.
of absorption with three companies, viz:
Infotech Enterprises, Ashland
Laboratories and Genpact that took up
over 85% of the transacted space.
Although occupiers evinced interest for
locations such as Uppal and Pocharam,
they did not convert to transactions
during the year despite offering the
lowest rents in the Hyderabad office
space market. This business district saw
no new office space completions during
the year and vacancy levels were at
29% at the end of 2013.
Our interactions with various market
stakeholders has led us to believe
that the sensitive political scenario
added an element of risk which
discouraged corporates to make
fresh investments in Hyderabad.
7
In our opinion, a division of
state will positively impact
office space demand as
economic considerations
will overshadow political
motives eventually.
Outlook
OFFICE TRACTION@GLANCE FEB 2014
The market is expected to
clock approximately
3.8 mn.sq.ft. of office space
absorption in 2014.
This coupled with the
limited inventory coming
online this year will not
exert further pressure on
vacancy levels which will
move in the 16%-18%
range.
Average asking rental values in
Hyderabad (`/sq.ft./month)
Business 2012 2013 District
CBD &Off CBD 45-48 43-47
SBD 39-41 39-41
PBD West 30-32 31-34
PBD East 24-26 25-27
Source: Knight Frank Research
FIGURE 9
Knight Frank India research provides development and strategic advisory
to a wide range of clients worldwide. We regularly produce detailed and
informative research reports which provide valuable insights on the real
estate market. Our strength lies in analyzing existing trends and predicting
future trends in the real estate sector from the data collected through
market surveys and interactions with real estate agents, developers, funds
and other stakeholders.
This report is published for general information only and not to be relied
upon in any way. Although high standards have been used in the
preparation of the information, analysis, views and projections presented in
this report, no responsibility or liability whatsoever can be accepted by
Knight Frank for any loss or damage resultant from any use of, reliance on
or reference to the contents of this document. As a general report, this
material does not necessarily represent the view of Knight Frank in relation
to particular properties or projects. Reproduction of this report in whole or
in part is not allowed without prior written approval of Knight Frank to the
form and content within which it appears.
Research
Dr. Samantak Das
Consultancy & Valuation
Saurabh Mehrotra
Office Agency
Viral Desai
Cities
Mumbai
Naushad Panjwani
NCR
Rajeev Bairathi
Bengaluru & Hyderabad
Satish BN
Pune
Shantanu Mazumder
Chennai
Kanchana Krishnan
Report Author
Yashwin Bangera, Lead Research Consultantwww.VelocitaBrand.com
OFFICE TRACTION@GLANCE