Embed Size (px)
Citation preview
ARENA
Hybridisation of Fossil Fuel Energy Generation in Australia
Public Report 20 November 2013

Document information
Client: ARENA Title: Hybridisation of Fossil Fuel Energy Generation in Australia Subtitle: Public Report Document No: 2158936A-POR-RPT-002 RevG Date: 20 November 2013
Rev Date Details
A 13/09/2013 Draft public report for comment
B 16/09/2013 Draft public report for distribution
C 20/09/2013 Draft public report
D 21/10/2013 Final draft public report
E 24/10/2013 Final draft public report complete
F 08/11/2013 Final
G 20/11/2013 Final
Author, Reviewer and Approver details
Prepared by: R Meehan Date: 04/11/2013 Signature:
Reviewed by: M Rudge Date: 06/11/2013 Signature:
Approved by: P Cameron Date: 08/11/2013 Signature:
Distribution
ARENA, Parsons Brinckerhoff file, Parsons Brinckerhoff Library
©Parsons Brinckerhoff Australia Pty Limited 2013
Copyright in the drawings, information and data recorded in this document (the information) is the property of Parsons Brinckerhoff. This document and the information are solely for the use of the authorised recipient and this document may not be used, copied or reproduced in whole or part for any purpose other than that for which it was supplied by Parsons Brinckerhoff. Parsons Brinckerhoff makes no representation, undertakes no duty and accepts no responsibility to any third party who may use or rely upon this document or the information.
Document owner
Parsons Brinckerhoff Australia Pty Limited ABN 80 078 004 798 Level 15 28 Freshwater Place Southbank VIC 3006 Tel: +61 3 9861 1111 Fax: +61 3 9861 1144 Email: [email protected] www.pbworld.com Certified to ISO 9001, ISO 14001, AS/NZS 4801 A GRI Rating: Sustainability Report 2011

Parsons Brinckerhoff | 2158936A-POR-RPT-002 RevG iii
ARENA Hybridisation of Fossil Fuel Energy Generation in Australia - Public Report
Contents Page number
Glossary vi
Executive summary ix
1. Introduction 1
1.1 Background 1
1.2 Study objectives 2
1.3 Study scope 2
1.3.1 Exclusions 3
1.4 Report structure 3
1.5 Disclaimers and limitations 3
1.5.1 Scope of services and reliance of data 3 1.5.2 Study for benefit of client 4 1.5.3 Other limitations 4
2. Potential for hybridisation 5
2.1 Technologies and applications 5
2.1.1 Solar thermal 5 2.1.2 Biomass 7 2.1.3 Geothermal 11
2.2 Level of penetration 12
2.2.1 Coal boiler hybridisation 13 2.2.2 CCGT hybrid 17 2.2.3 Discussion 18
2.3 Previous studies of hybridisation of fossil fuel plants 19
3. Assessment approach 29
3.1 Overview 29
3.2 Methodology 29
3.2.1 Initial screening of potential fossil fuel plants 29 3.2.2 Resource and technology suitability and fatal flaws assessment 30 3.2.3 MCA 33 3.2.4 Shortlist of projects and opportunity types 43 3.2.5 Analysis of shortlisted projects and opportunity types 43 3.2.6 Cost assessment 43
3.3 Stakeholder workshop 46
4. Findings 49

iv Parsons Brinckerhoff | 2158936A-POR-RPT-002 RevG
ARENA Hybridisation of Fossil Fuel Energy Generation in Australia - Public Report
4.1 Initial screening 49
4.2 Resource and technology suitability and fatal flaws assessment 51
4.2.1 Geothermal resource assessment 52
4.3 MCA 53
4.3.1 Power tower technology 53 4.3.2 OCGT assessment 53
4.4 Shortlisting of opportunity types 54
4.5 Stakeholder workshop 56
5. Assessment of shortlisted opportunity types 59
6. Conclusions and recommendations 65
6.1 Potential market for hybridisation 65
6.2 Shortlisting process 67
6.3 Scope for hybridisation 68
6.3.1 Cooperation of units – power generation 68 6.3.2 Cooperating units – industry 69
7. References 71
List of tables Page number
Table 2.1 Summary of CST technologies 7 Table 2.2 Potential for HTST capacity in solar assist (Wyld Group Pty Ltd, 2008) 19 Table 2.3 Extract from Table 3-1: Operating CST power station over 1MWe capacity as at
end 2011 22 Table 2.4 Ranking criteria 25 Table 2.5 Integration points for solar-augment 25 Table 2.6 Solar integration options for NGCC plants with duct firing 26 Table 2.7 Solar integration options for pulverised coal plants 27 Table 3.1 Resource and technology criteria 31 Table 3.2 Fatal flaws criteria 32 Table 3.4 Technical criteria 35 Table 3.5 Commercial and financial criteria 37 Table 3.6 Environmental and planning criteria 38 Table 3.7 Social and community criteria 38 Table 3.8 Solar MCA weightings 40 Table 3.9 Biomass MCA weightings 41 Table 3.10 Geothermal MCA weightings 42 Table 3.11 Key Assumptions – LCOE 44 Table 3.12 Fuel costs (BREE, 2012) 45 Table 4.1 Potential power plants for consideration 49 Table 4.2 Notable exclusions 51

Parsons Brinckerhoff | 2158936A-POR-RPT-002 RevG v
ARENA Hybridisation of Fossil Fuel Energy Generation in Australia - Public Report
Table 4.3 Opportunities for MCA 52
List of figures Page number
Figure E. 1 Overview of approach x Figure E. 2 Overview of shortlisting process xi Figure E. 3 Overview of MCA scores xi Figure E. 4 LCOE of hybridised plants attributable to renewables components for all
opportunity types xiii Figure 2.1 CST technologies (a) parabolic trough, b) linear Fresnel, c) power tower and d)
parabolic dish) 6 Figure 2.2 Dominion Power coal to biomass conversion (ESI Steam & Power, 2013) 10 Figure 2.3 Predicted temperature at 5 km depth (Geoscience and ABARE, 2010) 12 Figure 2.4 Coal-fired parallel solar integration schematic 14 Figure 2.5 Coal-fired solar boost integration schematic 15 Figure 2.6 Dedicated biomass boiler integration schematic 16 Figure 2.7 Geothermal preheating in the low-pressure feed heating train integration schematic 17 Figure 2.8 Gas-fired solar boost integration schematic 18 Figure 3.1 Overview of approach 29 Figure 3.2 Resource and technology suitability and fatal flaws assessment process 30 Figure 4.1 Overview of MCA scores 53 Figure 4.2 Example demand and resource availability for location in South Australia 54 Figure 4.3 Potential solar hybrid projects 55 Figure 4.4 Potential biomass hybrid projects 55 Figure 5.1 Total CAPEX vs. total installed MW 60 Figure 5.2 Renewable component of CAPEX vs. renewable component of MW 61 Figure 5.3 OPEX contribution to total sent-out LCOE 62 Figure 5.4 Contribution of renewable component of OPEX to renewable sent-out LCOE 62 Figure 5.5 Total LCOE of hybridised plants 63 Figure 5.6 Delta total LCOE of hybridised plants compared with exiting configurations 63 Figure 5.7 LCOE of hybridised plants attributable to renewables components 64 Figure 6.1 LCOE of hybridised plants attributable to renewables components for all
opportunity types 66 Figure 6.2 Overview of shortlisting process 67
List of appendices Appendix A Biomass feedstock assessment Appendix B Penetration level modelling integration schematics Appendix C List of fossil fuelled power plants Appendix D Resource and technology suitability and fatal flaws assessment scoring sheet Appendix E MCA scoring sheet Appendix F Stakeholder workshop attendees Appendix G GIS maps

vi Parsons Brinckerhoff | 2158936A-POR-RPT-002 RevG
ARENA Hybridisation of Fossil Fuel Energy Generation in Australia - Public Report
Glossary AEMO Australian Energy Market Operator
ARENA/Client Australian Renewable Energy Agency
ASI Australian Solar Institute
A$ Australian Dollar
BFB Bubbling Fluidised Bed
CAPEX Capital Expenditure
CCGT Combined Cycle Gas Turbine
CCS Carbon Capture and Storage
CFB Circulating Fluidised Bed
CPV Concentrating Photovoltaic
CSG Coal Seam Gas
CSP Concentrating Solar-Power
CST Concentrating Solar Thermal
DCF Discounted Cash Flow
DKIS Darwin-Katherine Interconnected System
DNI Direct Normal Irradiance
EPC Engineering, Procurement and Construction
EPRI Electric Power Research Institute
FF Fossil Fuel
FW Feedwater
GIS Geographic Information System
GT Gas Turbine
HP High Pressure
HRSG Heat Recovery Steam Generator
HTST High Temperature Solar Thermal
IEA International Energy Agency
IGCC Integrated Gasification and Combined Cycle
IP Intermediate Pressure
IRENA International Renewable Energy Agency
LCOE Levelised Cost of Electricity
LP Low Pressure
MCA Multi Criteria Analysis
MSW Municipal Solid Waste
MW Megawatt
MWe Megawatt electrical

Parsons Brinckerhoff | 2158936A-POR-RPT-002 RevG vii
ARENA Hybridisation of Fossil Fuel Energy Generation in Australia - Public Report
MWth Megawatt thermal
NEM National Energy Market
NG Natural Gas
NGCC Natural Gas Combined Cycle
NPV Net Present Value
NREL National Renewable Energy Laboratory
NSW New South Wales
NWIS North West Interconnected System
O&M Operations and Maintenance
OCGT Open Cycle Gas Turbine
OT Opportunity Type
PV Photovoltaic
QLD Queensland
R&D Research and Development
SA South Australia
SAM System Advisor Model
SCR Selective Catalytic Reduction
ST Steam Turbine
SWIS South West Interconnected System
UK United Kingdom
US$ United States Dollar
WA Western Australia

Parsons Brinckerhoff | 2158936A-POR-RPT-002 RevG ix
ARENA Hybridisation of Fossil Fuel Energy Generation in Australia - Public Report
Executive summary The Australian Renewable Energy Agency (ARENA)’s mandate is to improve the competitiveness of renewable energy technologies and increase the supply of renewable energy in Australia. As hybridisation of renewable energy technologies and existing fossil plants is an important near-term application for renewable systems, ARENA commissioned Parsons Brinckerhoff to conduct this study exploring the potential for deployment of hybrid power stations in Australia, and whether there is a sufficient market for a possible ARENA Strategic Initiative.
Hybridisation technologies considered In the context of this study, hybridisation refers to the integration of renewable technology into the thermal cycle of existing fossil fuel power stations. Therefore, Parsons Brinckerhoff considered renewable technologies that are capable of thermal cycle integration and have the potential to be widely deployed across Australia without being unique solutions applicable to individual power stations. The renewable technologies the study explored are:
solar thermal: parabolic trough, linear Fresnel and power tower
biomass: direct combustion, gasification, pyrolysis and anaerobic digestion
geothermal: enhanced geothermal systems (hot rock) and hot sedimentary aquifer systems.
Hybrid configuration and level of penetration1 Coal boiler hybridisation
Concentrated solar thermal (CST) hybridisation with coal boiler power plants can be achieved by two methods:
installing a solar thermal plant in parallel with the existing boiler, enabling the CST plant to deliver the same superheat and reheat conditions as the host plant (up to approximately 30% penetration may be achieved). This is only achievable for a sub-critical plant as conventional CST technologies cannot produce temperatures required to match the high pressure (HP) turbine inlet conditions of a super-critical plant
solar boost where solar heat is used to substitute for fossil fuels in feedwater heating or steam reheating equipment. The greatest degree of penetration results in boosting the temperature of the feedwater to the boiler (up to 7.9% penetration may be achieved).
Biomass hybridisation with coal boiler power plants may be achieved by one of two methods:
co-firing of biomass with coal (up to 12.5% penetration may be achieved)
installation of a dedicated biomass boiler to provide steam to the high-pressure feed heaters or reheater (up to 8.5% penetration may be achieved).
For geothermal hybridisation, due to the low resource temperatures available in proximity to potential fossil fuel plants, the best use of geothermal heat for hybridisation would be to supply heating steam to the low-pressure feed heaters (up to 4.5% penetration may be achieved).
1 Penetration refers to the per cent of rated energy output

x Parsons Brinckerhoff | 2158936A-POR-RPT-002 RevG
ARENA Hybridisation of Fossil Fuel Energy Generation in Australia - Public Report
CCGT hybrid
For CST hybridisation, reducing the output of a combined cycle gas turbine (CCGT) power plant to enable a solar boost is not desirable because gas turbine efficiency reduces at partial load. However, for a duct-fired CCGT plant or a conversion of an existing open cycle gas turbine (OCGT) plant to CCGT, significant additional output may be achieved by adding CST steam to the superheater inlet section of the heat recovery steam generator (HRSG) (up to 16% penetration may be achieved).
Biomass gasification to supply gas turbines has not been demonstrated to be commercially viable and has therefore not been considered for this study.
Assessment approach
Figure E. 1 Overview of approach
The approach, illustrated in Figure E. 1, involved a multi-staged screening process, which included the steps outlined below.
Initial screening of potential fossil fuel plants:
grid connected (NEM, SWIS, NWIS, DKIS)
greater than 100 MWe capacity
fuelled by black coal, gas (NG, CSG) or non-Victorian lower-rank coal (excludes Victorian lignite which is covered by a separate study)
Resource and technology suitability and fatal flaws assessment:
solar resource and technology suitability
biomass resource and technology suitability
geothermal resource and technology suitability
plant adaptability
environmental considerations
conflicting land use
MCA evaluation and ranking of opportunities against the following criteria groupings:

Parsons Brinckerhoff | 2158936A-POR-RPT-002 RevG xi
ARENA Hybridisation of Fossil Fuel Energy Generation in Australia - Public Report
technical
financial, commercial and economic
planning and environment
stakeholder and community.
Findings The assessment determined that of the original 66 power plants, 23 plant options were suitable for hybridisation, of which six were selected for further assessment.
Figure E. 2 Overview of shortlisting process
Of the 23 opportunities, 16 were solar thermal hybrid options and seven were biomass hybrid options.
Figure E. 3 Overview of MCA scores
From an initial assessment, five representative opportunity types (OT) were selected for shortlisting and cost analysis. From the cost modelling, a sixth OT, OT 6, also appeared as a widely deployable option and was therefore included in the cost analysis.
0
1
2
3
4
5
6
7
8
9
Social Environmental & planning Commercial Technical

xii Parsons Brinckerhoff | 2158936A-POR-RPT-002 RevG
ARENA Hybridisation of Fossil Fuel Energy Generation in Australia - Public Report
OT 1. CCGT base plant with solar thermal; hybridisation using linear Fresnel to supply high-pressure saturated steam which is superheated by the HRSG. One opportunity was applicable for this configuration.
OT 2. OCGT base plant with solar thermal; conversion of OCGT to CCGT with solar thermal hybridisation using linear Fresnel to supply high-pressure saturated steam which is superheated by the HRSG. Eight opportunities were applicable for this configuration.
OT 3. Coal-fired base plant with solar thermal; hybridisation using power tower for HP steam production. One opportunity was applicable for this configuration.
OT 4. Coal-fired base plant with biomass; hybridisation using an additional biomass boiler. While one opportunity was studied, this opportunity could be applied more widely.
OT 5. Coal-fired base plant with biomass; hybridisation using co-firing in existing boilers with a) 5% and b) 12.5% penetration. Six opportunities were applicable for this configuration.
OT 6. Although not originally shortlisted as an opportunity type, coal-fired base plant with solar thermal hybridisation using linear Fresnel to provide feedwater heating/reheating (also referred to as solar boost) is considered to be widely deployable and hence has also been considered. Six opportunities were applicable for this configuration.
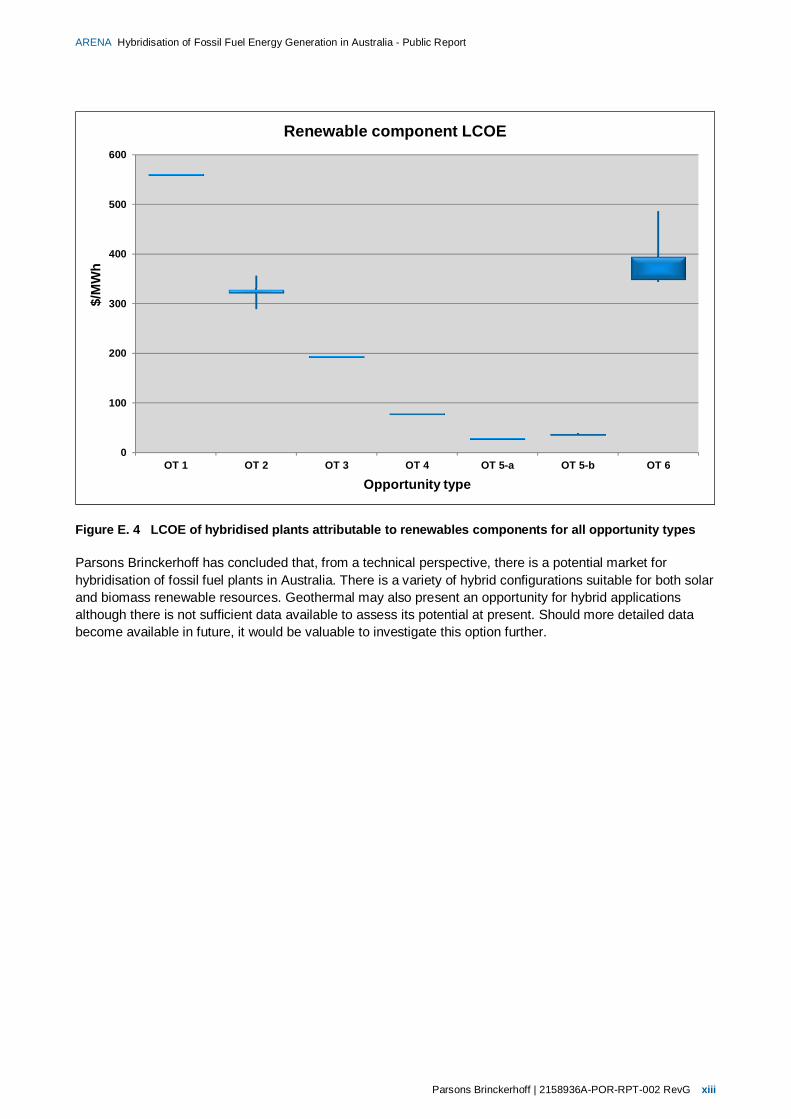
As shown in Figure E. 4 (boxplot showing the maximum, minimum and likely spread of the average LCOE), when considering the element of levelised cost of electricity (LCOE) that is attributable to renewable components of CAPEX, OPEX and sent-out energy, the following conclusions can be made:
solar thermal-based technologies are less cost-effective than biomass options; however, of the solar thermal technologies, the power tower (OT 3) option is most cost-effective
of the biomass options that co-fire fuel in existing boilers, those that yield a 5% (OT 5 –a) conventional fuel saving are slightly more effective than those producing a 12.5% (OT 5 –b) fuel saving
biomass hybridisation using an additional biomass boiler (OT 4), appears to be less effective than the co-firing options, but still more effective than the solar thermal options.
Parsons Brinckerhoff | 2158936A-POR-RPT-002 RevG xiii
ARENA Hybridisation of Fossil Fuel Energy Generation in Australia - Public Report
Figure E. 4 LCOE of hybridised plants attributable to renewables components for all opportunity types
Parsons Brinckerhoff has concluded that, from a technical perspective, there is a potential market for hybridisation of fossil fuel plants in Australia. There is a variety of hybrid configurations suitable for both solar and biomass renewable resources. Geothermal may also present an opportunity for hybrid applications although there is not sufficient data available to assess its potential at present. Should more detailed data become available in future, it would be valuable to investigate this option further.
0
100
200
300
400
500
600
OT 1 OT 2 OT 3 OT 4 OT 5-a OT 5-b OT 6
$/M
Wh
Opportunity type
Renewable component LCOE

Parsons Brinckerhoff | 2158936A-POR-RPT-002 RevG 1
ARENA Hybridisation of Fossil Fuel Energy Generation in Australia - Public Report
1. Introduction 1.1 Background Hybridisation of fossil fuel energy generation with renewable energy may offer an opportunity to develop utility-scale renewable energy projects. These types of projects would improve the competitiveness of renewable energy technologies by facilitating early commercial deployment. Leveraging off established technologies, renewable technologies can progress through their innovation cycles to commercial competitiveness, offering a similar gain in learning and development as greenfield renewable energy projects, at a comparatively lower cost than a stand-alone renewable plant.
Some investors may perceive utility-scale renewable energy technologies as high-risk, due to the comparatively high initial investment cost, specialised maintenance costs, and their lack of familiarity with such projects. Hybridisation of renewable technologies with fossil fuel generators may offer a lower-cost and lower-risk alternative to standalone renewable systems.
A hybrid fossil fuel project offers a demonstration gain that would reduce the uncertainty and cost of future renewable technology projects. Additionally, the joint use of equipment, infrastructure and capabilities that occurs when a renewable plant augments an existing plant significantly reduces the LCOE of the renewable plant, as well as the cost of the demonstration itself.
ARENA’s mandate is to improve the competitiveness of renewable energy technologies and increase the supply of renewable energy in Australia. As the hybridisation of renewable technology with existing fossil fuel plants is an important near-term application for renewable systems, ARENA has commissioned this study to
Hybridisation of existing fossil fuel generation offers the opportunity to scale up renewable energy technologies at lower cost than construction of a stand-alone renewable plant. Potential trials of hybrid solutions could help demonstrate that renewables can supply power reliably and build experience among generators operating and maintaining renewable energy plants, while also displacing emissions from fossil fuels.
At present there are some key knowledge gaps in hybrid solutions in Australia. These include the technical factors that enable hybridisation, the number of plants and the types of technologies suitable for hybridisation, the level of funding and the factors that influence the decision-making of energy producers when determining the design and scale of power plants.
ARENA will fund a study to examine the potential for widespread integration of renewable energy in existing power stations in Australia and the possible role for ARENA. Subject to the conclusions of this study, ARENA may consider launching a strategic initiative to encourage the broader deployment of hybrid technology, with the objective of demonstrating utility scale renewable energy, which is comparable in cost to fossil fuel generation.
- ARENA Investment Plan 2013-2014

2 Parsons Brinckerhoff | 2158936A-POR-RPT-002 RevG
ARENA Hybridisation of Fossil Fuel Energy Generation in Australia - Public Report
examine the potential for deployment of hybrid power stations in Australia, and whether there is a sufficient market for a possible ARENA Strategic Initiative.
1.2 Study objectives The objective of this study is to provide ARENA with a comprehensive overview of the potential for widespread integration of renewable energy generation into existing fossil fuel power stations in Australia. The study will assist ARENA in determining whether it should launch a Strategic Initiative to encourage the industry to more broadly deploy hybrid fossil fuel power projects demonstrating utility-scale, grid-connected renewable energy.
The goals of such an initiative may be to:
increase renewable energy supply by facilitating utility-scale deployment of renewable energy technologies
improve acceptance and competitiveness of renewable energy technologies in the market place
progress new renewable energy technologies along the innovation chain.
1.3 Study scope This study examines the potential in Australia for widespread integration of renewable technology into existing fossil fuel power stations (known as hybridisation), specifically integration into the thermal cycle. The study is at prefeasibility level with accuracy of costs and other aspects in the order of +/-30%. The work carried out was broken into the following tasks.
Task 1: Survey of fossil fuel plants across Australia to determine their hybridisation potential
Australia-wide desktop survey to identify appropriate fossil fuel generation plants. Plants were considered if they were:
– grid-connected (NEM, SWIS, NWIS, DKIS)
– greater than 100 MWe capacity
– fuelled by black coal, natural gas (NG), coal seam gas (CSG) or non-Victorian lower-rank coal, (excludes Victorian lignite which is covered by a separate study)
– operational.
Level of penetration considered and indicative levels of penetration identified.
Formulating criteria and scoring methodology to evaluate the hybridisation potential and ultimately the ranking of options.
Literature review of renewable energy technologies and their integration into existing energy plants.
Task 2: Estimate of the total and individual hybrid capacity of potential technologies and opportunities
Analysis of hybridisation capacity of opportunities by consideration of location, fuel type, operating regime, plant type, capacity, environmental impacts, planning, social impacts and other categories.
Task 3: Prioritisation (ranking) of opportunities
Preliminary fatal flaws screening followed by multi-criteria analysis (MCA) of qualifying opportunities.
Amalgamated results to determine five shortlisted opportunity types.
Task 4: Estimate of the LCOE (or other energy, if applicable) of the five shortlisted opportunity types

Parsons Brinckerhoff | 2158936A-POR-RPT-002 RevG 3
ARENA Hybridisation of Fossil Fuel Energy Generation in Australia - Public Report
Estimate of capital and operations and maintenance (O&M) costs.
LCOE (sent-out) of the five shortlisted opportunity types calculated using a discounted cash flow (DCF) approach, as outlined in the Energy Economics 2012 Australian Energy Technologies Perspective.
Task 5: Stakeholder workshop
Preparation of a draft public report for distribution to stakeholders registered to attend the stakeholder workshop regarding the proposed study methodology.
Presentation and discussion at workshop.
Task 6: Reporting: Assembling, reporting and review of information, specifically the preparation of a:
confidential report for internal ARENA purposes
public report to upload onto the ARENA website.
1.3.1 Exclusions
The following are notable exclusions to this study:
assessment of the impacts on the electricity market. This study does not take into consideration the impact of hybridisation on generator output during periods of extreme demand
assessment of the development of renewable energy technologies as a result of hybridisation
greenhouse gas reduction of the base plant as a result of hybridisation
multiple renewable resource configurations. If a location had a number of renewable energy resources available, they were assessed as individual options. A combined solution of multiple renewable resource hybridisation was not considered.
1.4 Report structure This report details the approach to and results of the assessment as per the study objectives and scope detailed in Sections 1.2 and 1.3. This report is structured as follows:
Chapter 2 reviews the potential for hybridisation in Australia, considering available and applicable technologies and the potential level of penetration
Chapter 3 outlines the approach and assumptions used to assess potential projects in Australia
Chapter 4 discusses the findings of the assessment process
Chapter 5 details the shortlisted options, providing details on potential hybrid plants, their configurations and costs associated
Chapter 6 provides the conclusions of this study.
1.5 Disclaimers and limitations In providing this report, Parsons Brinckerhoff notes the following disclaimers and limitations as to its usage.
1.5.1 Scope of services and reliance of data
This report has been prepared in accordance with the scope of work/services set out in the contract between Parsons Brinckerhoff and ARENA, and summarised in Section 1.3 above.
4 Parsons Brinckerhoff | 2158936A-POR-RPT-002 RevG
ARENA Hybridisation of Fossil Fuel Energy Generation in Australia - Public Report
In preparing this report, Parsons Brinckerhoff has relied upon data, surveys, analyses, designs, plans and other information available to us as a result of our analysis of publically available information and materials, and our recent industry experience (the Data). Except as otherwise stated in the report, Parsons Brinckerhoff has not verified the accuracy or completeness of the Data.
To the extent that the statements, opinions, facts, information, conclusions and/or recommendations in this report (the Conclusions) are based in whole or part on the Data, those conclusions are contingent upon the accuracy and completeness of the Data. Parsons Brinckerhoff will not be liable in relation to incorrect conclusions should any data, information or condition be incorrect or have been concealed, withheld, misrepresented or otherwise not fully disclosed to Parsons Brinckerhoff.
1.5.2 Study for benefit of client
This report has been prepared for the exclusive benefit of ARENA and no other party.
Parsons Brinckerhoff assumes no responsibility and will not be liable to any other person or organisation for or in relation to any matter dealt with in this report, or for any loss or damage suffered by any other person or organisation arising from matters dealt with or conclusions expressed in this report (including without limitation matters arising from any negligent act or omission of Parsons Brinckerhoff or for any loss or damage suffered by any other party relying upon the matters dealt with or conclusions expressed in this report).
Parties other than ARENA should not rely upon this report or the accuracy or completeness of any conclusions and should make their own inquiries and obtain independent advice in relation to such matters.
1.5.3 Other limitations
To the best of Parsons Brinckerhoff’s knowledge, the facts and matters described in this report reasonably represent the conditions at the time of printing. However, the passage of time, the manifestation of latent conditions or the impact of future events (including a change in applicable law) may have resulted in a variation to the conditions.
Parsons Brinckerhoff will not be liable to update or revise the report to take into account any events or emergent circumstances or facts occurring or becoming apparent after the date of the report.

Parsons Brinckerhoff | 2158936A-POR-RPT-002 RevG 5
ARENA Hybridisation of Fossil Fuel Energy Generation in Australia - Public Report
2. Potential for hybridisation 2.1 Technologies and applications Renewable energy technologies include technologies that use one or more renewable energy source. Types of renewable energy technologies that were considered are:
bioenergy
geothermal energy
solar energy (thermal and PV)
hydropower
ocean (thermal, wave and tidal) energy
wind energy.
In the context of this study, ‘hybridisation’ refers to the integration of renewable technology into the thermal cycle of existing fossil fuel power stations. Therefore, the following renewable technologies may be capable of hybridisation and have the potential to be relatively widely deployed in Australia without being unique solutions applicable to an individual power station:
solar thermal
bioenergy (biomass)
geothermal.
For all hybridisation options, the best use of the resource is achieved by adding energy to the thermal cycle at as high a temperature as possible as this enables as high a marginal efficiency of the resource as possible. Conversely, using high-temperature heat sources to meet low-temperature demands would be a poor use of the renewable resource.
The host plants have been assumed to have no significant reserve generating capacity to enable hybrid power boosting and that all hybrid operations will be by fossil fuel substitution.
The other technology options (solar PV, hydropower, ocean and wind) generate electricity directly and are therefore not suitable for integration into the thermal cycle, and so were not considered further for this study.
2.1.1 Solar thermal
Solar thermal refers to the conversion of sunlight into heat. Concentrated solar thermal (CST) systems use mirrors to direct and concentrate sunlight onto receivers that collect the solar energy and transfer it to a high-temperature liquid, steam or gas. CST technologies available include:

6 Parsons Brinckerhoff | 2158936A-POR-RPT-002 RevG
ARENA Hybridisation of Fossil Fuel Energy Generation in Australia - Public Report
parabolic trough: trough-shaped mirror reflectors direct and concentrate sunlight onto thermally efficient receiver tubes circulating a thermal transfer fluid, placed in the trough’s focal line. The heated fluid is pumped through a series of heat exchangers to produce steam. Shown in Figure 2.1 a)
linear Fresnel: linear mirror reflectors concentrate sunlight onto thermally efficient receiver tubes which commonly produce steam directly2. Shown in Figure 2.1 b)
power tower (or central receiving tower): an array of heliostats is used to direct and concentrate sunlight onto a single point receiver mounted on an elevated structure. Direct steam production or heating of a heat transfer fluid may occur in the receiver. Shown in Figure 2.1 c)
parabolic dish: a dish-shaped reflector focuses sunlight onto a single point, producing high temperatures at the receiver. It involves two-axis tracking. Shown in Figure 2.1 d).
Figure 2.1 CST technologies (a) parabolic trough, b) linear Fresnel, c) power tower and d) parabolic dish)
A summary of the key features of these technologies is provided in Table 2.1.
2 Fresnel lenses were included in this list from ASI (ASI, 2012); however this has not been applied to steam
production and is therefore not considered further.

Parsons Brinckerhoff | 2158936A-POR-RPT-002 RevG 7
ARENA Hybridisation of Fossil Fuel Energy Generation in Australia - Public Report
Table 2.1 Summary of CST technologies 3
Technology Annual solar to electricity
efficiency
Focus type
Power cycles considered
Commercial maturity
Installed generating capacity
Global4 Australia
Parabolic trough
12 to 15% Linear Steam Rankine
Organic Rankine
High 1,500 MWe None
Solar tower
20 to 30% Point Steam Rankine
Brayton (gas turbine)
Medium 60 MWe None
Linear Fresnel
10 to 12% Linear Steam Rankine Organic Rankine
Medium 38 MWe 3 MWe
Parabolic Dish
20 to 30% Point Stirling engine
Steam Rankine
Brayton (gas turbine)
Low 2 MWe
None
This study considers parabolic trough, linear Fresnel and power tower for integration. Parabolic dish was excluded due to the difficulty in integrating it into large-scale thermal plants. Parabolic dishes are primarily designed for small-scale, stand-alone or co-location generation.
Solar hybrid plants currently exist in Australia and overseas. The two main solar hybrid plants in Australia are at Kogan Creek, where a 44 MWe linear Fresnel plant is now under construction, and at Liddell, where, following a linear Fresnel demonstration plant of around 1MWth, a second phase has been operational since October 2012, producing 9.3 MWth (3 MWe).
2.1.2 Biomass
2.1.2.1 Technology options
Biomass technologies convert the energy stored in biomass to heat or into other fuel forms. Types of these processes are outlined below.
Direct combustion
Biomass fuels are burnt in a furnace with excess air. Technically proven commercial and industrial processes are available for a range of biomass fuels. Biomass fuels include green timber and dried timber, including forest and sawmill by-products and residues, agricultural residues, and industrial, commercial and municipal wastes.
Gasification
Gasification is a process that operates air-lean, often with steam and/or oxygen as a gasifying medium, and converts carbon-containing materials, such as coal, petroleum coke, biomass and wastes to a fuel gas (or syngas). The gas can then either be used to produce electric power or synthesised to produce valuable products such as chemicals, fertilisers, substitute natural gas, hydrogen and transportation fuels.
3 Adapted from Table 2-1: Summary of CSP technologies (ASI, 2012) 4 as at end 2011 (ASI, 2012)

8 Parsons Brinckerhoff | 2158936A-POR-RPT-002 RevG
ARENA Hybridisation of Fossil Fuel Energy Generation in Australia - Public Report
Pyrolysis
Pyrolysis is the high-temperature degradation of biomass (or other carbonaceous material) in the absence of oxygen to produce a fuel gas (or syngas) and with a solid residue, which is often high in carbon. Pyrolysis is usually focussed on the production of liquid (bio-oil) or solid (char or solids) rather than for power generation as an end application. Hence pyrolysis has not been considered further.
Anaerobic digestion
Anaerobic digestion is the production of biogas (predominantly methane) in a large, sealed, airless container known as a digester. Bacteria in the digester produce the biogas which can be used to generate heat and/or electricity.
2.1.2.2 Biomass hybridisation options
The various arrangements for implementation of biomass hybridisation are described below.
Co-firing by direct mixing of biomass fuel with existing coal fuel requiring only minor modifications
This form of co-firing, utilising relatively minor modifications to the host plant, is relatively well-developed in Australia and around the world. The International Energy Agency (IEA) (IEA, 2013) lists around 150 applications across the world where co-firing has been implemented by either direct mix utilising minor modifications, or co-firing via integration requiring modifications (more below). The IEA defines the list as plants that have implemented ‘partial substitution of coal as a main fuel in a utility boiler with biomass or waste’.
Typically, the method of co-firing utilising minor modifications mixes biomass with the coal before milling. The form of biomass for this application can be forest residues, wood chips, sawdust, sawmill residue or pellets. In utility-scale pulverised coal boilers, the fuel input is typically below 5% (of energy input), and more often implemented at around 1%.
Within Australia, the following plants are noted by IEA as having performed co-firing of biomass:
1. Muja Power Station (WA)
2. Vales Point (NSW)
3. Liddell (NSW)
4. Mt Piper (NSW)
5. Wallerawang (NSW)
6. Stanwell (QLD)
7. Tarong (QLD).
Although no detail is given surrounding the modifications at these plants, the modifications are believed to have been minor.
Major technical challenges associated with co-firing biomass include (Baxter, 2005):
fuel preparation, storage and delivery
ash deposition
fuel conversion
pollutant formation
increased corrosion rates of high-temperature components

Parsons Brinckerhoff | 2158936A-POR-RPT-002 RevG 9
ARENA Hybridisation of Fossil Fuel Energy Generation in Australia - Public Report
fly ash utilisation
impacts on selective catalytic reduction (SCR) systems.
None of these challenges have proven to be insurmountable and this form of co-firing has proven to be technically successful.
Co-firing via integration with an existing boiler and requiring more significant modifications to plant
Typically, these modifications incorporate new or modified fuel receiving, storage, milling and feed systems as well as modifications to existing boiler milling, firing and air quality control systems. This approach may require significant plant modifications such as dedicated biomass milling and feed systems.
There are no systems of this type in Australia as yet; however, there are several across the world including Drax Power Station in the United Kingdom (UK). Drax Power Station is the largest power station in the UK and provides approximately 7% of the UK’s power supply. The station features six boilers, originally coal-fired, with 6 x 660 MW steam turbines, and total capacity of 3,960 MW. The station began testing biomass co-firing in 2004, using direct injection of milled biomass into the fuel line, bypassing the existing coal mills.
Until recently, Drax Power Station averaged a co-firing ratio of 12.5% penetration. In the past year, Drax has commenced a path towards converting three of the six units to complete biomass firing. The project difficulties, as noted by the World Coal Association (World Coal Association, 2012), include:
the fuel system’s capabilities of handling larger throughput of fuel
provision of additional storage for the biomass
differences in moisture content between coal and biomass
complications in storing biomass due to moisture pick-up
availability of feedstock which means working closely with the community
possible allocation of privately owned land to biomass cultivation.
None of these are considered to be serious impediments in Australia and this form of firing could be installed at a number of power stations here.
Gasification of biomass with co-firing of biomass fuel gas
Biomass gasification with co-firing in a boiler has not been implemented within Australia. This technology however has been implemented overseas. Examples are outlined below.
Zeltweg, Austria
The Zeltweg plant in Austria is a 137 MWe coal-fired plant with biomass gasification, contributing to 3% replacement of coal, and contributing about 10 MWth of the total heat load. The plant has a fluidised bed gasifier, and may use bark, sawdust, and wood chips. An analysis report written on the plant (Granatstein, 2002), identifies several problems with the process, all of which, however, were related to the biomass handling, rather than the gasification process itself.
Vaskiluodon Voima Oy plant, Finland
This plant is the world’s largest biomass gasification plant, contributing 140 MW of biomass gasification to a 540 MWth coal fired boiler, and replacing approximately 40% of the boiler’s coal demand.
Overall, biomass gasification with co-firing involves higher capital cost and adds complexity to the host plant relative to other biomass technology options.

10 Parsons Brinckerhoff | 2158936A-POR-RPT-002 RevG
ARENA Hybridisation of Fossil Fuel Energy Generation in Australia - Public Report
Conversion of a boiler to 100% biomass
Conversion to 100% biomass typically involves new fuel receiving, storage, and feed systems as well as modifications to the boilers, ash handling, and air quality control systems
Dominion Virginia Power in Virginia, USA, is currently implementing this system, and by the end of 2013 will have converted three of its power generation assets from coal to biomass firing: Altavista, Hopewell and Southampton. All three plants have approximately 50 MW generating capacity each. The project does not indicate any particular matters of difficulty in the conversion aside from the significant capital cost of USD55 million per site, and a biomass fuel requirement of 600,000 tonnes of biomass per annum per site.
There are no known plans to implement modifications of a similar type in Australia.
Figure 2.2 Dominion Power coal to biomass conversion (ESI Steam & Power, 2013)
Circulating fluidised bed/bubbling fluidised bed
Circulating fluidised bed (CFB) and bubbling fluidised bed (BFB) technologies frequently utilise some degree of biomass firing. This is due to the improved mixing effect of the boiler bed, the fuel flexibility the technology offers, and the lower emissions it generates. Worldwide, the technology is well advanced and reliable. CFB and BFB boilers are ideal for biomass and applications where multiple fuel sources are utilised and may be used in the future.
There are several operating fluidised beds capable of burning biomass in Australia. These are described below.
Worsley Multi Fuel Cogeneration, WA: The largest CFB plant in Australia, Worsley comprises two CFB boilers, generating steam for BHP’s aluminium refinery, as well as two 57 MW steam turbines. The plant is capable of burning up to 30% wood waste.
Visy Paper, Tumut, NSW: This 55 MWth plant burns wood and paper residue and produces electricity and waste heat for the adjacent paper mill.
Redbank, NSW: This 140 MWe plant burns high-ash coal and washery wastes. This type of plant is capable of burning 100% biomass.

Parsons Brinckerhoff | 2158936A-POR-RPT-002 RevG 11
ARENA Hybridisation of Fossil Fuel Energy Generation in Australia - Public Report
Biomass hybridisation of CCGT plant
There are several possible arrangements for biomass firing with a CCGT plant under consideration around the world. However, it does not appear that this biomass firing technology has been implemented in a CCGT project of significant size, if at all. One possible arrangement involves using heat from biomass combusted in a boiler to support the steam cycle, also referred to as the ‘bottoming cycle’ (i.e. delivering steam to a steam turbine, and any preheating of air for a gas turbine), while the gas turbine provides the ‘topping cycle’ . In this arrangement, waste heat from the gas turbine flue gas may be used for drying the biomass. Another arrangement involves using syngas from biomass for duct firing at a CCGT plant.
2.1.2.3 Feedstock
There are a range of biomass feedstocks available for the multitude of conversion technologies. Feedstocks are typically categorised as:
municipal solid waste (MSW) – municipal waste, mainly organic material from household rubbish
landfill gas – contains mainly methane and is captured at landfills from the decomposition of waste
bagasse – fibrous by-product left over from sugar cane crushing
energy crops – woody crops grown specifically for bioenergy production
wood waste – predominantly forestry and mill residue left over from forestry and milling operation. Includes forest logging offcuts, sawmill sawdust, lumber manufacturing offcuts, paper-making waste, and woodchip from milling processes
agricultural residue – includes residue from any farming activity encompassing crop cultivation or animal rearing. Agricultural residue includes shells from coconut, nuts and peanuts; corn cobs and leaves; cotton and rice stalks; straw from wheat and barley; and animal slurry and farmyard manure.
For this study, only MSW, bagasse, sawmill residue, wheat and cotton residue were assessed. This is due to the relatively small quantity of the other biomass resources or their likely unavailability due to alternative uses. The reasons behind this decision are described below.
Landfill gas was not considered as it requires a power station to be located close to a landfill with landfill gas capturing capability. No plants under investigation in this study meet these requirements.
There is currently no significant energy crop industry in Australia.
Forestry and plantation residue was not considered because of the dispersed nature of the resource and the additional costs of collecting it. It also has beneficial reuse if left in the field.
Only wheat and cotton residue were considered as these are the most abundant crop cultivation residue in Australia. Other residue types have been used for electricity generation in Australia, but only for small-scale generation.
Although available in relatively large quantities, the manure from free-range livestock is widely dispersed and has value as a fertiliser (Clean Energy Council, n.d.) and, as such, has not been considered further.
Further information regarding feedstock is provided in Appendix A.
2.1.3 Geothermal
As detailed in the Australian Energy Resource Assessment (Geoscience and ABARE, 2010), Australia lacks conventional hydrothermal resources. However, there is substantial potential with hot rock, also referred to as enhanced geothermal systems, and hot sedimentary aquifer resources.
12 Parsons Brinckerhoff | 2158936A-POR-RPT-002 RevG
ARENA Hybridisation of Fossil Fuel Energy Generation in Australia - Public Report
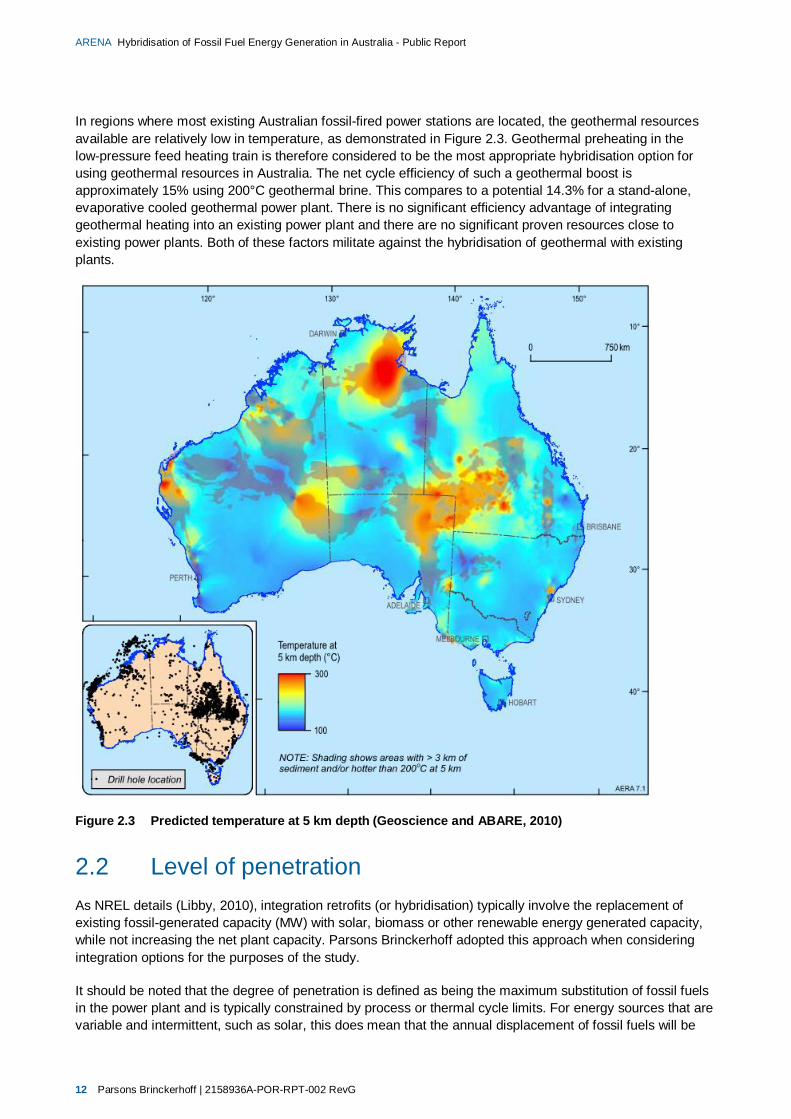
In regions where most existing Australian fossil-fired power stations are located, the geothermal resources available are relatively low in temperature, as demonstrated in Figure 2.3. Geothermal preheating in the low-pressure feed heating train is therefore considered to be the most appropriate hybridisation option for using geothermal resources in Australia. The net cycle efficiency of such a geothermal boost is approximately 15% using 200°C geothermal brine. This compares to a potential 14.3% for a stand-alone, evaporative cooled geothermal power plant. There is no significant efficiency advantage of integrating geothermal heating into an existing power plant and there are no significant proven resources close to existing power plants. Both of these factors militate against the hybridisation of geothermal with existing plants.
Figure 2.3 Predicted temperature at 5 km depth (Geoscience and ABARE, 2010)
2.2 Level of penetration As NREL details (Libby, 2010), integration retrofits (or hybridisation) typically involve the replacement of existing fossil-generated capacity (MW) with solar, biomass or other renewable energy generated capacity, while not increasing the net plant capacity. Parsons Brinckerhoff adopted this approach when considering integration options for the purposes of the study.
It should be noted that the degree of penetration is defined as being the maximum substitution of fossil fuels in the power plant and is typically constrained by process or thermal cycle limits. For energy sources that are variable and intermittent, such as solar, this does mean that the annual displacement of fossil fuels will be

Parsons Brinckerhoff | 2158936A-POR-RPT-002 RevG 13
ARENA Hybridisation of Fossil Fuel Energy Generation in Australia - Public Report
significantly lower than the achievable penetration level because of the lower annual availability of the energy resource, compared with geothermal and biomass that have the potential to be available all the time.
A coal-fired power plant may have its coal fuel supply supplemented with comparatively low-grade geothermal heat, biofuels or solar thermal input. Biomass gasification to supply gas turbines has not been demonstrated to be commercially viable. As such, only CCGT plants, where thermal energy can be supplied to the steam cycle, have been considered.
To investigate the level of penetration of renewables that may be possible through the hybridisation of an existing thermal power station, typical plant configurations have been used as host plants for modelling (detailed integration schematics are provided in Appendix B). These configurations are outlined below.
A comparatively modern, sub-critical coal-fired power station operating at 17.5 MPa with 540°C superheat and reheat temperatures.
It should be noted that most hybridisation options can also apply to a super-critical boiler and the above conditions are merely representative of the fleet of modern coal-fired boiler plants. Note also that the implication of the once-through boiler design (which includes super-critical boilers) is more significant than whether the boiler is super- or sub-critical; the exception being when steam is produced to match the HP turbine inlet conditions. Current CST technology is unable to reach these temperatures and small super-critical boilers for parallel integration are rare. As such, while these options are not suitable for super-critical plants at present, it is expected that with continuing development of CST technology, plants capable of supercritical CST conditions will become available.
Either an OCGT available to be converted to CCGT operation, or an existing CCGT plant which has duct firing capability. CCGTs with duct firing capability will have extra superheat and reheat capacity within the HRSG and extra steam turbine capacity to take additional heat input.
2.2.1 Coal boiler hybridisation
2.2.1.1 Solar thermal
Solar thermal hybridisation may be achieved by two methods:
installing a solar thermal power plant in parallel with the existing boiler so that the CST plant can deliver the same superheat and reheat conditions of temperature and pressure as the host plant
solar boost where solar heat is used to substitute for fossil fuels in feedwater heating or steam reheating equipment.
For the parallel firing option, up to approximately 30% penetration would be available without adversely impacting superheating and reheating temperatures. If the host boiler is capable of delivering constant steam temperatures down to 80% load, then by slightly raising the steam temperatures from the solar input, there will be no significant drop in temperature with a total of 30% input from solar. There is potential that this penetration may be exceeded, but this would require comprehensive modelling of the hybrid configuration.
The CST technology best suited to this duty is a power tower plant using molten salt as its heat transfer medium. A small amount of thermal storage would greatly assist the ability of the host plant to handle transients from the CST plant. This configuration has been considered during the assessment process. An increase in storage, along with a proportionate increase in solar field area, would not increase the penetration but would increase the net annual energy yield. For example, extending the storage period to 16 hours would more than double the annual energy yield from solar.

14 Parsons Brinckerhoff | 2158936A-POR-RPT-002 RevG
ARENA Hybridisation of Fossil Fuel Energy Generation in Australia - Public Report
Figure 2.4 Coal-fired parallel solar integration schematic
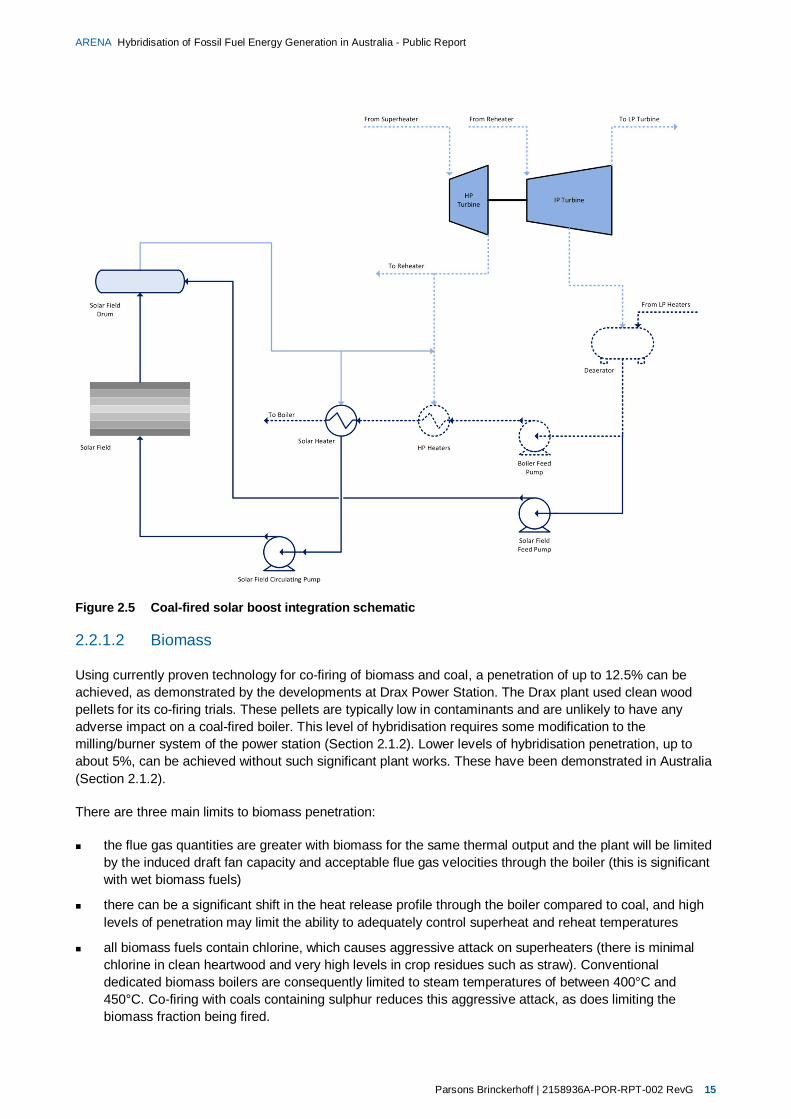
For the solar boost option, the greatest degree of penetration is achieved by boosting the temperature of the feedwater to the boiler. This approach is limited by the capacity of the air heater to compensate for the increasing economiser inlet temperature. Above this threshold, steam can be used to displace bleed steam delivered to the final stage feed heater. This flow is limited by the risk of significantly unbalancing the host plant’s superheaters and reheaters. The penetration achievable is 7.9%5. Higher levels of penetration could be achieved by displacing lower-pressure steam bleeds from the turbine, but the gains become less for the lower-temperature heat demands. The plant operation will also be considerably more difficult as fluctuations in solar input will compromise the stability of the power plant. It seems unlikely that any significant increase in penetration is available for a solar boost option.
Additionally, this approach avoids CST steam being delivered to the host reheaters which is considered to be desirable (due to potential iron pick-up in the CST field). Parsons Brinckerhoff has undertaken many engineering studies of solar boosting and has developed a design with a high penetration without significantly impacting the host boiler. This design is shown in Figure 2.5.
5 from Parsons Brinckerhoff’s previous experience
Parsons Brinckerhoff | 2158936A-POR-RPT-002 RevG 15
ARENA Hybridisation of Fossil Fuel Energy Generation in Australia - Public Report
Figure 2.5 Coal-fired solar boost integration schematic
2.2.1.2 Biomass
Using currently proven technology for co-firing of biomass and coal, a penetration of up to 12.5% can be achieved, as demonstrated by the developments at Drax Power Station. The Drax plant used clean wood pellets for its co-firing trials. These pellets are typically low in contaminants and are unlikely to have any adverse impact on a coal-fired boiler. This level of hybridisation requires some modification to the milling/burner system of the power station (Section 2.1.2). Lower levels of hybridisation penetration, up to about 5%, can be achieved without such significant plant works. These have been demonstrated in Australia (Section 2.1.2).
There are three main limits to biomass penetration:
the flue gas quantities are greater with biomass for the same thermal output and the plant will be limited by the induced draft fan capacity and acceptable flue gas velocities through the boiler (this is significant with wet biomass fuels)
there can be a significant shift in the heat release profile through the boiler compared to coal, and high levels of penetration may limit the ability to adequately control superheat and reheat temperatures
all biomass fuels contain chlorine, which causes aggressive attack on superheaters (there is minimal chlorine in clean heartwood and very high levels in crop residues such as straw). Conventional dedicated biomass boilers are consequently limited to steam temperatures of between 400°C and 450°C. Co-firing with coals containing sulphur reduces this aggressive attack, as does limiting the biomass fraction being fired.

16 Parsons Brinckerhoff | 2158936A-POR-RPT-002 RevG
ARENA Hybridisation of Fossil Fuel Energy Generation in Australia - Public Report
When directly feeding biomass into the existing coal mills, the 5% firing limit is set by constraints of the power station mill/burner system.
An alternative approach that avoids some of these issues is using a dedicated biomass boiler to provide steam to the high-pressure feed heater or the reheater. This approach limits the hybrid energy penetration to 8.5%. This concept was modelled as shown in Figure 2.6.
Figure 2.6 Dedicated biomass boiler integration schematic
The penetration of 8.5% could be achieved after allowing for the biomass boiler parasitic loads. There is the potential to install a biomass boiler in parallel with the host boiler but the availability of relatively small sub-critical boilers is limited.
These penetration levels are in agreement with values indicated by IEA and IRENA (IEA-ETSAP and IRENA, 2013)
2.2.1.3 Geothermal
Due to the low temperatures available, the best use for geothermal heat would be to supply heating steam to the low-pressure feed heaters. This would be achieved via clean steam generators heated with geothermal brine. This configuration is shown in Figure 2.7.

Parsons Brinckerhoff | 2158936A-POR-RPT-002 RevG 17
ARENA Hybridisation of Fossil Fuel Energy Generation in Australia - Public Report
Figure 2.7 Geothermal preheating in the low-pressure feed heating train integration schematic
This option was modelled using Thermoflex, for the typical coal-fired plant. The modelling shows that a penetration of 4.5% of the plant’s rated output could be achieved. For this plant, 200°C brine was unusable to supply de-aeration steam, as well as low-pressure feed heating steam, without having a wasteful use of the geothermal brine.
2.2.2 CCGT hybrid
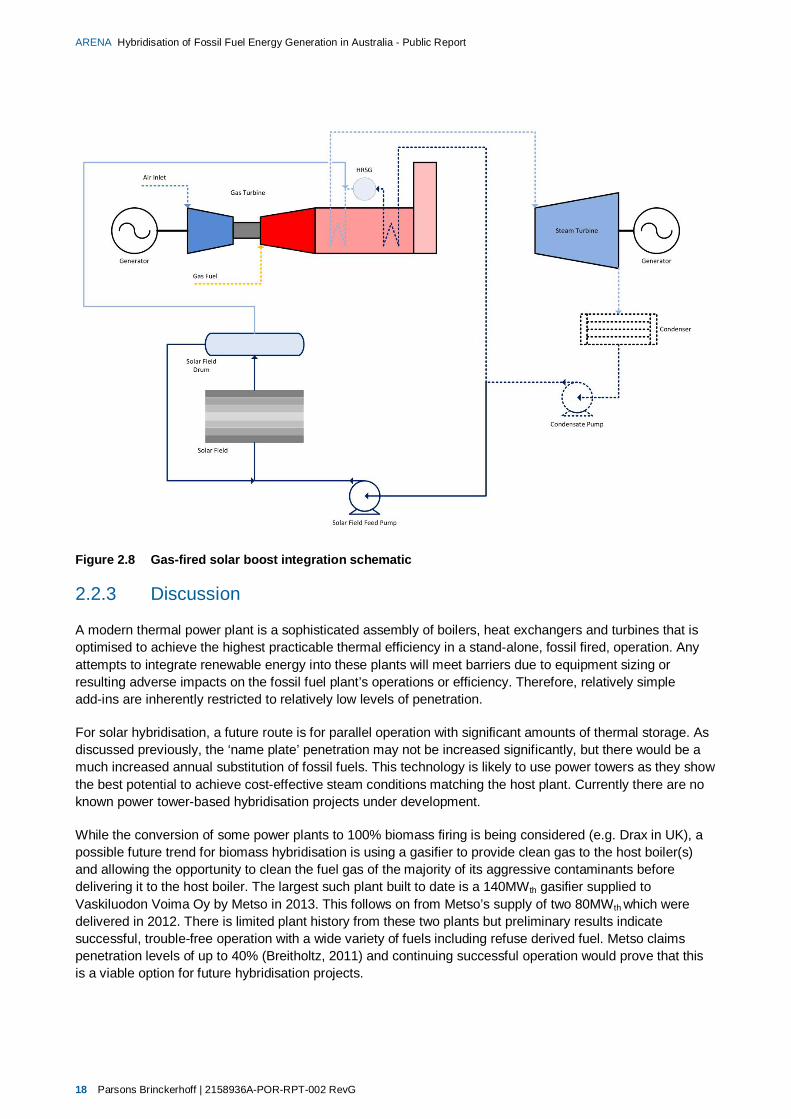
Unlike the coal-fired plant, it is less attractive, for thermal efficiency reasons, to reduce a CCGT output to enable a solar boost, because of the reduction in gas turbine efficiency at reduced loads. However, for a duct-fired-capable CCGT plant or an upgrade of an existing OCGT plant, a significant additional, displaced output may be achieved by adding CST steam into the high-pressure saturated steam from the highest pressure section of the HRSG.
The degree of boost available is constrained by maintaining the steam turbine in a high-efficiency band of operation in both modes of operation. Our modelling indicates that 16% extra power delivery is readily available. This is shown in Figure 2.8.
18 Parsons Brinckerhoff | 2158936A-POR-RPT-002 RevG
ARENA Hybridisation of Fossil Fuel Energy Generation in Australia - Public Report
Figure 2.8 Gas-fired solar boost integration schematic
2.2.3 Discussion
A modern thermal power plant is a sophisticated assembly of boilers, heat exchangers and turbines that is optimised to achieve the highest practicable thermal efficiency in a stand-alone, fossil fired, operation. Any attempts to integrate renewable energy into these plants will meet barriers due to equipment sizing or resulting adverse impacts on the fossil fuel plant’s operations or efficiency. Therefore, relatively simple add-ins are inherently restricted to relatively low levels of penetration.
For solar hybridisation, a future route is for parallel operation with significant amounts of thermal storage. As discussed previously, the ‘name plate’ penetration may not be increased significantly, but there would be a much increased annual substitution of fossil fuels. This technology is likely to use power towers as they show the best potential to achieve cost-effective steam conditions matching the host plant. Currently there are no known power tower-based hybridisation projects under development.
While the conversion of some power plants to 100% biomass firing is being considered (e.g. Drax in UK), a possible future trend for biomass hybridisation is using a gasifier to provide clean gas to the host boiler(s) and allowing the opportunity to clean the fuel gas of the majority of its aggressive contaminants before delivering it to the host boiler. The largest such plant built to date is a 140MWth gasifier supplied to Vaskiluodon Voima Oy by Metso in 2013. This follows on from Metso’s supply of two 80MWth which were delivered in 2012. There is limited plant history from these two plants but preliminary results indicate successful, trouble-free operation with a wide variety of fuels including refuse derived fuel. Metso claims penetration levels of up to 40% (Breitholtz, 2011) and continuing successful operation would prove that this is a viable option for future hybridisation projects.

Parsons Brinckerhoff | 2158936A-POR-RPT-002 RevG 19
ARENA Hybridisation of Fossil Fuel Energy Generation in Australia - Public Report
2.3 Previous studies of hybridisation of fossil fuel plants High Temperature Solar Thermal Roadmap, Wyld Group, 2008
Wyld Group was engaged by the Council of Australian Governments to prepare a high-temperature solar thermal (HTST) roadmap. The roadmap presents a plan for the development of HTST technology and research in Australia and makes suggestions regarding the role of Australian government, industry and researchers in facilitating this process. It also recommends a range of strategies and initiatives, suggesting responsibilities and a timeframe for implementation.
HTST is identified as an advantageous renewable energy option as it can be readily integrated with conventional thermodynamic cycles and power generation equipment, and offers dispatchable power when integrated with thermal storage and/or gas co-firing.
Wyld Group considered case studies which covered the following locations. These locations were chosen as they were considered to have good insolation levels, acceptable proximity to local loads, and high generation costs compared with alternative options:
Port Augusta, SA (connected to the NEM)
north-west Victoria (connected to the NEM)
central/north-west NSW (connected to the NEM)
Kalbarri, WA (connected to the SWIS)
Katherine, NT (connected to the Darwin-Katherine Interconnect System)
remote locations in NT and WA.
Wyld Group determined that solar hybridisation, referred to in its report as ‘solar assistance’, offers conventional power generation stations a near-term market in Australia for HTST electricity generation. The case studies found that solar hybridisation is potentially a highly economical option due to its lower capital cost in comparison to stand alone solar thermal.
Wyld Group states that the penetration level is limited to 5% of the thermal capacity due to thermal imbalance issues. Potential capacity was based on a previous study6 as well as estimates of the availability of land, fuel cost avoided, life of plant and competing options for carbon abatement. Appendix A of Wyld Group’s report provides a list of potential power plants and the ‘solar assist potential’ as included here in Table 2.2. However, detailed information regarding how the potential was determined is not provided.
Table 2.2 Potential for HTST capacity in solar assist (Wyld Group Pty Ltd, 2008)
Power plant Fuel used
Capacity (MW)
Solar assist maximum potential
(MW)
Land area required
(m2)
Solar assist potential
(MW)
Prospect
South Australia
Northern Coal 500 25 100,000 25 Very high
Playford Coal 240 12 48,000 12 Very high
6 L. Wibberley, A. Cottrell, P. Scaife and P. Brown, Synergies with Renewables: Concentrating Solar Power,
Cooperative Research Centre for Coal in Sustainable Development Technology Assessment Report No 56, 2006.

20 Parsons Brinckerhoff | 2158936A-POR-RPT-002 RevG
ARENA Hybridisation of Fossil Fuel Energy Generation in Australia - Public Report
Power plant Fuel used
Capacity (MW)
Solar assist maximum potential
(MW)
Land area required
(m2)
Solar assist potential
(MW)
Prospect
Torrens Island Gas, Oil 1,320 66 264,000 5 Low
Victoria
Loy Yang A Coal 2,200 110 440,000 55 Moderate
Loy Yang B Coal 1,000 50 200,000 25 Moderate
Yallourn W Coal 1,450 73 292,000 36 Moderate
Hazelwood Coal 1,760 88 352,000 44 High
Newport Gas 500 25 100,000 0 None
New South Wales
Bayswater Coal 2,680 134 536,000 35 Moderate
Liddell Coal 2,060 103 412,000 25 Moderate
Mt Piper Coal 1.320 66 264,000 33 Moderate
Wallerawang Coal 1,000 50 200,000 25 Moderate
Vales Point Coal 1,320 66 264,000 0 None
Munmorah Coal 600 30 120,000 0 None
Eraring Coal 2,640 132 528,000 30 Moderate
Queensland
Swanbank B Coal 480 24 96,000 0 None
Millmerran Coal 800 40 160,000 40 Low
Kogan Creek Coal 750 38 150,000 38 Low
Tarong Coal 1,400 70 280,000 70 Moderate
Tarong North Coal 450 23 90,000 23 Low
Callide A Coal 120 6 24,000 0 None
Callide C Coal 840 42 168,000 21 Low
Callide B Coal 700 35 140,000 15 Moderate
Stanwell Coal 1,400 70 280,000 20 Low
Gladstone Coal 1,680 84 336,000 0 None
Collinsville Coal 185 9 37,000 0 None
Western Australia
Muja C Coal 440 22 88,000 11 High
Muja D Coal 440 22 88,000 11 High
Bluewaters Coal 200 10 40,000 5 Low
Parsons Brinckerhoff | 2158936A-POR-RPT-002 RevG 21
ARENA Hybridisation of Fossil Fuel Energy Generation in Australia - Public Report
Power plant Fuel used
Capacity (MW)
Solar assist maximum potential
(MW)
Land area required
(m2)
Solar assist potential
(MW)
Prospect
Collie Coal 320 16 64,000 8 Moderate
Kwinana C Coal, Gas 480 24 96,000 0 None
This appears to be a realistic, high-level assessment of opportunities that gives a good indication of where plants might be sited. A 5% penetration level appears to be conservative, based on the technology available in 2008, but not unrealistic.
Realising the Potential for CSP in Australia report, The Australian Solar Institute, 2012
The Realising the Potential for CSP in Australia study was commissioned by the Australian Solar Institute (ASI) to facilitate the discussion of the potential of concentrating solar power (CSP) in Australia. In this study, CSP covers both CST and concentrating photovoltaic (CPV) solar power, and is limited to systems designed for utility-scale power generation. The study:
provides a summary of the global status of CSP
reviews previous investigations of the potential for CSP in Australia
establishes a best estimate of the current installed costs of large-scale systems, if they were to be built in Australia, and analyses the resulting LCOE
analyses the value of CSP electricity in the market place, with particular examination of the value of dispatchability and ancillary services
analyses the various potential market segments for CSP electricity in Australia, considering cost and value
examines the challenges that impeded the development of CSP in Australia at the time of the study
identifies pathways for CSP industry development and supporting research and development activities.
A technology-agnostic approach was adopted for the ASI study, with no technology, research group or developers promoted as providing the optimal path to large-scale deployment. ASI states that:
the report does not seek to ‘pick winners’ within the CSP category nor to contribute to debates that may divide the CSP industry. Any analysis of costs or development potential of individual technologies always has the potential to be divisive as there are a wide variety of views, methodologies and potential assumptions. For this report, the LCOE calculations are based on the status and potential of CSP as a general combined technology class, with established existing costs of construction as a starting point.
ASI undertook a stakeholder engagement process to form a common, unifying view across stakeholder groups and industry representative bodies.
The study outlines that a portfolio approach is the most suitable option to offer the lowest cost and risk pathway to meeting Australia’s energy needs and emission targets (80% below 2000 levels by 2050). CSP systems can meet those demands as they can be configured to provide dispatchable power.
The ASI study identifies the following solar thermal technologies as currently available, in order of deployment volume:
parabolic trough

22 Parsons Brinckerhoff | 2158936A-POR-RPT-002 RevG
ARENA Hybridisation of Fossil Fuel Energy Generation in Australia - Public Report
central receiver tower
linear Fresnel
Fresnel lenses
dishes.
An outline of operating CST plants over 1 MWe in capacity as at November 2011 is provided. An extract of the hybrid plants included is listed in Table 2.3.
Table 2.3 Extract from Table 3-1: Operating CST power station over 1MWe capacity as at end 2011
System Capacity (MWe) and power gen type
Location Storage or hybridisation
Technology provider
Remarks
Liddell Power Station (Linear Fresnel)
2
Steam turbine
NSW, Australia
Hybrid to existing coal plant
Ausra Electrical equivalent steam boost for coal station
Colorado Integrated Solar Project (Trough)
2
Steam turbine
Palisade, Colorado USA
Solar input to an existing coal plant
Xcel energy, Abengoa
Start production 2010
Martin MNGSEC (Trough)
75 Steam turbine
Indiantown, Florida USA
Part of a combined-cycle plant
Florida Power and Light
Attached to a large gas-fired combined-cycle power plant. Start production December 2010
Yazd ISCC (Trough)
17 Steam turbine
Yazd, Iran Combined with gas turbine plant
NA First CSP in Iran, one of first ISCC systems anywhere
Argelia (Trough)
25 Steam turbine
Hassi R’mel, Algeria
Part of a combined-cycle plant
Sonatrach, Abener
ISCC system, Production from May 2011
ISCC Morocco (Trough)
Ain Beni Mathar, Morocco
Part of a combined cycle plant
ONE, Abener ASCC system, production from May 2011
Section 4.2.1 looks at hybridisation with existing fossil fuel plants and industry and the potential for large-scale, grid-connect systems. ASI notes that the biggest limitation to a hybrid system is the requirement for co-location of a suitable solar resource with an existing fossil-fuelled power station.
Over 20 power stations in Australia were documented as having the solar resource and necessary vacant land (2 ha/MW for trough and 4 ha/MW for Fresnel systems) for co-location based solely on the technical potential market. The sites are:
1. Kogan Creek (QLD, 750 MW)
2. Callide (QLD, 1,700 MW)
3. Stanwell (QLD, 1,400 MW)

Parsons Brinckerhoff | 2158936A-POR-RPT-002 RevG 23
ARENA Hybridisation of Fossil Fuel Energy Generation in Australia - Public Report
4. Swanbank B (QLD, 480 MW)7
5. Mica Creek (QLD, 325 MW) – Mt Isa grid, future connection to CopperString/National Grid8
6. Gladstone (QLD, 1,680 MW) – cyclone risk apparent
7. Collinsville (QLD, 195 MW) – cyclone risk apparent
8. Tarong (QLD, 1,400 MW)9
9. Millmerran (QLD, 850 MW)
10. Liddell (NSW, 2,000 MW)
11. Eraring (NSW, 2,640 MW)
12. Bayswater (NSW, 2,640 MW)
13. Vales Point (NSW, 1,320 MW)
14. Munmorah (NSW, 600 MW)10
15. Mt Piper (NSW, 1,400 MW)
16. Redbank (NSW, 150 MW)
17. Wallerawang (NSW, 1,000 MW)
18. Playford A and B (SA, 330 MW) – various groups have been promoting this site’s potential
19. Northern (SA, 520 MW)
20. Kwinana (WA, 660 MW)
21. Muja (WA, 854 MW)
22. Collie (WA, 340 MW).
ASI notes that a range of other practical issues may limit the potential in this sector to a smaller number.
The study also indicates that private and/or public ownership of the stations and the owners’ desire or resistance to co-firing is a major issue. An issue that will need to be resolved is increases to the risk profile of power stations as a result of the CSP hybridisation, as it affects projected investment returns and therefore capital sourcing.
No further information is provided on how this list was developed.
The study also reviews the HTST Roadmap and comes to the conclusion that the Roadmap was optimistic in considering stations with relatively low solar resources. The study also comments that the 5% penetration level is overly conservative and reflects the perceived comfort zone of system operators. This is in line with Parson’s Brinckerhoff’s view.
From ASI’s investigations, it recommends a solar hybrid system should be able to provide at least 25% of the energy input when solar is available, when adapting full super-heated steam generation, not just feedwater pre-heating. This level of penetration is broadly in line with more detailed assessment by Parsons Brinckerhoff (30% penetration).
7 Shut down progressively between April 2010 and May 2012. 8 Copper String was abandoned in favour of a new power station (Diamantina). 9 700MW was closed in 2012. 10 On standby since Aug 2010; closure announced by Delta July 2012.

24 Parsons Brinckerhoff | 2158936A-POR-RPT-002 RevG
ARENA Hybridisation of Fossil Fuel Energy Generation in Australia - Public Report
Solar-Augment Potential of US Fossil-fired Power Plants, National Renewable Energy Laboratory (NREL), 2011
NREL’s study assessed and ranked the potential of solar thermal augmentations to coal-fired and natural gas combined cycle (NGCC) plants in the southeast and southwest United States. This ranking was developed to provide guidance to utilities on the feasibility of integrating solar thermal into their existing stations and the contribution hybrid plants could make to the nation’s electricity supply.
The assessment process was broken down into the following steps: 11
Plants were ranked against six criteria which are described below.
1. Age of fossil fuel plant
NREL states that newer plants receive higher scores as it is expected they will have a longer operating life, increasing the likelihood that the solar plant will be able to operate throughout its expected life. Plants over 30 years old are assumed to be close to retirement and more difficult to integrate.
2. Average capacity factor
Plants with low capacity factors are considered undesirable. Low capacity factor plants with infrequent operation result in significantly less MWh associated with solar. This raises the cost of solar-generated electricity, as there are fewer hours over which to reclaim capital costs. As such, baseload plants are more preferable. Plants with a capacity factor of less than 15% were not considered further in the study.
3. DNI resource
Plants with a DNI less than 4 kWh/m2/day (equivalent to 1500 kWh/m2/annum) were not considered further.
11 Accessible via http://maps.nrel.gov/node/10
Identification
• Identified all operating, under construction, and planned coal and NGCC plants in the regions in the USA known to have good solar resources (as defined by DNI).
Qualitative ranking
• Developed qualitative ranking (score of Excellent, Good or Fair) of solar-augmented potential for each power plant. Only evaluated parabolic trough and power tower CSP technologies.
Summary
• Summarised total solar energy provided and reduction in emissions into the ranked power plants.• Categorised potential by plant ranking, geography, age and other criteria.
Benefits
• Estimated the benefit to the solar industry and utility sector based on investment, manufacturing scale and operational learning.
Database
• Results were incorporated the ranked database of the plants into NREL's Solar Power Prospetor webtool7.

Parsons Brinckerhoff | 2158936A-POR-RPT-002 RevG 25
ARENA Hybridisation of Fossil Fuel Energy Generation in Australia - Public Report
4. Amount of available land surrounding the existing plant
Assumed that 1 MWe of solar required 5 acres of land and a 100 MW plant could accept up to 10 to 20 MWe of solar generation. This would therefore require 50 to 100 acres of land.
5. Topography of available land
Stated that generally, land with less than 3% slope is considered preferable for concentrating solar technologies. Any plant with greater than 5% slope was not considered further.
6. Solar-use efficiency that could be expected if the plant were augmented with a solar field.
This study focused on maximising solar energy production, not solar-use efficiency, and therefore did not eliminate any plants based on their solar use efficiency.
Plants were screened as a full plant, and then evaluated on a unit basis. On the full-plant level, plants were assessed against criteria 1 and 2. Plants that passed these two criteria were then assessed against criteria 3 and 4 using GIS software. Criterion 5 was then assessed on a unit level.
An overview of the ranking criteria is provided in Table 2.4.
Table 2.4 Ranking criteria
Score Age of plant
(years)
Capacity factor
(%)
Annual average DNI
(kWh/m 2/day)
Amount of land available (acres/fossil plant MW)
Topography of the land (% slope)
Solar use efficiency
(%)
Weighting 5% 20% 35% 15% 15% 10%
Not considered
>30 <15 <4 <0.05 >5 -
1 16-30 - 4-5 0.05-2 3-5 <30
2 - 15-50 5-6 0.2-0.35 - 30-32
3 11-15 - 6-6.5 0.35-0.5 1.5-3 32-35
4 - - 6.5-7 0.5-0.65 - 35-38
5 0-10 50 7 0.65 1.5 38
Solar integration potential was determined based on the preferred integration points as detailed in Table 2.5.
Table 2.5 Integration points for solar-augment
Solar technology Fossil technology Preferred integration point
Parabolic trough Coal Before superheaters
NGCC Before superheaters
Power tower Coal After final superheater
NGCC After final superheater
NREL utilised its System Advisor Model (SAM) to determine solar field size and plant location, and therefore the hourly thermal MW output of the field for a full year.
This approach appears to be appropriate for this high level of study, but does not take into consideration any commercial, financial, environmental or stakeholder aspects, which significantly impact the feasibility of a project.

26 Parsons Brinckerhoff | 2158936A-POR-RPT-002 RevG
ARENA Hybridisation of Fossil Fuel Energy Generation in Australia - Public Report
Demonstration Development Project Solar-Fossil Hybrid Power Plants: Summary report on Conceptual Designs, Electric Power Research Institute (EPRI), 2010
EPRI prepared this high-level summary of findings from selected research into solar-fossil hybrid power systems that evaluated the performance of a range of options for NGCC and coal-fired plants. All of the conceptual designs prepared during this research were based on solar-derived steam in conventional fossil-fuelled cycles that offset some of the fuel required to generate power.
This report details the major technology alternatives for hybridisation, specific solar integration options available for NGCC and coal-fired plants, considering both the positive and negative aspects. It then discusses case studies that developed conceptual designs for specific hybrid retrofits.
The report states that there are various possibilities for the integration of solar-derived steam into existing fossil plants. It also states that integration at the highest available temperature and pressure provides the greatest thermodynamic benefit. The most effective overall integration option for any specific project is dependent on a variety of factors, including existing plant equipment, site configuration, local climate, costs, and financing.
EPRI considered three CSP technologies for integration:
parabolic trough
power tower/central received
compact linear Fresnel reflector.
EPRI groups integration into two options:
creation of additional MWe for the grid
replacement of existing fossil-generated MW with solar-generated MW.
Retrofit applications are described as falling mostly into the latter, meaning that a plant’s heat rate will be reduced — that is thermal efficiency increased — when solar heat is added into the cycle, but the plant output remains the same.
The report provides an overview of integration options for NGCC plants (with duct firing) and coal-fired plants, as detailed in Table 2.6 and Table 2.7.
Table 2.6 Solar integration options for NGCC plants with duct firing
Description HP solar
superheated steam
(Option 1)
HP solar slightly
superheated steam
(Option 2)
HP saturated steam
(Option 3)
IP superheated
steam (Option 4)
LP superheated
steam (Option 5)
Solar feedwater source
Boiler FW pump discharge (LP drum operating temperature)
IP FW pump discharge or new IP solar FW pump
Condensate pumps
Integration point
HP superheater outlet
HP superheater inlet
HP superheater inlet
Cold reheat LP admissions steam piping
Temperature ~ 538°C ~ 371°C ~ 354°C ~ 371°C ~ 371°C
Solar use efficiency
46% 30-42%
29-40% 24-27% ~17%

Parsons Brinckerhoff | 2158936A-POR-RPT-002 RevG 27
ARENA Hybridisation of Fossil Fuel Energy Generation in Australia - Public Report
Table 2.7 Solar integration options for pulverised coal plants
Description HP solar
superheated steam
(Option 1)
HP solar slightly
superheated steam
(Option 2)
HP saturated steam
(Option 3)
IP superheated
steam (Option 4)
LP superheated
steam (Option 5)
Solar feedwater source
Boiler FW pump discharge (de-aerator operating temperature)
Boiler FW pump interstage bleed of new IP solar FW pump
Condensate pumps, boiler FW pump interstage bleed. Or new IP solar FW pump (depending on extraction pressure)
Integration point
Main steam header
HP primary superheater inlet
HP primary superheater inlet
Cold reheat Feedwater heater extraction steam
Temperature ~ 538°C ~ 371°C ~ 354°C ~ 371°C ~ 371°C
Solar use efficiency
43-46% 30-42%
28-40% 25-28% <30%
Options 1 to 4 for both NGCC and coal-fired plants represent options that supplement fossil-fuel-generated MW with solar MW. Option 5 for both may increase net plant capacity if there is sufficient capacity in the generator and cooling systems. This, however, is considered to be inferior to the other configurations. This option poses an additional risk compared to the other integration options due to higher operating pressures.
EPRI’s report states that a unique integration strategy and solar field size is required for each plant that results in the best economics and performance, given the variations possible. It also indicates that no significant changes are required for maintaining the existing power plant systems after solar integration.
EPRI has provided a substantiated summary of options for solar hybridisation with both coal- and natural gas-fired plants. The integration points and net solar efficiencies are in line with expectations. They also provide a useful comparison point given the research and supporting studies from credible parties (including American Electric Power, NV Energy, Southern Company, and the Tri-State Generation and Transmission Association) that led to this summary report.
Biomass Co-firing: Technology Brief, International Renewable Energy Agency (IRENA), 2013
This brief provides an overview of biomass co-firing, including technology status, performance and costs, and potentials and barriers. IRENA states there are three major co-firing technologies available:
direct co-firing: the simplest, cheapest and most common option
indirect co-firing: a less common process in which a gasifier converts the solid biomass into a fuel gas which is then burned with coal in the same boiler
parallel co-firing: which requires a separate biomass boiler that supplies steam to the same steam cycle.
Penetration levels of more than 20% are stated to be technically feasible today, with the caveat that in most cases co-firing levels are below 5%, only exceeding 10% on a continuous basis in about a dozen coal-fired plants worldwide.

28 Parsons Brinckerhoff | 2158936A-POR-RPT-002 RevG
ARENA Hybridisation of Fossil Fuel Energy Generation in Australia - Public Report
Operation and maintenance costs are said to be similar to coal-fired power plants (around 2.5 to 3.5% of CAPEX for direct co-firing and 5% of CAPEX for indirect co-firing), with an increase in costs associated with fuel handling. This is balanced by a reduction in costs associated with de-sulphurisation and ash disposal.
This paper provides a credible reference point to validate the penetration levels determined through Parsons Brinckerhoff’s evaluation.
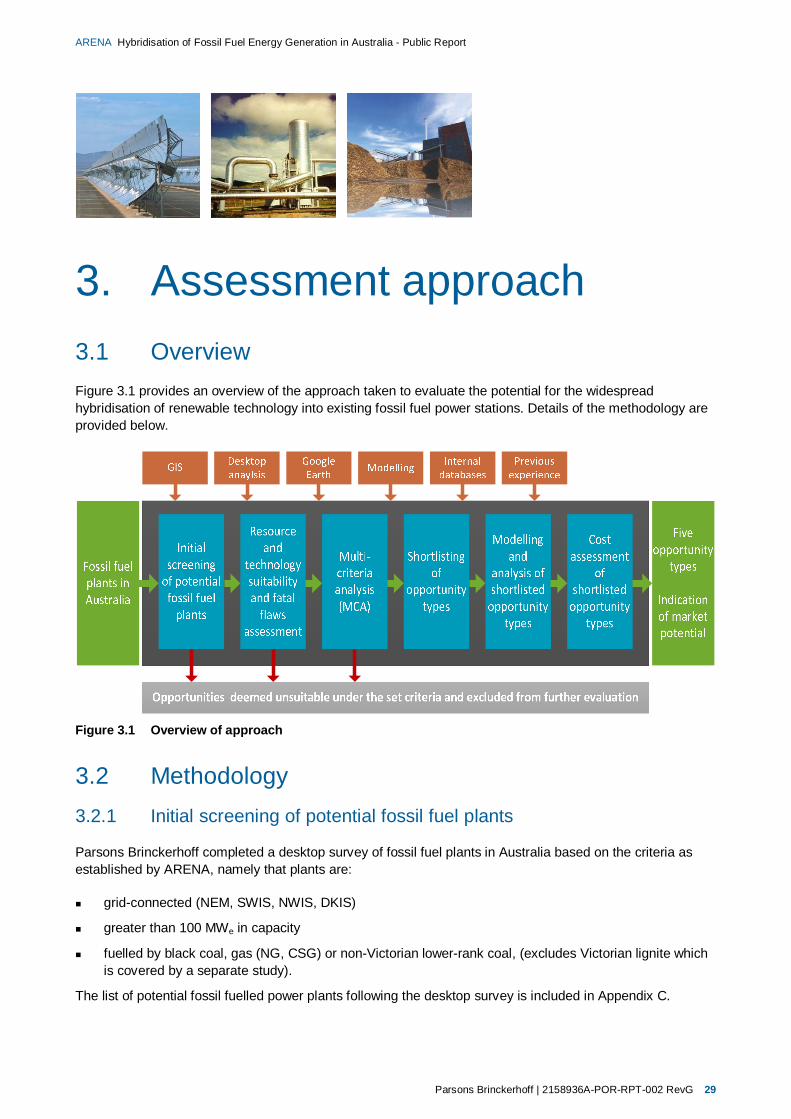
Parsons Brinckerhoff | 2158936A-POR-RPT-002 RevG 29
ARENA Hybridisation of Fossil Fuel Energy Generation in Australia - Public Report
3. Assessment approach 3.1 Overview Figure 3.1 provides an overview of the approach taken to evaluate the potential for the widespread hybridisation of renewable technology into existing fossil fuel power stations. Details of the methodology are provided below.
Figure 3.1 Overview of approach
3.2 Methodology 3.2.1 Initial screening of potential fossil fuel plants
Parsons Brinckerhoff completed a desktop survey of fossil fuel plants in Australia based on the criteria as established by ARENA, namely that plants are:
grid-connected (NEM, SWIS, NWIS, DKIS)
greater than 100 MWe in capacity
fuelled by black coal, gas (NG, CSG) or non-Victorian lower-rank coal, (excludes Victorian lignite which is covered by a separate study).
The list of potential fossil fuelled power plants following the desktop survey is included in Appendix C.

30 Parsons Brinckerhoff | 2158936A-POR-RPT-002 RevG
ARENA Hybridisation of Fossil Fuel Energy Generation in Australia - Public Report
3.2.2 Resource and technology suitability and fatal flaws assessment
All potential fossil fuel plants that passed the initial screening were assessed against resource and technology suitability and fatal flaws criteria as per the process detailed in Figure 3.2. Each plant was considered for solar, biomass and geothermal hybrid capability. The process was informed by GIS mapping of resource availability, Google Earth for land and infrastructure, and a desktop analysis including literature, databases and previous experience.
GIS maps were prepared using data from the following sources.
solar irradiation (DNI) – SolarGIS
wheat and cotton production – ABS
landfill locations – Geoscience Australia
geothermal resource temperature at 5 km depth – Geoscience Australia.
Figure 3.2 Resource and technology suitability and fatal flaws assessment process
The criteria used for this assessment are detailed in Table 3.1 and Table 3.2.

Parsons Brinckerhoff | 2158936A-POR-RPT-002 RevG 31
ARENA Hybridisation of Fossil Fuel Energy Generation in Australia - Public Report
Table 3.1 Resource and technology criteria
Criteria Definition Comments
Solar (Thermal)
Is there sufficient DNI on the site (above 2,000 kWh/m2/a)
2,000 kWh/m2/a is a typical measure of the required DNI for standalone CST economic feasibility (Peterseim, 2012). CST hybridisation feasibility may be achieved with a lower DNI, however the conservative value of 2,000 kWh/m2/a was used for this phase of analysis to ensure a practical representation of potential projects is achieved.
Is there sufficient land on or adjacent to the site (more than 5 ha/100 MWe gross)
5 ha is the approximate land requirement for a linear Fresnel 5 MWe plant12. This is used as the benchmark as linear Fresnel is the CST technology requiring the smallest footprint. The assessment is calculated per 100 MWe of electrical generation (corresponding to 5% penetration). Thus, a 200 MWe plant is deemed to have sufficient land if there is at least 10 ha of adjacent land potentially available for construction.
Biomass Is there an identified biomass resource within 100 km of the site
50 km is a typical cut-off for biomass transport economic feasibility for stand-alone plants (Rutovitz, n.d.). With plant hybridisation, a greater distance may be feasible due to a lower LCOE compared to stand-alone plants, and thus a greater distance of 100 km is used for analysis.
Is there sufficient quantity of biomass from the identified source (minimum 30 ktpa/100 MWe on a wet basis)
The minimum quantity required is estimated as per a generic power station augmentation with solid biomass (i.e. bagasse, MSW, sawmill and agricultural residue).
The assumed values for the estimate are:
penetration – 5% (equates to 5 MWe of electrical generation per 100 MWe capacity)
power station efficiency – 38% (typical value for sub-critical coal plants with reheat)
capacity factor – 85% (representing a baseload power station)
fuel calorific value – 18MJ/kg d.b.
fuel moisture content – 40%.
Is transport infrastructure adequate between the power station site and identified biomass resource
Qualitative assessment assessing factors such as road quality (width, paved, suburban road/highway) and transport time and distance (e.g. direct route or bypass towns etc.).
Geothermal Is there an adequate geothermal resource within 1 km of the site (minimum geothermal resource temperature of 200°C at 5 km depth)
A minimum geothermal resource temperature of 200°C13 is required to enable its use for feedwater heating of any of the feedwater heaters (HP/LP/de-aerator) in a conventional coal plant.
LP feed heating can be achieved with geothermal resource temperatures as low as 150°C, however the present capital costs and the gains achievable make this an ineffective use of a high-cost renewable technology.
A maximum distance of 1 km from the resource to the plant is prescribed to limit heat and head loss in the piping.
12 From Parsons Brinckerhoff SAM modelling 13 A single feedwater heater combined with a geothermal preheater represents a practical arrangement only if the geofluid temperature is reasonably high (Tg >200°C) (Khalifa, 1978)

32 Parsons Brinckerhoff | 2158936A-POR-RPT-002 RevG
ARENA Hybridisation of Fossil Fuel Energy Generation in Australia - Public Report
Table 3.2 Fatal flaws criteria
Criteria Definition Comments
Plant adaptability
Is the power station residual life greater than 20 years (i.e. has the power station been operating for less than 30 years)
Assumes that all power stations have an operational life of 50 years. Plants which are older than 30 years are closer to retirement whereas newer plants are expected to have a longer operating life.
Typically, newer plants are also likely to have better control systems and emission controls than older plants which have not undergone significant retrofits or upgrades.
Plants with a residual life of less than 20 years will have difficulty reclaiming the costs of the hybrid installation as there are fewer hours available to operate the plant.
See Note 1 for further discussion.
Does the power station have sufficient fuel reserves for the next 20 years
Based on known internal and public information.
Environmental considerations
Are the surrounding areas devoid of ecologically sensitive areas
Based on known internal and public information.
Assesses aspects including protected flora and fauna, cultural heritage, wetlands and waterways, state forest.
Are the site and its surrounding areas outside a flood-prone region
Based on known internal and public information.
Conflicting land use
Are the adjacent areas free of conflicting land use which would prevent the acquisition of additional land
Based on known internal and public information.
Assesses aspects including industrial and recreational use, tenements and easements.
Is the adjacent land free of urban encroachment
Qualitative assessment.
Note 1. The purpose of hybridisation in the context of this report is to facilitate the acceleration of renewable energy and the transition of fossil fuel plants to renewably fuelled plants. As such, increasing the life of a fossil fuel plant is not the primary objective. An operational life of 50 years is considered to be typical and reasonable when assessing the life of a plant. Plants that have been in operation for over 30 years are assumed to be close to retirement. The same cut-off was adapted by NREL (Turchi, 2011) when assessing the solar-augment potential of fossil-fired power plants in the United States of America.
It should be noted that this cut off is not a recommendation by Parsons Brinckerhoff on what ARENA should consider for a possible initiative. The viability of a project will be based on individual variables unique to that plant or project and will require assessment on a case-by-case basis. This limit is in place based on an overarching assumption so as to conduct the appropriate assessment at a prefeasibility level.
Within the boundaries of this study, it was not viable to assess each individual opportunity’s actual expected remaining life based on refurbishments, upgrades and other modifications that have been undertaken during life. In order to provide an indication of the market potential, the remaining life has been determined based on the commissioning date of the plant as is publically available. Refurbishments will play a part in determining the viability of a project when assessed further during project feasibility and business case development stages. However, for the purposes of providing ARENA with a view as to whether there is a market potential for hybridisation of fossil fuel plants, this was not seen to be of relative consequence or value for effort.

Parsons Brinckerhoff | 2158936A-POR-RPT-002 RevG 33
ARENA Hybridisation of Fossil Fuel Energy Generation in Australia - Public Report
While the degree of difficulty of integration is plant-specific, it can be generalised when assessing the plants at a prefeasibility level: typically, newer plants will be more readily integrated due to more advanced technologies installed, control systems and emission controls etc. than older plants which have not undergone significant retrofits or upgrades.
The ability to integrate each plant will vary for individual plants depending on design and upgrades. For example, some newer plants may be more difficult to hybridise because they could be designed with the tight design parameters and therefore adjustments to the cycle may be limited; while older plants may be more easily altered given their more robust design. Conversely, older plants may also have tight design allowances due to factors such as unknowns at the time of design and improvements in the system during their life. When considering the hybridisation of a specific plant, the project will need to be assessed on its merits, with ease of integration as a factor. However, for the purposes of this study, a high-level correlation between the age of facility and ease of integration is appropriate.
When considering the payback period of the asset, it can be generally assumed that the shorter the residual life of the plant, the fewer hours available to operate the plant and therefore recover the costs of the hybridisation. Again this will be situation-specific, for example where the host plant only requires minor modifications, such as co-firing by direct mixing of biomass fuel with existing coal fuel, a residual life of 20 years may not be necessary to recover costs. In this scenario, however, the fuel input is typically below 5% (of energy input), and more often implemented at around 1%. As only low levels of penetration can be achieved, the techno-economic benefits of low modification–low cost (short payback period)–low penetration verses increased modification–increased cost (longer payback period)–increased penetration would need to be assessed.
As demonstrated, each potential project is unique, and will need to take into consideration a multitude of site-specific considerations when developing a project. For the purposes of this assessment, a high-level assumption is appropriate and practical.
The resource and technology suitability and fatal flaws assessment scoring sheet is included in Appendix D.
3.2.3 MCA
MCA combines a quantitative and qualitative assessment of the critical factors driving the success of a project which are not captured through other analysis methods such as geospatial and DCF analyses. It enables focus on the qualitative attributes of a project that can reflect important strategic or risk factors that need to be considered as part of a study but lack the geospatial or financial characteristics required to fall within these other types of analyses.
By its nature, MCA analysis can be subjective. To mitigate the potential bias in subjective processes, Parsons Brinckerhoff held an internal workshop and invited specialists to both determine the criteria and assess the plants against those criteria. We note also that our assessments have been based on our understanding of the plants as a result of our experience within the industry and publicly available information. This approach is consistent with the terms under which we were engaged to complete this study.
The MCA was used to evaluate and rank the opportunities against the following criteria groupings:
technical
financial, commercial and economic
planning and environment
stakeholder and community.
The MCA results were achieved by the means described below.

34 Parsons Brinckerhoff | 2158936A-POR-RPT-002 RevG
ARENA Hybridisation of Fossil Fuel Energy Generation in Australia - Public Report
Each of the opportunities was assigned a score based on a range of one to nine (with one representing an excellent outcome and nine representing a very poor outcome).
Criteria weightings were allocated to each assessment criterion to indicate its importance relative to the other criteria. With respect to this process we note that:
initial weightings were assigned to criteria by the project team in an internal workshop based on a criterion’s level of strategic importance to the project
these initial weightings were then normalised to ensure that the summation of allocated weightings equalled 100%.
The weighted MCA score for each criterion was determined by multiplying the score by the weighting.
An MCA rank determined by the sum of the scores was awarded to each opportunity.
Table 3.3 through Table 3.6 provide an outline of the criteria implemented.
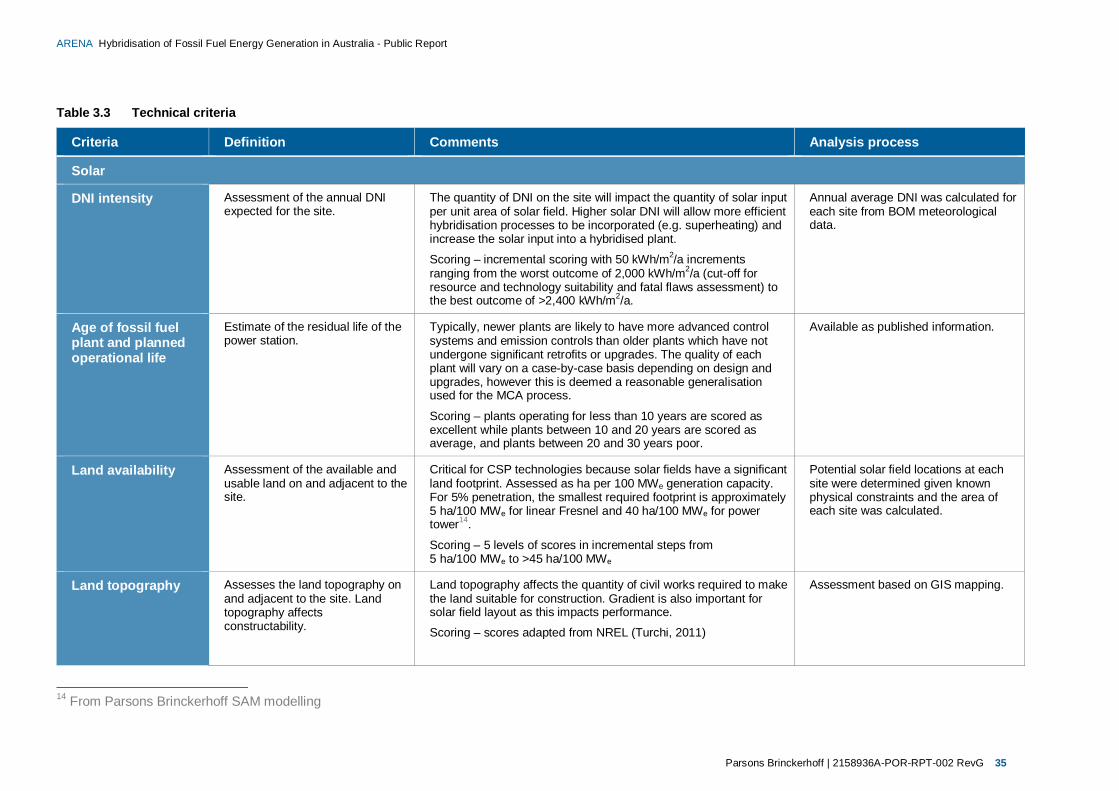
Parsons Brinckerhoff | 2158936A-POR-RPT-002 RevG 35
ARENA Hybridisation of Fossil Fuel Energy Generation in Australia - Public Report
Table 3.3 Technical criteria
Criteria Definition Comments Analysis process
Solar
DNI intensity Assessment of the annual DNI expected for the site.
The quantity of DNI on the site will impact the quantity of solar input per unit area of solar field. Higher solar DNI will allow more efficient hybridisation processes to be incorporated (e.g. superheating) and increase the solar input into a hybridised plant.
Scoring – incremental scoring with 50 kWh/m2/a increments ranging from the worst outcome of 2,000 kWh/m2/a (cut-off for resource and technology suitability and fatal flaws assessment) to the best outcome of >2,400 kWh/m2/a.
Annual average DNI was calculated for each site from BOM meteorological data.
Age of fossil fuel plant and planned operational life
Estimate of the residual life of the power station.
Typically, newer plants are likely to have more advanced control systems and emission controls than older plants which have not undergone significant retrofits or upgrades. The quality of each plant will vary on a case-by-case basis depending on design and upgrades, however this is deemed a reasonable generalisation used for the MCA process.
Scoring – plants operating for less than 10 years are scored as excellent while plants between 10 and 20 years are scored as average, and plants between 20 and 30 years poor.
Available as published information.
Land availability Assessment of the available and usable land on and adjacent to the site.
Critical for CSP technologies because solar fields have a significant land footprint. Assessed as ha per 100 MWe generation capacity. For 5% penetration, the smallest required footprint is approximately 5 ha/100 MWe for linear Fresnel and 40 ha/100 MWe for power tower14.
Scoring – 5 levels of scores in incremental steps from 5 ha/100 MWe to >45 ha/100 MWe
Potential solar field locations at each site were determined given known physical constraints and the area of each site was calculated.
Land topography Assesses the land topography on and adjacent to the site. Land topography affects constructability.
Land topography affects the quantity of civil works required to make the land suitable for construction. Gradient is also important for solar field layout as this impacts performance.
Scoring – scores adapted from NREL (Turchi, 2011)
Assessment based on GIS mapping.
14 From Parsons Brinckerhoff SAM modelling

36 Parsons Brinckerhoff | 2158936A-POR-RPT-002 RevG
ARENA Hybridisation of Fossil Fuel Energy Generation in Australia - Public Report
Criteria Definition Comments Analysis process
Unit size and plant configuration
Assesses the existing plant type, size and configuration in relation to its potential for hybridisation.
Different plants may have different hybridisation potential due to generation technology and plant configuration. Aspects for consideration include CCGT vs. coal-fired, steam temperature and pressure, number and stages of feed heating etc.
Scoring – 5 levels of scores from highly suited to highly unsuited
Qualitative assessment based on Parsons Brinckerhoff’s knowledge of the fossil fuel plant and technical requirements of the hybridisation technologies.
Capacity factor Capacity factor of the existing fossil fuel plant.
Capacity factor represents the frequency the plant operates at per year. Power plants with higher capacity factors operate more, enabling capital expenditure to be recouped, lowering the cost of electricity generation. A 5-year average was used as capacity factor varies yearly due to demand, scheduled and unscheduled maintenance and retrofit, and commercial considerations.
Scoring – 5 levels of scores in incremental steps from 0% to >85%
Available as published information from AEMO (AEMO, 2012) and internal databases.
Biomass
Proximity to biomass source
Proximity to the nearest biomass source.
Proximity to the nearest biomass source impacts transport costs, which are typically a significant factor for biomass-fired power station feasibility. Straight-line distance from the fossil fuel plant to the biomass source was taken. Transport infrastructure was assessed in the resource and technology suitability and fatal flaws assessment phase, and thus only plants with suitable transport infrastructure are included in the MCA phase. As such, driving distance is likely to vary proportionally with straight-line distance from the plant to the biomass resource.
Scoring – incremental scoring with 10 km increments ranging from the worst outcome of 90 to 100 km away to the best outcome of <20km away.
Measurement of straight-line distance from the fossil fuel plant to the biomass source.
Age of fossil fuel plant and planned operational life
As per solar As per solar As per solar
Unit size and plant configuration
As per solar As per solar
As per solar
Capacity factor As per solar As per solar
As per solar

Parsons Brinckerhoff | 2158936A-POR-RPT-002 RevG 37
ARENA Hybridisation of Fossil Fuel Energy Generation in Australia - Public Report
Criteria Definition Comments Analysis process
Geothermal
Geothermal resource
Assessment of the geothermal resource temperature likely to be available for the site.
Higher geothermal resource temperature will allow more efficient hybridisation processes to be incorporated (e.g. HP feedwater heating).
Scoring – incremental scoring of 10°C ranging from the worst outcome of 200°C (cut-off for resource and technology suitability and fatal flaws assessment) to the best outcome of >280°C
Assessment of mapping of geothermal resource temperature at 5 km.
Age of fossil fuel plant and planned operational life
As per solar As per solar As per solar
Unit size and plant configuration
As per solar As per solar
As per solar
Capacity factor As per solar As per solar
As per solar
Table 3.4 Commercial and financial criteria
Criteria Definition Comments Analysis Process
Ownership Successful development of hybridisation projects will require access to adequate capital throughout all stages of the development process.
A project proponent’s access to capital throughout all stages of the development process is key to successful development. Proponents need to show they have a demonstrated history of securing adequate capital – be it from grant, debt or equity sources.
Scoring – 5 levels of scores assessing historical and likely future ability to source funding
Qualitative assessment based on review of financial statements and publically available information regarding ownership, gearing, debt ratio and project funding.
Future expectations of fuel availability (biomass only)
Assessment of the renewable energy fuel supply availability in the future over the life of the hybridised plant.
Future availability of the renewable fuel will impact on the life of the plant as well as the costs associated with sourcing from a new location or development to accommodate a new resource.
Scoring – 5 levels of scores from highly secure to highly insecure
Qualitative assessment based on public information regarding fuel quantity, expected future production, and competing uses and demands.
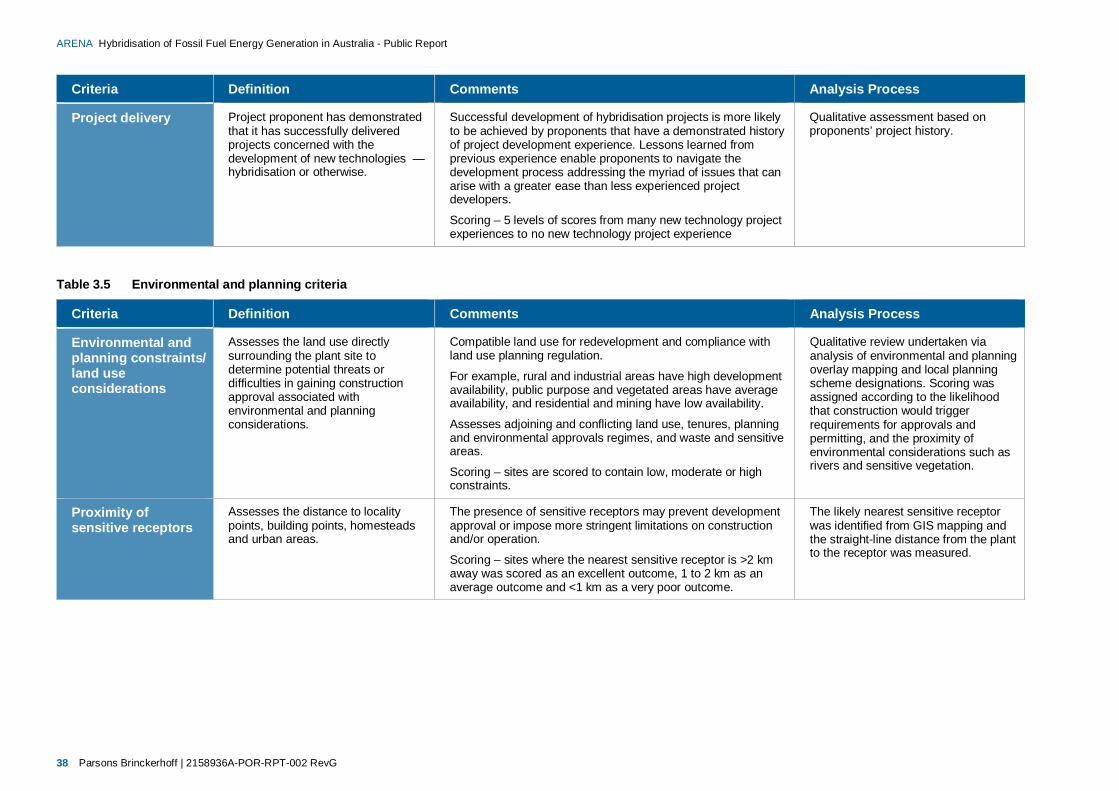
38 Parsons Brinckerhoff | 2158936A-POR-RPT-002 RevG
ARENA Hybridisation of Fossil Fuel Energy Generation in Australia - Public Report
Criteria Definition Comments Analysis Process
Project delivery Project proponent has demonstrated that it has successfully delivered projects concerned with the development of new technologies — hybridisation or otherwise.
Successful development of hybridisation projects is more likely to be achieved by proponents that have a demonstrated history of project development experience. Lessons learned from previous experience enable proponents to navigate the development process addressing the myriad of issues that can arise with a greater ease than less experienced project developers.
Scoring – 5 levels of scores from many new technology project experiences to no new technology project experience
Qualitative assessment based on proponents’ project history.
Table 3.5 Environmental and planning criteria
Criteria Definition Comments Analysis Process
Environmental and planning constraints/ land use considerations
Assesses the land use directly surrounding the plant site to determine potential threats or difficulties in gaining construction approval associated with environmental and planning considerations.
Compatible land use for redevelopment and compliance with land use planning regulation.
For example, rural and industrial areas have high development availability, public purpose and vegetated areas have average availability, and residential and mining have low availability.
Assesses adjoining and conflicting land use, tenures, planning and environmental approvals regimes, and waste and sensitive areas.
Scoring – sites are scored to contain low, moderate or high constraints.
Qualitative review undertaken via analysis of environmental and planning overlay mapping and local planning scheme designations. Scoring was assigned according to the likelihood that construction would trigger requirements for approvals and permitting, and the proximity of environmental considerations such as rivers and sensitive vegetation.
Proximity of sensitive receptors
Assesses the distance to locality points, building points, homesteads and urban areas.
The presence of sensitive receptors may prevent development approval or impose more stringent limitations on construction and/or operation.
Scoring – sites where the nearest sensitive receptor is >2 km away was scored as an excellent outcome, 1 to 2 km as an average outcome and <1 km as a very poor outcome.
The likely nearest sensitive receptor was identified from GIS mapping and the straight-line distance from the plant to the receptor was measured.

Parsons Brinckerhoff | 2158936A-POR-RPT-002 RevG 39
ARENA Hybridisation of Fossil Fuel Energy Generation in Australia - Public Report
Table 3.6 Social and community criteria
Criteria Definition Comments Analysis Process
Social impact Assessment of the social impacts caused by the hybridisation of the nominated plant.
Qualitative assessment. Factors for consideration include transport, traffic, visual impacts, noise, odour and emissions.
Scoring – 5 levels of scores from extremely low impact to extremely high impact
Qualitative assessment of the renewable energy source, hybridisation technology and nearest sensitive receptors.
Community perception
Assessment of community perception towards the hybridisation of the nominated plant.
Qualitative assessment. Assesses community acceptance to selected renewable energy technology e.g. use of biomass as fuel and known community opposition in specific regions. Scoring – 5 levels of scores judging perception from good to bad
Qualitative assessment of the development type, area for development, and the makeup of local communities.

40 Parsons Brinckerhoff | 2158936A-POR-RPT-002 RevG
ARENA Hybridisation of Fossil Fuel Energy Generation in Australia - Public Report
Additional criteria which were considered but not included in the MCA process are listed below.
Biomass quantity – the availability of sufficient biomass resource was assessed in the resource and technology suitability and fatal flaws assessment. Only plants with sufficient biomass resource were assessed during the MCA. Biomass penetration is limited by technological constraints and therefore the availability of biomass above that required to achieve the maximum penetration level will not provide technological benefits. It will, however, increase market competition for the biomass resource, and is included as a consideration for the criterion ‘future expectations of fuel availability’.
Water availability – additional water use after hybridisation is primarily for mirror cleaning or boiler makeup. However, these uses are deemed to be low in comparison to existing fossil plant water requirements, so water availability was not specifically assessed.
Cost of retrofit – assessed in the LCOE estimate.
Water and other wastes – impacts on methods and costs of disposal. It was assumed that the existing fossil plants have adequate waste management and disposal systems.
The weightings and justification for each criterion are provided in Table 3.7 through Table 3.9.
Table 3.7 Solar MCA weightings
Criteria Weighting Weighting justification
DNI intensity 20% DNI significantly affects the performance of the plant and heavily impacts on CAPEX and generation output. As it has a significant impact on plant performance and economics, it is given the highest weighting.
Age of fossil fuel plant and planned operational life
10% Plant age will affect ease of integration and the quantity of upgrades required for the fossil fuel plant. As such, this is given a moderate weighting.
Land availability 15% The amount of land available affects the size of the solar field which can be constructed and impacts the penetration of the hybrid plant. As such, it is given a high weighting.
Land topography 5% Land topography affects the civil works costs. However, as the civil costs are a small fraction of the overall costs of a CSP project (between 3% to 6% depending on CSP technology15), this is given a low weighting.
Unit size and plant configuration
10% The unit size and plant configuration will affect ease and effectiveness of integration. This impacts on performance and economics and so has been given a moderate weighting.
Capacity factor 5% Capacity factor impacts on MWh generation per year and subsequent LCOE. However, as the capacity factor of the hybridised plant is more likely to be limited by the availability of the solar resource (i.e. the CSP technology only operating during the day), this is given a low weighting.
Ownership 3% Ownership and accessibility to funding affects the interest and return required for the hybridisation project. However, as ownership can change and other sources of funding may be required, e.g. grants or joint ventures, this is given a very low weighting.
Project delivery 5% The ability of the proponents to deliver the project will impact on the success (i.e. budget and schedule) of the project. However, as there are controls and practices available for successful project implementation, this is given a low weighting.
15 From SAM modelling output

Parsons Brinckerhoff | 2158936A-POR-RPT-002 RevG 41
ARENA Hybridisation of Fossil Fuel Energy Generation in Australia - Public Report
Criteria Weighting Weighting justification
Environment and planning constraints/land use considerations
15% Availability of developable land will heavily impact on the ability of obtaining construction approval. If the quantity of developable land is limited, this may result in extended negotiation for approval, additional limitations or restrictions, or even failed approval, for the hybridisation project. As such, this is given a high weighting.
Proximity of sensitive receptors
2% Solar has a low impact on sensitive receptors so this is given a low weighting.
Social impact 5% Solar has a low social impact and thus this is given a low weighting.
Community perception
5% Community perceptions regarding solar are typically good and thus this is given a low weighting.
Table 3.8 Biomass MCA weightings
Criteria Weighting Weighting justification
Proximity to biomass source
15% Transport costs are likely to be a significant portion of the operational costs for a biomass hybrid plant and heavily impact the LCOE, and thus this is given a high weighting.
Age of fossil fuel plant and planned operational life
10% Plant age will affect ease of integration and the quantity of upgrades required for the fossil fuel plant. As such, this is given a moderate weighting.
Unit size and plant configuration
10% The unit size and plant configuration will affect ease and effectiveness of integration. This impacts on performance and economics and so has been given a moderate weighting.
Capacity factor 5% Capacity factor impacts on the MWh generation per year and subsequent LCOE. The capacity factor of a power station is impacted by many different factors such as scheduled and unscheduled maintenance and commercial drivers. Although historic capacity factors are an indication of the likely future capacity factor, most plants have the ability to increase capacity factor with the correct commercial drivers. As such, this is given a low weighting.
Ownership 3% Ownership and accessibility to funding affects the interest and return required for a hybridisation project. However, as ownership can change and other sources of funding may be required e.g. grants or joint ventures, this is given a very low weighting.
Future expectations of fuel availability
15% Continued availability of biomass resource will significantly affect costs to purchase and maintain the biomass fuel supply and heavily impact the LCOE thus this is given a high weighting.
Project delivery 5% The ability of the proponents to deliver the project will impact on the success (i.e. budget and schedule) of the project. However, as there are controls and practices available for successful project implementation, this is given a low weighting.
Environment and planning constraints and land use considerations
7% Land is required for fuel storage, handling or additional biomass boiler. The availability of developable land will impact economics and design. However, as the land requirements are likely to be low, this is given a low weighting.
Proximity of sensitive receptors
10% Biomass may have a high impact on sensitive receptors depending on the source of the biomass resource and thus this is given a moderate weighting.
Social impact 10% Biomass may have a significant social impact in regards to emissions (odour) and transport so this is given a moderate weighting.
42 Parsons Brinckerhoff | 2158936A-POR-RPT-002 RevG
ARENA Hybridisation of Fossil Fuel Energy Generation in Australia - Public Report
Criteria Weighting Weighting justification
Community perception
10% Community perception regarding biomass varies, however opposition may exist due to perceived social or economic impact. Thus this is given a moderate weighting.
Table 3.9 Geothermal MCA weightings
Criteria Weighting Weighting justification
Geothermal resource 15% Geothermal resource temperature affects the integration option for hybridisation and impacts on CAPEX and generation output. As such, this is given a high weighting.
Age of fossil fuel plant and planned operational life
10% Plant age will affect ease of integration and the quantity of upgrades required for the fossil fuel plant. As such, this is given a moderate weighting.
Unit size and plant configuration
10% The unit size and plant configuration will affect the ease and effectiveness of integration. This impacts on performance and economics and so has been given a moderate weighting.
Capacity factor 5% Capacity factor impacts on the MWh generation per year and subsequent LCOE. The capacity factor of a power station is impacted by many different factors such as scheduled and unscheduled maintenance and commercial drivers. Although historic capacity factors are an indication of the likely future capacity factor, most plants have the ability to increase capacity factor with the correct commercial drivers. As such, this is given a low weighting.
Ownership 5% Ownership and accessibility to funding affects the interest and return required for a hybridisation project. However, as ownership can change and other sources of funding may be required, e.g. grants or joint ventures, this is given a low weighting.
Future expectations of fuel availability
15% Resource and fuel continuity are critical to ensuring asset life and return on investment. As costs are high for developing additional geothermal resources, this is given a high weighting.
Project delivery 10% The ability of the proponents to deliver the project will impact on the success (i.e. budget and schedule) of the project. As engineered geothermal solutions are still an immature technology, proponents must be willing to accept additional risk to develop this option. As such this is given a moderate weighting.
Environment and planning constraints and land use considerations
10% Planning approval is required to undertake drilling exploration. As this is critical to development this is given a moderate weighting.
Proximity of sensitive receptors
5% Geothermal has a low impact on sensitive receptors and thus this is given a low weighting.
Social impact 5% Geothermal has a low social impact and thus this is given a low weighting.
Community perception
10% Community perceptions of geothermal include concerns regarding fracking activities and generation of seismic events. Thus, this is given a moderate weighting.
The MCA scoring sheet is included in Appendix E.

Parsons Brinckerhoff | 2158936A-POR-RPT-002 RevG 43
ARENA Hybridisation of Fossil Fuel Energy Generation in Australia - Public Report
3.2.4 Shortlist of projects and opportunity types
Following the MCA process, Parsons Brinckerhoff assessed the opportunity rankings to determine a shortlist of projects and therefore opportunity types that provided an appropriate indication of the potential for and costs of widespread hybridisation in Australia.
The objective of this step was to provide a shortlist that incorporates a range of technologies, plant configurations and fossil fuel types to allow ARENA to understand the variations of potential hybrid projects.
3.2.5 Analysis of shortlisted projects and opportunity types
The shortlisted projects and opportunity types were analysed according to the appropriate technology and application to determine the hybridisation opportunity and associated CAPEX and O&M estimates. These estimates were assessed using modelling and calculations benchmarked against market knowledge.
A high to low range was determined from the applicable plants within the shortlisted opportunity types.
3.2.5.1 Solar
Modelling of the annual generation output of solar hybridisation was undertaken using the SAM provided by NREL. Cost estimates were generated from PEACE and the SAM models and adjusted to Australian conditions by recommended factors for Australia built into the programs.
3.2.5.2 Biomass
Biomass options were assessed using calculations derived from previous project experience.
3.2.5.3 Geothermal
No geothermal opportunities were found to be suitable for shortlisting under the confines of this study and hence not analysed further.
There are limitations in the ability to assess the resource potential for geothermal due to the lack of data. Current bottom-hole temperature data is largely populated by petroleum drilling results and is therefore biased towards particular geology. Publically available data regarding heat flow measurements and distributions and knowledge of geology at depth are inadequate for detailed assessment of geothermal in Australia (Geoscience and ABARE, 2010).
3.2.6 Cost assessment
A cost assessment of each of the shortlisted projects and opportunity types was completed by calculating the LCOE for each in comparison with an LCOE for the same plant pre-enhancement, to develop a differential LCOE for each option. In order to determine the LCOE of each plant pre-enhancement, and in the absence of known O&M cost data, approximate fixed and variable O&M cost rates have been assumed for the existing plants, which were then offset in the calculation of LCOE for the respective enhancements.
In determining each LCOE, we were guided by the assumptions and process included in the Australian Energy Technology Assessment (BREE, 2012) as requested by ARENA.
A high to low range was determined from the applicable plants within the shortlisted opportunity types.
3.2.6.1 LCOE
LCOE is a commonly used tool for comparing electric power generation costs. It reflects the minimum cost of energy at which a generator must sell its produced electricity in order to break even.

44 Parsons Brinckerhoff | 2158936A-POR-RPT-002 RevG
ARENA Hybridisation of Fossil Fuel Energy Generation in Australia - Public Report
=
+ +(1 + )
(1 + )
Where:
LCOE Average lifetime levelised electricity generation cost
It Investment expenditure (CAPEX) in the year
Mt O&M expenditure in the year
Ft Fuel expenditure in the year
Et Electricity generation in the year
r Discount rate
n Amortisation period
In addition we note:
O&M costs include the cost of carbon but exclude the costs of sequestration
Fuel costs are calculated as follows:
= ×100
× 100
Generation output has been calculated as follows:
= × 100
3.2.6.2 Assumptions
The global assumptions we have relied upon in calculating the LCOE for each shortlisted plant are detailed below.
Table 3.10 Key Assumptions – LCOE
Assumption Description Amount Source
Amortisation period
Anticipated life of the plant
30 years Parsons Brinckerhoff estimate
Discount rate The cost of capital for all technologies
10% Australian Energy Technology Assessment (BREE, 2012)
Development period
Time required to develop a project prior to commencement of construction
18 months – earliest construction can commence on any project is 1/1/2014.
Parsons Brinckerhoff estimate
National economic growth
Rate of growth for the Australian economy
3% decreasing to 2.75% by 2022
Australian Energy Technology Assessment (BREE, 2012)
Exchange Rate
Australian Dollar : United States Dollar
A$0.925 – 0.825 : US$1 over the
Consensus assessment of the forecasts from National Australia Bank, Commonwealth Bank, Westpac Banking
Parsons Brinckerhoff | 2158936A-POR-RPT-002 RevG 45
ARENA Hybridisation of Fossil Fuel Energy Generation in Australia - Public Report
Assumption Description Amount Source amortisation period Corporation and St George Bank,
October 2013.
Carbon price Cost associated with carbon emissions, assuming a carbon tax remains in place
A$23 per tonne escalating to A$152.83 per tonne in 2049
Australian Energy Technology Assessment (BREE, 2012)
Renewable energy target
Emission reduction target for generation to be sourced from renewable sources
586.50Mt CO2-e – 565.70 Mt CO2-e (2012 – 2049)
Australian Energy Technology Assessment (BREE, 2012)
CAPEX breakdown
Local equipment and construction costs
22.5% Parsons Brinckerhoff’s recent project experience
International Equipment Costs
55%
Labour Costs 22.5%
Fixed O&M cost
Existing plants’ annual fixed O&M costs
Unless otherwise stated, the following assumptions have been made:
A$13,000/MW (gas-fired open-cycle)
A$31,000/MW (gas-fired combined cycle)
A$50,000/MW (coal-fired)
Parsons Brinckerhoff estimate
In addition to those listed in Table 3.10, we have relied upon the following assumptions about fuel costs, which have been taken from the Australian Energy Technology Assessment (BREE, 2012). All amounts are expressed in Australian Dollars per GJ delivered.
Table 3.11 Fuel costs (BREE, 2012)
$G/GJ North QLD
South QLD
NSW / ACT
VIC TAS SA NT WA (SWIS)
WA (non-SWIS)
Brown coal
1/01/2012 1.58
1/01/2020 2.56
1/01/2025 2.89
1/01/2030 3.27
1/01/2040 3.84
1/01/2050 4.27
Black coal
1/01/2012 2.43 2.16 2.14 1.58 2.50
1/01/2020 2.38 1.66 1.73 2.56 2.75

46 Parsons Brinckerhoff | 2158936A-POR-RPT-002 RevG
ARENA Hybridisation of Fossil Fuel Energy Generation in Australia - Public Report
$G/GJ North QLD
South QLD
NSW / ACT
VIC TAS SA NT WA (SWIS)
WA (non-SWIS)
1/01/2025 2.89
1/01/2030 2.31 1.59 1.68 3.27 2.75
1/01/2040 2.31 1.59 1.68 3.84 2.75
1/01/2050 2.31 1.59 1.68 4.27 2.75
Natural Gas
1/01/2012 6.41 6.76 6.36 5.36 5.82 6.42 11.00 11.68 10.64
1/01/2020 9.33 9.37 8.57 7.69 8.15 8.70 11.00 13.87 12.88
1/01/2025 10.67 10.6550 10.14 9.34 9.8150 10.24 11.00 13.0850 12.0850
1/01/2030 12.01 11.94 11.71 10.99 11.48 11.78 11.00 12.30 11.29
1/01/2040 12.01 11.94 11.71 10.99 11.48 11.78 11.00 12.30 11.29
1/01/2050 12.01 11.94 11.71 10.99 11.48 11.78 11.00 12.30 11.29
Generalised assumptions of the cost of bagasse and biomass have not been used in this study.
In order to develop the cost assessment to a level appropriate for this high-level study, the team relied upon the global assumptions listed above and a number of plant-specific assumptions. These assumptions are either based on publically available information or from internally obtained data. Generators have not been contacted to obtain or clarify the data used in this assessment.
3.3 Stakeholder workshop Two workshops were undertaken as part of this study to provide stakeholder engagement and guidance to the process of the assessment. The workshops were:
a closed workshop session attended by generators and industry bodies invited by ARENA
an open workshop session accessible to the general public attended by those who registered via ARENA.
The workshops were held in Sydney on the 26th September 2013 with the format of the two sessions as follows:
Welcome (ARENA)
Administrative arrangements
Agree meeting expectations
Overview on Study Objectives (ARENA)
Opportunity for hybrid generation (5 minutes)
Planned ‘Strategic Initiative’ (5 minutes)
Draft Report presentation (Parsons Brinckerhoff)
Details of the approach undertaken
Open Forum (Led by ARENA)

Parsons Brinckerhoff | 2158936A-POR-RPT-002 RevG 47
ARENA Hybridisation of Fossil Fuel Energy Generation in Australia - Public Report
Close (ARENA)
Overview of meeting
Summary of next steps.
Stakeholders included private and government-owned energy generators, industry associations, research bodies, academics, government agencies and technology providers. A list of the attendees is included in Appendix F.
As input into this report, the stakeholder workshop aimed to seek feedback on the approach to the assessment process undertaken and also understand the issues and concerns of projects and technologies of this type in the wider market space.
The draft public report was distributed to attendees prior to the workshop to inform the discussion. This report was structured as follows:
Chapter 1 provided an introduction into study objectives and scope
Chapter 2 reviewed the potential for hybridisation in Australia, considering available and applicable technologies and the potential level of penetration
Chapter 3 outlined the approach and assumptions used to assess potential projects in Australia.
Key feedback from the two stakeholder workshops is summarised in Section 4.5.

Parsons Brinckerhoff | 2158936A-POR-RPT-002 RevG 49
ARENA Hybridisation of Fossil Fuel Energy Generation in Australia - Public Report
4. Findings 4.1 Initial screening The desktop survey determined that the following plants were suitable for further consideration in the context of this study. Refer to Appendix C for further details on these sites.
Table 4.1 Potential power plants for consideration
Site State Installed capacity (MW)
Plant type Operation type
Fuel
Bayswater NSW 2,640 Steam sub-critical Base Black coal
Bell Bay Three Tas 120 OCGT Peak Natural gas pipeline
Bluewaters WA 416 Steam sub-critical Base Black coal
Braemar QLD 504 OCGT Peaking Coal seam methane
Braemar 2 QLD 519 OCGT Intermediate Coal seam methane
Callide B QLD 700 Steam sub-critical Base Black coal
Callide C QLD 810 Steam super-critical Base Black coal
Cape Lambert WA 120 CCGT Base Natural gas pipeline
Channel Island NT 310 OCGT, CCGT Base Natural gas pipeline
Cockburn Power Station
WA 240 CCGT Base Natural gas pipeline
Collie WA 340 Steam sub-critical Base Black coal
Collinsville QLD 190 Steam sub-critical Intermediate Black coal
Colongra NSW 667 OCGT Peak Natural gas pipeline
Condamine A QLD 144 CCGT Base Coal seam methane
Darling Downs QLD 644 CCGT Base Coal seam methane
Dry Creek SA 156 OCGT Peak Natural gas pipeline
Eraring NSW 2,880 Steam sub-critical Base Black coal
Gladstone QLD 1,680 Steam sub-critical Base Black coal
Hallett SA 228.3 OCGT Peak Natural gas pipeline

50 Parsons Brinckerhoff | 2158936A-POR-RPT-002 RevG
ARENA Hybridisation of Fossil Fuel Energy Generation in Australia - Public Report
Site State Installed capacity (MW)
Plant type Operation type
Fuel
Jeeralang VIC 432 OCGT Peak Natural gas pipeline
Kemerton WA 300 OCGT Peak Natural gas pipeline
Kogan Creek QLD 744 Steam super-critical Base Black coal
Kwinana WA 420 Steam sub-critical + OCGT
Base Black coal, natural gas pipeline
Laverton North VIC 312 OCGT Peak Natural gas pipeline
Liddell NSW 2,000 Steam sub-critical Base Black coal
Mica Creek QLD 333 CCGT and gas fired boiler
Base Natural gas pipeline
Millmerran QLD 856 Steam Super Critical Base Black coal
Mortlake stage 1 VIC 566 OCGT Peak Natural gas pipeline
Mt Piper NSW 1,400 Steam sub-critical Base Black coal
Mt Stuart QLD 414 OCGT Peak Kerosene aviation fuel used for stationary energy - avtur
Muja WA 854 Steam sub-critical Base Black coal
Mungarra WA 112 OCGT Intermediate Natural gas pipeline
Neerabup WA 330 OCGT Peak Natural gas pipeline
NewGen Kwinana
WA 320 CCGT Intermediate Natural gas pipeline
Newport VIC 500 Steam sub-critical Peak Natural gas pipeline
Northern SA 530 Steam sub-critical Base Brown coal
Oakey QLD 282 OCGT Peak Natural gas pipeline and distillate oil
Osborne SA 180 CCGT Base Natural gas pipeline
Paraburdoo WA 153 OCGT Base Natural gas pipeline
Parkeston WA 110 OCGT Peak Natural gas pipeline
Pelican Point SA 478 CCGT Intermediate Natural gas pipeline
Pinjar WA 572 OCGT Peak Natural gas pipeline
Pinjarra WA 280 CCGT Base Natural gas pipeline
Playford B SA 240 Steam sub-critical Intermediate Brown coal
Port Headland WA 210 OCGT Peak Natural gas pipeline
Quarantine SA 224 OCGT Peak Natural gas pipeline
Redbank NSW 143.8 Steam sub-critical Base Black coal
Smithfield NSW 170.9 CCGT Base Natural gas pipeline

Parsons Brinckerhoff | 2158936A-POR-RPT-002 RevG 51
ARENA Hybridisation of Fossil Fuel Energy Generation in Australia - Public Report
Site State Installed capacity (MW)
Plant type Operation type
Fuel
Energy Facility
Somerton VIC 160 OCGT Peak Natural Gas Pipeline
Stanwell QLD 1,460 Steam sub-critical Base Black coal
Swanbank E GT QLD 385 CCGT Base Coal Seam Methane
Tallawarra NSW 420 CCGT Base Natural Gas Pipeline
Tamar Valley Combined Cycle
Tas 208 CCGT Base Natural Gas Pipeline
Tarong QLD 1,400 Steam sub-critical Base Black coal
Tarong North QLD 450 Steam Super Critical Base Black coal
Torrens Island A SA 480 Steam sub-critical Intermediate Natural gas pipeline
Torrens Island B SA 800 Steam sub-critical Intermediate Natural gas pipeline
Uranquinty NSW 664 OCGT Peak Natural gas pipeline
Vales Point B NSW 1,320 Steam sub-critical Base Black coal
Valley Power VIC 300 OCGT Peak Natural gas pipeline
Wagerup WA 320 OCGT Peak Natural gas pipeline and distillate oil
Wallerawang C NSW 1,000 Steam sub-critical Base Black coal
Weddell NT 120 OCGT Base Natural gas pipeline
Worsley Alumina WA 110 Steam sub-critical Base Black coal
Yabulu QLD 244 CCGT Base Coal seam methane
Yarwun QLD 154 CCGT Base Natural gas pipeline
Of note, the following plants were excluded due to the following:
Table 4.2 Notable exclusions
Site Explanation
Munmorah Power station Decommissioned, has not been in production since August 2010
Swanbank B Decommissioned in May 2012
Newman Not considered to be grid-connected as per the context of this study, but rather an islanded grid servicing the BHP Billiton Iron Ore with no interconnection to the NWIS
4.2 Resource and technology suitability and fatal flaws assessment
GIS maps used to determine the resource availability are provided in Appendix G.

52 Parsons Brinckerhoff | 2158936A-POR-RPT-002 RevG
ARENA Hybridisation of Fossil Fuel Energy Generation in Australia - Public Report
The resource and technology suitability and fatal flaws assessment found 23 opportunities to be appropriate to proceed to MCA, and these are shown in Table 4.3.
Any opportunity excluded during this stage is not necessarily unfeasible for hybridisation, but is merely not applicable for further consideration within the scope of this study. A more detailed analysis of a specific site and technology assessment is required to determine the feasibility of hybridisation for an individual project.
Table 4.3 Opportunities for MCA
Project Hybrid type Base plant type Base plant fuel
Project A Biomass Steam sub-critical Black coal
Project B Biomass Steam sub-critical Black coal
Project C Solar OCGT Natural gas pipeline
Project D Solar CCGT Coal seam methane
Project E Solar Steam super-critical Black coal
Project F Solar OCGT Natural gas pipeline and distillate oil
Project G Solar Steam sub-critical Black coal
Project H Solar Steam sub-critical Black coal
Project I Biomass Steam sub-critical Black coal
Project J Solar Steam super-critical Black coal
Project K Biomass Steam super-critical Black coal
Project L Solar OCGT Natural gas pipeline
Project M Solar Steam sub-critical Brown coal
Project N Biomass Steam sub-critical Brown coal
Project O Solar Steam sub-critical Black coal
Project P Biomass Steam sub-critical Black coal
Project Q Solar Steam sub-critical Black coal
Project R Biomass Steam sub-critical Black coal
Project S Solar OCGT Natural gas pipeline
Project T Solar OCGT Natural gas pipeline
Project U Solar OCGT Natural gas pipeline
Project V Solar OCGT Natural gas pipeline
Project W Solar OCGT Natural gas pipeline
4.2.1 Geothermal resource assessment
From the GIS mapping, five sites were identified which may have sufficient geothermal resource. Of the five, three were OCGTs and as these cannot be integrated with geothermal in either open or combined cycle, they were excluded from consideration as geothermal options.

Parsons Brinckerhoff | 2158936A-POR-RPT-002 RevG 53
ARENA Hybridisation of Fossil Fuel Energy Generation in Australia - Public Report
Further assessment was undertaken to investigate the other two sites with geothermal potential. However they were determined to not be feasible options given the relative distance from the stations to the geothermal resource, the uncertainty of the resource and the ability to replicate the hybridisation option.
4.3 MCA Following the MCA, all 23 opportunities were considered to be suitable, at varying levels, for hybridisation within the context of this study; that is, no fatal flaws were discovered during the MCA process.
An overview of the scores determined from the MCA is provided in Figure 4.1. For representation purposes, the scores have been inverted appropriately to visually represent the higher ranking projects as higher graphically.
Figure 4.1 Overview of MCA scores
4.3.1 Power tower technology
An additional assessment was undertaken for the option of implementing a power tower using molten salt and storage. The typical maximum distance recommended between the solar field and power block is 1 km to limit heat and head loss. However, with the use of molten salt, greater distances may be permissible.
As such, each of the sub-critical coal plants were additionally assessed for sufficient available land beyond the 1 km radius and additionally scored for a power tower option (these scores are not included in Figure 4.1).
4.3.2 OCGT assessment
The OCGT plants considered in this assessment typically operate as peaking plants, meaning they only operate during high-demand periods. When considering solar hybridisation, the peak demand periods do
0
1
2
3
4
5
6
7
8
9
Social Environmental & planning Commercial Technical

54 Parsons Brinckerhoff | 2158936A-POR-RPT-002 RevG
ARENA Hybridisation of Fossil Fuel Energy Generation in Australia - Public Report
not typically align with periods of high solar resource availability. Figure 4.2 demonstrates the demand to resource availability mismatch of a location in South Australia as an example.
As such, solar hybrid solutions with an OCGT host plant were assumed to operate as base-load plants for the purposes of this assessment so to allow best utilisation of the solar resource. Individual plants will need to assess the viability of this operating regime, understanding the implications of altering the operating mode on the plant and on the market.
Figure 4.2 Example demand and resource availability for location in South Australia
4.4 Shortlisting of opportunity types As it was determined from the MCA process that all 23 opportunities were considered suitable for hybridisation, we assessed the rankings further to provide a shortlist that incorporated a range of technologies, plant configurations and fossil fuel types. This was to allow ARENA to understand the various potential hybrid opportunities providing an appropriate indication of the potential for widespread hybridisation in Australia.
Figure 4.3 provides an overview of the rankings for the solar hybrid opportunities. For representation purposes, the scores have been inverted appropriately to visually represent the higher ranking projects as higher graphically.
From this assessment, 16 opportunities were found to be suitable for solar hybridisation, comprised of:
one potential project with a CCGT base plant
eight potential projects with an OCGT base plant which would need to be converted to CCGT as described within this report
five potential projects with a sub-critical coal-fired base plant
-100
0
100
200
300
400
500
600
700
800
600
700
800
900
1000
1100
1200
1300
1400
1500
12 A
M1
AM
2 A
M3
AM
4 A
M5
AM
6 A
M7
AM
8 A
M9
AM
10 A
M11
AM
12 P
M1
PM
2 P
M3
PM
4 P
M5
PM
6 P
M7
PM
8 P
M9
PM
10 P
M11
PM
12 A
M
DN
I (W
/m2
MW
Power Demand Solar DNI

Parsons Brinckerhoff | 2158936A-POR-RPT-002 RevG 55
ARENA Hybridisation of Fossil Fuel Energy Generation in Australia - Public Report
two potential projects with a super-critical coal-fired base plant.
Figure 4.3 Potential solar hybrid projects
Figure 4.3 provides an overview of the rankings for the biomass hybrid projects. For representation purposes, the scores have been inverted appropriately to visually represent the higher ranking projects as higher graphically. Seven projects were found to be suitable for biomass hybridisation, comprised of:
six potential projects with a sub-critical coal-fired base plant
one potential project with a super-critical coal-fired base plant.
Figure 4.4 Potential biomass hybrid projects
1
2
3
45
6
78
9
10
11
12 13
14 15
16
CCGT OCGT Coal Sub Critical Coal Super CriticalProject key: 1 Project D2 Project C3 Project F4 Project L5 Project S6 Project T7 Project U8 Project V9 Project W10 Project G11 Project H12 Project M13 Project O14 Project Q15 Project E16 Project J
1
2
34
56 7
Coal Sub Critical Coal Super Critical Project key: 1 Project A2 Project B3 Project I4 Project N5 Project P6 Project R7 Project K
56 Parsons Brinckerhoff | 2158936A-POR-RPT-002 RevG
ARENA Hybridisation of Fossil Fuel Energy Generation in Australia - Public Report
The following points regarding the shortlisting process are noted:
solar and biomass hybrid options were ranked and scored against options of the same type i.e. biomass hybrid options are not ranked compared with solar hybrid options
three different fossil fuel plant technologies were selected for investigation with solar hybridisation (OCGT, CCGT and sub-critical coal-fired)
the top five shortlisted options represent the best options as assessed by the criteria and weighting used in this study with the information available to Parsons Brinckerhoff for analysis, and do not necessarily represent the most feasible options. As such, other options may be more viable or appear to be better options for hybridisation when assessed on different criteria, criteria weighting and confidential information not available to Parsons Brinckerhoff at the time of this study.
The following five opportunity types were chosen for further detailed assessment of capacity and estimated LCOE for hybridisation. They were chosen because they represent the best-ranked options from the MCA process while providing an array of options for investigation to compare the LCOE for different hybridisation technologies.
From this, the following opportunity types were selected and ranges for CAPEX and LCOE determined;
OT 1. CCGT base plant with solar thermal; hybridisation using linear Fresnel to supply high pressure saturated steam which is superheated by the HRSG.
OT 2. OCGT base plant with solar thermal; Conversion of OCGT to CCGT with solar thermal hybridisation using linear Fresnel to supply high pressure saturated steam which is superheated by the HRSG.
OT 3. Coal fired base plant with solar thermal; hybridisation using power tower for HP steam production (hybridisation of one unit).
OT 4. Coal fired base plant with biomass; hybridisation using an additional biomass boiler (hybridisation of one unit).
OT 5. Coal-fired base plant with biomass; hybridisation using co-firing in existing boilers with a) 5% and b) 12.5% penetration.
Although the solar boost option was not shortlisted as a top 5 opportunity type in this assessment, it is considered to be an option that could be widely deployed in Australia. In this study, site-specific factors, such as land availability, led to a lower MCA ranking for solar boost than other opportunities assessed. However, there are not seen to be any fundamental adverse issues related to the technology that would result in it not being a viable option for hybridisation and thus was also included as an opportunity type for cost analysis.
4.5 Stakeholder workshop The two workshops were constructive and informative, with stakeholders contributing to the open forum. The key points from the two sessions are outlined below.
Appetite within industry; the below points were raised.
The appetite for new investment is reduced due to:
– low electricity prices in the wholesale power market
– some generators preparing for sale
– uncertainty around the carbon price and direct action plan.

Parsons Brinckerhoff | 2158936A-POR-RPT-002 RevG 57
ARENA Hybridisation of Fossil Fuel Energy Generation in Australia - Public Report
The appetite to invest was highly specific to individual company circumstances such as the amount of capital available, stage of the investment cycle a company is in and forecasted electricity demand. It would be unlikely that conditions would exist in the near term for the attendees present to be interested in hybridisation projects.
Hybridisation would need to be heavily subsidised to be viable.
Adding generation would make hybridisation more appealing to generators, as opposed to supplementing existing generation, as presented within this report. This would raise other issues including market demand and impacts on the market that would need to be considered. Conversely, by supplementing generation, hybridisation could offer a reduction in fuel costs, reduction in carbon emissions and a positive corporate image.
Energy efficiency projects offer more immediate value for money.
More hybridisation demonstration projects would give generators greater comfort in launching hybrid projects of their own.
Reliability and security of asset is a critical factor. In order to provide security of the asset, which is imperative to generators, the hybrid system would preferably be a ‘bolt-on’ type system, or able to be isolated, so that the plant could be easily be reverted back to business as usual should any issues occur. De-risking the project is a necessity from an operational point of view.
Scope; the below points were raised.
It may be beneficial for ARENA to consult with the plants and find out the actual interest for hybridisation in the marketplace, as well as the likelihood to deploy and timing. This study addresses the technical viability of hybrid projects, but does not look at the actual likelihood projects will happen or how to encourage these projects, which would be of value to ARENA.
The scope may be too limiting and should be broader. In Parsons Brinckerhoff’s opinion, the issue around scope is the view from stakeholders that ARENA will be limiting the definition of hybridisation for its initiative to that depicted in this current study. Hybridisation may in fact be broadened to consider:
– various integration types, configurations and potential technologies not restricted to the thermal cycle
– co-location i.e. whether there is merit in including this under the ‘hybridisation’ branch or should it be treated separately
– integration with other base plants or process blocks e.g. coal drying, coal gasification.
Stakeholders were interested in forecasting the electricity demand profile of the region when looking at increasing electricity output.
Assessment process; the below points were raised.
Generators would like to open considerations to plants older than 30 years citing a stronger business case for older plants since they are typically less leveraged and present lower revenue risk, and may be technically easier to augment compared to newer more specialised power plants. When considering residual life to payback capital expenditure, the 30-year cut-off may be applicable to solar, geothermal and some biomass, however for biomass which can be readily added to the system this wouldn’t be such an issue.
Stakeholders were interested in funding for constructing new hybrid power plants, in addition to adding renewables to existing plants.
When considering geothermal resources, data and heat maps are limited.
There are a number of research and development projects underway utilising low-temperature geothermal resources in the order of 120°C–150°C temperatures at depths of 3 km.

58 Parsons Brinckerhoff | 2158936A-POR-RPT-002 RevG
ARENA Hybridisation of Fossil Fuel Energy Generation in Australia - Public Report
There may be value in assessing the sensitivity of the variables considered for the cost assessment.
Amendments were made to the study and ensuing report following the comments and recommendations from the stakeholder workshops. These amendments were:
cost modelling of all short listed options from the resources and fatal flaws analysis
this enabled a range of LCOEs to be estimated for most opportunity types to better provide an indication of the likely LCOE for each option
included the opportunity type of coal base plant solar boost for comparison
investigation of the likely impact of technology enhancement on permissible penetration levels
discussions on the scope of the study and definition of hybridisation.

Parsons Brinckerhoff | 2158936A-POR-RPT-002 RevG 59
ARENA Hybridisation of Fossil Fuel Energy Generation in Australia - Public Report
5. Assessment of shortlisted opportunity types
The shortlisted opportunity types were assessed to determine the spread of various specific cost indicators, namely LCOE, CAPEX and OPEX, for the range of projects that underwent the MCA process. In addition to LCOE for both the existing and enhanced configurations, and the difference between them ( LCOE) already described, the following indicators were determined:
NPV of total enhancement CAPEX versus total installed MW of the enhanced plant
NPV of the renewable components of CAPEX versus renewable contribution to the installed MW of the enhanced plant (i.e. for a OCGT to CCGT plus solar thermal conversion, only the CAPEX and MW contribution related to the renewable enhancement are considered)
total OPEX versus total sent-out MWh (levelised) of the enhanced plant
renewable component of OPEX versus renewable contribution to sent-out MWh (levelised) of the enhanced plant
total LCOE of the enhanced plant
LCOE for renewables components of CAPEX and OPEX versus renewable contribution to sent-out MWh.
The shortlisted opportunity types were assessed as shown below.
OT 1. CCGT base plant with solar thermal; hybridisation using linear Fresnel to supply high-pressure saturated steam which is superheated by the HRSG. One opportunity was applicable for this configuration, Project D.
OT 2. OCGT base plant with solar thermal; conversion of OCGT to CCGT with solar thermal hybridisation using linear Fresnel to supply high-pressure saturated steam which is superheated by the HRSG. Eight opportunities were applicable for this configuration, Projects C, F, L, S, T, U, V and W.
OT 3. Coal-fired base plant with solar thermal; hybridisation using power tower for HP steam production. One opportunity was applicable for this configuration, Project M.
OT 4. Coal-fired base plant with biomass; hybridisation using an additional biomass boiler. One opportunity was modelled for this configuration, Project B.
OT 5. Coal-fired base plant with biomass; hybridisation using co-firing in existing boilers with a) 5% and b) 12.5% penetration. Six opportunities were applicable for this configuration, Projects A, I, K N, P and R.

60 Parsons Brinckerhoff | 2158936A-POR-RPT-002 RevG
ARENA Hybridisation of Fossil Fuel Energy Generation in Australia - Public Report
OT 6. Although not originally shortlisted as an opportunity type, coal-fired base plant with solar thermal hybridisation using linear Fresnel to provide feedwater heating/reheating, also referred to as solar boost, is considered to be widely deployable and hence has also been considered. Six opportunities were applicable for this configuration, Projects E, G, H, J, O and Q.
The following figures illustrate the derived ranges of the indicators. In each chart, the vertical lines represent the range between maxima and minima, whilst the inner horizontal line or block illustrates the approximate location of the mean and median results. We note that from a statistical viewpoint, the number of cases considered in each category is relatively few.
Figure 5.1 Total CAPEX vs. total installed MW
0
200
400
600
800
1,000
1,200
1,400
OT 1 OT 2 OT 3 OT 4 OT 5-a OT 5-b OT 6
$k/M
W
Opportunity type
Discounted total CAPEX vs. total installed MW

Parsons Brinckerhoff | 2158936A-POR-RPT-002 RevG 61
ARENA Hybridisation of Fossil Fuel Energy Generation in Australia - Public Report
Figure 5.2 Renewable component of CAPEX vs. renewable component of MW
Figures 5.1 and 5.2 illustrate clearly that the lowest capital cost enhancements are achieved by co-firing biomass. Even when considering only the magnitude of the renewable contribution to installed capacity, the CAPEX is approximately one third of the nearest competing technology.
The disparity between the ranges for the OCGT conversion to CCGT with linear Fresnel (OT 2) category shown on figures 5.1 and 5.2 shows the large CAPEX requirement for the CCGT conversion. In figure 5.1, the CCGT with linear Fresnel costs/MW are considerable greater than those for linear Fresnel solar thermal conversion of a coal-fired plant (OT 6). In figure 5.2, the comparison is much closer, putting the two categories — as far as the renewable component of their respective CAPEXs are concerned — very much on a par with each other, and, as might be expected, on a par with the solar thermal conversion of an existing CCGT plant (OT 1).
0
500
1,000
1,500
2,000
2,500
3,000
3,500
4,000
4,500
OT 1 OT 2 OT 3 OT 4 OT 5-a OT 5-b OT 6
$k/M
W
Opportunity type
Discounted renewable component of CAPEX vs. renewable component of MW
62 Parsons Brinckerhoff | 2158936A-POR-RPT-002 RevG
ARENA Hybridisation of Fossil Fuel Energy Generation in Australia - Public Report
Figure 5.3 OPEX contribution to total sent-out LCOE
Figure 5.4 Contribution of renewable component of OPEX to renewable sent-out LCOE
Figure 5.3 shows again the influence of the CCGT component of the conversion on the total cost of an OCGT to CCGT with linear Fresnel enhancement (OT 2). The range of total OPEX for this category stands out in comparison with the remaining categories, though an existing CCGT plant (OT 1) is similar. Figure 5.4, which considers only the OPEX and sent-out energy of the renewable component, shows considerable consistency between all solar thermal categories. As a group, these have lower operational cost than biomass technologies, which is not surprising given that the biomass technologies include a cost of fuel.
0
20
40
60
80
100
120
140
160
OT 1 OT 2 OT 3 OT 4 OT 5-a OT 5-b OT 6
$/M
Wh
Opportunity type
Levilised total OPEX vs. total MWh
0
10
20
30
40
50
60
70
80
OT 1 OT 2 OT 3 OT 4 OT 5-a OT 5-b OT 6
$/M
Wh
Opportunity type
Levelised renewable component OPEX vs. renewable MWh

Parsons Brinckerhoff | 2158936A-POR-RPT-002 RevG 63
ARENA Hybridisation of Fossil Fuel Energy Generation in Australia - Public Report
Figure 5.5 Total LCOE of hybridised plants
Figure 5.6 Delta total LCOE of hybridised plants compared with exiting configurations
Figure 5.5 and 5.6 illustrate the indicators that have been considered in greater detail in Section 4 of this report. The results are dominated by the savings made in the CCGT with linear Fresnel category (OT 2); but as stated previously, this is primarily attributable to the OCGT to CCGT conversion, rather than the hybridisation linear Fresnel conversion. The chart in figure 5.7 shows a very different comparison.
0
20
40
60
80
100
120
140
160
180
200
OT 1 OT 2 OT 3 OT 4 OT 5-a OT 5-b OT 6
$/M
Wh
Opportunity type
Total LCOE of hybridised plants
-250
-200
-150
-100
-50
0
50
OT 1 OT 2 OT 3 OT 4 OT 5-a OT 5-b OT 6
$/M
Wh
Opportunity type
LCOE of Enhancement compared to existing configuration

64 Parsons Brinckerhoff | 2158936A-POR-RPT-002 RevG
ARENA Hybridisation of Fossil Fuel Energy Generation in Australia - Public Report
Figure 5.7 LCOE of hybridised plants attributable to renewables components
Figure 5.7 shows that when considering the element of LCOE that is attributable to renewable contributions to CAPEX, OPEX and sent-out energy, solar thermal-based technologies are less effective than biomass options. Of the solar thermal technologies, the power tower (OT 3) option is most effective. Of the biomass options that co-fire the fuel in existing boilers, those that yield a 5% (OT 5 –a) conventional fuel saving are slightly more effective than those producing a 12.5% (OT 5 –b) fuel saving. Biomass hybridisation using an additional biomass boiler (OT 4), appears to be less effective than the co-firing options, but still more effective than the solar thermal options.
0
100
200
300
400
500
600
OT 1 OT 2 OT 3 OT 4 OT 5-a OT 5-b OT 6
$/M
Wh
Opportunity type
Renewable component LCOE
Parsons Brinckerhoff | 2158936A-POR-RPT-002 RevG 65
ARENA Hybridisation of Fossil Fuel Energy Generation in Australia - Public Report
6. Conclusions and recommendations
6.1 Potential market for hybridisation The process detailed within this report found that there is a potential market for hybridisation of fossil fuel plants in Australia. Following initial assessments, 23 opportunities were considered to be suitable, consisting of:
16 solar thermal opportunities:
one potential opportunities with a CCGT base plant
eight potential opportunities with an OCGT base plant which would need to be converted to CCGT as described within this report
five potential opportunities with a sub-critical coal-fired base plant
two potential opportunities with a super-critical coal-fired base plant
seven biomass opportunities:
six potential opportunities with a sub-critical coal-fired base plant
one potential opportunities with a super-critical coal-fired base plant.
The MCA process showed that several OCGTs may prove good candidates for solar hybridisation. This is predominantly due to the fact they are located in regions with high DNI and an abundance of available land. The commercial drivers for these OCGT plant owners are unknown and it may be likely that they do not wish to convert to CCGT for commercial reasons.
Of these 23, five opportunity types (plus an additional type seen to be widely deployable) were analysed further to determine estimated costs. This snapshot of opportunities provides a basis which can be applied at a high level to the wider group, demonstrating the likely make-up and costing associated with the widespread uptake of hybrid projects in Australia.
OT 1. CCGT base plant with solar thermal; hybridisation using linear Fresnel to supply high-pressure saturated steam which is superheated by the HRSG. One opportunity was applicable for this configuration.
OT 2. OCGT base plant with solar thermal; conversion of OCGT to CCGT with solar thermal hybridisation using linear Fresnel to supply high-pressure saturated steam which is superheated by the HRSG. Eight opportunities were applicable for this configuration.

66 Parsons Brinckerhoff | 2158936A-POR-RPT-002 RevG
ARENA Hybridisation of Fossil Fuel Energy Generation in Australia - Public Report
OT 3. Coal-fired base plant with solar thermal; hybridisation using power tower for HP steam production. One opportunity was applicable for this configuration.
OT 4. Coal-fired base plant with biomass; hybridisation using an additional biomass boiler. While one opportunity was studied, this opportunity could be applied more widely.
OT 5. Coal-fired base plant with biomass; hybridisation using co-firing in existing boilers with a) 5% and b) 12.5% penetration. Six opportunities were applicable for this configuration.
OT 6. Although not originally shortlisted as an opportunity type, coal-fired base plant with solar thermal hybridisation using linear Fresnel to provide feedwater heating/reheating (also referred to as solar boost) is considered to be widely deployable and hence has also been considered. Six opportunities were applicable for this configuration.
As demonstrated in Figure 6.1 below, when considering the element of LCOE that is attributable to renewable components of CAPEX, OPEX and sent-out energy, the following conclusions can be drawn:
solar thermal-based technologies are less cost-effective than biomass options, however of the solar thermal technologies, the power tower (OT 3) option is most cost-effective
of the biomass options that co-fire fuel in existing boilers, those that yield a 5% (OT 5 –a) conventional fuel saving are slightly more cost-effective than those producing a 12.5% (OT 5 –b) fuel saving
biomass hybridisation using an additional biomass boiler (OT 4) appears to be less cost-effective than the co-firing options, but still more effective than the solar thermal options.
Figure 6.1 LCOE of hybridised plants attributable to renewables components for all opportunity types
0
100
200
300
400
500
600
OT 1 OT 2 OT 3 OT 4 OT 5-a OT 5-b OT 6
$/M
Wh
Opportunity type
Renewable component LCOE

Parsons Brinckerhoff | 2158936A-POR-RPT-002 RevG 67
ARENA Hybridisation of Fossil Fuel Energy Generation in Australia - Public Report
6.2 Shortlisting process
Figure 6.2 Overview of shortlisting process
No opportunities were excluded from further investigation during the MCA process as no fatal flaws were discovered in any of the 23 opportunities upon more detailed investigation. If a less stringent set of criteria was implemented during the resource and technology stage, it is possible that more projects would have progressed and been found to be feasible.
Given the scope of this study, it is Parsons Brinckerhoff’s opinion that a coarse selection process, as applied, is suitable given the high-level approach and lack of detail in data and information publicly available. Some specific criteria that may result in a wider pool of potential projects are described below.
Resource availability
Solar – a less stringent limit of 1,700 could have been applied. This could have seen another eight projects proceed to MCA (all but the Victorian power stations).
Biomass – a wider radius may have allowed a number of additional potential projects through. However, it is ultimately dependent on the business case and costs. While 100 km radius is considered to be quite wide, should a proponent wish to pursue this option with its own particular drivers, the high cost of transportation could be balanced by other aspects specific to the project. This aspect is considered to be highly situation-specific and is too detailed for Parsons Brinkerhoff to comment on at present within this study.
Geothermal – it was difficult to assess the resource potential for geothermal due to the lack of data. Current bottom-hole temperature data is largely populated by petroleum drilling results and is therefore biased towards particular geology. Publically available data regarding heat flow measurements and distributions and knowledge of geology at depth are inadequate for efficient geothermal exploration in Australia (Geoscience and ABARE, 2010). Individual companies may have access to further data from detailed studies conducted in their exploration leases, however not all of this is available for review.
Given the above, there is a significantly high risk associated with resource availability. The assessment process considered this situation when identifying potential projects with geothermal capability. Of note, during the resource and technology suitability and fatal flaws assessment stage, two opportunities were found to be possibly within proximity to a reasonable geothermal resource and with plant configurations suitable for hybridisation. Given the high risk of resource availability and lack of detail available in GIS mapping, further investigation was undertaken to determine the sites’ suitability. In summary, there was not enough evidence to sufficiently prove that the required resources would be available for these stations and they were therefore excluded from further investigation.
Geothermal does offer the potential for hybridisation, and should more detailed data be available in future, this option has the merits to be investigated further.
Age of plant – while mid-life plant upgrades were not considered in this study, plants which have undergone a mid-life retrofit, but have operated for greater than 30 years, may be candidates for

68 Parsons Brinckerhoff | 2158936A-POR-RPT-002 RevG
ARENA Hybridisation of Fossil Fuel Energy Generation in Australia - Public Report
hybridisation. With the mid-life upgrade, it is likely there will not be any significant impediments in regards to integration associated with the control system. Other aspects such as emissions and plant efficiency still need to be considered.
6.3 Scope for hybridisation As demonstrated in Section 4.5, the stakeholder workshop revealed that a broader definition of hybridisation should be considered. The definition of hybridisation within this study is a focussed one: the integration of renewable technology into the thermal cycle of existing fossil fuel power stations.
There are several definitions for hybrid systems, including those not strictly limited to power generation. The key definitions considered here are:
thermal cycle integration: as presented within this study
cooperation of units – power generation: a small set of cooperating units generating electricity, additional heat, water or other services, based on renewable and non-renewable energy sources to form an integrated power generation facility
cooperation of units – industry: a small set of cooperating units generating electricity, additional heat, potable water or other services based on renewable and non-renewable energy sources, to form an integrated power generation or industrial facility.
A broad definition of hybridisation, taking into consideration the above, is:
Hybrid systems present a mechanism to increase availability and flexibility of power supply systems and industrial systems, providing flexible sources of electricity, heat and services which optimise utilisation of energy sources.
6.3.1 Cooperation of units – power generation
This option does not provide as many potential cost saving benefits as integrating into the thermodynamic cycle. This is because major plant equipment is not shared between the added renewable technology and the base fossil plant. For cooperating units, the likely maximum equipment sharing is limited to the transmission infrastructure with additional potential for sharing of some existing site staff. These cost savings are small, and thus capital and operational costs are likely to be similar to stand-alone renewable energy projects.
Given that costs associated with cooperating units are similar to a brownfields stand-alone plant, typically only renewable technologies which cannot integrate into the thermodynamic cycle are used for this type of hybridisation. The exception is the use of fossil fuel technology to meet the transient nature of intermittent renewable technologies.
When coupled with renewable energy technology, a cooperating set of units provides electricity or additional heat or steam into the base power plant. A set of units that provides direct electricity into the base plant are typically referred to as co-located hybridisation. Typical configurations include:
wind turbines with gas/diesel reciprocating engines or gas turbines
wind turbines with solar PV (with or without gas/diesel reciprocating engines or gas turbine back-up).
solar PV with any fossil fuel plant with the solar supplying power to auxiliary plant equipment or to offset the fossil fuel plant generation during the day.
solar (thermal or PV) with fossil fuel technology used when the solar plant is not operating. Depending on the operating regime of the plant, the fossil fuel technology has fast-start capabilities e.g. a diesel
Parsons Brinckerhoff | 2158936A-POR-RPT-002 RevG 69
ARENA Hybridisation of Fossil Fuel Energy Generation in Australia - Public Report
engine to meet drops in output when the renewable technology is not operating. Otherwise, gas turbines or fossil fuel boilers are used to generate output at night.
hydropower at plants with sufficient hydro resource (dam or sufficient free-flowing water for micro-hydro) to offset/augment fossil plant generation.
Co-location of intermittent renewable energy technologies aids in increasing the capacity of these technologies and may assist in lowering its cost of energy. There does, however- appear to be little financial benefit from co-location of base-load renewable energy technologies unless the cost of the renewable energy is lower than the cost of the fossil fuel energy component of sent-out generation. As such, co-location would appear to suit small- to medium-sized projects, especially in off-grid or remote grid locations where diesel generation is the only reliable energy resource, or if gas costs rise significantly above present levels. For instance, many mining companies are considering solar PV, wind and even small hydro as a means of saving fuel currently used for gas/diesel engine generation.
Cooperating units that provide additional heat or steam (separate to the thermal cycle) or other services into the base fossil fuel plant are also available. An example of this hybrid application is the replacement of electrically-driven equipment with steam-driven equipment. Steam would be provided by renewable technologies, including solar thermal, biomass and geothermal which are capable of steam generation. For intermittent sources, the steam supply would be supplemented by the base-plant steam. This would result in lowered parasitic load of the base plant and therefore result in increased power sent out; although this is expected to be minimal. The potential savings are realised in the reduction of power consumed by electric drives. There remains the need to dispose of the steam exhausted from the steam-driven auxiliary plant. Steam could either be used in the feed water heating system or condensed. Steam-driven auxiliaries remain a realistic technical option but overall feasibility is site-specific.
It is also noted that hybridisation for power generation does not need to be restricted to renewable combined with non-renewable hybrid systems. Hybridisation of supportive renewables could prove a viable option, this includes solar-geothermal hybridisation. Such a configuration could exploit the synergies between the solar and geothermal energy sources. Lower temperature geothermal power generation could be viable if enhanced by solar resources.
6.3.2 Cooperating units – industry
In addition to power generation, renewable energy technologies can be used for other industrial process uses, such as:
process heat and steam production from solar, biomass and geothermal e.g. pulp and paper milling, bauxite refining and food refining
process cooling e.g. solar process cooling
water treatment e.g. solar desalination
motive power e.g. hydro or wind power to drive air compressors.
There is significant potential for using renewable sources for industrial processes, especially for steam and heat production. However, to date, implementation of solar thermal or geothermal renewable technologies for industrial applications in Australia has been limited due to the costs associated with these technologies. The largest industrial users of renewable technology have been in industries with a readily available supply of biomass residual such as bagasse (sugar industry) or wood waste (pulp and paper)

Parsons Brinckerhoff | 2158936A-POR-RPT-002 RevG 71
ARENA Hybridisation of Fossil Fuel Energy Generation in Australia - Public Report
7. References ACIL Tasman, 2009. Fuel resource, new entry and generation costs in the NEM, s.l.: AEMO.
AEMO, 2012. NEM-Wide Historical Information Report, s.l.: AEMO.
ASI, 2012. Realising the Potential of Concentrating Solar Power in Australia, s.l.: Australian Solar Institute.
Australian Solar Institute, 2012. Realising the Potential of Concentrating Solar Power in Australia, s.l.: Australian Solar Institute.
Baxter, L. K. J., 2005. Biomass-coal Co-combustion: Opportunity for Affordable Renewable Energy , s.l.: s.n.
Böszörményi, L. B. a. G., 2003. Hybrid energy technologies for an efficient geothermal heat utilization, s.l.: s.n.
BREE, 2012. Australian Energy Technology Assessment, s.l.: s.n.
Breitholtz, C., 2011. The biomass gasification plant to Vaskiludon Voima in Vaasa and two more ongoing gasification projects. [Online] Available at: http://www.zelenaenergija.org/blobs/eb16f372-fa48-42fe-b621-e9cf0b5fdc7a.pdf [Accessed 21 October 2013].
Buchta, J., n.d. An assessment of renewable energy generation in a conventional steam power plant with geothermal feedwater preheating , s.l.: s.n.
Clean Energy Council, 2013. Bioenergy Bulletin: Using Bagasse for Bioenergy. [Online] [Accessed 2 September 2013].
Clean Energy Council, n.d. Biomass Resource Appraisal, s.l.: s.n.
Crawford D, J. T. O. M. H. A. R. J. B. T., 2012. AEMO 100% Renewable Energy Study: Potential for electricity generaion in Australia from biomass in 2010, 2030 and 2050, Newcastle, Australia: CSIRO Energy Transformed Flagship.
ESI Steam & Power, 2013. ESI completes Dominion Power coal to biomass conversion. [Online] Available at: http://www.esitenn.com/tags/biomass-conversion/ [Accessed 2 September 2013].
Geoscience and ABARE, 2010. Australian Energy Resource Assessment, Canberra: s.n.
Granatstein, D. L., 2002. Case study on Biococomb Biomass Gasification Project Zeltweg Power Station, Austria, s.l.: IEA Bioenergy Agreement - Task 36.

72 Parsons Brinckerhoff | 2158936A-POR-RPT-002 RevG
ARENA Hybridisation of Fossil Fuel Energy Generation in Australia - Public Report
Hotchkiss, R. L. W. H. M., 2002. Waste/Biomass Co-Gasification with Coal, s.l.: Department of Trade and Industry's Cleaner Coal Technology Programme.
IEA, 2013. Database of Biomass Cofiring initiatives. [Online] Available at: http://www.ieabcc.nl/database/cofiring.php [Accessed 2 September 2013].
IEA-ETSAP and IRENA, 2013. Biomass Co-firing Technology Brief, s.l.: IRENA.
IRENA, 2012. Renewable Energy Technologies: Cost Analysis Series - Biomass for Power Generation. s.l.:s.n.
Khalifa, E. D. R. a. K. J., 1978. Geothermal preheating in Fossil-fired Steam Power Plants, s.l.: Department of Energy, U.S.
Khalifa, E. D. R. a. K. J., 1978. Geothermal preheating in Fossil-fired Steam Power PLants, s.l.: Department of Energy, U.S.
Kohl, T. S. R., 2004. Electricity production by geothermal hybrid - plants in low-enthalpy areas, s.l.: s.n.
Libby, C. M. P. C. L., 2010. Demonstration Development Project Solar-Fossil Hybrid Power Plants: Summary Report on Conceptual Designs, California: EPRI.
NETL, 2013. Gasification Plant Databases. [Online] Available at: http://www.netl.doe.gov/technologies/coalpower/gasification/worlddatabase/ [Accessed 2 September 2013].
Peterseim, J. e. a., 2012. Concentrating solar power / energy from waste hybrid plants - creating synergies. s.l.:SolarPaces Conference.
Rutovitz, J. &. P. R., n.d. NSW Bioenergy Handbook. s.l.:Department of Energu, Utilities and Sustainability.
Turchi, C. L. N. B. R. &. L. C., 2011. Solar-Augment Potential of U.S. Fossil-Fired Power Plants, s.l.: National Reneable Energy Laboratory.
Van Loo, S. K. J., 2008. The Handbook of Biomass Combustion & Co-firing, London: Earthscan.
World Coal Association, 2012. Co-firing biomass with coal. [Online] Available at: http://www.worldcoal.org/resources/ecoal-archive/ecoal-current-issue/co-firing-biomass-with-coal/ [Accessed September 2013].
Wyld Group Pty Ltd, 2008. High Temperature Solar Thermal Technology Roadmap, s.l.: New South Wales and Victorian Governments.

Parsons Brinckerhoff | 2158936A-POR-RPT-002 RevG A-1
Appendix A
Biomass feedstock assessment

Parsons Brinckerhoff | 2158936A-POR-RPT-002 RevG A-1
ARENA Hybridisation of Fossil Fuel Energy Generation in Australia - Public Report
A1. Biomass feedstock overview There are a range of biomass feedstocks available for multiple conversion technologies, as detailed subsequently.
A1.1 Municipal solid waste (MSW) MSW can be combusted at specially designed waste-to-energy facilities with a minimal amount of processing. One advantage MSW combustion has over other fuels is that MSW can be obtained either at no cost or in some instances with a negative cost from the MSW facility for receiving and processing raw MSW. Typically, the solid waste incinerated at a waste-to-energy facility contains a proportion of some renewable energy compliant material, along with other waste such as plastics and rubber. Restraints and issues faced by a MSW facility are:
the typical requirement to be close to a waste disposal location;
air quality challenges;
ash deposition and corrosion potential in boilers; and
other challenges such as some hazardous waste, disposal of ash, transportation and wider community and public considerations.
Although MSW-to-energy technology is fairly mature overseas, currently Australia has few significant MSW-to-energy facilities. In the United States alone, there are over 100 MSW-to-energy facilities.
Direct combustion at a waste-to-energy facility and anaerobic digestion are the core technologies for the conversion of MSW and other wastes to energy. Direct combustion of waste is practiced in Australia, however is mostly limited to smaller applications such as incineration of medical waste, paper industry waste (including firing in recovery boilers) and at a larger scale, to solid waste incineration in cement kilns.
Direct waste combustion has been applied on a greater scale around the world, including one of the largest waste-to-energy facilities in the world at Amsterdam:
Amsterdam Waste Fired Power Plant. This plant has a rated capacity of 74 MW, and burns 1.4 million tonnes of MSW annually. The plant generates high pressure (HP) steam at 440°C and 130 bar which is forwarded to the steam turbine. One of the key opposing concepts for any waste-to-energy facility is flue gas pollution. This plant is able to perform at 20% of the flue gas limits set by the Environmental Protection Agency.
The following anaerobic digestion plant is currently in operation in Australia:
EarthPower Waste to Energy Facility, Camelia, NSW. EarthPower is a food waste-to-energy facility using source segregated food waste, and producing electricity as well as fertilizer. The facility can produce 3.9MW electricity to the grid
A paper published by Veolia Environmental Services16 identified the key issues for this facility as:
maintaining feedstock volumes;
the quality of feedstock;
16 S. Rainford & M. Coupe, 2010, Energy Recovery from waste: and analysis of the options, Veolia
Environmental Services
A-2 Parsons Brinckerhoff | 2158936A-POR-RPT-002 RevG
ARENA Hybridisation of Fossil Fuel Energy Generation in Australia - Public Report
the introduction of contamination by customers, thus requiring constant education;
the requirement of a gate fee to customers to be higher than landfill in order for it to be commercially viable;
high maintenance costs; and
significantly electricity-intensive taking away its edge of greenhouse gas reductions that were achieved by keeping waste from entering landfill.
As a generality, the use of MSW and many other wastes for co-firing in utility boilers, other than clean biomass such as timber industry residue, should be approached with thorough consideration and only after comprehensive testing of the fuel has been performed and risk assessment undertaken. On the other hand, it is appropriate to consider the use of separate boilers supplying steam in parallel with a utility boiler as is practiced in Europe.
There are no known projects of this type in Australia.
A1.2 Landfill gas Landfill gas is generated by decomposing organic refuse at waste collection facilities. The gas mostly consists of methane, carbon dioxide, water vapour and organic compounds. Gas is extracted under vacuum via vertical wells and piped to a gas processing plant before being forwarded to a gas engine. The issues associated with landfill gas are similar to the issues from MSW with the added risk of gas combustion. There are a number of landfill gas recovery plants with generation capacity in Australia, mostly less than 5 MW. These include:
Woodlawn Bioreactor. The Woodlawn Bioreactor is a landfill site converted from an open cut mine, 250km South-West of Sydney. The site processes 400,000 tonnes of municipal waste annually, and can produce 3MW electricity.
Lucas Heights 2. This site is grid connected and produces 17.3MW of electricity. The site processes 570,000 tonnes of waste annually.
New Energy, Boodarie. The New Energy waste to energy plant is approved for construction for the end of 2013. The plant is expected to process 255,000 tonnes of waste annually, and produce 15.5MW electricity to the grid. The plant will use gasification of the waste it receives (a thermal process, different to the process used by conventional landfill gas recovery facilities).
There has been a power station hybridisation by co-firing of landfill gas at Swanbank B Power Station in Queensland. Approximately 6% of the thermal load was achieved by direct combustion of landfill gas in the coal fired power station boiler. This was a successful operation but with the retirement of Swanbank B, has been discontinued.
No specific application for co-firing landfill gas has been identified in this study and the current practice is for the gas to be burnt directly in reciprocating engine generator systems at the landfill site.
A1.3 Bagasse Bagasse, being the fibrous by-product left over from sugar cane crushing, is often combusted in boilers on or close-by to the crushing facility to produce both the electrical and steam demand of the crushing process. At Australian sites, half of the electricity generated is also exported to the grid. There are currently 28 sugar cane mill sites in Australia, predominantly on the East Coast. Bagasse boilers offer numerous advantages including lower greenhouse gas emissions than conventional coal boilers, and when coupled with a sugar cane crushing facility, fuel supply is considered as a free by-product. The restriction placed on bagasse boilers is that the fuel supply is dependent on the cane season, and typically only lasts for 22 weeks, giving a

Parsons Brinckerhoff | 2158936A-POR-RPT-002 RevG A-3
ARENA Hybridisation of Fossil Fuel Energy Generation in Australia - Public Report
need for boiler shutdowns in the off season or flexibility to run on other fuels such as coal or wood pellets. Since some boilers are shutdown during the off season, there may be some opportunity for conversion to dual firing with woodchip and exporting to the grid during this time. For bagasse boilers that already have coal firing capability, there may be opportunity for woodchip co-firing in the off season. Typically however, bagasse boiler generation per site is below 100MW.
The Australian Energy Market Operator (AEMO) estimates that there is approximately 5.5 Mt/yr of bagasse potentially available for electricity production17. This translates to 6.4 TWh/yr of electricity, although regionally, AEMO estimates there to be 2–3 TWh/yr of generation across two regions.
Examples of bagasse generation sites include:
Invicta Sugar Mill, Biru, Queensland. Invicta Mill generates a total of 50MWe, with 40MW exported to the grid.
Rocky Point Sugar Mill, Maroochie River, Queensland. Capacity for the plant is 30MW fired mostly on Bagasse from own operations. The mill also burns fuel from council green waste, and wood waste from a nearby mulching business.
Condong, Broadwater and Harwood Sugar Mills in Northern NSW runs year round with bagasse in the crushing season and wood waste and other wastes in the off- season.
According to the Clean Energy Council18, most sugar mills use coal during the off-season, though are now considering other alternatives such as co-firing with pellets. Such mills may be potentially receptive to an implementation of co-firing or sourcing of alternate fuels. Movements to reduce some mills usage of coal in the off-season has already commenced with Mackay Sugar receiving a $9 million grant from the Federal Government in 2012 to improve the efficiency of the Marian mill boiler under coal firing.
While bagasse would be an appropriate fuel for co-firing, none was found to be available near enough to power stations to be viable.
A1.4 Energy crops Energy crops are plantations established specifically for the purpose of use as fuel for energy. Energy crops are typically densely planted with the intention of being low cost and low maintenance. Although the intended origin of energy crop fuel is somewhat different by definition to that of wood waste, the typical application of technology for firing is the same as wood waste. One such example of a viable energy crop is Mallee Eucalypt. Energy crops have an added benefit of bringing viability to previous uneconomical or unused farm land, or being integrated complimentarily with pre-existing agricultural establishments. To improve fuel quality, energy crops may be compacted and pelletised, thus improving performance.
AEMO estimates energy crop availability to be currently negligible19. Should demand arise AEMO predicts 10 Mt/yr by 2030 could be available. Regionally, AEMO estimates possible electricity generation of between 1.3 TWh/yr and 4 TWh/yr (8 regions).
17 Crawford D et al., 2012. AEMO 100% Renewable Energy Study: Potential for electricity generation in
Australia from biomass in 2010, 2030 and 2050, Newcastle, Australia: CSIRO Energy Transformed Flagship
18 Clean Energy Council, 2013. Bioenergy Bulletin: Using Bagasse for Bioenergy. [Online] [Accessed 2 September 2013] and Clean Energy Council, n.d. Biomass Resource Appraisal, s.l.: s.n. 19 Crawford D et al., 2012. AEMO 100% Renewable Energy Study: Potential for electricity generation in
Australia from biomass in 2010, 2030 and 2050, Newcastle, Australia: CSIRO Energy Transformed Flagship

A-4 Parsons Brinckerhoff | 2158936A-POR-RPT-002 RevG
ARENA Hybridisation of Fossil Fuel Energy Generation in Australia - Public Report
Currently in Australia, crops are not grown specifically for use as a fuel source. Rather crop residue may be used such as wood waste and bagasse. Around the world, energy crop utilization is not well developed. It wasn’t until 2011 that the Drax power station in the UK became the first power station in the UK to create a farm dedicated to the testing of energy crops for its boilers. Projects of note to date include:
Verve energy’s Narrogin Integrated Wood Project. The plant is used for the processing of oil mallee to produce eucalypt oil. In addition, the plant fires mallee to produce 1MW of power and commenced construction in 2000. The plant was established as a trial only, and is currently idle waiting for other investors. The plant demonstrated the potential for harvesting of a dedicated energy crop.
Drax power station, UK. Covered further under wood waste below, the Drax power station in the UK, a 6x660MW plant, commenced testing of dedicated energy crop firing in 2011. Drax established a 70-acre dedicated “Energy SMART farm” within its site boundaries for the co-firing.
There have been limited trials in power stations in Australia but no ongoing use is known.
A1.5 Wood waste Wood waste refers to wood remains from wood applications such as residue from forest logging offcuts, and branches at the plantation, sawmill saw dust, lumber manufacturing offcuts, construction offcuts, demolition waste, paper making waste, woodchip from milling processes and wood found in municipal solid waste. In some applications, wood waste may be pelletised to improve the fuel quality. A core issue faced in wood waste sourcing is achieving a consistent supply both in terms of supply rate and quality.
The preferred combustion technologies available to wood waste (and energy crop) include:
Co-firing via integration with existing boiler
Typical co-firing biomass through the existing or modified burner/mill systems take up to about 12.5% of energy input to the boiler as biomass.
Conversion of boiler to full biomass firing
New boiler on site. This could be a fluidised bed or a grate, depending upon the fuel type.
Retrofit of gas turbine plant to a hybrid combined cycle plant.
AEMO estimates 7.3 Mt/yr of wood waste from native forests, giving a potential for 10.4 TWh/yr of electricity20.This however, depends on the regions and may range between 0.5 TWh/yr and 1.6TWh/yr for each region (4 to 6 regions). An additional 8 to 10 Mt/yr is estimated as available from plantations, converting to 12 to 16 TWh/yr of electricity, however this is highly dependent on the region. Regionally, the electricity production is between zero to 2.8 TWh/yr (6 regions). Crop stubble is also estimated by AEMO to be 18 Mt/yr within the AEMO regions, translating to 20 TWh/yr of electricity. This figure is noted to vary significantly and is around 1 Mt/yr to 3 Mt/yr, across 11 regions.
A1.6 Agricultural waste The term agricultural waste extends to any fuel source obtained as waste from farming activities being that of crop cultivation or animal rearing. Bagasse and wood waste therefore may also fall under this fuel source category. Other examples of agricultural waste include shells from coconut, nuts and peanuts, corn cobs and leaves, cotton and rice stalks, ground coffee waste, straw from wheat and barley. The examples given can
20 Crawford D et al., 2012. AEMO 100% Renewable Energy Study: Potential for electricity generation in
Australia from biomass in 2010, 2030 and 2050, Newcastle, Australia: CSIRO Energy Transformed Flagship

Parsons Brinckerhoff | 2158936A-POR-RPT-002 RevG A-5
ARENA Hybridisation of Fossil Fuel Energy Generation in Australia - Public Report
be referred to as dry residues. The key technologies available to agricultural waste are combustion technologies (similar to wood waste), gasification, and pyrolysis.
A1.6.1 Dry Residue
The technology range applicable to dry residue agricultural waste is similar to that used for firing wood waste and bagasse.
Within Australia there are a number of examples of small scale boilers fired on agricultural waste including:
Suncoast Gold’s Macadamia Nut Power Plant. The plant is located in Gympie, Queensland, and produces 6MW as steam and electricity for the Macadamia operations, and 1.5MWe for the grid.
Nestle Gympie Fluidised Bed Boiler. Nestle operates a 16MW thermal wood and coffee fired bubbling fluidised bed boiler.
Australian Tartaric Products Cogeneration, Victoria. An 8MW thermal biomass boiler fired on grape marc, grape lees, and centrifuged by-products created from the wine making process. This project is nearing completion.
The Ely Power Station, Cambridgeshire, England is the world’s largest straw fired power station, generating 38MW of electricity.
While hybrid technology of integration of an agricultural waste supply (excluding bagasse and wood chip) with an existing large scale boiler is not demonstrated within Australia, the individual technology for firing agricultural waste is fairly mature within Australia giving potential for development of an integration project.
A1.6.2 Wet Residue
Wet residues consist of animal slurry and farmyard manure. Wet residues have a high moisture content, and are primarily used for fertilisers. The high moisture of wet residues means anaerobic digestion for production of biogas is the most suitable conversion to energy application. Anaerobic digestion is fairly mature around the world; however it is a fairly modestly developed technology in Australia. An example is below:
Berrybank Farm, Windermere, Victoria. The farm has 15,000 pigs which produce the same quantity of effluent as a city of 40,000 people. The farm generates 2.9MW to the grid by anaerobic digestion of the pig effluent to generate biogas, which is fed to a gas engine. The project costs A$2 million, and reportedly saves the farm A$425,000 annually.
The core of the difficulties surrounding any significant implementation of large scale anaerobic digestion technology for biogas is the wide distribution and range of potential feedstock. Annual variation in potential feedstock also complicates large scale viability. Furthermore, many such economical concentrations of wet residue may often already be used for fertiliser product.
Direct firing of wet residue is somewhat under developed particularly in Australia. Globally, some significant projects have been developed including:
Thetford Power Station UK. As one of the largest biomass power stations in the UK, Thetford burns 450,000 tonnes of poultry litter annually in a conventional boiler to generate 38.5MW of electricity.
Westfield Biomass Plant, Cardenden, Scotland. A 10MW bubbling fluidized bed boiler fired on poultry litter, generating steam and electricity for the grid.

Parsons Brinckerhoff | 2158936A-POR-RPT-002 RevG B-1
Appendix B
Penetration level modelling integration schematics
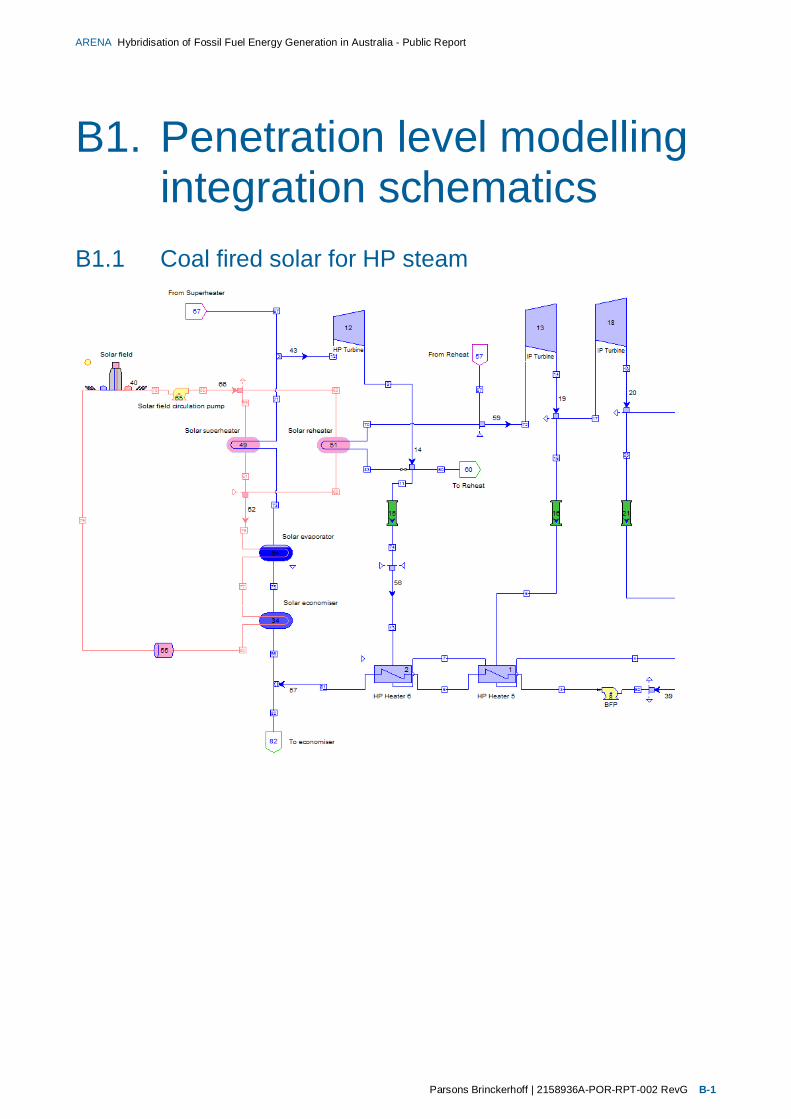
Parsons Brinckerhoff | 2158936A-POR-RPT-002 RevG B-1
ARENA Hybridisation of Fossil Fuel Energy Generation in Australia - Public Report
B1. Penetration level modelling integration schematics
B1.1 Coal fired solar for HP steam

B-2 Parsons Brinckerhoff | 2158936A-POR-RPT-002 RevG
ARENA Hybridisation of Fossil Fuel Energy Generation in Australia - Public Report
B1.2 Coal fired solar boost
Parsons Brinckerhoff | 2158936A-POR-RPT-002 RevG B-3
ARENA Hybridisation of Fossil Fuel Energy Generation in Australia - Public Report
B1.3 Dedicated biomass boiler

B-4 Parsons Brinckerhoff | 2158936A-POR-RPT-002 RevG
ARENA Hybridisation of Fossil Fuel Energy Generation in Australia - Public Report
B1.4 Geothermal preheating in the low pressure feed heating train

Parsons Brinckerhoff | 2158936A-POR-RPT-002 RevG B-5
ARENA Hybridisation of Fossil Fuel Energy Generation in Australia - Public Report
B1.5 Gas fired solar boost

Parsons Brinckerhoff | 2158936A-POR-RPT-002 RevG C-1
Appendix C
List of fossil fuelled power plants
Parsons Brinckerhoff | 2158936A-POR-RPT-002 RevG C-1
ARENA Hybridisation of Fossil Fuel Energy Generation in Australia - Public Report
Power Station State Owner Unit Numbers and Nameplate Capacity (MW)
Installed Capacity (MW)
Plant Type Operation Type
Fuel Grid Year Commissioned
Coordinates
Bayswater NSW Macquarie Generation 4 x 660 2,640 Steam Sub Critical Base Black Coal NEM First 1985, last 1986
32°23 45 S 150°56 57 E
Bell Bay Three TAS Aurora Energy Tamar Valley Pty Ltd 3 x 40 120 OCGT Peak Natural Gas Pipeline NEM 2006 41°08 31 S 146°54 09 E
Bluewaters WA Bluewaters Power 2 x 208 416 Steam Sub Critical Base Black Coal SWIS 2009 33°19 49 S 116°13 41 E
Braemar QLD Alinta Energy 3 x 168 504 OCGT Peak Coal Seam Methane NEM 2006 27°06 36 S 150°54 18 E
Braemar 2 QLD Arrow Energy 3 x 173 519 OCGT Intermediate Coal Seam Methane NEM 2009 27°06 36 S 150°54 18 E
Callide B QLD CS Energy 2 x 350 700 Steam Sub Critical Base Black Coal NEM 1988 24°20 50 S 150°36 31 E
Callide C QLD Callide Power Management 2 x 420 840 Steam Super Critical Base Black Coal NEM 2001 24°20 50 S 150°36 31 E
Cape Lambert WA Rio Tinto 2 x 43; 1 x 35 120 CCGT Base Natural Gas Pipeline NWIS Expected 2014 20°35 34 S 117°10 50 E
Channel Island NT NT Power and Water Corp 6 x 30, 2 x 45; 1 x 40 310 OCGT, CCGT Base Natural Gas Pipeline DKIS First 1986, last 2012
12°33 18 S 130°51 59 E
Cockburn Power Station WA Verve energy 1 x 165; 1 x 75 240 CCGT Base Natural Gas Pipeline SWIS 2003 32°12 00 S 115°46 26 E
Collie WA Verve energy 1 x 340 340 Steam Sub Critical Base Black Coal SWIS 1999 33°20 33 S 116°15 44 E
Collinsville QLD Ratch Australia 3 x 32; 1 x 33; 1 x 66 195 Steam Sub Critical Intermediate Black Coal NEM 1976 20°32 36 S 147°48 25 E
Colongra NSW Delta Electricity 4 x 167 667 OCGT Peak Natural Gas Pipeline NEM 2009 33°12 38 S 151°32 33 E
Condamine A QLD QGC 2 x 43; 1 x 57 144 CCGT Base Coal Seam Methane NEM 2009 26°39 49 S 150°15 53 E
Darling Downs QLD Origin Energy 3 x 121.5; 1 x 280 644 CCGT Base Coal Seam Methane NEM 2010 27°06 39 S 150°54 20 E
Dry Creek SA Synergen Power Pty. Ltd. 3 x 52 156 OCGT Peak Natural Gas Pipeline NEM 1975 34°50 51 S 138°34 54 E
Eraring NSW Origin Energy 4 x 720 2,880 Steam Sub Critical Base Black Coal NEM First 1982, last 1984
33°03 44 S 151°31 13 E
Gladstone QLD Gladstone Power Station Participants 6 x 280 1,680 Steam Sub Critical Base Black Coal NEM First 1976, last 1982
23°51 03 S 151°13 10 E
Hallett SA EnergyAustralia 4 x 16.4, 3 x 17, 2 x 17.3, 2 x 24.8, 1 x 27.5
228.3 OCGT Peak Natural Gas Pipeline NEM 2001 33°20 56 S 138°45 06 E
Jeeralang VIC Ecogen Energy 4 x 51, 3 x 76 432 OCGT Peak Natural Gas Pipeline NEM First 1979, last 1980
38°16 30 S 146°25 32 E
Kemerton WA Ratch 2 x 150 300 OCGT Peak Natural Gas Pipeline SWIS 2005 33°9 49 S 115°46 50 E
Kogan Creek QLD CS Energy 1 x 744 744 Steam Super Critical Base Black Coal NEM 2007 26°54 59 S 150°44 57 E
Kwinana WA Verve energy 2 x 200, 1x20 420 Steam Sub Critical + OCGT
Base Black Coal, Natural Gas Pipeline
SWIS First 1970, last 1980
32°11 55 S 115°46 29 E
Laverton North VIC Snowy Hydro 2 x 156 312 OCGT Peak Natural Gas Pipeline NEM 2006 37°50 28 S 144°47 20 E
C-2 Parsons Brinckerhoff | 2158936A-POR-RPT-002 RevG
ARENA Hybridisation of Fossil Fuel Energy Generation in Australia - Public Report
Power Station State Owner Unit Numbers and Nameplate Capacity (MW)
Installed Capacity (MW)
Plant Type Operation Type
Fuel Grid Year Commissioned
Coordinates
Liddell NSW Macquarie Generation 4 x 500 2,000 Steam Sub Critical Base Black Coal NEM First 1971, last 1973
32°22 19 S 150°58 38 E
Mica Creek QLD Stanwell Corporation Limited 1 x 55; 3 x 35; 3 x 33; 2 x 30; 1 x 14
333 CCGT & gas fired boiler Base Natural Gas Pipeline Ergon Energy Grid
1960 onwards 20°46 40 S 139°29 26 E
Millmerran QLD Millmerran Power Partners 2 x 428 856 Steam Super Critical Base Black Coal NEM 2002 27°57 42 S 151°16 45 E
Mortlake stage 1 VIC Origin Energy 2 x 283 566 OCGT Peak Natural Gas Pipeline NEM 2012 38°04 04 S 142°48 00 E
Mt Piper NSW EnergyAustralia 2 x 700 1,400 Steam Sub Critical Base Black Coal NEM First 1993, last 1996
33°21 32 S 150°1 56 E
Mt Stuart QLD Origin Energy 2 x 144; 1 x 126 414 OCGT Peak Kerosene Aviation fuel used for stationary energy
NEM First 1999, last 2009
19°20 17 S 146°51 02 E
Muja WA Verve energy 2 x 200, 2 x 227 854 Steam Sub Critical Base Black Coal SWIS First 1966, last 1986
33°26 47 S 116°18 23 E
Mungarra Power Station WA Verve energy 3 x 37 112 OCGT Intermediate Natural Gas Pipeline SWIS 1990 28°53 21 S 115°07 04 E
Neerabup WA ERM Power 2 x 165 330 OCGT Peak Natural Gas Pipeline SWIS 2009 31°40 14 S 115°48 09 E
NewGen Kwinana WA Sumitomo 1 x 160; 1 x 160 320 CCGT Intermediate Natural Gas Pipeline SWIS 2008 32°11 55 S 115°46 29 E
Newport VIC Ecogen Energy 1 x 500 500 Steam Sub Critical Peak Natural Gas Pipeline NEM 1980 37°50 29 S 144°53 41 E
Northern SA Alinta Energy 2 x 265 530 Steam Sub Critical Base Brown Coal NEM 1985 32°32 36 S 137°47 17 E
Oakey QLD Oakey Power Holdings 2 x 141 282 OCGT Peak Natural Gas Pipeline and Distillate Oil
NEM 1999 27°25 07 S 151°40 48 E
Osborne SA Origin Energy 1 x 120; 1 x 60 180 CCGT Base Natural Gas Pipeline NEM 1998 34°47 53 S 138°30 28 E
Paraburdoo WA Rio Tinto 4 x 39 156 OCGT Base Natural Gas Pipeline RP 23°13 26 S 117°36 48 E
Parkeston WA Transalta 3 x 43 110 OCGT Peak Natural Gas Pipeline RP 1996 30°44'17"S 121°30'24"E
Pelican Point SA Pelican Point Power Limited 2 x 163, 1 x 175 478 CCGT Intermediate Natural Gas Pipeline NEM First 2000, last 2001
34°45 47 S 138°30 18 E
Pinjar WA Verve energy 1 x 123, 2 x 116, 6 x 36
572 OCGT Peak Natural Gas Pipeline SWIS First 1990, last 1996
31°33 29 S 115°49 05 E
Pinjarra WA Alinta Energy 2 x 140 280 CCGT cogeneration Base Natural Gas Pipeline SWIS First 2006, last 2007
32°38 51 S 115°56 49 E
Playford B SA Alinta Energy 4 x 60 240 Steam Sub Critical Intermediate Brown Coal NEM 1963 32°32 22 S 137°47 00 E
Port Hedland WA Alinta Energy 5 x 42 210 OCGT Peak Natural Gas Pipeline NWIS 1995 & 1998 20°25 45 S 118°32 59 E
Quarantine SA Origin Energy 4 x 24, 1 x 128 224 OCGT Peak Natural Gas Pipeline NEM First 2001, last 2009
34°48 24 S 138°31 24 E
Redbank NSW Redbank Energy Ltd 1 x 143.8 143.8 Steam Sub Critical Base Black Coal NEM 2001 32°34 48 S 151°04 19 E
Smithfield Energy Facility NSW Marubeni 3 x 36.3; 1 x 62 170.9 CCGT Base Natural Gas Pipeline NEM 1997 33°51 00 S

Parsons Brinckerhoff | 2158936A-POR-RPT-002 RevG C-3
ARENA Hybridisation of Fossil Fuel Energy Generation in Australia - Public Report
Power Station State Owner Unit Numbers and Nameplate Capacity (MW)
Installed Capacity (MW)
Plant Type Operation Type
Fuel Grid Year Commissioned
Coordinates
150°56 58 E
Somerton VIC AGL 4 x 40 160 OCGT Peak Natural Gas Pipeline NEM 2001 37°37 55 S 144°57 11 E
Stanwell QLD Stanwell Corporation Limited 4 x 365 1,460 Steam Sub Critical Base Black Coal NEM First 1993, last 1996
23°30 35 S 150°19 07 E
Swanbank E GT QLD Stanwell Corporation Limited 1 x 265; 1 x 120 385 CCGT Base Coal Seam Methane NEM 2002 27°39 35 S 152°48 52 E
Tallawarra NSW EnergyAustralia 1 x 275, 1 x 160 420 CCGT Base Natural Gas Pipeline NEM 2009 34°31 22 S 150°48 29 E
Tamar Valley Combined Cycle
TAS Aurora Energy Tamar Valley Pty Ltd 1 x 140; 1 x 68 208 CCGT Base Natural Gas Pipeline NEM 2009 41°09 18 S 146°55 37 E
Tarong QLD Stanwell Corporation Limited 4 x 350 1,400 Steam Sub Critical Base Black Coal NEM First 1984, last 1986
26°46 52 S 151°54 54 E
Tarong North QLD Stanwell Corporation Limited 1 x 450 450 Steam Super Critical Base Black Coal NEM 2003 26°46 52 S 151°54 54 E
Torrens Island A SA AGL Energy 4 x 120 480 Steam Sub Critical Intermediate Natural Gas Pipeline NEM 1967 34°48 24 S 138°31 24 E
Torrens Island B SA AGL Energy 4 x 200 800 Steam Sub Critical Intermediate Natural Gas Pipeline NEM 1976 34°48 24 S 138°31 24 E
Uranquinty NSW Origin Energy 4 x 166 664 OCGT Peak Natural Gas Pipeline NEM 2009 35°10 49 S 147°13 00 E
Vales Point B NSW Delta Electricity 2 x 660 1,320 Steam Sub Critical Base Black Coal NEM First 1976, last 1980
33°09 38 S 151°32 31 E
Valley Power VIC Snowy Hydro 6 x 50 300 OCGT Peak Natural Gas Pipeline NEM 2001 38°15 12 S 146°35 20 E
Wagerup WA Alinta Energy 2 x 162 320 OCGT Peak Gas and Distillate SWIS 2007 32°54 58 S 115°55 08 E
Wallerawang C NSW EnergyAustralia 2 x 500 1,000 Steam Sub Critical Base Black Coal NEM 1976 & 1980 33°24 14 S 150°05 04 E
Weddell NT NT Power and Water Corp 3 x 40 120 OCGT Base Natural Gas Pipeline DKIS 2008 12°34 38 S 130°57 01 E
Worsley Alumina WA Griffin Energy 2 x 55 110 Steam Sub Critical Base Black Coal SWIS 2012 33°14 19 S 116°03 44 E
Yabulu QLD Ratch Australia 1 x 160; 1 x 84 244 CCGT Base Coal Seam Methane NEM 1999 & 2005 19°12 56 S 146°36 04 E
Yarwun QLD Rio Tinto 1 x 154 154 CCGT cogeneration Base Natural Gas Pipeline NEM 2010 23°49 36 S 151°09 13 E
Parsons Brinckerhoff | 2158936A-POR-RPT-002 RevG D-1
Appendix D
Resource and technology suitability and fatal flaws assessment
scoring sheet

Parsons Brinckerhoff | 2158936A-POR-RPT-002 RevG D-1
ARENA Hybridisation of Fossil Fuel Energy Generation in Australia - Public Report

D-2 Parsons Brinckerhoff | 2158936A-POR-RPT-002 RevG
ARENA Hybridisation of Fossil Fuel Energy Generation in Australia - Public Report

Parsons Brinckerhoff | 2158936A-POR-RPT-002 RevG D-3
ARENA Hybridisation of Fossil Fuel Energy Generation in Australia - Public Report

Parsons Brinckerhoff | 2158936A-POR-RPT-002 RevG E-1
Appendix E
MCA scoring sheet

Parsons Brinckerhoff | 2158936A-POR-RPT-002 RevG E-1
ARENA Hybridisation of Fossil Fuel Energy Generation in Australia - Public Report

E-2 Parsons Brinckerhoff | 2158936A-POR-RPT-002 RevG
ARENA Hybridisation of Fossil Fuel Energy Generation in Australia - Public Report

Parsons Brinckerhoff | 2158936A-POR-RPT-002 RevG F-1
Appendix F
Stakeholder workshop attendees
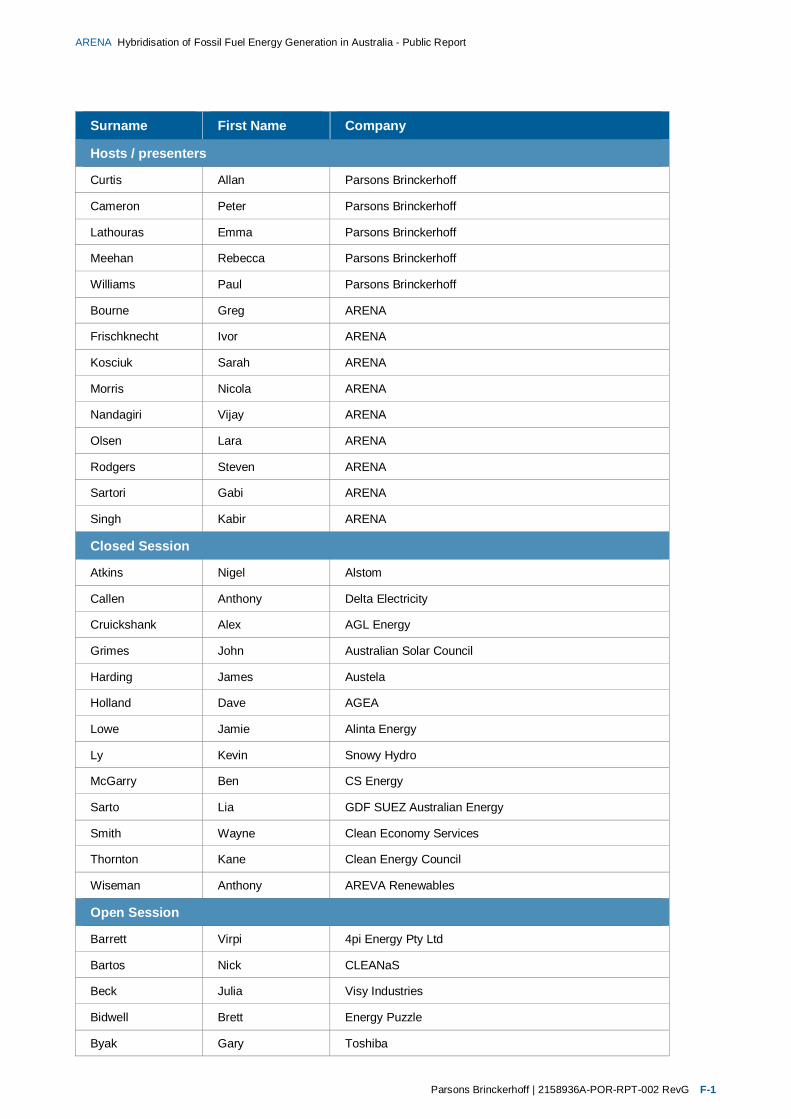
Parsons Brinckerhoff | 2158936A-POR-RPT-002 RevG F-1
ARENA Hybridisation of Fossil Fuel Energy Generation in Australia - Public Report
Surname First Name Company
Hosts / presenters
Curtis Allan Parsons Brinckerhoff
Cameron Peter Parsons Brinckerhoff
Lathouras Emma Parsons Brinckerhoff
Meehan Rebecca Parsons Brinckerhoff
Williams Paul Parsons Brinckerhoff
Bourne Greg ARENA
Frischknecht Ivor ARENA
Kosciuk Sarah ARENA
Morris Nicola ARENA
Nandagiri Vijay ARENA
Olsen Lara ARENA
Rodgers Steven ARENA
Sartori Gabi ARENA
Singh Kabir ARENA
Closed Session
Atkins Nigel Alstom
Callen Anthony Delta Electricity
Cruickshank Alex AGL Energy
Grimes John Australian Solar Council
Harding James Austela
Holland Dave AGEA
Lowe Jamie Alinta Energy
Ly Kevin Snowy Hydro
McGarry Ben CS Energy
Sarto Lia GDF SUEZ Australian Energy
Smith Wayne Clean Economy Services
Thornton Kane Clean Energy Council
Wiseman Anthony AREVA Renewables
Open Session
Barrett Virpi 4pi Energy Pty Ltd
Bartos Nick CLEANaS
Beck Julia Visy Industries
Bidwell Brett Energy Puzzle
Byak Gary Toshiba

F-2 Parsons Brinckerhoff | 2158936A-POR-RPT-002 RevG
ARENA Hybridisation of Fossil Fuel Energy Generation in Australia - Public Report
Surname First Name Company
Chambers Craig AECOM
Duerden Harry Geowave engines Pty Ltd
Faust Ana Maria Reed Exhibitions
Fowler Rick Coal Innovation NSW, NSW Trade & Investment
Fox Paul Calcef
Gerner Ed Geoscience Australia
Goodwin Wayne Beca
Gravett Martin Transpacific Industries
Grima Charles Aurecon
Gurgenci Hal The University of Queensland
Gurney Phil Brown Coal Innovation Australia
Hayes Bernard Alstom
Huddleston-Holmes Cameron CSIRO
Khoo Paul Graphite Energy
Knight James Coal Innovation NSW, NSW Dept of Trade & Investment
Kovacic Felipe Origin Energy
Lasich John Raygen Resources
Lowry Graham Boiler & Power Plant Services Pty Ltd
McGarry Ben CS Energy
Napper Mark HydroSun Holdings Pty Ltd
Noone Ben UNSW
Patel Kalpen Cogent Energy
Pedler Mark DMITRE
Pusenjak Steve GHD
Smith Jodi Department of Resources, Energy and Tourism
Smitham Jim CSIRO
Voukelatos Spiros Mitsubishi Australia Ltd
Way Catherine RenewablesSA
Wearmouth Andy Verve Energy

Parsons Brinckerhoff | 2158936A-POR-RPT-002 RevG G-1
Appendix G
GIS maps

Parsons Brinckerhoff | 2158936A-POR-RPT-002 RevG G-1
ARENA Hybridisation of Fossil Fuel Energy Generation in Australia - Public Report

G-2 Parsons Brinckerhoff | 2158936A-POR-RPT-002 RevG
ARENA Hybridisation of Fossil Fuel Energy Generation in Australia - Public Report

Parsons Brinckerhoff | 2158936A-POR-RPT-002 RevG G-3
ARENA Hybridisation of Fossil Fuel Energy Generation in Australia - Public Report

G-4 Parsons Brinckerhoff | 2158936A-POR-RPT-002 RevG
ARENA Hybridisation of Fossil Fuel Energy Generation in Australia - Public Report

Parsons Brinckerhoff | 2158936A-POR-RPT-002 RevG G-5
ARENA Hybridisation of Fossil Fuel Energy Generation in Australia - Public Report

G-6 Parsons Brinckerhoff | 2158936A-POR-RPT-002 RevG
ARENA Hybridisation of Fossil Fuel Energy Generation in Australia - Public Report