Embed Size (px)
Citation preview
0
Hybrid Wireless Broadband Networks
Juwita Mohd Sultan
A thesis submitted to
Lancaster University for the degree of
Doctor of Philosophy
2016
i
Abstract
Hybrid Wireless Broadband Networks
Juwita Mohd Sultan
Submitted for the degree of Doctor of Philosophy
February 2016
A hybrid system is an integration of two or more different systems, particularly in this
thesis referring to wireless broadband networks. However, to provide end-to-end quality of
service (QoS) in a hybrid system is a challenging task due to different protocol in each
system.
In this thesis, we aim to improve the overall performance of hybrid networks in a
disaster management by addressing the challenges as well as the problems in a homogeneous
network. Such an approach allows more efficient multi-parameter optimization and
significant improvements in the overall system performance. More specifically, we introduce
two novel algorithms. The first is the novel end-to-end QoS algorithm for hybrid wireless
broadband networks. We proposed the end-to-end QoS maps based on particular chosen
parameters and analyse the simulation results. The QoS maps are applied to a few scenarios,
and the performance evaluation of the constructed network is presented. Based on the results
obtained by software simulation tools, the performance validation shows that the hybrid
network has specific advantages and constraints in terms of number of users, preference,
coverage and applications.
The second algorithm presented is the novel in users’ application algorithm, the
purpose of which is to optimize bandwidth for first responders applied in the PPDR project

ii
under grant agreement EU FP7 SEC PPDR-TC. This algorithm is responsible for
incorporating more users and different levels of background load to a hybrid network. The
proposed method analyses both positive and negative outcomes based on the results obtained.
This algorithm has been presented in the PPDR project.

iii
Declaration
I declare that the material presented in this thesis consists of original work undertaken
solely by myself and whenever work by other authors is referred to, it has been properly
referenced. The material has not been submitted in substantially the same form for the award
of a higher degree elsewhere.
Juwita Mohd Sultan
February 2016
iv
List of Publications/ Contributions
Published:
Journals:
1. D. Zvikhachevskiy, J.M.Sultan, K.Dimyati, “Quality of Service Mapping Over
WiFi+WiMAX and WiFi+LTE Networks”, in Journal of Telecommunication
Electronic and Computer Engineering (JTEC), Vol 5 No 2, 2013.
2. J. M. Sultan, G. Markarian, and P. Benachour, “WiMAX Quality of Service
Deployment in Disaster Management,” in International Journal of Advances in
Computer Networks and Its Security (IJCNS), Vol 5, Issue 1, ISSN 2250-3575, 2015.
Conferences:
1. J. M. Sultan, G. Markarian, and P. Benachour, “WiMAX Quality of Service
Deployment in Disaster Management,” in International Conference On Advances in
Computing, Communication and Information Technology, CCIT 2014, Birmingham,
UK, 16-17 November, 2014.
2. J. M. Sultan, G. Markarian, “ Network Optimization for Integration of WiFi and
WiMAX ”, in IEEE Fourth International Conference on Future Generation
Communication Technologies, FGCT 2015, Luton, 29-31 July, 2015.
Submitted:
Journals:
1. J. M. Sultan, M.S. Johal, “Cross Layer Scheduling in WiMAX QoS for Disaster
Management ”, submitted to Journal of Telecommunication Electronic and Computer
Engineering (JTEC). (Accepted)
Conferences:
1. J. M. Sultan, G. Markarian, and P. Benachour , “Interoperability of WiFi and WiMAX
in Disaster Management for PPDR Services,” IEEE International Conference on
Communications, ICC’16, Malaysia, 23-27 May 2016.

v
Acknowledgements
I would like to thank, first of all, the God almighty, without whom nothing is
possible. My sincerest gratitude towards my supervisor, Professor Garik Markarian, for
believing in me since the beginning of this journey, being patient with me during the most
challenging times and comforting me with good advice. This thesis has significantly
benefited from his valuable guidance, insights and constant encouragement. I greatly
appreciate his care and concern, not only for my intellectual and personal growth, but also for
the well-being of my family and myself.
I wish to thank Dr Phillip Benachour for his thoughtful guidance and insightful
suggestions in some parts of the research work. I would also like to thank Professor
Kaharudin Dimyati from Universiti Pertahanan Nasional Malaysia (UPNM) in Malaysia,
who, has always supported me even though I am no longer his student.
Also, I would like to take this opportunity to thank the RINICOM LTD engineers
- James Jackson, Danil Kuzin, Luis Teixeira and Natasha Mccrone, for their insightful
discussions and suggestions during the EU research project which has made a profound
impact on my research. To my lab mates in the School of Computing and Communications,
InfoLab 21, my sincere thanks for being great neighbors and those valuable technical
discussions.
I would also like to thank my sponsor and employer, Ministry of Education,
Malaysia and Universiti Teknikal Malaysia Melaka (UTeM), who gave me the opportunity to
further my studies and also provided financial support, without which this research would not
have been possible.
Finally, my deepest gratitude to my family, my parents and parents-in-law, for
their unconditional love and support throughout my life, especially when I delivered my

vi
second baby during the 1st year of my studies; and of course, to my brother, who has never
stopped motivating me since the beginning of my journey in the academia world.
To my beloved husband, Mohamed Azuani, for his continuous and undying love,
especially during my formative years, so much so that I did not have to worry about anything
else but my studies. I really appreciate that. My heartfelt thanks to my dearly beloved
daughters, Arrissha Qaisara and Aisy Qairina, for their love, encouragement, and support
throughout my years here in Lancaster University. This thesis is dedicated to them.
vii
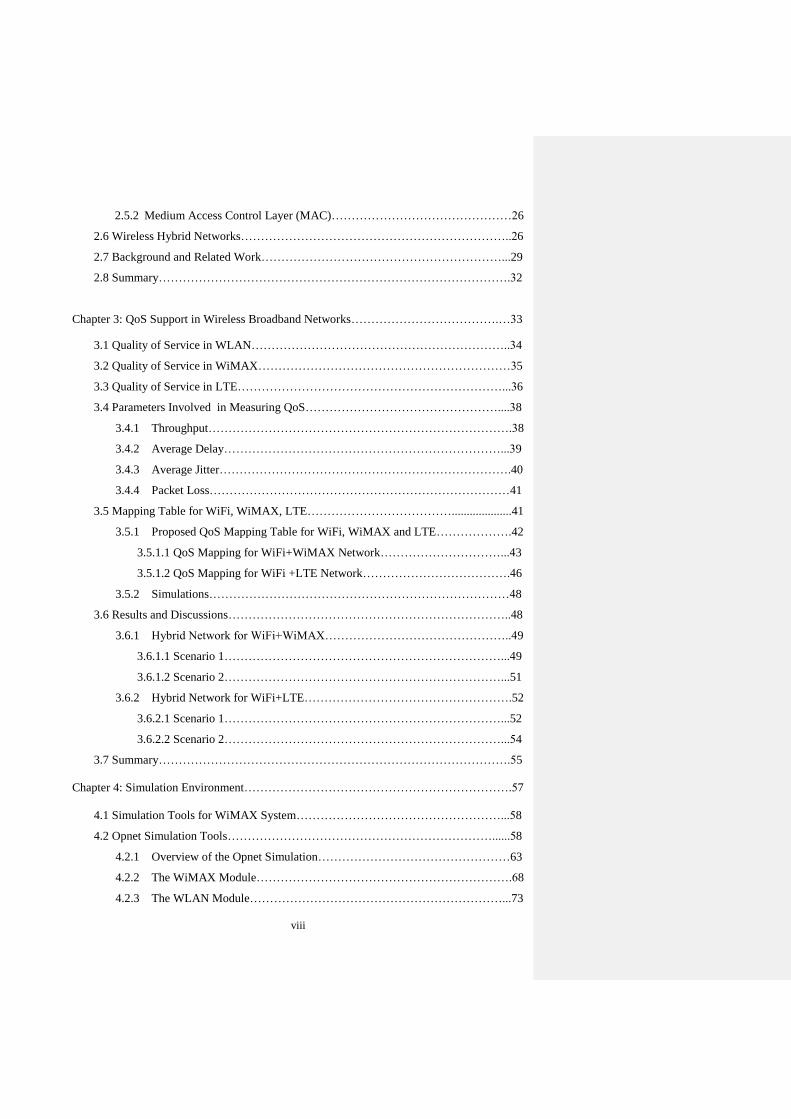
Table of Contents
Abstract………………………………………………………………………………………...i
Declaration……………………………………………………………………………………iii
List of Publications/ Contributions…………………………………………………………...iv
Acknowledgement……………………………………………………………………………..v
List of Tables…………………………………………………………………………………..x
List of Figures………………………………………………………………………………...xi
List of Abbreviations……………………………………………………………………..…xiii
Chapter 1: Introduction………………………………………………………………………..1
1.1 Motivation……………………………………………………………………….…….3
1.2 Objectives of the Thesis…………...………………………………………….……….2
1.3 Contribution of the Thesis……………………………………………………………..3
1.4 Research Methodology………………………………………………………………...4
1.5 Thesis Outline………………………………………………………………………….5
Chapter 2: Overview of WiMAX and WiFi…………………………………………………...7
2.1 The IEEE 802.16 standards…………………………………………………………...7
2.2 The IEEE 802.11 standards…………………………………………………………...8
2.3 The Architecture of 802.16 system………………………………………………….11
2.4 The Open System Interconnection (OSI) Model…………………………………...12
2.4.1 The Physical Layer (PHY)………………………………………………….14
2.4.1.1 The Frame Structure………………………………………………….16
2.4.1.2 Adaptive Modulation and Coding (AMC)…………………………...17
2.4.2 The Medium Access Control Layer (MAC)………………………………….18
2.4.2.1 Convergence Sublayer (CS)………………………………………….19
2.4.2.2 Common Part Sublayer (CPS)………………………………………19
2.4.2.3 Privacy Sublayer (PS)………………………………………………..20
2.4.2.4 Connection Establishment……………………………………………20
2.4.2.5 Scheduling, Bandwidth Request and Grants…………………………21
2.5 The Architecture of 802.11 system………………………………………………….23
2.5.1 The Physical Layer (PHY)…………………………………………………...24
viii
2.5.2 Medium Access Control Layer (MAC)………………………………………26
2.6 Wireless Hybrid Networks…………………………………………………………..26
2.7 Background and Related Work……………………………………………………...29
2.8 Summary…………………………………………………………………………….32
Chapter 3: QoS Support in Wireless Broadband Networks……………………………….…33
3.1 Quality of Service in WLAN………………………………………………………..34
3.2 Quality of Service in WiMAX………………………………………………………35
3.3 Quality of Service in LTE…………………………………………………………...36
3.4 Parameters Involved in Measuring QoS…………………………………………....38
3.4.1 Throughput………………………………………………………………….38
3.4.2 Average Delay……………………………………………………………...39
3.4.3 Average Jitter……………………………………………………………….40
3.4.4 Packet Loss…………………………………………………………………41
3.5 Mapping Table for WiFi, WiMAX, LTE………………………………....................41
3.5.1 Proposed QoS Mapping Table for WiFi, WiMAX and LTE……………….42
3.5.1.1 QoS Mapping for WiFi+WiMAX Network…………………………...43
3.5.1.2 QoS Mapping for WiFi +LTE Network……………………………….46
3.5.2 Simulations…………………………………………………………………48
3.6 Results and Discussions……………………………………………………………..48
3.6.1 Hybrid Network for WiFi+WiMAX………………………………………..49
3.6.1.1 Scenario 1……………………………………………………………...49
3.6.1.2 Scenario 2……………………………………………………………...51
3.6.2 Hybrid Network for WiFi+LTE…………………………………………….52
3.6.2.1 Scenario 1……………………………………………………………...52
3.6.2.2 Scenario 2……………………………………………………………...54
3.7 Summary…………………………………………………………………………….55
Chapter 4: Simulation Environment………………………………………………………….57
4.1 Simulation Tools for WiMAX System……………………………………………...58
4.2 Opnet Simulation Tools…………………………………………………………......58
4.2.1 Overview of the Opnet Simulation…………………………………………63
4.2.2 The WiMAX Module……………………………………………………….68
4.2.3 The WLAN Module………………………………………………………...73
ix
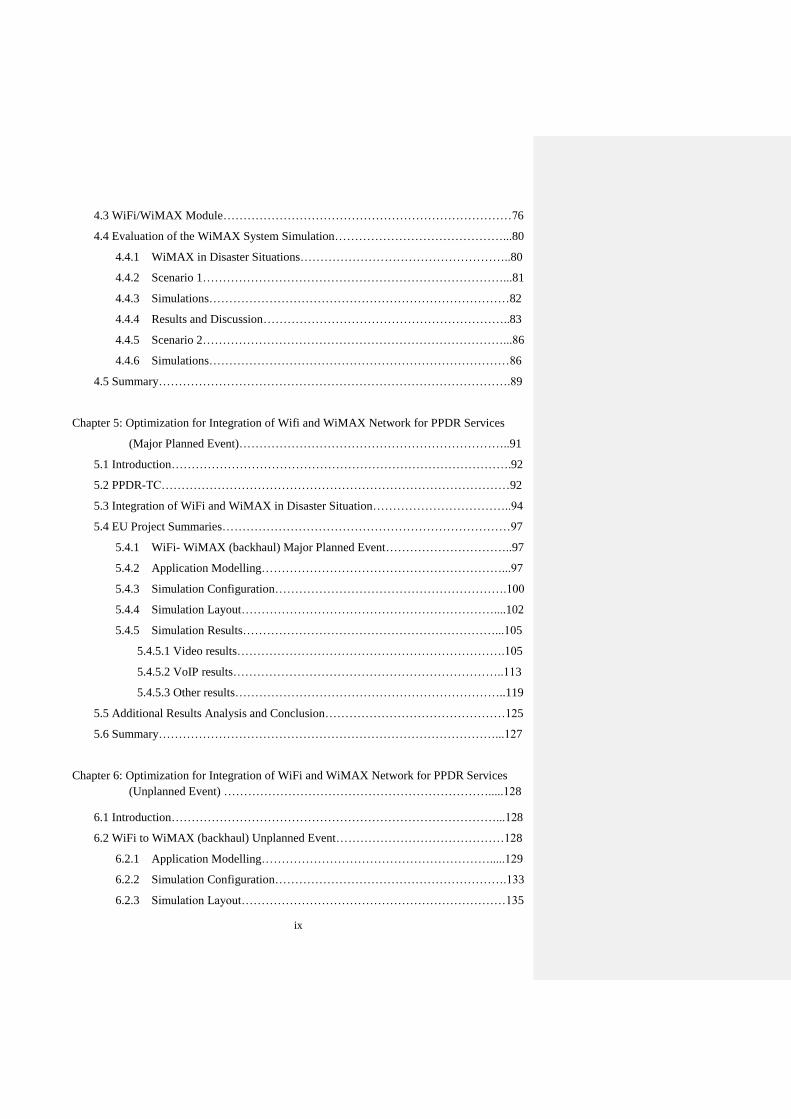
4.3 WiFi/WiMAX Module………………………………………………………………76
4.4 Evaluation of the WiMAX System Simulation……………………………………...80
4.4.1 WiMAX in Disaster Situations……………………………………………..80
4.4.2 Scenario 1…………………………………………………………………...81
4.4.3 Simulations…………………………………………………………………82
4.4.4 Results and Discussion……………………………………………………..83
4.4.5 Scenario 2…………………………………………………………………...86
4.4.6 Simulations…………………………………………………………………86
4.5 Summary…………………………………………………………………………….89
Chapter 5: Optimization for Integration of Wifi and WiMAX Network for PPDR Services
(Major Planned Event)…………………………………………………………..91
5.1 Introduction………………………………………………………………………….92
5.2 PPDR-TC……………………………………………………………………………92
5.3 Integration of WiFi and WiMAX in Disaster Situation……………………………..94
5.4 EU Project Summaries………………………………………………………………97
5.4.1 WiFi- WiMAX (backhaul) Major Planned Event…………………………..97
5.4.2 Application Modelling……………………………………………………...97
5.4.3 Simulation Configuration………………………………………………….100
5.4.4 Simulation Layout………………………………………………………....102
5.4.5 Simulation Results………………………………………………………...105
5.4.5.1 Video results………………………………………………………….105
5.4.5.2 VoIP results…………………………………………………………..113
5.4.5.3 Other results…………………………………………………………..119
5.5 Additional Results Analysis and Conclusion………………………………………125
5.6 Summary…………………………………………………………………………...127
Chapter 6: Optimization for Integration of WiFi and WiMAX Network for PPDR Services
(Unplanned Event) ………………………………………………………….....128
6.1 Introduction………………………………………………………………………...128
6.2 WiFi to WiMAX (backhaul) Unplanned Event……………………………………128
6.2.1 Application Modelling………………………………………………….....129
6.2.2 Simulation Configuration………………………………………………….133
6.2.3 Simulation Layout…………………………………………………………135
x
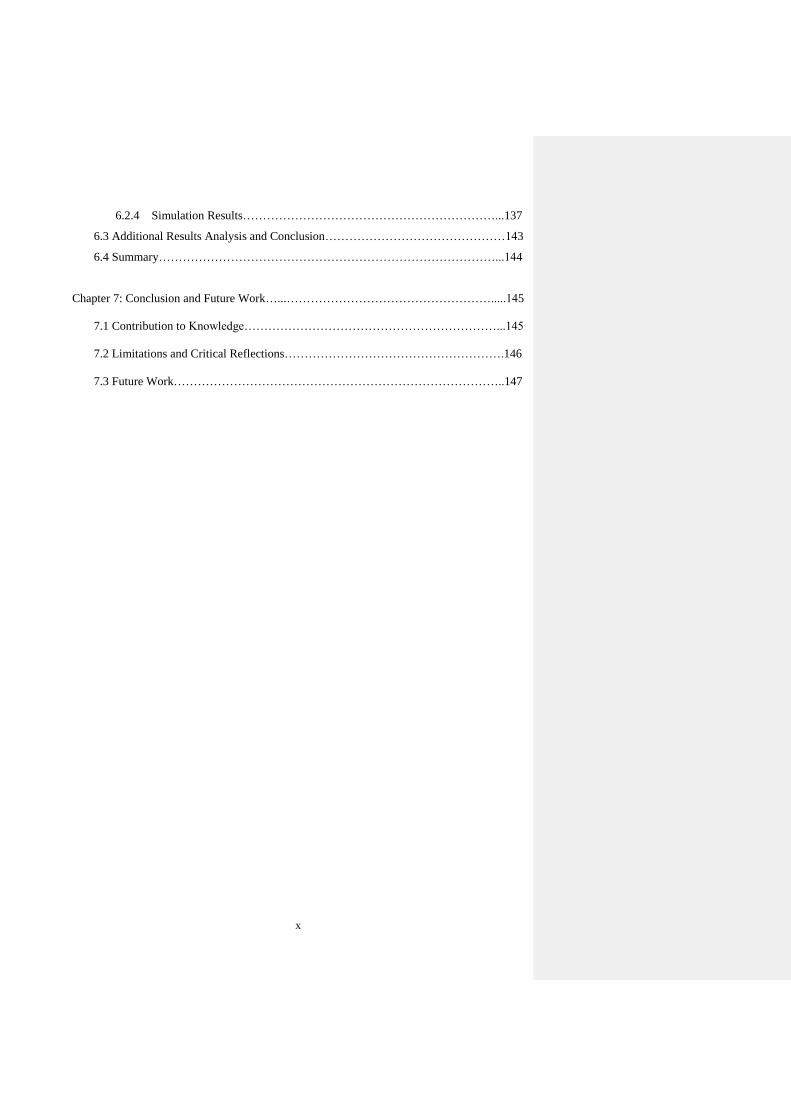
6.2.4 Simulation Results………………………………………………………...137
6.3 Additional Results Analysis and Conclusion………………………………………143
6.4 Summary…………………………………………………………………………...144
Chapter 7: Conclusion and Future Work…...…………………………………………….....145
7.1 Contribution to Knowledge………………………………………………………...145
7.2 Limitations and Critical Reflections……………………………………………….146
7.3 Future Work………………………………………………………………………..147
xi
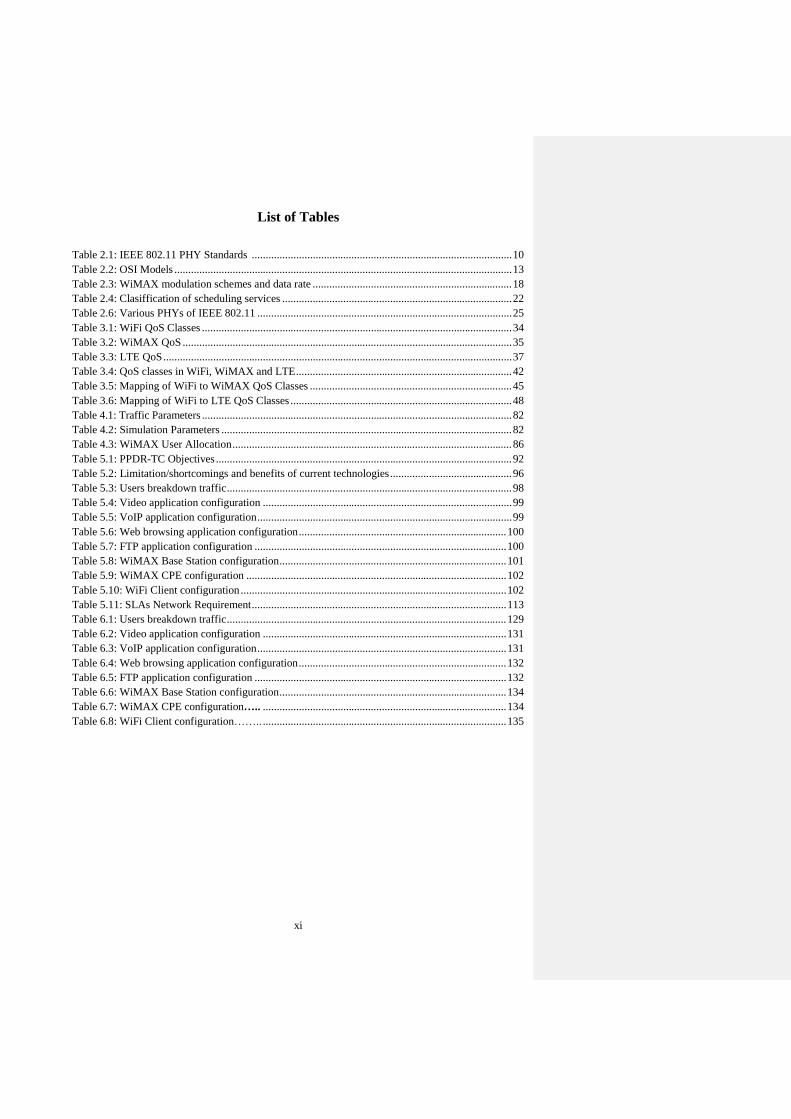
List of Tables
Table 2.1: IEEE 802.11 PHY Standards .............................................................................................. 10
Table 2.2: OSI Models .......................................................................................................................... 13
Table 2.3: WiMAX modulation schemes and data rate ........................................................................ 18
Table 2.4: Clasiffication of scheduling services ................................................................................... 22
Table 2.6: Various PHYs of IEEE 802.11 ............................................................................................ 25
Table 3.1: WiFi QoS Classes ................................................................................................................ 34
Table 3.2: WiMAX QoS ....................................................................................................................... 35
Table 3.3: LTE QoS .............................................................................................................................. 37
Table 3.4: QoS classes in WiFi, WiMAX and LTE .............................................................................. 42
Table 3.5: Mapping of WiFi to WiMAX QoS Classes ......................................................................... 45
Table 3.6: Mapping of WiFi to LTE QoS Classes ................................................................................ 48
Table 4.1: Traffic Parameters ................................................................................................................ 82
Table 4.2: Simulation Parameters ......................................................................................................... 82
Table 4.3: WiMAX User Allocation ..................................................................................................... 86
Table 5.1: PPDR-TC Objectives ........................................................................................................... 92
Table 5.2: Limitation/shortcomings and benefits of current technologies ............................................ 96
Table 5.3: Users breakdown traffic ....................................................................................................... 98
Table 5.4: Video application configuration .......................................................................................... 99
Table 5.5: VoIP application configuration ............................................................................................ 99
Table 5.6: Web browsing application configuration ........................................................................... 100
Table 5.7: FTP application configuration ........................................................................................... 100
Table 5.8: WiMAX Base Station configuration .................................................................................. 101
Table 5.9: WiMAX CPE configuration .............................................................................................. 102
Table 5.10: WiFi Client configuration ................................................................................................ 102
Table 5.11: SLAs Network Requirement ............................................................................................ 113
Table 6.1: Users breakdown traffic ..................................................................................................... 129
Table 6.2: Video application configuration ........................................................................................ 131
Table 6.3: VoIP application configuration .......................................................................................... 131
Table 6.4: Web browsing application configuration ........................................................................... 132
Table 6.5: FTP application configuration ........................................................................................... 132
Table 6.6: WiMAX Base Station configuration .................................................................................. 134
Table 6.7: WiMAX CPE configuration….. ........................................................................................ 134
Table 6.8: WiFi Client configuration…….. ........................................................................................ 135
xii
List of Figures
Figure 2.1: Downlink and uplink communication path ........................................................................ 12
Figure 2.2: General frame structures of TDD and FDD systems .......................................................... 17
Figure 2.3: WiMAX MAC layer ........................................................................................................... 19
Figure 2.4: The 802.11 standards focus on the Data Link and Physical Layers of the OSI reference
model .................................................................................................................................................... 25
Figure 2.5 First hybrid network topology ............................................................................................ 27
Figure 2.6 Second hybrid network topology ......................................................................................... 28
Figure 3.1: Hybrid WiFi + WiMAX network ....................................................................................... 44
Figure 3.2: Hybrid WiFi+LTE network ................................................................................................ 47
Figure 3.3: Throughput when rtPS for WiFi and WiMAX network ..................................................... 50
Figure 3.4: Throughput when BE for Wi-Fi and rtPS for WiMAX network ........................................ 50
Figure 3.5: Throughput when rtPS for Wi-Fi and BE for WiMAX network ........................................ 51
Figure 3.6: Throughput when BE for WiFi and WiMAX network ....................................................... 52
Figure 3.7: Throughput when rtPS for LTE and WiFi network ............................................................ 53
Figure 3.8: Throughput when BE for WiFi and rtPS for LTE network ................................................ 53
Figure 3.9: Throughput when rtPS for Wi-Fi and BE for LTE network ............................................... 54
Figure 4.0: Throughput when BE for LTE and WiFi network ............................................................. 54
Figure 4.1: The Network Model .......................................................................................................... 60
Figure 4.2: The Node Model ................................................................................................................ 61
Figure 4.3: The Process Model ............................................................................................................. 62
Figure 4.4: Opnet Simulation Workflow .............................................................................................. 63
Figure 4.5: Network Creation ............................................................................................................... 64
Figure 4.6 : Application Definition ....................................................................................................... 66
Figure 4.7: Profile Definition ................................................................................................................ 67
Figure 4.8 :WiMAX Configuration Object ........................................................................................... 68
Figure 4.9: WLAN Configuration Object ............................................................................................. 74
Figure 4.10: WiFi-WiMAX coexistence topology .............................................................................. 76
Figure 4.11: WiFi/WiMAX Router ....................................................................................................... 77
Figure 4.12: Average throughput for rtPS and BE ................................................................................ 83
Figure 4.13: Average data dropped for rtPS and BE ............................................................................. 84
Figure 4.14: Average delay for rtPS and BE ........................................................................................ 85
Figure 4.15. Average throughput for rtPS and BE ................................................................................ 87
Figure 4.16. Average delay for BE users .............................................................................................. 88
Figure 4.17. Average delay for rtPS users ............................................................................................ 89
Figure 5.1: Simulation Physical Layout .............................................................................................. 103
Figure 5.2: Network Architecture Layout ........................................................................................... 104
Figure 5.3: Video Delay for 50 Nodes ................................................................................................ 106
Figure 5.4: Video Delay for 100 Nodes .............................................................................................. 107
Figure 5.5: Video Delay for 150 Nodes .............................................................................................. 108
Figure 5.6: Video Delay for 200 Nodes .............................................................................................. 109
Figure 5.7: Average Video Throughput for 150 Nodes ...................................................................... 110
Figure 5.8: Video Packet Loss for 150 Nodes .................................................................................... 110
Figure 5.9: Average Video Delay for 50% background .................................................................... 111
Figure 5.10: Percentage of video able to transmit for all nodes .......................................................... 112

xiii
Figure 5.11: VoIP Delay for 50 Nodes ............................................................................................... 114
Figure 5.12: VoIP Jitter for 50 Nodes ................................................................................................. 115
Figure 5.13: VoIP Delay for 150 Nodes ............................................................................................. 115
Figure 5.14: VoIP Jitter for 150 Nodes ............................................................................................... 116
Figure 5.15: VoIP Delay for 200 Nodes ............................................................................................. 117
Figure 5.16: VoIP Jitter for 200 Nodes ............................................................................................... 118
Figure 5.17: Average Throughput for all nodes .................................................................................. 119
Figure 5.18: Packets Sent/Received for 50 and 200 nodes ................................................................. 120
Figure 5.19: Packets Sent/Received for VoIP, FTP and Web for 50 and 200 Nodes ......................... 120
Figure 5.20: Percentage of Packets Received Excluding Video ......................................................... 121
Figure 5.21: Web Delay for 50% background .................................................................................... 122
Figure 5.22: Web Delay for 50 Nodes ................................................................................................ 123
Figure 5.23: Web Delay for 150 Nodes .............................................................................................. 123
Figure 5.24: Web Delay for 200 Nodes .............................................................................................. 124
Figure 5.25: Average Delay for VoIP, Video and Web for all nodes ................................................. 125
Figure 6.1: Network Architecture Layout ........................................................................................... 136
Figure 6.2: Average Video Delay for 10% and 30% background ...................................................... 137
Figure 6.3: Average VoIP Delay for 10% and 30% background ........................................................ 138
Figure 6.4: Average VoIP Jitter for 10% and 30% background ......................................................... 139
Figure 6.5: Average Web Delay for 10% and 30% background ......................................................... 140
Figure 6.6: Average Throughput for 10% and 30% background ........................................................ 141
Figure 6.7: Average Video Throughput for 10% and 30% background ............................................. 142
Figure 6.8: Packet Sent/Received for 10% and 30% Video ................................................................ 142
Figure 6.9: Percentage of Packets Received of VoIP, FTP and Web ................................................. 143

xiv
List of Abbreviations
AAS- Adaptive antenna system
AMC- Adaptive Modulation and Coding
AP- Access Point
ASN GW- Access Service Network Gateway
ATM- Asynchronous Transfer Mode
BE - Best Effort
BPSK- Binary Phase Shift Keying
BS- Base Station
BSHC- Base Station Hybrid Coordinator
BSS- Basic Service Set
CCA- Clear Channel Assessment
CID- Connection Identifier
CoS - Class of Service
CS- Convergence Sublayer
CCK- Complementary Code Keying
CPS- Common Part Sublayer
DCPCC- District Civil Protection Coordination Centre
DHCP- Dynamic Host Configuration Protocol
DL- Downlink
DS- Distribution System
DSL - Digital Subscriber Line
DSSS - Direct Sequence Spread Spectrum
ertPS - Extended Real time Polling Service

xv
ESS- Extended Service Set
ETSI - European Telecommunications Standards Institute
EU- European Union
FEC- Forward Error Correction
FFT- Fast Fourier Transform
FHSS - Frequency Hopping Spread Spectrum
FTP - File Transfer Protocol
FDD- Frequency Division Duplex
3GPP- 3rd Generation Partnership Project
GBR - Guaranteed Bit Rate
GUI - graphical user interface
GHz- Gigahertz
HD- Half Duplex
HN - Hybrid Networks
HSDPA- High-Speed Downlink Packet Access
HSDPA+- Evolved High-Speed Packet Access
ID- Identifier
IEEE - Institute of Electrical and Electronics Engineers
IEEE-SA - IEEE Standards Association
IP - Internet Protocol
IR- Infrared
ISM- Industrial, Scientific and Medical
ISO- International Organization for Standardization
ITU- International Telecommunication Union
LB- Load Balancing

xvi
LLC- Logical Link Control
LMR- Land Mobile Radio
LOS- Line-of-Sight
LTE - Long Term Evolution
MAC - Medium Access Control
MANET- Mobile Ad-Hoc Network
MHz- Megahertz
MPDUs- MAC Protocol Data Units
MPEG- Moving Picture Experts Group
Mbps - Megabits per second
MIMO - Multiple Input Multiple Output
Mstr- Maximum Sustained Reserve Traffic Rate
Mrtr- Minimum Reserved Traffic Rate
MS- Mobile Station
Non-GBR - Non-Guarantee Bit Rate
NLOS- Non Line-of-Sight
nrtPS - Non-real time Polling Service
NS- Network Simulator
OFDM - Orthogonal Frequency Division Multiplexing
OFDMA- Orthogonal Frequency-Division Multiple Access
PCMCIA- Personal Computer Memory Card International Association
PHY- Physical Layer
PHS- Payload Header Suppression
PLCP- Physical Layer Convergence Procedure
PLR- Packet Loss Ratio
xvii
PMD- Physical Medium Dependent
PMP- Point to Multipoint
PPDR- Public Protection and Disaster Relief
PS- Privacy Sublayer
OSI- Open Systems Interconnection
QAM- Quadrature amplitude modulation
QCI - QoS Class identifier
QCI - QoS Class identifier
QoS - Quality of Service
QoE- Quality of Experience
QPSK- Quadrature Phase Shift Keying
REDComm- Rapid Emergency Deployment Mobile Communication
RLC- Radio Link Control
rtPS - Real Time Polling Service
SS – Sub-Station
SC- Single Carrier
SCA- Software Communication Architecture
SDR- Software Defined Radio
SDU- Service Data Units
SMC- Signal Modulation Scheme
SNR- Signal to Noise Ratio
SNMP- Simple Network Management Protocol
SLA- Service Level Agreement
TC- Transformation Center
TDD- Time Division Duplexing

xviii
TDMA- Time Division Multiplexing
TCP - Transmission Control Protocol
TETRA- Terrestrial Trunked Radio
TFTP- Trivial File Transfer Protocol
UL- Uplink
UGS- Unsolicited Grant Service
UMTS - Universal Mobile Telecommunications System
VLAN- Vitual Local Area Network
VoIP - Voice over IP
VPN - Virtual Personal Network
WEIRD- WiMAX Extensions for Remote
WiFi - Wireless Fidelity
WiMAX - Worldwide Interoperability for Microwave Access
Wireless MAN - Wireless Metropolitan Area Network
WLAN - Wireless Local Area Network
1
Chapter 1: Introduction
Deployment of various wireless broadband access networks has always been associated
with the increasing demand for reliable and high speed access and also guaranteed quality of
service (QoS). Typically, this is accomplished with different wireless system and also by
different service providers. While each of the developed networks have well defined
advantages, independent operation of these networks results in certain drawbacks [1][2]. In
order to achieve the maximum benefit from the existing infrastructure, convergence of the
networks is no more an option. However, such a proposal will not be successful without
developing and providing the much needed end-to-end quality of service in the existing
service classes across the proposed network architecture.
In this thesis, we propose approaches that utilize the hybrid broadband
communication networks enhanced with prediction capabilities.
1.1 Motivation
Providing the required end-to-end QoS in hybrid networks is an arduous task due to
the different bit rate, channel characteristics, bandwidth allocation, fault tolerant levels and
handoff supports and methods implemented in each sub-network [3][4]. These differences
can be outlined as below [5];
Wireless Local Area Networks (WLANs) provide higher data rate at a lower cost, but
only within a limited area [6]. Worldwide Interoperability for Microwave Access Networks
(WiMAX) coverage is up to 50km in radius with high data rates, good quality of service,
seamless mobility both within a network and between networks of different technologies and
service providers [7]. In Long Term Evolution (LTE) network, the traffic volume per

2
subscriber increases rapidly as multiple services, for example voice, video, and data may be
carried on multiple network domains, each with its own traffic pattern and QoS requirements
[8] .
However, in many practical applications, users rarely use a homogeneous network
because hybrid networks allow greater flexibility in working toward the desired results. At
the same time, using hybrid networks generate a problem of parameter matching and
optimization of end-to-end parameters for the entire hybrid network [9]. While individual
standards do provide recommendations for optimization of key parameters, these
recommendations are not valid in the integrated hybrid architecture. This problem is more
intense when hybrid networks are intended in emergency disaster situations, such as
earthquakes, tsunamis, flooding or forest fires. Such situations in which hybrid networks are
used to address emergency disaster situations are the main subject of our research.
The end users’ (user in different network connected seamlessly with other network)
requirement could not be fulfilled if QoS guarantee could not be provided by the system,
therefore, an end-to-end QoS for hybrid wireless networks needs to be defined. A
comprehensive explanation will be discussed in Chapter 3 of this thesis. Due to the extensive
number of possible hybrid network architectures, a common approach and optimization are
required. For our condition, we narrowed the issue by concentrating on wireless fidelity
(WiFi) and WiMAX as a hybrid network and optimizing parameters that are essential for
these systems; throughput, delay, packet loss.
Our investigation has revealed that this field of research includes many open
challenges, and we decided to address these problems by considering together hybrid wireless
networks and QoS algorithms for first responders in emergency situations. During the
research period, I was also involved in the European Union (EU) project, -focusing on the

3
hybrid systems for Public Protection and Disaster Relief (PPDR) operations. My main role in
the team was to prepare the simulation results which the investigation outcomes would
benefit their operations as well. PPDR is one of the most important organizations which was
responsible for the disaster preparedness and recovery. Conventionally it would assist the
emergency communications among the first responders on site including the firefighters,
emergency response personnel, law enforcement and also disparate agencies.
1.2 Objectives of the Thesis
The main objective of this thesis is to develop an optimization integration of WiFi
and WiMAX model to be applied in the PPDR operations. The thesis also has specific
objectives:
i) To improvise the QoS and providing the guaranteed of QoS in the context of disaster
recovery, therefore increase the chances of survival.
ii) To evaluate the new approach on utilizing WiMAX network resources with the
provided practical guidance.
4
1.3 Contribution of the Thesis
The contributions of the thesis can be summarised as follows:
i) It introduces a novel approach based on the parameters for two different hybrid
networks; WiFi + WiMAX and WiFi + LTE by developing the end-to-end QoS
mapping tables.
ii) Proposes a new approach based on WiMAX network with new QoS mapping.
New scenarios are created with the new QoS mapping, and simulation results are
presented. It was proven that the best QoS class in some scenarios did not provide
the best parameters for users in the system.
iii) Proposes a new model of a hybrid system to optimize a chosen parameter in
disaster management systems. An optimization model was developed and
explained.
iv) Develops a novel users’ application algorithms based on the PPDR operations
requirements for hybrid networks. It applies the proposed algorithm to minimize
delays and packet drops.
v) Provides a new model of a hybrid system analysis, applied to the PPDR operations
in disaster management.
1.4 Research Methodology
This section will provide details and sufficient ideas of the method used in the
research. There are three main bodies used as our research guidelines consists of Theoretical,
Simulation and Practical Part. Generally, for the Theoretical Part, we conducted literature
reviews from all the trusted inputs such as conference papers, journals, magazines, books and
others. The topic includes homogenous wireless broadband system and also hybrid system
Commented [ez1]: Is packet dropped a term? If so, retain dropped and delete drops.

5
which would be our main contribution to the knowledge later on. The next process would be
the Simulation Part. We plan to use the simulation tools to obtain the results, analyzing the
outcomes before implement them in the real situation. Based on several simulation tools such
as NS2, NS3, Matlab and Opnet, we decided to use Opnet in our research. Opnet is
recognized for its high reliability since it provides powerful simulation capability for the
study of network architectures and protocols which makes the simulation of real-life
networks close to reality. The most important thing is all the modules needed in our research
(homogeneous and hybrid modules) are accessible in Opnet. The last process is the validation
process for all the results obtained which we define as the Practical Part. Several experts were
involved in this part to prove the validity of the simulation results.Therefore, based on the
feedback received, throubleshooting process were also simultaneously performed in order to
have optimize results.
1.5 Thesis Outline
The thesis is organised as follows. In Chapter 2, the overview of WiMAX and WiFi
networks, hybrid broadband wireless networks and the difference between WiMAX and WiFi
and system architectures are established in this chapter. Also, literature reviews are presented
and the primary existing problems highlighted.
Chapter 3 discusses the QoS mapping table for WiFi, WiMAX and LTE. The chapter
begins with a brief discussion on the QoS classes in WiFi, WiMAX and LTE. Following this,
the parameters including measuring QoS are clarified. QoS mapping tables are also proposed
and described here. Simulations were then conducted to test and verify the correctness of the
mapping table. Herein, research was involved with WiFi, WiMAX and LTE, however, as we

6
narrowed down our research, we focused only on WiMAX and WiFi as discussed in the next
chapter.
Chapter 4 then discusses the simulation tools used in WiMAX. The simulation
environment in Optimized Network Engineering Tool (OPNET) is first discussed, followed
by the components accessible for WiMAX and WiFi modules. Then a WiFi/WiMAX
gateway or also known as Customer-premises equipment (CPE), is explained its use to allow
interoperability between WiFi and WiMAX as a hybrid network. Next, the evaluation of
WiMAX system is conducted, particularly in disaster situations. Two scenarios are presented
here to evaluate the performance.
In Chapter 5, the cross system for WiFi and WiMAX system by means of integration
of WiFi and WiMAX, mainly focussing on the PPDR operation, is presented. During this
research, I was involved in the EU project organized by the PPDR Transformation Center
(TC). Therefore, my task was to prepare the simulation results based on the given scenarios.
The layout for each scenario, based on PPDR requirements, was prepared by the engineers of
Rinicom LTC Consortium. On top of that, I had to investigate and propose the best/optimum
results which in future will be used as the EU standard and also used by the first responders
in any emergency situation.
In Chapter 6, the optimization across different systems proposed in this chapter was
extended to the PPDR operations. The focus was on optimizing the bandwidth utilization
with more users and heavy applications added so that the end-to-end QoS in terms of delay,
packet loss and minimum rate requirements will still be guaranteed. This chapter first
discusses on the simulation results obtained based on the specific scenario. Next, the analysis
of the performance is illustrated. Then, the proposal to obtain cross-system optimization is
elaborated followed by the evaluations using simulations.
7
Chapter 2: OVERVIEW OF WiMAX and WiFi
WiMAX is a standard based on IEEE 802.16 broadband wireless access metropolitan
area technology, expected to deliver high quality broadband services. Meanwhile WiFi
belongs to one of the WLAN family referred to as IEEE 802.11b designed for a short
distance communication [10]. WiMAX is expected to provide up to 40 Mbps over a 50km
area, whereas the maximum transfer speed for WiFi is 100 Mbps within 100m area [2].
Although WiFi is known as one of the wireless standards, there are certain differences
between them; standard, data rate, transmission distance, operating frequency and QoS.
In this chapter, an overview of the IEEE 802.16 and IEEE 802.11 standards are provided.
Although there are other wireless broadband systems such as UMTS/3G and LTE, we
focused only on WiMAX and WiFi in this research. Therefore, in this chapter, we start with
the description of the evolution of the standards, followed by the architectures for each
system. Also, we explain briefly about the Open Systems Interconnection (OSI) Layer,
focusing on the physical and Medium Access Control (MAC) layer, since its interconnection
with QoS necessary.
2.1 The IEEE 802.16 standards
Institute of Electrical and Electronics Engineers (IEEE) is a professional working group
established in 1963 with the task of developing standards and maintaining functions through
the IEEE Standards Association (IEEE-SA) [11]. IEEE 802 refers to a family of IEEE
standards dealing with local area networks and metropolitan area networks specifically for
networks carrying variable-size packets. The IEEE 802.16 is a series of wireless broadband
standards written by IEEE in 1999 to develop standards for broadband wireless metropolitan
area networks [12]. Although the 802.16 family of standards is officially called
Commented [ez2]: Is necessity here a term? If not, it should be ‘is necessary’.

8
WirelessMAN in IEEE, it has been commercialized under the name WiMAX by the WiMAX
Forum industry alliance.
There are various versions of WiMAX standards; IEEE 802.16-2001, IEEE 802.16-2004,
IEEE 802.16e-2005, IEEE 802.16-2009. IEEE 802.16-2004 is known as Fixed WiMAX and
IEEE 802.16e-2005 is known as Mobile WiMAX [13] . 802.16m is an upgraded version of
802.16-2009 version and is referred to as WiMAX advanced, which is also a candidate for
the 4G, in competition with the LTE Advanced standard [14].
Both Fixed WiMAX and Mobile WiMAX systems are used for broadband data
communication. The fixed WiMAX system will have subscriber terminals located at a fixed
place and Mobile WiMAX will have nomadic, portable and mobile capabilities [15]. Thus, in
this thesis, both Fixed and Mobile WiMAX systems will be used which will be explained
later in the next chapter. Fixed WiMAX system is applied to the Planned Event situation
meanwhile Mobile WiMAX as nomadic access is designated for Unplanned Event situation.
WiMAX operates at frequency of 2-66 Gigahertz (GHz), which is divided into two parts:
2-11 GHz and 10-66 GHz [16]. The lower frequency band supports Non Line-of-Sight
(NLOS) whereas Line-of-Sight (LOS) is supported in the upper frequency band. Since LOS
and NLOS propagation are quite different, a standard that supports physical and medium
access control (MAC) layer supports for both bands needed to be designed [17]. Thus, the
scope of 802.16-2004 standard covers the specifications of these two layers in the OSI model.
2.2 The IEEE 802.11 standards
The IEEE 802.11 standard was developed by the IEEE 802.11 Working Group since
1991, where the first standard was published in 1997. The first IEEE 802.11 standard
specification, referred to as IEEE 802.11-1997 in 1997 which was then the IEEE 802.11-1999
9
in year 1999 reflected mostly minor changes. The IEEE 802.11-1997 and 802.11-1999
standards included a single connectionless MAC and three physical (PHYs) namely Direct-
Sequence Spread Spectrum (DSSS), Frequency-Hopping Spread Spectrum (FHSS) and
infrared (IR)[18]. The supported transmission rate was only 1-2 Mbps with DSSS, FHSS and
were defined to operate at the 2.4 GHz Industrial, Scientific and Medical (ISM) bands [19].
This first standard was also initially referred to as “wireless Ethernet” since it was designed
to support wireless services in local areas.
Since then, many amendments have been made to enhance its technology such as
higher speed, QoS support and security enhancement. For example, the first two amendments
namely, 802.11a and 802.11b, defined new PHY amendments [20]. The IEEE 802.11a-1999
defined a new PHY based on Orthogonal Frequency Division Multiplexing (OFDM) operated
in the 5 GHz band supporting up to 54 Mbps transmission rate. Meanwhile IEEE 802.11b-
1999 defined a new PHY based on Complementary Code Keying (CCK) to operate in the 2.4
GHz ISM bands with transmission rate up to 11 Mbps [21].
The standardization of the IEEE 802.11a was completed in 1999, but it was only
introduced into the market in 2002 due to implementation difficulties. However, at the same
time the 802.11b was more attractive and widely deployed, especially when the 802.11a
devices were more expensive than the 802.11b. Even worst for the 802.11a was in 2003, the
extension of the 802.16b for the 2.4 GHz referred as IEEE 802.11g-2003. The rates defined
in 802.11g are exactly the same as those of the 802.11a since the 802.11g uses the exact
same transmission schemes as the 802.11a. Due to the backward compatibility requirements,
the performance of the 802.11g in ideal environments was worst than 802.11a. However, it
became popular later in 2003 since the 802.11g devices were lower cost and backward
compatible with the widely deployed 802.11b.
10
Then is the evolving of MAC layer in 802.11. The 802.11e-2005 was introduced to
support QoS for multimedia applications, scheduling and admission control mechanism and
other new features. Later on, to overcome security threats, new encryption schemes, new
authentication and key management schemes were introduced by 802.11i-2004. Some other
amendments, including 802.11k to provide mechanisms to higher layers for radio and
network measurements were made. Meanwhile, to increase the WLAN throughput, 802.11n
was introduced which would specify mechanisms to increase transmission rates up to 600
Mbps operating at 2.4 GHz and 5 GHz ISM bands. Therefore, 802.11n was chosen in my
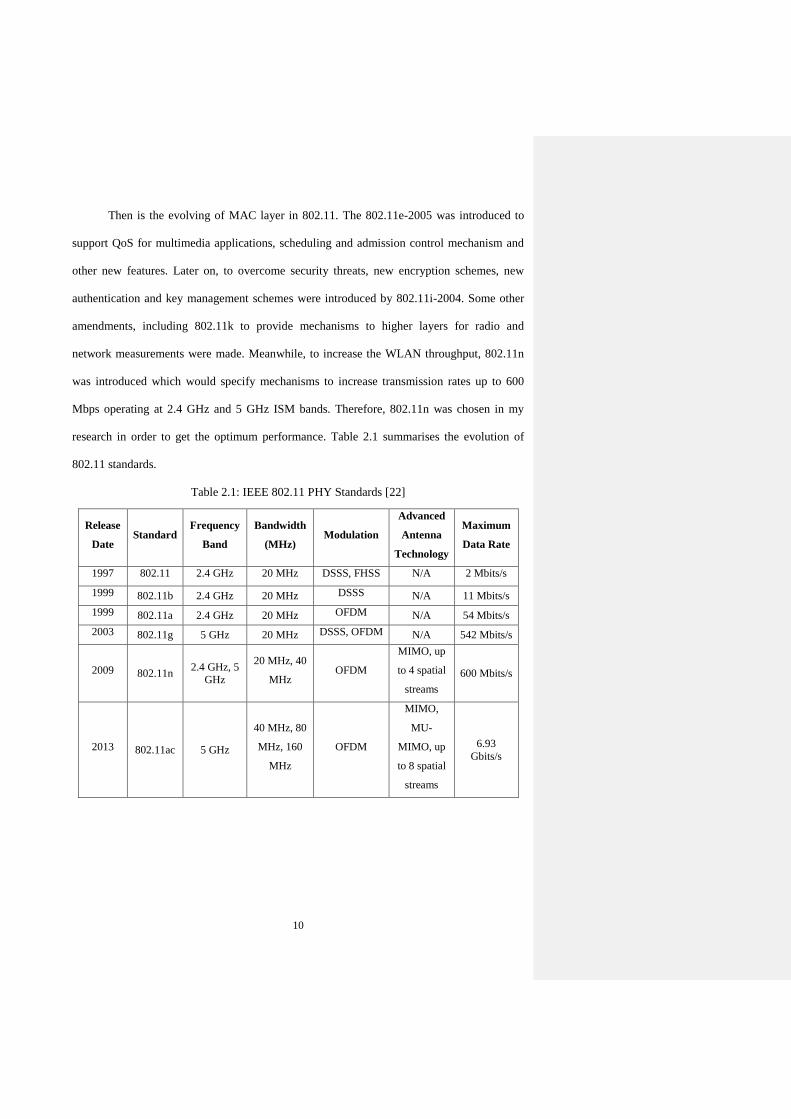
research in order to get the optimum performance. Table 2.1 summarises the evolution of
802.11 standards.
Table 2.1: IEEE 802.11 PHY Standards [22]
Release
Date Standard
Frequency
Band
Bandwidth
(MHz) Modulation
Advanced
Antenna
Technology
Maximum
Data Rate
1997 802.11 2.4 GHz 20 MHz DSSS, FHSS N/A 2 Mbits/s
1999 802.11b 2.4 GHz 20 MHz DSSS N/A 11 Mbits/s
1999 802.11a 2.4 GHz 20 MHz OFDM N/A 54 Mbits/s
2003 802.11g 5 GHz 20 MHz DSSS, OFDM N/A 542 Mbits/s
2009 802.11n 2.4 GHz, 5
GHz
20 MHz, 40
MHz OFDM
MIMO, up
to 4 spatial
streams
600 Mbits/s
2013 802.11ac 5 GHz
40 MHz, 80
MHz, 160
MHz
OFDM
MIMO,
MU-
MIMO, up
to 8 spatial
streams
6.93
Gbits/s
11
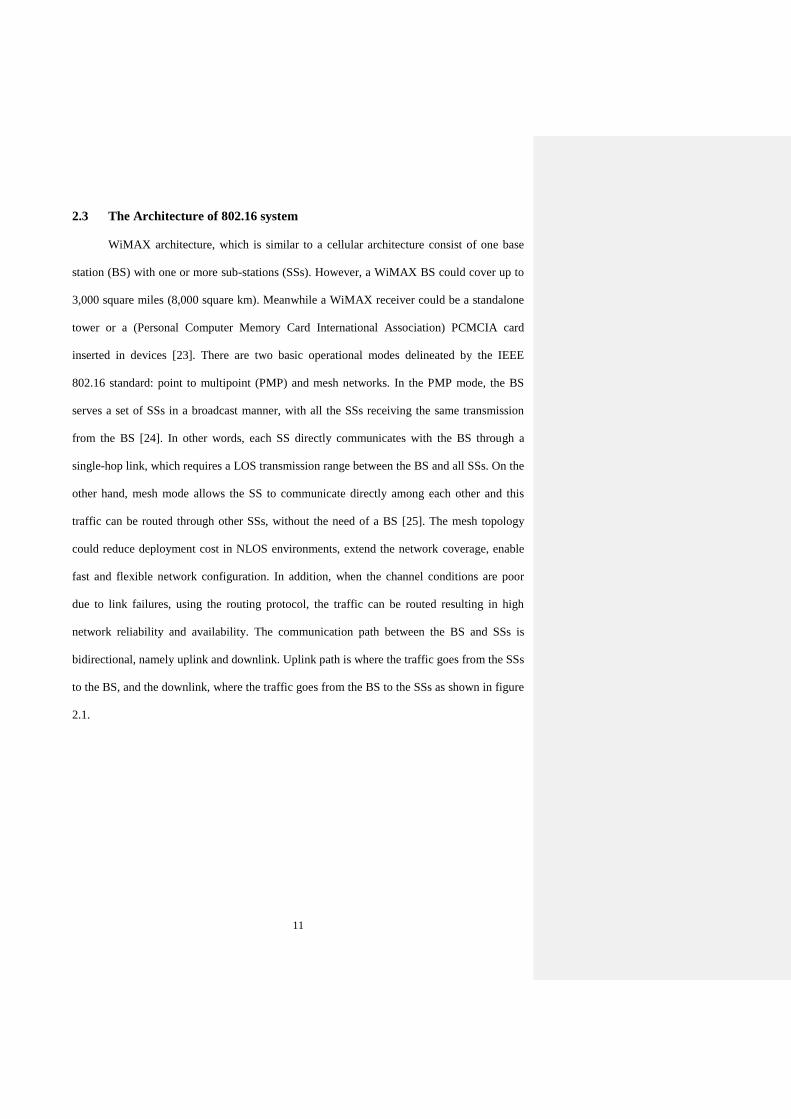
2.3 The Architecture of 802.16 system
WiMAX architecture, which is similar to a cellular architecture consist of one base
station (BS) with one or more sub-stations (SSs). However, a WiMAX BS could cover up to
3,000 square miles (8,000 square km). Meanwhile a WiMAX receiver could be a standalone
tower or a (Personal Computer Memory Card International Association) PCMCIA card
inserted in devices [23]. There are two basic operational modes delineated by the IEEE
802.16 standard: point to multipoint (PMP) and mesh networks. In the PMP mode, the BS
serves a set of SSs in a broadcast manner, with all the SSs receiving the same transmission
from the BS [24]. In other words, each SS directly communicates with the BS through a
single-hop link, which requires a LOS transmission range between the BS and all SSs. On the
other hand, mesh mode allows the SS to communicate directly among each other and this
traffic can be routed through other SSs, without the need of a BS [25]. The mesh topology
could reduce deployment cost in NLOS environments, extend the network coverage, enable
fast and flexible network configuration. In addition, when the channel conditions are poor
due to link failures, using the routing protocol, the traffic can be routed resulting in high
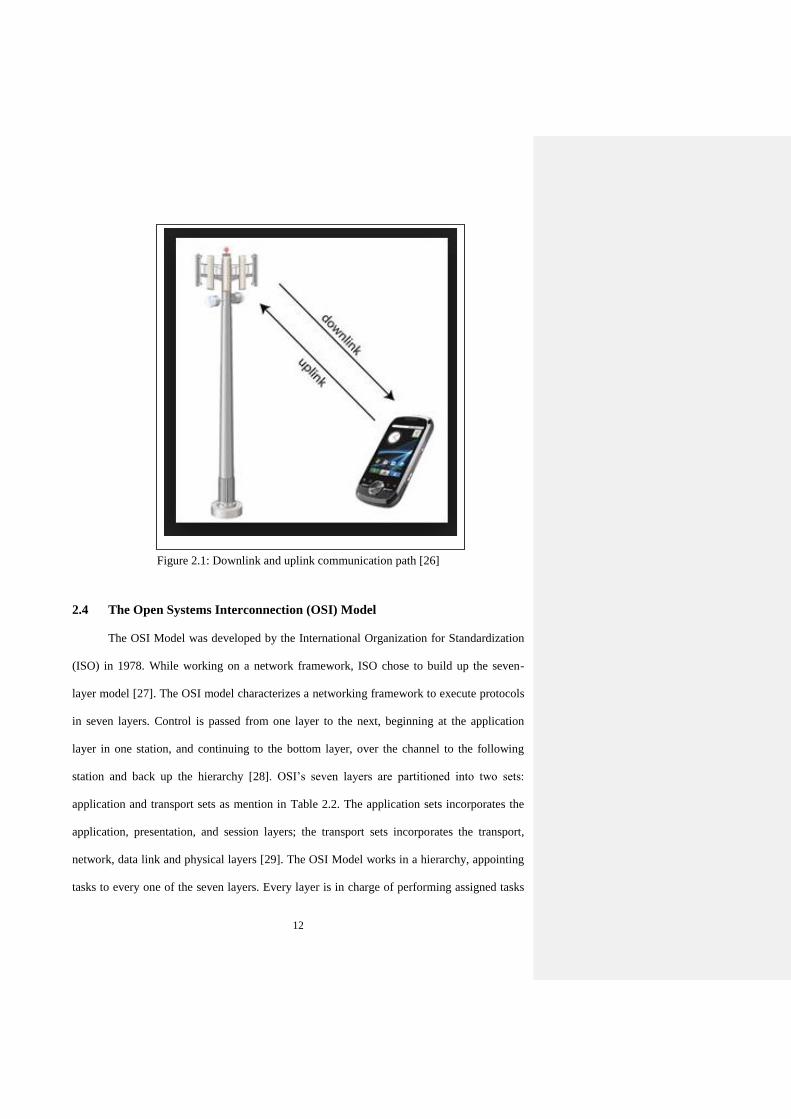
network reliability and availability. The communication path between the BS and SSs is
bidirectional, namely uplink and downlink. Uplink path is where the traffic goes from the SSs
to the BS, and the downlink, where the traffic goes from the BS to the SSs as shown in figure
2.1.
12
Figure 2.1: Downlink and uplink communication path [26]
2.4 The Open Systems Interconnection (OSI) Model
The OSI Model was developed by the International Organization for Standardization
(ISO) in 1978. While working on a network framework, ISO chose to build up the seven-
layer model [27]. The OSI model characterizes a networking framework to execute protocols
in seven layers. Control is passed from one layer to the next, beginning at the application
layer in one station, and continuing to the bottom layer, over the channel to the following
station and back up the hierarchy [28]. OSI’s seven layers are partitioned into two sets:
application and transport sets as mention in Table 2.2. The application sets incorporates the
application, presentation, and session layers; the transport sets incorporates the transport,
network, data link and physical layers [29]. The OSI Model works in a hierarchy, appointing
tasks to every one of the seven layers. Every layer is in charge of performing assigned tasks
13
and transferring completed tasks to the next layer for further processing. Today, numerous
protocols are produced based on the OSI Model working mechanism. The OSI model does
not perform any functions in the networking process [30]. It is a theoretical framework so we
can better understand complex interactions that are happening.
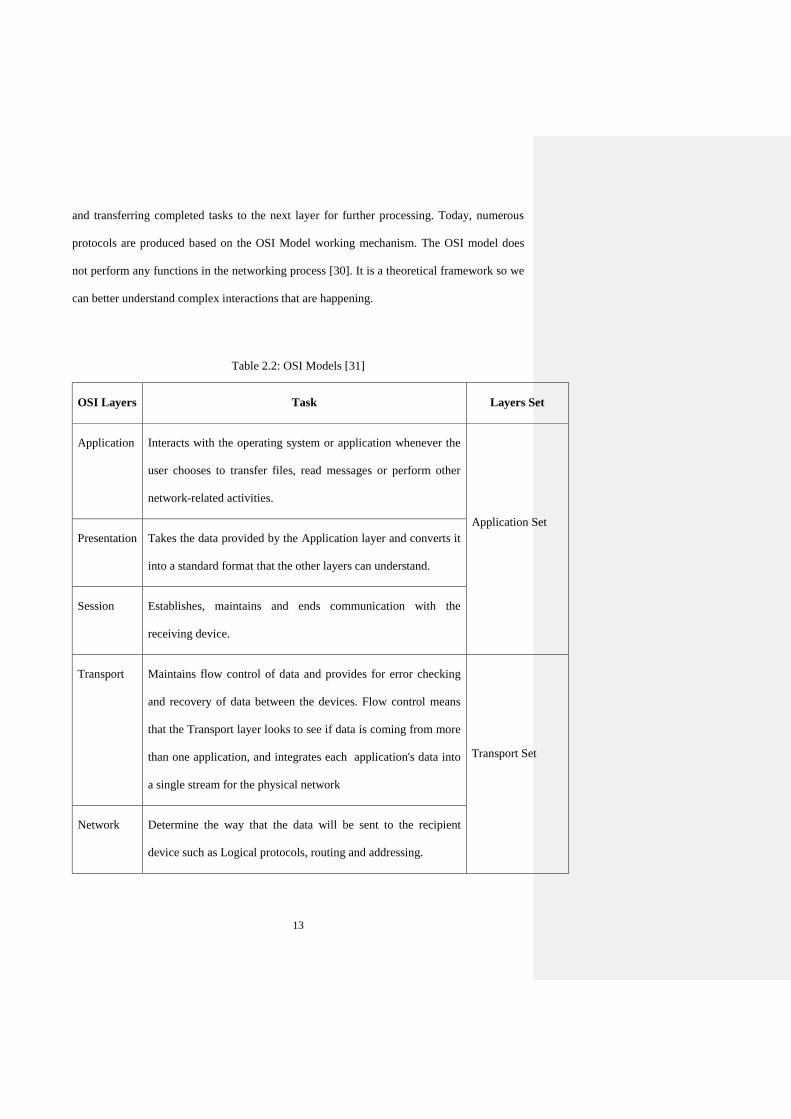
Table 2.2: OSI Models [31]
OSI Layers Task Layers Set
Application Interacts with the operating system or application whenever the
user chooses to transfer files, read messages or perform other
network-related activities.
Application Set
Presentation Takes the data provided by the Application layer and converts it
into a standard format that the other layers can understand.
Session Establishes, maintains and ends communication with the
receiving device.
Transport Maintains flow control of data and provides for error checking
and recovery of data between the devices. Flow control means
that the Transport layer looks to see if data is coming from more
than one application, and integrates each application's data into
a single stream for the physical network
Transport Set
Network Determine the way that the data will be sent to the recipient
device such as Logical protocols, routing and addressing.
14
The services and protocols specified in IEEE 802 maps to the lower two layers (Data
Link and Physical) of the seven-layer OSI Model. It splits the OSI Data Link Layer into two
sub-layers named Logical Link Control (LLC) and MAC. In this chapter, we will cover the
discussion of the Physical Layer and also MAC Sublayer.
2.4.1 The Physical Layer
The physical layer, the lowest layer of the OSI model, is concerned with the
transmission and reception between a device and a physical transmission medium [32]. This
includes the electrical/optical, mechanical, and functional interfaces to the physical medium,
transmission mode and network topology as bus, mesh, or ring [33].
Occasionally the specification for physical layer for 10-66 GHz frequency wave is
called WirelessMAN SC (single carrier) with frequency division duplex (FDD) and time
division duplex (TDD) support modes [34]. It is used for LOS propagation that can reach
multiple miles with a focused beam antenna design. However, in order to support NLOS from
the 2-11 GHz band, three new physical layer specifications were introduced [35]:
i. WirelessMAN-SCa: A single carrier modulated air interface (for frequency
band of between 2 to 11 GHz).
Data Link The appropriate physical protocol is assigned to the data. Also,
the type of network and the packet sequencing is defined.
Physical Defines the physical characteristics of the network such as
connections, voltage levels and timing.

15
ii. WirelessMAN-OFDM: A 256-carrier orthogonal frequency division
multiplexing scheme. Multiple access of different SSs is based on time
division multiplexing (TDMA) scheme.
iii. WirelessMAN-OFDMA: A 2048-carrier OFDM scheme. A subset of
carriers is assigned to an individual receiver to provide multiple access.
The difference between WirelessMAN-SCa and OFDM module is that OFDM is
more resilient to the multipath effect since it allows neighboring subcarriers to overlap and
result in higher bandwidth efficiency. Meanwhile the differences between OFDM and
OFDMA is organized into two dimension operators; time and frequency [36]. The
collaboration between these two parameters allows for multiple access by arranging
resources into subchannels for individual receivers allocation. OFDM is applied to NLOS
propagation because of the simplicity of the equalization process for multi carrier signals and
their natural immunity to multipath propagation [37]. Initially, WirelessMAN-OFDM is
popular among the vendors due to the reasons of Fast Fourier Transform (FFT) and less
stringent requirement for frequency synchronization compared to WirelessMAN-OFDMA.
However, since the introduction of WirelessMAN-OFDMA, it is more preferred by the
industry because of bandwidth efficiency [38]. It works by distributing subcarrier-group
subchannels matched to each user to provide the best performance, meaning the least
problems with fading and interference based on the location and propagation characteristics
of each user [39].
Other features in PHY layer are [40]:
i. Adaptive antenna system (AAS); multiple antennas are used at the receiver and
transmitter ends to increase the channel capacity by the focused beam antenna design
towards users to achieve in-cell frequency reuse. Fully utilizing beams of the adaptive

16
antenna system will also result in less required power. Besides that, signal-to-
interference (SNR) ratio will increase through combining multiple signals coherently.
ii. Adaptive modulation : There are multiple different modulation schemes for the uplink
and downlink path, such as Binary Phase Shift Keying (BPSK), Quadrature Phase
Shift Keying (QPSK), 16 Quadrature Amplitude Modulation (QAM), 64 QAM, and
256 QAM with different coding rates. It provides a wide range of trade-offs data rate
and robustness depending on channel conditions.
iii. Space time coding: applied in the downlink communication path as an optional
feature to provide for space transmit diversity. The space time coding assumes that the
base station is using two transmit antennas and one transmit antenna for the
subscriber stations.
2.4.1.1 The Frame Structure
The downlink and uplink subframes, which make up a frame, are transmitted using
either FDD or TDD techniques [41]. In FDD, the downlink and uplink sub-frames use
different frequencies, whereas in TDD, both of them share the same frequency but are
transmitted in different time slots. FDD is commonly used for 2G and 3G cellular networks.
Meanwhile, WiMAX supports full-duplex FDD and half-duplex FDD (HD-FDD). The
difference is that in full-duplex FDD a user device can transmit and receive simultaneously,
while in half-duplex FDD a user device can only transmit or receive at any given time slot
[42] . TDD requires only one channel for transmitting downlink and uplink sub-frames at two
different time slots resulting in higher spectral efficiency than FDD. The ratio for downlink to
uplink can also be adjusted dynamically besides the flexibility of handling both symmetric
and asymmetric broadband traffic [43].
17
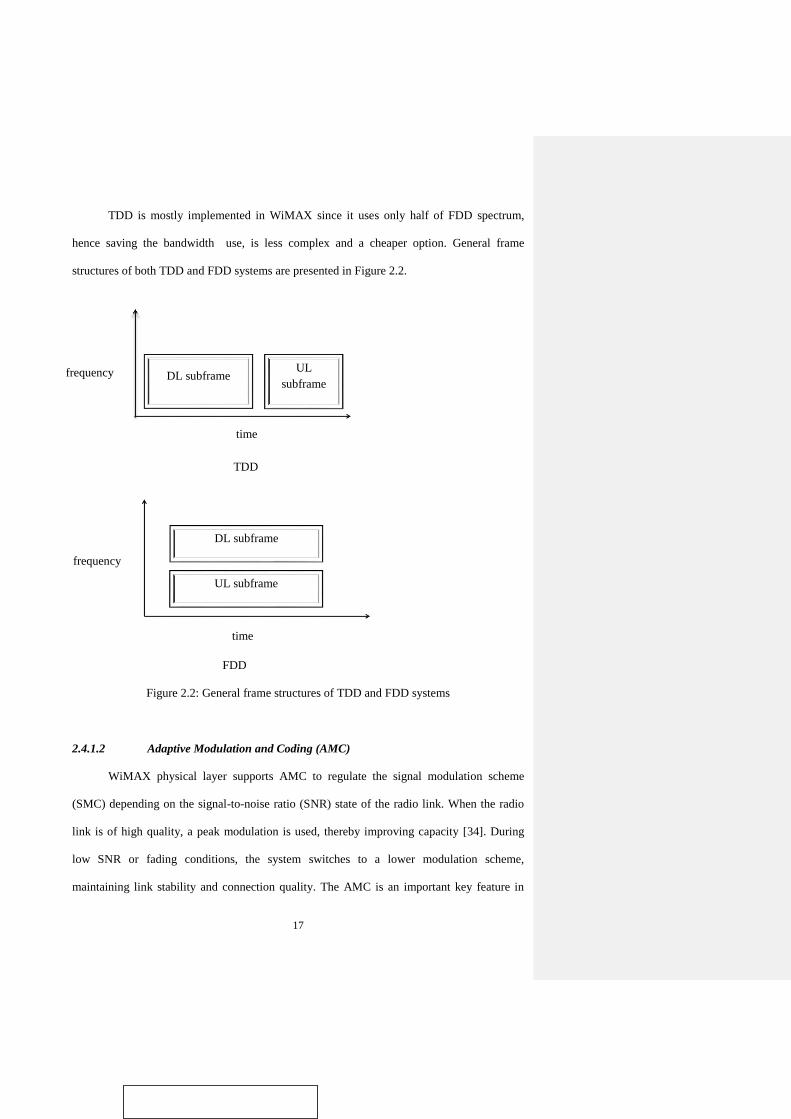
TDD is mostly implemented in WiMAX since it uses only half of FDD spectrum,
hence saving the bandwidth use, is less complex and a cheaper option. General frame
structures of both TDD and FDD systems are presented in Figure 2.2.
TDD
FDD
Figure 2.2: General frame structures of TDD and FDD systems
2.4.1.2 Adaptive Modulation and Coding (AMC)
WiMAX physical layer supports AMC to regulate the signal modulation scheme
(SMC) depending on the signal-to-noise ratio (SNR) state of the radio link. When the radio
link is of high quality, a peak modulation is used, thereby improving capacity [34]. During
low SNR or fading conditions, the system switches to a lower modulation scheme,
maintaining link stability and connection quality. The AMC is an important key feature in
DL subframe UL
subframe
time
DL subframe
UL subframe
time
frequency
frequency
18
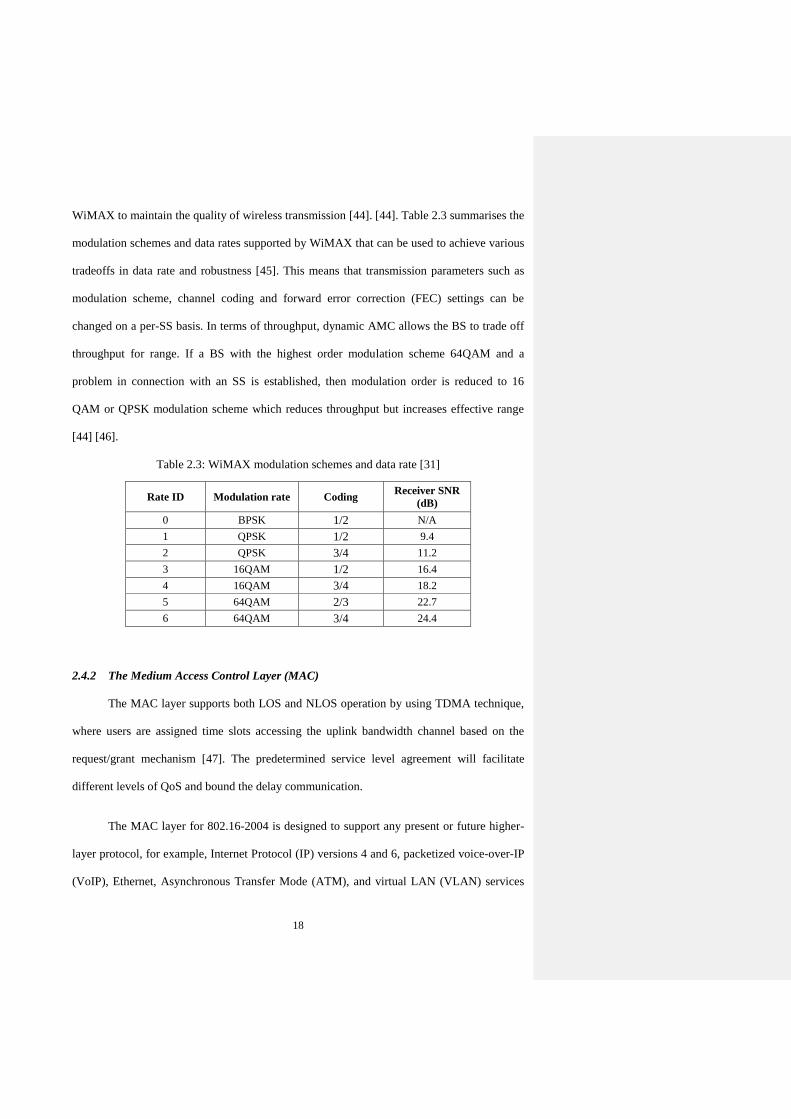
WiMAX to maintain the quality of wireless transmission [44]. [44]. Table 2.3 summarises the
modulation schemes and data rates supported by WiMAX that can be used to achieve various
tradeoffs in data rate and robustness [45]. This means that transmission parameters such as
modulation scheme, channel coding and forward error correction (FEC) settings can be
changed on a per-SS basis. In terms of throughput, dynamic AMC allows the BS to trade off
throughput for range. If a BS with the highest order modulation scheme 64QAM and a
problem in connection with an SS is established, then modulation order is reduced to 16
QAM or QPSK modulation scheme which reduces throughput but increases effective range
[44] [46].
Table 2.3: WiMAX modulation schemes and data rate [31]
Rate ID Modulation rate Coding Receiver SNR
(dB)
0 BPSK 1/2 N/A
1 QPSK 1/2 9.4
2 QPSK 3/4 11.2
3 16QAM 1/2 16.4
4 16QAM 3/4 18.2
5 64QAM 2/3 22.7
6 64QAM 3/4 24.4
2.4.2 The Medium Access Control Layer (MAC)
The MAC layer supports both LOS and NLOS operation by using TDMA technique,
where users are assigned time slots accessing the uplink bandwidth channel based on the
request/grant mechanism [47]. The predetermined service level agreement will facilitate
different levels of QoS and bound the delay communication.
The MAC layer for 802.16-2004 is designed to support any present or future higher-
layer protocol, for example, Internet Protocol (IP) versions 4 and 6, packetized voice-over-IP
(VoIP), Ethernet, Asynchronous Transfer Mode (ATM), and virtual LAN (VLAN) services
19
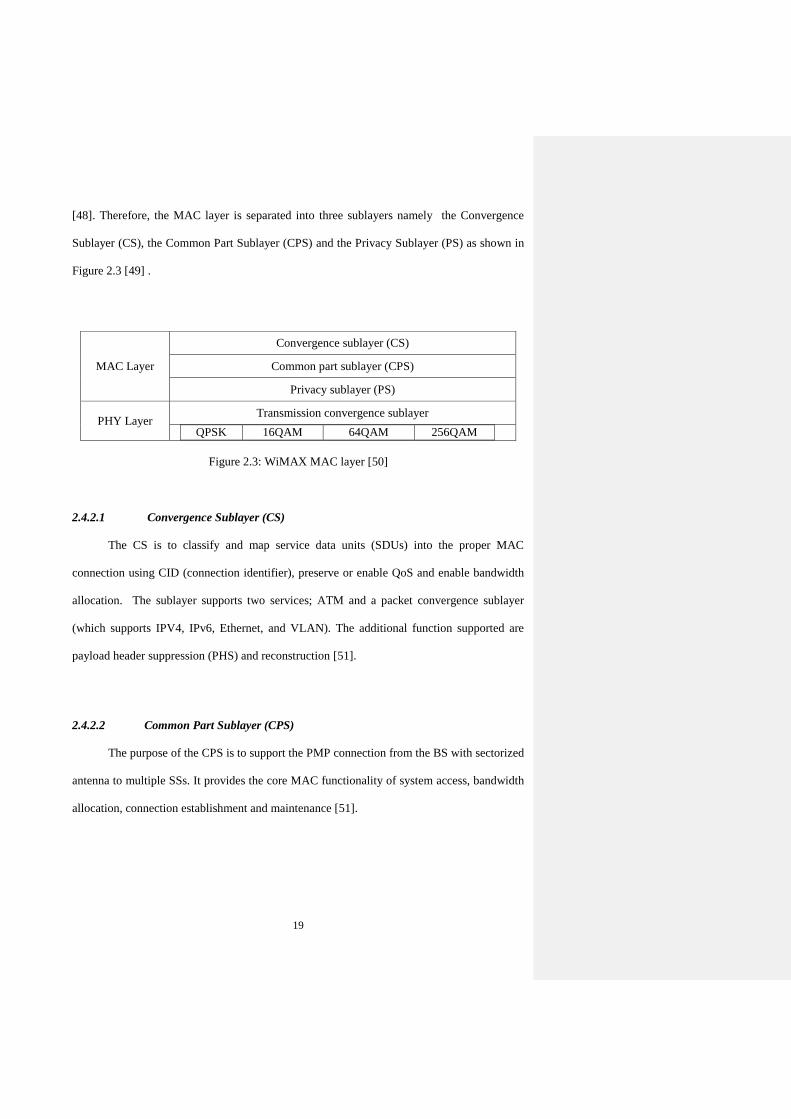
[48]. Therefore, the MAC layer is separated into three sublayers namely the Convergence
Sublayer (CS), the Common Part Sublayer (CPS) and the Privacy Sublayer (PS) as shown in
Figure 2.3 [49] .
MAC Layer
Convergence sublayer (CS)
Common part sublayer (CPS)
Privacy sublayer (PS)
PHY Layer Transmission convergence sublayer
QPSK 16QAM 64QAM 256QAM
Figure 2.3: WiMAX MAC layer [50]
2.4.2.1 Convergence Sublayer (CS)
The CS is to classify and map service data units (SDUs) into the proper MAC
connection using CID (connection identifier), preserve or enable QoS and enable bandwidth
allocation. The sublayer supports two services; ATM and a packet convergence sublayer
(which supports IPV4, IPv6, Ethernet, and VLAN). The additional function supported are
payload header suppression (PHS) and reconstruction [51].
2.4.2.2 Common Part Sublayer (CPS)
The purpose of the CPS is to support the PMP connection from the BS with sectorized
antenna to multiple SSs. It provides the core MAC functionality of system access, bandwidth
allocation, connection establishment and maintenance [51].

20
2.4.2.3 Privacy Sublayer (PS)
The PS is accountable for the security of data that comes and leaves the PHY layer to
ensure appropriate level of security for the parties involved in a transmission. This sublayer
provides security features such as authentication, secure key exchange and encryption on the
MAC Protocol Data Units (MPDUs) and forwards them to the PHY layer [52][50].
2.4.2.4 Connection Establishment
Since the 802.16 MAC is connection-oriented, a connection between an SS and a BS
must be established before any user information can be sent. Using a connection-oriented
MAC architecture, the uplink and downlink connections are controlled by the serving BS.
The connection occurs between the MAC layer in the BS and MAC layer in the Mobile
Station (MS) referred to as a unidirectional flow of data, with an assigned QoS [53]. Each
connection is identified by a connection identifier (CID), which serves as a temporary address
for the data transmission over the established link [35]. There are three types of connection in
each direction defined for management purposes; basic, primary, and secondary connections
[54]. The basic connection is used by the BS MAC and SS MAC to exchange short, time-
urgent MAC management messages, which are not very delay tolerant. The same basic CID
is assigned to both the downlink and uplink connections. It is also used for Radio Link
Control (RLC) messages, which are used to control power and ranging in addition to
changing burst profiles. The primary management connection is responsible by the BS MAC
and SS MAC to exchange longer, more delay tolerant MAC management messages and its
principle use is in the security sublayer [39] . The function of the secondary connection is to
allow a particular protocol being run at a higher layer, for instance the routing protocol, to
exchange their management messages, to transfer delay tolerant, and also standards-based
messages [55]. Example of the standards are the Dynamic Host Configuration Protocol

21
(DHCP), Trivial File Transfer Protocol (TFTP), Simple Network Management Protocol
(SNMP) [56]. Since secondary management messages are not MAC management messages,
management connection is required only for managing the SSs.
2.4.2.5 Scheduling, Bandwidth Request and Grants
Each connection in the uplink direction is mapped to a scheduled service to improve
the efficiency of the polling or granting process in the uplink bandwidth request [57]. The
scheduling rules or policies which contain a set of parameters that quantifies the QoS
requirements, are used by the BS while allocating bandwidth [58]. Using scheduling services
at BS, bandwidth allocation is mainly characterized by their uplink bandwidth request and
grant processes, which vary with traffic characteristics and delay requirements.
Bandwidth request is a mechanism that SSs uses to indicate to the BS that they need
uplink band allocation. This band request message may be transmitted during any uplink
allocation, except during any initial ranging interval [59]. Bandwidth can be requested by
stand-alone requests (BW request MAC PDU) or a piggyback request. Table 2.4 lists a
summary of the five different categories of scheduling services, including their individual
application examples and attributes of bandwidth management. Piggyback request refers to a
method of using a previously granted uplink channel access opportunity to inform the BS that
an SS requires another allocation to send pending data. Meanwhile, bandwidth stealing refers
to another special option, which uses the granted band for sending another band request
rather than sending data [60]. Both of these special options for bandwidth requests are
applicable depending on the scheduling type [58].
22
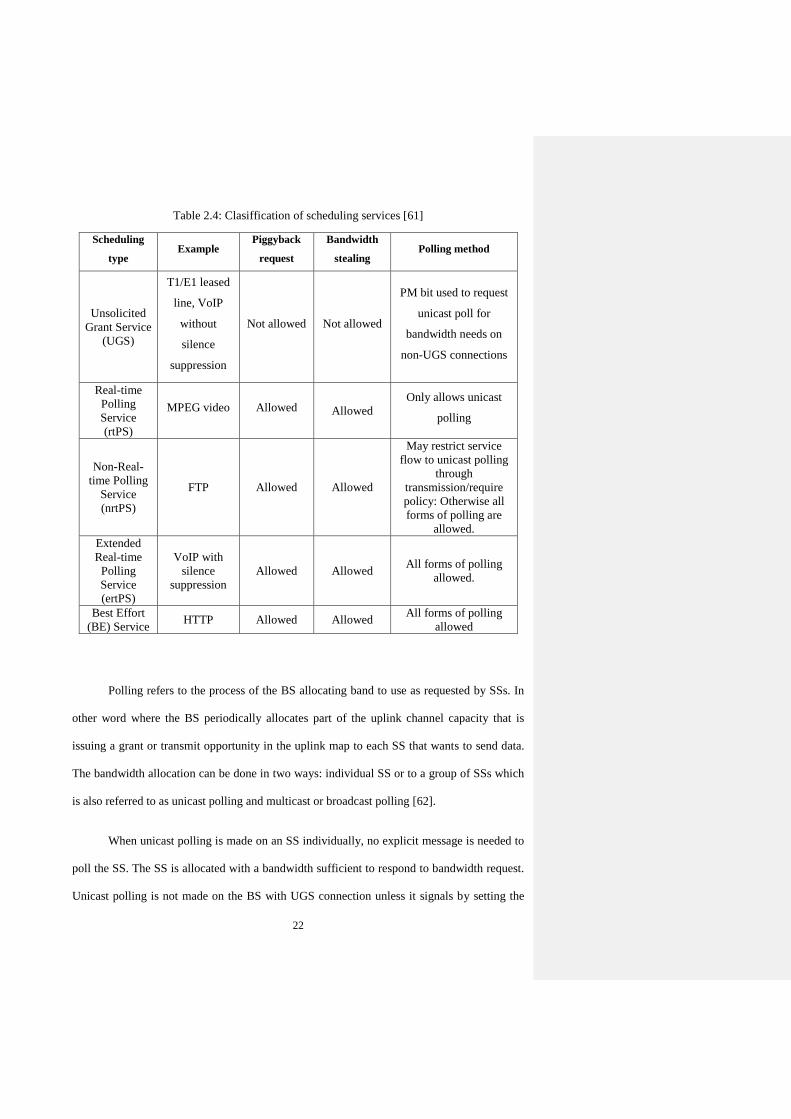
Table 2.4: Clasiffication of scheduling services [61]
Polling refers to the process of the BS allocating band to use as requested by SSs. In
other word where the BS periodically allocates part of the uplink channel capacity that is
issuing a grant or transmit opportunity in the uplink map to each SS that wants to send data.
The bandwidth allocation can be done in two ways: individual SS or to a group of SSs which
is also referred to as unicast polling and multicast or broadcast polling [62].
When unicast polling is made on an SS individually, no explicit message is needed to
poll the SS. The SS is allocated with a bandwidth sufficient to respond to bandwidth request.
Unicast polling is not made on the BS with UGS connection unless it signals by setting the
Scheduling
type Example
Piggyback
request
Bandwidth
stealing Polling method
Unsolicited
Grant Service
(UGS)
T1/E1 leased
line, VoIP
without
silence
suppression
Not allowed Not allowed
PM bit used to request
unicast poll for
bandwidth needs on
non-UGS connections
Real-time
Polling
Service
(rtPS)
MPEG video Allowed Allowed
Only allows unicast
polling
Non-Real-
time Polling
Service
(nrtPS)
FTP Allowed Allowed
May restrict service
flow to unicast polling
through
transmission/require
policy: Otherwise all
forms of polling are
allowed.
Extended
Real-time
Polling
Service
(ertPS)
VoIP with
silence
suppression
Allowed Allowed All forms of polling
allowed.
Best Effort
(BE) Service HTTP Allowed Allowed
All forms of polling
allowed

23
PM bit in the header to request additional non-UGS connection [63]. This saves bandwidth
over polling all SSs individually. Multicast and broadcast polling are done when there is
insufficient bandwidth to poll each SS individually. When polling is done in multicast, the
allocated slot for making bandwidth requests is a shared slot, which every polled SS attempts
to use or in other words to participate on contention resolution process [59]. Multicast polling
is one of the mechanisms used in WiMAX networks, and achieves better and even guaranteed
quality of service and with reduced waste in utilization [64]. Therefore, based on all the
characteristics mention for each type of scheduling services, we narrowed our research into
rtPS and BE scheduling type which will be discussed in Chapters 3 and 4.
2.5 The Architecture of 802.11 system
The main idea in our research is to build an integration sytem which focuses on
WiMAX and WiFi network. Therefore, in this section, an overview of 802.11 system is
added in this thesis. 802.11 is an evolving family of specifications for WLANs developed by
IEEE [22]. The architecture encompasses of three layers: LLC, MAC, and physical layer
[65]. In 802.11, each computer, mobile, portable or fixed device is referred to as a station.
When two or more stations come together to communicate with each other, they form a Basic
Service Set (BSS). A BSS consists of two stations executing the same MAC protocol and
competing for access to the same shared wireless medium. The BSS may be isolated or it
may connect to a backbone distribution system (DS) through an access point (AP). The AP
may also function as bridge, meanwhile the DS can be a switch, a wired network, or a
wireless network. The MAC protocol used in 802.11 architecture may be fully distributed or
controlled by a central coordination system in the access point. Generally, BSS is known as a
cell in the literature [66].

24
The simplest 802.11 configuration is where each station belongs to a single cell and
within the range of the associated AP. It is also possible for two cells to overlap, therefore a
single station could participate in more than one cell. The association between a station and a
cell is a dynamic process where stations may turn off, in the coverage range or even out of
the range. An extended service set (ESS) consists of two or more SS interconnected by a DS
which will increase the network coverage [67].
2.5.1 The Physical Layer (PHY)
The 802.11 PHYs operate on unlicensed bands at 2.4 GHz and 5 GHz. Most of the
PHYs which are DSSS, FHSS, 802.11b, and 802.11g operate at the 2.4 GHz, whereas
802.11a operates at the 5 GHz bands [68]. Modulation scheme used by 802.11 is TDD which
is a similar concept used in typical cellular networks. The channel bandwidth is also
dependent on the PHY’s characteristics as 802.11a and 802.11g occupy a 20 MHz band while
the 802.11b signals occupy a 22 MHz band [69]. The transmission rate for 802.11n covers up
to 600 Mbps since it utilizes multiple antenna technologies (MIMO) and channel bonding
(using 40 MHz bandwidth instead of 20 MHz) [70]. However, since the transmission rate is
inversely proportional to the transmission range, therefore, the higher the transmission rate,
the shorter the transmission range becomes. This is because to have a successful
transmission, higher signal-to-interference-and-noise ratio (SINR) is needed for higher order
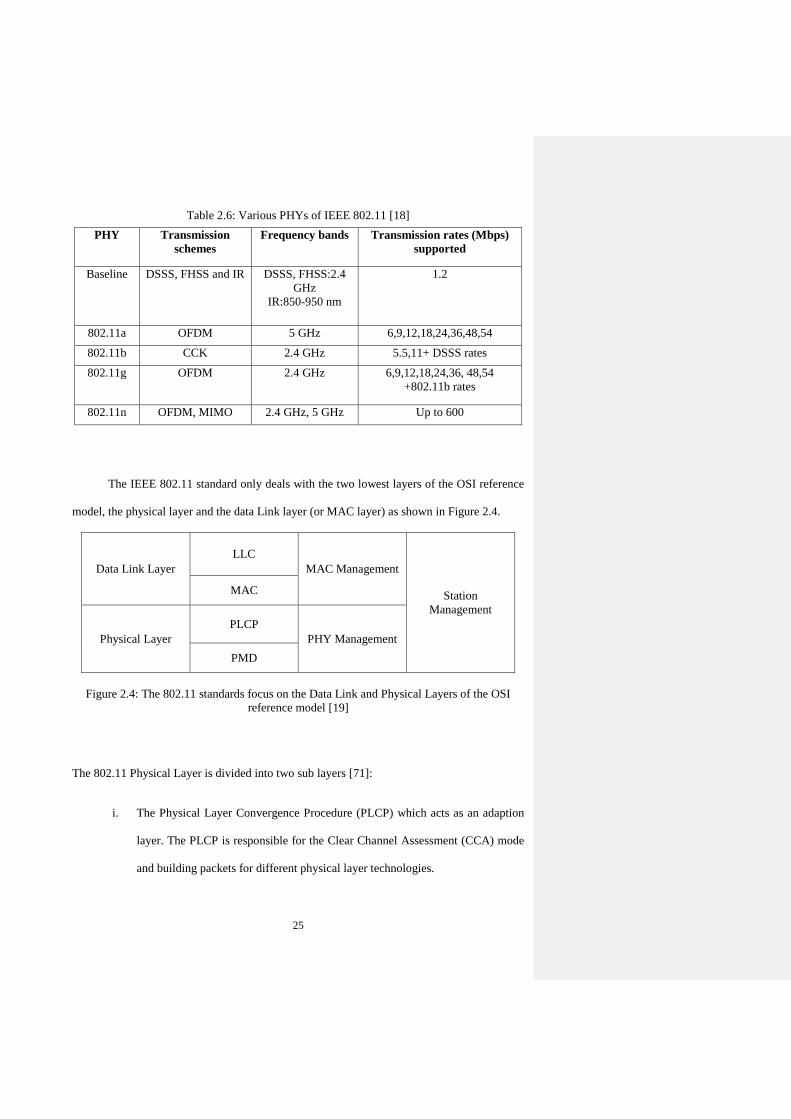
modulation schemes. Table 2.6 lists a summary of the differences in 802.11 PHYs.
25
Table 2.6: Various PHYs of IEEE 802.11 [18]
The IEEE 802.11 standard only deals with the two lowest layers of the OSI reference
model, the physical layer and the data Link layer (or MAC layer) as shown in Figure 2.4.
Data Link Layer
LLC
MAC Management
Station
Management
MAC
Physical Layer
PLCP
PHY Management
PMD
Figure 2.4: The 802.11 standards focus on the Data Link and Physical Layers of the OSI
reference model [19]
The 802.11 Physical Layer is divided into two sub layers [71]:
i. The Physical Layer Convergence Procedure (PLCP) which acts as an adaption
layer. The PLCP is responsible for the Clear Channel Assessment (CCA) mode
and building packets for different physical layer technologies.
PHY Transmission
schemes
Frequency bands Transmission rates (Mbps)
supported
Baseline DSSS, FHSS and IR DSSS, FHSS:2.4
GHz
IR:850-950 nm
1.2
802.11a OFDM 5 GHz 6,9,12,18,24,36,48,54
802.11b CCK 2.4 GHz 5.5,11+ DSSS rates
802.11g OFDM 2.4 GHz 6,9,12,18,24,36, 48,54
+802.11b rates
802.11n OFDM, MIMO 2.4 GHz, 5 GHz Up to 600
26
ii. The Physical Medium Dependent (PMD) layer specifies modulation and coding
techniques. The PHY management layer takes care of the management issues
such as channel tuning.
The Station Management sublayer is responsible for coordination of interactions
between the MAC and PHY layers [72].
2.5.2 Medium Access Control Layer (MAC)
The MAC layer provides the functional and procedural means to transfer data
between network entities and to detect and possibly correct errors that may occur in the
physical layer. It also provides access to contention based and contention free traffic on
different kinds of physical layers [72].
In the MAC layer, the responsibilities are divided into two sublayers namely: the
MAC sub-layer and the MAC management sub-layer. The MAC sub-layer’s task is to define
the access mechanisms and packet formats meanwhile MAC management sub-layer is
responsible for the power management, security and roaming services [73].
2.6 Wireless Hybrid Networks
Hybrid Networks (HN) are the most widely used types of communication system. HN
is a network which unites different communication standards with different types of
architectures. HN can be divided into the two main groups [9]:
Hybrid networks based on two or more different networks architectures.
Hybrid networks based on two or more different networks standards.
27
Usually three major types of network architectures are utilized in HN:
Bus network architecture [1]
Ring network architecture [2]
Star network architecture [2]
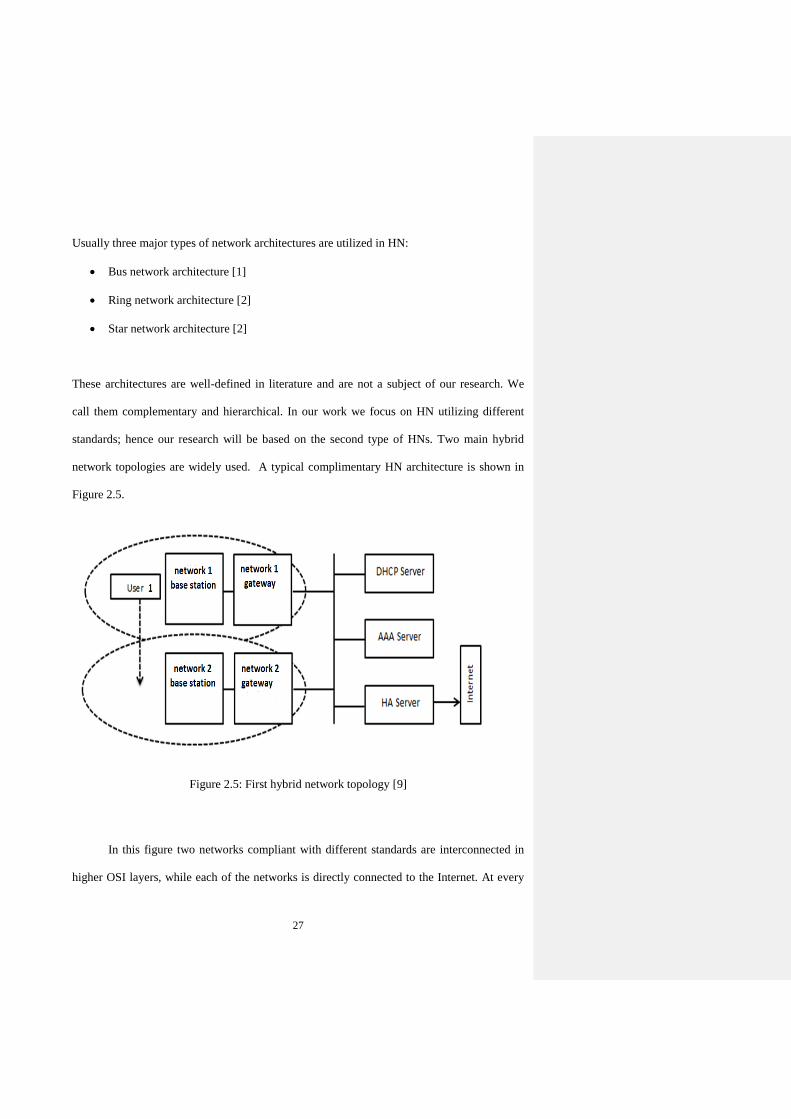
These architectures are well-defined in literature and are not a subject of our research. We
call them complementary and hierarchical. In our work we focus on HN utilizing different
standards; hence our research will be based on the second type of HNs. Two main hybrid
network topologies are widely used. A typical complimentary HN architecture is shown in
Figure 2.5.
Figure 2.5: First hybrid network topology [9]
In this figure two networks compliant with different standards are interconnected in
higher OSI layers, while each of the networks is directly connected to the Internet. At every
28
instant, a user is connected to only one network, and one of the main functions of the HN is
to support seamless roaming between the subnetworks. This type of an HN is used by mobile
phone operators in which a user is constantly hopping between the 3G, High-Speed Downlink
Packet Access (HSDPA), Evolved High-Speed Packet Access (HSDPA+) and other
networks.
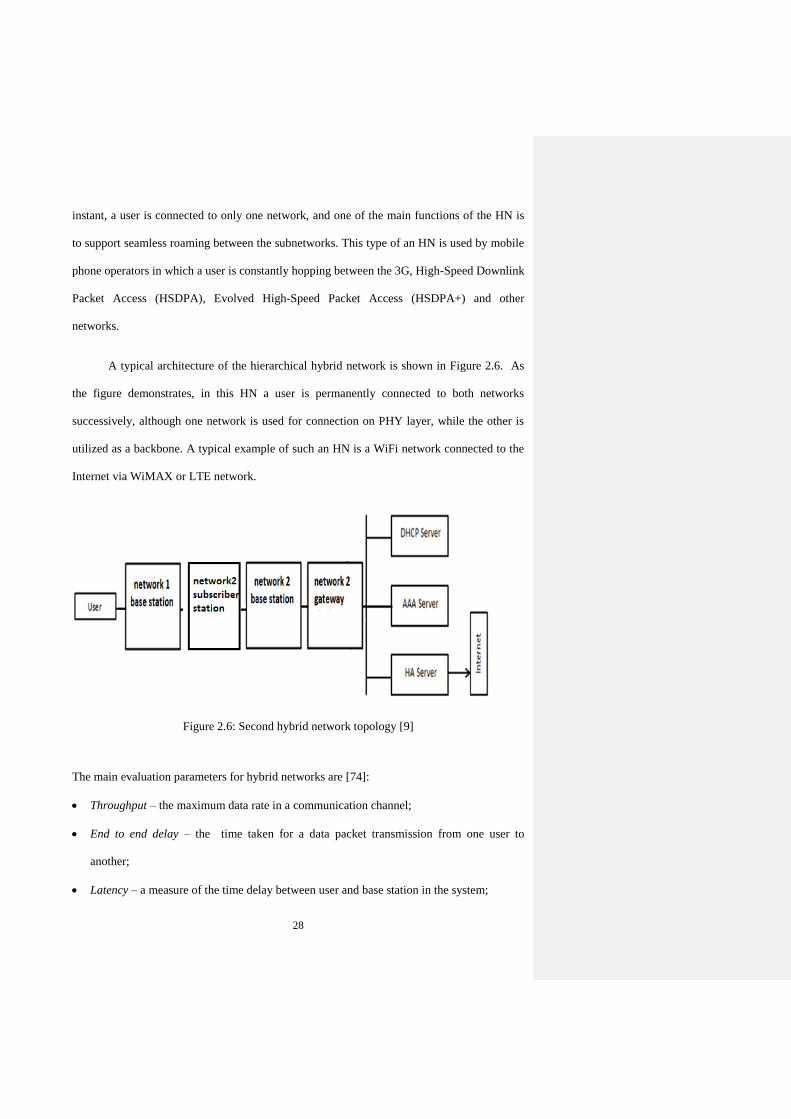
A typical architecture of the hierarchical hybrid network is shown in Figure 2.6. As
the figure demonstrates, in this HN a user is permanently connected to both networks
successively, although one network is used for connection on PHY layer, while the other is
utilized as a backbone. A typical example of such an HN is a WiFi network connected to the
Internet via WiMAX or LTE network.
Figure 2.6: Second hybrid network topology [9]
The main evaluation parameters for hybrid networks are [74]:
Throughput – the maximum data rate in a communication channel;
End to end delay – the time taken for a data packet transmission from one user to
another;
Latency – a measure of the time delay between user and base station in the system;
29
Packet loss –a parameter showing how many data packets were lost during the data
transfer.
2.7 Backgound and Related Work
The subject of QoS allocation and management especially in hybrid network
environment have become more challenging than ever due to the technological advances in
wireless communication systems. Since mapping QoS in a hybrid system is not an easy task
due to several factors, therefore; this area received great attention in the research community.
In [3], the author proposed mapping method using Application Service Map (ASM) that
classifies application services based on performance requirements. Using ASM method, new
application could be easily inserted without the need of the alternation or modification. As in
[75], a method of mapping QoS of UMTS and WiMAX over a loose coupling environment
across IP based network is presented. A QoS gateway that will connect different wireless
systems is used to support end-to-end QoS. Meanwhile, in [76], a thereotical explanation of
end-to-end QoS over heterogenous networks was described . The EuQoS system architecture
and protocol is used when there is a request from the user. One of the latest research [77],
that maps WiMAX-WLAN-LTE using Load Balancing (LB) technique. The act of LB is as
the load distributor for IP multimedia traffic across multiple servers which two or more
servers can be incorporated. However, in the research, the QoS assigned to the users are not
incorporated. For all the works mention in [63][64][65], there are no simulation results to
verify the mapping methods. For this reason, we decided to work on two private networks
first before moving on to bigger hybrid networks. In this thesis, we proposed QoS mapping
tables for WiFi + WiMAX network and verifying it through the simulations results.
The other key components focus in this thesis, is the integration of WiFi + WiMAX
hybrid systems for first responders in disaster or emergency situations. In [78], the discussion

30
was dedicated to the problem arised in the WiFi+WiMAX interworking such as the protocols
involved, the ideal QoS should be assigned when a user moves to a different network and
others. Another concern in an integration system is the security and mobility issues as pointed
out by the author in [79]. The paper presented a full system testbed to derive a unified
security model and to support seamless handoff within a WiFi and WiMAX hybrid network.
In [80], the research shows and end-to-end WiFi+WiMAX network deployment in testbed
environment. Results obtained from the investigation indicates that WiFi+WiMAX
deployment does not deteriote throughput as compared to a standalone WiMAX system. In
[81], the author proposed an an analytic model for an integrated wireless network using
WiMAX as backhaul support for WiFi traffic. Based on the research in [67], only the issues
of WiFi+ WiMAX interworking was raised however no results was presented to support the
problem statement. Meanwhile research in [68][68],as well in [70] that involves testbed
environment, particularly only one parameters was considered in the network. To that
reasons, in a different way, our work is focus on providing simulation results with
consideration of all the QoS parameters and also on the optimization issues.
Other than that, since our research also involves with EU PPDR-TC Projects, some
research have been done to support our work. A comprehensive explanation about the PPDR
Projects will be explained in Chapter 5 of this thesis. There are diverse instances of system
architecture for emergency mobile communications particularly in PPDR services either it is
a standalone or a hybrid network. One of the examples of a standalone communication
system is the satellite communications [82]. Satellite communication can provide a really
wide coverage over a large area, which makes it very useful in specific and large natural
disasters (earthquake, floodings). In spite of that, the limitation of satellite communication is
the dependency on the ground infrastructure, which is associated with the management of the
satellites. Thus, to serve with the localization and also to offer a continuous data link, an
Commented [ez3]: Again the or this?

31
integration of satellite and aerospace communication segments with terrestrial backbones was
introduced [83]. In [84], an emergency communication system based on software-defined
radio (SDR) technology and software communication architecture (SCA) to support PPDR
operations with special focus on the provision of satellite communications was presented. As
well mention in [85], the research addressed the challenges of setting up satellite-based
emergency communication facilities during a disaster from technical, financial and
organizational standpoints. A research involving wireless mesh network is explained in [86],
that proposed a mesh architecture as a back-up network in cases of emergencies and also
measurement of the video streaming application as indicator of the network performance.
Another research focus on PPDR operation is [87], which the author proposed an optimized
mechanism for narrowband terrestrial trunked radio (TETRA) systems for intensive and
concurrent voice usage and real-time, low-capacity data. It had also presented a scenario for
evolution toward broadband land mobile radio (LMR) based on the design of communication
systems that integrate TETRA and LTE radio access. One of the recent examples of an
emergency network project is the Rapid Emergency Deployment Mobile Communication
(REDComm) project [88]. REDComm foremost aim was to construct a communications
infrastructure to bear out and handle communications in emergency and crisis situations,
when standard communication networks are non usable.
However, our main focus for the PPDR project are the traffic combinations for the
WiFi users in order to support more users in the hybrid network. Also, an optimization of the
integration that minimizes the delays and packet loss and also with an optimum thoughput.

32
2.8 Summary
In this section we presented an overview of IEEE 802.16 and IEEE 802.11 standards,
including a brief explanation on the systems layout. The 802.16 standard had evolved from
its first version with some limitations in terms of line of sight communication and mobility to
the latest version which improvised many aspects of the standard. Other than that, the
evolution of the 802.11 was discussed for different standards and features. We identified
several drawbacks for these systems and therefore explained the needs of hybrid network,
hence providing a rationale for our research. We have presented different types of wireless
hybrid network and some of the research related to hybrid network were also presented in this
chapter as our reference for the rest of the research.
33
Chapter 3: QoS SUPPORT IN WIRELESS BROADBAND NETWORKS
Wireless communication has at present turned into an essential part in trading
information, prompting more sharing resources among users and along these lines a bigger
necessity of transfer speed in a system. Other than users' expense fulfillment with the wireless
innovations, another vital component that has drawn an extraordinary arrangement is the
ability of meeting QoS [89]. QoS is characterized as the capacity of a system to have some
level of affirmation that its traffic and service necessities would be fulfilled in terms of packet
loss, delay, throughput and jitter [90].
However, it would be different in the point of view of QoS in the disaster recovery. In
times of catastrophe such as earthquakes or tsunamis, particularly when the major incumbent
communications infrastructure was destroyed or damaged, a relatively tight and robust
communications system needs to be deployed in order to support the communication needs of
the rescue and retrieval operations. It is vital to have a guaranteed QoS to assist the
communication needs among the first responders. Therefore, based on my proposed
architecture, the QoS level could be increased and guaranteed, not only the aim is to
communicate between the rescue team and the monitoring center but also important for
saving lives.
In this chapter, the challenges of QoS connectivity are addressed and a novel QoS
mapping scheme, particularly for hybrid broadband networks is proposed and assessed. We
focused on two of the most widely used hybrid networks; WiFi-WiMAX and WiFi-LTE. As
opposed to other works that were described and analyzed in Chapter 2, we worked with all
possible QoS combinations for WiFi-WiMAX and WiFi-LTE hybrid broadband networks,
and we will provide descriptions on how QoS maps can be developed based on the
Commented [ez4]: Has this been provided earlier or will be
provided in this chapter? If this chapter will provide it, then the corrections are as made.
But if this has been described, it should be ‘we have provided
descriptions on how…
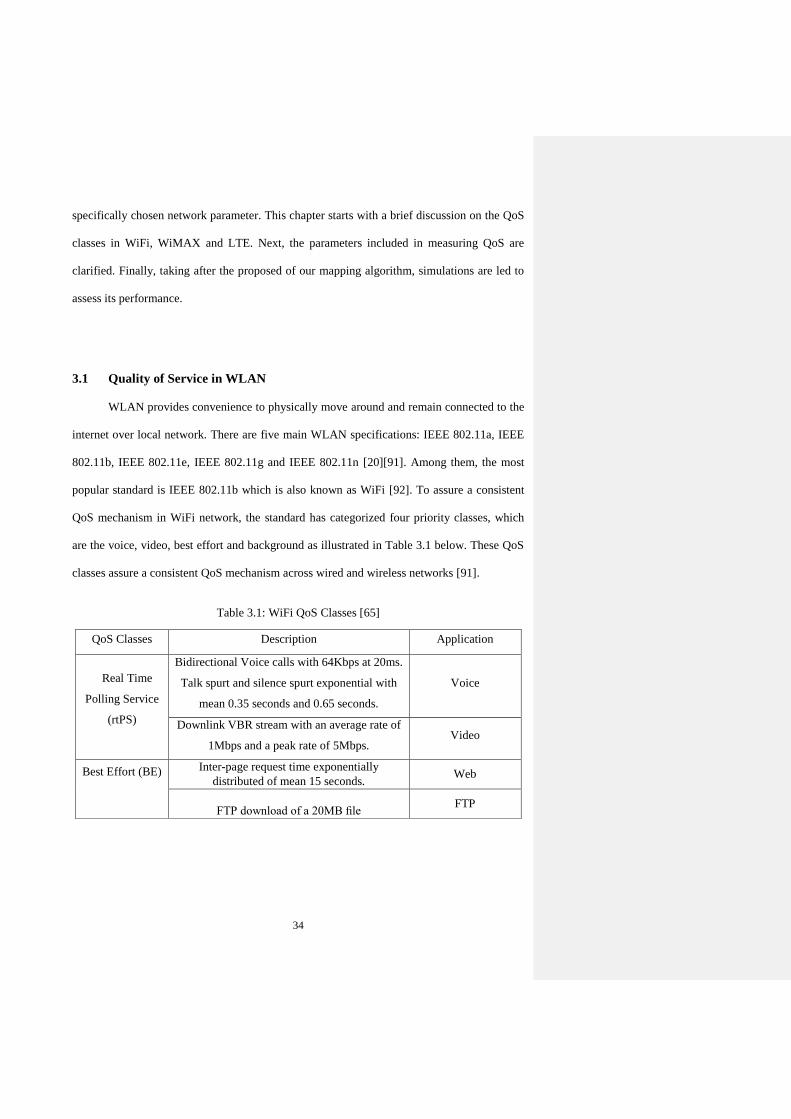
34
specifically chosen network parameter. This chapter starts with a brief discussion on the QoS
classes in WiFi, WiMAX and LTE. Next, the parameters included in measuring QoS are
clarified. Finally, taking after the proposed of our mapping algorithm, simulations are led to
assess its performance.
3.1 Quality of Service in WLAN
WLAN provides convenience to physically move around and remain connected to the
internet over local network. There are five main WLAN specifications: IEEE 802.11a, IEEE
802.11b, IEEE 802.11e, IEEE 802.11g and IEEE 802.11n [20][91]. Among them, the most
popular standard is IEEE 802.11b which is also known as WiFi [92]. To assure a consistent
QoS mechanism in WiFi network, the standard has categorized four priority classes, which
are the voice, video, best effort and background as illustrated in Table 3.1 below. These QoS
classes assure a consistent QoS mechanism across wired and wireless networks [91].
Table 3.1: WiFi QoS Classes [65]
QoS Classes Description Application
Real Time
Polling Service
(rtPS)
Bidirectional Voice calls with 64Kbps at 20ms.
Talk spurt and silence spurt exponential with
mean 0.35 seconds and 0.65 seconds.
Voice
Downlink VBR stream with an average rate of
1Mbps and a peak rate of 5Mbps. Video
Best Effort (BE)
Inter-page request time exponentially
distributed of mean 15 seconds. Web
FTP download of a 20MB file FTP
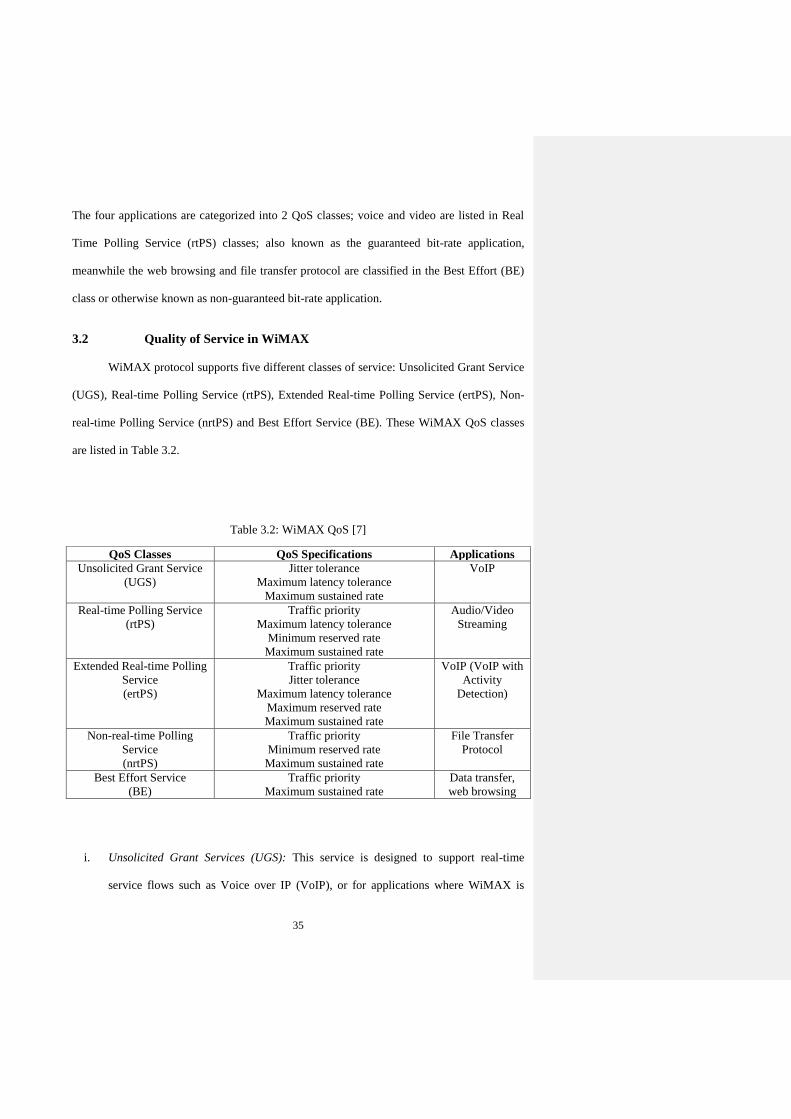
35
The four applications are categorized into 2 QoS classes; voice and video are listed in Real
Time Polling Service (rtPS) classes; also known as the guaranteed bit-rate application,
meanwhile the web browsing and file transfer protocol are classified in the Best Effort (BE)
class or otherwise known as non-guaranteed bit-rate application.
3.2 Quality of Service in WiMAX
WiMAX protocol supports five different classes of service: Unsolicited Grant Service
(UGS), Real-time Polling Service (rtPS), Extended Real-time Polling Service (ertPS), Non-
real-time Polling Service (nrtPS) and Best Effort Service (BE). These WiMAX QoS classes
are listed in Table 3.2.
Table 3.2: WiMAX QoS [7]
QoS Classes QoS Specifications Applications
Unsolicited Grant Service
(UGS)
Jitter tolerance
Maximum latency tolerance
Maximum sustained rate
VoIP
Real-time Polling Service
(rtPS)
Traffic priority
Maximum latency tolerance
Minimum reserved rate
Maximum sustained rate
Audio/Video
Streaming
Extended Real-time Polling
Service
(ertPS)
Traffic priority
Jitter tolerance
Maximum latency tolerance
Maximum reserved rate
Maximum sustained rate
VoIP (VoIP with
Activity
Detection)
Non-real-time Polling
Service
(nrtPS)
Traffic priority
Minimum reserved rate
Maximum sustained rate
File Transfer
Protocol
Best Effort Service
(BE)
Traffic priority
Maximum sustained rate
Data transfer,
web browsing
i. Unsolicited Grant Services (UGS): This service is designed to support real-time
service flows such as Voice over IP (VoIP), or for applications where WiMAX is

36
used to replace fixed lines such as E1 and T1. It offers fixed-size grants on a real-time
periodic basis, which eliminates the overhead and latency and assures that grants are
available to meet the flow’s real-time needs [8]
ii. Real-time Polling Service (rtPS): This service is designed to support real-time
services such as Moving Picture Experts Group (MPEG) video. It is also used for
enterprise access services where guaranteed E1/T1 rates are needed but with the
possibility of higher bursts if network capacity is available. It has a variable bit rate
but with guaranteed minimums for data rate and delay [9].
iii. Extended Real-time Polling Service (ertPS): This service is designed to support real-
time services such as VoIP with silence suppression that have variable data rates but
require guaranteed data rate and delay. One typical system in this QoS class is Skype
[96].
iv. Non-real-time Polling Service (nrtPS): This service is designed to support for services
where a guaranteed bit rate (GBR) is required but latency is not critical, such as File
Transfer Protocol (FTP).
v. Best Effort Service (BE): This service is designed for Internet services such as email
and web browsing that do not require a minimum service-level guarantee. Data
packets are carried as space becomes available. In this QoS class, delays may be
incurred and jitter is not a problem [97].
3.3 Quality of Service in LTE
LTE was created by the 3rd Generation Partnership Project (3GPP) with the
association of the European Telecommunications Standards Institute (ETSI). LTE is an
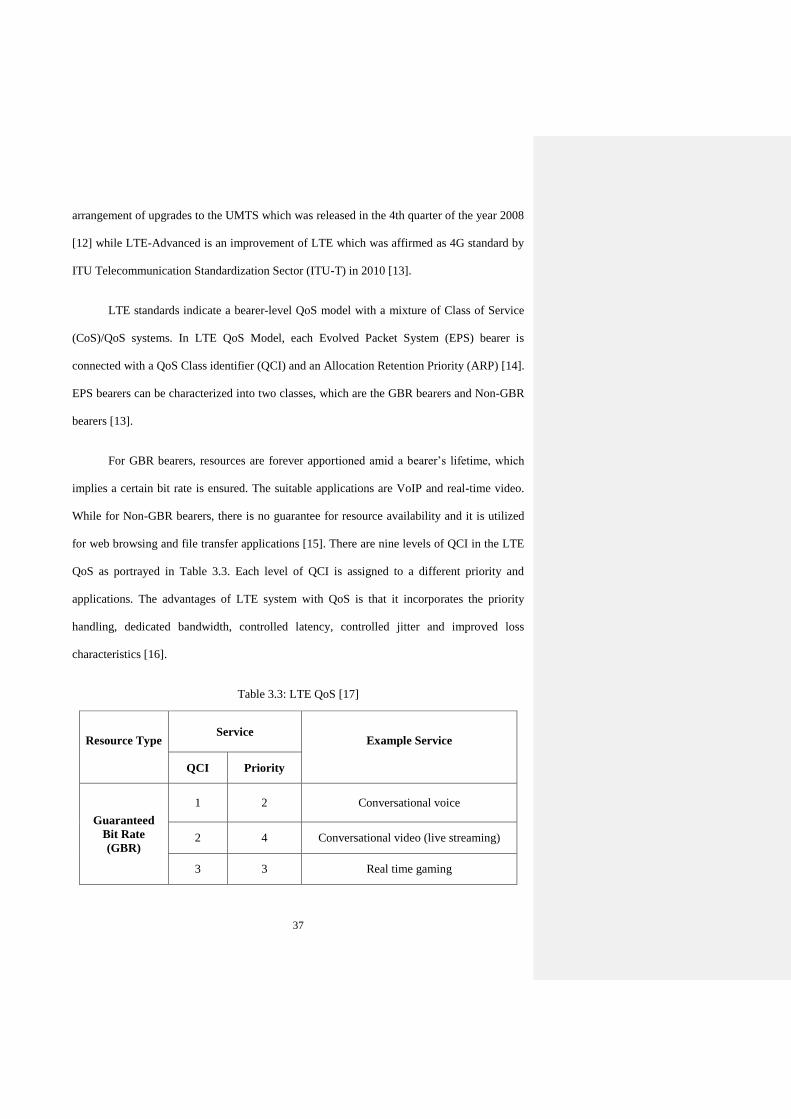
37
arrangement of upgrades to the UMTS which was released in the 4th quarter of the year 2008
[12] while LTE-Advanced is an improvement of LTE which was affirmed as 4G standard by
ITU Telecommunication Standardization Sector (ITU-T) in 2010 [13].
LTE standards indicate a bearer-level QoS model with a mixture of Class of Service
(CoS)/QoS systems. In LTE QoS Model, each Evolved Packet System (EPS) bearer is
connected with a QoS Class identifier (QCI) and an Allocation Retention Priority (ARP) [14].
EPS bearers can be characterized into two classes, which are the GBR bearers and Non-GBR
bearers [13].
For GBR bearers, resources are forever apportioned amid a bearer’s lifetime, which
implies a certain bit rate is ensured. The suitable applications are VoIP and real-time video.
While for Non-GBR bearers, there is no guarantee for resource availability and it is utilized
for web browsing and file transfer applications [15]. There are nine levels of QCI in the LTE
QoS as portrayed in Table 3.3. Each level of QCI is assigned to a different priority and
applications. The advantages of LTE system with QoS is that it incorporates the priority
handling, dedicated bandwidth, controlled latency, controlled jitter and improved loss
characteristics [16].
Table 3.3: LTE QoS [17]
Resource Type
Service Example Service
QCI Priority
Guaranteed
Bit Rate
(GBR)
1 2 Conversational voice
2 4 Conversational video (live streaming)
3 3 Real time gaming
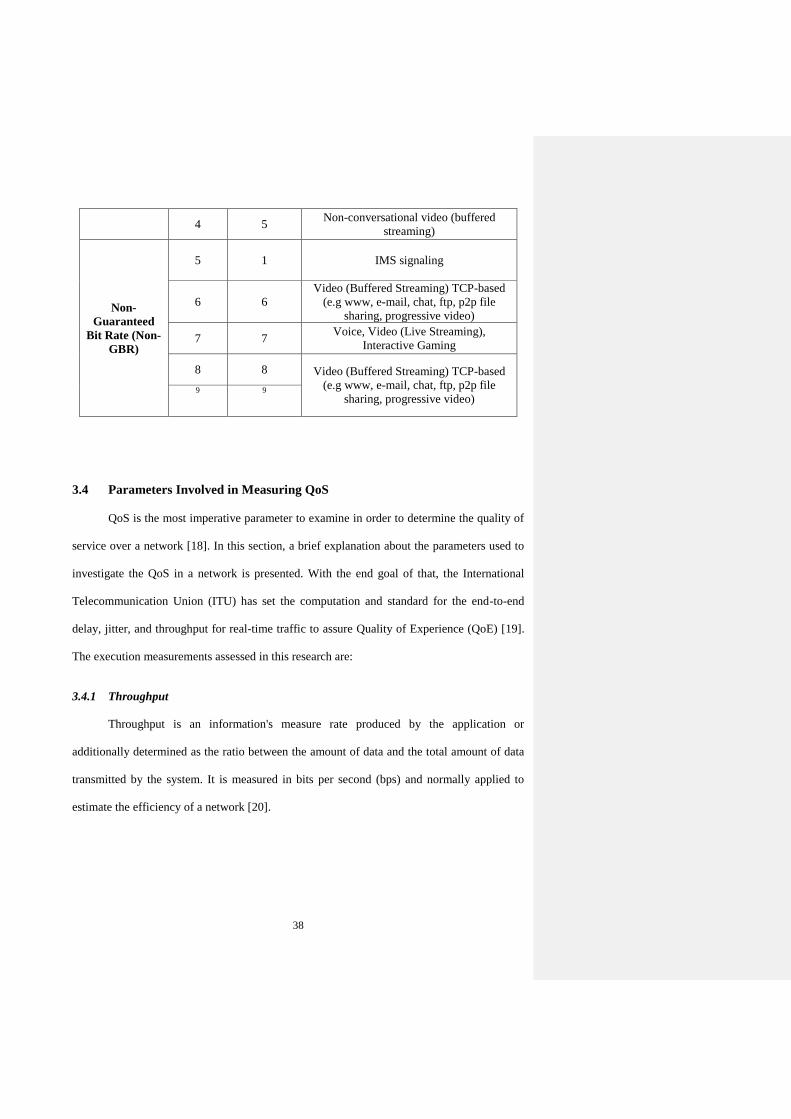
38
4 5 Non-conversational video (buffered
streaming)
Non-
Guaranteed
Bit Rate (Non-
GBR)
5 1 IMS signaling
6 6
Video (Buffered Streaming) TCP-based
(e.g www, e-mail, chat, ftp, p2p file
sharing, progressive video)
7 7 Voice, Video (Live Streaming),
Interactive Gaming
8 8 Video (Buffered Streaming) TCP-based
(e.g www, e-mail, chat, ftp, p2p file
sharing, progressive video) 9 9
3.4 Parameters Involved in Measuring QoS
QoS is the most imperative parameter to examine in order to determine the quality of
service over a network [18]. In this section, a brief explanation about the parameters used to
investigate the QoS in a network is presented. With the end goal of that, the International
Telecommunication Union (ITU) has set the computation and standard for the end-to-end
delay, jitter, and throughput for real-time traffic to assure Quality of Experience (QoE) [19].
The execution measurements assessed in this research are:
3.4.1 Throughput
Throughput is an information's measure rate produced by the application or
additionally determined as the ratio between the amount of data and the total amount of data
transmitted by the system. It is measured in bits per second (bps) and normally applied to
estimate the efficiency of a network [20].
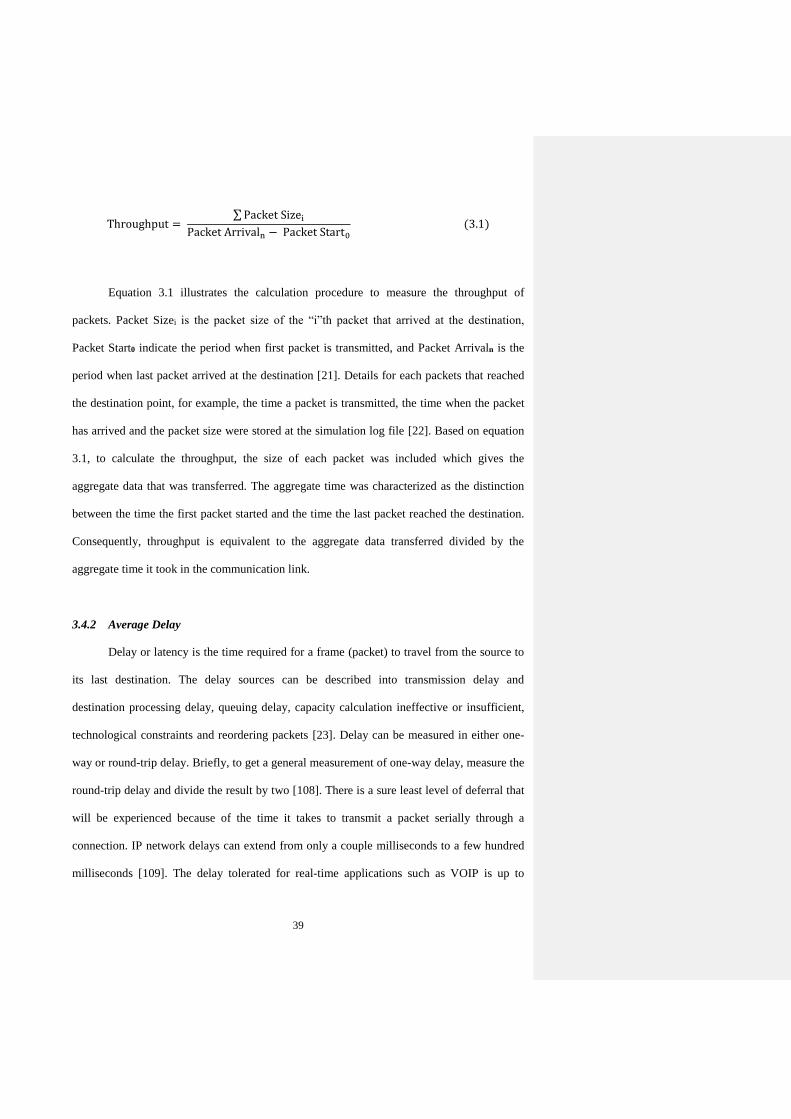
39
Throughput = ∑ Packet Sizei
Packet Arrivaln − Packet Start0 (3.1)
Equation 3.1 illustrates the calculation procedure to measure the throughput of
packets. Packet Sizei is the packet size of the “i”th packet that arrived at the destination,
Packet Start0 indicate the period when first packet is transmitted, and Packet Arrivaln is the
period when last packet arrived at the destination [21]. Details for each packets that reached
the destination point, for example, the time a packet is transmitted, the time when the packet
has arrived and the packet size were stored at the simulation log file [22]. Based on equation
3.1, to calculate the throughput, the size of each packet was included which gives the
aggregate data that was transferred. The aggregate time was characterized as the distinction
between the time the first packet started and the time the last packet reached the destination.
Consequently, throughput is equivalent to the aggregate data transferred divided by the
aggregate time it took in the communication link.
3.4.2 Average Delay
Delay or latency is the time required for a frame (packet) to travel from the source to
its last destination. The delay sources can be described into transmission delay and
destination processing delay, queuing delay, capacity calculation ineffective or insufficient,
technological constraints and reordering packets [23]. Delay can be measured in either one-
way or round-trip delay. Briefly, to get a general measurement of one-way delay, measure the
round-trip delay and divide the result by two [108]. There is a sure least level of deferral that
will be experienced because of the time it takes to transmit a packet serially through a
connection. IP network delays can extend from only a couple milliseconds to a few hundred
milliseconds [109]. The delay tolerated for real-time applications such as VOIP is up to

40
150ms before the quality of the call is unacceptable [108]. The lower the value of delay
means the better performance of the protocol.
Average Delay = ∑ Packet Arrivali − Packet Starti
n (3.2)
Equation 3.2 depicts the calculation method for measuring average delay. Packet
Arrivali means the period when packet “i” arrive at the destination while for Packet Starti, is
the period when the packet “i” leaves the source. The total number of frame or packets is
indicated as “n” [14].
3.4.3 Average Jitter
Jitter is characterized as variety in delay after some time from point-to-point . It is
ordinarily utilized as an indicator of consistency and stability of a network [110]. Jitter is a
standout amongst the most essential components to determine the execution of a system and
the QoS of the system. For instance in a VoIP call, if the delay of transmission changes too
broadly, the call quality will be significantly debased. The measure of jitter tolerable on the
network is influenced by the depth of the jitter buffer on the system equipment in the voice
path [111]. The more jitter buffer available, the more the system can lessen the impacts of
jitter. Equation 3.3 characterizes the steps to figure average jitter. It is the average of the
absolute difference in the time it took for successive packets to achieve the destination [105].
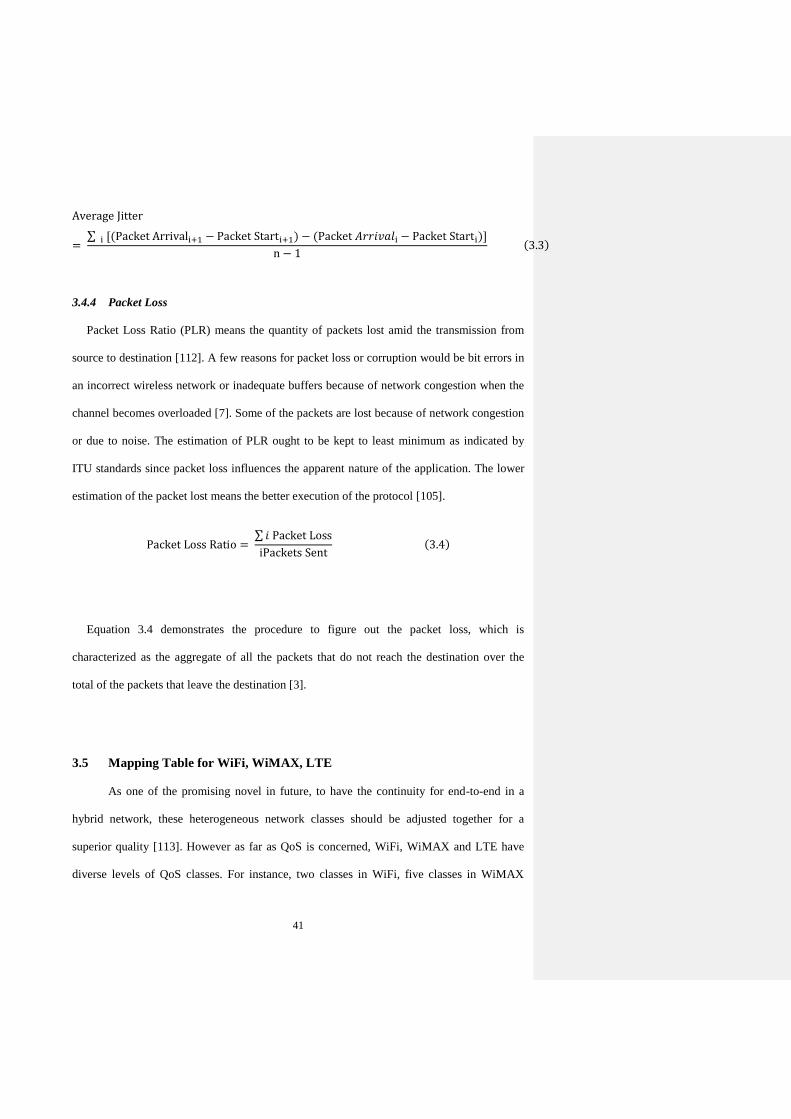
41
Average Jitter
= ∑ i [(Packet Arrivali+1 − Packet Starti+1) − (Packet 𝐴𝑟𝑟𝑖𝑣𝑎𝑙i − Packet Starti)]
n − 1 (3.3)
3.4.4 Packet Loss
Packet Loss Ratio (PLR) means the quantity of packets lost amid the transmission from
source to destination [112]. A few reasons for packet loss or corruption would be bit errors in
an incorrect wireless network or inadequate buffers because of network congestion when the
channel becomes overloaded [7]. Some of the packets are lost because of network congestion
or due to noise. The estimation of PLR ought to be kept to least minimum as indicated by
ITU standards since packet loss influences the apparent nature of the application. The lower
estimation of the packet lost means the better execution of the protocol [105].
Packet Loss Ratio = ∑ 𝑖 Packet Loss
iPackets Sent (3.4)
Equation 3.4 demonstrates the procedure to figure out the packet loss, which is
characterized as the aggregate of all the packets that do not reach the destination over the
total of the packets that leave the destination [3].
3.5 Mapping Table for WiFi, WiMAX, LTE
As one of the promising novel in future, to have the continuity for end-to-end in a
hybrid network, these heterogeneous network classes should be adjusted together for a
superior quality [113]. However as far as QoS is concerned, WiFi, WiMAX and LTE have
diverse levels of QoS classes. For instance, two classes in WiFi, five classes in WiMAX
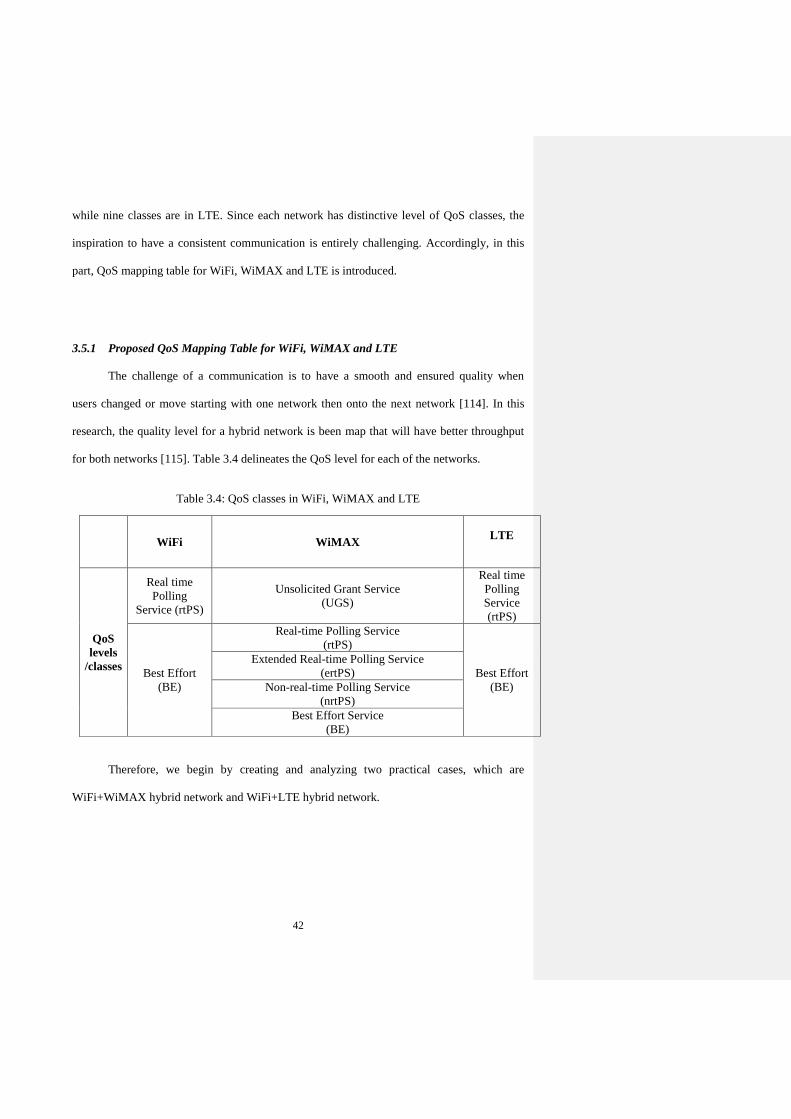
42
while nine classes are in LTE. Since each network has distinctive level of QoS classes, the
inspiration to have a consistent communication is entirely challenging. Accordingly, in this
part, QoS mapping table for WiFi, WiMAX and LTE is introduced.
3.5.1 Proposed QoS Mapping Table for WiFi, WiMAX and LTE
The challenge of a communication is to have a smooth and ensured quality when
users changed or move starting with one network then onto the next network [114]. In this
research, the quality level for a hybrid network is been map that will have better throughput
for both networks [115]. Table 3.4 delineates the QoS level for each of the networks.
Table 3.4: QoS classes in WiFi, WiMAX and LTE
WiFi WiMAX LTE
QoS
levels
/classes
Real time
Polling
Service (rtPS)
Unsolicited Grant Service
(UGS)
Real time
Polling
Service
(rtPS)
Best Effort
(BE)
Real-time Polling Service
(rtPS)
Best Effort
(BE)
Extended Real-time Polling Service
(ertPS)
Non-real-time Polling Service
(nrtPS)
Best Effort Service
(BE)
Therefore, we begin by creating and analyzing two practical cases, which are
WiFi+WiMAX hybrid network and WiFi+LTE hybrid network.

43
3.5.1.1 QoS Mapping for WiFi+WiMAX Network
Figure 3.1 shows the diagram of the hybrid WiFi+WiMAX network. In this figure, we
considered the most generic case when up to M WiFi users could be connected to any of the
N WiMAX Client Premises Equipment (CPE). Such an architecture covers a wide range of
applications, from basic internet browsing to environmental monitoring to healthcare and
security [116][117].

44
Figure 3.1: Hybrid WiFi + WiMAX network
WiFi 1
rtPS
Wireless
IP
Modem
rtPS rtPS BE BE
Wireless
IP
Modem
Wireless
IP
Modem
Wireless
IP
Modem
Wireless
IP
Modem
WiFi 2
Wireless
IP
Modem
BE
Wireless
IP
Modem
ertPS
Wireless
IP
Modem
nrtPS
WiFi 3
Wireless
IP
Modem
Wireless
IP
Modem
rtPS
BE
WiFi 4
Wireless
IP
Modem
UGS
B
S
T
Wireless IP
Modem rtPS
Wireless IP
Modem
Wireless IP
Modem
Wireless IP
Modem
Wireless IP
Modem
Wireless IP
Modem
Wireless IP
Modem
Wireless IP
Modem
Wireless IP
Modem
Wireless IP
Modem
rtPS
rtPS
rtPS
BE
BE
BE
BE
BE
BE
Wireless
IP
Modem
rtPS
WiMAX
Wireless
IP
Modem
BE
WiFi 5
Wireless IP
Modem
Wireless IP
Modem
Wireless IP
Modem
Wireless IP
Modem
Wireless IP
Modem
Wireless IP
Modem
Wireless IP
Modem
Wireless IP
Modem
Wireless IP
Modem
Wireless IP
Modem
Wireless IP
Modem
Wireless IP
Modem
Wireless IP
Modem
Wireless IP
Modem
Wireless IP
Modem
rtPS
rtPS
BE
BE
BE
BE
BE
BE
BE
BE
BE
BE
BE
BE
BE

45
Table 3.5 shows the proposed end-to-end QoS mapping in the above defined
WiFi+WiMAX network. This mapping will be used in the analysis of the next section to
ensure its ability to carry the required QoS.
Table 3.5: Mapping of WiFi to WiMAX QoS Classes
Application Examples WiFi QoS
Classes
WiMAX QoS Classes
Real Time
Applications
VoIP & Video
conference Services
Real Time
Polling Service
(rtPS)
Unsolicited Grant
Service (UGS)
Real-time Polling
Service
(rtPS)
Multimedia Streaming,
Multiparty Gaming
Services
Extended Real-time
Polling Service
(ertPS)
Non-Real Time
Applications
Web browsing, File
Transfer Services
Best Effort
Service
(BE)
Non-real-time Polling
Service
(nrtPS)
MMS & Email Services Best Effort Service
(BE)
Table 3.5 shows the division process of 5 QoS in WiMAX into two separate sub –
classes; Real Time Applications and Non-Real Time Applications. The UGS, rtPS and ertPS
WiMAX QoS Classes are assigned to the Real Time Applications meanwhile nrtPS and BE
are to the Non-Real Time Applications Sub-Classes. The process of these separations are
based on the applications assigned to each WiMAX QoS Classes as illustrated in Table 3.2
which are based on real time and non-real time applications. Therefore, all the WiMAX QoS
Classes in the Real Time Application Sub-Classes are mapped to the rtPS in the WiFi QoS
Classes as shown in Table 3.5 as green colour. Whereas, the indicator of orange colour
represents the remaining WiMAX QoS Classes which are nrtPS and BE that maps to BE in
WiFi QoS Classes.

46
3.5.1.2 QoS Mapping for WiFi+LTE Network
Figure 3.2 shows the hybrid network architecture consisting of WiFi and LTE
networks. This configuration is similar to the previous WiFi + WiMAX scenario; which in
this case, there are 5 users in the LTE that are connected to 5 different WiFi scenarios.
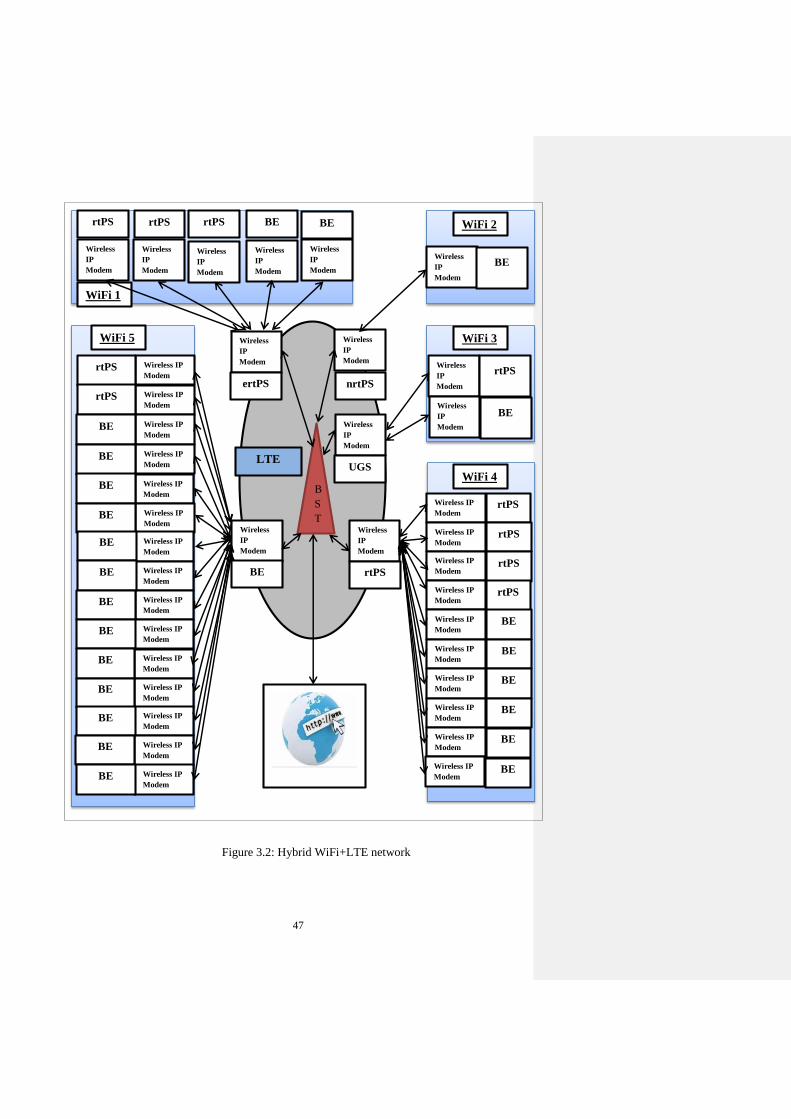
47
Figure 3.2: Hybrid WiFi+LTE network
WiFi 1
rtPS
Wireless
IP
Modem
rtPS rtPS BE BE
Wireless
IP
Modem
Wireless
IP
Modem
Wireless
IP
Modem
Wireless
IP
Modem
WiFi 2
Wireless
IP
Modem
BE
Wireless
IP
Modem
ertPS
Wireless
IP
Modem
nrtPS
WiFi 3
Wireless
IP
Modem
Wireless
IP
Modem
rtPS
BE
WiFi 4
Wireless
IP
Modem
UGS
B
S
T
Wireless IP
Modem rtPS
Wireless IP
Modem
Wireless IP
Modem
Wireless IP
Modem
Wireless IP
Modem
Wireless IP
Modem
Wireless IP
Modem
Wireless IP
Modem
Wireless IP
Modem
Wireless IP
Modem
rtPS
rtPS
rtPS
BE
BE
BE
BE
BE
BE
Wireless
IP
Modem
rtPS
LTE
Wireless
IP
Modem
BE
WiFi 5
Wireless IP
Modem
Wireless IP
Modem
Wireless IP
Modem
Wireless IP
Modem
Wireless IP
Modem
Wireless IP
Modem
Wireless IP
Modem
Wireless IP
Modem
Wireless IP
Modem
Wireless IP
Modem
Wireless IP
Modem
Wireless IP
Modem
Wireless IP
Modem
Wireless IP
Modem
Wireless IP
Modem
rtPS
rtPS
BE
BE
BE
BE
BE
BE
BE
BE
BE
BE
BE
BE
BE
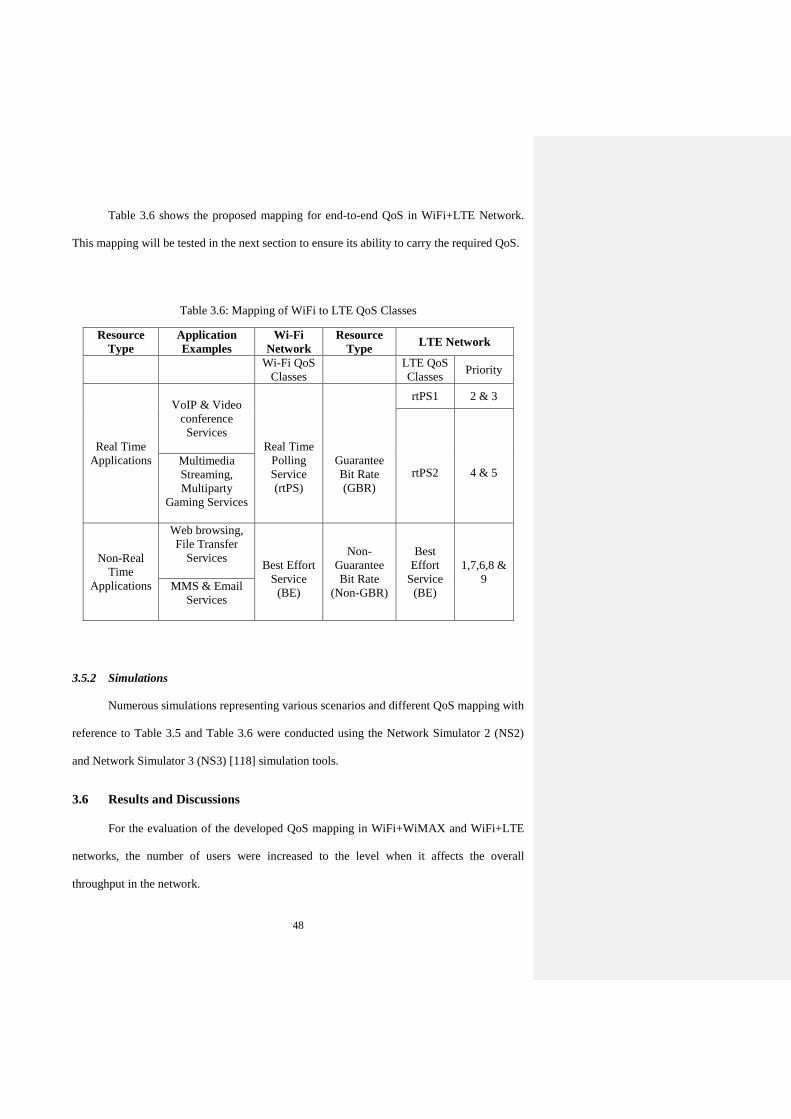
48
Table 3.6 shows the proposed mapping for end-to-end QoS in WiFi+LTE Network.
This mapping will be tested in the next section to ensure its ability to carry the required QoS.
Table 3.6: Mapping of WiFi to LTE QoS Classes
Resource
Type
Application
Examples
Wi-Fi
Network
Resource
Type LTE Network
Wi-Fi QoS
Classes
LTE QoS
Classes Priority
Real Time
Applications
VoIP & Video
conference
Services
Real Time
Polling
Service
(rtPS)
Guarantee
Bit Rate
(GBR)
rtPS1 2 & 3
rtPS2
4 & 5 Multimedia
Streaming,
Multiparty
Gaming Services
Non-Real
Time
Applications
Web browsing,
File Transfer
Services
Best Effort
Service
(BE)
Non-
Guarantee
Bit Rate
(Non-GBR)
Best
Effort
Service
(BE)
1,7,6,8 &
9
MMS & Email
Services
3.5.2 Simulations
Numerous simulations representing various scenarios and different QoS mapping with
reference to Table 3.5 and Table 3.6 were conducted using the Network Simulator 2 (NS2)
and Network Simulator 3 (NS3) [118] simulation tools.
3.6 Results and Discussions
For the evaluation of the developed QoS mapping in WiFi+WiMAX and WiFi+LTE
networks, the number of users were increased to the level when it affects the overall
throughput in the network.
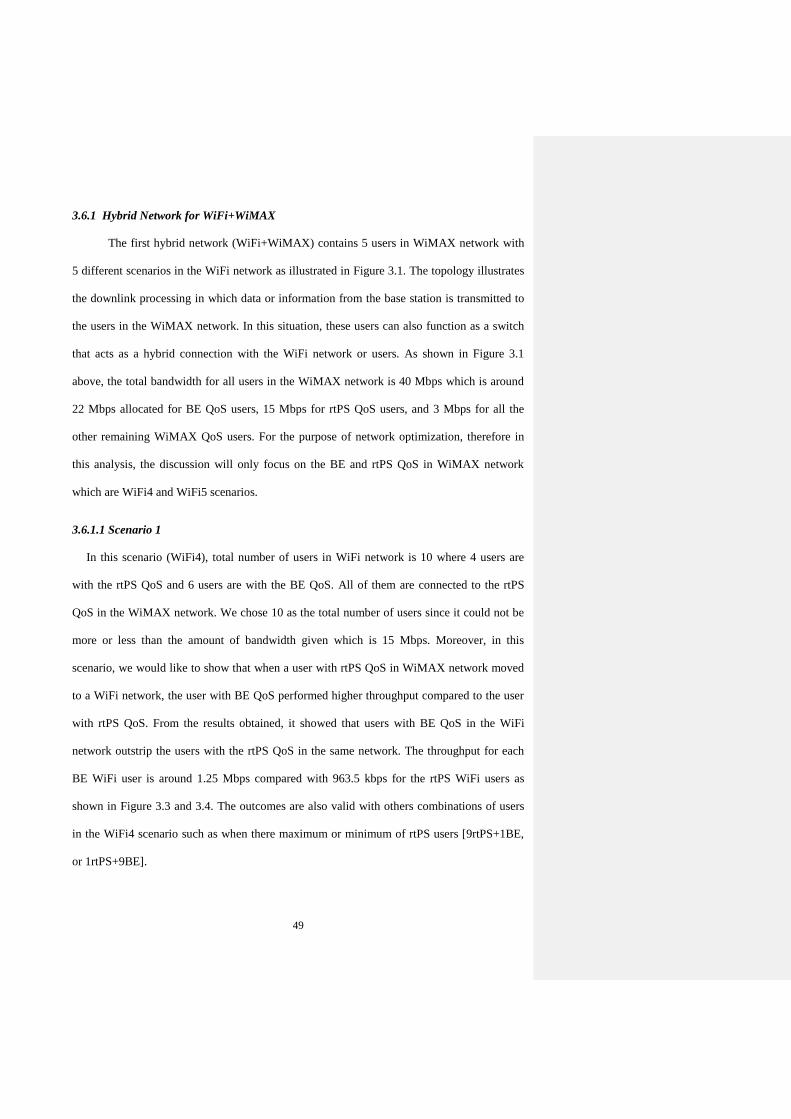
49
3.6.1 Hybrid Network for WiFi+WiMAX
The first hybrid network (WiFi+WiMAX) contains 5 users in WiMAX network with
5 different scenarios in the WiFi network as illustrated in Figure 3.1. The topology illustrates
the downlink processing in which data or information from the base station is transmitted to
the users in the WiMAX network. In this situation, these users can also function as a switch
that acts as a hybrid connection with the WiFi network or users. As shown in Figure 3.1
above, the total bandwidth for all users in the WiMAX network is 40 Mbps which is around
22 Mbps allocated for BE QoS users, 15 Mbps for rtPS QoS users, and 3 Mbps for all the
other remaining WiMAX QoS users. For the purpose of network optimization, therefore in
this analysis, the discussion will only focus on the BE and rtPS QoS in WiMAX network
which are WiFi4 and WiFi5 scenarios.
3.6.1.1 Scenario 1
In this scenario (WiFi4), total number of users in WiFi network is 10 where 4 users are
with the rtPS QoS and 6 users are with the BE QoS. All of them are connected to the rtPS
QoS in the WiMAX network. We chose 10 as the total number of users since it could not be
more or less than the amount of bandwidth given which is 15 Mbps. Moreover, in this
scenario, we would like to show that when a user with rtPS QoS in WiMAX network moved
to a WiFi network, the user with BE QoS performed higher throughput compared to the user
with rtPS QoS. From the results obtained, it showed that users with BE QoS in the WiFi
network outstrip the users with the rtPS QoS in the same network. The throughput for each
BE WiFi user is around 1.25 Mbps compared with 963.5 kbps for the rtPS WiFi users as
shown in Figure 3.3 and 3.4. The outcomes are also valid with others combinations of users
in the WiFi4 scenario such as when there maximum or minimum of rtPS users [9rtPS+1BE,
or 1rtPS+9BE].
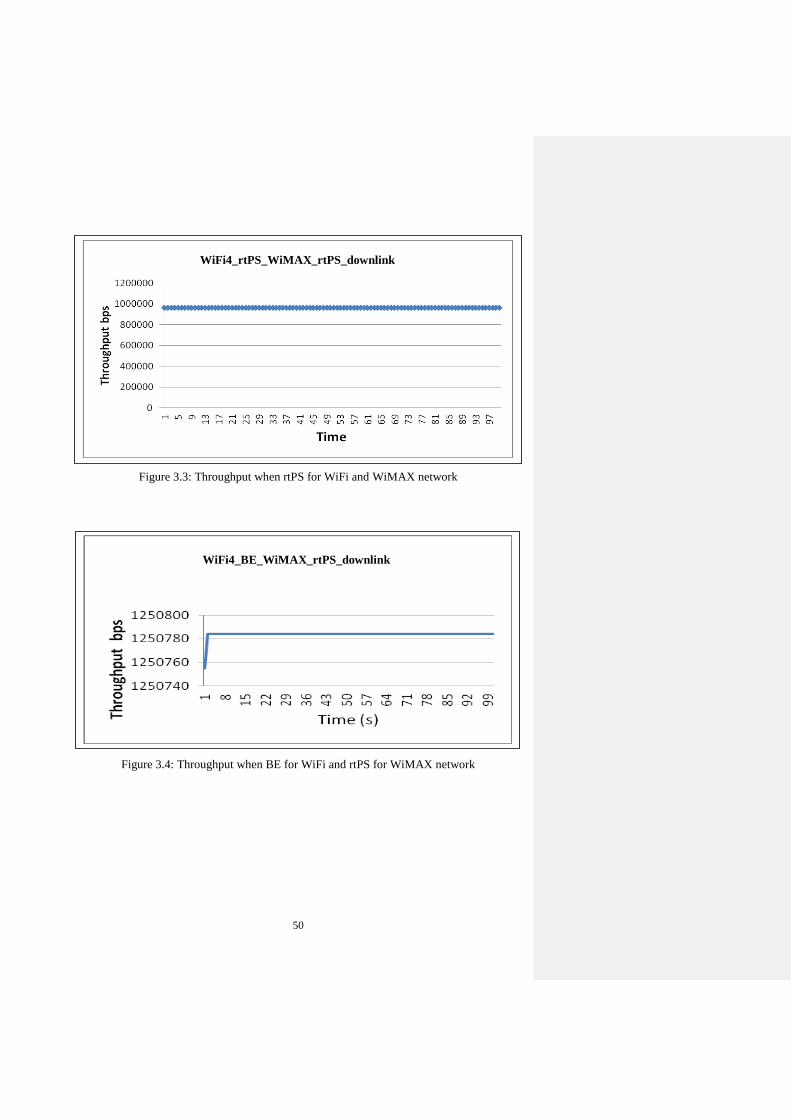
50
Figure 3.3: Throughput when rtPS for WiFi and WiMAX network
Figure 3.4: Throughput when BE for WiFi and rtPS for WiMAX network
WiFi4_rtPS_WiMAX_rtPS_downlink
WiFi4_BE_WiMAX_rtPS_downlink
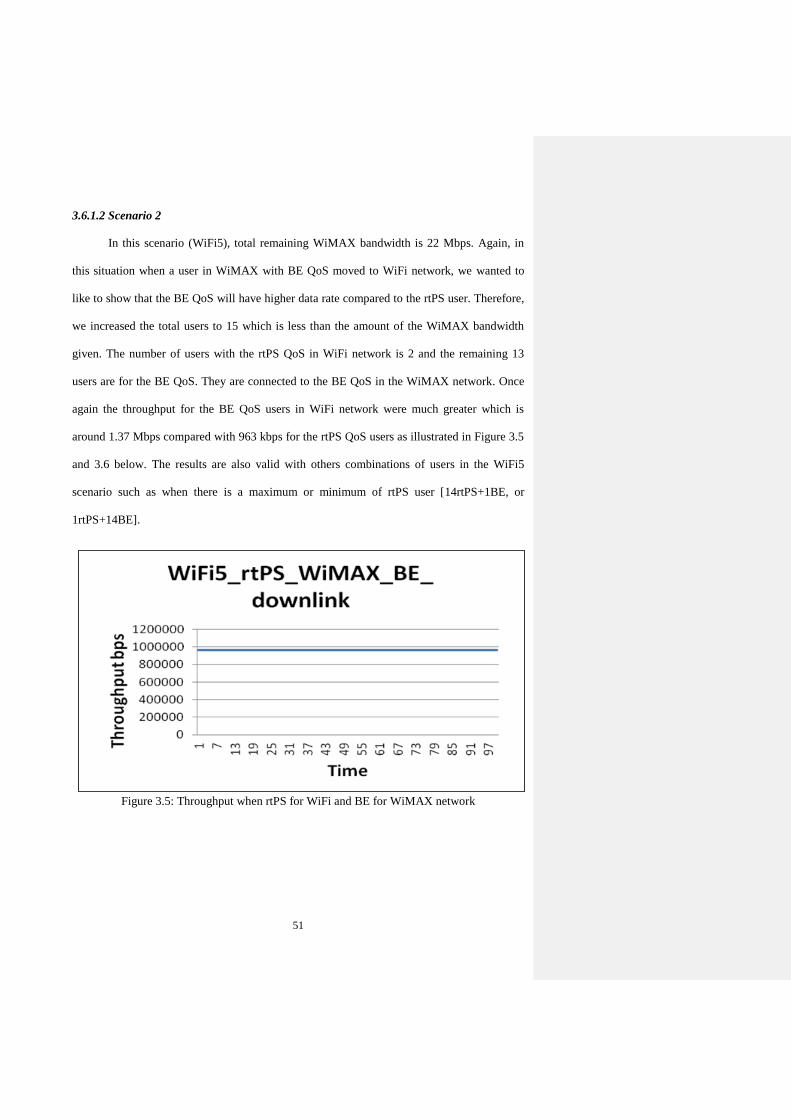
51
3.6.1.2 Scenario 2
In this scenario (WiFi5), total remaining WiMAX bandwidth is 22 Mbps. Again, in
this situation when a user in WiMAX with BE QoS moved to WiFi network, we wanted to
like to show that the BE QoS will have higher data rate compared to the rtPS user. Therefore,
we increased the total users to 15 which is less than the amount of the WiMAX bandwidth
given. The number of users with the rtPS QoS in WiFi network is 2 and the remaining 13
users are for the BE QoS. They are connected to the BE QoS in the WiMAX network. Once
again the throughput for the BE QoS users in WiFi network were much greater which is
around 1.37 Mbps compared with 963 kbps for the rtPS QoS users as illustrated in Figure 3.5
and 3.6 below. The results are also valid with others combinations of users in the WiFi5
scenario such as when there is a maximum or minimum of rtPS user [14rtPS+1BE, or
1rtPS+14BE].
Figure 3.5: Throughput when rtPS for WiFi and BE for WiMAX network
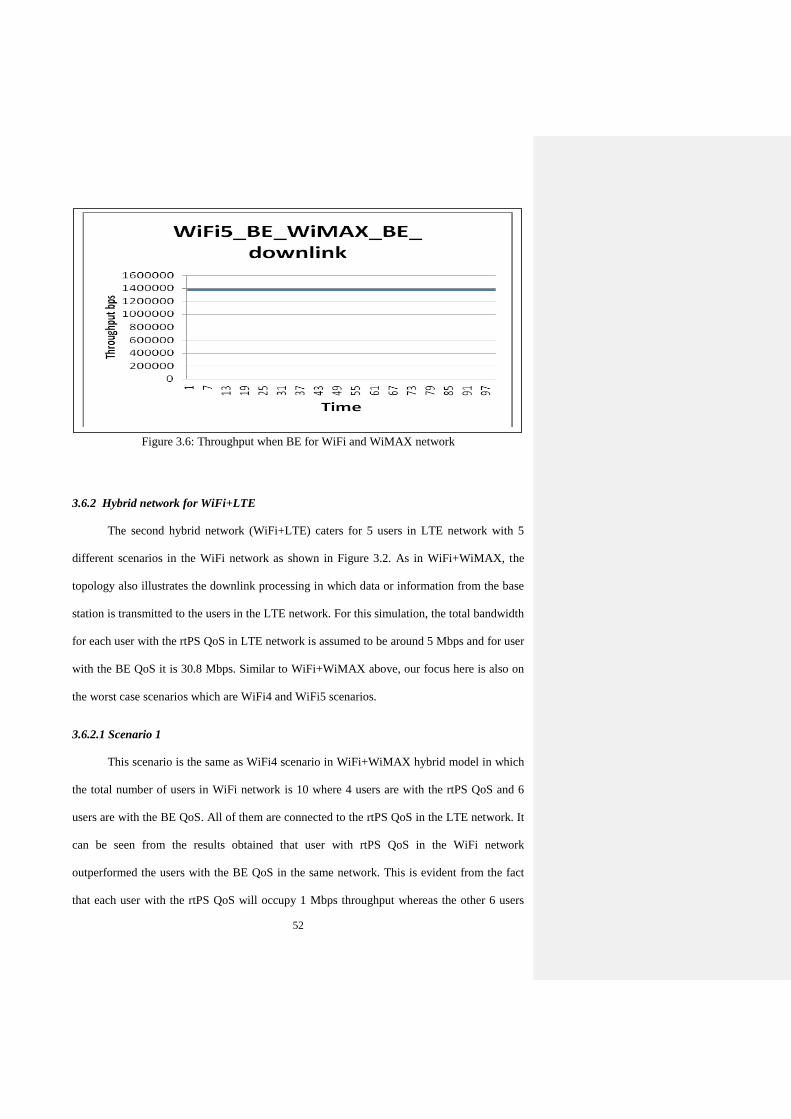
52
Figure 3.6: Throughput when BE for WiFi and WiMAX network
3.6.2 Hybrid network for WiFi+LTE
The second hybrid network (WiFi+LTE) caters for 5 users in LTE network with 5
different scenarios in the WiFi network as shown in Figure 3.2. As in WiFi+WiMAX, the
topology also illustrates the downlink processing in which data or information from the base
station is transmitted to the users in the LTE network. For this simulation, the total bandwidth
for each user with the rtPS QoS in LTE network is assumed to be around 5 Mbps and for user
with the BE QoS it is 30.8 Mbps. Similar to WiFi+WiMAX above, our focus here is also on
the worst case scenarios which are WiFi4 and WiFi5 scenarios.
3.6.2.1 Scenario 1
This scenario is the same as WiFi4 scenario in WiFi+WiMAX hybrid model in which
the total number of users in WiFi network is 10 where 4 users are with the rtPS QoS and 6
users are with the BE QoS. All of them are connected to the rtPS QoS in the LTE network. It
can be seen from the results obtained that user with rtPS QoS in the WiFi network
outperformed the users with the BE QoS in the same network. This is evident from the fact
that each user with the rtPS QoS will occupy 1 Mbps throughput whereas the other 6 users
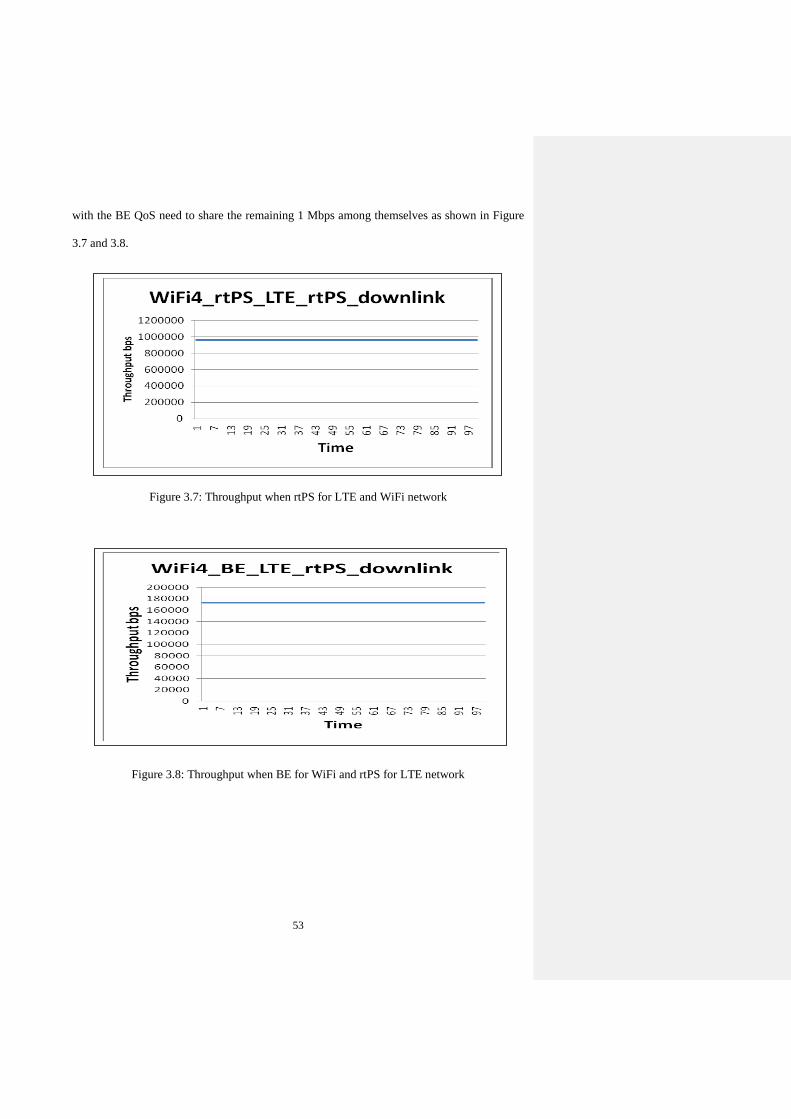
53
with the BE QoS need to share the remaining 1 Mbps among themselves as shown in Figure
3.7 and 3.8.
Figure 3.7: Throughput when rtPS for LTE and WiFi network
Figure 3.8: Throughput when BE for WiFi and rtPS for LTE network
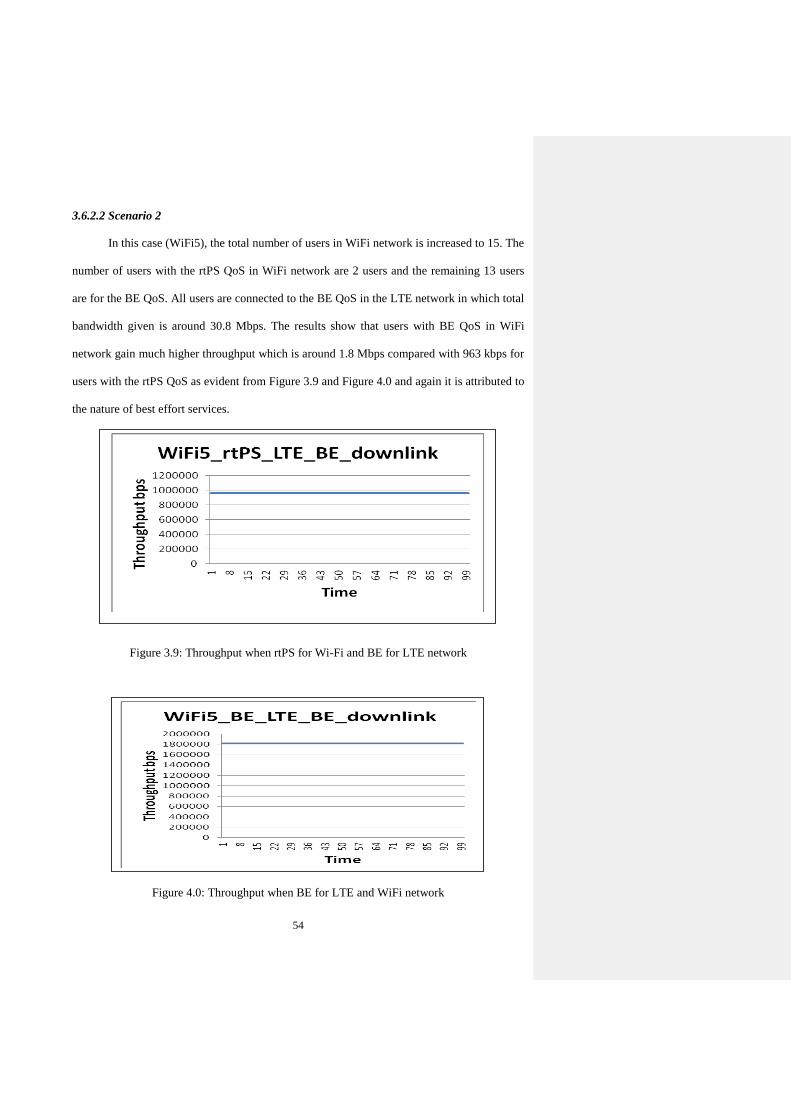
54
3.6.2.2 Scenario 2
In this case (WiFi5), the total number of users in WiFi network is increased to 15. The
number of users with the rtPS QoS in WiFi network are 2 users and the remaining 13 users
are for the BE QoS. All users are connected to the BE QoS in the LTE network in which total
bandwidth given is around 30.8 Mbps. The results show that users with BE QoS in WiFi
network gain much higher throughput which is around 1.8 Mbps compared with 963 kbps for
users with the rtPS QoS as evident from Figure 3.9 and Figure 4.0 and again it is attributed to
the nature of best effort services.
Figure 3.9: Throughput when rtPS for Wi-Fi and BE for LTE network
Figure 4.0: Throughput when BE for LTE and WiFi network
55
3.7 Summary
In this section, we have presented a new approach for designing QoS maps for hybrid
networks particularly for two of the most widely used cases of hybrid networks:
WiFi+WiMAX and WiFi+LTE. The main task of these models was to illustrate how the
system parameters changed depending on information transmitted with the various QoS
classes through a hybrid network. A major parameter in the functioning of the presented
network is the users’ throughput. The simulation provided us with the following conclusion:
depending on the network load, the worst class of QoS priority can be the best option
for the user. It was explained not only using theory but also by providing practical
explanation with actual parameters of the hybrid network. This is due to the
theoretical characteristic of the rtPS QoS, which is designed to support real-time
service flow. In contrast, BE QoS is designed for non-real-time applications where no
service guarantee is provided and therefore control services on a best available basis.
Therefore, in order to accentuate the merit of the BE QoS, we investigated a variety of
users’ scenarios and validated them through simulations. Taking Scenario 1 and
Scenario 2 for WiFi+LTE hybrid network for example, in this situation the LTE
network will intuitively decide to connect the WiFi users with the LTE rtPS QoS.
This is to ensure that all the WiFi rtPS users will have the best and stable throughput.
However, this LTE rtPS switch/user can only manage to support up to 4 WiFi rtPS
users or else there is no slot available for the WiFi BE user. Meanwhile if there is a
large number of WiFi users, they have to be connected to the LTE BE QoS. This
unique hybrid network can support up to more than 30 WiFi users where at this point
the WiFi BE user’s throughput is still better than that of the WiFi rtPS user.

56
Hence, it can be concluded that although BE QoS is the cheapest pricing or probably
the most unwanted QoS model, it still possesses satisfying network accomplishment.
Throughput obtained for rtPS and BE QoS shown in the mapping tables indicates that:
Summary WiMAX bandwidth Indicator Users
BE<rtPS Total WiMAX bandwidth < Total number of users
BE=rtPS Total WiMAX bandwidth = Total number of users
BE>rtPS Total WiMAX bandwidth > Total number of users
57
Chapter 4: Simulation Environment
One of a cost-effective way of evaluating the performance of a system is by using a
simulation process. The simulation procedures aim to investigate the behavior of the
theoretical models in pre-defined and customized environments, and, if possible, to compare
and contradict them with real data of live networks. Simulations may also shorten the time in
getting the end results which may take longer time in a real-system. By employing the
original parameter applied in a real-system, the simulation can be made simpler without
scarifying to the correctness of the end results.
Since we are using the simulation tool for the previous and for next remaining chapters,
in this section we will discuss the simulation tools accessible for WiMAX and WiFi.
Followed by the description of Optimization of Network Engineering Tool (Opnet)
Simulation Tool, which we used in our research. Next, we will present a layout on the
simulation environment in Opnet and also the components accessible for WiMAX and WiFi
modules in Opnet. Finally, we will illustrate the simulations conducted for WiMAX system
particulary for a disaster management situation.
4.1 Simulation Tools for WiMAX System
There are several network simulation programs such as Qualnet, Network Simulation
2 (NS2), Network Simulation 3 (NS3) and Opnet modeler that can be used to simulate
wireless network, including WiMAX network [119]. Each program differs from the other,
both in terms of the ease and the ability to use with their own advantages and disadvantage.
NS2 and NS3 are a discrete-occasion system test systems, basically expected for examination
and instructive applications. NS3 is free programming, authorized under the GNU GPLv2
permit, and it is openly accessible for exploration, and improvement [120]. On the other
hand, as one of the leading simulators for network research and development, OPNET [121]
Commented [ez5]: I am unsure of what you mean here. I don’t
think scarifying is the appropriate term to use unless this is a
technical term.
58
provides a powerful simulation capability for the study of network architectures and
protocols. It is widely used in both industry and academia. Compared to another well-known
simulator NS2 [118], OPNET has a well-engineered user- interface using mainstream
software and operating system, which are attractive to network operators. Another reason to
choose OPNET is the fact that it contains a vast number of models for commercially
available network elements and has various real-life network configuration capabilities,
which makes the simulation of real-life networks close to reality and it is recognized for its
high reliability [122] . Therefore, in this chapter and mostly for all the projects involved in
my research, I chose to use the Opnet Modeler 16.5 simulation tool for the simulation
purpose.
4.2 Opnet Simulation Tools
Opnet is a research oriented network simulation tool that provides a development
environment for modeling and simulation of deployed wired as well as wireless networks. It
is otherwise called an exceedingly advanced simulation software package that enables
developers to model communications networks and distribute systems, and provide multiple
solutions for managing networks and applications such as network operation, planning,
research and development (R&D), network engineering and performance management [123].
Opnet uses a hierarchical strategy to organize all the models to build a whole network and
allows them to analyse the behaviour and performance of modelled systems through Discrete
Event Simulations (DES) [124]. Other features of OPNET include graphical user interface
(GUI) interface, comprehensive library of network protocols and models, source code for all
models, graphical results and statistics, etc [106]. Some of the possible wireless
communication technologies that can be simulated in OPNET are Mobile Ad-Hoc Network
(MANET), 802.11, 3G/4G, Ultra-Wide Band, WiMAX, LTE, Bluetooth, and ZigBee [125].
59
Simulating a scenario can overcome constraints of proprietary hardware and software such as
lack of development tools. Therefore, OPNET is of the most popular, accurate and
applicable in the real world in the field of network simulation. Briefly, OPNET MODELER
was selected, due to the following abilities [126]:
a) Provides a comprehensive development environment supporting the modelling of real
life network configurations.
b) Performes discrete-event simulation tool with a convenient development environment.
c) Provides graphical user interfaces known as editors to capture the specifications of
deployed networks, equipment, and protocols.
d) Opnet modeler has a library of models for most of the common networks around us.
e) This software is mostly used in the Research and Development (R&D) techniques for
students, lecturers, engineers, and researchers.
A simulation in OPNET is divided into a three-tiered structure, namely: network
model, node model, and process model as shown in figures 2,3, and 4 [106] . The top layer is
the network layer that reflects the topology of the network, the middle layer is the node layer
that is composed of the corresponding protocol models and reflects the characteristics of the
equipment, and the bottom layer is the process model that is described by finite state
machines. The three tier model fully corresponds to the actual network, protocol and
equipment, and it can reflect the relevant characteristics of the network.
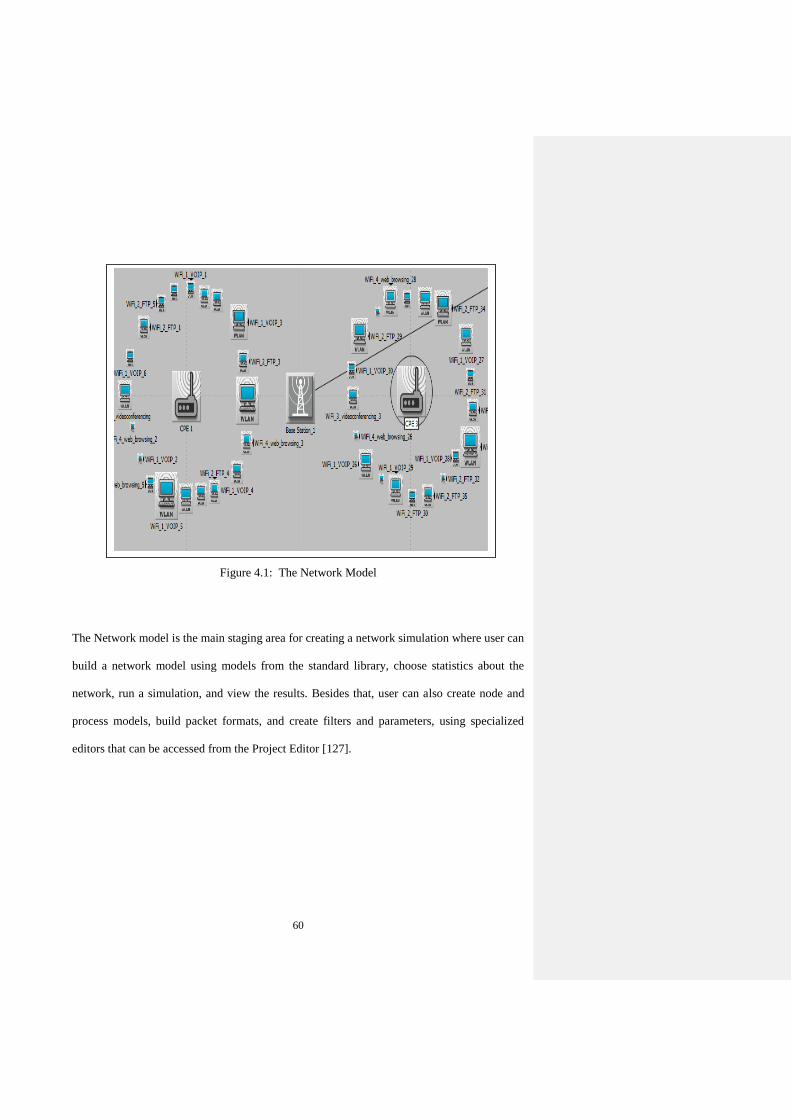
60
Figure 4.1: The Network Model
The Network model is the main staging area for creating a network simulation where user can
build a network model using models from the standard library, choose statistics about the
network, run a simulation, and view the results. Besides that, user can also create node and
process models, build packet formats, and create filters and parameters, using specialized
editors that can be accessed from the Project Editor [127].
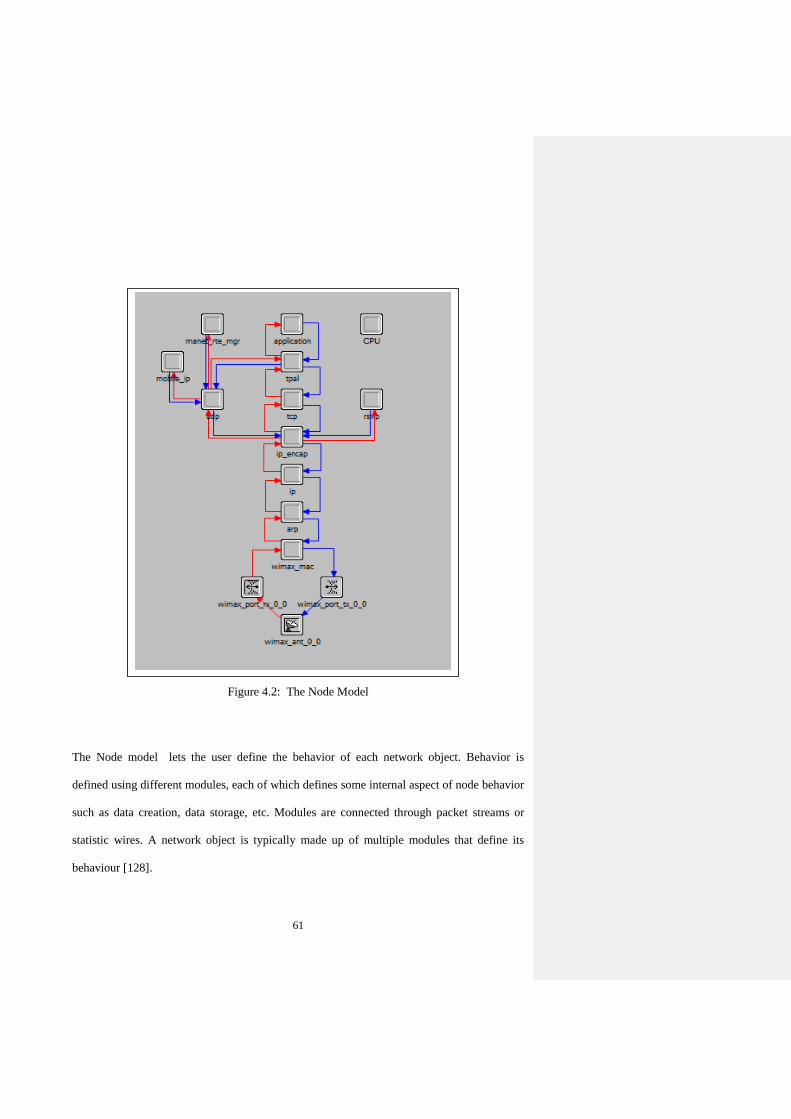
61
Figure 4.2: The Node Model
The Node model lets the user define the behavior of each network object. Behavior is
defined using different modules, each of which defines some internal aspect of node behavior
such as data creation, data storage, etc. Modules are connected through packet streams or
statistic wires. A network object is typically made up of multiple modules that define its
behaviour [128].
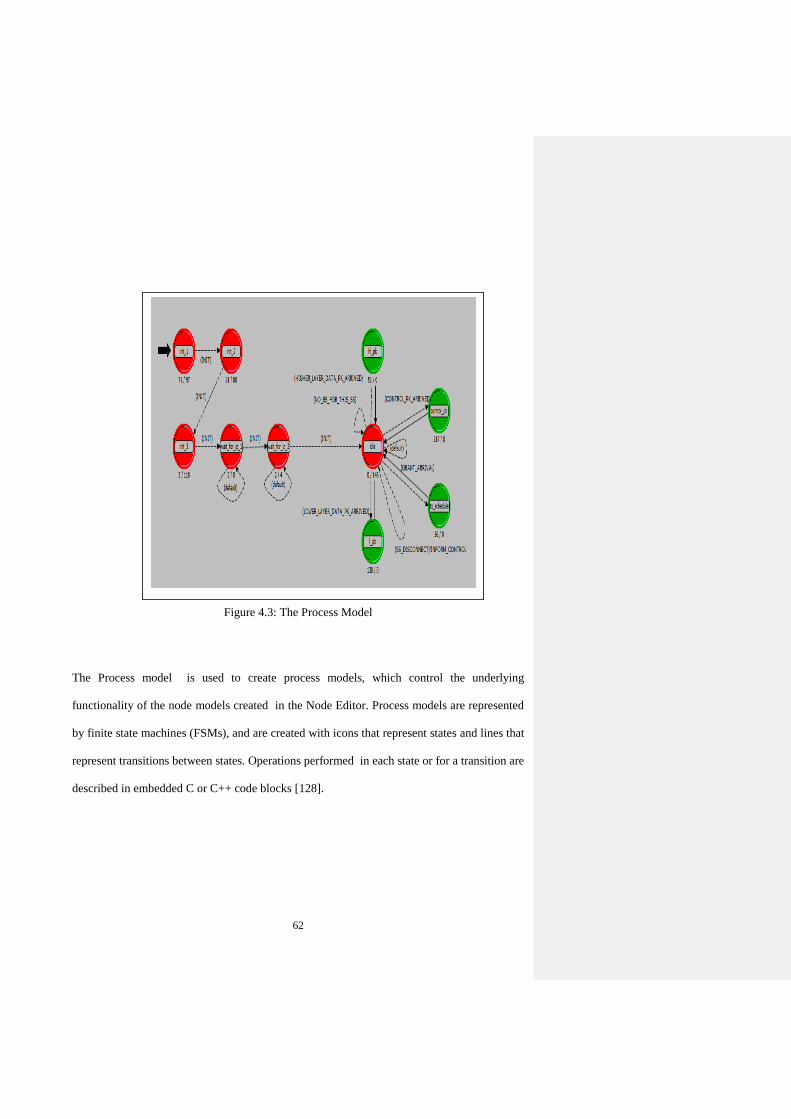
62
Figure 4.3: The Process Model
The Process model is used to create process models, which control the underlying
functionality of the node models created in the Node Editor. Process models are represented
by finite state machines (FSMs), and are created with icons that represent states and lines that
represent transitions between states. Operations performed in each state or for a transition are
described in embedded C or C++ code blocks [128].
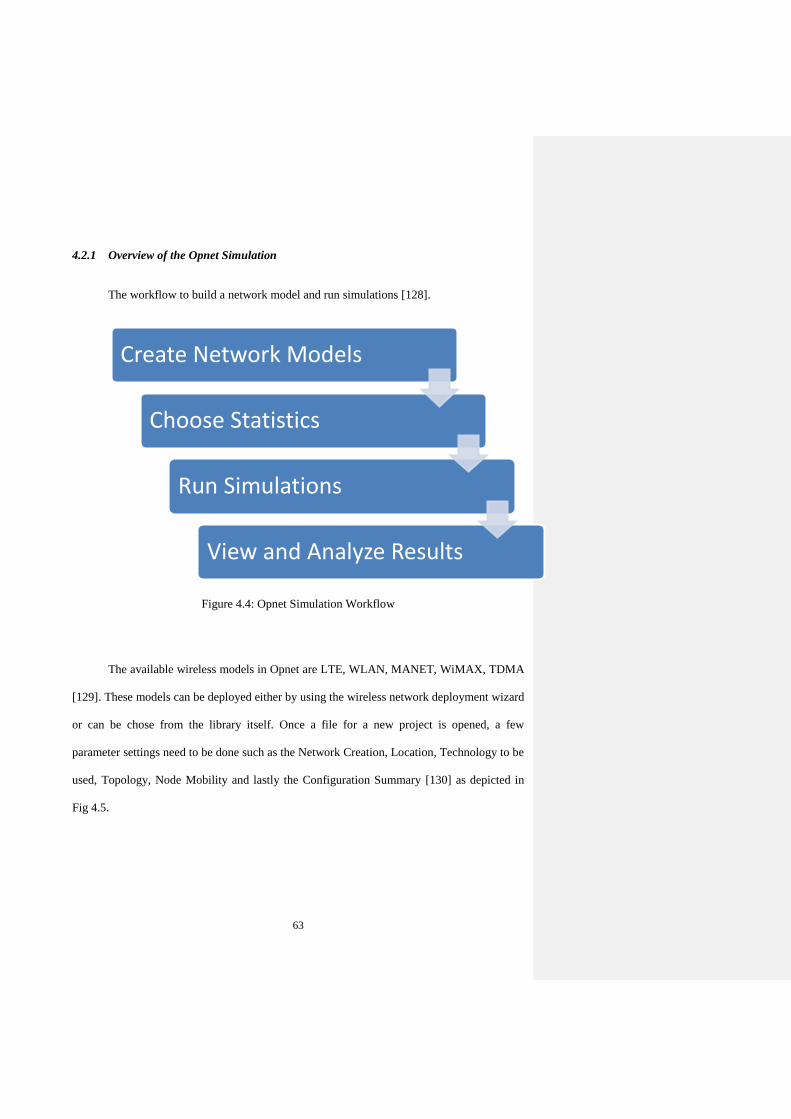
63
4.2.1 Overview of the Opnet Simulation
The workflow to build a network model and run simulations [128].
Figure 4.4: Opnet Simulation Workflow
The available wireless models in Opnet are LTE, WLAN, MANET, WiMAX, TDMA
[129]. These models can be deployed either by using the wireless network deployment wizard
or can be chose from the library itself. Once a file for a new project is opened, a few
parameter settings need to be done such as the Network Creation, Location, Technology to be
used, Topology, Node Mobility and lastly the Configuration Summary [130] as depicted in
Fig 4.5.
Create Network Models
Choose Statistics
Run Simulations
View and Analyze Results
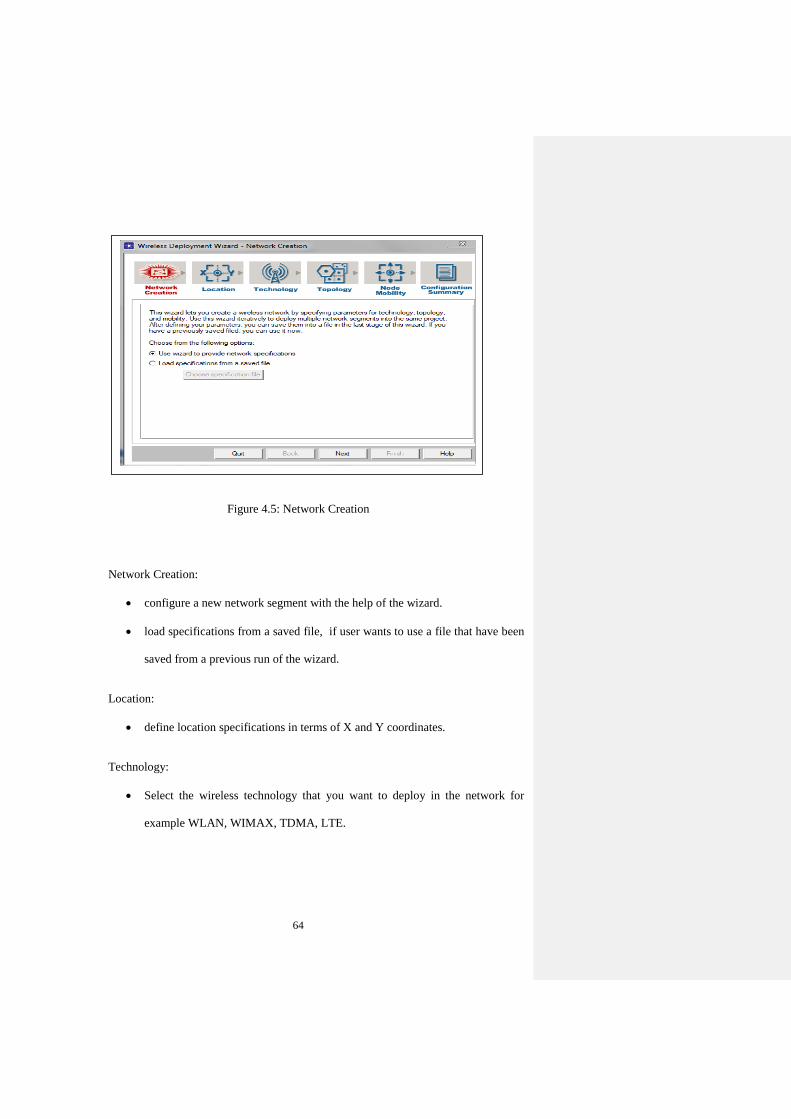
64
Figure 4.5: Network Creation
Network Creation:
configure a new network segment with the help of the wizard.
load specifications from a saved file, if user wants to use a file that have been
saved from a previous run of the wizard.
Location:
define location specifications in terms of X and Y coordinates.
Technology:
Select the wireless technology that you want to deploy in the network for
example WLAN, WIMAX, TDMA, LTE.

65
Topology:
Specify a geographical overlay for the wireless subnet which can be selected
from the drop down menu such as the area in square meters and number of
cells and the cell radius in kilometers.
Node Mobility:
Specify the node models with which to populate the network segment and
specify node mobility parameters for the wireless network segment.
Configuration Summary:
Reviews and shows the specifications entered and to save the file.
For each wireless network creation, there are other main important settings applied, which are
the Application Definition and Profile Definition as shown in Figure 4.6 and Figure 4.7
respectively.
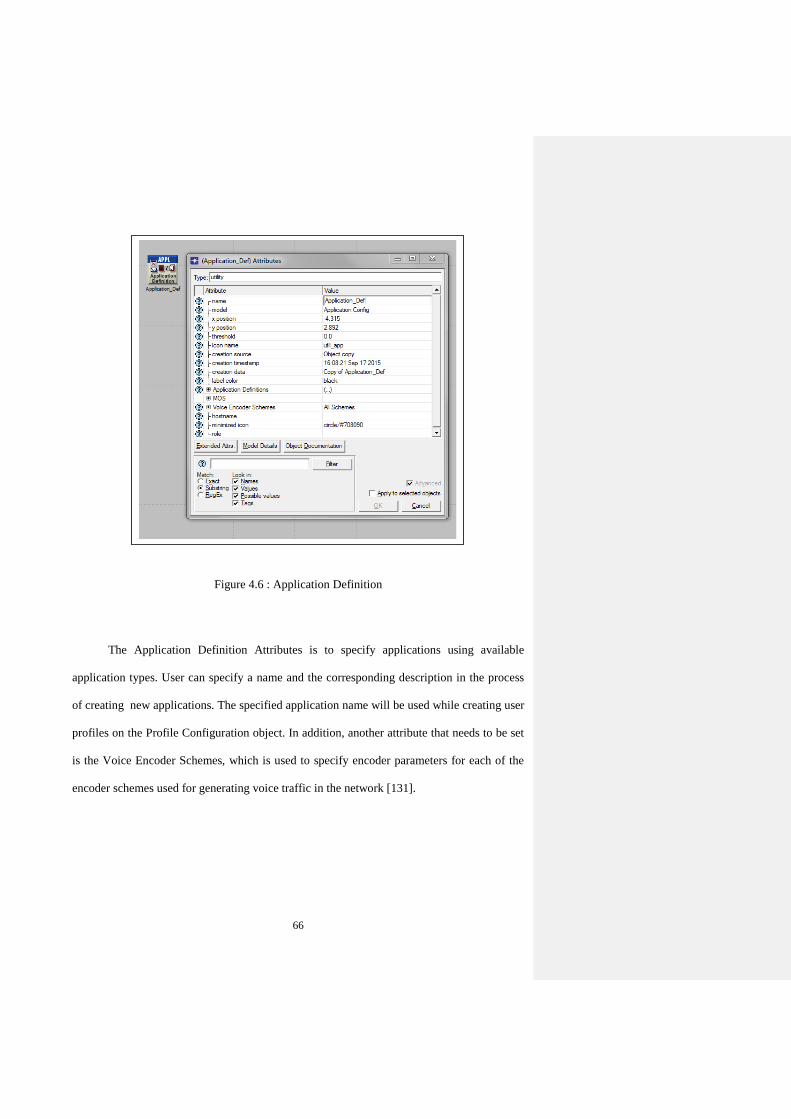
66
Figure 4.6 : Application Definition
The Application Definition Attributes is to specify applications using available
application types. User can specify a name and the corresponding description in the process
of creating new applications. The specified application name will be used while creating user
profiles on the Profile Configuration object. In addition, another attribute that needs to be set
is the Voice Encoder Schemes, which is used to specify encoder parameters for each of the
encoder schemes used for generating voice traffic in the network [131].
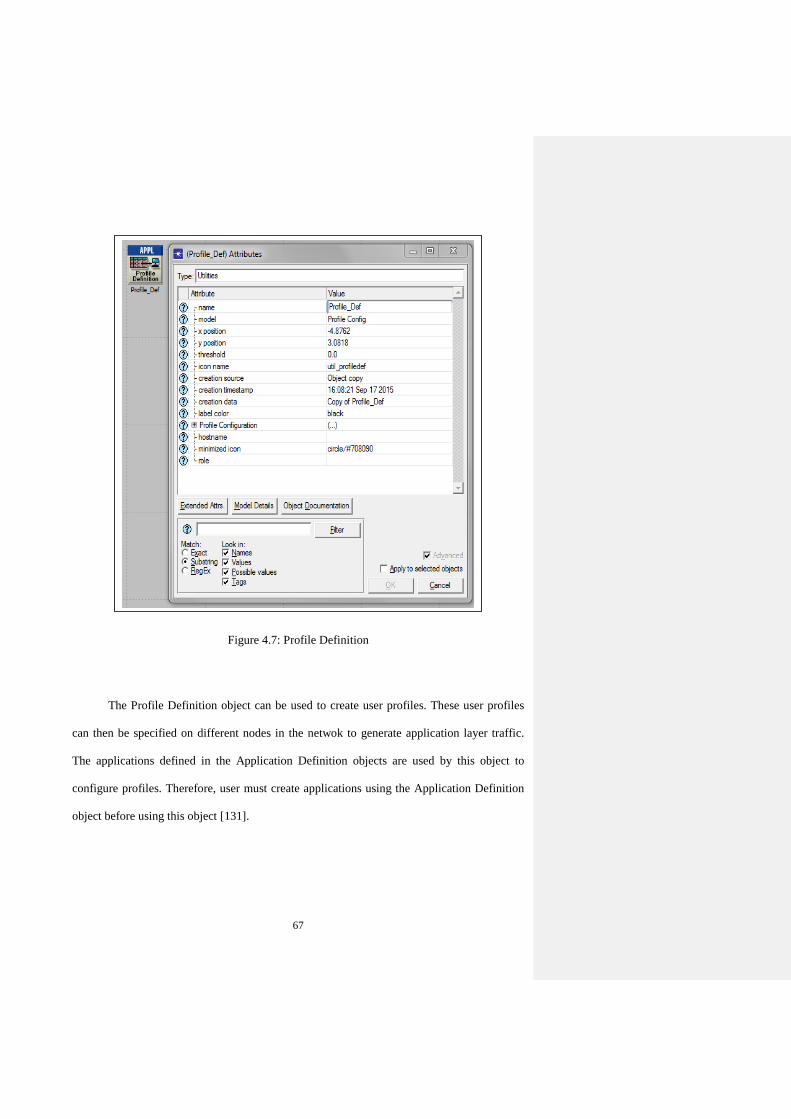
67
Figure 4.7: Profile Definition
The Profile Definition object can be used to create user profiles. These user profiles
can then be specified on different nodes in the netwok to generate application layer traffic.
The applications defined in the Application Definition objects are used by this object to
configure profiles. Therefore, user must create applications using the Application Definition
object before using this object [131].
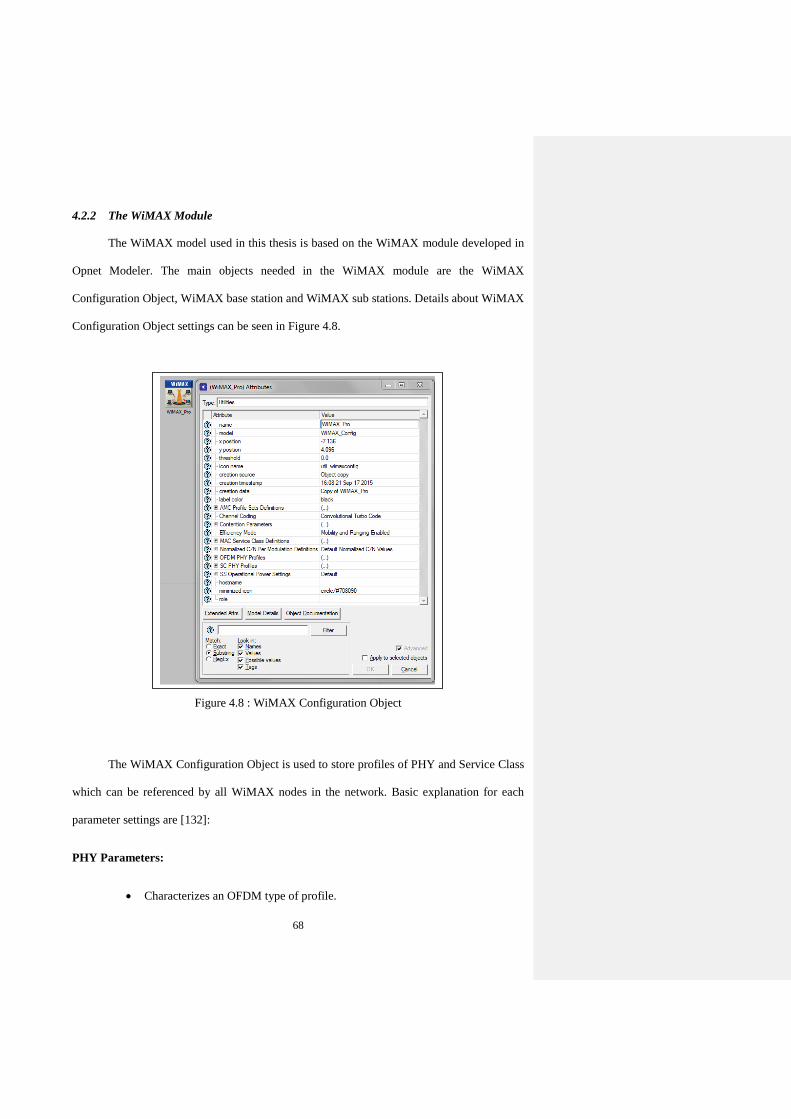
68
4.2.2 The WiMAX Module
The WiMAX model used in this thesis is based on the WiMAX module developed in
Opnet Modeler. The main objects needed in the WiMAX module are the WiMAX
Configuration Object, WiMAX base station and WiMAX sub stations. Details about WiMAX
Configuration Object settings can be seen in Figure 4.8.
Figure 4.8 : WiMAX Configuration Object
The WiMAX Configuration Object is used to store profiles of PHY and Service Class
which can be referenced by all WiMAX nodes in the network. Basic explanation for each
parameter settings are [132]:
PHY Parameters:
Characterizes an OFDM type of profile.

69
The frame structure to be used in the network.
Specifies the duplexing method with only TDD currently supported in the
model.
The frequency band in which the OFDMA channel functions.
MAC Parameters:
This attribute allows configuration of parameters that make up a service class. A
service class groups the QoS requirements of a service flow. Any service class
definition can be referenced by any other service flow (uplink/downlink) defined in
the network.
Specifies the service class name based on the service flow.
The scheduling type specifically to the bandwidth request or grant mechanism for any
connection of this class.
Maximum Sustained Traffic Rate which defines the peak rate for the traffic coming
from the higher layer to the 802.16 MAC.
Minimum Reserved Traffic Rate which specifies the minimum guaranteed data rate
for a given service flow of this class.
Maximum Latency that represents the time elapsed between two consecutive
allocations. Currently, this attributes only takes effect for UGS and ertPS connections.
Unsolicited Poll Interval which specifies the duration between two consecutive
unsolicited pools granted to all connections sharing this service slot. A poll is an
opportunity for sending a bandwidth request from the SS towards the BS, on behalf of
a given connection.
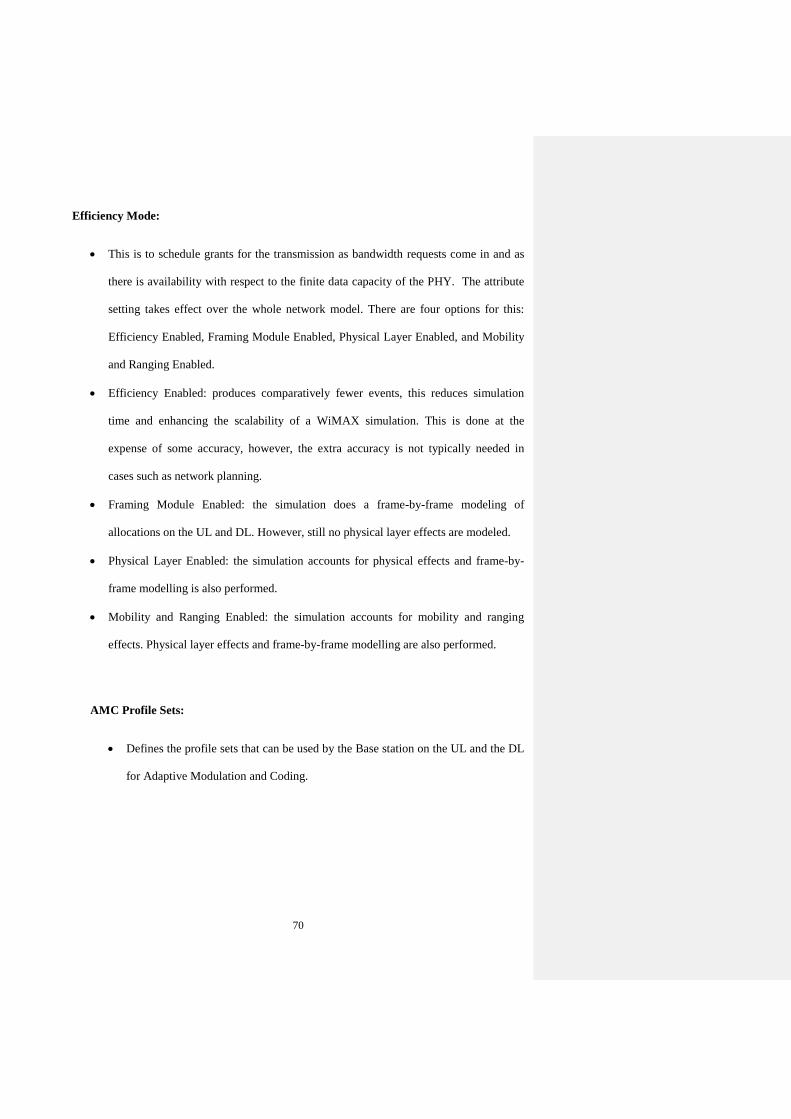
70
Efficiency Mode:
This is to schedule grants for the transmission as bandwidth requests come in and as
there is availability with respect to the finite data capacity of the PHY. The attribute
setting takes effect over the whole network model. There are four options for this:
Efficiency Enabled, Framing Module Enabled, Physical Layer Enabled, and Mobility
and Ranging Enabled.
Efficiency Enabled: produces comparatively fewer events, this reduces simulation
time and enhancing the scalability of a WiMAX simulation. This is done at the
expense of some accuracy, however, the extra accuracy is not typically needed in
cases such as network planning.
Framing Module Enabled: the simulation does a frame-by-frame modeling of
allocations on the UL and DL. However, still no physical layer effects are modeled.
Physical Layer Enabled: the simulation accounts for physical effects and frame-by-
frame modelling is also performed.
Mobility and Ranging Enabled: the simulation accounts for mobility and ranging
effects. Physical layer effects and frame-by-frame modelling are also performed.
AMC Profile Sets:
Defines the profile sets that can be used by the Base station on the UL and the DL
for Adaptive Modulation and Coding.

71
Configuration for WiMAX Base Station settings are as follow:
PHY profiles: PHY profiles are grouped into two main classes: Single Carrier
(SC, SC-a) and Orthogonal Frequency Division Multiplexing (OFDM, OFDMA).
A BS node and its associated SS nodes should be configured with the same PHY
profile type and is to be used for all communications from/to this MAC.
Maximum Transmission Power: the power specified in this attribute refers to the
total transmission power that this transmitter can output over the entire channel
bandwidth. On a Base Station, the total transmission power is fixed and is set as
specified by user. On a Subscriber Station, if the efficiency mode is set to
Mobility and Ranging Enabled, the total transmission power can be changed
dynamically as commanded by the ranging module. For all other values of the
efficiency mode, the total transmission power is fixed and is set as specified by
the user.
MAC Address: This attribute specifies address of the WiMAX MAC. This should
be a unique value among all types of MAC (example ethernet, WLAN, etc) in the
network. By default, the simulation will assign unique values to all MAC
modules. In addition, a user can specify an address. If duplicate addresses are
detected, simulation will be stopped.
Classifier Definitions: allows mapping of higher layer traffic to a WiMAX service
class. Each map consists of a match criteria and corresponding service class.
BS Parameters: to set the capability of a BS in UL and DL.
Antenna Gain (dBi): used to bypass the antenna gain computations at this node
and use a provided gain value for all directions.

72
Configuration for WiMAX Sub Station settings are as follow:
Application Supported Profiles: specifies the names of all profiles which are enabled
on this node. Each profile is defined in detail in the profile configuration object that
can be found in the utilities palette. A profile describes user behavior in terms of what
applications are being used and the amount of traffic each application generates.
Application Supported Services: parameters to start and setup services for various
applications at this server. Clients can send traffic to this server for only those
applications which are supported by this attribute.
Antenna Gain: This attribute can be used to bypass the antenna gain computations at
this node and use a provided gain value for all directions.
Classifier Definitions: to allow mapping of higher layer traffic to a WiMAX service
class. Each map consists of a match criteria and corresponding service class.
BS MAC Address: This attribute is used by an SS MAC to identify its serving BS
MAC. For Auto Assigned settings, an SS node will use the MAC address of the BS
node with the maximum received power. This attribute replaces the BS discovery
procedure achieved during network entry of an SS node. Once the BS is identified by
this attribute, it will be used by the SS for the entire simulation duration.
Downlink Service Flows: This attribute specifies the properties of the downlink
service flows. These flows originate at the BS and terminate at this SS node. Several
downlink service flows may be configured. There should be only one downlink
service flow to this node with a given service class name.
Uplink Service Flows: This attribute specifies the properties of the uplink service
flows. These flows originate at the SS and terminate at the BS node. Several uplink
service flows may be configured. There should be only one uplink service flow from
this node with a given service class name.

73
Control Connections: This attribute specifies the properties of the control connections.
Currently only Basic connection is defined. The configuration is applied to both
uplink and downlink instances of the connection.
Multipath Channel Model: The channel model is defined on the SS and it applies to
the channel between the SS transmitter and the BS receiver, as well as the channel
between the BS transmitter and the SS receiver. In other words, the channel model
specified on an SS applies to both the uplink and the downlink transmissions
involving that SS. When the SS moves from one cell to another, it carries the channel
model with it into the new cell.
Pathloss Model: This attribute specifies the type of pathloss model to be applied to
signals being received at this WiMAX MAC. Each pathloss model is appropriate for a
certain kind of environment through which the signal propagates before reaching the
receiver. The Free Space pathloss model refers to the classical free space pathloss.
The "Suburban Fixed (Erceg)" pathloss model is defined in: V. Erceg et al., as "An
empirically based path loss model for wireless channels in suburban environments",
IEEE JSAC, vol.17, no.7, July 1999, pp. 1205-1222. Erceg's model is also referenced
in IEEE802.16a-03/01 document. The "Outdoor to Indoor and Pedestrian
Environment" and the "Vehicular Environment" are pathloss models described in the
"Radio Tx Technologies for IMT2000" white paper of the ITU.
4.2.3 The WLAN Module
The model of WLAN in Opnet is built to demonstrate some of the implemented
features and algorithms of the WLAN technology, specified in IEEE’s 802.11, 802.11a,
802.11b, 802.11g, 802.11e, and 802.11n standards [133].
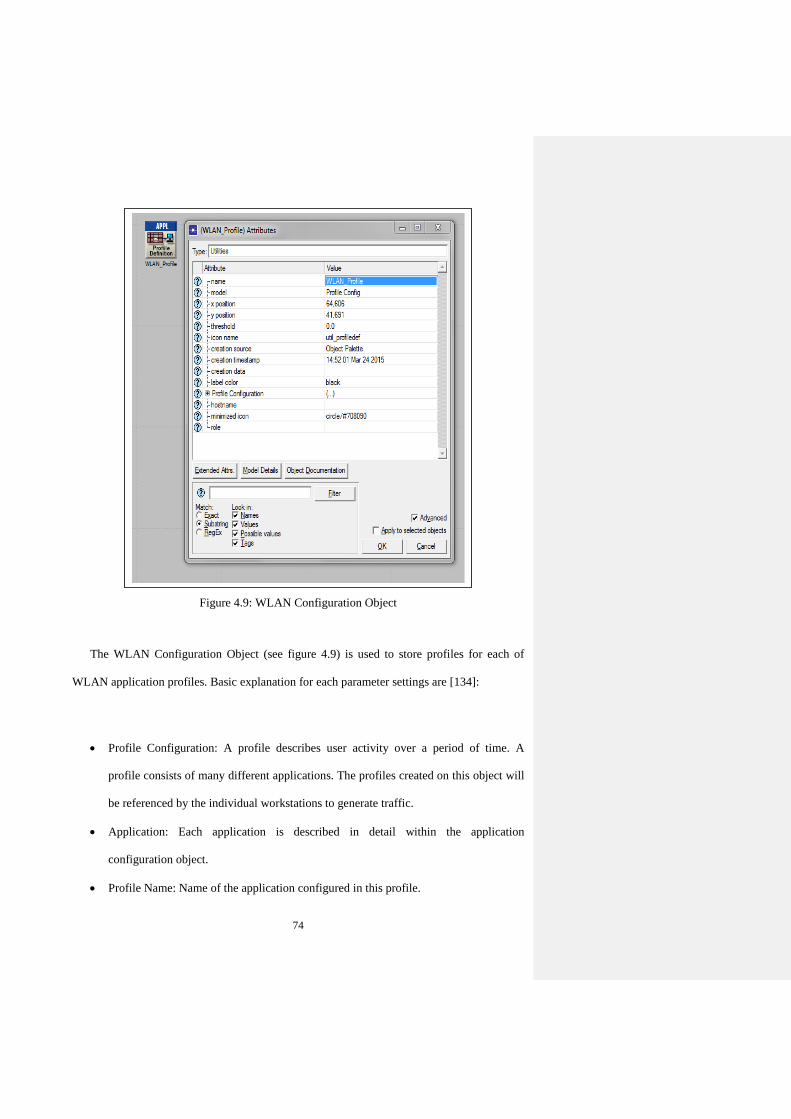
74
Figure 4.9: WLAN Configuration Object
The WLAN Configuration Object (see figure 4.9) is used to store profiles for each of
WLAN application profiles. Basic explanation for each parameter settings are [134]:
Profile Configuration: A profile describes user activity over a period of time. A
profile consists of many different applications. The profiles created on this object will
be referenced by the individual workstations to generate traffic.
Application: Each application is described in detail within the application
configuration object.
Profile Name: Name of the application configured in this profile.

75
Start Time Offset: This attribute has two interpretations based on the value specified
for the Operation Mode.
Operation Mode: If the Operation Mode is set to Simultaneous, this offset refers to the
offset of the first instance of each application (defined in the profile), from the start of
the profile. If the Operation Mode is set to Serial (Ordered) or Serial (Random), this
offset refers to the time from the start of the profile to the start of the first application.
It also serves as the inter-application time between the end of one application to the
start of the next. If an application does not end (duration set to End of Profile),
subsequent applications will not start.
Duration: The maximum amount of time allowed for an application session before it
aborts. This is often used as a timeout. When it is set to End of Profile, the application
will end when the profile duration has expired. When it is set to End of Last Task, the
application will end when the last task of the application has completed regardless of
task completion times.
Repeatability: Specifies the parameters used to repeat applications within the
surrounding profile.
Configuration for WLAN Sub Station settings are as follow:
Application Supported Profiles: A profile describes user behavior in terms of what
applications are being used and the amount of traffic each application generates.
Profiles can be repeated based on a repeatability pattern.
Application Destination Preferences: Provides mappings between symbolic
destination names specified in the Application Definition.
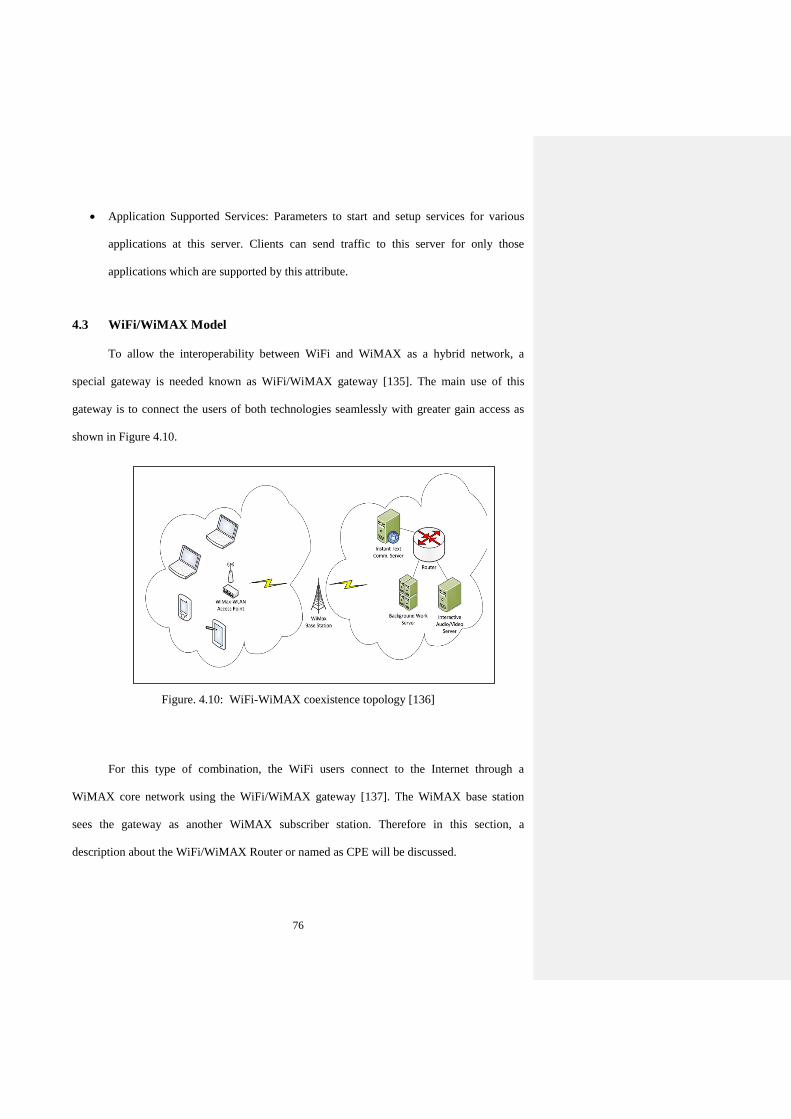
76
Application Supported Services: Parameters to start and setup services for various
applications at this server. Clients can send traffic to this server for only those
applications which are supported by this attribute.
4.3 WiFi/WiMAX Model
To allow the interoperability between WiFi and WiMAX as a hybrid network, a
special gateway is needed known as WiFi/WiMAX gateway [135]. The main use of this
gateway is to connect the users of both technologies seamlessly with greater gain access as
shown in Figure 4.10.
Figure. 4.10: WiFi-WiMAX coexistence topology [136]
For this type of combination, the WiFi users connect to the Internet through a
WiMAX core network using the WiFi/WiMAX gateway [137]. The WiMAX base station
sees the gateway as another WiMAX subscriber station. Therefore in this section, a
description about the WiFi/WiMAX Router or named as CPE will be discussed.
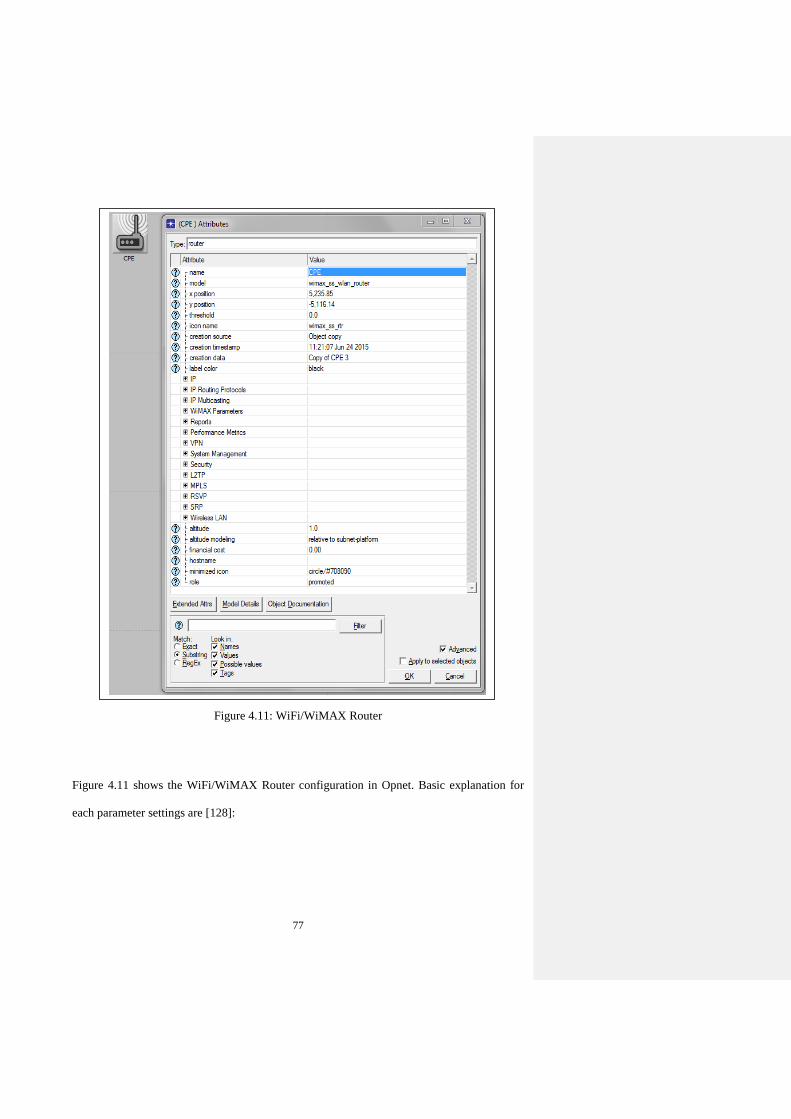
77
Figure 4.11: WiFi/WiMAX Router
Figure 4.11 shows the WiFi/WiMAX Router configuration in Opnet. Basic explanation for
each parameter settings are [128]:
78
WiMAX Parameters:
Antenna Gain (dBi) : This attribute can be used to bypass the antenna gain
computations at this node and use a provided gain value for all directions.
Classifier Definitions: This attribute allows mapping of higher layer traffic to a
WiMAX service class. Each map consists of a match criteria and corresponding
service class.
Traffic Characteristics: This attribute specifies the match criteria for mapping higher
layer traffic to WiMAX service flows.
Service Class Name: This attribute specifies the name of a service class for the traffic
matching the defined characteristics. This service class name is later used to find a
service flow.
PHY Profile: This attribute specifies the PHY profile to be used for all
communications from/to this MAC. A BS node and its associated SS nodes should be
configured with the same PHY profile.
SS Parameters: Subscriber station parameters - definitions of service flows, ranging
parameters, mobility parameters, AMC parameters, piggyback bandwidth request
support, power control, power saving parameters.
WLAN Parameters:
MAC Address: Specifies the WLAN layer's unique MAC address.
BSS Identifier: This attribute identifies the BSS to which the WLAN MAC belongs.
In case of Auto Assigned, all WLAN MACs in each subnet belong to the same BSS
(the subnets define the borders of the BSSs in the network). If this attribute is used
(set to a value different than Auto Assigned), then it should be configured globally for
all the WLAN nodes or interfaces in the network. For WLAN MACs, whose roaming

79
functionality is enabled, this attribute identifies only their initial BSSs. They may
associate with other BSSs later during the simulation.
Access Point Functionality: Can be used to assign the MAC as the access point of its
BSS and to enable the access point functionality in the MAC by setting its value to
Enabled.
PHY Characteristics: Based on the value of this attribute, which determines the
physical layer technology in use, the WLAN MAC will configure the values of the
following protocols parameters as indicated in the IEEE 802.11 WLAN standard.
Data Rate (bps): Specifies the data rate that will be used by the MAC for the
transmission of the data frames via physical layer. The set of supported data rates
depending on the deployed physical layer technology are specified in IEEE's 802.11,
802.11a, 802.11b, 802.11g and 802.11n standards.
Channel Settings: Specifies the frequency band that will be used by the radio
transmitter and receiver connected to the MAC. The channel numbers correspond to
the channels available in the 2.4 GHz ISM band (specified in IEEE 802.11, 802.11b
and 802.11g), and 5 GHz U-NII band (specified in 802.11a).
Transmit Power: Specifies the transmit power of the STA in Watts. Note that no
limits are imposed upon the value of this attribute.
Packet Reception-Power Threshold: Defines the received power threshold (receiver
sensitivity) value of the radio receiver in dBm for arriving WLAN packets. Packets
with a power less than the threshold are not sensed and decoded by the receiver.
Buffer Size: Specifies the maximum size of the higher layer data buffer in bits. Once
the buffer limit is reached, the data packets arrived from higher layer will be
discarded until some packets are removed from the buffer so that the buffer has some
free space to store these new packets.
80
4.4 Evaluation of the WiMAX System Simulation
Simulations for several scenarios were conducted to verify the WiMAX module using
Opnet. This segment begins with depiction and cases where WiMAX was used in an
emergency situation especially in a real time situation. Next the explanation on the scenario
used in the simulation, followed by the simulation results and the examination. Finally, the
outcome of the WiMAX QoS behavior is outlined and discussed.
In this research, the reasons why we chose WiMAX as the solution was due to several
reasons; WiMAX network can be deployed in the risk and inaccessible areas for example in a
place where the disaster happened (earthquake, seaquake, flooding, and forest fires) and even
in the proximity of a possible hazard such as volcanoes and nuclear power stations [3]. The
selection of WiMAX based communication architecture is the best solution due to its
capabilities in terms of coverage, data rates, user mobility and even enables meeting different
QoS constraints in relation to different types of applications and traffic [4]. In particular, in
the case of an emergency communication system, it is possible to allocate network resources
properly and to assign priority to critical applications, such as real-time applications.
4.4.1 WiMAX in Disaster Situations
In many practical applications or situations where emergency communication is
required, very often the major communication is down. It has also happened during times of
catastrophe such as earthquakes or tsunamis, when the entire incumbent communications
infrastructure is destroyed or damaged [1]. An ad-hoc communication system that requires
relatively fast and robust links must be deployed in a very short time to support the
communication needs of the rescue and recovery operations [2]. For example in the 2010
Haitian Earthquake response, VoIP, video and applications such as Skype, Ushahidi, Sahana,
81
Facebook, Twitter, and Google Maps were used by the disaster responders for the emergency
communications [138].
There are two scenarios that have been used by the WiMAX Extensions for Remote
(WEIRD) and Isolated Research Data Networks project; Environmental Monitoring and Fire
Prevention [139]. For the environmental operation, several video cameras and wireless sensor
networks were installed around the area to record any occurrences that happened. Next, all
the data was collected and transmitted to the Monitoring Centre using a Mobile WiMAX link
to be analyzed [140]. The same procedure goes for the Fire Prevention Scenario, images and
text descriptions taken from the operation site were being transmitted to the Fire Station
District Civil Protection Coordination Centre (DCPCC) using Mobile WiMAX. For this case,
real-time data such as voice and VoIP application have been used and utilized [138].
Next, the evaluation of WiMAX as a homogenous system is conducted, particularly in
disaster situations. Two scenarios are presented here to evaluate the performance; Scenario 1
and Scenario 2.
4.4.2 Scenario 1
In this scenario, we analyzed the performance of the rtPS and BE QoS. Currently in
WiMAX there are 5 different QoS and it is commonly known that rtPS provides higher
quality and BE provides the worst quality. However, in the case of a disaster, there is a need
to have any type of communication. It is also desirable to get more from the system
performance what the conventional system can do. One of the conventional thinking is that
rtpS QoS will always give the best performance with the higher throughput while BE QoS is
like a backup [141]. Therefore, we wanted to investigate whether BE QoS could perform
better than the rtPS in terms of throughput, delay and packet loss.
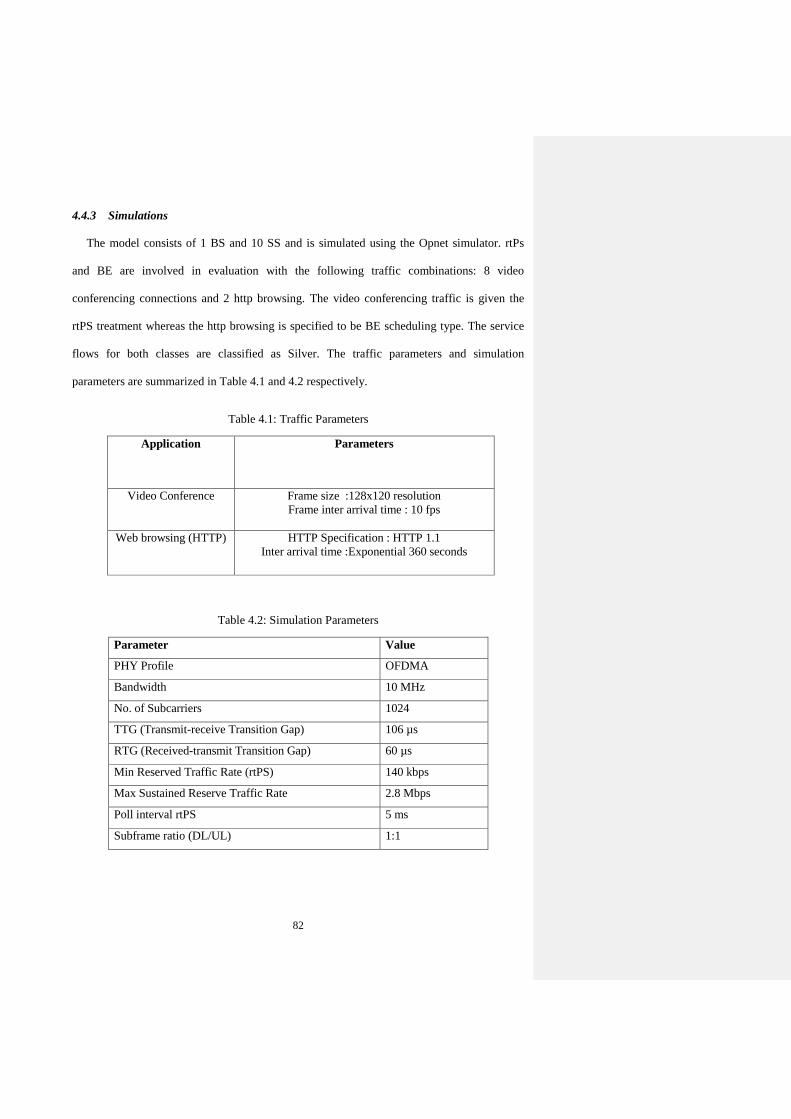
82
4.4.3 Simulations
The model consists of 1 BS and 10 SS and is simulated using the Opnet simulator. rtPs
and BE are involved in evaluation with the following traffic combinations: 8 video
conferencing connections and 2 http browsing. The video conferencing traffic is given the
rtPS treatment whereas the http browsing is specified to be BE scheduling type. The service
flows for both classes are classified as Silver. The traffic parameters and simulation
parameters are summarized in Table 4.1 and 4.2 respectively.
Table 4.1: Traffic Parameters
Application Parameters
Video Conference Frame size :128x120 resolution
Frame inter arrival time : 10 fps
Web browsing (HTTP) HTTP Specification : HTTP 1.1
Inter arrival time :Exponential 360 seconds
Table 4.2: Simulation Parameters
Parameter Value
PHY Profile OFDMA
Bandwidth 10 MHz
No. of Subcarriers 1024
TTG (Transmit-receive Transition Gap) 106 µs
RTG (Received-transmit Transition Gap) 60 µs
Min Reserved Traffic Rate (rtPS) 140 kbps
Max Sustained Reserve Traffic Rate 2.8 Mbps
Poll interval rtPS 5 ms
Subframe ratio (DL/UL) 1:1
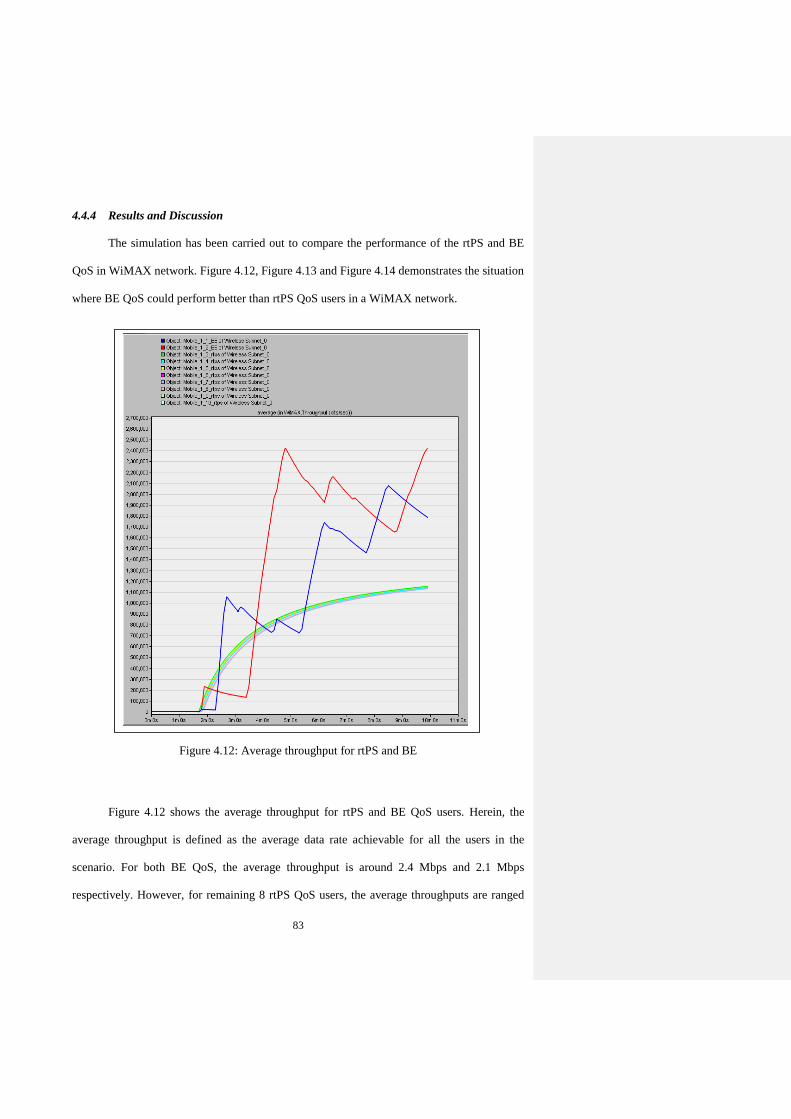
83
4.4.4 Results and Discussion
The simulation has been carried out to compare the performance of the rtPS and BE
QoS in WiMAX network. Figure 4.12, Figure 4.13 and Figure 4.14 demonstrates the situation
where BE QoS could perform better than rtPS QoS users in a WiMAX network.
Figure 4.12: Average throughput for rtPS and BE
Figure 4.12 shows the average throughput for rtPS and BE QoS users. Herein, the
average throughput is defined as the average data rate achievable for all the users in the
scenario. For both BE QoS, the average throughput is around 2.4 Mbps and 2.1 Mbps
respectively. However, for remaining 8 rtPS QoS users, the average throughputs are ranged
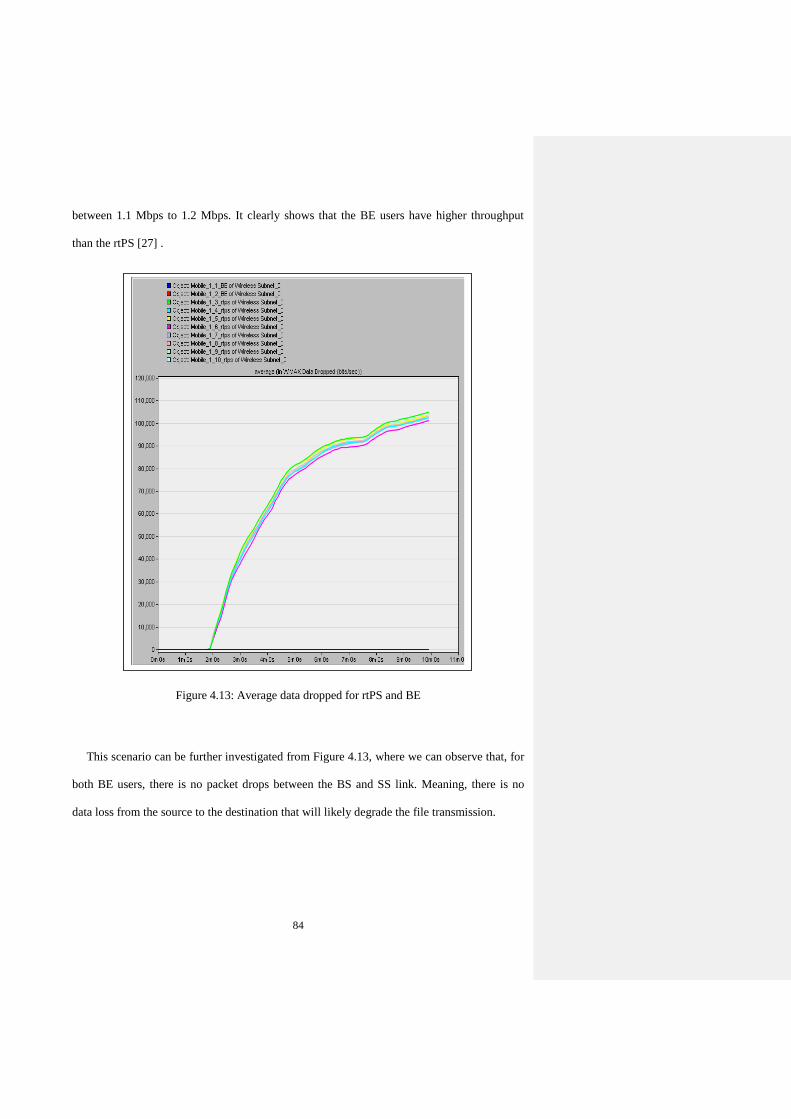
84
between 1.1 Mbps to 1.2 Mbps. It clearly shows that the BE users have higher throughput
than the rtPS [27] .
Figure 4.13: Average data dropped for rtPS and BE
This scenario can be further investigated from Figure 4.13, where we can observe that, for
both BE users, there is no packet drops between the BS and SS link. Meaning, there is no
data loss from the source to the destination that will likely degrade the file transmission.
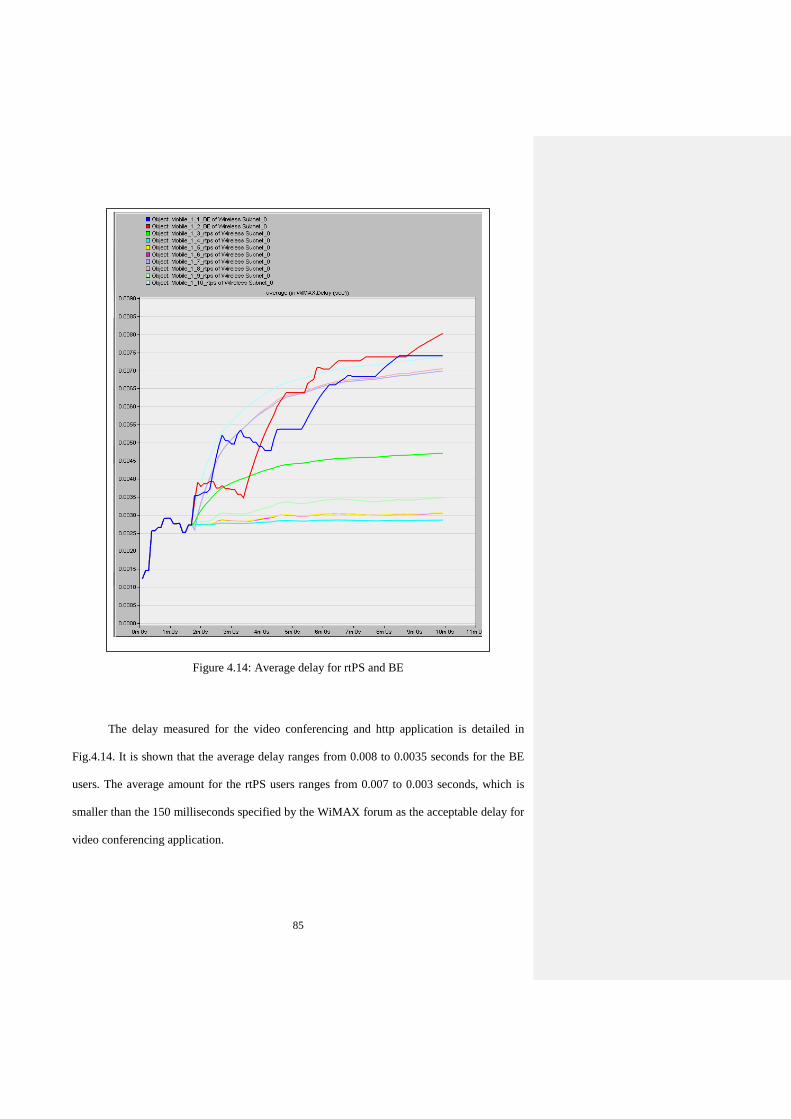
85
Figure 4.14: Average delay for rtPS and BE
The delay measured for the video conferencing and http application is detailed in
Fig.4.14. It is shown that the average delay ranges from 0.008 to 0.0035 seconds for the BE
users. The average amount for the rtPS users ranges from 0.007 to 0.003 seconds, which is
smaller than the 150 milliseconds specified by the WiMAX forum as the acceptable delay for
video conferencing application.
86
4.4.5 Scenario 2
Another concern is the application assigned for each WiMAX QoS which is evaluated
in Scenario 2. Conventional WiMAX standard defines 5 levels of quality of service and in
this level video conferencing/streaming is assigned to the rtPS classes [142]. However, there
are a number of scenarios where video conferencing can work with the BE QoS for example,
in the WiFi network [143]. We anticipated that such scenarios will happen in emergency
situations, therefore we would like to try these unusual scenarios where video conferencing
could be required to operate with the BE. Eventhough video conferencing is not used over BE
classes but let’s assume for this particular case the user does not have any other choice. So
our systems solution is to provide this user with enough throughput so that the user can run
video conferencing/streaming application over BE QoS class, which is not commonly
possible. We also proposed not only video streaming for rtPS QoS user, but also web
browsing for the rtPS user. The following figures are the results from evaluating the BE QoS
with the video conferencing applications. Eventhough it is an unusual case, based on this
discovery, it can be very useful to the rescue team during disaster or an emergency situation.
4.4.6 Simulations
The next model contains 10 users with the specific QoS allocation as depicted in Table
4.3.
Table 4.3: WiMAX User Allocation
WiMAX QoS Number of WiMAX User Application Assigned
rtPS 3 web browsing
BE 2 video conferencing/streaming
rtPS 5 video conferencing/streaming
Commented [ez6]: Sorry, but there are two therefores used here and youhave a lot of points you want to bring forth. I think you
would have to rephrase this. I dare not rephrase this because I may
distort the meaning you want to illustrate.
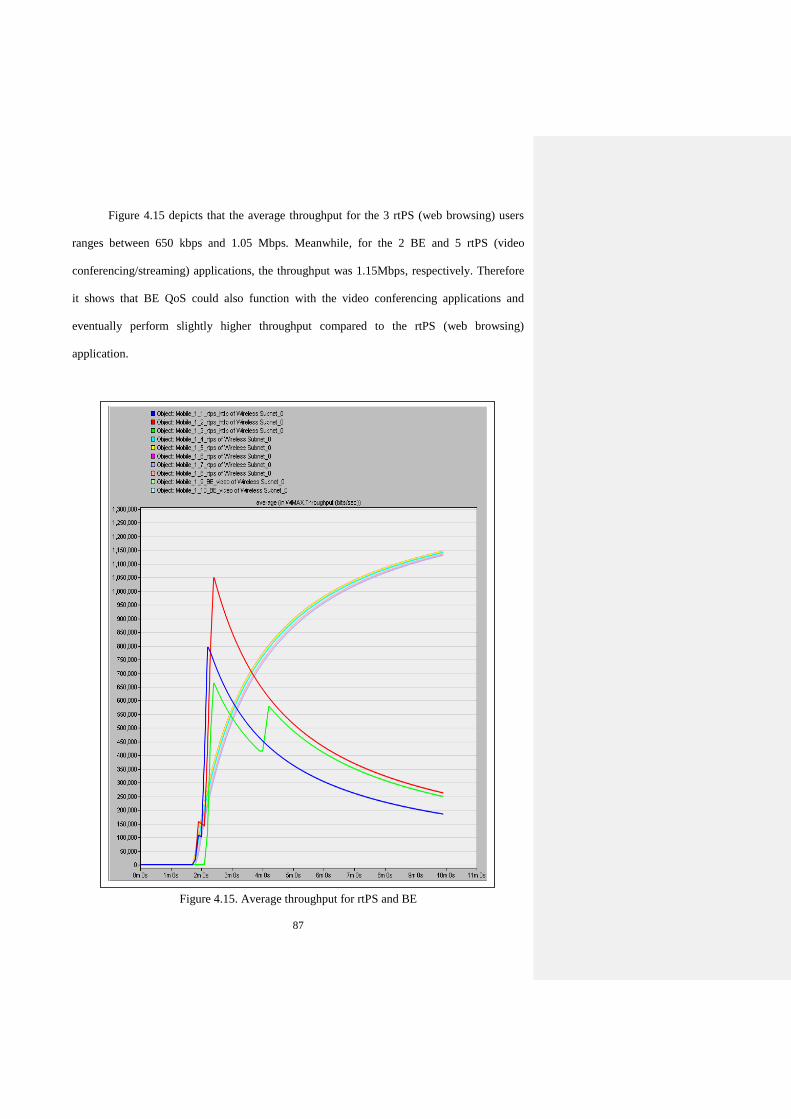
87
Figure 4.15 depicts that the average throughput for the 3 rtPS (web browsing) users
ranges between 650 kbps and 1.05 Mbps. Meanwhile, for the 2 BE and 5 rtPS (video
conferencing/streaming) applications, the throughput was 1.15Mbps, respectively. Therefore
it shows that BE QoS could also function with the video conferencing applications and
eventually perform slightly higher throughput compared to the rtPS (web browsing)
application.
Figure 4.15. Average throughput for rtPS and BE
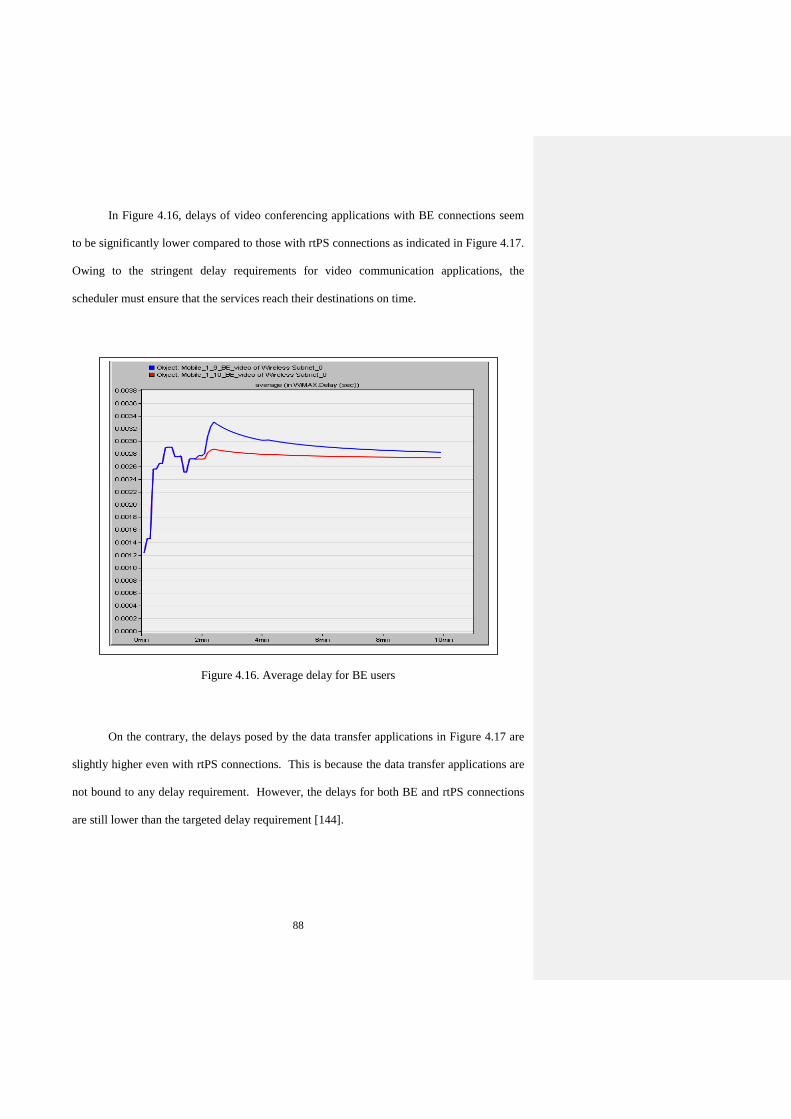
88
In Figure 4.16, delays of video conferencing applications with BE connections seem
to be significantly lower compared to those with rtPS connections as indicated in Figure 4.17.
Owing to the stringent delay requirements for video communication applications, the
scheduler must ensure that the services reach their destinations on time.
Figure 4.16. Average delay for BE users
On the contrary, the delays posed by the data transfer applications in Figure 4.17 are
slightly higher even with rtPS connections. This is because the data transfer applications are
not bound to any delay requirement. However, the delays for both BE and rtPS connections
are still lower than the targeted delay requirement [144].
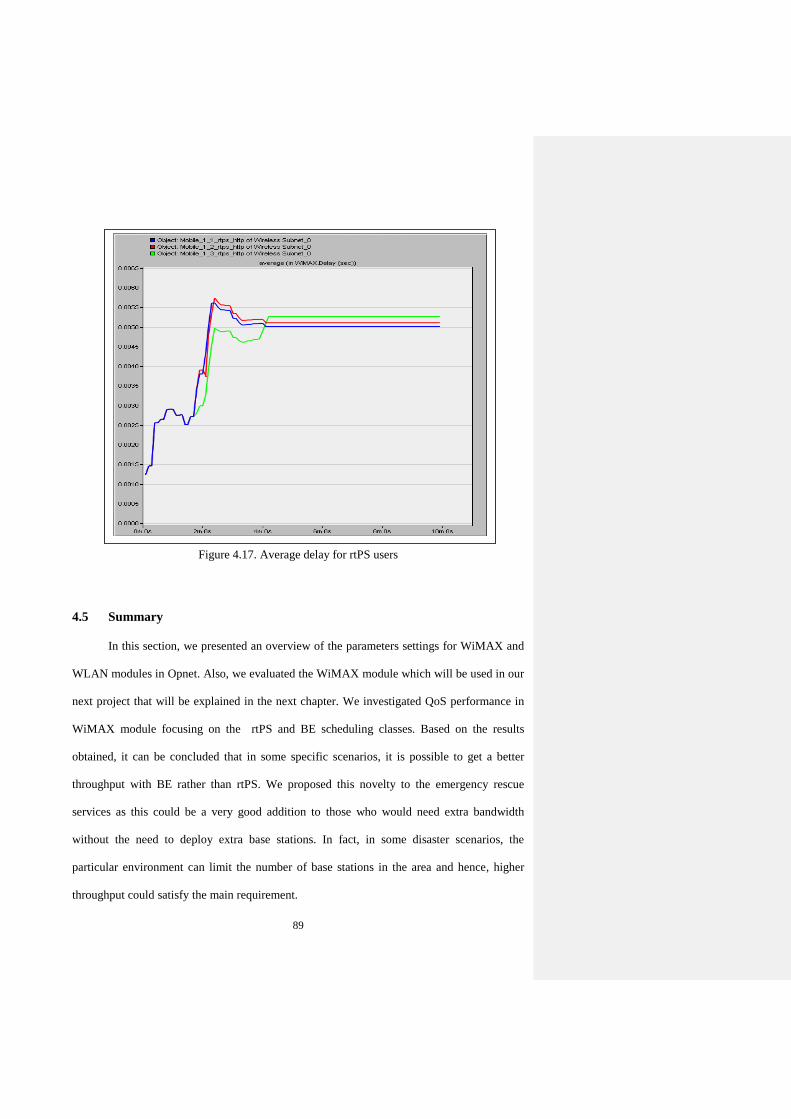
89
Figure 4.17. Average delay for rtPS users
4.5 Summary
In this section, we presented an overview of the parameters settings for WiMAX and
WLAN modules in Opnet. Also, we evaluated the WiMAX module which will be used in our
next project that will be explained in the next chapter. We investigated QoS performance in
WiMAX module focusing on the rtPS and BE scheduling classes. Based on the results
obtained, it can be concluded that in some specific scenarios, it is possible to get a better
throughput with BE rather than rtPS. We proposed this novelty to the emergency rescue
services as this could be a very good addition to those who would need extra bandwidth
without the need to deploy extra base stations. In fact, in some disaster scenarios, the
particular environment can limit the number of base stations in the area and hence, higher
throughput could satisfy the main requirement.

90
Besides that, we evaluated the cross layer approach whereby we assigned the real time
applications to the non-guaranteed bit rate classes and vice versa. We found that BE classes
is also probably suitable for the video conferencing applications which could possibly be
used during an emergency situation.
91
Chapter 5: Optimization for Integration of WiFi and WiMAX Network for
PPDR Services (Major Planned Event)
Public Protection and Disaster Relief (PPDR) is the most important organization that is
responsible for the disaster preparedness and recovery [84]. In times of catastrophe such as
earthquakes or tsunamis, particularly when the major incumbent communications
infrastructure was destroyed or damaged, a relatively tight and robust communications
system needs to be deployed in order to support the communication needs of the search and
rescue operations. Therefore, PPDR organization will assist the emergency communications
among the first responders on the site including firefighters, emergency response personnel,
law enforcement and also disparate agencies.
I was involved in the European Union (EU) project organized by the PPDR
Transformation Center (TC). PPDR-TC is a project that involves several partners of different
nature and expertise and requires a careful planning as well as procedures to achieve its
necessarily ambitious objectives. PPDR-TC has launched a project with the title of Public
Protection and Disaster Relief-Transformation Center, Call Identifier: FP7-SEC-2012.5.2-1.
The main objectives of the project is preparation of the next generation of PPDR
communication network. Therefore, my task was to prepare the simulation results based on
the given scenarios. The layout needed for each scenario, based on PPDR requirements, were
prepared by the engineers from Rinicom LTD. Besides that, I was also given the role to
investigate and propose the best/optimum results, which in the future, will be used as an EU
standard and by the first responders in any emergency case. Thus, in Chapters 5 and 6, the
discussion involves integration of WiFi and WiMAX, mainly focusing on the PPDR users.
92
However, this chapter will concentrate on the Major Planned Event situation, whereas the
Unplanned Event will be discussed in the next chapter.
5.1 Introduction
In a large international disaster scenario, there are multiplicity of different PPDR
organizations that may be involved to support the mission. Nevertheless, they may use
different wireless communication technologies, which create interoperability barriers [145].
In this chapter, I proposed a hybrid communication architecture that involves the integration
of WiFi and WiMAX using a special router known as WiFi/WiMAX router, for the operation
of emergency situations. Previously, PPDR organizations have used voice services to perform
their operational duties. Nevertheless, non-voice communications is becoming equally
important [87] to diverse applications such as video streaming, picture download, and remote
database depending on the nature of the tragedy. A complete list of current and future
applications needed for PPDR services are described in [146], which explains the necessity of
data connectivity in their operations. In this thesis, we also proposed an optimize
combination number of applications that can be maintained in the integration of WiFi-
WiMAX network.
5.2 PPDR-TC
Public Protection and Disaster Relief-Transformation Center (PPDR-TC) was a
project that had the involvement of several partners of different nature and expertise that were
directly involved in PPDR operations. The main objective of the project was to increase the
efficiency of communications infrastructure by the enhancement of new communication
technologies in order to achieve interoperable, secure and resilient communication - tailored
specifically for the future needs of the PPDR community. Following this, the integration and
participation of end-users, with specific knowledge in public safety issues, play a key role in
Commented [ez7]: Is sustainable or can be maintained? Both
are different in meanings, so you would need to decide which would
best describe the point you want to highlight.
Commented [ez8]: Or from different fields
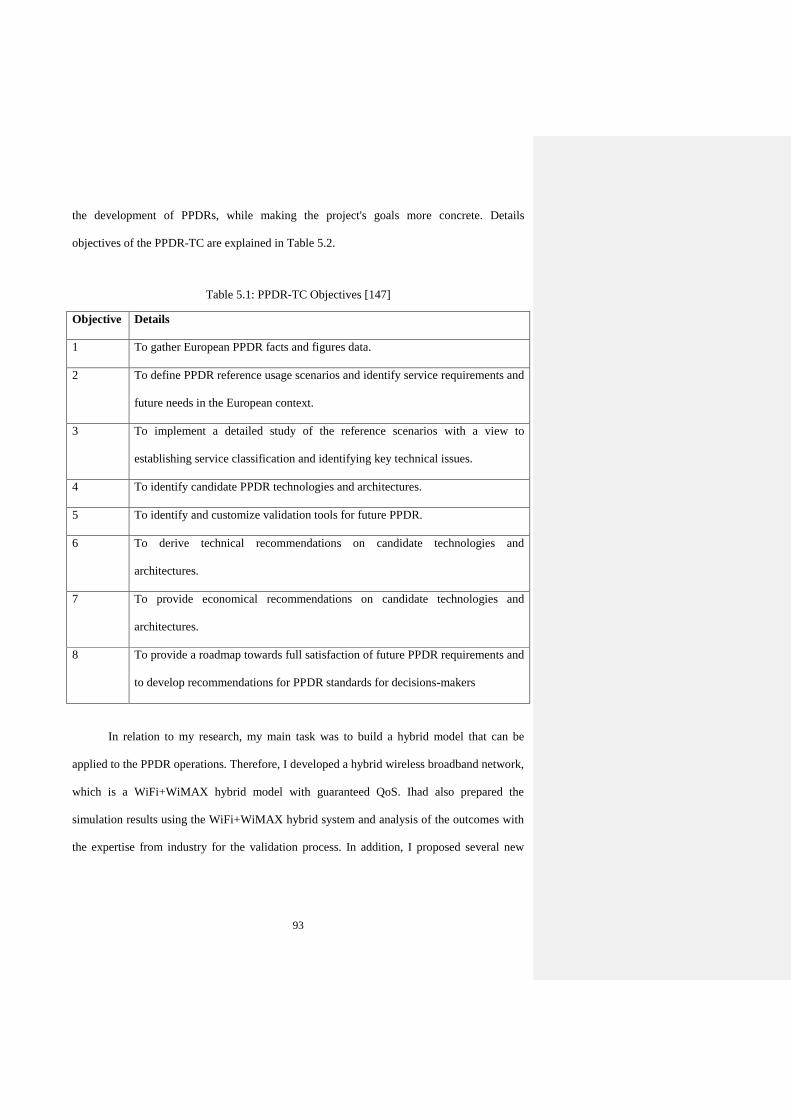
93
the development of PPDRs, while making the project's goals more concrete. Details
objectives of the PPDR-TC are explained in Table 5.2.
Table 5.1: PPDR-TC Objectives [147]
Objective Details
1 To gather European PPDR facts and figures data.
2 To define PPDR reference usage scenarios and identify service requirements and
future needs in the European context.
3 To implement a detailed study of the reference scenarios with a view to
establishing service classification and identifying key technical issues.
4 To identify candidate PPDR technologies and architectures.
5 To identify and customize validation tools for future PPDR.
6 To derive technical recommendations on candidate technologies and
architectures.
7 To provide economical recommendations on candidate technologies and
architectures.
8 To provide a roadmap towards full satisfaction of future PPDR requirements and
to develop recommendations for PPDR standards for decisions-makers
In relation to my research, my main task was to build a hybrid model that can be
applied to the PPDR operations. Therefore, I developed a hybrid wireless broadband network,
which is a WiFi+WiMAX hybrid model with guaranteed QoS. Ihad also prepared the
simulation results using the WiFi+WiMAX hybrid system and analysis of the outcomes with
the expertise from industry for the validation process. In addition, I proposed several new

94
findings or results that would benefit the PPDR projects. All these were not carried with other
partners or consortium involves in the PPDR-TC.
5.3 Integration of WiFi and WiMAX in Disaster Situation
This section discusses the mechanism of the integration of WiFi and WiMAX starting
with a general view of each protocol in each system particularly for disaster or emergency
situation.
Every bit a beginning version of wireless solution, the WiFi is considered as the very
high-speed WLAN mechanism to plug in laptops, cell phones and other appliances. Curently,
WiFi is popularly employed in Internet access, VoIP communication and many more with a
speed of 54 Mbps and a reach of approximately 30 meters [9]. On the other hand, WiMAX is
high-speed WMAN wireless technologies of recent days. It is a standard that was built with
the intention to supply long distance wireless connectivity with a theoretical data rate of 70
Mbps with a range 50 km. Nevertheless, the achievable data rate with current version is 10
Mbps at a reach of 2 kilometers [10].
Although, both the technologies of the WiMAX and the WiFi provide a wireless
connection to last mile problem, their working mechanism is technically different [11]. One
of the primary reasons why WiFi is unable to work at greater distances as WiMAX is that
radios operating in the unlicensed frequencies are not admitted to be equally potent as those
operated with licenses [12]. Since the power is less, the same effects happen to the distance.
Secondly, the WiFi MAC layer uses contention access, whereas WiMAX uses a scheduling
algorithm. Using a contention mode algorithm, users have to compete for data throughput to
the access level. In the interim, by scheduling mode algorithm, it lets the user to only
95
compete once on the access level. As a result, WiMAX outstrip WiFi in terms of throughput,
latency, and spectral efficiency [13].
Despite such high data rate and long distance coverage, WiMAX is not widely used as
WiFi. The primary reason is the price involved in WiMAX deployment, which is related to
the licensed frequency band used in WiMAX standard. The frequency band used in WiFi is
ISM band, hence, the cost involved in fixing up the WiFi network [14] is rather high. Thus, to
minimize the cost of setting up a wirelessly connected network with quality of service,
researchers are attempting to integrate both WiFi and WiMAX into a single operating
environment.
Both WiFi and WiMAX standards are designed for the Internet protocol applications.
However, by combining these two technologies, WiMAX can function as a backhaul while
WiFi will be connected directly to the users [15]. During times of catastrophe such as
earthquakes or tsunamis, when the entire incumbent communications infrastructure was
destroyed or damaged, an ad-hoc communications system that requires relatively fast and
robust links must be deployed in a very short time to support the communication needs of the
rescue and recovery operations. Therefore, using this type of WiFi and WiMAX integration
network, communication needs among the first responders, the victims and headquarters can
be deployed. After an emergency call has been received, vehicles and personnel belonging to
several authorities are sent to the incident scene. Rescuers have to immediately seek for
people who require quick assistance. At the same time, they have to set up communications
for various tasks such as, transmission of live video event from a disaster area to the fire
department’s command center, data transmitting to the corresponding headquarter, medical
data fetching from hospitals’ databases regarding the medical chronicle of the injured persons
Commented [ez9]: Or related
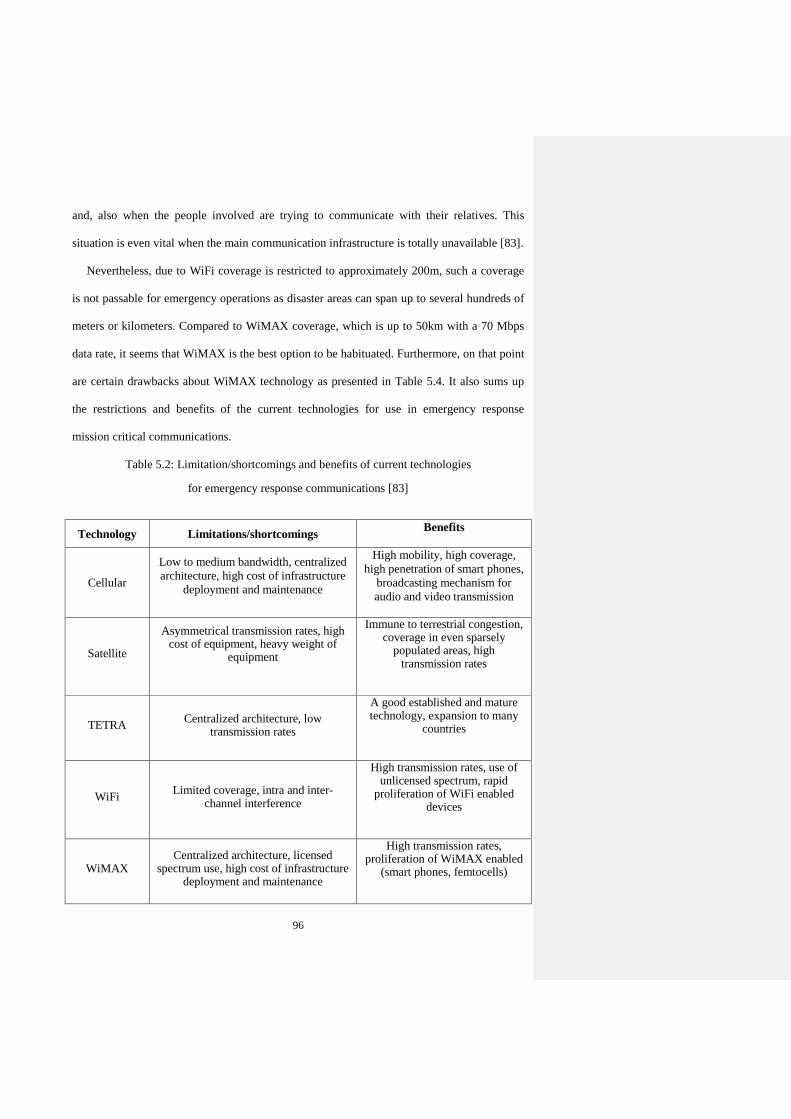
96
and, also when the people involved are trying to communicate with their relatives. This
situation is even vital when the main communication infrastructure is totally unavailable [83].
Nevertheless, due to WiFi coverage is restricted to approximately 200m, such a coverage
is not passable for emergency operations as disaster areas can span up to several hundreds of
meters or kilometers. Compared to WiMAX coverage, which is up to 50km with a 70 Mbps
data rate, it seems that WiMAX is the best option to be habituated. Furthermore, on that point
are certain drawbacks about WiMAX technology as presented in Table 5.4. It also sums up
the restrictions and benefits of the current technologies for use in emergency response
mission critical communications.
Table 5.2: Limitation/shortcomings and benefits of current technologies
for emergency response communications [83]
Technology Limitations/shortcomings Benefits
Cellular
Low to medium bandwidth, centralized
architecture, high cost of infrastructure
deployment and maintenance
High mobility, high coverage,
high penetration of smart phones,
broadcasting mechanism for
audio and video transmission
Satellite
Asymmetrical transmission rates, high cost of equipment, heavy weight of
equipment
Immune to terrestrial congestion, coverage in even sparsely
populated areas, high transmission rates
TETRA Centralized architecture, low
transmission rates
A good established and mature technology, expansion to many
countries
WiFi Limited coverage, intra and inter-
channel interference
High transmission rates, use of unlicensed spectrum, rapid
proliferation of WiFi enabled devices
WiMAX Centralized architecture, licensed
spectrum use, high cost of infrastructure deployment and maintenance
High transmission rates, proliferation of WiMAX enabled
(smart phones, femtocells)

97
5.4 EU Project Summaries
There are two operational scenarios considered in this project; Major Planned Event
and Unplanned Event. The Major Planned Event network is modeled with WiMAX as
backhaul to the core IP network, whereas in the Unplanned Event, each WiMAX BS is
connected to a PPDR centre. The next section provides the summary of the results from the
EU project report for both scenarios.
5.4.1 WiFi – WiMAX (backhaul) Major Planned Event
This simulation presents the results for a WiFi network using WiMAX as backhaul to
the core IP network. Each WiMAX base station is linked to a WiMAX CPE (AP device
which has built-in WiFi and WiMAX bridge). PPDR users are simulated within range of this
WiFi device and are represented as WiFi terminals and all traffic is then transmitted over the
WiMAX CPE back to the linked base station and then the core network.
5.4.2 Application modelling
Within this simulation there are several applications which are run as described
herein. The applications simulated are shown below and are based on user requirements at
the scene of a major event or incident. Results are presented in this report for background
traffic levels of 0%, 10% & 50% as the most representative based on the results achieved.
The performance effects of additional background traffic and number of network users were
shown to be well demonstrated in these 3 different traffic levels and thus further simulations
were not necessary, such results would have taken considerable time to run but offered little
additional information. OPNET was used as the simulator of choice for these simulations.
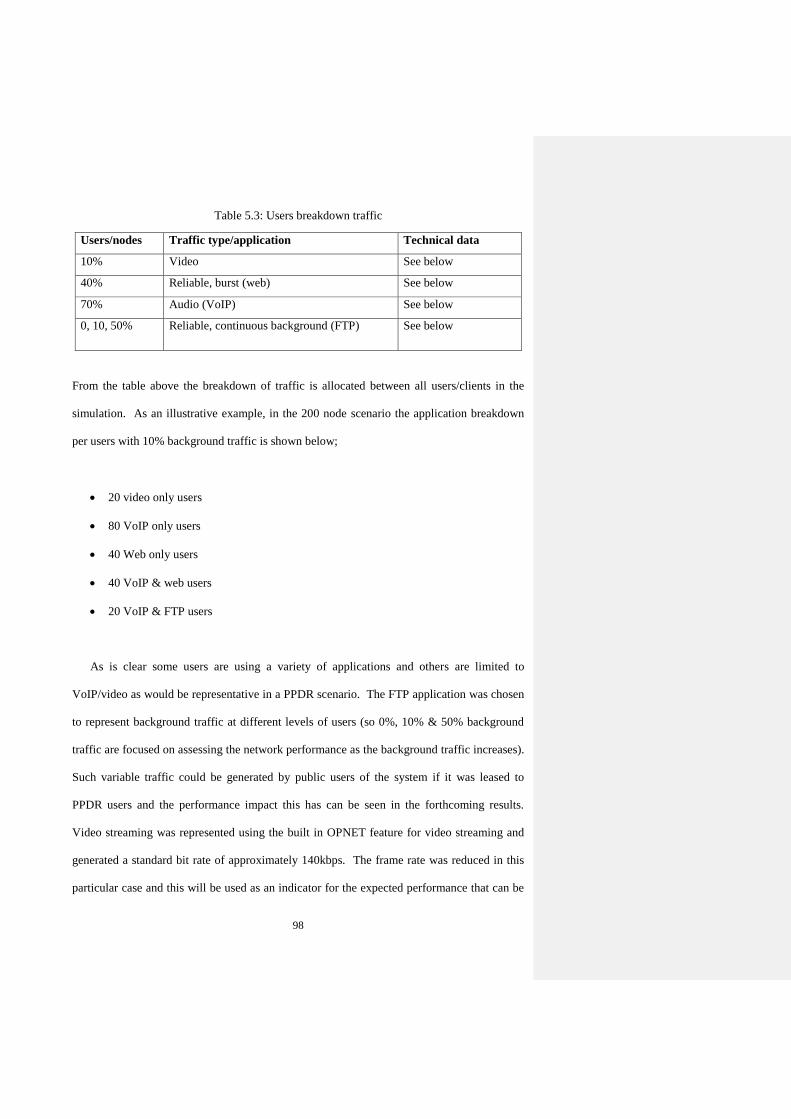
98
Table 5.3: Users breakdown traffic
Users/nodes Traffic type/application Technical data
10% Video See below
40% Reliable, burst (web) See below
70% Audio (VoIP) See below
0, 10, 50% Reliable, continuous background (FTP) See below
From the table above the breakdown of traffic is allocated between all users/clients in the
simulation. As an illustrative example, in the 200 node scenario the application breakdown
per users with 10% background traffic is shown below;
20 video only users
80 VoIP only users
40 Web only users
40 VoIP & web users
20 VoIP & FTP users
As is clear some users are using a variety of applications and others are limited to
VoIP/video as would be representative in a PPDR scenario. The FTP application was chosen
to represent background traffic at different levels of users (so 0%, 10% & 50% background
traffic are focused on assessing the network performance as the background traffic increases).
Such variable traffic could be generated by public users of the system if it was leased to
PPDR users and the performance impact this has can be seen in the forthcoming results.
Video streaming was represented using the built in OPNET feature for video streaming and
generated a standard bit rate of approximately 140kbps. The frame rate was reduced in this
particular case and this will be used as an indicator for the expected performance that can be
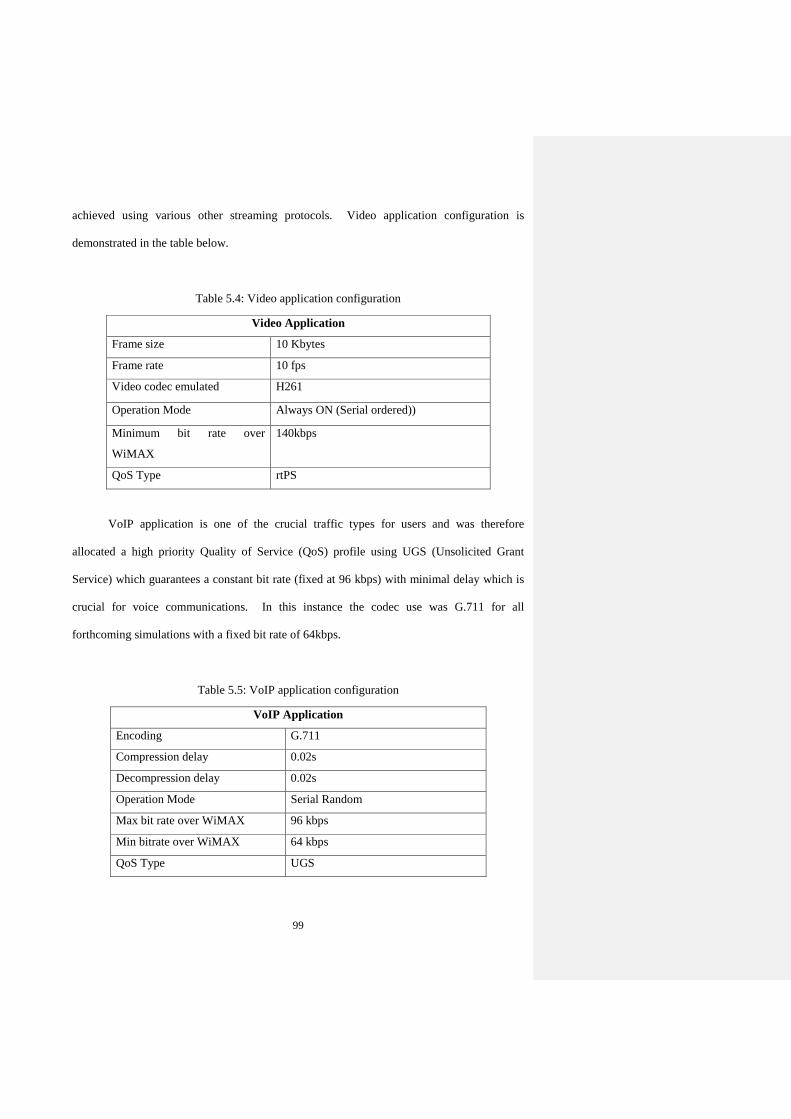
99
achieved using various other streaming protocols. Video application configuration is
demonstrated in the table below.
Table 5.4: Video application configuration
Video Application
Frame size 10 Kbytes
Frame rate 10 fps
Video codec emulated H261
Operation Mode Always ON (Serial ordered))
Minimum bit rate over
WiMAX
140kbps
QoS Type rtPS
VoIP application is one of the crucial traffic types for users and was therefore
allocated a high priority Quality of Service (QoS) profile using UGS (Unsolicited Grant
Service) which guarantees a constant bit rate (fixed at 96 kbps) with minimal delay which is
crucial for voice communications. In this instance the codec use was G.711 for all
forthcoming simulations with a fixed bit rate of 64kbps.
Table 5.5: VoIP application configuration
VoIP Application
Encoding G.711
Compression delay 0.02s
Decompression delay 0.02s
Operation Mode Serial Random
Max bit rate over WiMAX 96 kbps
Min bitrate over WiMAX 64 kbps
QoS Type UGS
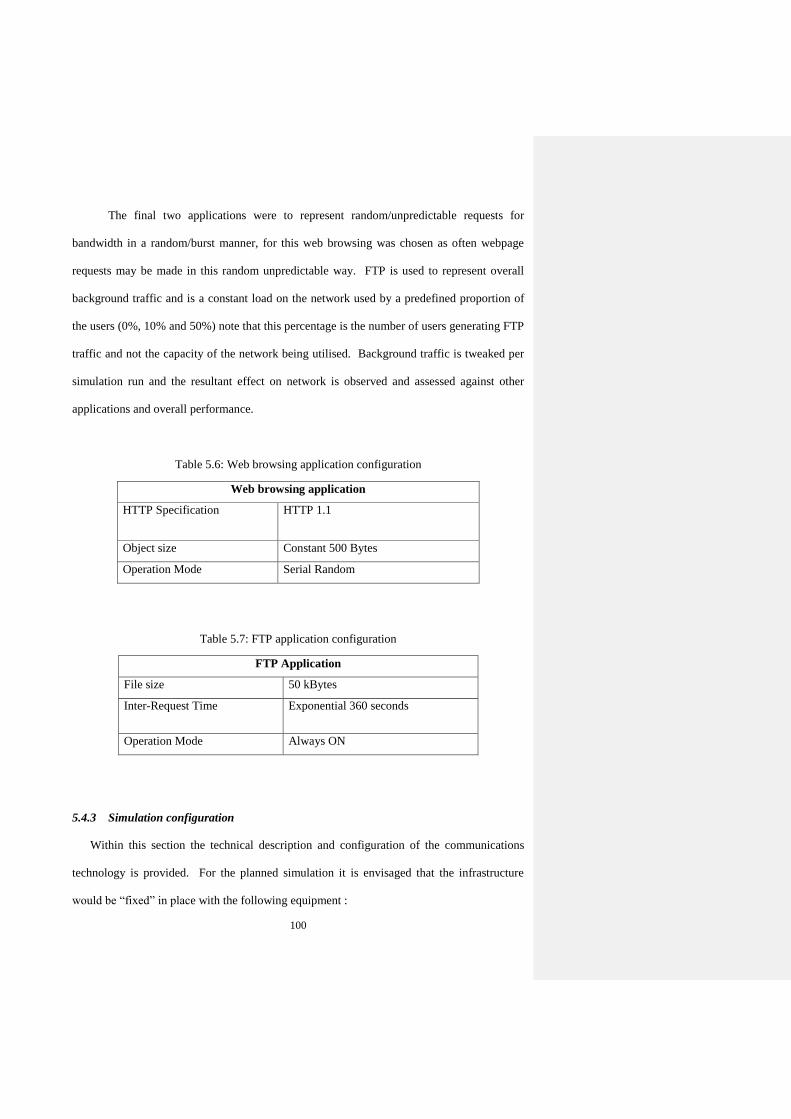
100
The final two applications were to represent random/unpredictable requests for
bandwidth in a random/burst manner, for this web browsing was chosen as often webpage
requests may be made in this random unpredictable way. FTP is used to represent overall
background traffic and is a constant load on the network used by a predefined proportion of
the users (0%, 10% and 50%) note that this percentage is the number of users generating FTP
traffic and not the capacity of the network being utilised. Background traffic is tweaked per
simulation run and the resultant effect on network is observed and assessed against other
applications and overall performance.
Table 5.6: Web browsing application configuration
Web browsing application
HTTP Specification HTTP 1.1
Object size Constant 500 Bytes
Operation Mode Serial Random
Table 5.7: FTP application configuration
FTP Application
File size 50 kBytes
Inter-Request Time Exponential 360 seconds
Operation Mode Always ON
5.4.3 Simulation configuration
Within this section the technical description and configuration of the communications
technology is provided. For the planned simulation it is envisaged that the infrastructure
would be “fixed” in place with the following equipment :
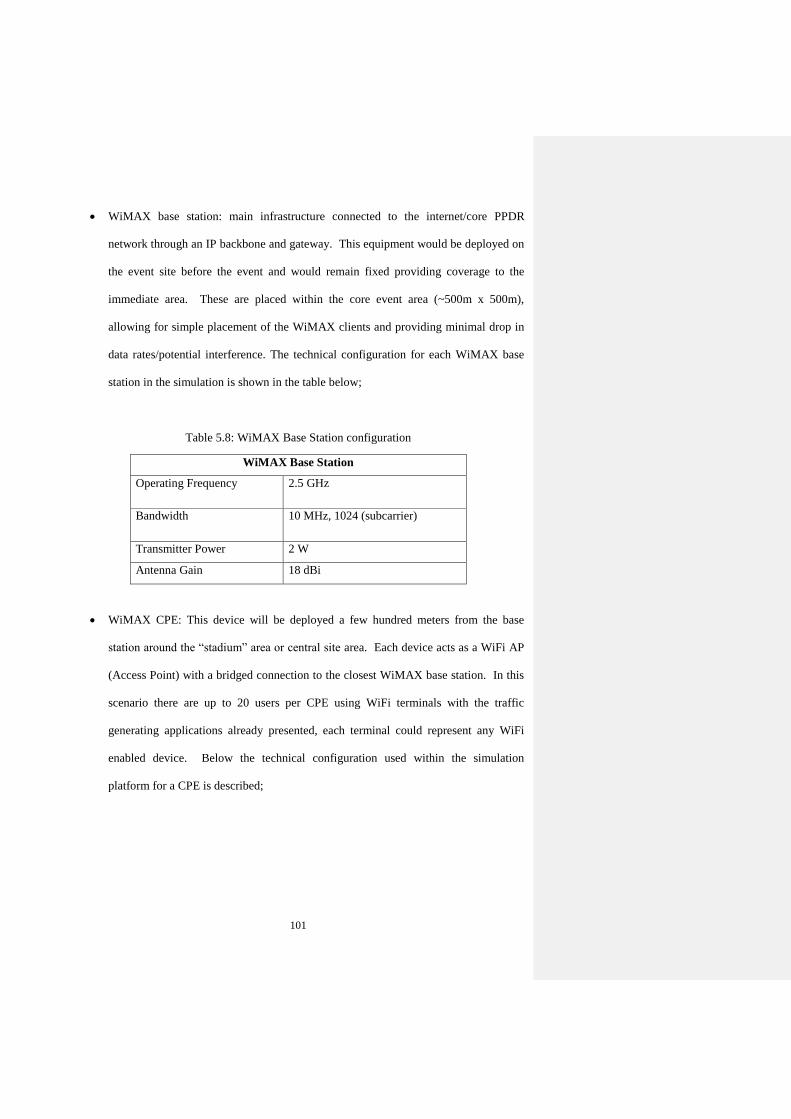
101
WiMAX base station: main infrastructure connected to the internet/core PPDR
network through an IP backbone and gateway. This equipment would be deployed on
the event site before the event and would remain fixed providing coverage to the
immediate area. These are placed within the core event area (~500m x 500m),
allowing for simple placement of the WiMAX clients and providing minimal drop in
data rates/potential interference. The technical configuration for each WiMAX base
station in the simulation is shown in the table below;
Table 5.8: WiMAX Base Station configuration
WiMAX Base Station
Operating Frequency 2.5 GHz
Bandwidth 10 MHz, 1024 (subcarrier)
Transmitter Power 2 W
Antenna Gain 18 dBi
WiMAX CPE: This device will be deployed a few hundred meters from the base
station around the “stadium” area or central site area. Each device acts as a WiFi AP
(Access Point) with a bridged connection to the closest WiMAX base station. In this
scenario there are up to 20 users per CPE using WiFi terminals with the traffic
generating applications already presented, each terminal could represent any WiFi
enabled device. Below the technical configuration used within the simulation
platform for a CPE is described;
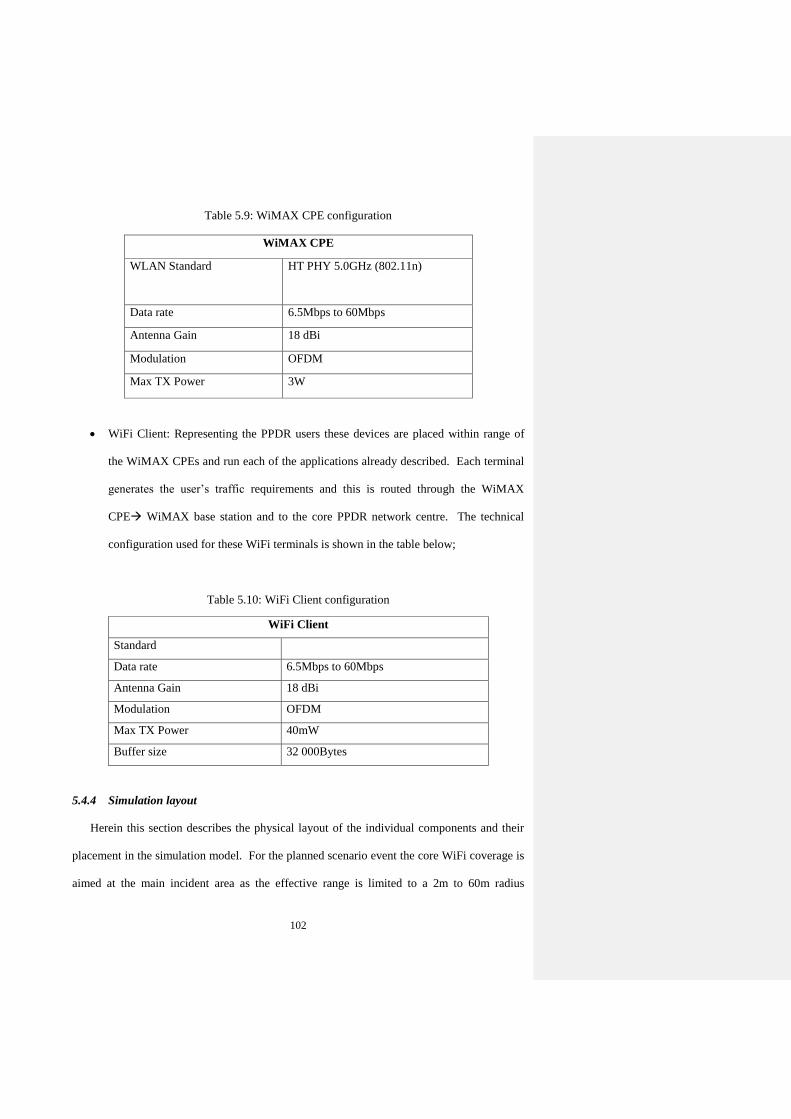
102
Table 5.9: WiMAX CPE configuration
WiFi Client: Representing the PPDR users these devices are placed within range of
the WiMAX CPEs and run each of the applications already described. Each terminal
generates the user’s traffic requirements and this is routed through the WiMAX
CPE WiMAX base station and to the core PPDR network centre. The technical
configuration used for these WiFi terminals is shown in the table below;
Table 5.10: WiFi Client configuration
WiFi Client
Standard
Data rate 6.5Mbps to 60Mbps
Antenna Gain 18 dBi
Modulation OFDM
Max TX Power 40mW
Buffer size 32 000Bytes
5.4.4 Simulation layout
Herein this section describes the physical layout of the individual components and their
placement in the simulation model. For the planned scenario event the core WiFi coverage is
aimed at the main incident area as the effective range is limited to a 2m to 60m radius
WiMAX CPE
WLAN Standard HT PHY 5.0GHz (802.11n)
Data rate 6.5Mbps to 60Mbps
Antenna Gain 18 dBi
Modulation OFDM
Max TX Power 3W
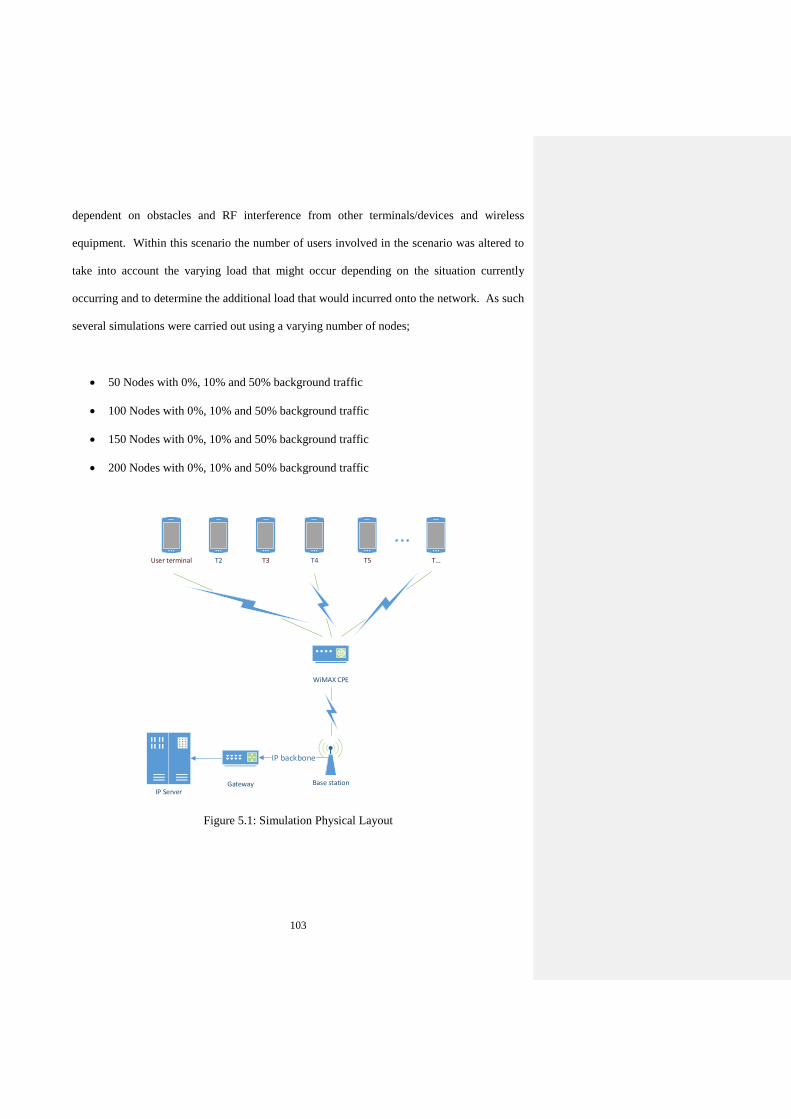
103
dependent on obstacles and RF interference from other terminals/devices and wireless
equipment. Within this scenario the number of users involved in the scenario was altered to
take into account the varying load that might occur depending on the situation currently
occurring and to determine the additional load that would incurred onto the network. As such
several simulations were carried out using a varying number of nodes;
50 Nodes with 0%, 10% and 50% background traffic
100 Nodes with 0%, 10% and 50% background traffic
150 Nodes with 0%, 10% and 50% background traffic
200 Nodes with 0%, 10% and 50% background traffic
Base station
WiMAX CPE
IP backbone
IP ServerGateway
T2 T4User terminal T3 T5 T...
...
Figure 5.1: Simulation Physical Layout
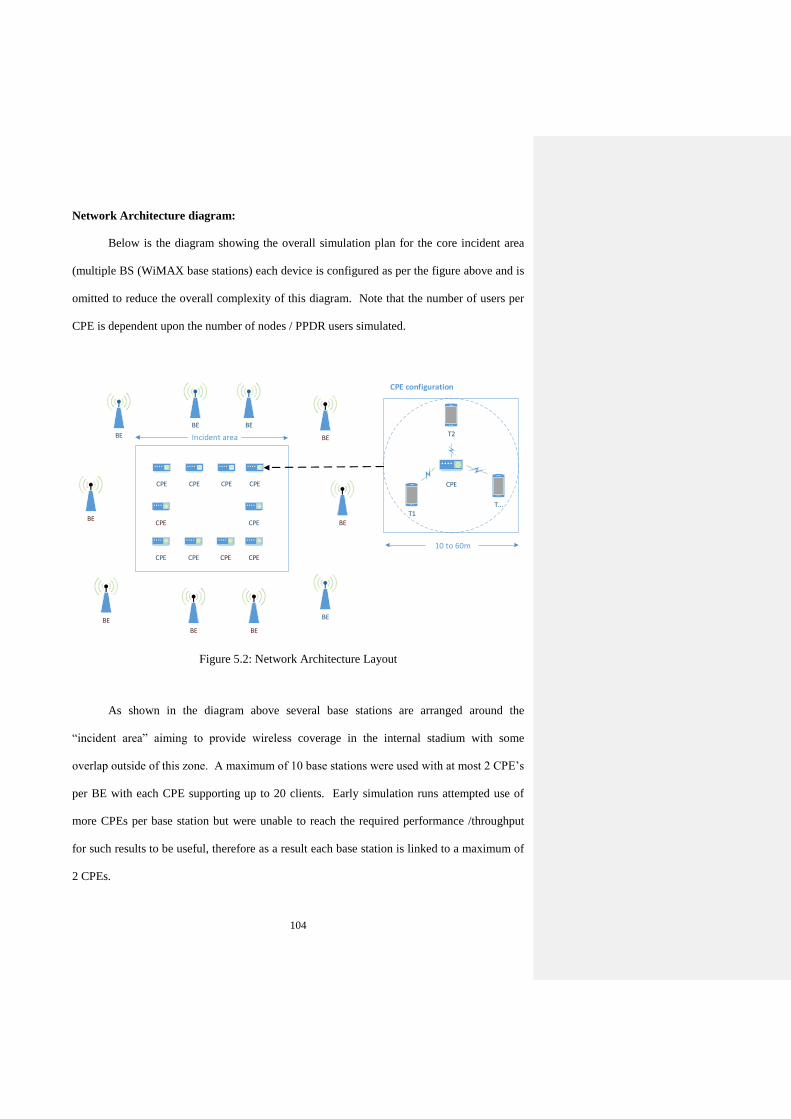
104
Network Architecture diagram:
Below is the diagram showing the overall simulation plan for the core incident area
(multiple BS (WiMAX base stations) each device is configured as per the figure above and is
omitted to reduce the overall complexity of this diagram. Note that the number of users per
CPE is dependent upon the number of nodes / PPDR users simulated.
BE
BE BE
BE
BEBE
BE
BE
BE
BE
CPE CPE CPE CPE
CPE CPE CPE CPE
CPECPE
CPE
T2
T1T...
10 to 60m
Incident area
CPE configuration
Figure 5.2: Network Architecture Layout
As shown in the diagram above several base stations are arranged around the
“incident area” aiming to provide wireless coverage in the internal stadium with some
overlap outside of this zone. A maximum of 10 base stations were used with at most 2 CPE’s
per BE with each CPE supporting up to 20 clients. Early simulation runs attempted use of
more CPEs per base station but were unable to reach the required performance /throughput
for such results to be useful, therefore as a result each base station is linked to a maximum of
2 CPEs.
105
5.4.5 Simulation results
Results for the planned scenario section are presented within this section with
discussion/analysis. These results assess the following in terms of performance
characteristics –
Throughput – Mean throughput for relevant applications per user.
Mean packet delay : average delay or latency for packet delivery from the user
terminal to the core network measured per application
Jitter – jitter performance is measured for VoIP application performance to assess
network performance.
Packet delivery performance – Measure of the average number of packets which are
transmitted/received to ascertain capability of the network to route traffic effectively.
5.4.5.1 Video results
One of the next generation applications and not currently a widespread application,
performance here could be of crucial importance for the mid to long term in PPDR networks.
Results are shown in this section for the performance achieved for 50, 100, 150 and 200
nodes with the varying background traffic levels, taking into account the metrics noted above.
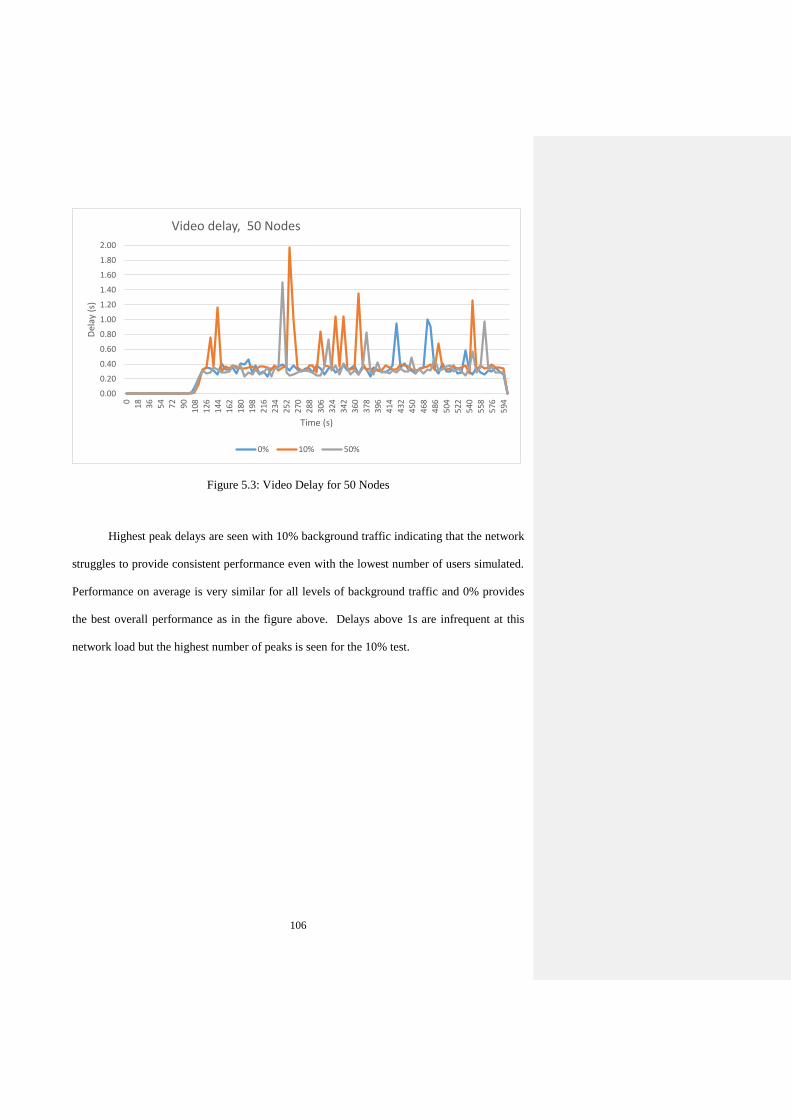
106
Figure 5.3: Video Delay for 50 Nodes
Highest peak delays are seen with 10% background traffic indicating that the network
struggles to provide consistent performance even with the lowest number of users simulated.
Performance on average is very similar for all levels of background traffic and 0% provides
the best overall performance as in the figure above. Delays above 1s are infrequent at this
network load but the highest number of peaks is seen for the 10% test.
0.00
0.20
0.40
0.60
0.80
1.00
1.20
1.40
1.60
1.80
2.00
0
18
36
54
72
90
108
126
144
162
180
198
216
234
252
270
288
306
324
342
360
378
396
414
432
450
468
486
504
522
540
558
576
594
Del
ay (
s)
Time (s)
Video delay, 50 Nodes
0% 10% 50%
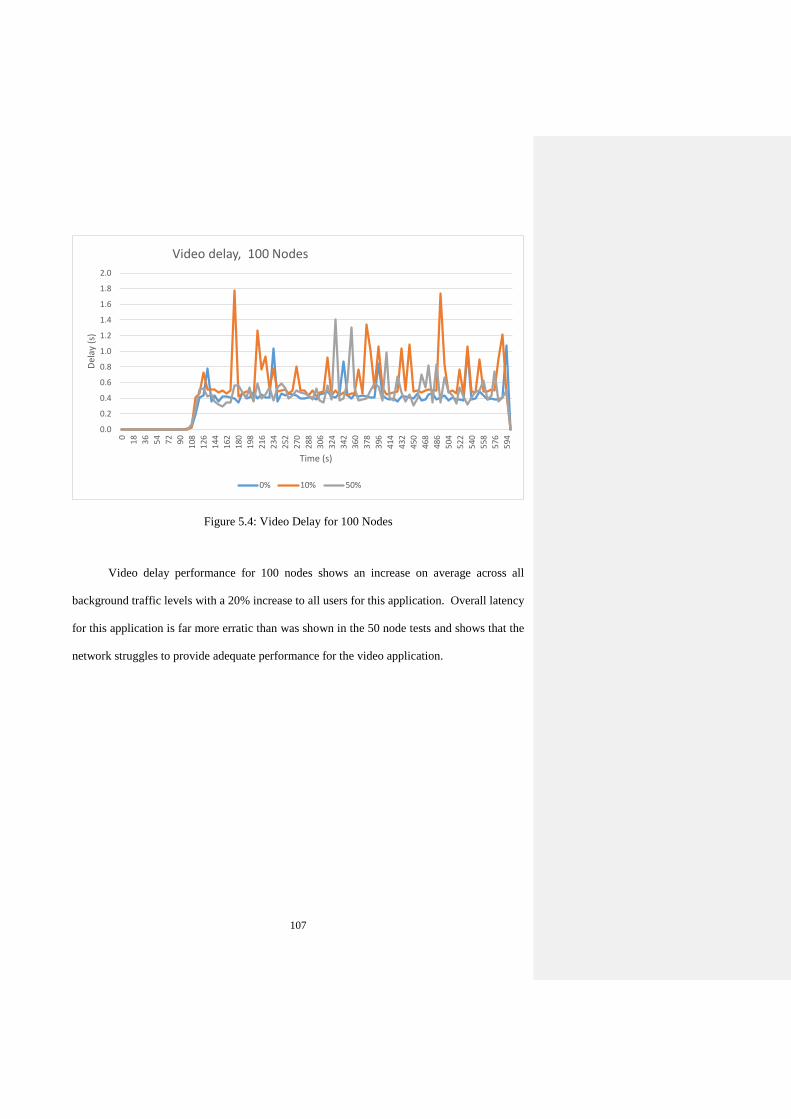
107
Figure 5.4: Video Delay for 100 Nodes
Video delay performance for 100 nodes shows an increase on average across all
background traffic levels with a 20% increase to all users for this application. Overall latency
for this application is far more erratic than was shown in the 50 node tests and shows that the
network struggles to provide adequate performance for the video application.
0.0
0.2
0.4
0.6
0.8
1.0
1.2
1.4
1.6
1.8
2.0
0
18
36
54
72
90
108
126
144
162
180
198
216
234
252
270
288
306
324
342
360
378
396
414
432
450
468
486
504
522
540
558
576
594
Del
ay (
s)
Time (s)
Video delay, 100 Nodes
0% 10% 50%
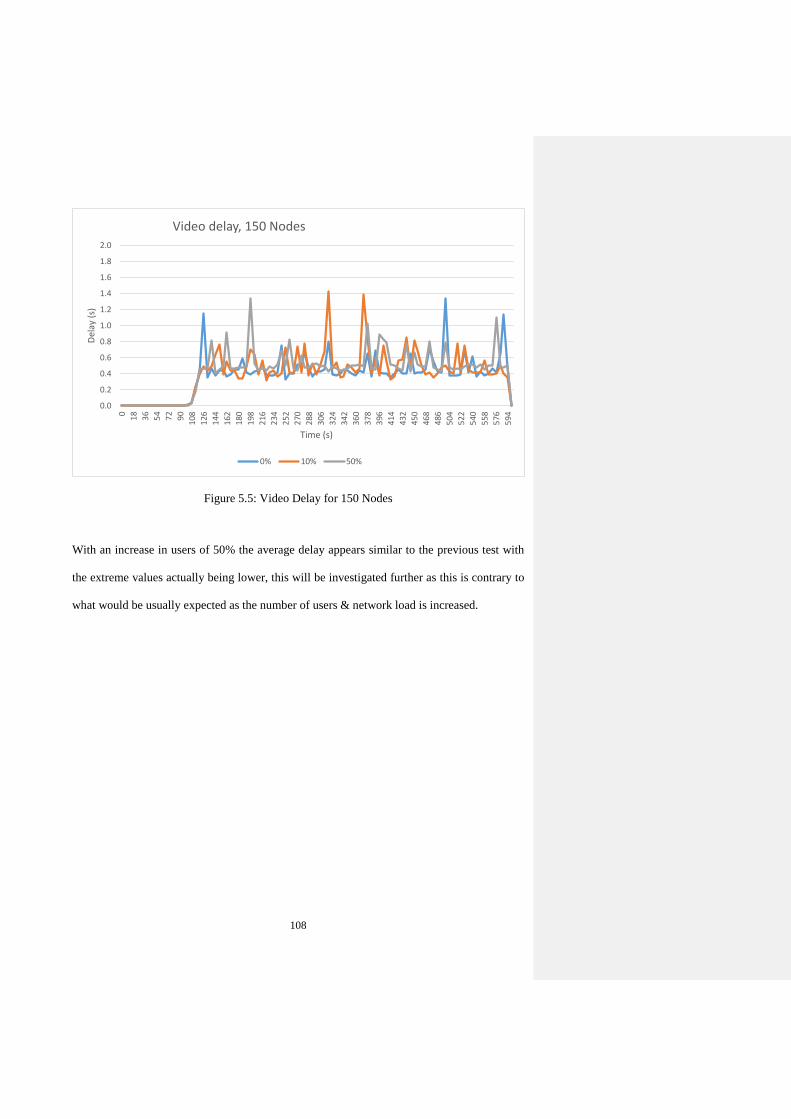
108
Figure 5.5: Video Delay for 150 Nodes
With an increase in users of 50% the average delay appears similar to the previous test with
the extreme values actually being lower, this will be investigated further as this is contrary to
what would be usually expected as the number of users & network load is increased.
0.0
0.2
0.4
0.6
0.8
1.0
1.2
1.4
1.6
1.8
2.0
0
18
36
54
72
90
108
126
144
162
180
198
216
234
252
270
288
306
324
342
360
378
396
414
432
450
468
486
504
522
540
558
576
594
Del
ay (
s)
Time (s)
Video delay, 150 Nodes
0% 10% 50%
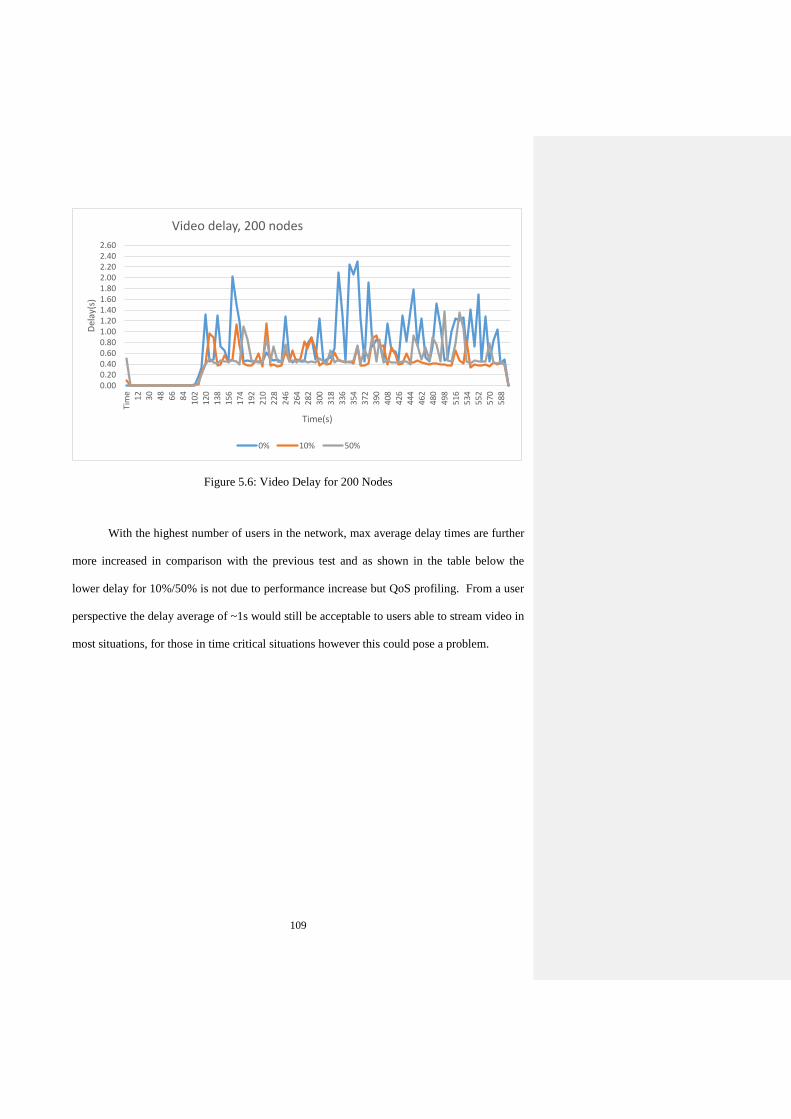
109
Figure 5.6: Video Delay for 200 Nodes
With the highest number of users in the network, max average delay times are further
more increased in comparison with the previous test and as shown in the table below the
lower delay for 10%/50% is not due to performance increase but QoS profiling. From a user
perspective the delay average of ~1s would still be acceptable to users able to stream video in
most situations, for those in time critical situations however this could pose a problem.
0.000.200.400.600.801.001.201.401.601.802.002.202.402.60
Tim
e1
23
04
86
68
41
021
20
138
156
174
192
210
228
246
264
282
300
318
336
354
372
390
408
426
444
462
480
498
516
534
552
570
588
Del
ay(s
)
Time(s)
Video delay, 200 nodes
0% 10% 50%
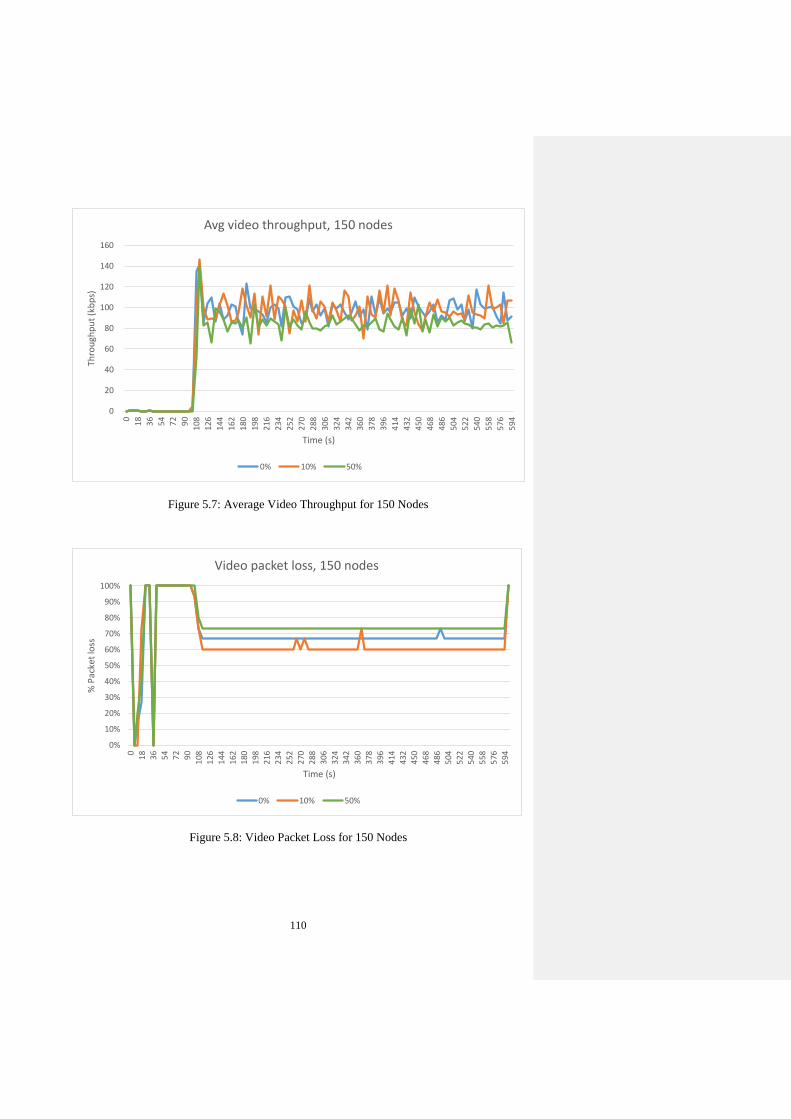
110
Figure 5.7: Average Video Throughput for 150 Nodes
Figure 5.8: Video Packet Loss for 150 Nodes
0
20
40
60
80
100
120
140
160
0
18
36
54
72
90
108
126
144
162
180
198
216
234
252
270
288
306
324
342
360
378
396
414
432
450
468
486
504
522
540
558
576
594
Thro
ugh
pu
t (k
bp
s)
Time (s)
Avg video throughput, 150 nodes
0% 10% 50%
0%
10%
20%
30%
40%
50%
60%
70%
80%
90%
100%
01
83
65
47
29
01
081
261
441
621
801
982
162
342
522
702
883
063
243
423
603
783
964
14
432
450
468
486
504
522
540
558
576
594
% P
acke
t lo
ss
Time (s)
Video packet loss, 150 nodes
0% 10% 50%
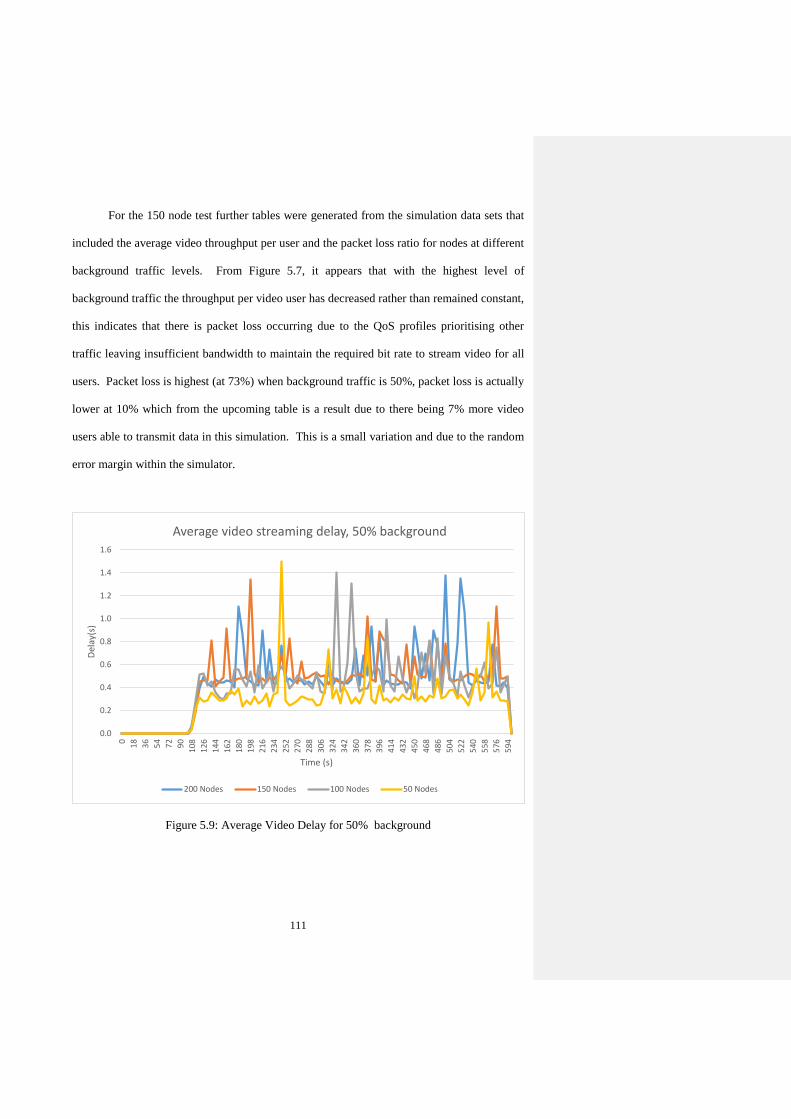
111
For the 150 node test further tables were generated from the simulation data sets that
included the average video throughput per user and the packet loss ratio for nodes at different
background traffic levels. From Figure 5.7, it appears that with the highest level of
background traffic the throughput per video user has decreased rather than remained constant,
this indicates that there is packet loss occurring due to the QoS profiles prioritising other
traffic leaving insufficient bandwidth to maintain the required bit rate to stream video for all
users. Packet loss is highest (at 73%) when background traffic is 50%, packet loss is actually
lower at 10% which from the upcoming table is a result due to there being 7% more video
users able to transmit data in this simulation. This is a small variation and due to the random
error margin within the simulator.
Figure 5.9: Average Video Delay for 50% background
0.0
0.2
0.4
0.6
0.8
1.0
1.2
1.4
1.6
0
18
36
54
72
90
108
126
144
162
180
198
216
234
252
270
288
306
324
342
360
378
396
414
432
450
468
486
504
522
540
558
576
594
Del
ay(s
)
Time (s)
Average video streaming delay, 50% background
200 Nodes 150 Nodes 100 Nodes 50 Nodes
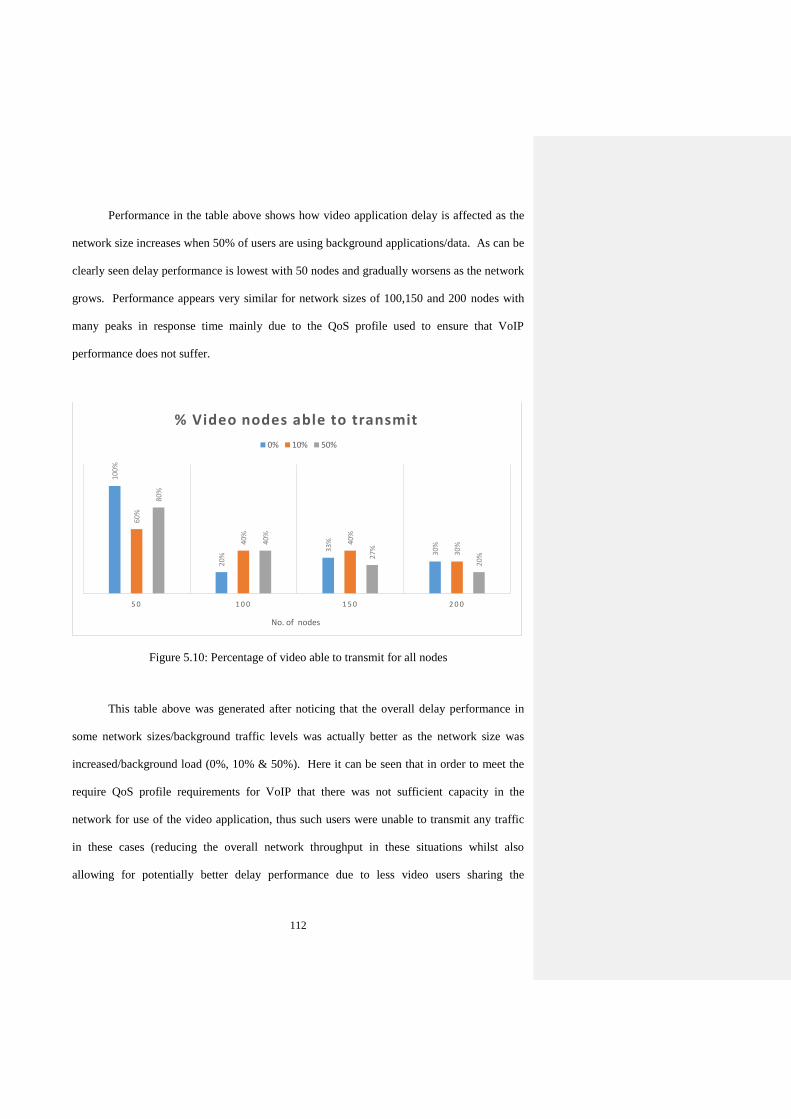
112
Performance in the table above shows how video application delay is affected as the
network size increases when 50% of users are using background applications/data. As can be
clearly seen delay performance is lowest with 50 nodes and gradually worsens as the network
grows. Performance appears very similar for network sizes of 100,150 and 200 nodes with
many peaks in response time mainly due to the QoS profile used to ensure that VoIP
performance does not suffer.
Figure 5.10: Percentage of video able to transmit for all nodes
This table above was generated after noticing that the overall delay performance in
some network sizes/background traffic levels was actually better as the network size was
increased/background load (0%, 10% & 50%). Here it can be seen that in order to meet the
require QoS profile requirements for VoIP that there was not sufficient capacity in the
network for use of the video application, thus such users were unable to transmit any traffic
in these cases (reducing the overall network throughput in these situations whilst also
allowing for potentially better delay performance due to less video users sharing the
100%
20%
33%
30%
60%
40%
40%
30%
80%
40%
27%
20%
5 0 1 0 0 1 5 0 2 0 0
No. of nodes
% Video nodes able to transmit
0% 10% 50%
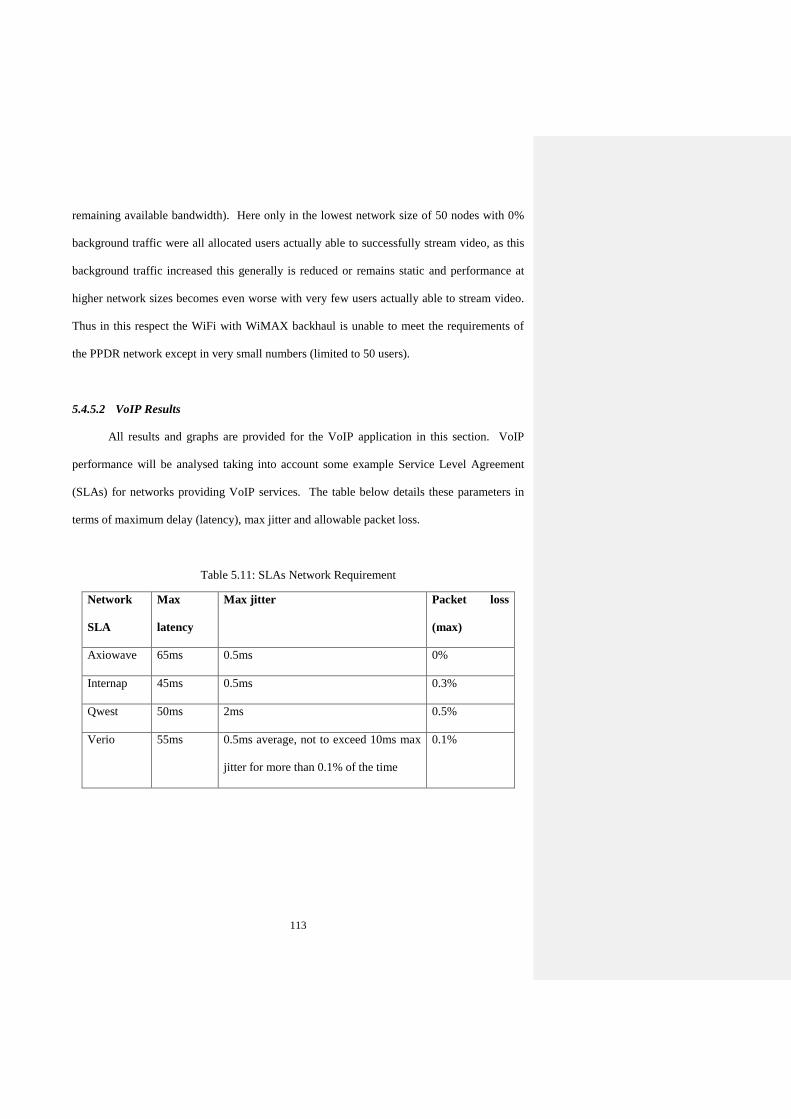
113
remaining available bandwidth). Here only in the lowest network size of 50 nodes with 0%
background traffic were all allocated users actually able to successfully stream video, as this
background traffic increased this generally is reduced or remains static and performance at
higher network sizes becomes even worse with very few users actually able to stream video.
Thus in this respect the WiFi with WiMAX backhaul is unable to meet the requirements of
the PPDR network except in very small numbers (limited to 50 users).
5.4.5.2 VoIP Results
All results and graphs are provided for the VoIP application in this section. VoIP
performance will be analysed taking into account some example Service Level Agreement
(SLAs) for networks providing VoIP services. The table below details these parameters in
terms of maximum delay (latency), max jitter and allowable packet loss.
Table 5.11: SLAs Network Requirement
Network
SLA
Max
latency
Max jitter Packet loss
(max)
Axiowave 65ms 0.5ms 0%
Internap 45ms 0.5ms 0.3%
Qwest 50ms 2ms 0.5%
Verio 55ms 0.5ms average, not to exceed 10ms max
jitter for more than 0.1% of the time
0.1%
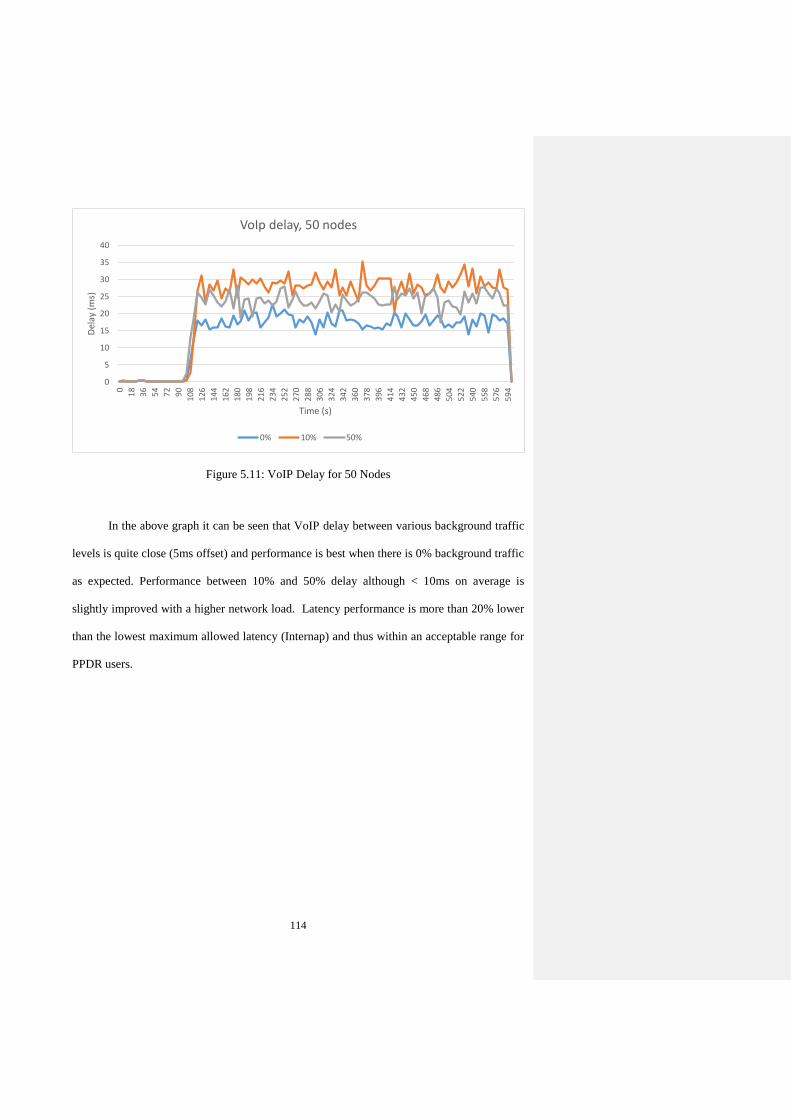
114
Figure 5.11: VoIP Delay for 50 Nodes
In the above graph it can be seen that VoIP delay between various background traffic
levels is quite close (5ms offset) and performance is best when there is 0% background traffic
as expected. Performance between 10% and 50% delay although < 10ms on average is
slightly improved with a higher network load. Latency performance is more than 20% lower
than the lowest maximum allowed latency (Internap) and thus within an acceptable range for
PPDR users.
0
5
10
15
20
25
30
35
40
0
18
36
54
72
90
108
126
144
162
180
198
216
234
252
270
288
306
324
342
360
378
396
414
432
450
468
486
504
522
540
558
576
594
Del
ay (
ms)
Time (s)
VoIp delay, 50 nodes
0% 10% 50%
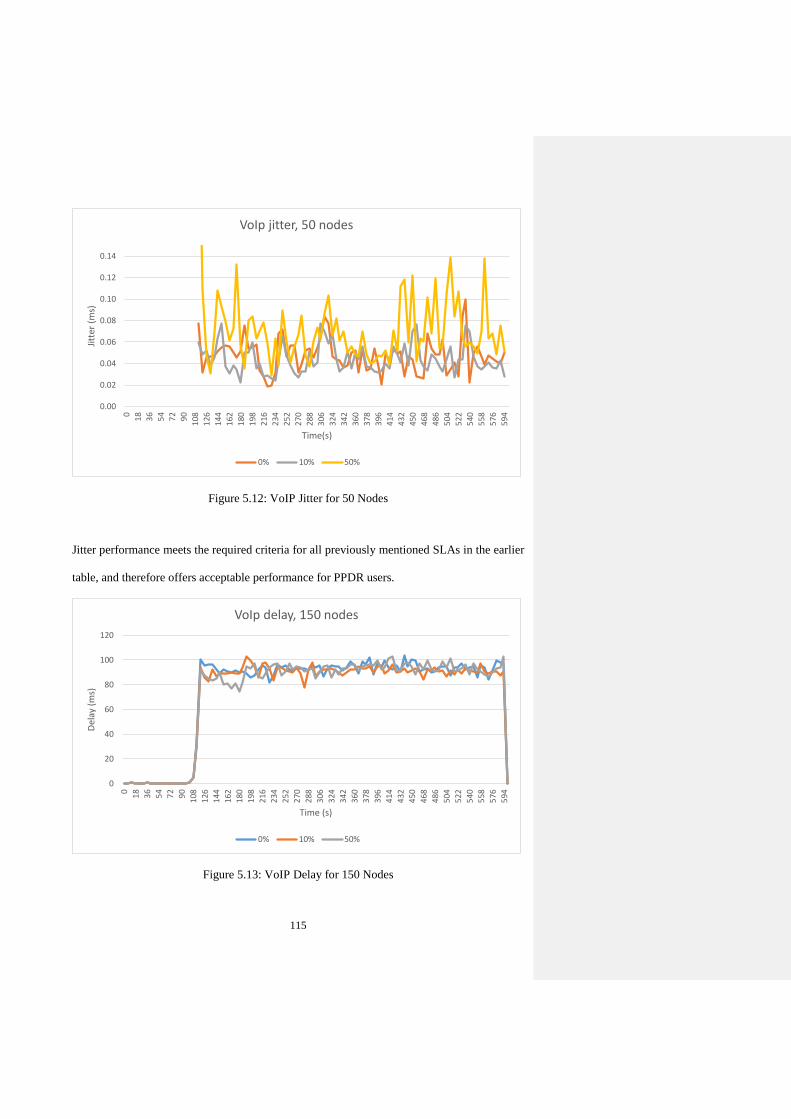
115
Figure 5.12: VoIP Jitter for 50 Nodes
Jitter performance meets the required criteria for all previously mentioned SLAs in the earlier
table, and therefore offers acceptable performance for PPDR users.
Figure 5.13: VoIP Delay for 150 Nodes
0.00
0.02
0.04
0.06
0.08
0.10
0.12
0.14
0
18
36
54
72
90
108
126
144
162
180
198
216
234
252
270
288
306
324
342
360
378
396
414
432
450
468
486
504
522
540
558
576
594
Jitt
er (
ms)
Time(s)
VoIp jitter, 50 nodes
0% 10% 50%
0
20
40
60
80
100
120
0
18
36
54
72
90
108
126
144
162
180
198
216
234
252
270
288
306
324
342
360
378
396
414
432
450
468
486
504
522
540
558
576
594
Del
ay (
ms)
Time (s)
VoIp delay, 150 nodes
0% 10% 50%
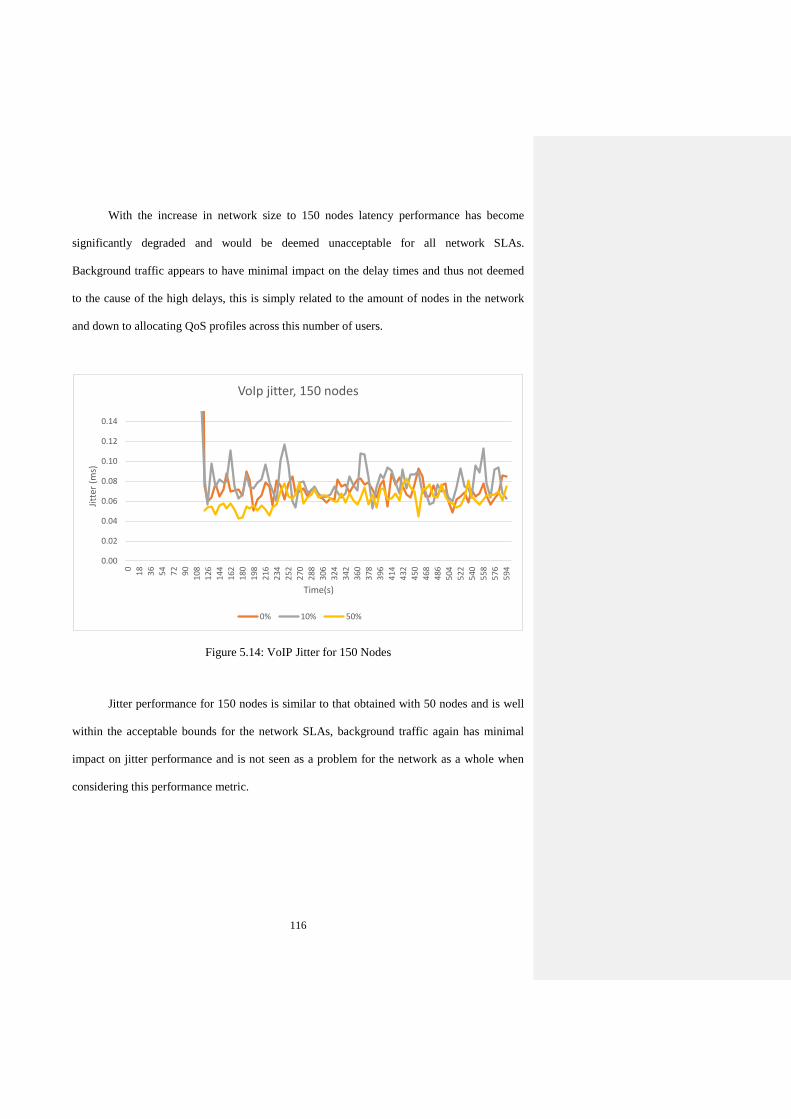
116
With the increase in network size to 150 nodes latency performance has become
significantly degraded and would be deemed unacceptable for all network SLAs.
Background traffic appears to have minimal impact on the delay times and thus not deemed
to the cause of the high delays, this is simply related to the amount of nodes in the network
and down to allocating QoS profiles across this number of users.
Figure 5.14: VoIP Jitter for 150 Nodes
Jitter performance for 150 nodes is similar to that obtained with 50 nodes and is well
within the acceptable bounds for the network SLAs, background traffic again has minimal
impact on jitter performance and is not seen as a problem for the network as a whole when
considering this performance metric.
0.00
0.02
0.04
0.06
0.08
0.10
0.12
0.14
0
18
36
54
72
90
108
126
144
162
180
198
216
234
252
270
288
306
324
342
360
378
396
414
432
450
468
486
504
522
540
558
576
594
Jitt
er (
ms)
Time(s)
VoIp jitter, 150 nodes
0% 10% 50%
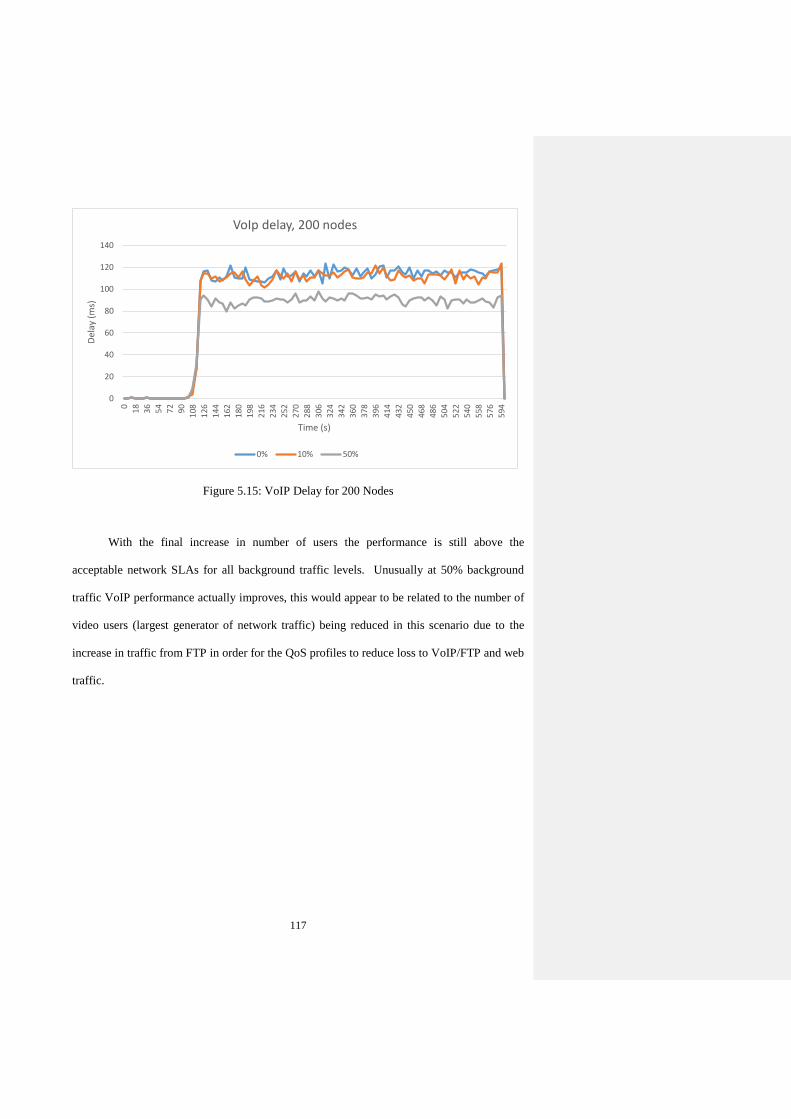
117
Figure 5.15: VoIP Delay for 200 Nodes
With the final increase in number of users the performance is still above the
acceptable network SLAs for all background traffic levels. Unusually at 50% background
traffic VoIP performance actually improves, this would appear to be related to the number of
video users (largest generator of network traffic) being reduced in this scenario due to the
increase in traffic from FTP in order for the QoS profiles to reduce loss to VoIP/FTP and web
traffic.
0
20
40
60
80
100
120
140
0
18
36
54
72
90
108
126
144
162
180
198
216
234
252
270
288
306
324
342
360
378
396
414
432
450
468
486
504
522
540
558
576
594
Del
ay (
ms)
Time (s)
VoIp delay, 200 nodes
0% 10% 50%
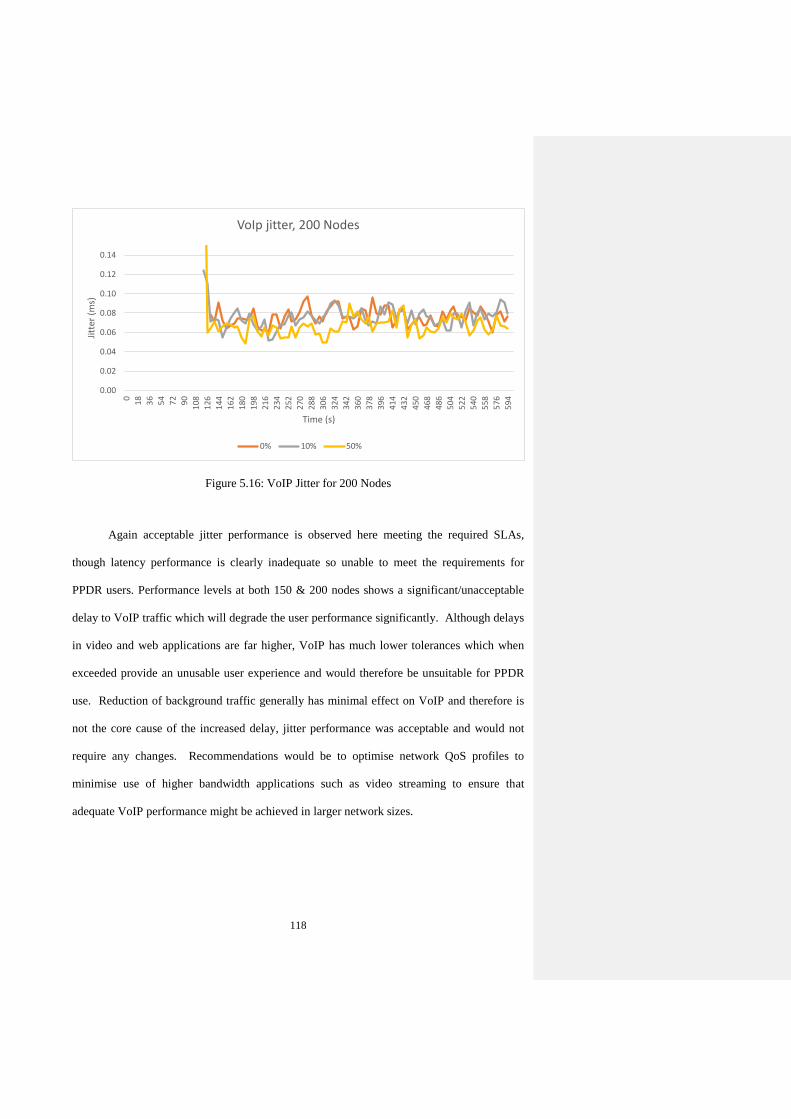
118
Figure 5.16: VoIP Jitter for 200 Nodes
Again acceptable jitter performance is observed here meeting the required SLAs,
though latency performance is clearly inadequate so unable to meet the requirements for
PPDR users. Performance levels at both 150 & 200 nodes shows a significant/unacceptable
delay to VoIP traffic which will degrade the user performance significantly. Although delays
in video and web applications are far higher, VoIP has much lower tolerances which when
exceeded provide an unusable user experience and would therefore be unsuitable for PPDR
use. Reduction of background traffic generally has minimal effect on VoIP and therefore is
not the core cause of the increased delay, jitter performance was acceptable and would not
require any changes. Recommendations would be to optimise network QoS profiles to
minimise use of higher bandwidth applications such as video streaming to ensure that
adequate VoIP performance might be achieved in larger network sizes.
0.00
0.02
0.04
0.06
0.08
0.10
0.12
0.14
0
18
36
54
72
90
108
126
144
162
180
198
216
234
252
270
288
306
324
342
360
378
396
414
432
450
468
486
504
522
540
558
576
594
Jitt
er (
ms)
Time (s)
VoIp jitter, 200 Nodes
0% 10% 50%
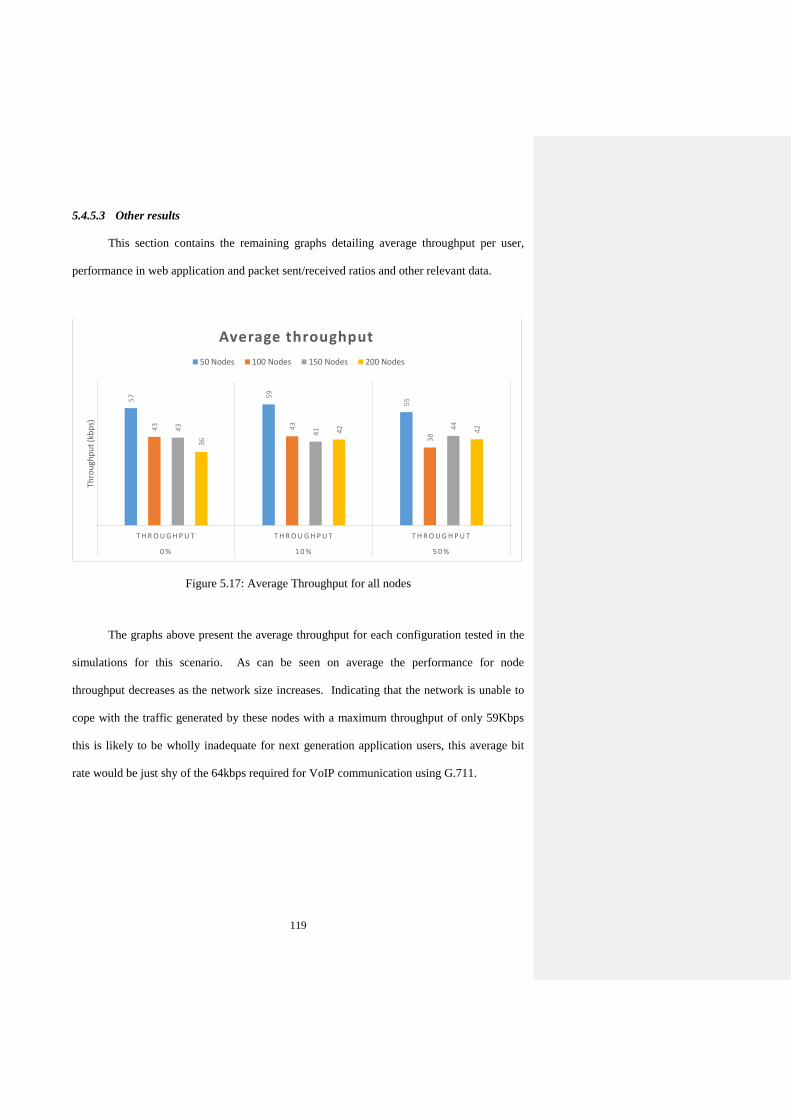
119
5.4.5.3 Other results
This section contains the remaining graphs detailing average throughput per user,
performance in web application and packet sent/received ratios and other relevant data.
Figure 5.17: Average Throughput for all nodes
The graphs above present the average throughput for each configuration tested in the
simulations for this scenario. As can be seen on average the performance for node
throughput decreases as the network size increases. Indicating that the network is unable to
cope with the traffic generated by these nodes with a maximum throughput of only 59Kbps
this is likely to be wholly inadequate for next generation application users, this average bit
rate would be just shy of the 64kbps required for VoIP communication using G.711.
57 59
55
43 43
38
43
41
44
36
42 42
T H R O U G H P U T T H R O U G H P U T T H R O U G H P U T
0 % 1 0 % 5 0 %
Thro
ugh
pu
t (k
bp
s)
Average throughput
50 Nodes 100 Nodes 150 Nodes 200 Nodes
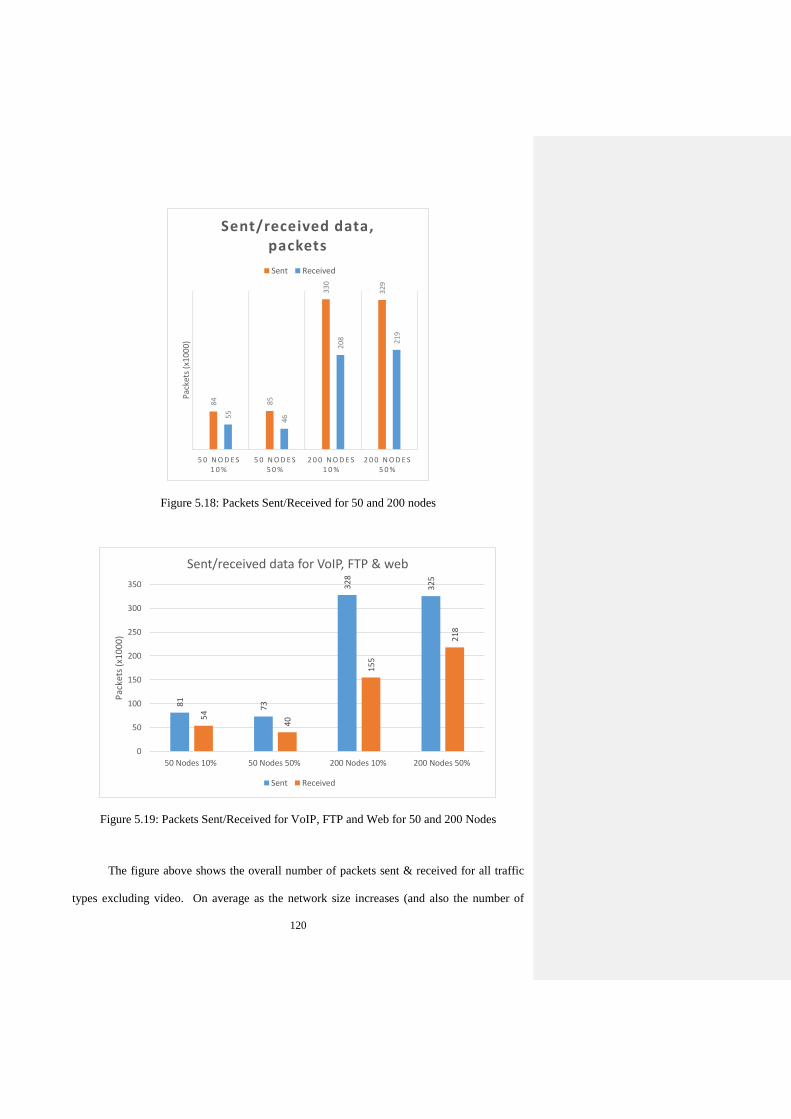
120
Figure 5.18: Packets Sent/Received for 50 and 200 nodes
Figure 5.19: Packets Sent/Received for VoIP, FTP and Web for 50 and 200 Nodes
The figure above shows the overall number of packets sent & received for all traffic
types excluding video. On average as the network size increases (and also the number of
84 85
330
329
55
46
208 21
9
5 0 N O D E S 1 0 %
5 0 N O D E S 5 0 %
2 0 0 N O D E S 1 0 %
2 0 0 N O D E S 5 0 %
Pac
kets
(x1
00
0)
Sent/received data, packets
Sent Received
81
73
32
8
32
5
54
40
15
5
21
8
0
50
100
150
200
250
300
350
50 Nodes 10% 50 Nodes 50% 200 Nodes 10% 200 Nodes 50%
Pac
kets
(x1
00
0)
Sent/received data for VoIP, FTP & web
Sent Received
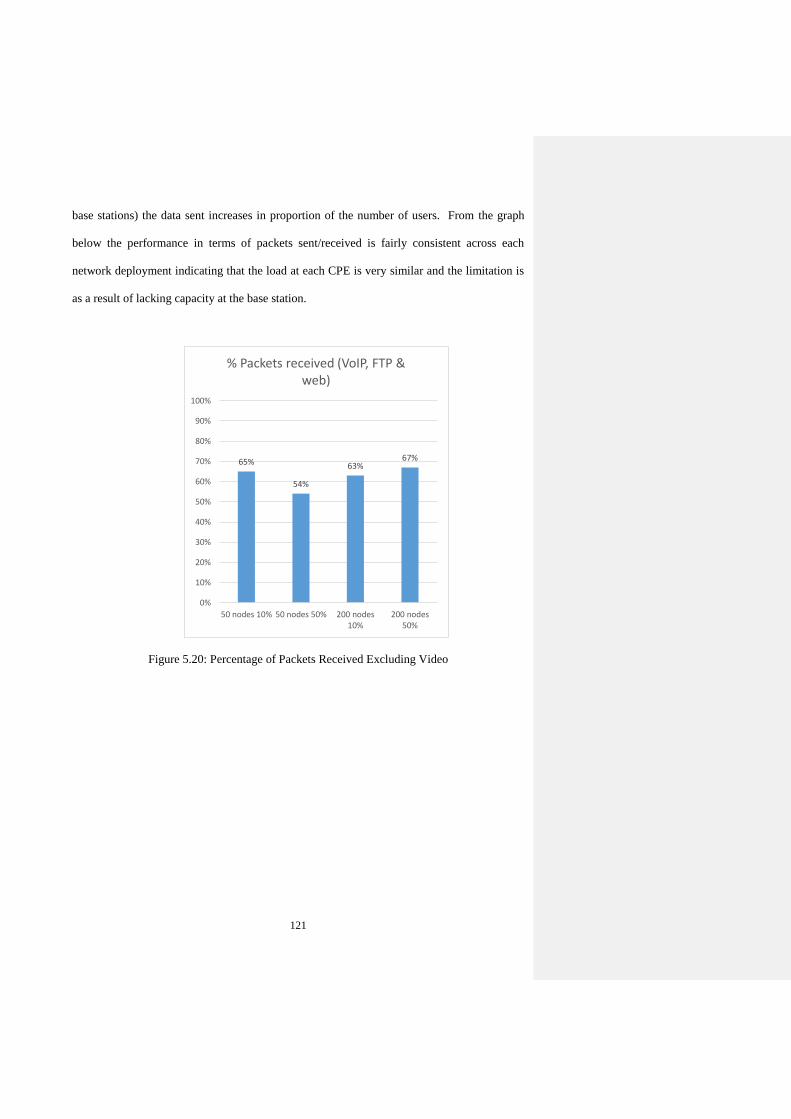
121
base stations) the data sent increases in proportion of the number of users. From the graph
below the performance in terms of packets sent/received is fairly consistent across each
network deployment indicating that the load at each CPE is very similar and the limitation is
as a result of lacking capacity at the base station.
Figure 5.20: Percentage of Packets Received Excluding Video
65%
54%
63%67%
0%
10%
20%
30%
40%
50%
60%
70%
80%
90%
100%
50 nodes 10% 50 nodes 50% 200 nodes10%
200 nodes50%
% Packets received (VoIP, FTP & web)

122
Figure 5.21: Web Delay for 50% background
With a static background traffic of 50% it is clear to see that the network performance
is more or less stable where the network size is 150 nodes or lower. With the configuration
used for this simulation WiMAX is not truly able to provide an acceptable user experience
with delays of up to 6 seconds, performance with other network sizes would be suitable on
the whole with the occasional blip in performance.
0
1
2
3
4
5
6
7
0
18
36
54
72
90
108
126
144
162
180
198
216
234
252
270
288
306
324
342
360
378
396
414
432
450
468
486
504
522
540
558
576
594
Del
ay (
s)
Time (s)
Web delay, 50% background
200 Nodes 150 Nodes 100 Nodes 50 Nodes
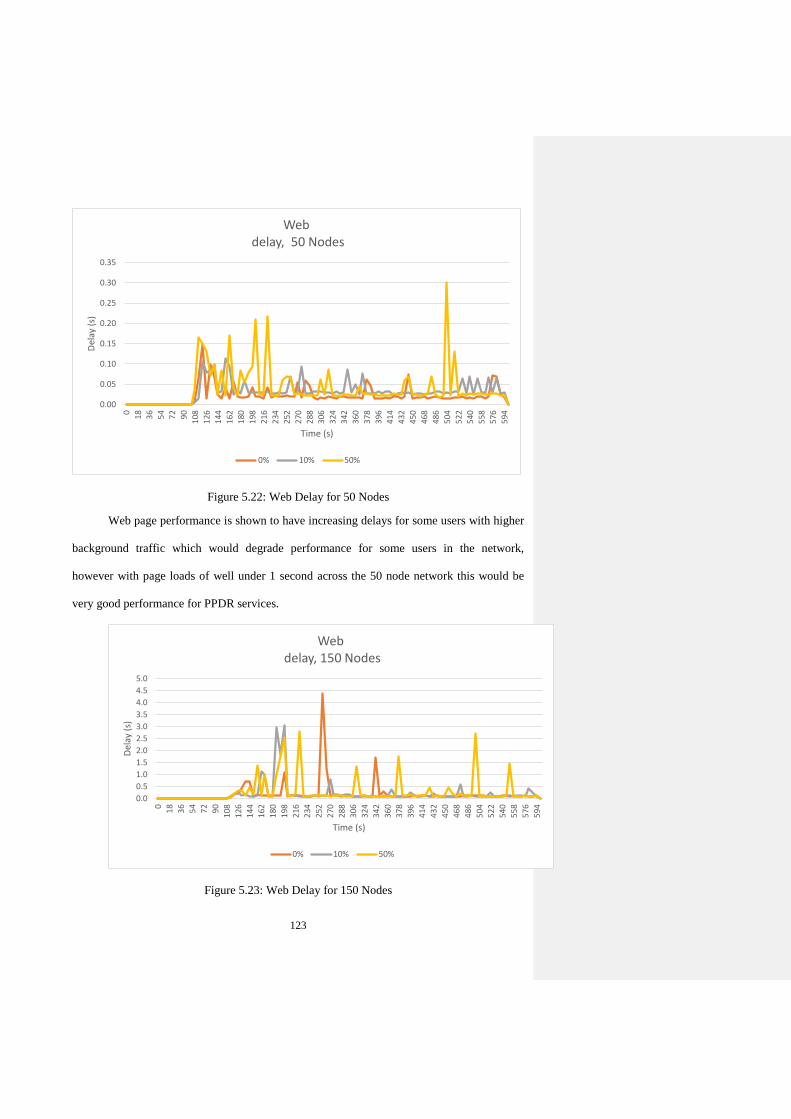
123
Figure 5.22: Web Delay for 50 Nodes
Web page performance is shown to have increasing delays for some users with higher
background traffic which would degrade performance for some users in the network,
however with page loads of well under 1 second across the 50 node network this would be
very good performance for PPDR services.
Figure 5.23: Web Delay for 150 Nodes
0.00
0.05
0.10
0.15
0.20
0.25
0.30
0.35
0
18
36
54
72
90
108
126
144
162
180
198
216
234
252
270
288
306
324
342
360
378
396
414
432
450
468
486
504
522
540
558
576
594
Del
ay (
s)
Time (s)
Webdelay, 50 Nodes
0% 10% 50%
0.0
0.5
1.0
1.5
2.0
2.5
3.0
3.5
4.0
4.5
5.0
0
18
36
54
72
90
108
126
144
162
180
198
216
234
252
270
288
306
324
342
360
378
396
414
432
450
468
486
504
522
540
558
576
594
Del
ay (
s)
Time (s)
Webdelay, 150 Nodes
0% 10% 50%
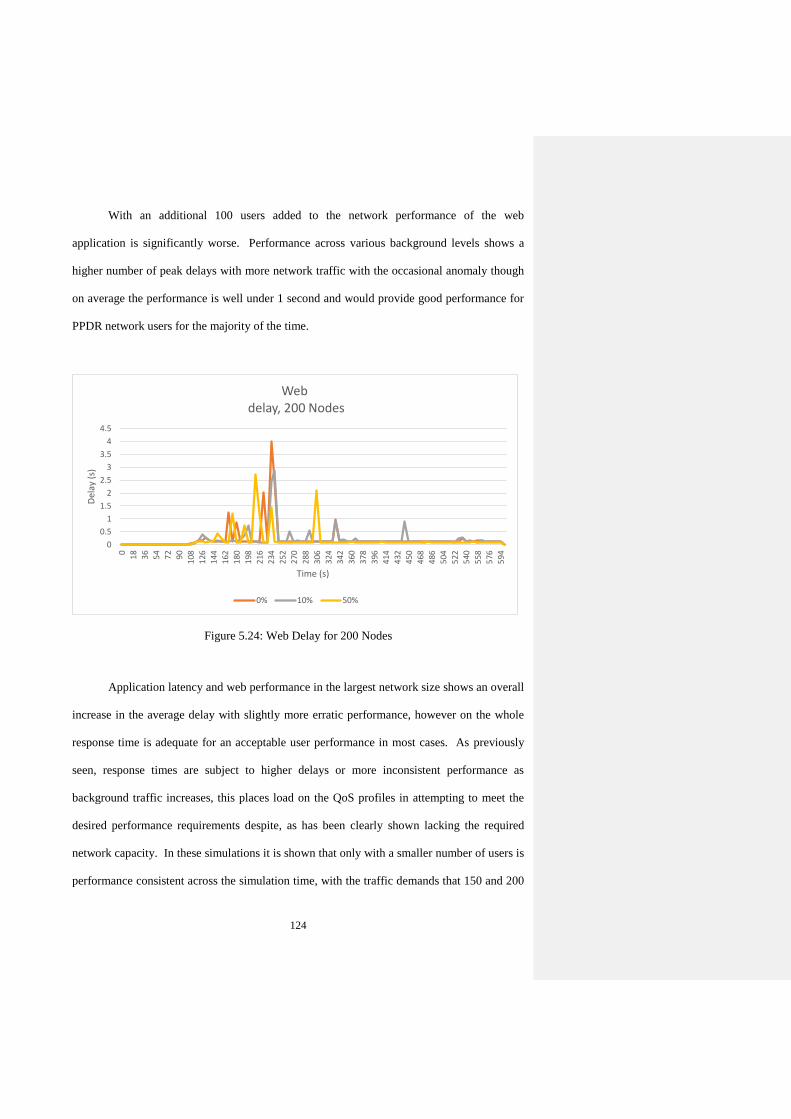
124
With an additional 100 users added to the network performance of the web
application is significantly worse. Performance across various background levels shows a
higher number of peak delays with more network traffic with the occasional anomaly though
on average the performance is well under 1 second and would provide good performance for
PPDR network users for the majority of the time.
Figure 5.24: Web Delay for 200 Nodes
Application latency and web performance in the largest network size shows an overall
increase in the average delay with slightly more erratic performance, however on the whole
response time is adequate for an acceptable user performance in most cases. As previously
seen, response times are subject to higher delays or more inconsistent performance as
background traffic increases, this places load on the QoS profiles in attempting to meet the
desired performance requirements despite, as has been clearly shown lacking the required
network capacity. In these simulations it is shown that only with a smaller number of users is
performance consistent across the simulation time, with the traffic demands that 150 and 200
0
0.5
1
1.5
2
2.5
3
3.5
4
4.5
0
18
36
54
72
90
108
126
144
162
180
198
216
234
252
270
288
306
324
342
360
378
396
414
432
450
468
486
504
522
540
558
576
594
Del
ay (
s)
Time (s)
Webdelay, 200 Nodes
0% 10% 50%
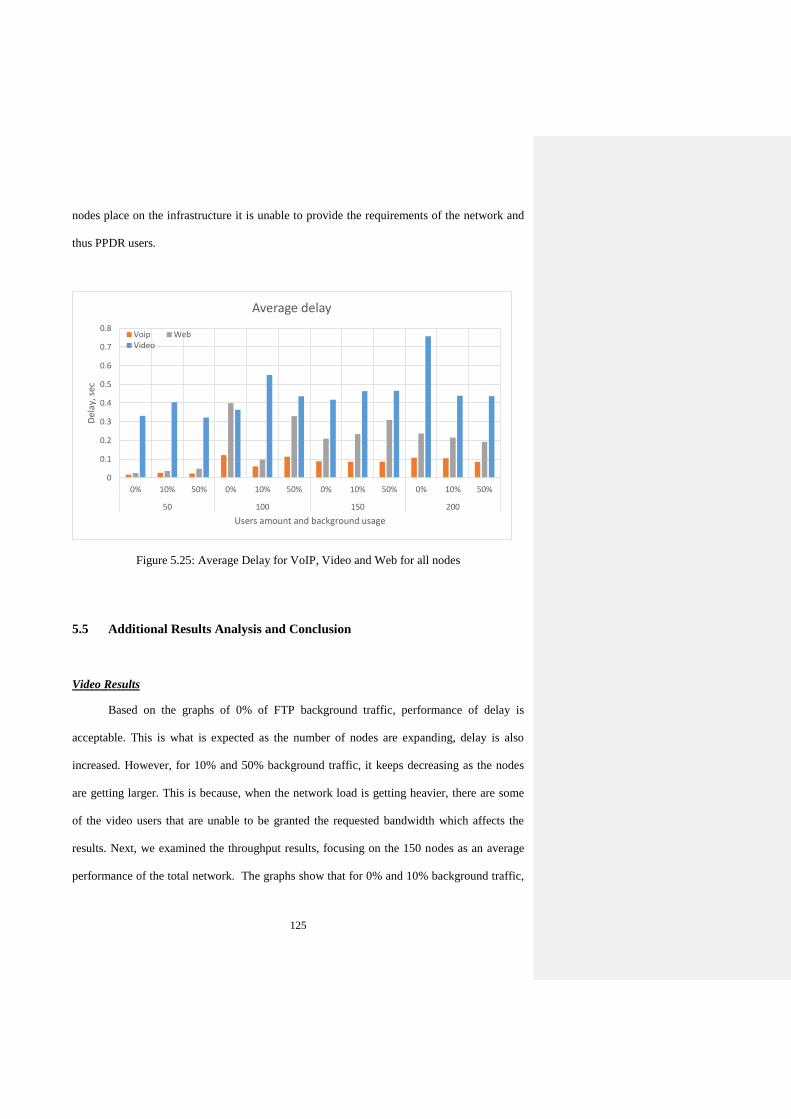
125
nodes place on the infrastructure it is unable to provide the requirements of the network and
thus PPDR users.
Figure 5.25: Average Delay for VoIP, Video and Web for all nodes
5.5 Additional Results Analysis and Conclusion
Video Results
Based on the graphs of 0% of FTP background traffic, performance of delay is
acceptable. This is what is expected as the number of nodes are expanding, delay is also
increased. However, for 10% and 50% background traffic, it keeps decreasing as the nodes
are getting larger. This is because, when the network load is getting heavier, there are some
of the video users that are unable to be granted the requested bandwidth which affects the
results. Next, we examined the throughput results, focusing on the 150 nodes as an average
performance of the total network. The graphs show that for 0% and 10% background traffic,
0
0.1
0.2
0.3
0.4
0.5
0.6
0.7
0.8
0% 10% 50% 0% 10% 50% 0% 10% 50% 0% 10% 50%
50 100 150 200
Del
ay, s
ec
Users amount and background usage
Average delay
Voip WebVideo
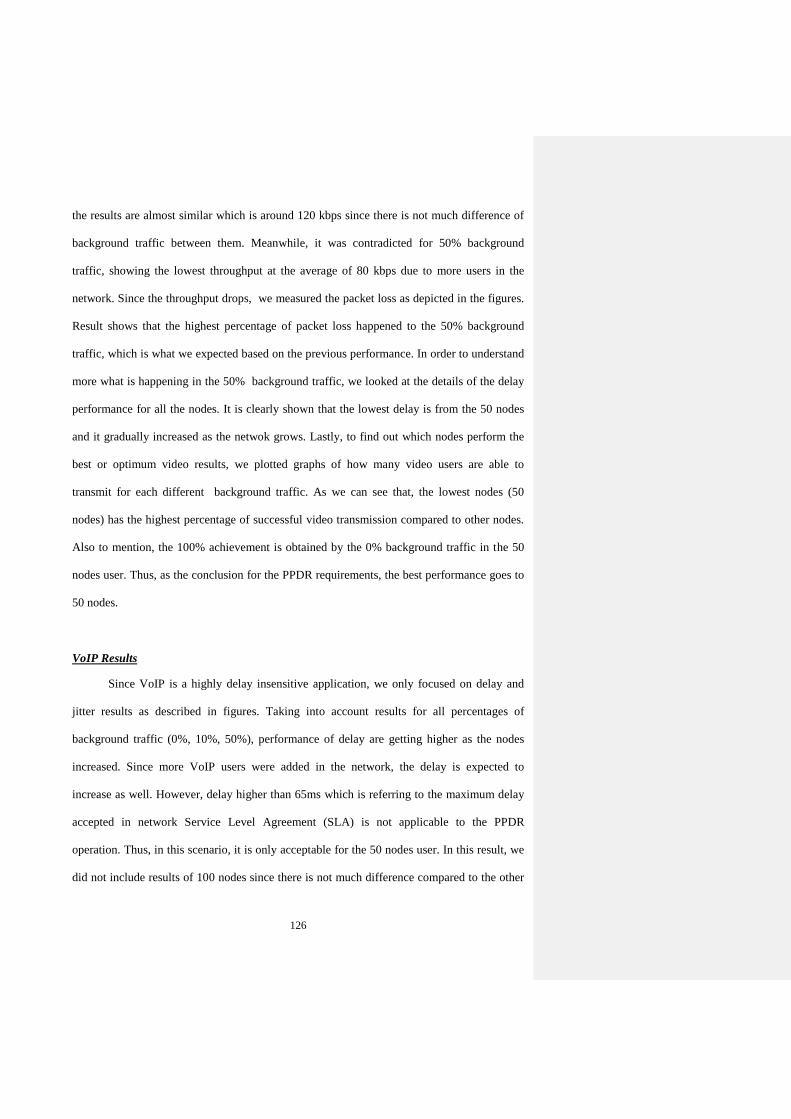
126
the results are almost similar which is around 120 kbps since there is not much difference of
background traffic between them. Meanwhile, it was contradicted for 50% background
traffic, showing the lowest throughput at the average of 80 kbps due to more users in the
network. Since the throughput drops, we measured the packet loss as depicted in the figures.
Result shows that the highest percentage of packet loss happened to the 50% background
traffic, which is what we expected based on the previous performance. In order to understand
more what is happening in the 50% background traffic, we looked at the details of the delay
performance for all the nodes. It is clearly shown that the lowest delay is from the 50 nodes
and it gradually increased as the netwok grows. Lastly, to find out which nodes perform the
best or optimum video results, we plotted graphs of how many video users are able to
transmit for each different background traffic. As we can see that, the lowest nodes (50
nodes) has the highest percentage of successful video transmission compared to other nodes.
Also to mention, the 100% achievement is obtained by the 0% background traffic in the 50
nodes user. Thus, as the conclusion for the PPDR requirements, the best performance goes to
50 nodes.
VoIP Results
Since VoIP is a highly delay insensitive application, we only focused on delay and
jitter results as described in figures. Taking into account results for all percentages of
background traffic (0%, 10%, 50%), performance of delay are getting higher as the nodes
increased. Since more VoIP users were added in the network, the delay is expected to
increase as well. However, delay higher than 65ms which is referring to the maximum delay
accepted in network Service Level Agreement (SLA) is not applicable to the PPDR
operation. Thus, in this scenario, it is only acceptable for the 50 nodes user. In this result, we
did not include results of 100 nodes since there is not much difference compared to the other
127
nodes. Next, we evaluated the performance of jitter for the same nodes. Eventually it shows
that jitter for all nodes are within the maximum jitter range mentioned in the SLA,
eventhough results for 100 and 150 nodes could not be counted as they exceeded the delay
requirement. As the conclusion, to fullfill the PPDR requirements, VoIP performs the
optimum results for small nodes (50 nodes).
Web Results
As shown in the graphs, delay for all nodes are growing especially to the maximum of
200 nodes. The result also applies to the different percentage of background traffic. In spite
of that, the results are only consistent for 50 nodes users compared to others. Therefore, again
it shows that with the smaller number of users, it was able to accomplish with the PPDR
requirements.
5.6 Summary
In this chapter, a detailed research has been explored on a hybrid network, which
involves integration of WiFi and WiMAX particularly in our scenario. Thus, to evaluate the
QoS performance, we investigated the number of WiFi responders/users that could optimize
the bandwidth in the network. As the outcome based on the simulations, we proposed the
optimum or ideal quantity of WiFi users which had been explained in this chapter. On top of
that, we also developed the optimum traffic or application combination that could assigned to
the WiFi users and can be applied to the PPDR services for their operation as first responders
in an emergency situation.
128
Chapter 6: Optimization for Integration of WiFi and WiMAX Network for
PPDR Services (Unplanned Event)
This chapter is continuously project from the previous chapter which involves with the
PPDR Services. However, this chapter will focus on the Unplanned Event Scenario.
6.1 Introduction
Unplanned Event is a situation when the communication infrastructure is deployed
when the existing backbone connection is not functioning or destroyed. Therefore, it needs to
be link to a communication model which is describe detail in the next section. However, we
choosed 200 users in this scenario as our references to evaluates the performance of the
network.
6.2 WiFi to WiMAX (backhaul) Unplanned Event
Previously assigned in the preliminary report for “Preliminary technical validation of
future PPDRs technologies and architectures”. This simulation represents the results
produced for a WiFi network using WiMAX as backhaul to a PPDR centre for an unplanned
scenario lacking in terms of existing infrastructure/IP backbone. Within this simulation each
WiMAX base station is linked to WiMAX CPE’s (explained in previous chapter) and this can
be up to 1km from the nearest base station. Base stations are simulated as mobile vehicles
with a built in mast and represented using appropriate configuration. WiFi users are placed
around the WiMAX CPEs and represent the network being deployed at a specific incident
site which requires communications infrastructure on an “as required” basis, then using WiFi
terminals they access the WiMAX CPE which in terms links to the IP backbone linked to the
PPDR centre.
129
6.2.1 Application modelling
Applications run within this simulation are allocated as per the table included below.
Each application is allocated to the number of users indicated per the PPDR users/nodes and
will be configured as set forth in the simulation configuration section. Performance is
assessed against application delay, packets received ratio of all data sent and jitter for VoIP
performance. In this simulation background traffic is fixed at 10% to represent use of other
PPDR services used for management purposes/network management etc. As a next
generation service it is expected that video streaming would increasingly be required and the
effects were compared when increasing the number of video users from 10 % to 30%.
OPNET was used as the simulator of choice for these simulations and further
detail/justifications can be found in “Specification of validation scenarios and tools (D5.1
REFERENCE)”
Table 6.1: Users breakdown traffic
PPDR users/nodes Traffic type/application Technical data
10%, 30% Video See below.
40% Reliable, burst (web) See below.
70% Audio (VoIP) See below.
10% Reliable, continuous background
(FTP)
See below.
From the table above the breakdown of traffic is allocated between all users/clients in the
simulation. The breakdown of traffic/applications per user is shown below for each of the
simulations;

130
200 users 10% video
20 video users
80 VoIP users
20 VoIP & FTP users
40 VoIP & web users
40 web users
200 users 30% video
20 video users
40 video & VoIP users
40 VoIP users
20 VoIP & FTP users
40 VoIP & web users
40 web users
As described above the majority of users are using one or two applications
simultaneously with VoIP being the core application, as would be representative in a PPDR
unplanned scenario. FTP traffic is generated at the lower level 10% in this scenario as this
network would be a private network only used by PPDR users and thus the level of additional
traffic would not be as variable compared with for instance the planned scenario. Here
network traffic and application performance is monitored as the number of video users are
increased to assess performance impacts for VoIP performance as the most important traffic
type used currently by PPDR users.
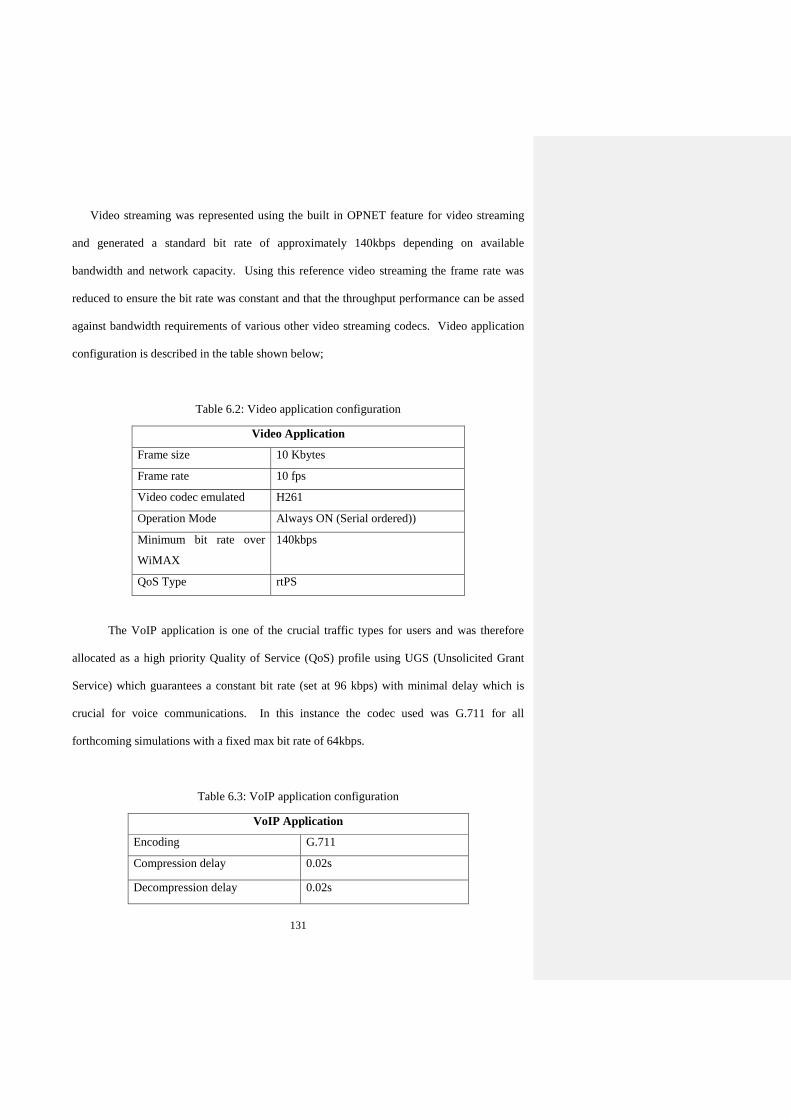
131
Video streaming was represented using the built in OPNET feature for video streaming
and generated a standard bit rate of approximately 140kbps depending on available
bandwidth and network capacity. Using this reference video streaming the frame rate was
reduced to ensure the bit rate was constant and that the throughput performance can be assed
against bandwidth requirements of various other video streaming codecs. Video application
configuration is described in the table shown below;
Table 6.2: Video application configuration
Video Application
Frame size 10 Kbytes
Frame rate 10 fps
Video codec emulated H261
Operation Mode Always ON (Serial ordered))
Minimum bit rate over
WiMAX
140kbps
QoS Type rtPS
The VoIP application is one of the crucial traffic types for users and was therefore
allocated as a high priority Quality of Service (QoS) profile using UGS (Unsolicited Grant
Service) which guarantees a constant bit rate (set at 96 kbps) with minimal delay which is
crucial for voice communications. In this instance the codec used was G.711 for all
forthcoming simulations with a fixed max bit rate of 64kbps.
Table 6.3: VoIP application configuration
VoIP Application
Encoding G.711
Compression delay 0.02s
Decompression delay 0.02s
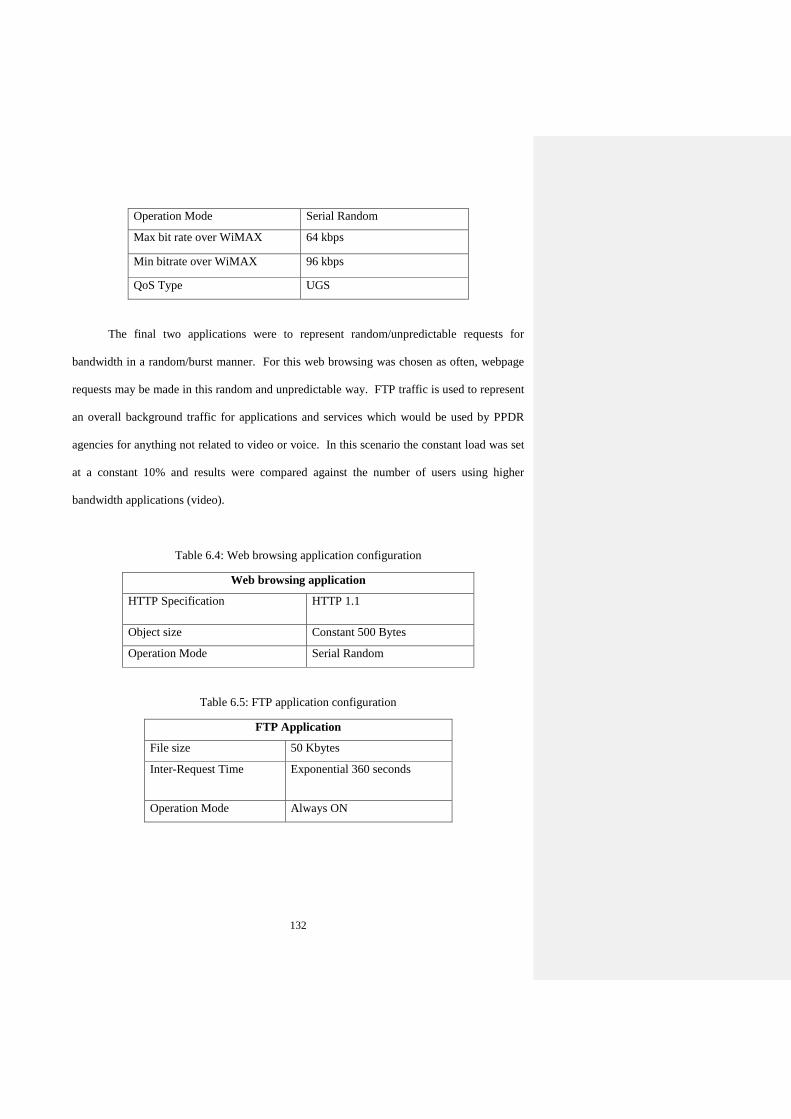
132
Operation Mode Serial Random
Max bit rate over WiMAX 64 kbps
Min bitrate over WiMAX 96 kbps
QoS Type UGS
The final two applications were to represent random/unpredictable requests for
bandwidth in a random/burst manner. For this web browsing was chosen as often, webpage
requests may be made in this random and unpredictable way. FTP traffic is used to represent
an overall background traffic for applications and services which would be used by PPDR
agencies for anything not related to video or voice. In this scenario the constant load was set
at a constant 10% and results were compared against the number of users using higher
bandwidth applications (video).
Table 6.4: Web browsing application configuration
Web browsing application
HTTP Specification HTTP 1.1
Object size Constant 500 Bytes
Operation Mode Serial Random
Table 6.5: FTP application configuration
FTP Application
File size 50 Kbytes
Inter-Request Time Exponential 360 seconds
Operation Mode Always ON
133
6.2.2 Simulation configuration
Herein this section the technical description and configuration of the communication
technology is provided. For the unplanned simulation it is envisaged that the infrastructure
would deployed as required in the area of the unplanned incident, this area was deemed to be
10km x 10km for the purposes of this simulation.
Here WiMAX base stations are represented as mobile base stations which would be
deployed from a vehicle and fixed into place for the duration of the simulation, potentially in
a real world incident they could move between locations to offer the best coverage for
individual areas as necessary. Each CPE would be deployed locally at an incident site and
relocated as necessary, this could be several km from the deployed base stations and further
still from the PPDR command centre which is linked using the WiMAX backhaul to these
users. In order to provide a representative set of results in a reasonable time this simulation
focused on a 10km square whereby up to 200 users would be deployed representing a fairly
dense coverage when placed into the 40km overall area.
WiMAX base station: Each system is deployed into a mobile vehicle with large mast
for communication with other systems. The network would require some initial
configuration when arriving on site to be linked with the core PPDR centre using the
WiMAX as back-haul IP back-bone. Once deployed WiMAX CPEs could be
deployed within several km from each base station and ideally as close as possible to
minimise packet loss and improve throughput performance. The technical
configuration for each WiMAX base station in the simulation is shown in the table
below;
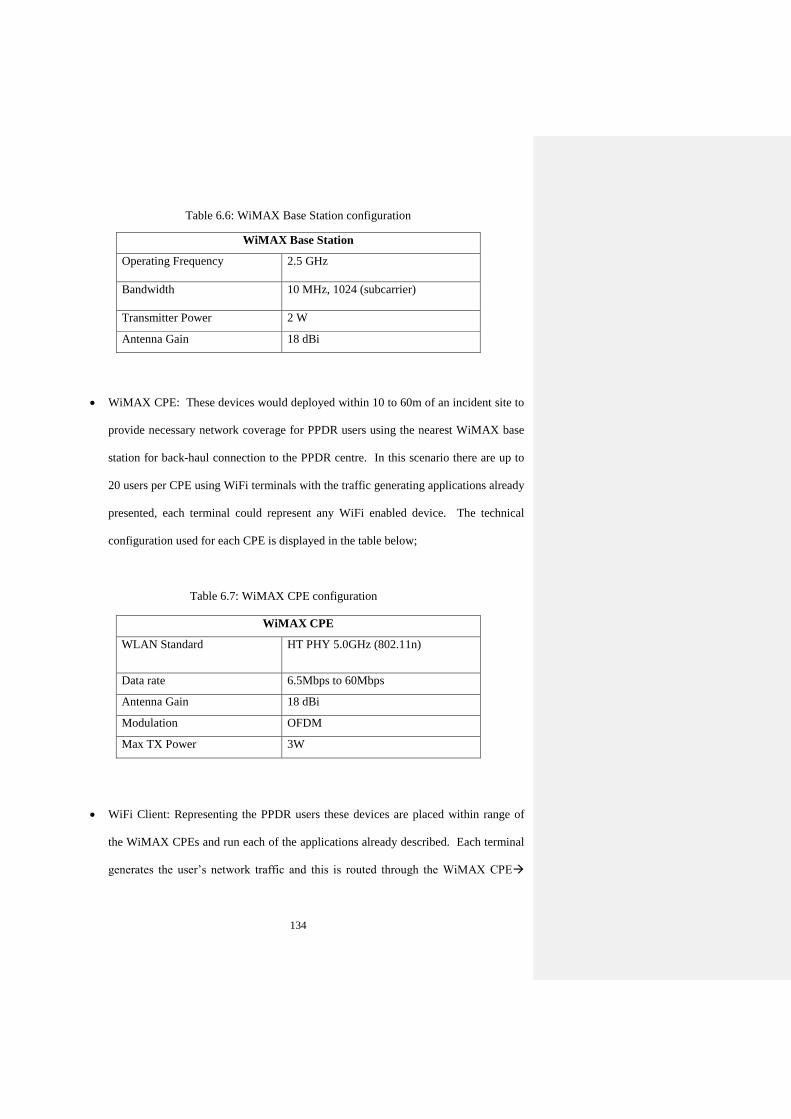
134
Table 6.6: WiMAX Base Station configuration
WiMAX Base Station
Operating Frequency 2.5 GHz
Bandwidth 10 MHz, 1024 (subcarrier)
Transmitter Power 2 W
Antenna Gain 18 dBi
WiMAX CPE: These devices would deployed within 10 to 60m of an incident site to
provide necessary network coverage for PPDR users using the nearest WiMAX base
station for back-haul connection to the PPDR centre. In this scenario there are up to
20 users per CPE using WiFi terminals with the traffic generating applications already
presented, each terminal could represent any WiFi enabled device. The technical
configuration used for each CPE is displayed in the table below;
Table 6.7: WiMAX CPE configuration
WiFi Client: Representing the PPDR users these devices are placed within range of
the WiMAX CPEs and run each of the applications already described. Each terminal
generates the user’s network traffic and this is routed through the WiMAX CPE
WiMAX CPE
WLAN Standard HT PHY 5.0GHz (802.11n)
Data rate 6.5Mbps to 60Mbps
Antenna Gain 18 dBi
Modulation OFDM
Max TX Power 3W
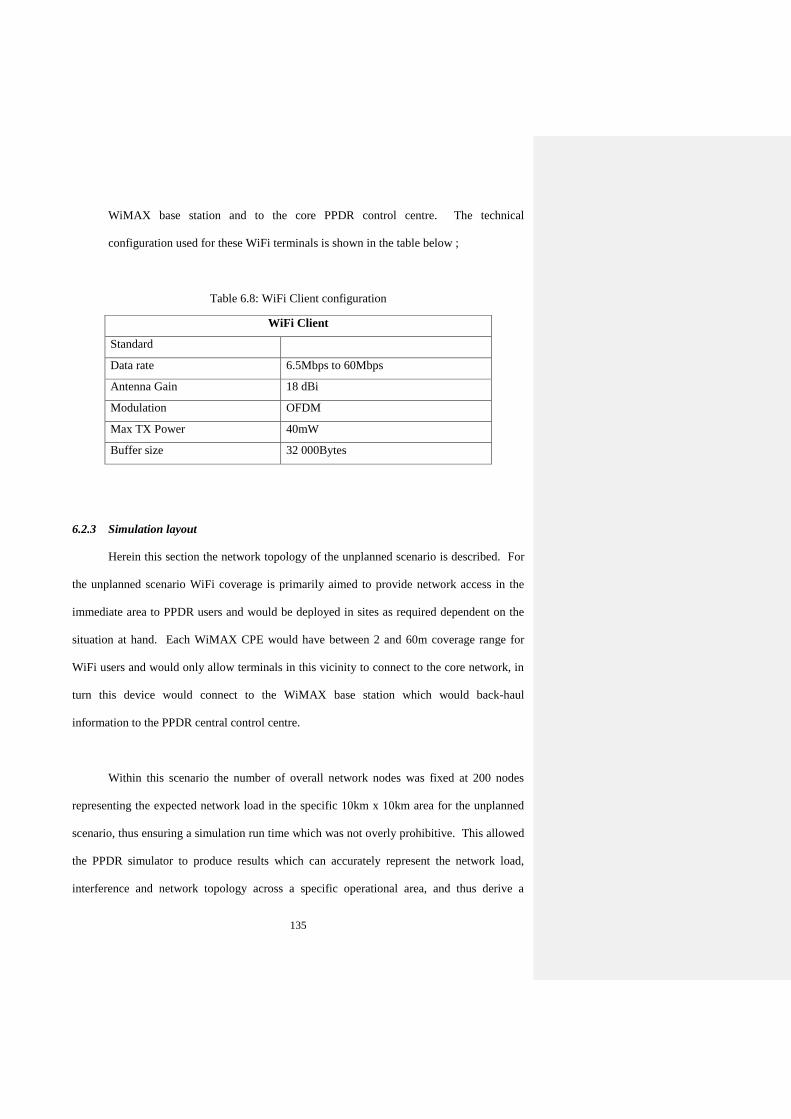
135
WiMAX base station and to the core PPDR control centre. The technical
configuration used for these WiFi terminals is shown in the table below ;
Table 6.8: WiFi Client configuration
WiFi Client
Standard
Data rate 6.5Mbps to 60Mbps
Antenna Gain 18 dBi
Modulation OFDM
Max TX Power 40mW
Buffer size 32 000Bytes
6.2.3 Simulation layout
Herein this section the network topology of the unplanned scenario is described. For
the unplanned scenario WiFi coverage is primarily aimed to provide network access in the
immediate area to PPDR users and would be deployed in sites as required dependent on the
situation at hand. Each WiMAX CPE would have between 2 and 60m coverage range for
WiFi users and would only allow terminals in this vicinity to connect to the core network, in
turn this device would connect to the WiMAX base station which would back-haul
information to the PPDR central control centre.
Within this scenario the number of overall network nodes was fixed at 200 nodes
representing the expected network load in the specific 10km x 10km area for the unplanned
scenario, thus ensuring a simulation run time which was not overly prohibitive. This allowed
the PPDR simulator to produce results which can accurately represent the network load,
interference and network topology across a specific operational area, and thus derive a
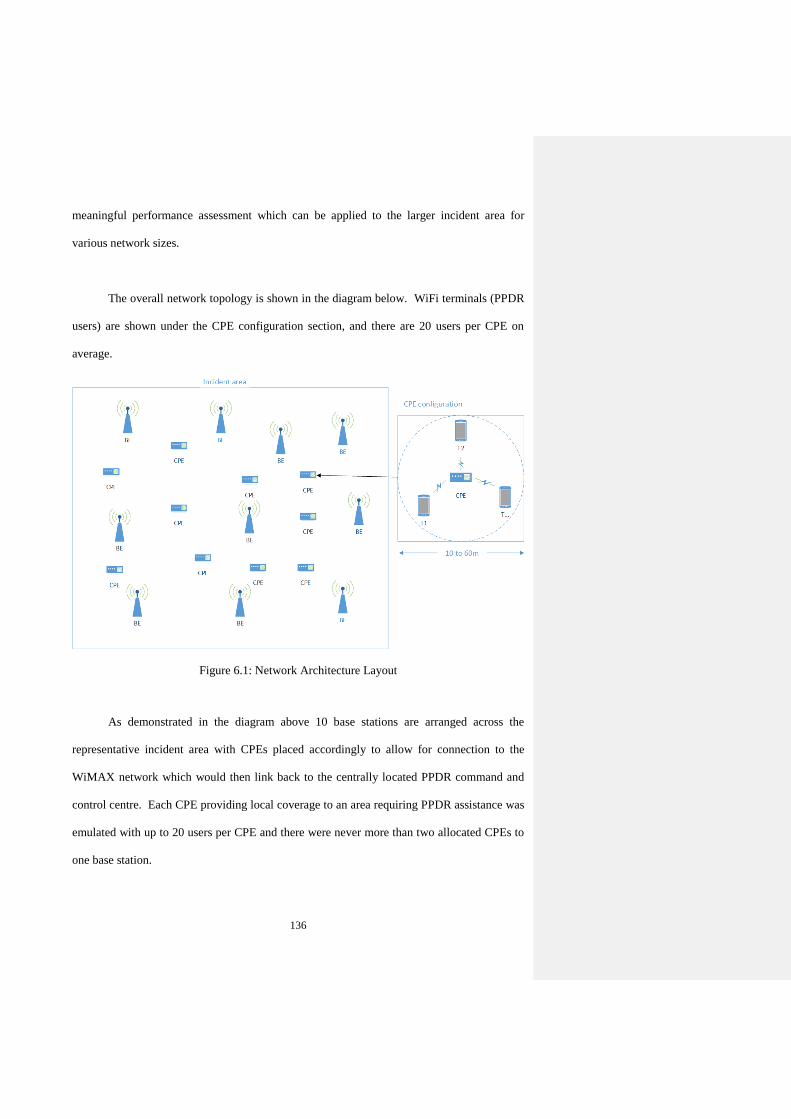
136
meaningful performance assessment which can be applied to the larger incident area for
various network sizes.
The overall network topology is shown in the diagram below. WiFi terminals (PPDR
users) are shown under the CPE configuration section, and there are 20 users per CPE on
average.
Figure 6.1: Network Architecture Layout
As demonstrated in the diagram above 10 base stations are arranged across the
representative incident area with CPEs placed accordingly to allow for connection to the
WiMAX network which would then link back to the centrally located PPDR command and
control centre. Each CPE providing local coverage to an area requiring PPDR assistance was
emulated with up to 20 users per CPE and there were never more than two allocated CPEs to
one base station.
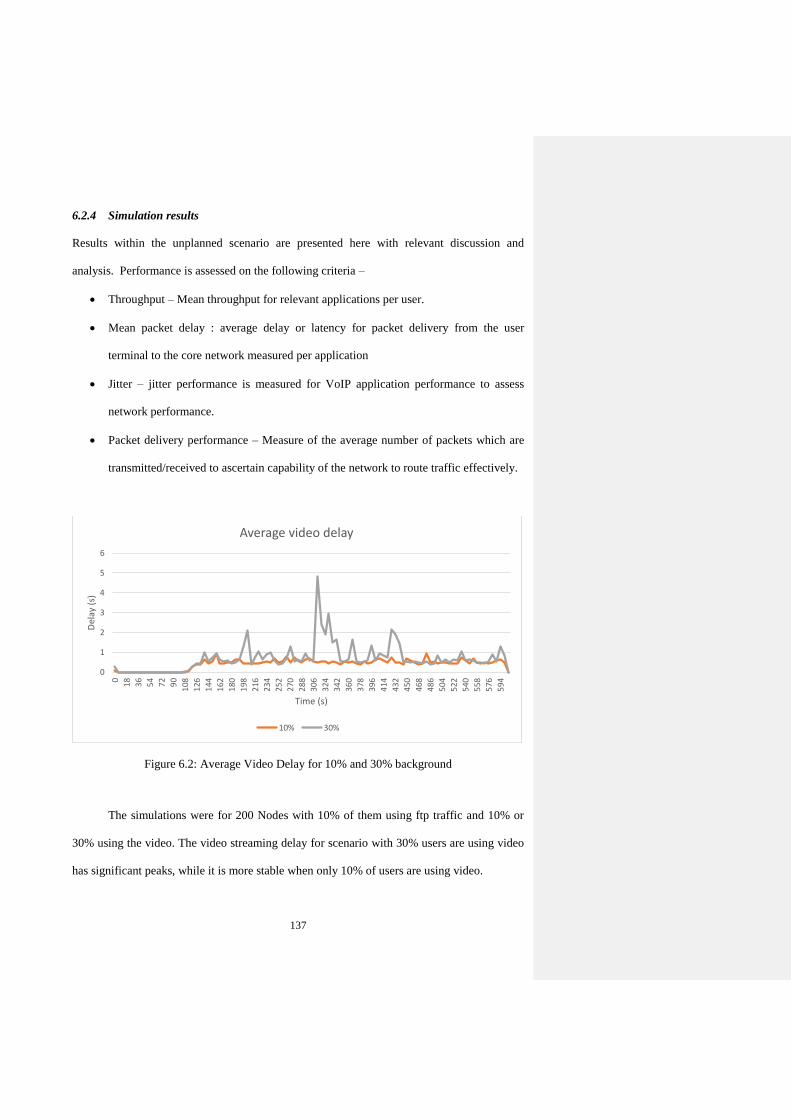
137
6.2.4 Simulation results
Results within the unplanned scenario are presented here with relevant discussion and
analysis. Performance is assessed on the following criteria –
Throughput – Mean throughput for relevant applications per user.
Mean packet delay : average delay or latency for packet delivery from the user
terminal to the core network measured per application
Jitter – jitter performance is measured for VoIP application performance to assess
network performance.
Packet delivery performance – Measure of the average number of packets which are
transmitted/received to ascertain capability of the network to route traffic effectively.
Figure 6.2: Average Video Delay for 10% and 30% background
The simulations were for 200 Nodes with 10% of them using ftp traffic and 10% or
30% using the video. The video streaming delay for scenario with 30% users are using video
has significant peaks, while it is more stable when only 10% of users are using video.
0
1
2
3
4
5
6
0
18
36
54
72
90
108
126
144
162
180
198
216
234
252
270
288
306
324
342
360
378
396
414
432
450
468
486
504
522
540
558
576
594
Del
ay (
s)
Time (s)
Average video delay
10% 30%
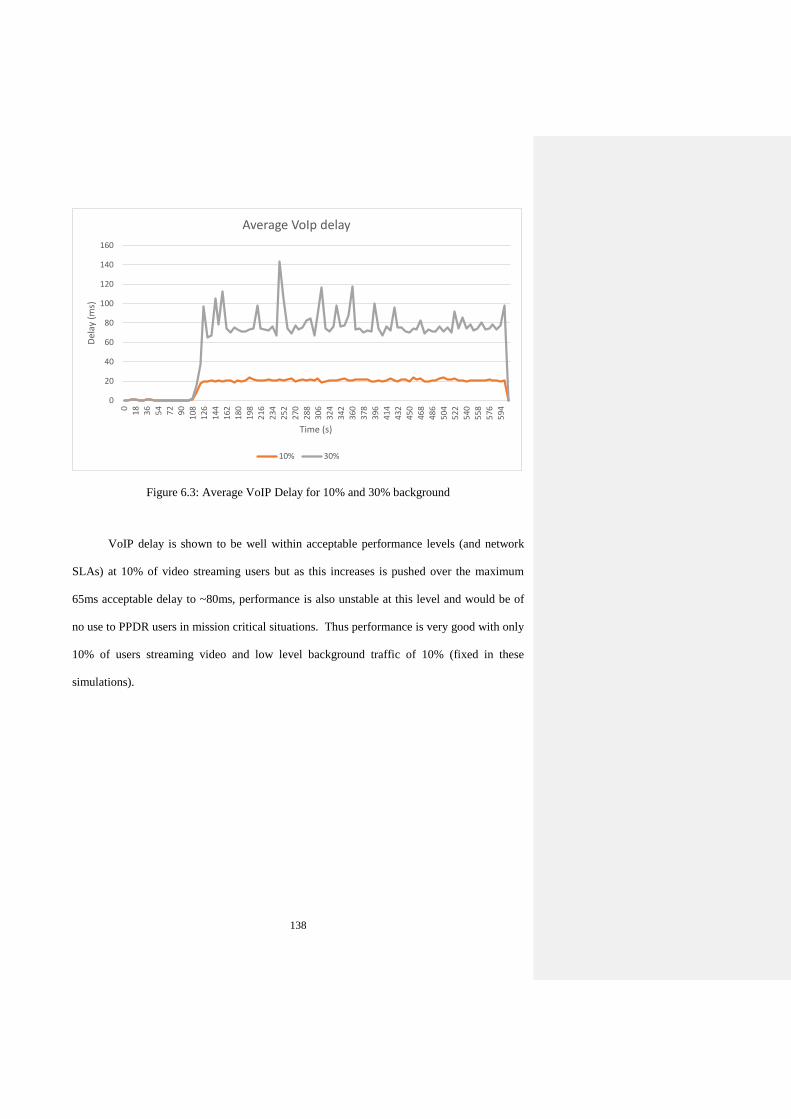
138
Figure 6.3: Average VoIP Delay for 10% and 30% background
VoIP delay is shown to be well within acceptable performance levels (and network
SLAs) at 10% of video streaming users but as this increases is pushed over the maximum
65ms acceptable delay to ~80ms, performance is also unstable at this level and would be of
no use to PPDR users in mission critical situations. Thus performance is very good with only
10% of users streaming video and low level background traffic of 10% (fixed in these
simulations).
0
20
40
60
80
100
120
140
160
0
18
36
54
72
90
108
126
144
162
180
198
216
234
252
270
288
306
324
342
360
378
396
414
432
450
468
486
504
522
540
558
576
594
Del
ay (
ms)
Time (s)
Average VoIp delay
10% 30%
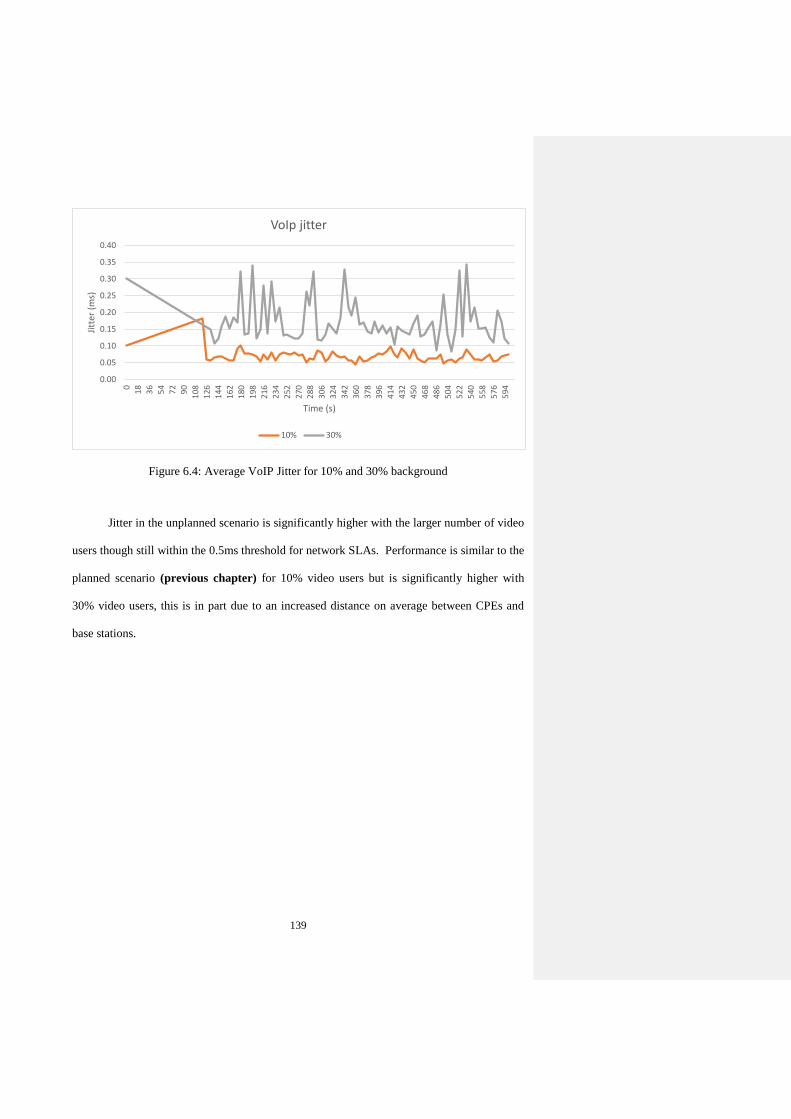
139
Figure 6.4: Average VoIP Jitter for 10% and 30% background
Jitter in the unplanned scenario is significantly higher with the larger number of video
users though still within the 0.5ms threshold for network SLAs. Performance is similar to the
planned scenario (previous chapter) for 10% video users but is significantly higher with
30% video users, this is in part due to an increased distance on average between CPEs and
base stations.
0.00
0.05
0.10
0.15
0.20
0.25
0.30
0.35
0.40
0
18
36
54
72
90
108
126
144
162
180
198
216
234
252
270
288
306
324
342
360
378
396
414
432
450
468
486
504
522
540
558
576
594
Jitt
er (
ms)
Time (s)
VoIp jitter
10% 30%
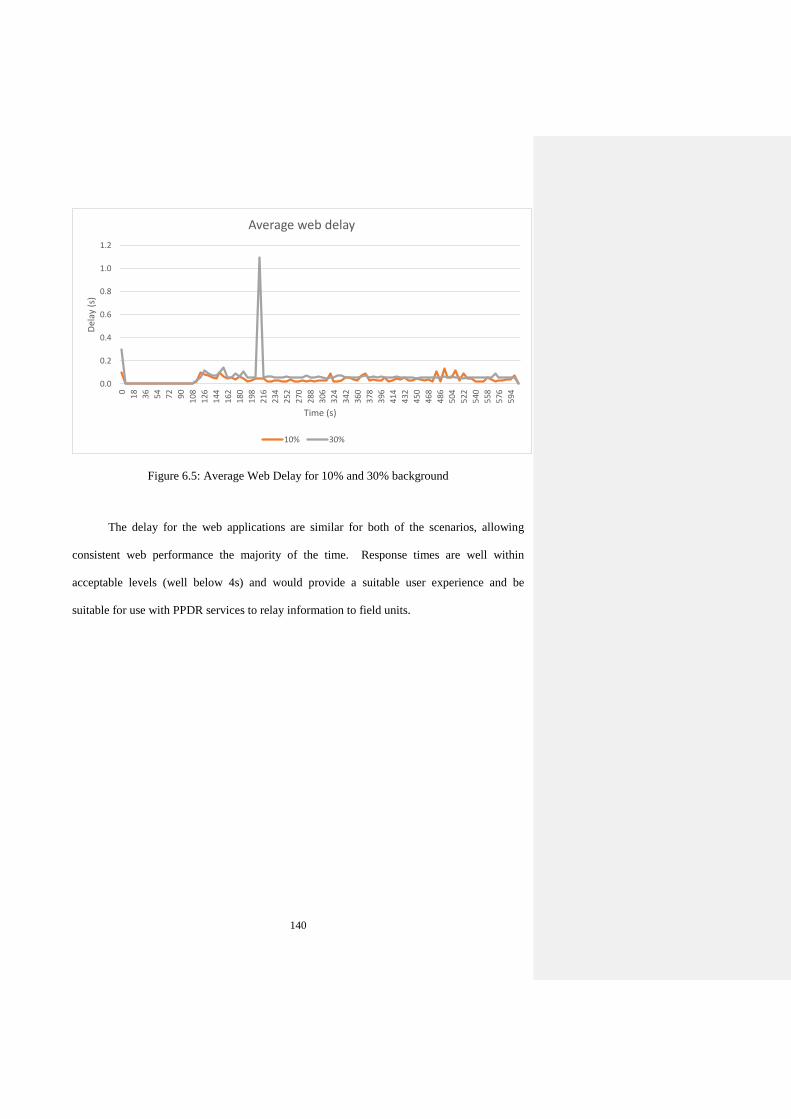
140
Figure 6.5: Average Web Delay for 10% and 30% background
The delay for the web applications are similar for both of the scenarios, allowing
consistent web performance the majority of the time. Response times are well within
acceptable levels (well below 4s) and would provide a suitable user experience and be
suitable for use with PPDR services to relay information to field units.
0.0
0.2
0.4
0.6
0.8
1.0
1.2
0
18
36
54
72
90
108
126
144
162
180
198
216
234
252
270
288
306
324
342
360
378
396
414
432
450
468
486
504
522
540
558
576
594
Del
ay (
s)
Time (s)
Average web delay
10% 30%
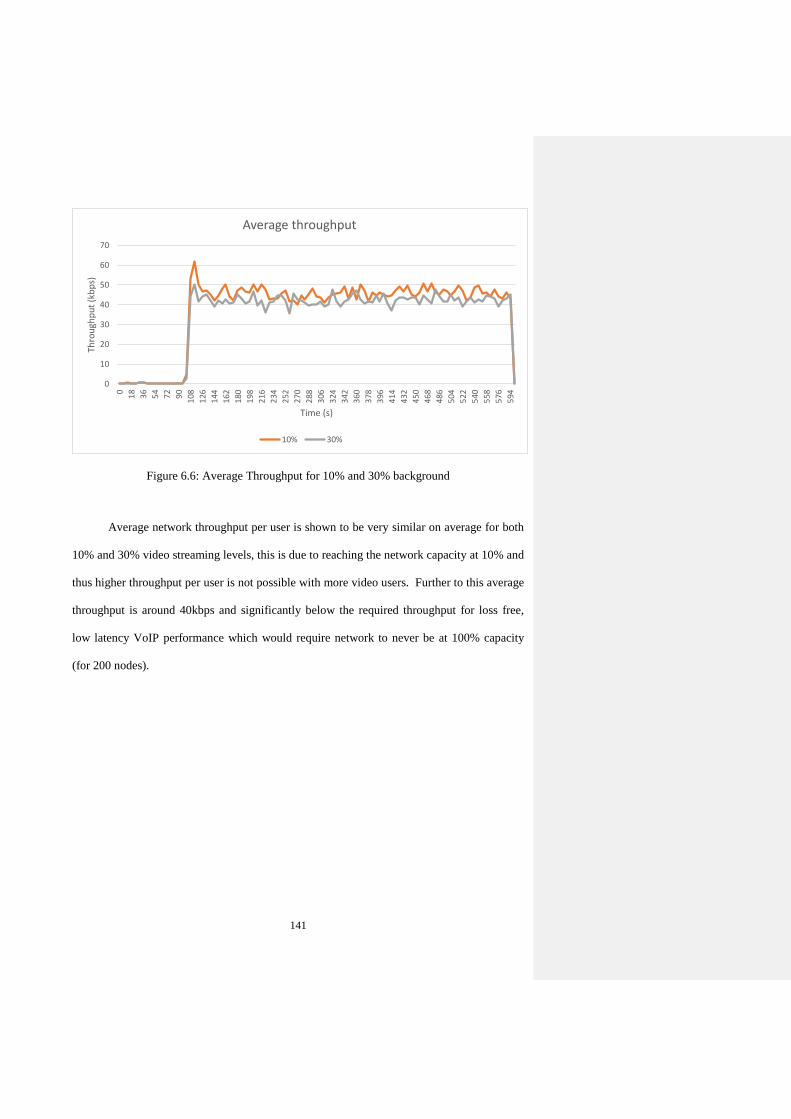
141
Figure 6.6: Average Throughput for 10% and 30% background
Average network throughput per user is shown to be very similar on average for both
10% and 30% video streaming levels, this is due to reaching the network capacity at 10% and
thus higher throughput per user is not possible with more video users. Further to this average
throughput is around 40kbps and significantly below the required throughput for loss free,
low latency VoIP performance which would require network to never be at 100% capacity
(for 200 nodes).
0
10
20
30
40
50
60
70
0
18
36
54
72
90
108
126
144
162
180
198
216
234
252
270
288
306
324
342
360
378
396
414
432
450
468
486
504
522
540
558
576
594
Thro
ugh
pu
t (k
bp
s)
Time (s)
Average throughput
10% 30%
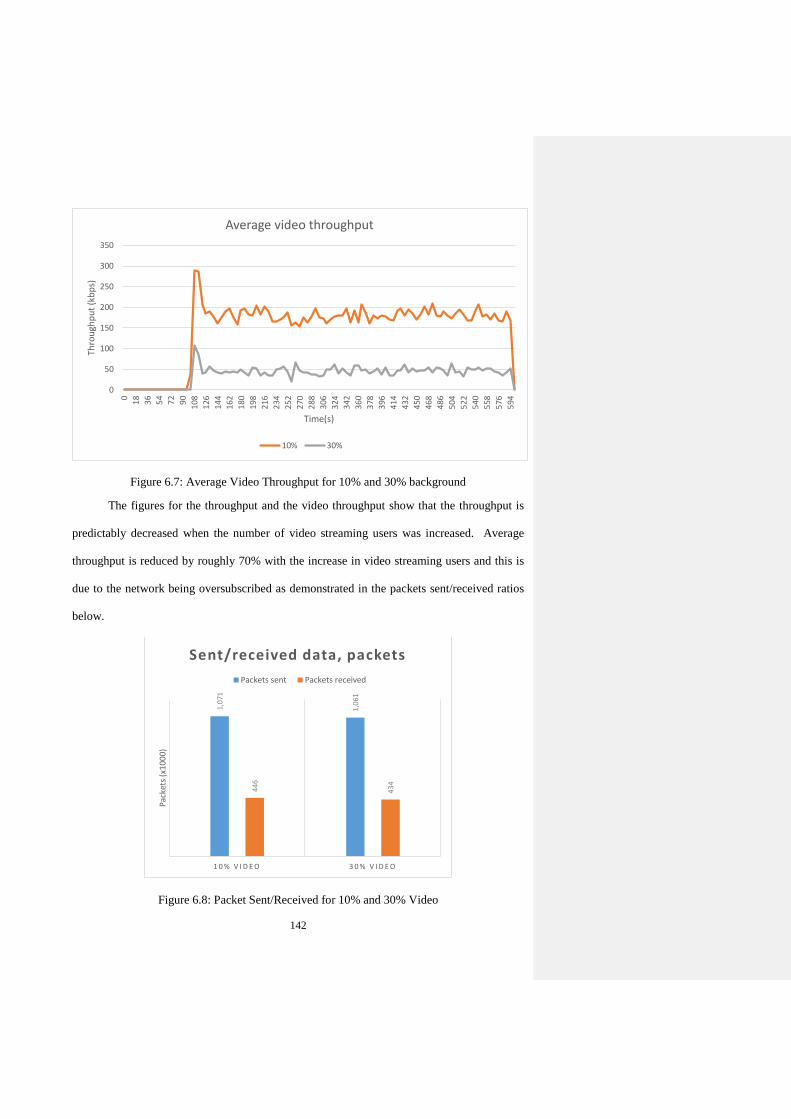
142
Figure 6.7: Average Video Throughput for 10% and 30% background
The figures for the throughput and the video throughput show that the throughput is
predictably decreased when the number of video streaming users was increased. Average
throughput is reduced by roughly 70% with the increase in video streaming users and this is
due to the network being oversubscribed as demonstrated in the packets sent/received ratios
below.
Figure 6.8: Packet Sent/Received for 10% and 30% Video
0
50
100
150
200
250
300
350
0
18
36
54
72
90
108
126
144
162
180
198
216
234
252
270
288
306
324
342
360
378
396
414
432
450
468
486
504
522
540
558
576
594
Thro
ugh
pu
t (k
bp
s)
Time(s)
Average video throughput
10% 30%
1,07
1
1,06
1
446
434
1 0 % V I D E O 3 0 % V I D E O
Pac
kets
(x1
00
0)
Sent/received data, packets
Packets sent Packets received
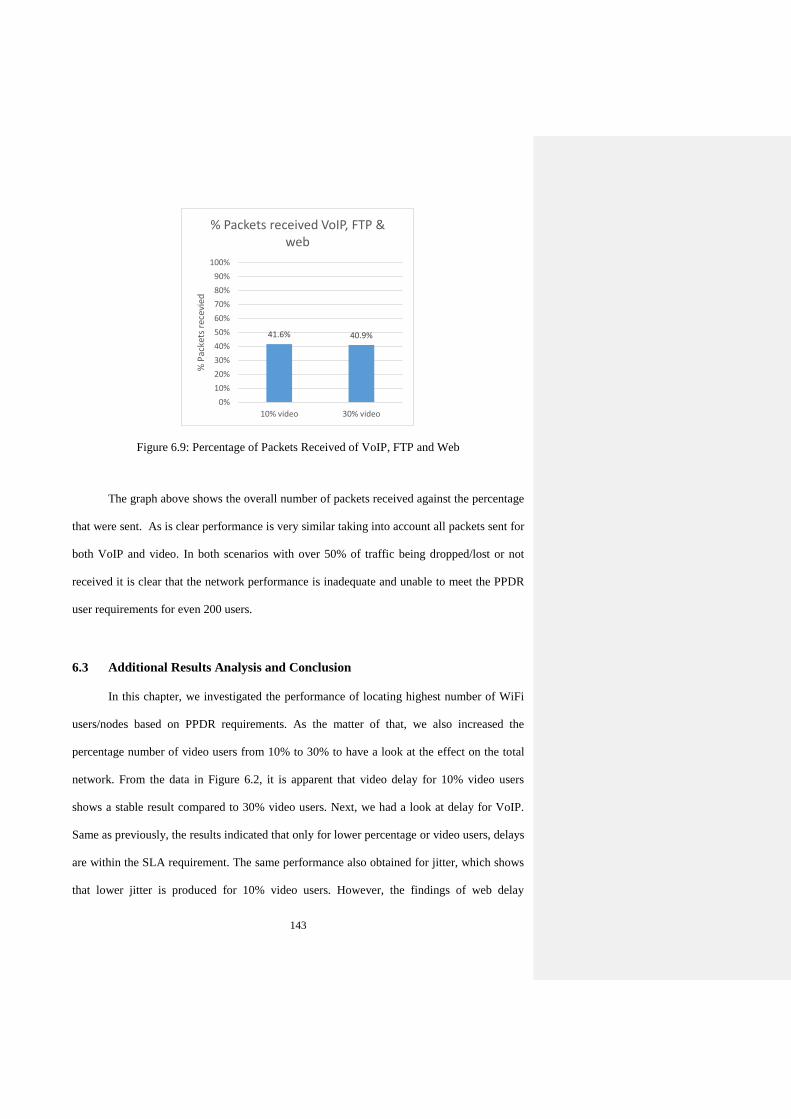
143
Figure 6.9: Percentage of Packets Received of VoIP, FTP and Web
The graph above shows the overall number of packets received against the percentage
that were sent. As is clear performance is very similar taking into account all packets sent for
both VoIP and video. In both scenarios with over 50% of traffic being dropped/lost or not
received it is clear that the network performance is inadequate and unable to meet the PPDR
user requirements for even 200 users.
6.3 Additional Results Analysis and Conclusion
In this chapter, we investigated the performance of locating highest number of WiFi
users/nodes based on PPDR requirements. As the matter of that, we also increased the
percentage number of video users from 10% to 30% to have a look at the effect on the total
network. From the data in Figure 6.2, it is apparent that video delay for 10% video users
shows a stable result compared to 30% video users. Next, we had a look at delay for VoIP.
Same as previously, the results indicated that only for lower percentage or video users, delays
are within the SLA requirement. The same performance also obtained for jitter, which shows
that lower jitter is produced for 10% video users. However, the findings of web delay
41.6% 40.9%
0%
10%
20%
30%
40%
50%
60%
70%
80%
90%
100%
10% video 30% video
% P
acke
ts r
ecev
ied
% Packets received VoIP, FTP & web
144
application show slightly a different performance. Delays for both percentage of video users
showing a similar output, thus allowing consistent web performance all the time. Another
important finding was the network throughput. Average throughput for both percentages
ranges between 40 kbps to 50 kbps, however it is significantly lower than the required
throughput for PPDR operations. To understand more about the network performance, we
also plotted a graph for percentage of packets received based on number of packets sent and
received. The percentage of packets received mainly for VoIP, FTP and web application
since adding the video users will degrade the network performance. Comparing the two set of
results, it can be seen that over 50% of the traffic was dropped due to the network load. As
the conclusion, considering all the results obtained for 200 users with different percentage of
video users, the network was unable to satisfy the PPDR requirements.
6.4 Summary
Based on the previous chapter, the maximum number of users in the scenario is 200.
Therefore, in this chapter, we investigated more about the performance of the 200 users when
number of users assigned with the video application is increased. The results presented has
shown that the QoS network parameter is affected when more video users are present in the
network. This happened since more bandwidth is allocated for video as compared to others,
which increased the network loss as well. However, since most of the results showed
unsatisfied results based on the PPDR requirement, therefore an increase in video users will
degrade the network performance.
145
Chapter 7: Conclusion and future work
This thesis is dedicated to the development and optimization of the disaster operation
applications, particularly focusing on PPDR research project.
7.1 Contribution To Knowledge
The main contribution to knowledge is the development of hybrid network consists of
WiFi + WiMAX, which can guarantee QoS in disaster situations. Generally, we consider two
key components of these systems: wireless hybrid networks and users’ application
algorithms. Also, I introduced new algorithms which provide significant improvements
compared to conventional systems as an addition to my contribution.
When researching wireless hybrid networks, we introduced the concept of end-to-end
heterogeneous QoS and provide optimized solutions for the two most widely used HN:
WiFi+WiMAX and WiFi+LTE as presented in Chapter 3. For these systems it was illustrated
how the system parameters changed, depending on the information transmitted with the
various QoS classes, through a hybrid network. A major parameter in the functioning of the
presented networks is the throughput achieved by the user. The simulation provided us with
the following conclusions - QoS maps were developed to optimize the end-to-end parameter.
All simulation results were presented and analysed. The outcome presented that, depending
on the network loads, the worst class of QoS priority is the best option for the user. This was
explained not only with theory, but also with a practical explanation using actual parameters
of hybrid network.
In the WiMAX as the homogeneous system research, we proposed a new approach for
QoS mapping table as discussed in Chapter 4. We assigned different QoS to different
applications to investigate the network performance. The results presented in this thesis has
Commented [ez10]: I or we?
Commented [ez11]: Our or my?
146
illustrated that the developed approach is applicable to the first responders especially in an
emergency situation.
While conducting the integration of WiFi and WiMAX project, which was reported in
Chapters 5 and 6, we found out that users’ application played an important role in the
bandwidth utilization. Therefore, to allow more users in the hybrid WiFi+ WiMAX network,
we proposed users’ application algorithms for the Wifi users. It applies the proposed models
optimize the bandwidth alongside with the minimization of delays and packet dropped. Also,
various simulations tests were conducted to verify the number of Wifi users could
accommodate in the hybrid system as required by the PPDR operations. The results presented
in this thesis showed that there are some limitations for the users based on a specific
parameters and scenarios. The results have been proposed to the European Union project in
the framework of the program EU FP7 SEC under PPDR-TC grant agreement.
7.2 Limitations and Critical Reflections
During my research in order to achieve the overall objectives, there were some
limitations and critical reflections. In terms of interference problem, the suitable WiFi
standard needs to be chosen in order to have all the CPE working successfully. Therefore, in
my research, I found that 802.11n was the best standard to use. Another concern is the
number of CPEs in the scenario. It would be better if the number of CPEs could be reduced,
which will eventually minimise the cost planning. Therefore, this reveals that more than one
CPE will get connected to the BS.

147
7.3 Future Work
This thesis focuses on two key components of disaster management systems: wireless
hybrid networks and users’ application algorithms. An obvious extension of our research
would be multiple system integration and the overall system optimization. To achieve this
target, the following research challenges should be considered:
Different heterogeneous QoS mapping to optimize the overall throughput and delay;
Integration of WiFi + LTE hybrid systems for first responders in disaster or
emergency situations;
Development of numerical metrics for evaluation and comparison of the integration of
WiFi + LTE hybrid systems.
148
References
[1] N. Moradpoor, et al., “Hybrid optical and wireless technology integrations for next
generation broadband access networks,” in IFIP/IEEE International Symposium on
Integrated Network Management (IM 2011) and Workshops, 2011, pp. 1013–1020.
[2] S. Ahmed, W. Sherif, and S. Qusay, “Dealing with Quality of Service in Hybrid
Wired-Wireless Networks,” in International Conference on Network Applications,
Protocols and Services, NETAPPS 2010, 2010, pp. 105–109.
[3] M. S. Ryu, H.-S. Park, and S.-C. Shin, “QoS class mapping over heterogeneous
networks using Application Service Map,” in International Conference on Systems and
International Conference on Mobile Communications and Learning Technologies,
2006, ICNICONSMCL '06, 2006, p.13.
[4] K.X.Miao, “Enterprise WiMAX Building the Next Generation Enterprise Wireless
Infrastructure with WiMAX,” in International Conference on Wireless Information
Networks and Systems (WINSYS),2010, pp.1-5.
[5] W.Cheng, X.Zhang and H.Zhang, “Heterogenous Statistical QoS Provisioning for
Downlink Transmission Over Mobile Wireless Cellular Networks,” in IEEE Global
Communications Conference (GLOBECOM 2014), 2014, pp. 4622-4628.
[6] Z. H. Fan, Z. X. Zhang, and H. Wang, “A vertical handoff algorithm application to the
integration of WLAN and WMAN wireless heterogeneous networks,” in International
Conference on Computational and Information Sciences, ICCIS 2012, 2012, pp. 803–
806.
[7] R. K. Jha and U. D. Dalal, “Location Based Radio Resource Allocation (LBRRA) in
WIMAX and WLAN network,” in Proceedings of the 2011 World Congress on
Information and Communication Technologies, WICT 2011, 2011, pp. 399–406.
[8] A.Zvikhachevskaya, G. Markarian, and L.Mihaylova, “Quality of Service
consideration for the wireless telemedicine and e-health services,” in IEEE Conference
on Information and Communication Technologies, ICT 2013, 2013, pp. 199–202.
[9] D. K. Zvihachevskiy, “Novel Wireless Monitoring Systems for Aviation and Medical
Applications", Ph.D Dissertation, School of Computing and Communications,
Lancaster University, 2014.
[10] J. Sangeetha and S. Kumar, “A Comparative study on WiFi and WiMAX networks,”
in IEEE International Conference on Computational Intelligence and Computing

149
Research, 2010,pp. 1–5.
[11] Institute of Electrical and Electronics Engineers.” Available
http://www.ieee.org/index.
[12] "IEEE Standard for Local and metropolitan area networks--Part 16: Air Interface for
Fixed broadband Wireless Access Systems--Amendment 2: Medium Access Control
Modifications and Additional Physical Layer Specifications for 2-11 GHz", IEEE Std
802.16a-2003 (Amendment to IEEE Std 802.16-2001), pp. 0_1-292,2003.
[13] S.More and D.K.Misha,“4G Revolution: WiMAX technology,”in International
Conference on Internet (AH-ICI), 2012 Third Asian Himalayas, 2012, pp. 1-4.
[14] S. Ahmadi, “An Overview of Next Generation Mobile WiMAX Technology,” IEEE
Communications Magazine, vol. 47, no 6. pp. 84–98, June 2009.
[15] K. Etemad, “Overview of mobile WiMAX technology and evolution,” IEEE
Communications Magazine, vol. 46, no. 10, pp. 31–40, 2008.
[16] D. Pareit, et al., “The history of WiMAX: A Complete Survey of the Evolution in
Certification and Standardization for IEEE 802.16 and WiMAX,” IEEE
Communications Surveys & Tutorials, vol. 14, no. 4, pp. 1183–1211, 2012.
[17] D.Pareit, et al., “A Throughput Analysis at the MAC Layer of Mobile WiMAX,” in
IEEE Wireless Communications and Networking Conference (WCNC 2010), 2010,
pp.1-6.
[18] “IEEE Standard for Information technology-- Local and metropolitan area networks--
Specific requirements-- Part 11: Wireless LAN Medium Access Control (MAC) and
Physical Layer (PHY) specifications Amendment 8: IEEE 802.11 Wireless Network
Management,” IEEE Standard.
[19] Wireless Local Area Networks, in “IEEE Wiley Press”, 2011, pp. 731-750 ”
[20] D.Kaur, et al., “QoS in WLAN using IEEE 802.11e: Survey of QoS in MAC Layer
Protocols,” in International Conference on Advanced Computing & Communication
Technologies,ACCT 2012, 2012, pp. 468-473.
[21] N.Fishawy, et al., “Modified cross-layer scheduling for mobile WiMAX networks,” in
National Radio Science Conference, NRSC, 2011, pp. 1-10.
[22] IEEE 802.11 standards. Available : http://www.wikipedia/IEEE 802.11/com/

150
[23] L.Nazaryan, E.A.Panaousis and C.Politis, “End-to-End Security Protection.” IEEE
Vehicular Technology Magazine, vol. 5, no 1, pp.85-90.
[24] K. Lu, Y. Qian, and H. H. Chen, “A secure and service-oriented network control
framework for WiMAX networks,” IEEE Communication. Magazine,, vol. 45, no. 5,
pp. 124–130, 2007.
[25] M.Hammoshi, “WiMAX Simulation Model to Investigate Performance Factors,”
Journal of Convergence Information Technology, vol. 6, no. 1, pp. 266–276, Jan.
2011.
[26] Downlink and Uplink in WiMAX. Available: www.microwavejournal.com.
[27] Y.Li and W.Cui, “Research based on OSI model,” in International Conference on
Communication Software and Networks (ICCSN), 2011, pp. 554-557.
[28] S.N.Orzen “Interaction Understanding in the OSI Model Functionality of Networks
with Case Studies,” in International Symposium on Applied Computational
Intelligence and Informatics, SACI, 2014, pp 327-330.
[29] W.Fan, et al., “A Near Field Communication (NFC) security model based on the OSI
reference model,” IEEE Trustcom/BigDataSE/ISPA, 2015, pp. 1324-1328..
[30] OSI model-Wikipedia, the free encyclopedia. Available: http://www.wikipedia/OSI
Model.
[31] A.Ukil and J.Sen, “QoS Aware Cross-Layer Optimized Resource Allocation in
WiMAX Systems,” in International Conference on Wireless Communication,
Vehicular Technology, Information Theory and Aerospace & Electronic Systems
Technology, 2009, pp.812-822.
[32] W.H, Tranter et al., “OSI Reference Model-The ISO Model of Architecture for Open
Systems Interconnection,” IEEE Press Wiley, vol. 1, no. 1, pp.599-606, 2007.
[33] "IEEE Standards for Local and Metropolitan Area networks: Demand Priority Access
Method, Physical Layer and Repeater Specification for 100 Mb/s Operation", IEEE Std
802.12-1995, pp. 0_1-430, 1995.
[34] S. Khemiri, G. Pujolle, K. Boussetta, and N. Achir, “A combined MAC and Physical
resource allocation mechanism in IEEE 802.16e networks,” in IEEE Vehicular
Technology Conference, VTC 2010-Spring, 2010.

151
[35] M. Wang, “WiMAX Physical Layer: Specifications Overview and Performance
Evaluation,” in IEEE Consumer Communications and Networking Conference,
CCNC’2011, 2011, pp. 10–12.
[36] F. Wang et al, “Mobile WiMAX systems- performance and evolution,” IEEE
Communication Magazine, vol. 46, no. 10, pp. 41–49, 2008.
[37] M. N. Khan and S. Ghauri, “The WiMAX 802.16e Physical Layer Model,” in
International Conference on Wireless, Mobile and Multimedia Networks, IET 2008,
2008, pp. 117–120.
[38] J. M. Westall and J. J. Martin, “Performance characteristics of an operational WiMAX
network,” IEEE Transactions on Mobile Computing, vol. 10, no. 7, pp. 941–953, 2011.
[39] M. Seyedzadegan and M. Othman, “IEEE 802.16: WiMAX Overview, WiMAX
Architecture,” International Journal of Computer Theory and Engineering, vol. 5,
no. 5, pp. 784–787, 2013.
[40] A. R. Shankar, P. Rani, and S. Kumar, “An Analytical Approach to Qualitative
Aspects of WiMAX physical layer,” in International Conference on Information
Technology for Real World Problems, VCON 2010, 2010, pp. 36–41.
[41] Y.C.Lai and Y.H. Chen, “Designing and Implementing an IEEE 802.16 Network
Simulator for Performance Evaluation of Bandwidth Allocation Algorithms,” in
International Conference High Performance Computing and Communication, HPCC
'09, 2009.
[42] T. M. Nguyen, et al, “Dynamic Downlink and Uplink Subframe Boundary Adjustment
for Capacity Improvement and QoS Support in Mobile WiMAX,” in Fourth
International Conference on Communications and Electronics, ICCE, 2012, pp. 141–
144.
[43] K. Wongthavarawat and A. Ganz, “Packet scheduling for QoS support in IEEE 802.16
broadband wireless access systems,” International Journal Communication System.,
vol. 16, no. 1, pp. 81–96, Feb. 2003.
[44] M. K. Salman, et al, “Simulation Study of WiMAX Base Station Deployment Using
AMC Under Different Frequency Planning Techniques,” in International Conference
on Electronic Design, ICED, 2014,pp .537-542.
[45] H. Shatila, M. Khedr, and J. Reed, “Adaptive modulation and coding for WiMAX
152
systems with vague channel state information using cognitive radio,” in International
Symposium on Performance Evaluation of Computer and Telecommunication Systems,
SPECTS, 2010, pp. 405-409.
[46] R. K. Jha and U. D. Dalal, “Location based radio resource allocation (LBRRA) in
WiMAX and WiMAX-WLAN interface network,” in International Conference on
Communication Systems and Networks, COMSNETS 2012, 2012, pp. 1-2.
[47] “IEEE Standard for Information technology — Telecommunications and information
exchange between systems — Local and metropolitan area networks — Specific
requirements Part 11 : Wireless LAN Medium Access Control (MAC),” IEEE Std
802.11-2007, pp 1-1076, 2007.
[48] K.Nisar, M.H.Hijazi, I.Lawal, “A New Model of Application Response Time for VOIP
over WLAN and Fixed WiMAX, ” in International Conference on Computing
Technology and Information Management (ICCTIM), 2015, pp.174-179.
[49] "IEEE Standard for Information Technology-Telecommunications and information
exchange between systems-Local and metropolitan area networks-Specific
requirements. Part 11: Wireless LAN Medium Access Control (MAC) and Physical
Layer (PHY) Specifications (Revision of IEEE Std 802.11-1999)", IEEE Std 802.11-
2007, 2007.
[50] L. Kurchazewski and Z. Kotulski, “WiMAX Networks-architecture and data security,”
Annales UMCS Informatica, vol. 11, no. 1, pp. 33–41, 2011.
[51] S.Hong and M.Kim, “Design and Analysis of a Wireless Switched Digital Video
Schemen for Mobile TV Services over WiMAX Networks,” IEEE Transactions on
Broadcasting, Vol.59, no.2, pp-328-339, 2013.
[52] H.Tiwari and B.Chaurausia, “Key Management in WiMAX,” in International
Conference on Communication Systems and Network Technologies (CSNT), 2014, pp.
669-672.
[53] F. Sarfaraz and T. Parveen, “Wireless Communication and Security in Wimax,” IOSR
Journal of Electronics and Communication Engineering, vol. 2, no. 2, pp. 22–29,
2012.
[54] S. Ghazal, L. Mokdad, and J. Ben-Othman, “Performance Analysis of UGS, rtPS,
nrtPS Admission Control in WiMAX Networks,” in International Conference on
Communications,2008, pp. 2696–2701.
[55] D. Ali and K. Dimyati, “Threshold based Cyclic Polling (TbCP): An Uplink
Scheduling Agorithm for Mobile WiMAX Systems,” International Journal of
153
Information and Electronics, vol. 1, no. 1, 2011.
[56] I.Kang, et al., “Mlticarrier Technlogy for 4G WiMAX System,”IEEE Communications
Magazine, Vol 48, no. 8, pp. 50-58.
[57] R. Wong, et al, “WiMAX architecture priority scheduling for multimedia
applications,” in IEEE 27th Canadian Conference on Electrical and Computer
Engineering (CCECE), 2014, pp. 1–6.
[58] A. Sayenko, O. Alanen, and T. Hämäläinen, “Scheduling solution for the IEEE 802.16
base station,” Computer Networks, vol. 52, no. 1, pp. 96–115, 2008.
[59] F. Yin and G. Pujolle, “Efficient polling mechanism in WiMAX network,” in IEEE
Wireless Communications and Networking Conference, WCNC, 2009, 2009, pp1-6.
[60] A. Sayenko, O. Alanen, and T. Hämäläinen, “Scheduling solution for the IEEE 802.16
base station,” Computer Networks, vol. 52, no. 1, pp. 96–115, Jan. 2008.
[61] B.Lee and S.Choi, “Broadband wireless access and local networks: mobile WiMAX
and WiFi-Google Book.” 2008.
[62] A.H.Rashwan, H.M.Elbadawy and H.H.Ali, “Comparative Assessments for Different
WiMAX Scheduling Algorithms,” in World Congress on Engineering and Computer
Science 2009 Vol 1, CES 2009, USA,2009, pp. 6–10.
[63] H. Wang and L. Dittmann, “Downlink resource management for QoS scheduling in
IEEE 802.16 WiMAX networks,” Computer Communications, vol. 33, no. 8, pp.
940–953, 2010.
[64] T. Anouari and A. Haqiq, “Improved QoE-based scheduling algorithm in WiMAX
network,” in International Conference on Multimedia Computing and Systems
(ICMCS), 2014, pp. 878–883.
[65] D. Camps-Mur, et al, “Leveraging 802.11n frame aggregation to enhance QoS and
power consumption in Wi-Fi networks,” Computer Networks, vol. 56, no. 12, pp.
2896–2911, 2012.
[66] B. Ammar A., D. B. Mohd, and I. Muhammad, “IEEE 802.21 based vertical handover
in WiFi and WiMAX networks,” in IEEE Symposium Computer Informatics, Isc.
2012, 2012, pp. 140–144.
[67] H.Afrancheh and A.Haghighat, “Adaptive Controling of IEEE 802.16 WiMAX
154
standard and IEEE 802.11 Wireless LAN Networks standard.” in International
Conference on Computer Science and Information Technology (ICCSIT), 2010, pp 82-
85.
[68] G. Malik and A. Singh, “Performance Evaluation of WiFi and WiMAX Using Opnet,”
International Journal of Advanced Research in Computer Science and Software
Engineering, vol. 3, no. 6, pp. 571–579, 2013.
[69] N. Ghazisaidi, H. Kassaei, and M. S. Bohlooli, “Integration of WiFi and WiMAX-
Mesh Networks,” in International Conference Advanced Mesh Networks, 2009, pp.
6–11.
[70] S. Banerji and R. S. Chowdhury, “Wi-Fi & WiMAX : A Comparative Study,” Journal
of Engineering, vol. 2,no. 5, 2013.
[71] K.S.Ting, et al., “The Performance Evaluation of IEEE 802.11 against IEEE 802.15.4
with Low Transmission Power”, in Asia-Pacific Conference on Communications
(APCC), 2011, pp. 850-855.
[72] A.Das, et al., “Effects on IEEE 802.11 MAC Throughput in Wireless LAN Over Fiber
Systems”, Journal of Lightwave Technology, vol.25,no.11, pp. 3321-3328.
[73] W. Shao-Cheng and A. Helmy, “Performance Limits and Analysis of Contention-
based IEEE 802.11 MAC,” in IEEE Conference Local Computer Networks, 2006, pp.
418–425..
[74] J. K. Jain, “Performance Evaluation of Hybrid Multipath Progressive Routing Protocol
for MANETs,” International Journal of Computer Applications , vol. 71, no. 18, pp.
25–29, 2013.
[75] C. M. Sarraf, F. Ousta, N. Kamel, and M. Z. Yusoff, “Quality of service mapping
between UMTS, WiMAX and IP-based network in Heterogeneous Wireless
Networks,” in IEEE International Conference on Intelligent and Advanced Systems
(ICIAS2012), 2012), pp. 291–295.
[76] E. Mingozzi, et al., “EuQoS: End-to-End Quality of Service over Heterogeneous
Networks,” Computer Communications, vol. 32, no. 12, pp. 1355–1370, 2009.
[77] G. Vijayalakshmy, N. Lakshmy, and G. Sivaradje, “QoS Improvement for the Next
Generation Heterogeneous Network,” International Journal Computer Applications,
vol. 92, no. 15, pp. 1–13, 2014.
155
[78] N.Dutta and S.R.Biradar, “Interoperability of WiFi and WiMAX,” in IEEE 2nd
International Conference on Parallel, Distributed and Grid Computing, 2012.
[79] L. Yi and K. X. Miao, “WiMAX-WiFi unified network architecture, security, and
mobility,” in International Conference Communication Technology Proceedings,
ICCT, 2010, pp. 324–327.
[80] M.Gracias, V.Knezevic, and A.Esmailpour, “Interoperability between WiMAX and
WiFi In a Testbed Environment,” in Canadian Conference on Electrical and Computer
Engineering (CCECE), 2011, pp. 1144–1148.
[81] S. Tang, “Performance Analysis of an Integrated Wireless Network using WiMAX as
Backhaul Support for WiFi Traffic,” in Military Communications Conference,
MILCOM 2011, 2011, pp. 1833–1837.
[82] W. Wang, X. Liu, J. Vicente, and P. Mohapatra, “Integration gain of heterogeneous
WiFi/WiMAX networks,” IEEE Transaction. Mobile Computing, vol. 10, no. 8, pp.
1131–1143, 2011.
[83] A. G. Fragkiadakis, et al., “Ubiquitous robust communications for emergency response
using multi-operator heterogeneous networks,” EURASIP Journal on Wireless
Communications and Networking, vol.1, no.1, 2011.
[84] G. Baldini, T. Sturman, A. Dalode, A. Kropp, and C. Sacchi, “An emergency
communication system based on software-defined radio,” EURASIP Journal on
Wireless Communications and Networking, pp. 1–16, 2014.
[85] E. L.Franck, et al., “On the role of satellite communications for emergency situations
with a focus on Europe,” International Journal Satelite Communications and
Networking, vol. 28, no. 5–6, pp. 291–315, 2010.
[86] M.Chimbwanda, “Evaluating The Performance of Mesh network Protocols For
Disaster Scenarios,” Msc Dissertation, University of Western Cape, 2011.
[87] A.Calderon and R.Abadias, "Land Mobile Radio,Following a Realistic Path Toward
Broadband for PPDR Services” IEEE Vehicular Technology Magazine, pp.37–45,
2013.
[88] “REDCOMMproject.” Available: http://www.redcomm-project.eu/description.
[89] “Quality of Service Networking,” Internetworking Research And Experience.
Available: http://www.wikipedia.com

156
[90] V. Abel and R. Rambally, “WiMax and Wi-Fi in Current World,” International
Journal of Scientific & Engineering Research ,vol. 2, no. 9, pp. 1–4, 2011.
[91] I. Paudel, F. Outay, and B. Jouaber, “QoS-HAN : QoS Provisiong in Home Automated
Networks over IEEE 802.11n” in IEEE Symposium on Computers and
Communications, ISCC, 2012. pp. 839–844.
[92] G. Lampropoulos, et al., “A flexible UMTS/WLAN architecture for improved network
performance,” in Wireless Personal Communications, , 2007, pp. 889–906.
[93] A.Manal and E.Khaled, “WIMAX Basics From PHY Layer to Scheduling and
Multicasting Approaches, International Journal of Compuetr Science & Engineering
Survey, IJCSES, vol. 2, no. 1, pp. 1–17, 2011.
[94] H. Guesmi and S. Maaloul, “A Cross-Layer Qos Based Scheduling Algorithm WRR
Design in Wimax Base Stations,” American Journal of Electrical and Electronic
Engineering, vol. 1, no. 1, pp. 1–9, 2013.
[95] S. Cho and S. Seol, “Providing QoS and Rate Limiting for WiMAX Mobile Hotspots
based on Policy and Charging Control Architecture,” International Journal of Control
and Automation, vol. 6, no. 4, pp. 217–226, 2013.
[96] C. So-in, S. Member, R. Jain, and A. Tamimi, “Scheduling in IEEE 802.16e Mobile
WiMAX netwoks: key issues and a survey,” IEEE Journal on Selected Areas in
Communications, Vol.27, no.2, pp. 156-171, 2009.
[97] K. Noordin and G. Markarian, “Providing QoS support through schedulling in
WiMAX systems,” International Journal of the Physical Sciences, vol. 6, no. 16, pp.
4070–4081, 2011.
[98] S. Parkvall, et al., “LTE-Advanced - Evolving LTE towards IMT-Advanced,” in IEEE
Vehicular Technology Conference, VTC 2008-Fall, 2008, pp. 1-5.
[99] V. H. Muntean, M. Otesteanu, and G. M. Muntean, “QoS parameters mapping for the
E-learning traffic mix in LTE networks,” in International Joint Conference on
Computational Cybernetics and Technical Informatics (ICCC-CONTI), 2010 pp. 299-
304.
[100] M. Alasti, B. Neekzad, J. Hui, and R. Vannithamby, “Quality of service in WiMAX
and LTE networks,” IEEE Communication Magazines, vol. 48, no. 5, pp. 104–111,
2010.
[101] H. Pham, X. N. Vu, and S. Hwang, “Service Class-Aided Scheduling for LTE,” in
International Conference on Advanced Communication Technology (ICACT), 2011

157
pp. 39–43.
[102] L. Li, S. Shen, and C. C.-Y. Yang, “LTE CoS/QoS Harmonization Emulator,” 2011 in
International Conference on Cyber-Enabled Distributed Computing and Knowledge
Discovery (CyberC), 2011, pp. 154–161.
[103] P. Bhagat, P. Halgaonkar, and V. Wadhai, “Comparison of LTE and WiMAX on the
Basis of Qualities,” International Journal of P2P Network Trends and Technology,
vol. 1, no. 3, pp. 5–12, 2011.
[104] D. C. Josheff, S. M. Paul, and M. D. José, “Model of QoS on NGN: An analysis of
performance,” in IEEE Conference of Electronics, Robotics and Automotive
Mechanics, CERMA 2010, 2010pp. 271–276.
[105] B. Kumar and P. Gupta, “Scheduling algorithms in a WiMAX network,” in
International Conference on Advanced Computing and Communication Technologies,
ACCT 2012, 2012, pp. 457–462.
[106] K. Jaswal and K. Vats, “OPNET Based Simulation Investigation Of WiMAX Using
Different QoS” International Journal of Research in Engineering and Technology, pp.
575–579, 2014.
[107] P. Grover and M. Chawla, “Performance Analysis Of VOIP Codec’s With QoS
Parameters,” International Journal of Advance Foundation and Research in Computer,
vol. 2, no. 5, pp. 96–103, 2015.
[108] “Measuring Delay, Jitter, and Packet Loss with Cisco IOS SAA and RTTMON -
Cisco.” Available : http://www.cisco.com
[109] I. Lawal, A. Said, and A. Mu’azu, “Simulation Model to Improve QoS Performance
over Fixed WiMAX using OPNET,” Research Journal of Applied Sciences,
Engineering and Technology, vol. 6, no. 21, pp. 3933–3945, 2013.
[110] “Jitter ”. Available : http://www.wikipedia.com
[111] D. Ali and K. Dimyati, “Performance Analysis of Delay Jitter in Mobile WiMAX
Systems,” International Conference on Information and Electronics Engineering, vol.
6, pp. 6–10, 2011.
[112] “Packet loss ”. Available : http://www.wikipedia.com.
[113] S. S. Islam and M. B. Mollah, “OPNET based study on the effects of both FACH

158
scheduling and bandwidth on QoS in UMTS network,” in International Conference
Informatics, Electron. Vision, ICIEV 2012,212, pp. 887–892.
[114] J. V. Maisuria and R. M. Patel, “Overview of techniques for improving QoS of TCP
over wireless links,” in International Conference on Communication Systems and
Network Technologies, CSNT 2012, 2012, pp. 366–370.
[115] J. Lee et al., “QoS Mapping over Hybrid Optical and Wireless Access Networks,” in
International Conference on Evolving Internet, 2009, pp. 1–3.
[116] P. Wang, et al., “Hybrid network combining PLC and IEEE802.16 for hospital
environment,” in International Symposium on Power Line Communications and its
Applications, IEEE ISPLC 2010, 2010, pp. 267–272.
[117] G. Markarian, et al., “Video distribution techniques over WiMAX networks for m-
health applications,” IEEE Transactions on Information Technology in Biomedicine,
vol. 16, no. 1, pp. 24–30, 2012.
[118] K. Fall and K. Varadhan, “The network simulator (ns-2),” ”. Available : http://www.
isi. edu/nsnam/ns. 2007.
[119] L. Guo, et al., “Performance evaluation for on-demand routing protocols based on
OPNET modules in wireless mesh networks,” Computer Electronics Engineering, vol.
37, pp. 106–114, 2011.
[120] “ns-3.”. Available : http://www.nsnam.org/
[121] O. Modeler, “Opnet Technologies,” Available : http ://www. mil3. com.
[122] W. Zhao and J. Xie, “OPNET-based modeling and simulation study on handoffs in
Internet-based infrastructure wireless mesh networks,” Computer Networks, vol. 55,
pp. 2675–2688, 2011.
[123] N. Jakhar and K. Vats, “OPNET based Performance Evaluation of WIMAX Network
with WIMAX Management using Different QoS,” International Journal of Research
in Engineering and Technology, vol. 3, no. 6, pp. 862–872, 2014.
[124] S. Mittal, “OPNET: An Integrated Design Paradigm for Simulations,” Software
Engineering : An International Journal (SEIJ), vol. 2, no. 2, pp. 57–67, 2012.
[125] S.Habib and P.Marimuthu,“Optimized capacity Planning and Performance
Measurement through OPNET Modeler,” in International Conference on Computer

159
Applications and Industrial Electronics (ICCAIE), 2010, pp. 43-48.
[126] B. F. Gumaidah, H. H. Soliman, and M. Obayya, “Study the Effect of Base Frequency
on the Performance of WiMAX Network Carrying Voice,” International Journal of
Computer Networks & Communications, vol. 4, no. 4, pp. 77–88, 2012.
[127] A. M. S. , K. N. and A. A. M. Ibrahim A. Lawal, “A Distributed QoS-Oriented Model
to Improve\nNetwork Performance for Fixed WiMAX,” International Journal on
Recent Trends in Engineering and Technology, vol. 10, no. 1, p. 17, 2014.
[128] R. M. Library, “Riverbed Modeler,” Available : http ://www.riverbed.com
[129] P.Vajsar, et al., “Advanced Trajectory Management Techniques for Mobile Nodes in
OPNET Modeler Environment,” in International Conference on Telecommunications
and Signal Processing (TSP), 2012, pp. 348-353.
[130] N. Shah, “Network Simulation Using Opnet,” MSc Dissertation, London City
University, 2006.
[131] “Network Modeling using Windows - OPNET IT Guru_ Creating the Application and
Profile Objects.” . Available : http ://www. opalsoft.net/qos
[132] M.Torad, A.Qassas, H.Henawi, “Comparison between LTE and WiMAX based on
System Level Simulation Using OPNET modeler, ” in National Radio Science
Conference (NRSC), 2011, pp. 1-9.
[133] M.Drajic and I.Kokic, “A comparative analysis of simulators NS2 and OPNET IT
Guru Academic Edition” in Telecommunications Forum, TELFOR, 2012, pp. 1780-
1783.
[134] A.S.Mahmoud, “Network Simulation Wireless Local Area Network Standard,”
Simulation, pp. 1–42, 2007.
[135] E. C. Park, “Efficient uplink bandwidth request with delay regulation for real-time
service in mobile wimax networks,” IEEE Transaction Mobile Computing , vol. 8, no.
9, pp. 1235–1249, 2009.
[136] J. M. Sultan, G. Markarian, and P. Benachour, “WiMAX Quality of Service
Deployment in Disaster Management,” in International Conferences on Advances in
Computing, Communication and Information Technology, CCIT-2014, 2014, pp. 36–
40.

160
[137] “WiMAX-WiFi Synergy for Next Generation Heterogynous Network _ InTechOpen.”
Available : http:// www.intechopen.com/books/wimax-new-developments/wimax-wifi-
synergy-for-next-generation-heterogynous-network.
[138] P. Neves, et al, “WiMAX for Emergency Services : An Empirical Evaluation,” in
International Conference on Next Generation Mobile Application, Services and
Technologies, INGMAST 2007, 2007.
[139] “WEIRD project.” A Report by National Research Networks by Italy, Portugal, Spain.
[140] E. Guainella, et al, “WiMAX Extensions to Isolated Research Data Networks,” in
IEEE Wiley Press, 2008, pp. 329-352.
[141] A. Flizikowski and M. Przybyszewski, “Evaluation of QoS and QoE in Mobile
WIMAX – Systematic Approach.” Available: http://www.intechopen.com/
[142] P. Mach and R. Bestak, “WiMAX throughput evaluation of conventional relaying,” in
IFIP International Federation for Information Processing , Vol 245, Personal Wireless
Communications, Springer, 2007, pp. 11–17.
[143] D. Zvikhachevskiy, J. M Sultan,K. Dimyati “Quality of Service Mapping Over
WiFi+WiMAX and WiFi+LTE Networks,” in Journal of Telecommunication,
Electronic and Computer Engineering, vol. 5, no. 2, pp. 1–10, 2013.
[144] “WiMAX system evaluation methodology,” by Wimax Forum, 2008, pp. 1–208.
[145] “Report to Congressional Requesters EMERGENCY ALERTING Capabilities Have
Improved, but Additional Guidance and Testing Are Needed,” United States
Government Accountability Office, April, 2013.
[146] “Report for the TETRA Association Public safety mobile broadband and spectrum
needs, ” Final report by Analysys Mason, March, 2010.
[147] “PPDR.” Available: http://www.ppdr-tc.eu/
[148] G. Vijayalakshmy and G. Shivaradje, “WiMAX and WiFi Convergence Architecture
to Achieve QoS,” ObCom 2011, Springer, pp. 512–521, 2012.
[149] L. Hou and K. X. Miao, “A Pre-authentication Architecture in WiFi & WiMAX
Integrated System,” in International Conference on Communications and Networking
in China, 2009. ChinaCOM 2009, pp 1-5.
[150] E. Doulatyari, et al., “Quality of Service Support for a WiFi-WiMAX Network in a

161
Test-bed Environment,” in International Conference on Innovations in Information
Technology (IIT), 2012, pp. 316–321.
[151] A. Sarma, S. Chakraborty, and S. Nandi, “Deciding Handover Points based on Context
Aware Load Balancing in a WiFi-WiMAX Heterogeneous Network Environment,”
IEEE Transaction on Vehicular Technology, vol. 65, no. 1, pp. 348-357, 2015.
[152] D. Niyato and E. Hossain, “WIRELESS BROADBAND ACCESS: WIMAX AND
BEYOND - Integration of WiMAX and WiFi: Optimal Pricing for Bandwidth
Sharing,” IEEE Communication Magazine, vol. 45, no. 5, pp. 140 –146, 2007.