Embed Size (px)
Citation preview
8/3/2019 Hybrid Vehicles Performances Analysis-Feed
http://slidepdf.com/reader/full/hybrid-vehicles-performances-analysis-feed 1/12
ABSTRACT
The continuous increase of pollutants and fine particulates is
mainly caused by cars circulating worldwide. Therefore, it is
necessary to replace internal combustion engines with the
cleanest electric motors. The short term solution is
represented by Hybrid Electric Vehicles (HEVs) due to its
environmental and efficiency characteristics. In the present
paper a dynamic feed-forward mathematical model for a
hybrid vehicle performance analysis is proposed. Torque and
power, pollutant emission, fuel consumption, battery pack
state of charge, as well as speed and acceleration have been
evaluated by means of simulation of United State and
Japanese standard driving cycles. In order to carry out
simulations on a real hybrid configuration, the model has been based on the powertrain installed on the Toyota Prius
(Toyota Hybrid System - THS). A mathematical sub-model
of each vehicle component has been implemented to simulate
the real vehicle behavior in all possible running conditions.
To do so, a rule-based control strategy was also implemented
to manage the energy flows during vehicle motions taking
into account battery pack state of charge, vehicle speed,
engine and motor torques, as well as power generation in
regenerative breaking condition. In order to assess the
effectiveness and accuracy of the implemented mathematical
model, different simulations on standard driving cycles have
been carried out, and results have been compared with
experimental data found in scientific literature. The
comparison shows a well evident agreement between
simulated and experimental data in different running
conditions. Furthermore, in an acceleration test from 0 km/h
to 100 km/h, the response of the simulated vehicle has been
evaluated, and results showed a good agreement between
simulated and experimental data. The developed
mathematical model is a powerful tool to study the dynamics
of powertrain system and the interaction between
components. It is also possible to try out new control
strategies able to reduce fuel consumption and pollutants
emissions maintaining at the same time the required performance.
INTRODUCTIONToday, evermore stringent anti-pollution laws and the
pressing need for energy saving are driving the technologica
development of increasingly efficient propulsion [1].
Hybrid propulsion systems are nowadays a short-medium
term solution for obtaining higher efficiency targets and
lower pollutant emissions thanks to the interconnection of
two propulsion systems. At present the most common
solution is the combination of an internal combustion engineand an electric motor.
Both industrial and scientific research have given great
impetus to such technology.
As regards the car industry, in 1997 Toyota Motor Corp
marketed their first hybrid vehicle, the Prius, first in Japan
and then worldwide in 2001. Honda followed suit with their
Insight, marketed in 2000. Since then, Toyota has been
working on several THS (Toyota Hybrid System) propulsion
versions, which will be marketed in Europe from 2010, all
based on a hybrid Series/Parallel configuration.
The research community has mainly focused on energy-flow
optimization and overall vehicle-propulsion management, so
as to further reduce fuel consumption and pollutants. So, to
optimize these flows and performance, there are two main
approaches: experimental and numerical modeling.
This latter approach is preferred, especially by the scientific
community, because mathematical models ensure fas
technological low-cost development which can then be tested
experimentally for optimized solutions.
Hybrid Vehicles Performances Analysis: Feed-
Forward Dynamic Approach
2010-01-1443
Published
05/05/2010
S. Brusca, A.T. Galvagno, R. Lanzafame and M. MessinaUniv. of Catania
Copyright © 2010 SAE Internationa
THIS DOCUMENT IS PROTECTED BY U.S. COPYRIGHT
It may not be reproduced, stored in a retrieval system, distributed or transmitted, in whole or in part, i n any form or by any means.
Downloaded from SAE International by Clemson University Libraries, Copyright 2011 SAE International
Friday, December 02, 2011 03:54:22 PM
8/3/2019 Hybrid Vehicles Performances Analysis-Feed
http://slidepdf.com/reader/full/hybrid-vehicles-performances-analysis-feed 2/12
Mathematical models [2], depending on level of accuracy, are
divided into three main categories: static, quasi-static and
dynamic. The first two [3 and 4], feature a backward vehicle
simulation, while the last is a forward one. In the first case,
the simulation starts from the cycle-imposed speed which,
with backward calculations, is able to determine the
consumption of the fuel needed to run the imposed cycle. In
forward models, the simulated vehicle speed is controlled bythe driver, as in reality, to follow the imposed cycle; this
provides actual fuel consumption, pollutant emissions and
predicts vehicle perfor mance.
The main advantages of using a static or quasi-static model
lie in simpler implementation of the model and quicker
computations, but this also entails less accurate results in
dynamic simulations and inadequacy in simulating vehicle
performance. By contrast, dynamic models, being more
complex to accomplish and requiring more computing time,
obtain more accurate results in dynamic simulations as well
as predicting the real performance of simulated vehicles.
Besides, these models best lend themselves to the study and
development of control strategies for engines and the
generation and storage of electricity.
The present work deals with the study of a hybrid vehicle, by
implementing a dynamic mathematical model to simulate the
Toyota Prius THS performance.
DYNAMIC MODELA feed-forward mathematical model was studied and
implemented for a vehicle with hybrid Series/Parallel
propulsion.
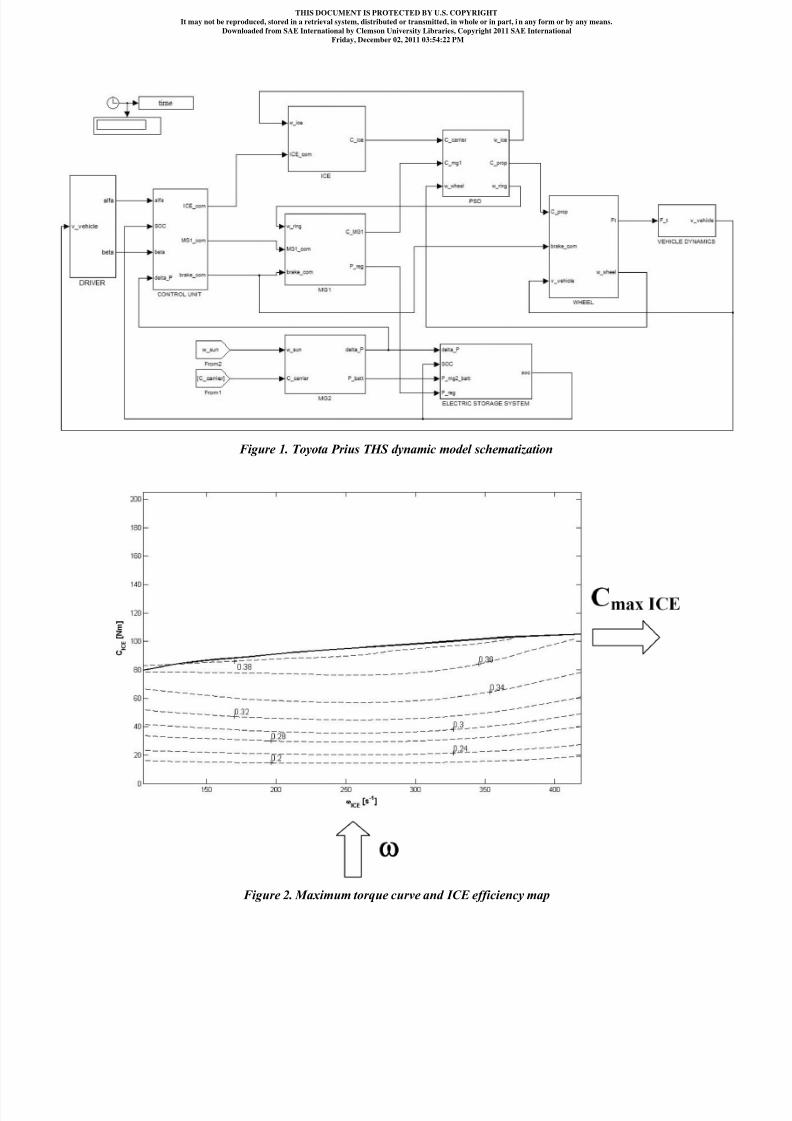
Figure 1 shows the Simulink® environment/mathematical
model of the Toyota Prius THS, listing all the main elements:
• Driver
• Control Unit (CU)
• Internal Combustion Engine (ICE)
• Electric Motor (MG1)
• Electric Power generator (MG2)
• Power Split Device (PSD)• Battery
• Wheel and vehicle Dynamics
(See Figure 1 after last section of paper)
This model is a feedback model, where the control parameter
is the simulated vehicle speed. A brief description of each
component is given below.
DRIVER In the Driver subsystem, driving-cycle imposed speed and
feedback simulated speed are compared. The comparison
error is managed by two PID controllers, one for the
accelerator, the other for the brake, the function of which is to
control the related variable, in this case the vehicle simulated
speed so as to follow, as faithfully as possible, the referencevariable which is the driving-cycle imposed speed. Within the
PID controller, equation 1 is solved:
(1)
where Kp, Ki and Kd respectively are the gains from
proportional, integrative and derivative effects of th
controller, e(t ) is error and u(t) is controller response. The
controller response corresponds to a signal proportional to the
pressure exerted by the driver on the accelerator and brake
pedals.
Controllers calibration was done using the Ziegler-Nichols
methodology [5].
The output signal of the Driver subsystem ranges from 0 to 1
which correspond to the two pedal end-strokes. These signal
are used as input signals for the Control Unit subsystem.
CONTROL UNITThe Control Unit, together with the Power Split Device, is the
most important part of the THS system. All the signals from
other subsystems converge in this subsystem, allowinginteraction between propulsion, generation and storage
components.
THS has five possible operational modes which vary
according to the power and speed requirements imposed by
the driving cycle. The control unit receives as input the
accelerator and the brake signals, the state of charge (later
SOC) of the storage system and the generated and required
power from electrical machines. Taking into account all these
signals, the control unit activates one of the five possible
operational modes.
In the first mode (Fully Electric), only the electric motor(MG1) propels the vehicle, while the ICE remains off. This
condition occurs during starting and low-speed drives and
requires at the same time vehicle speeds lower than 45 km/h
and battery SOC over 50%. If these two conditions are no
simultaneously verified, the control unit activates the second
operational mode.
The second mode applies when vehicle speed is over 45 km/
h, and when the power generate by MG2 (moved from ICE)
is greater than power required from MG1. In this mode, the
THIS DOCUMENT IS PROTECTED BY U.S. COPYRIGHT
It may not be reproduced, stored in a retrieval system, distributed or transmitted, in whole or in part, i n any form or by any means.
Downloaded from SAE International by Clemson University Libraries, Copyright 2011 SAE International
Friday, December 02, 2011 03:54:22 PM
8/3/2019 Hybrid Vehicles Performances Analysis-Feed
http://slidepdf.com/reader/full/hybrid-vehicles-performances-analysis-feed 3/12
ICE and MG1 together generate the torque necessary to set
the vehicle in motion. In this operational mode the Control
Unit evaluates if the motor MG2 can provide the power
required by the motor MG1 (delta_P=(C MG1 − C MG2) <0), if
so it actives both the ICE to MG1.
If the vehicle speed is over 45 km/h, the power generate by
MG2 is lower than power required from MG1 and the SOC isgreater than 50%, the CU activates the third mode. In this
case, the MG1, besides to uses MG2 energy, also drains
energy from the storage system.
The fourth mode is activated during vehicle deceleration and
braking. In this case MG1 becomes an electric power
generator and recharges the storage system.
The fifth mode is activated when the vehicle stops and the
SOC is less than 50%. Then, the ICE works at its maximum
efficiency point, allowing the MG2 to increase the SOC of
the storage system.
PROPULSION AND GENERATION
SYSTEMSThe propulsion systems, ICE and MG1, and the power
generation system MG2, are complex structures in which
thermo-chemical and electro-mechanical transformations take
place. These systems have been simulated through the use of
their characteristic curves that allow to link torques and
power to rotational speed of moving parts.
For ICE, MG1, and MG2 the torque can be evaluated by
equation 2:
(2)
where stands for maximum torque at the rotational
speed considered, is system pulsation, α represents the
accelerator pedal position, J is the total polar moment of
inertia and P aux is the power absorbed by any accessories,
assumed constant as rotational speed varies.
The C max can be deduced from the characteristic curves for
ICE, MG1, and MG2. In Figure 2, the ICE characteristiccurves [6] is shown as an example.
(See Figure 2 after last section of paper)
Within the ICE subsystem there is a further submodel which
determines the specific fuel consumption and pollutant
emissions.
The fuel flow rate is calculated from power balance equation
3:
(3)
where P IC E is the power output of ICE subsystem, η ICE
represents ICE efficiency which varies as supplied power and
rotational speed vary (see Figure 2), Hi is the lower heating
value of the fuel and ṁcomb is the fuel flow rate.
Solving equation 3 and integrating over time, the fue
consumption is obtained for the chosen driving cycle.
To evaluate the CO2 production, equation 4 is applied [4]:
(4)
where mcomb is fuel mass used, mmC is carbon molar mass
mmO is oxygen molar mass, mm H is hydrogen molar massand H_C is the hydrogen/carbon fuel ratio.
PSD (POWER SPLIT DEVICE)Figure 3 shows the Power Split Device used to connect the
two power sources and the THS system generator. It is an
epicyclic train composed of a sun gear, a ring gear and a
planetary carrier, to which the generator, the motor and the
ICE are connected. On the shaft connecting the ring gear and
the MG1 there is a gearing which transfers the engine-
generated torque to the wheels via a silent chain.
ICE-generated power is conveyed to the wheels(mechanically) and generator (electrically). The former
consists in transferring power from the planetary carrier to
the ring gear, the latter in power transfer from the planetary
carrier to the PSD sun gear, to which the generator is
connected. The energy transferred to it is turned into
electricity which is stored in the batteries or sent to the MG1.
To calculate the torque and rotation speed of each PSD
component, the power equilibrium between the various shafts
and the ratios of torques to rotation speeds have been
examined and solved. In order not to complicate the model
the inertial PSD torques were deliberately overlooked
entailing a slight fuel saving.
THIS DOCUMENT IS PROTECTED BY U.S. COPYRIGHT
It may not be reproduced, stored in a retrieval system, distributed or transmitted, in whole or in part, i n any form or by any means.
Downloaded from SAE International by Clemson University Libraries, Copyright 2011 SAE International
Friday, December 02, 2011 03:54:22 PM

8/3/2019 Hybrid Vehicles Performances Analysis-Feed
http://slidepdf.com/reader/full/hybrid-vehicles-performances-analysis-feed 4/12
Figure 3. Power Split Device
From calculations made in the other subsystems, the PSD
input variables are known: C ICE the torque supplied by the
ICE, the MG1 rotation speed and C MG1, the MG1
torque. From these inputs, the output variables were defined
by solving equations 5, 6 and 7 [7]:
(5)
(6)
(7)
where is MG2 rotation speed and C MG2 is MG2
torque, is the ICE rotation speed, and z is the number
of teeth of the sun and ring gear.
Knowing the ICE and MG1 torques which propel the vehicle,
the torque from the shaft connected to the PSD ring gear
which is transferred to the wheels through a system made upof a silent train and a series of cogwheels was calculated as
per equation 8:
(8)
where C prop is the torque generated by the PSD subsystem
resulting from the torques supplied by both power sources
and τ stands for the transmission ratio related to al
components between the PSD and the drive wheels.
ELECTRIC STORAGE SYSTEMThe subsystem dealing with electric power storage [8
features equations used to obtain the state of charge (SOC) o
the storage batteries: 38 modules of 7.2 V nominal. Thissubsystem solves equation 9:
(9)
where SOC 0 stands for the initial storage battery charge, and
within the integral:
(10)
where I batt is the charge/discharge current, and C batt is the
system storage capacity; from equation 10 it follows that if
the I batt is negative the storage system is discharged and vice
versa for charging.
The power supplied or absorbed from the storage system
( P batt ), can be evaluated by equation 11:
(11)
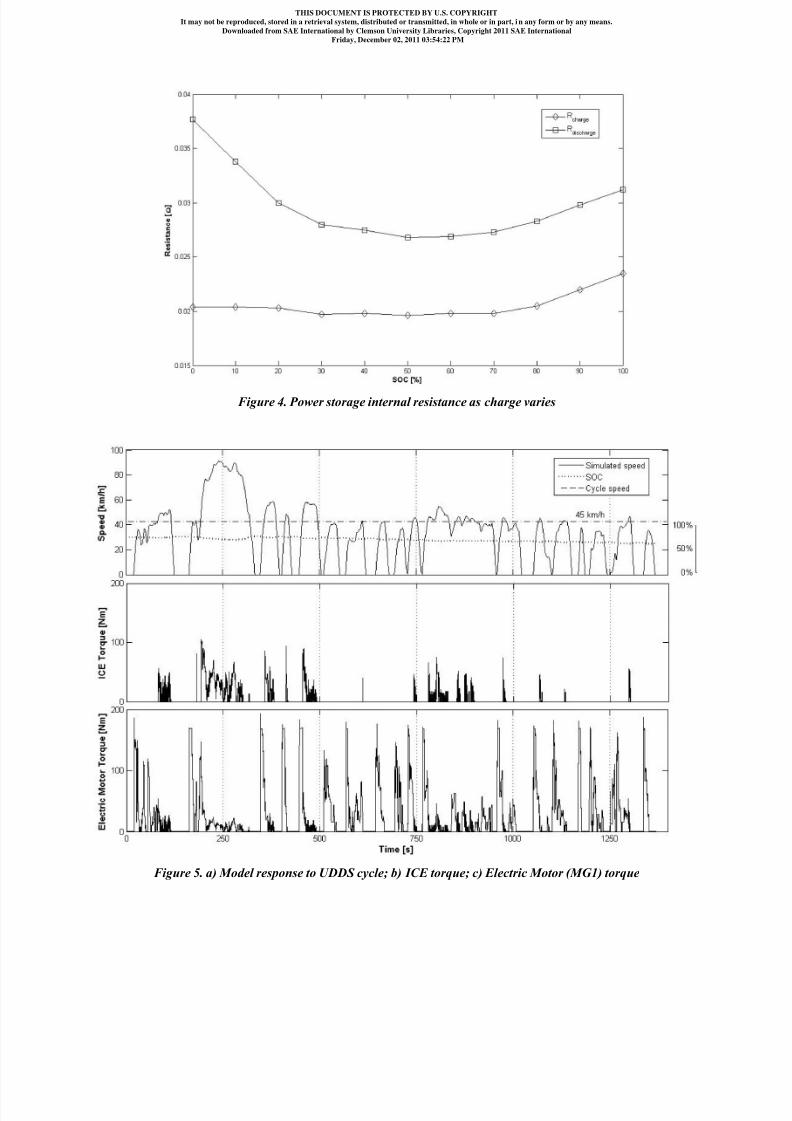
where V oc and Rbatt indicate idle voltage and power storageinternal resistance, the latter being different in charge and
discharge phases, both functions of SOC, as reported in
Figure 4 [9].
(See Figure 4 after last section of paper)
WHEEL AND VEHICLE DYNAMICSWithin these two subsystems, the simulated vehicle speed is
defined by solving the unidimensional equation of motion. In
this model it is assumed that vehicle motion is rectilinear and
that the wheels do not skid either during braking or
acceleration; this simplifies the equations but produces lowerfuel consumption.
The Wheel subsystem calculates the horizontal componen
traction force F t which provides vehicle acceleration or
deceleration through equation 11:
(12)
THIS DOCUMENT IS PROTECTED BY U.S. COPYRIGHT
It may not be reproduced, stored in a retrieval system, distributed or transmitted, in whole or in part, i n any form or by any means.
Downloaded from SAE International by Clemson University Libraries, Copyright 2011 SAE International
Friday, December 02, 2011 03:54:22 PM
8/3/2019 Hybrid Vehicles Performances Analysis-Feed
http://slidepdf.com/reader/full/hybrid-vehicles-performances-analysis-feed 5/12
where C prop is the torque generated by the PSD subsystem
resulting from the torques supplied by both engines, C braking
is braking system torque proportional to the brake pedal
position, C inertia the torque inertia at the wheels and Rwheel
the wheel radius.
In the Vehicle Dynamics subsystem, the motion equation is
solved along the vehicle's trajectory.
(13)
where F p is the projection of the gravitational force along the
vehicle's trajectory, F r is the friction generated by the tire
rolling along the asphalt, due to the rolling friction
coefficient, F a is the aerodynamic friction caused by the
vehicle impacting the air, mv is the vehicle mass and v ̇vehicle is
the vehicle acceleration.
Integrating and solving equation 12 in relation to speed, we
get the feedback signal which allows the subsystem Driver,
once the difference between cycle-imposed speed and actual
vehicle speed is known, to send the most suitable acceleration
or braking inputs to obtain a f aithful reproduction of the
imposed cycle.
SIMULATIONS AND DISCUSSION OFRESULTSAll parameters concerning the system's components were put
into the mathematical model in order to carry out simulations
and evaluate the effectiveness of the model. As stated above,up to now two versions of Prius are on the market, the THS
and the 2nd generation called THS-II. Basing on data from
the two versions [10], it has been noticed that the
improvements in the second series mainly consist in a more
efficient ICE, a larger motor and generator, and some small
details in the control system such as extending the generator's
range. Apart from that, nothing has changed in the dynamic
equations which govern the vehicle. The simulation regarded
the THS model.
All vehicle characteristics, efficiency maps and characteristic
curves, were obtained from official Toyota Motor Corp.,
from the ADVISOR 2002 and from scientific literature [11].
Figure 5 a) shows the response of proposed model to the
UDDS standard cycle (Urban Dynamometer Driving
Schedule) in terms of speed and state of charge of the power
storage system (SOC at the cycle beginning equal to 70%;
SOC at the cycle end equal to 62 %). The model closely
follows the imposed cycle; notice how the simulated speed
faithfully follows the reference cycle speed whereas SOC
trend is similar to that seen in [12].
Figure 5 a) shows also the threshold of 45 km/h. The ICE is
activated when the vehicle speed overcomes this threshold
(see Figure 5 b).
For each SOC starting value, during UDDS cycle, the THS
Control Unit manages power sources in or der to obtain a fina
SOC value of about 60%. This THS strategy is designed to
optimized the fuel consumption [12].
(See Figure 5 after last section of paper)
Figure 5 b) and c) shown the ICE and MG1 torques
respectively. The ICE is activated when vehicle speed
overcomes the threshold of 45 km/h, while the electrical
motor (MG1) is activated when vehicle acceleration is greater
than zero and vehicle is moving (vvehicle > 0 km/h)
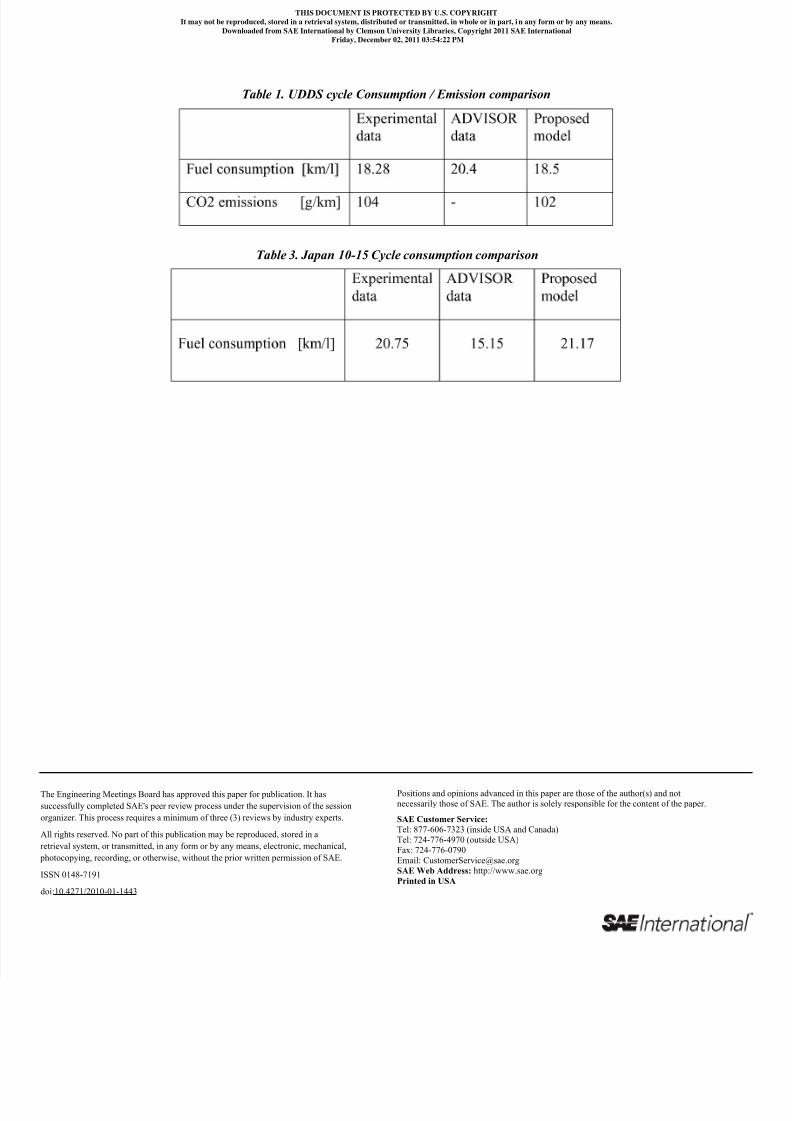
Table 1 shows a comparison between the simulation results
of the proposed model, experimental data [13] and
ADVISOR 2002, related to the UDDS driving cycle. They
confirm the effectiveness of the proposed model, with limited
errors, both in terms of fuel consumption and pollutant
emissions.
(See Table 1 after last section of paper)
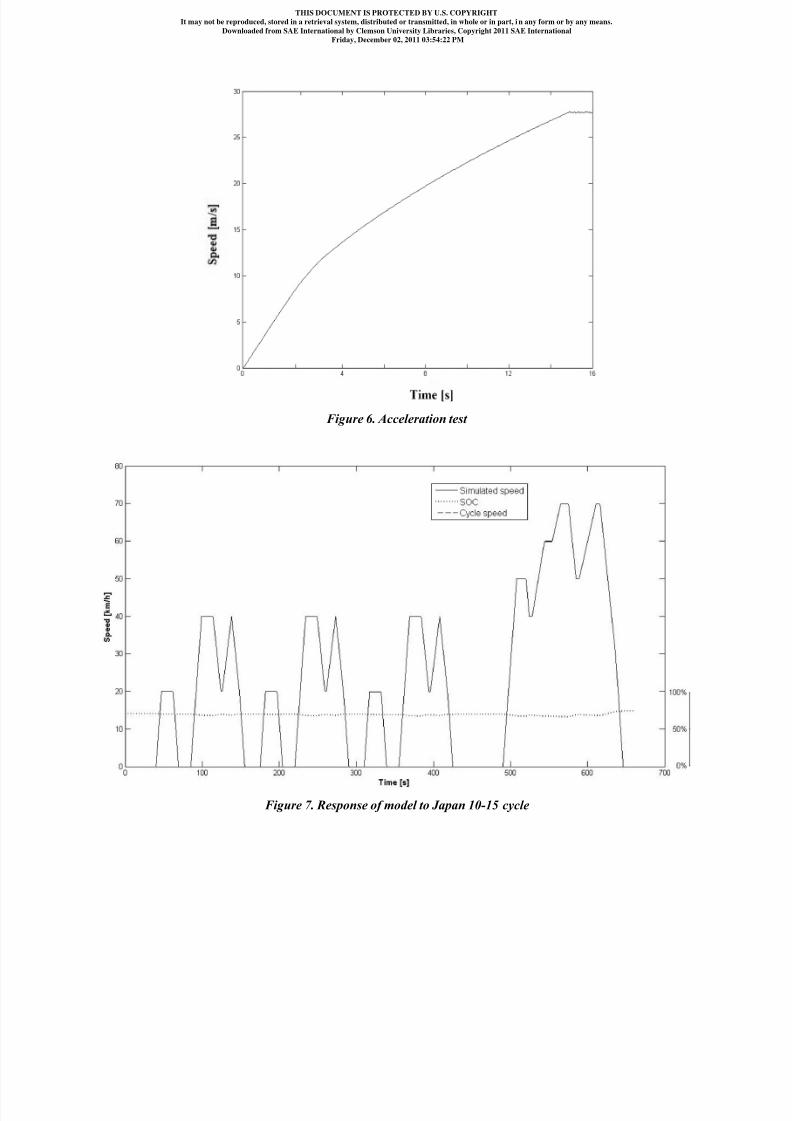
Being a dynamic model, the simulated vehicle's performance
can be assessed. Figure 6 shows the model's response to an
acceleration test using a driving cycle from 0 km/h to 100
km/h. Table 2 compares the simulation results with the
experimental data [14]. Since the experimental test refers to
an acceleration test from 0 to 60 mph, it also was used to
validate the numerical simulation.
(See Figure 6 after last section of paper)
Table 2. Performance Comparison
To verify the reliability of the proposed model versus
different imposed cycles, other simulations were performed
with different standard cycles. Figure 7 shows the response of
the model to Japanese 10-15 mode standard cycle, made up
of three urban cycles (Japanese 10 mode) and an extra-urban
one (Japanese 15 mode). Also in this case the model response
follows the imposed cycle perfectly in terms of speed, while
the SOC remains nearly constant from start to end.
THIS DOCUMENT IS PROTECTED BY U.S. COPYRIGHT
It may not be reproduced, stored in a retrieval system, distributed or transmitted, in whole or in part, i n any form or by any means.
Downloaded from SAE International by Clemson University Libraries, Copyright 2011 SAE International
Friday, December 02, 2011 03:54:22 PM
8/3/2019 Hybrid Vehicles Performances Analysis-Feed
http://slidepdf.com/reader/full/hybrid-vehicles-performances-analysis-feed 6/12
(See Figure 7 after last section of paper)
Table 3 shows a numerical comparison between the
experimental data [11], results from ADVISOR 2002
simulations, and results of proposed model simulation. It
seems clear how, even with other driving cycles than the one
used for setting the model, the model can accurately provide
the fuel consumption to complete the cycle.
(See Table 3 after last section of paper)
CONCLUSIONSIn this work, a feed-forward dynamic model of Toyota
Hybrid system has been developed. The characteristics of all
vehicle components were entered into the model, and a “rule-
based” control system was implemented to manage
interaction between vehicle components, making it easy to
predict the general behavior of a real vehicle. The model
performed simulations of the UDDS standard cycle and other
cycles to evaluate the model's response. The results confirmthat the model can simulate the actual vehicle accurately and
that the control strategy implemented closely follows that of
the first generation Toyota Prius. Compared to previous
model studies [15], this one can assess vehicle performance
as well as fuel consumption and pollutant emissions. This
represents a remarkable target to help popularise hybrid
motor vehicles in a market looking for ever better
performance and lower fuel consumption.
REFERENCES1. Chan C. C., “The state of the art of electric and hybrid
vehicles”, Proceedings of the IEEE , 90 (2), 247-275, 2002.2. Gao D. W., Mi C. and Emadi A., “Modeling and
Simulation of Electric and Hybrid Veicles”, Proceedings of
the IEEE , 95 (4), 729-745, 2007.
3. Markel T., Brooker A., Hendricks T., Johnson V., Kelly
K., Kramer B., O'Keefe M., Sprik S., and Wipke K.,
“ADVISOR: A systems analysis tool for advanced vehicle
modeling”, J. Power Sources, 110 (2), 255-266, 2002.
4. Fiorenza, S., Lanzafame, R., and Messina, M.,
“Development of a Quasi-Static Backward Code for the
Simulation of an Integrated Starter Alternator Vehicle,” SAE
Technical Paper 2007-01-4125, 2007.
5. Hwang H., Choi J., Lee W., Kim J., “A Tuning Algorithmfor The PID Controller Utilizing Fuzzy Theory”,
International Joint Conference on Neural Networks , 4,
2210-2215, 1999.
6. http://www-personal.engin.umd.umich.edu
7. Sasaki S., “Toyota's newly developed hybrid powertrain”,
Proceedings of the 10th International Symposium on Power
Semiconductor Devices and ICs, 1, pp. 17-22, 1998.
8. Liu J., Peng H., “Modeling and Control of a Power-Split
Hybrid Vehicle”, IEEE Transactions on Control Systems
Technology, 16 (6), 1242-1251, 2008.
9. Advisor 2002 program libraries files.
10. Muta, K., Yamazaki, M., and Tokieda, J., “Development
of New-Generation Hybrid System THS II - Drastic
Improvement of Power Performance and Fuel Economy,”
SAE Technical Paper 2004-01-0064, 2004.
11. Rousseau, A., Sharer, P., and Pasquier, M., “Validation
Process of a HEV System Analysis Model: PSAT,” SAETechnical Paper 2001-01-0953, 2001.
12. Kelly K. J., Mihalic M. and Zolot M., “Battery Usage
and Thermal Performance of the Toyota Prius and Honda
Insight During Chassis Dynamometer Testing”, The
Seventeenth Annual Battery Conference on Applications and
Advances, Long Beach, California, 2002.
13. Liu J., Peng H. and Filipi Z., “Modeling and Analysis of
the Toyota Hybrid System”, Proceedings of the 2005 IEEE/
ASME Advanced Intelligent Mechatronics Conference,
Monterrey, California, 2005.
14. Douba M., “Performance and Emissions of The Toyota
Prius”, Prius Data Exchange Workshop, USCAR, Ott. 1999.
15. Fiorenza, S., Lanzafame, R., and Messina, M., “Analysis
of Rules-Based Control Strategies for Integrated Starter
Alternator Vehicles,” SAE Technical Paper 2008-01-1314,
2008.
DEFINITIONS/ABBREVIATIONS
THSToyota Hybrid System;
ICEInternal combustion engine;
MG1Electrical Motor;
MG2Electrical Power generator;
PSDPower Split Device;
u(t)Accelerator/Brake control signal;
KpPropor tional gain;
Kiintegrative gain;
THIS DOCUMENT IS PROTECTED BY U.S. COPYRIGHT
It may not be reproduced, stored in a retrieval system, distributed or transmitted, in whole or in part, i n any form or by any means.
Downloaded from SAE International by Clemson University Libraries, Copyright 2011 SAE International
Friday, December 02, 2011 03:54:22 PM
8/3/2019 Hybrid Vehicles Performances Analysis-Feed
http://slidepdf.com/reader/full/hybrid-vehicles-performances-analysis-feed 7/12
e(t )error between imposed cycle speed and simulated
speed;
Kdderivative gain;
Ctorque [Nm];
angular pulsation;
α
propulsion system command signal;
J polar inertial moment [kg*m^2];
P power [W];
η
efficiency;
Hilower heating value [J/kg];
ṁcomb
fuel flow rate [kg/s];
mCO2
CO2 mass produced [kg];
mcomb
fuel mass used [kg];
mmC
carbon molar mass [g/mol];
mmO
oxygen molar mass [g/mol];
mmH
hydrogen molar mass [g/mol];
H_Chydrogen/carbon fuel ratio;
generator angular pulsation [s^(−1)];
internal combustion engine angular pulsation [s^(−1)];
electric motor angular pulsation [s^(−1)];
z ring
teeth number of ring gear;
z sun
teeth number of sun gear;
C MG 2
generator torque [Nm];
C ICE
internal combustion engine torque [Nm];
C MG 1
electrical motor torque [Nm];
C prop
tractor torque [Nm];
τ
gear ratio;
SOCstorage system state of charge;
SOC 0
initial state of charge;
SȮCtemporary variation of state of charge;
I batt
current in storage system [A];
THIS DOCUMENT IS PROTECTED BY U.S. COPYRIGHT
It may not be reproduced, stored in a retrieval system, distributed or transmitted, in whole or in part, i n any form or by any means.
Downloaded from SAE International by Clemson University Libraries, Copyright 2011 SAE International
Friday, December 02, 2011 03:54:22 PM
8/3/2019 Hybrid Vehicles Performances Analysis-Feed
http://slidepdf.com/reader/full/hybrid-vehicles-performances-analysis-feed 8/12
V batt
tension in storage system [V];
P batt
storage system power [W];
V oc
storage system idle tension [V];
F t
traction force [N];
C braking
braking torque [Nm];
C inertia
inertial torque [Nm];
Rwheel
wheel radius [m];
F p
gravitation force [N];
F r
rolling friction force [N];
F a
aerodynamic friction force [N];
mv
vehicle mass [kg];
vvehicle
vehicle speed [m/s]
v̇vehicle
vehicle acceleration [m/s^2];
UDDSUrban Dynamometer Driving Schedule.
THIS DOCUMENT IS PROTECTED BY U.S. COPYRIGHT
It may not be reproduced, stored in a retrieval system, distributed or transmitted, in whole or in part, i n any form or by any means.
Downloaded from SAE International by Clemson University Libraries, Copyright 2011 SAE International
Friday, December 02, 2011 03:54:22 PM
8/3/2019 Hybrid Vehicles Performances Analysis-Feed
http://slidepdf.com/reader/full/hybrid-vehicles-performances-analysis-feed 9/12
Figure 1. Toyota Prius THS dynamic model schematization
Figure 2. Maximum torque curve and ICE efficiency map
THIS DOCUMENT IS PROTECTED BY U.S. COPYRIGHT
It may not be reproduced, stored in a retrieval system, distributed or transmitted, in whole or in part, i n any form or by any means.
Downloaded from SAE International by Clemson University Libraries, Copyright 2011 SAE International
Friday, December 02, 2011 03:54:22 PM
8/3/2019 Hybrid Vehicles Performances Analysis-Feed
http://slidepdf.com/reader/full/hybrid-vehicles-performances-analysis-feed 10/12
Figure 4. Power storage internal resistance as charge varies
Figure 5. a) Model response to UDDS cycle; b) ICE torque; c) Electric Motor (MG1) torque
THIS DOCUMENT IS PROTECTED BY U.S. COPYRIGHT
It may not be reproduced, stored in a retrieval system, distributed or transmitted, in whole or in part, i n any form or by any means.
Downloaded from SAE International by Clemson University Libraries, Copyright 2011 SAE International
Friday, December 02, 2011 03:54:22 PM
8/3/2019 Hybrid Vehicles Performances Analysis-Feed
http://slidepdf.com/reader/full/hybrid-vehicles-performances-analysis-feed 11/12
Figure 6. Acceleration test
Figure 7. Response of model to Japan 10-15 cycle
THIS DOCUMENT IS PROTECTED BY U.S. COPYRIGHT
It may not be reproduced, stored in a retrieval system, distributed or transmitted, in whole or in part, i n any form or by any means.
Downloaded from SAE International by Clemson University Libraries, Copyright 2011 SAE International
Friday, December 02, 2011 03:54:22 PM
8/3/2019 Hybrid Vehicles Performances Analysis-Feed
http://slidepdf.com/reader/full/hybrid-vehicles-performances-analysis-feed 12/12
Table 1. UDDS cycle Consumption / Emission comparison
Table 3. Japan 10-15 Cycle consumption comparison
The Engineering Meetings Board has approved this paper for publication. It has
successfully completed SAE's peer review process under the supervision of the session
organizer. This process requires a minimum of three (3) reviews by industry experts.
All rights reserved. No part of this publication may be reproduced, stored in a
retrieval system, or transmitted, in any form or by any means, electronic, mechanical,
photocopying, recording, or otherwise, without the prior written permission of SAE.
ISSN 0148-7191
doi:10.4271/2010-01-1443
Positions and opinions advanced in this paper are those of the author(s) and not
necessarily those of SAE. The author is solely responsible for the content of the paper.
SAE Customer Service:Tel: 877-606-7323 (inside USA and Canada)
Tel: 724-776-4970 (outside USA)
Fax: 724-776-0790
Email: [email protected]
SAE Web Address: http://www.sae.org
Printed in USA
THIS DOCUMENT IS PROTECTED BY U.S. COPYRIGHT
It may not be reproduced, stored in a retrieval system, distributed or transmitted, in whole or in part, i n any form or by any means.
Downloaded from SAE International by Clemson University Libraries, Copyright 2011 SAE International
Friday, December 02, 2011 03:54:22 PM