Embed Size (px)
Citation preview

This document is downloaded from DR‑NTU (https://dr.ntu.edu.sg)Nanyang Technological University, Singapore.
Hybrid energy storage systems for power systemfrequency control
Zhou, Xiangyu
2018
Zhou, X. (2018). Hybrid energy storage systems for power system frequency control.Master's thesis, Nanyang Technological University, Singapore.
https://hdl.handle.net/10356/89097
https://doi.org/10.32657/10220/46112
Downloaded on 25 Feb 2022 13:17:02 SGT

HYBRID ENERGY STORAGE SYSTEMs FOR
POWER SYSTEM FREQUENCY CONTROL
ZHOU XIANGYU
2018
HE
SS
s FO
R P
OW
ER
SY
ST
EM
FR
EQ
UE
NC
Y C
ON
TR
OL
Z
HO
U X
IAN
GY
U
SCHOOL OF ELECTRICAL AND ELECTRONIC
ENGINEERING
HYBRID ENERGY STORAGE SYSTEMs FOR
POWER SYSTEM FREQUENCY CONTROL
ZHOU XIANGYU
School of Electrical and Electronic Engineering
A thesis submitted to the Nanyang Technological University
in partial fulfilment of the requirement for the degree of
Master of Engineering
2018

I
I
Acknowledgements First of all, I would like to express my sincere thanks and deepest gratitude to my
supervisor, Dr. Tang Yi, who had provided me with valuable guidance at every
stage of this thesis. I feel so impressed by his rigorous attitude for research, and
this influence will enlighten me not only in this project but also in my future.
I shall extend my sincere thanks to my senior, Dr. Wang Yu, a talented researcher,
for his kindness and help. Also, I would like to thank Mr. Fang Jingyang, who
has instructed me and helped me a lot in the past two years. I would also like to
thank all my teachers and seniors for their support and help.
Last but not least, I would like to thank my family and my friends, who would
always provide me their unconditional love and encouragement.
This research is supported by the National Research Foundation, Prime Minister's
Office, Singapore under the Energy Programme and administrated by the Energy
Market Authority (EP Award No. NRF2015EWT-EIRP002-007).
Zhou Xiangyu July 2018

II
II
Contents Acknowledgements .............................................................................................I
Contents ............................................................................................................. II
Summary ...........................................................................................................IV
Acronyms ........................................................................................................... V
List of Figures ...................................................................................................VI
List of Tables .................................................................................................VIII
CHAPTER 1 INTRODUCTION ...................................................................... 1
1.1 Research Background .......................................................................... 1
1.1.1 Literature Review............................................................................. 3
1.1.2 Energy Storage System .................................................................... 5
1.2 Motivations .......................................................................................... 9
1.3 Objectives .......................................................................................... 10
1.4 Major Contribution of the Thesis ....................................................... 11
1.5 Organization ....................................................................................... 12
CHAPTER 2 FUNDAMENTAL PRINCIPLE AND MATHEMATICAL
DESCRIPTION ............................................................................................ 14
2.1 Active Power and Frequency Control ...................................................... 14
2.2 Different Frequency Control Stages .................................................. 16
2.3 Frequency Control in an Isolated Power System ............................... 16
2.3.1 Main Parts of Frequency Regulation Model .................................. 16
2.3.2 Primary Frequency Control............................................................... 20
2.3.3 Basic Automatic Generation Control ................................................ 23
2.4 Traditional Load Frequency Control in the Multi-Area Interconnected
Power System................................................................................................. 24
2.4.1 The Tie-line Model ........................................................................ 26
2.4.2 Frequency Bias Control Factor ...................................................... 27
CHAPTER 3 INERTIAL RESPONSE AND PRIMARY FREQUENCY
CONTROL BY USING A HYBRID ENERGY STORAGE SYSTEM31
3.1 Interconnected Power System Model for Simulation ........................ 31
3.2 Grid Frequency Characteristics................................................................ 33
3.3 The Hybrid Energy Storage System .................................................. 35
3.3.1 Control Blocks of the Supercapacitor for Inertial Response ......... 37
3.3.2 Control Blocks of the Battery for Primary Frequency Response .. 38
3.3.3 Sizing of the Hybrid Energy Storage System ................................ 39
3.4 Simulation Results and Analysis ....................................................... 41
3.4.1 Power System Under Study ........................................................... 41
3.4.2 Case Study ..................................................................................... 41
A. Case 1 ..................................................................................... 41
B. Case 2 ..................................................................................... 43
C. Case 3 ..................................................................................... 44

III
III
CHAPTER 4 SECONDARY FREQUENCY CONTROL BY USING A
HYBRID ENERGY STORAGE SYSTEM ............................................... 46
4.1 Introduction of the Control Method ................................................... 46
4.1.1 Filtered ACE Method ..................................................................... 46
4.1.2 The Control Blocks of the Battery ................................................. 47
4.1.3 Battery Operation Regulation ........................................................ 48
4.2 Simulation Results and Analysis ....................................................... 50
4.2.1 Power System Under Study ........................................................... 50
4.2.2 Simulation Results ......................................................................... 51
4.2.2.1 Frequency Performance When With/Without the HESS ....... 51
4.2.2.2 Investigation on HESS Performance ..................................... 53
A. The Influence of Battery Size and Capacity .............................. 53
B. The Influence of Cut-Off Frequency ......................................... 57
C. The Influence of PI Controllers Tuning ..................................... 61
CHAPTER 5 CONCLUSION AND RECOMMENDATIONS FOR
FUTURE WORK ......................................................................................... 66
5.1 Conclusion ......................................................................................... 66
5.2 Recommendations for Future Work................................................... 67
5.2.1 Virtual Inertia ................................................................................. 67
5.2.2 Virtual Energy Storage System ...................................................... 68
Bibliography ..................................................................................................... 71
Author’s Publication ........................................................................................ 77

IV
IV
Summary In order to overcome the ever-challenging environmental issues caused by
greenhouse gas emission, conventional energy sources are gradually being
replaced by renewable energy sources. However, the increasing penetration of
renewable energy sources leads to the decrease of power system inertia, since
renewable sources barely contribute to the inertial response. To tackle this
problem, a hybrid energy storage system (HESS), which is composed of the
battery and the supercapacitor, is proposed in this project to enhance the system
frequency control performance.
Besides, a sizing method for the HESS under system contingencies is also
presented with the consideration of system cost and operation standards.
Furthermore, the battery used for improving secondary frequency control
performance in normal operation scenarios with the consideration of SoC
regulation is also investigated
The effectiveness of the proposed HESS control method is verified through
simulations for both contingencies and normal operation scenarios.

V
V
Acronyms
LFC
RES
Load Frequency Control
Renewable Energy Source
PV Photovoltaic
ESS Energy Storage System
BESS Battery Energy Storage System
HESS
RMS
AGC
VSS
Hybrid Energy Storage System
Root Mean Square
Automation Generation Control
Variable Structure Controller
PFR Primary Frequency Response
IR Inertial Response
SC Supercapacitor
RoCoF Rate of Change of Frequency
SoC State of Charge
ACE
ISE
VSGs
DR
VESS
LMI
ANN
GA
Area Control Area
Integral Squared Error
Virtual Synchronous Generators
Demand Response
Virtual Energy Storage System
Linear Matric Inequality
Artificial Neural Network
Genetic Algorithm

VI
VI
List of Figures Fig 1. 1 Growth in solar capacity led by falling price [1] .................................... 2
Fig 1. 2 Share of energy from RESs in the EU member states 2004-2016 [2] .... 2
Fig 1. 3 Block diagram of variable structure approach for LFC [25] .................. 4
Fig 1. 4 Operation principle of battery energy storage system [37] .................... 7
Fig 1. 5 Operation principle of supercapacitor energy storage system [37] ........ 8
Fig 2. 1 Equivalent diagram of the power system ............................................. 14
Fig 2. 2 Frequency control stages in UCTE [8] ................................................. 16
Fig 2. 3 Block structure with steady-state control loop [50].............................. 19
Fig 2. 4 Simplicity of block structure for generation control ............................ 20
Fig 2. 5 Basic diagram of droop control ............................................................ 20
Fig 2. 6 Typical Frequency response of droop control ...................................... 21
Fig 2. 7 System block diagram for load frequency control analysis .................. 22
Fig 2. 8 Simulation model of AGC control........................................................ 23
Fig 2. 9 Frequency response of AGC control .................................................... 24
Fig 2. 10 block diagram of LFC in multi-area power system [5] ...................... 25
Fig 2. 11 Power exchange between two terminals ............................................. 26
Fig 3. 1 Simulation model of the interconnected power system ........................ 32
Fig 3. 2 Values of J during the change of ACE1 and ACE2 ............................... 33
Fig 3. 3 Frequency responses and RoCoF of a single-area droop control model
under a 1% step-up load change (H = 2, 3, 4 and 5) .................................. 34
Fig 3. 4 Frequency responses of a single-area droop control model under a 1%
step-up load change (D=1, 2, 3 and 4) ....................................................... 35
Fig 3. 5 Power system structure ......................................................................... 36
Fig 3. 6 The supercapacitor used for IR ............................................................. 37
Fig 3. 7 BESS used for PFR............................................................................... 38
Fig 3. 8 Effective power droop characteristic of ESS ........................................ 38
Fig 3. 9 Dynamic response of Area 1 without/with SC and Area 2................... 42
Fig 3. 10 Frequency response of Area 1 with only the supercapacitor (SC) and
Area 1 with the HESS ................................................................................ 44
Fig 3. 11 Frequency response of tie-line bias control of Area 1 without/with
HESS .......................................................................................................... 45
Fig 4. 1 The framework of filtered ACE method............................................... 46
Fig 4. 2 The control block of BESS ................................................................... 47
Fig 4. 3 The control blocks for battery regulation ............................................. 49
Fig 4. 4 PV plus load variation file .................................................................... 51
Fig 4. 5 Comparison of dynamic performance when with/without HESS ........ 52
Fig 4. 6 SoC profile of the battery ..................................................................... 53
Fig 4. 7 The comparison of dynamic performance under different battery sizes
(SBattery = 50, 100 MW) .............................................................................. 54

VII
VII
Fig 4. 8 System dynamic performance under different battery capacity (CBattery
= 50, 75, 100, 125, 175 MWh)................................................................... 57
Fig 4. 9 Comparison of dynamic performance under different cut-off frequency
(t=3s, 30s) .................................................................................................. 59
Fig 4. 10 Comparison of dynamic performance under different cut-off
frequency (t=30s, 60s) ............................................................................... 61
Fig 4. 11 Comparison of the dynamic performance under different PI controller
gains (Kp = 1&Ki = 0.5, Kp = 10&Ki = 5) .................................................... 63
Fig 4. 12 Comparison of dynamic performance under different PI controller
settings (Kp = 10&Ki = 5, Kp = 50&Ki = 25)............................................... 65
Fig 5. 1 Basic control scheme of VSG and droop control [73].......................... 68
Fig 5. 2 Combination of flywheel energy storage system and refrigerators in a
VESS .......................................................................................................... 69

VIII
VIII
List of Tables Table 1. 1 Typical types of ESSs [35] ................................................................. 6
Table 4. 1 Controller tuning for the filtered ACE method ................................. 51
Table 4. 2 Dynamic performance under different battery size .......................... 55

CHAPTER 1 INTRODUCTION
1
CHAPTER 1 INTRODUCTION
In this chapter, the background information as well as the literature summary for this
research are discussed. Some limitations in the previous research works are listed in
the motivation part. Then it is followed by the objectives and major contributions of
this thesis. Lastly, the structure of this thesis is introduced in the organization part.
1.1 Research Background
The penetration level of renewable energy sources (RESs) keeps increasing in the
modern power system. Traditionally, fossil energy from fuel and coal is utilized for
electric power generation. However, fossil fuels may cause environmental pollutions
by emitting greenhouse gases. Besides, such sources are non-renewable and with a fast
consumption rate. Such severe issues emphasize the importance of replacing the fossil
energy with renewable energy sources (RESs), since RESs, such as wind energy,
hydrogen energy and solar energy are sustainable and have minimal impacts on the
environment. Solar energy is one of the most widely-used RESs in Singapore, which is
a tropical country with sufficient sunlight intensity. Over the past years, the installed
capacity of solar Photovoltaic (PV) has been increased dramatically while the cost of
installation decreases [1]. The capacity and cost of solar PV from 2009 to 2016 are
shown in Fig 1. 1. Furthermore, the penetration of RESs has been increased, as shown
in Fig 1. 2 [2]. According to a plan published in 2014, the penetration of solar PV in
Singapore will be increased to 5 percent in electricity peak demand by 2020 [3].
Nevertheless, the increasing penetration of RESs may introduce other problems for
power system operation. Above all, RESs have no contribution to system inertia. Inertia
is defined as the resistance of any physical object to any change in its position and state
of motion. Power system inertia can be regarded as its capability for maintaining the
original operation state when facing power variations.

CHAPTER 1 INTRODUCTION
2
For a power system with insufficient inertia, severe frequency deviations may occur as
a result of the imbalance between power generation and load demand. To maintain the
normal operation of a power system, the frequency deviation needs to be controlled
within a range, normally set as ±0.2 Hz [4]. Replacing traditional synchronous
generators with RESs will cause a decrease of the equivalent system inertia constant
[5], and hence degrade the system frequency response. Besides, the intermittency nature
of RESs can also introduce unpredictable power fluctuations. As a result, the power
system frequency response becomes even worse.
Fig 1. 1 Growth in solar capacity led by falling price [1]
Fig 1. 2 Share of energy from RESs in the EU member states 2004-2016 [2]

CHAPTER 1 INTRODUCTION
3
1.1.1 Literature Review
To properly regulate system frequency, especially to mitigate the aggravated
frequency variations with increased RESs penetration, several methods have been
proposed. The most commonly adopted method is called the load frequency control
(LFC), which can ensure power system frequency stability after load disturbances
The LFC issues have been studied by many researchers. The basic concepts of
frequency bias tie-line control are illustrated in [6]-[10], including the structure of
the model, controller design and system performance regarding to parameters
variation.
The increasing complexity of modern power system requires higher reliability and
stability. Several controllers using the advanced control methodologies such as
optimal control, adaptive control, self-tuning control, variable structure control and
robust control are proposed for LFC improvement. An example of using variable
structure control in a multi-area power system is shown in Fig 1. 3.
(a) Block diagram of area i
1
1 gisT
1
1 gisT
1 iR1 iR
if
iv
1
sControlleri1x iu
ciP
1
1
ri ri
ri
sT K
sT
1
1 tisT
2ix
eiX
6ix5ix
giP
di iP z
, 3tie i iP x
4ix
1
pi
pi
K
sT
1
s
jf
2 ijT
Nf
4jx
4Nx2 iNT

CHAPTER 1 INTRODUCTION
4
(b) Block diagram of variable structure controller
Fig 1. 3 Block diagram of variable structure approach for LFC [25]
The optimal control approach has provided a new method for solving the multi-
variable control problems by considering the state variable of the model as well as
the objective function to be minimized [11], [12]. On the other hand, as the change
of system operating point may influence the control performances, adaptive controls
[13], [14] and self-tuning controls [15], [16] are proposed to properly adjust the
control parameters for different system operating points.
In addition, in the traditional LFC method with PI controller, optimizing the
integrator gain through the conventional approach may cause relatively large
frequency overshoots and transient frequency deviations. A significant advantage
of the variable structure controller is the ability for changing the system structure
based on some law of structure change [17]-[19]. Such characteristic makes the
controller insensitive to system parameters changes.
Besides, the increasing scale of modern multi-area interconnected power systems
has brought robustness issues since the conventional simply-tuned controllers are
incapable of providing good dynamic performance over a wide range of regions and
the constantly changing load. A novel controller which can ensure the stability of
the overall systems is needed. In [20], the robust controller based on Riccati-
equation approach is proposed. Furthermore, µ-synthesis approach, H∞ control and
linear matric inequality (LMI) technique have also been reported in [21]-[24].
1ixiK
i
i
12
4jx
iu
i
1i ix

CHAPTER 1 INTRODUCTION
5
Additionally, the power system structure has become more complex due to the
integration of RESs, and the reshaping of the plant may be required in the robust
control schemes. Soft computing techniques, such as artificial neural network
(ANN), fuzzy logic and genetic algorithm (GA) have been utilized, since they are
more suitable for dealing with nonlinear conditions and uncertainty issues. Among
them, the ANN is a black box, which represents the non-linear relationship between
the input and output without the consideration of system structure. In [26], the
neural networks which can act as the control intelligence in conjunction with a
standard adaptive LFC scheme are studied. The application of ANN in automatic
generation control (AGC) is discussed in [27], [28]. Apart from this, the robustness
of fuzzy logic has also enriched its applications in multi-variable conditions [29]-
[31]. Alternatively, the GA is an innovative optimization technique based on the
natural selection and genetics with a randomly structured information exchange.
The exploration of the GA used in the field of LFC is also discussed in [32]-[34].
One disadvantage of the aforementioned methods is that the original system
structure may be changed with the implementation of different control schemes or
soft computing techniques. Besides, system parameters are required for the
controller design.
1.1.2 Energy Storage System
Recently, there has been a growing need for the application of energy storage system
(ESS). In general, ESS can be regarded as an energy buffer, which is able to store the
redundant energy when the power generation exceeds the load demand and release the
stored energy when needed. Furthermore, compared with traditional devices, ESS can
respond to fast power fluctuations since the time constant of ESS is relatively small,
and hence can be adopted for different control objectives. For instance, ESSs can
provide active power compensation to support peak-shaving and frequency regulation.
CHAPTER 1 INTRODUCTION
6
Besides, ESSs can be implemented in power systems without changing the original
main system structure.
Therefore, the application of ESSs is another practical option for LFC performance
improvement. Typical types of ESSs are listed in Table 1. 1 [35]. Since the
characteristics of different types of ESSs vary from each other [36], the selection of
ESS type depends on its application.
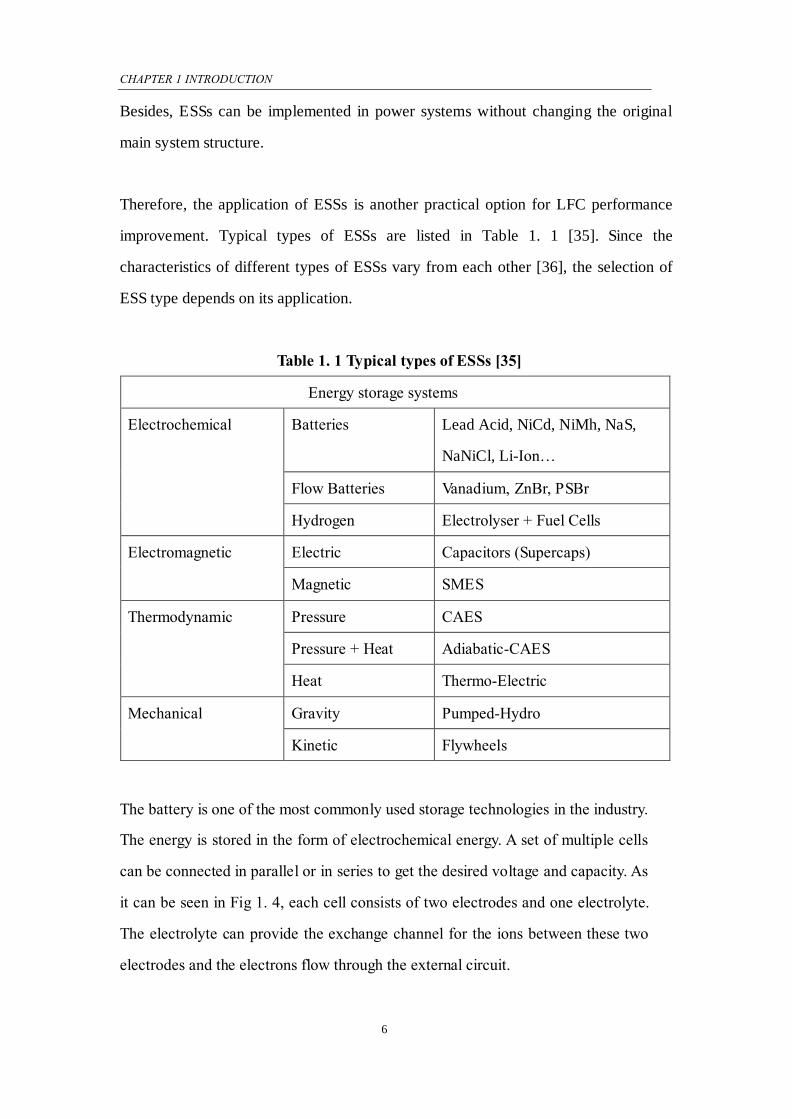
Table 1. 1 Typical types of ESSs [35]
Energy storage systems
Electrochemical Batteries Lead Acid, NiCd, NiMh, NaS,
NaNiCl, Li-Ion…
Flow Batteries Vanadium, ZnBr, PSBr
Hydrogen Electrolyser + Fuel Cells
Electromagnetic Electric Capacitors (Supercaps)
Magnetic SMES
Thermodynamic Pressure CAES
Pressure + Heat Adiabatic-CAES
Heat Thermo-Electric
Mechanical Gravity Pumped-Hydro
Kinetic Flywheels
The battery is one of the most commonly used storage technologies in the industry.
The energy is stored in the form of electrochemical energy. A set of multiple cells
can be connected in parallel or in series to get the desired voltage and capacity. As
it can be seen in Fig 1. 4, each cell consists of two electrodes and one electrolyte.
The electrolyte can provide the exchange channel for the ions between these two
electrodes and the electrons flow through the external circuit.
CHAPTER 1 INTRODUCTION
7
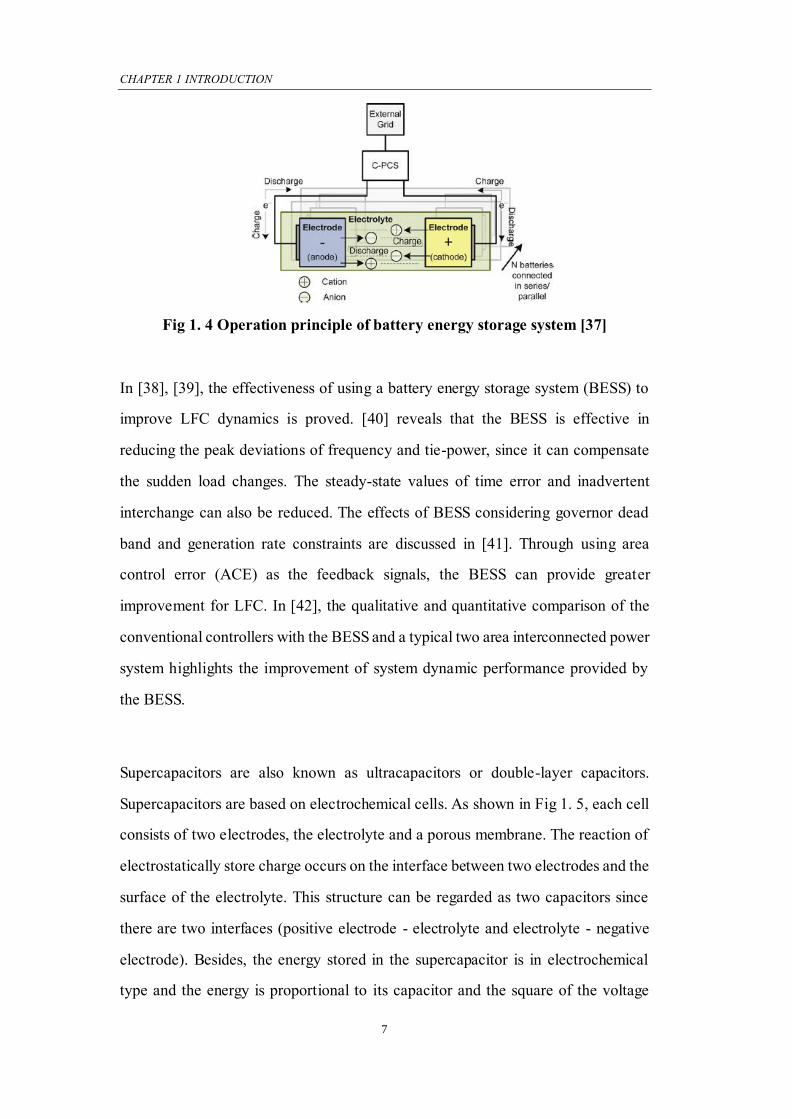
Fig 1. 4 Operation principle of battery energy storage system [37]
In [38], [39], the effectiveness of using a battery energy storage system (BESS) to
improve LFC dynamics is proved. [40] reveals that the BESS is effective in
reducing the peak deviations of frequency and tie-power, since it can compensate
the sudden load changes. The steady-state values of time error and inadvertent
interchange can also be reduced. The effects of BESS considering governor dead
band and generation rate constraints are discussed in [41]. Through using area
control error (ACE) as the feedback signals, the BESS can provide greater
improvement for LFC. In [42], the qualitative and quantitative comparison of the
conventional controllers with the BESS and a typical two area interconnected power
system highlights the improvement of system dynamic performance provided by
the BESS.
Supercapacitors are also known as ultracapacitors or double-layer capacitors.
Supercapacitors are based on electrochemical cells. As shown in Fig 1. 5, each cell
consists of two electrodes, the electrolyte and a porous membrane. The reaction of
electrostatically store charge occurs on the interface between two electrodes and the
surface of the electrolyte. This structure can be regarded as two capacitors since
there are two interfaces (positive electrode - electrolyte and electrolyte - negative
electrode). Besides, the energy stored in the supercapacitor is in electrochemical
type and the energy is proportional to its capacitor and the square of the voltage

CHAPTER 1 INTRODUCTION
8
between the terminals of the electrochemical cell. The cell voltage is low and the
desired voltage and capacity of the supercapacitor are achieved through the series
and parallel connection of several cells. The energy density of supercapacitors is
around 100 times higher than conventional capacitors [43].
Fig 1. 5 Operation principle of supercapacitor energy storage system [37]
In [46], the implementation of a fuzzy logic controlled supercapacitor bank for LFC
improvement in an interconnected power system is proposed. The simulation results
prove the effectiveness of this method. The supercapacitor combined with GA tuned
algorithm is proposed in [45] and a significant decrease in the frequency deviation
and the tie-line power deviation is observed.
In summary, the battery and supercapacitor energy storage system can be quite
effective for the system dynamic performance improvement. Normally, the
charging and discharging time of a supercapacitor is significantly small (less than 1
millionhm) as compared with the battery [6], and its power density is approximately
10 times higher than the battery [43]. But the supercapacitor has relatively small
energy density. Such features indicate that the supercapacitor is suitable for high-
density energy charging or discharging situations which last for a short period of
time. The most commonly used battery is the Li-ion battery, which is characterized
by a high energy density, about 170–300 Wh/l [46]. Considering such characteristic,

CHAPTER 1 INTRODUCTION
9
the battery is often used for the situations where the power exchange will be needed
for a long-time scale and the intensity is not quite high.
1.2 Motivations
Based on the deployment of frequency reserve figure in [4], inertial response (IR) is the
initial reaction to control frequency drop after a load disturbance. This is then followed
by primary frequency response (PFR), which will regulate system frequency to a
steady-state value. After that, secondary control and tertiary control will respond to
eliminate the steady-state frequency error and achieve economic dispatch, respectively.
Many impressive research works have been done to improve system dynamic
performance of LFC. One of them is to use the energy storage system (ESS), since ESS
can provide active power compensation for supporting frequency regulation. As one of
the most commonly used energy storage technologies, battery is often used in frequency
regulation area. However, compared with other energy storage devices, battery has a
relatively low power density. For the inertial response stage of frequency regulation,
relatively high power output will be needed in a short time. Besides, for the primary
frequency response and secondary frequency control stage, a relatively high energy
density will be needed. The single type of ESS may not be able to meet the power
system operation requirements due to the diverse characteristics of different control
stages.
Besides, the optimal sizing of ESS is crucial considering its high cost. Most sizing
strategies focus on the financial profits. The sizing method considering system dynamic
performance under contingencies also needs to be studied.
There have been some research works relating to the control schemes of the battery
[47], [48]. Since the battery has a relatively high energy density, the implementation of

CHAPTER 1 INTRODUCTION
10
the battery in secondary frequency control can also be investigated.
In the traditional automatic generation control (AGC) method, the generator takes the
responsibility for the frequency regulation. The battery, which can respond to fast
fluctuating signals, can be used to further improve the secondary control performance.
Apart from this, the former control schemes mainly consist of classical droop controller
or PID controllers. The State of Charge (SoC) of the battery cannot be regulated.
Therefore, additional control blocks need to be proposed based on the operation
limitations of the battery.
1.3 Objectives
This project aims at improving power system dynamic performance for both normal
and contingency scenarios through employing ESS. As ESS has the potential to mitigate
frequency deviations by compensating the power imbalance, the scope of this thesis is
mainly focusing on controlling ESS according to different types of input signals,
including short-term load contingencies and long-term PV plus load variations profile.
The main objectives of this thesis are listed below:
Firstly, as the modern power system is normally characterized by interconnecting
different subareas through tie lines, a multi-area frequency control model is more
practical and generalized as compared to the single-area model. Driven by such need, a
multi-area interconnected power system model is established in order to study the
enhancement of the LFC performance.
Based on the established model, the hybrid energy storage system (HESS) is designed
in this thesis to enhance the LFC performance by combining the advantages of the
battery and the supercapacitor. The supercapacitor with high power density is utilized

CHAPTER 1 INTRODUCTION
11
to improve the inertial response [39], while the battery energy storage system with high
energy density is sized and controlled to fulfill the requirement of the primary frequency
response. Furthermore, secondary frequency control is conventionally taken charge by
synchronous generators. The frequency performance can be significantly improved by
the ESS as compared with the generator considering the relatively small time-delay.
Therefore, the secondary frequency control based on the battery is also studied in this
thesis.
Additionally, under system contingencies, only the improvement of inertial response
and primary frequency control stage needs to be considered. An effective control
scheme for the HESS can be proposed. Besides, the sizing method of the HESS based
on power system operation standards also needs to be taken account.
Lastly, for the long-term simulations for normal operation scenarios, the contribution
of the HESS in secondary control improvement needs to be studied. Apart from a
practical control strategy of the HESS, the battery operation needs to be regulated
considering the limitations of battery SoC. The influence of several parameters on the
system dynamic performance can also be investigated.
1.4 Major Contribution of the Thesis
Main contributions of this thesis are listed as follows:
1) Instead of using a single type energy storage, a HESS with complementary
energy storage devices is employed. The HESS can combine the advantages
of different energy storage devices. The supercapacitor, which has high
energy density, is used to achieve inertial response improvement. The battery,
which has enough power density, is verified to be able to cover the
improvement in primary frequency response and secondary frequency control.

CHAPTER 1 INTRODUCTION
12
2) The HESS is employed in a multi-area interconnected model. The research
works based on the multi-area model are more practical and meaningful than
using a single area model.
3) Under short-term system contingencies: A practical control scheme is
proposed for the HESS. The effectiveness of HESS for inertial response and
primary frequency control performance improvement is verified through both
mathematical methods and simulation results. Besides, the determination of
HESS size considering the need for power system operation standards is also
introduced.
4) For the long-term power variations: Apart from the control methods
mentioned earlier, the battery is further used to improve the secondary
frequency control performance through a filtered ACE method. The battery
operation regulation considering SoC limitations is also achieved. Besides,
relatively long-term simulations are conducted to investigate the influence of
different parameters on system dynamics, including battery size and capacity,
the cut-off frequency of the high-pass filter and PI controller settings.
1.5 Organization
The thesis is organized as follows: chapter 1 introduces the background knowledge,
the state-of-art LFC improvement methods, and the hybrid energy storage system.
Besides, the motivations, objectives and main contributions of the thesis are
presented. Chapter 2 is the fundamental principle and mathematical description of
the basic LFC method. Chapter 3 focuses on the situation where the input signals
are system contingencies. It begins with the introduction of the simulation model as
well as the concepts of some grid frequency characteristics, followed by the
modeling, analysis, and sizing method of the HESS. The effectiveness is verified
through several case studies in simulation. Chapter 4 focuses on normal operation
scenarios. The HESS is further used for the performance improvement of secondary

CHAPTER 1 INTRODUCTION
13
control. The control scheme of the battery including the operation regulations is
introduced. The influence of different parameters on system dynamics, including
the battery size and capacity, the cut-off frequency of the filter and the PI controller
parameters tunings is also studied through simulations. Chapter 5 concludes the
thesis and provides some possible research recommendations for future work.

CHAPTER 2 FUNDAMENTAL PRINCIPLE AND MATHEMATICAL DESCRIPTION
14
CHAPTER 2 FUNDAMENTAL PRINCIPLE AND
MATHEMATICAL DESCRIPTION
In this chapter, the basic knowledge about frequency control, including the
relationship between active power and frequency control, different control stages
and the establishment of frequency control model is presented. The fundamental
principle of primary frequency control and automatic generation control in an
isolated power system is introduced. Then the application of traditional LFC
method in an interconnected power system model has been discussed.
2.1 Active Power and Frequency Control
Fig 2. 1 Equivalent diagram of the power system
An equivalent diagram of two different power system areas interconnected by a
transmission line is illustrated in Fig 2. 1. The impedance Z is predominately inductive,
so it is considered as purely inductive here. Thus, the complex power S̃R received at
the receiving point can be calculated as:
* *cos sinP [ ]S S R
R R R R R
E jE ES jQ E I E
jX
(2.1)
Thus, the following equations can be derived:
sinS RR
E EP
X
(2.2)
Iሚ S̃R=PR+jQR
SS෩ =PS+jQ
S
𝐸𝑆∠𝛿 𝐸𝑆 Z

CHAPTER 2 FUNDAMENTAL PRINCIPLE AND MATHEMATICAL DESCRIPTION
15
2cosS R RR
E E EQ
X
(2.3)
where Es and ER are the root-mean-square (RMS) voltage values at the sending point
and receiving point, respectively, while δ is the voltage angle difference between the
sending point and the receiving point. The transmitted active and reactive power can be
calculated as:
sinS RS
E EP
X
(2.4)
2 cosS S RS
E E EQ
X
(2.5)
From equations (2.2)-(2.5), the transferred active power can be controlled by adjusting
the angle difference δ, while the reactive power is determined by the voltage magnitude
difference.
2 fdt (2.6)
Additionally, as the angle difference ∆𝛿 is the integration of frequency Δf, the active
power can be controlled by adjusting the frequency.
Since the active power and reactive power will influence the frequency and voltage
respectively, the control problem of them can be considered separately. This project
focuses on the improvement of the frequency performance, thus only the active power
is considered in the regulation model.
CHAPTER 2 FUNDAMENTAL PRINCIPLE AND MATHEMATICAL DESCRIPTION
16
2.2 Different Frequency Control Stages
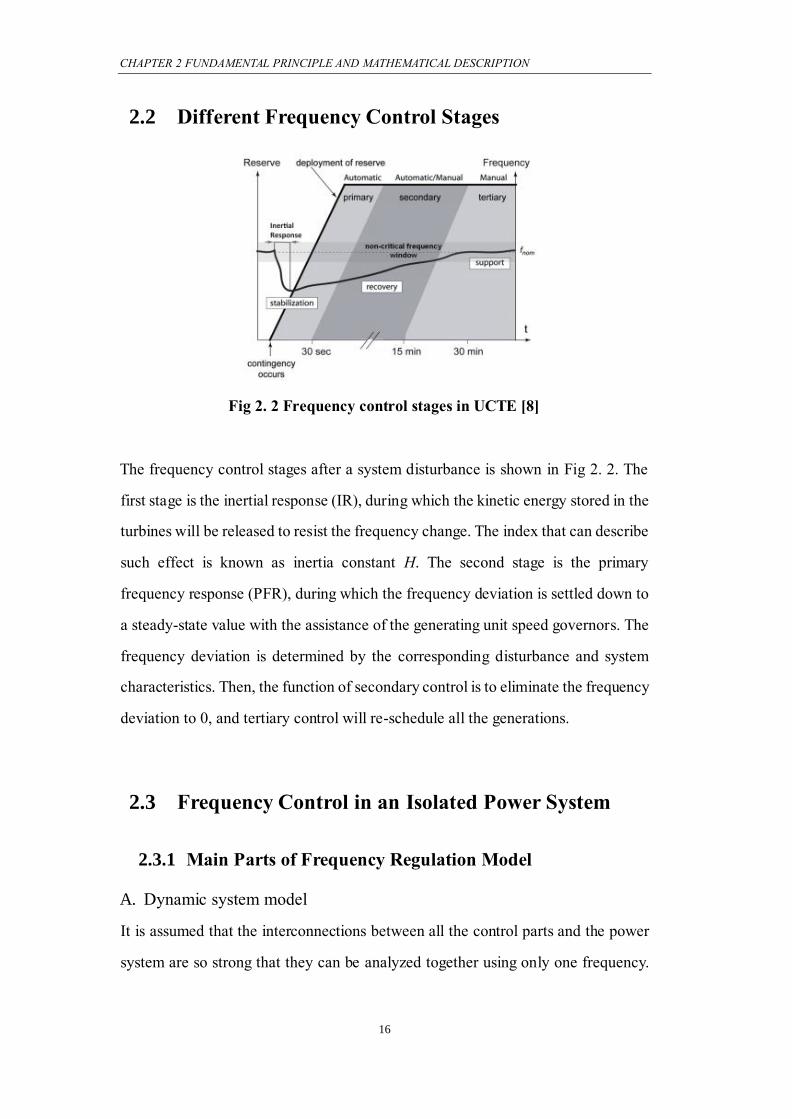
Fig 2. 2 Frequency control stages in UCTE [8]
The frequency control stages after a system disturbance is shown in Fig 2. 2. The
first stage is the inertial response (IR), during which the kinetic energy stored in the
turbines will be released to resist the frequency change. The index that can describe
such effect is known as inertia constant H. The second stage is the primary
frequency response (PFR), during which the frequency deviation is settled down to
a steady-state value with the assistance of the generating unit speed governors. The
frequency deviation is determined by the corresponding disturbance and system
characteristics. Then, the function of secondary control is to eliminate the frequency
deviation to 0, and tertiary control will re-schedule all the generations.
2.3 Frequency Control in an Isolated Power System
2.3.1 Main Parts of Frequency Regulation Model
A. Dynamic system model
It is assumed that the interconnections between all the control parts and the power
system are so strong that they can be analyzed together using only one frequency.

CHAPTER 2 FUNDAMENTAL PRINCIPLE AND MATHEMATICAL DESCRIPTION
17
Under this assumption, the instantaneous power disturbance can be expressed as the
difference of the power generation ΔPG and the load variation ΔPL.
As discussed in [49], such power imbalance will be mitigated through the following
ways:
1) By transferring the surplus power to kinetic energy Ek, which are stored in the
rotating mass of the system:
*
* 2 *
* * *[ ( ) ] [ (1 2 )] 2 ( )k
k k k
Ed d f d f dE E E f
dt dt f dt f f dt
(2.7)
2) By the frequency-dependent load consumptions:
All the load speed or frequency will get an increase D ≜ ∂PD/∂f MW/Hz, where D
is the load-damping constant.
3) By transferring the surplus power to an interconnected neighbouring system, and
ΔPtie represents the total power transferred out from this area.
From 1)-3), the following equation can be got:
*
*2 ( )k
G L tie
E dP P f D f P
f dt (2.8)
Then, (2.8) can be normalized with each side of the equation divided by the nominal
power Sb:
*2 ( )G L tie
H dP P f D f P
f dt (2.9)
where the inertia constant H is defined as H = E*
k /Sb.
Through Laplace transforms, equation (2.9) becomes:
1[ ( ) ( ) ( )] ( )
2G L tieP s P s P s F s
Hs D
(2.10)
Since M = 2H, (2.10) can be expressed as:
1[ ( ) ( ) ( )] ( )G L tieP s P s P s F s
Ms D
(2.11)

CHAPTER 2 FUNDAMENTAL PRINCIPLE AND MATHEMATICAL DESCRIPTION
18
So, the transfer function of the system can be defined by:
1( )G s
Ms D
(2.12)
In this project, the main focus is on the frequency regulation issue, and contributions of
all generators are aggregated. To avoid unnecessary complications, the inter-machine
effects and the transmission line influences are not considered in this project.
In (2.12), D represents the damping ratio of the whole power system. In addition, the
whole power system inertia Hsys is calculated as the weighted average value of each
generator’s inertia, i.e.:
1
1
n
i iisys n
ii
H SH
S
(2.13)
where Hi is the inertia constant of the generator i, and Si is the corresponding rated
power.
B. Reheat steam turbine model
Excessive moisture can erode the blades. The most important objective of using the
reheat turbine is to avoid excessive humidity in the steam at the end of expansion
process, thus protecting the turbine. In reheat turbines, after partial expansion, the steam
with higher pressure will be transported to the boiler to reheat at constant pressure, and
then it is fed back to the low pressure turbine for further use. The humidity of the steam
can be reduced through this approach. The efficiency can also be improved.
In this project, the reheat steam turbine is represented using the following transfer
function:
1( )
(1 )(1 )
HP RHT
CH HP
sF TG s
sT sF
(2.14)
where TRH is the time constant of reheater. TCH is the time constant of main inlet

CHAPTER 2 FUNDAMENTAL PRINCIPLE AND MATHEMATICAL DESCRIPTION
19
volumes and steam chest. FHP represents the proportion of the power generated by the
HP section (the first section steams meet after entering through the control valve and
the inlet piping) in the total power generated by the entire turbine.
C. Speed governor with droop control model
The synchronous generator normally consists of the valve/gate, the turbine, and the
controller. When there is a difference between the reference speed and the real speed,
an error signal will be generated and transported proportionally to the valve/gate. Then,
through adjusting the valve/gate position, the output power of the turbine will be
changed, until such error signal is eliminated. The system frequency can be adjusted
back to the setpoint. But the governors cannot be used when two or more generators are
connected. If the reference speeds of different generators are not set as the same value,
speed control conflicts will arise among all the generators. To deal with this issue, the
well-known droop control has been widely applied to adjust the rotation speed
according to the delivered power, and the control diagram is shown in Fig 2. 3 [50].
(a) Governor with steady-state feedback control
(b) The simplicity of block structure
Fig 2. 3 Block structure with steady-state control loop [50]

CHAPTER 2 FUNDAMENTAL PRINCIPLE AND MATHEMATICAL DESCRIPTION
20
Fig 2. 4 Simplicity of block structure for generation control
As mentioned in the previous part, the relationship between the generator speed and the
load can be changed by adjusting the output power of the generator. This can be
achieved through the method shown in Fig 2. 4, in which a load reference is given.
In practice, when there are two or more generators supplying power to the system
cooperatively, the output power change value of each generator is decided by the speed
droop coefficient, which is influenced by the load reference.
2.3.2 Primary Frequency Control
Fig 2. 5 Basic diagram of droop control
The basic model of primary frequency control, which is also known as droop control,
is shown in Fig 2. 5. The overall model consists of the dynamic system model, the
reheat steam turbine model and the speed governor with droop control.

CHAPTER 2 FUNDAMENTAL PRINCIPLE AND MATHEMATICAL DESCRIPTION
21
Fig 2. 6 Typical Frequency response of droop control
A typical frequency response of an isolated power system with only droop control is
shown in Fig 2. 6. Suppose that there is a disturbance due to the imbalanced power, the
system frequency will drop since a portion of rotating energy has been utilized to
compensate such power imbalance. Assuming that the system remains stable after such
disturbance, the rate of change of frequency (RoCoF, d(Δf )/dt) at t0 can be expressed
as the following [51]:
0 00 0 0 0
( ) ( )( ) ( ) ( )( )
2 2
pu pu
G L
keq eq eq
P t P td f P t P tt f f f
dt E H M
(2.15)
where PG(t0) is the power generation and PL(t0) is the load demand. Ekeq is the kinetic
energy stored in the rotating mass of the generator at the frequency setpoint f0.
The second stage of frequency regulation is the primary frequency control. All the
generators within one area will work cooperatively by adjusting the speed governor.
Such process can be described with the following equation:
0
1 ( )
b
P f t
S R f
(2.16)
where ∆P is the power change in this area. R is the permanent droop.
The frequency will drop to the nadir fmin after a certain amount of time. According to
[6], the frequency nadir can be influenced by many factors, such as the power variation,
system inertia, dynamic response characteristics of the generating units and loads, etc.
'
0( )f t 0f
f
ssf
minf
'
0( )f t 0f
f
ssf
minf
Fre
quen
cy
(Hz)
Time
(seconds)

CHAPTER 2 FUNDAMENTAL PRINCIPLE AND MATHEMATICAL DESCRIPTION
22
The system block used for frequency control analysis is shown in Fig 2. 7. ΔPmn
represents the nth generating unit.
1
eqM s D f
1mP
2mP
mnP
LP
...
Fig 2. 7 System block diagram for load frequency control analysis
Still, it is assumed that the system is stable after this disturbance, i.e., the primary
frequency control can cover the requirements of frequency regulation. In the steady
state, the frequency can be adjusted to a constant value f∞, which is determined by the
power imbalance and system characteristics.
1 2
1 1 1 1( )
n eq
P Pf
D DR R R R
(2.17)
1 2
1
1 1 1( )
eq
n
R
R R R
(2.18)
where Req represents the combined influence of the droop constants in the generating
units. D is the load-damping ratio, which can be regarded as the frequency characteristic
of all the loads.
In the real power system, the automatic generation control (AGC) or secondary
frequency control, which can eliminate the frequency deviation caused by PFR, is also
included for further regulation.

CHAPTER 2 FUNDAMENTAL PRINCIPLE AND MATHEMATICAL DESCRIPTION
23
2.3.3 Basic Automatic Generation Control
In AGC, a proportional integral (PI) controller is adopted to eliminate the frequency
error. When there is a frequency error, the proportional controller can provide an output
Pout in proportional with the original signal e(t) so that the response speed can be
improved. Such relationship is expressed using equation (2.19). It should be noted that
the proportional gain needs to be appropriately tuned. A large proportional gain may
lead to system instability, while a small proportional gain may degrade the dynamic
performance.
( )out pP K e t (2.19)
As long as the error is not 0, the integral controller will continue to work until such
error signal is eliminated. Equation (2.20) explains the input and output relationship of
the integral controller.
0( )
t
out iI K e d (2.20)
Normally, AGC control includes two parts, the first part is the primary frequency
control, which is provided by the speed governor of the turbine. The second part is the
integral controller, which is used to improve the dynamic response of the system and
eliminate the steady-state error. The simulation model of AGC control is shown in Fig
2. 8.
Fig 2. 8 Simulation model of AGC control

CHAPTER 2 FUNDAMENTAL PRINCIPLE AND MATHEMATICAL DESCRIPTION
24
Fig 2. 9 Frequency response of AGC control
In this power system, only part of the generating units can simultaneously provide
both droop control and secondary control, while the rests only have the function of
droop control. This model is more practical than the commonly used one, in which
all the generators can provide both droop control and supplementary control [52].
From the frequency response of AGC control, it can be seen that the steady-state
error is eliminated, and it is vital for system stability and operation.
2.4 Traditional Load Frequency Control in the Multi-Area
Interconnected Power System
For multi-area interconnected power systems, the most commonly used strategy for
load frequency control is tie-line bias control method. The block diagram of this
method is shown in Fig 2. 10 [5]. Tie-line bias control aims at limiting the frequency
deviation within an acceptable range and keeping tie-line power within a pre-
specified value. A well-designed LFC model can track power change or load
disturbance in the system. This control method can not only improve the stability
and dynamic response of the system but also improve the quality of electricity.

CHAPTER 2 FUNDAMENTAL PRINCIPLE AND MATHEMATICAL DESCRIPTION
25
Fig 2. 10 block diagram of LFC in multi-area power system [5]
In this multi-area system, LFC is achieved through both droop control and bias
control. Droop control is achieved through the speed governor of the generating
units. Bias control is proposed for the following two objectives of interconnected
power systems:
1) the frequency deviation should become 0 after this control process;
2) the power exchanged through the tie-line should be maintained as a constant
value;
The control signal of bias control, which is known as area control error (ACEi, i=1,
2…n), is calculated by:
,i i i tie iACE B f P (2.21)
where Bi is the bias factor of the corresponding area. ∆fi is the frequency deviation
and ∆Ptie,i is the power exchange through the tie-line.
Then the integral controller with a proportional gain Ki is used to eliminate this error
signal. From equation (2.21), it can be concluded that only when both Δfi and
ΔPtie,i are equal to 0, can ACEi become 0. From which, the two control objectives
mentioned earlier are achieved.

CHAPTER 2 FUNDAMENTAL PRINCIPLE AND MATHEMATICAL DESCRIPTION
26
Apart from this, the selection of Ki can improve the system dynamic response. The
choice of bias factor Bi can also influence system performance. It needs to serve the
purpose of limiting the influence of disturbances in its own area. For example,
assuming that a load disturbance occurs in area 1, if Bi is chosen inappropriately,
this disturbance will arise control actions in area 2, but the controllers in area 2 will
then react by trying to eliminate this change. These actions cause a degradation of
system control scheme.
2.4.1 The Tie-line Model
For multi-area power systems, different areas are connected through tie-lines. The
main difference between the one area model and the multi-area model is the
existence of power exchange among different areas.
Fig 2. 11 Power exchange between two terminals
From Fig 2. 11, based on the analysis in [53], the power flow between the
interconnected two areas is:
1 212 1 2sin( )
T
E EP
X (2.22)
where E1 and E2 are the terminal voltages. δ1 and δ2 are the voltage angles, and XT
is the reactance of the line.
XT E1∠δ1 E2∠δ
2
P12

CHAPTER 2 FUNDAMENTAL PRINCIPLE AND MATHEMATICAL DESCRIPTION
27
When the load disturbance occurs, the balance between generation and demand
cannot be maintained. As a result, a voltage phase angle difference Δδi (i=1, 2) will
be imposed on the original value δi0 (i=1, 2). The variation of the power exchange
value ΔP12 can be calculated by:
1 212 10 20 1 2cos( )( )
T
E EP
X (2.23)
The relationship between Δδi (i=1, 2) and Δfi (i=1, 2) is:
2i if dt (2.24)
After combining equation (2.23) and (2.24), the following equation can be got:
12 12 1 22 ( )P T f dt f dt (2.25)
in which,
1 212 10 20cos( )
T
E ET
X (2.26)
T12 represents the electric relationship between these two areas, which can be
decided by the power flow calculation. Power flow calculation is commonly used
for power system plan and optimization, which is normally prior to the simulation
procedures. However, the main objective of this project is to observe and improve
the frequency response performance of an interconnected power system model.
Thus, according to [7,54,55], an identical value T12 = 0.086 is used for simulation.
2.4.2 Frequency Bias Control Factor
When there is only droop control in this interconnected power system model, the
frequency deviation Δf after a load disturbance ΔPL1 shall satisfy the following
conditions [52]:
1 12 1
1
1( ) Lf D P PR
(2.27)
2 12
2
1( )f D PR
(2.28)

CHAPTER 2 FUNDAMENTAL PRINCIPLE AND MATHEMATICAL DESCRIPTION
28
Thus, the steady-state frequency deviation can be calculated as:
1 1
1 21 2
1 2
1 1( ) ( )
L LP Pf
D DR R
(2.29)
where β1 and β2 are also known as the composite frequency response characteristics.
The power exchange between these two areas is given by:
1 2
2 1 212
1 21 2
1 2
1( )
1 1( ) ( )
L
L
P DR P
P
D DR R
(2.30)
To eliminate the frequency deviation, tie-line bias control is employed. The control
signal is known as area control error (ACE). When a load disturbance occurs in area
1, the error signal of area 1 is:
1 12 1ACE P B f (2.31)
Similarly, for area 2,
2 12 2ACE P B f (2.32)
where B1 and B2 are the bias factors.
The value of ACE is quite important for the performance of secondary control. From
equations (2.29) and (2.30), the best value of the bias factor is the corresponding
frequency response characteristic β.
From [8], [9], [56]-[58], it can be concluded that the steady-state does not have
much impact on the selection of the bias factor, since the ACE signal can be adjusted
to 0 with the integral controller in supplementary control. From the following
equation:
1 1 12 1 0ACE A P B f (2.33)
With any A1≠0 and B1≠0, ΔP12 and Δf must be 0 to make this equation established.

CHAPTER 2 FUNDAMENTAL PRINCIPLE AND MATHEMATICAL DESCRIPTION
29
Suppose that a load disturbance occurs in area 1, a frequency deviation will occur
and mitigated by the droop control. After this, the secondary control which is
activated slower than the primary control begins to work to eliminate this deviation.
The dynamic performance of this stage is influenced by the values of the bias factors.
Several sets of the values for B1 and B2 are used to illustrate this problem.
It is assumed that all the other parameters and conditions are the same for these two
areas.
1) If the parameters are set as B1 = β1 and B2 = β2, the following equations can be got:
1 2 1 11 12 1 1
1 2 1 2
L LR L
P PACE P B f P
(2.35)
and
1 2 1 22 12 2
1 2 1 2
0L LR
P PACE P f
(2.36)
It is indicated that only the supplementary control in area 1 will respond to this
change, and this disturbance is unobservable for the corresponding control in area
2.
2) If the parameters are chosen B1 = 2β1, and B2 = β2, ACE1 and ACE2 become:
11 12 1 1 2 1
1 2 2
1( 2 ) (1 )L
R L
PACE P B f P
(2.37)
Similarly, for area 2:
12 12 2
2
LR
PACE P B f
(2.38)
From these equations, it can be observed that the supplementary control in these
two areas will respond and adjust the frequency difference twice as fast as the
adjusting speed in condition 1). However, the power undertaken by area 2 will arise
an error signal ACE2 and then the supplementary control will try to eliminate this
change, which means to eliminating this power output change. Involving such
redundant procedures in the control process is not reasonable.

CHAPTER 2 FUNDAMENTAL PRINCIPLE AND MATHEMATICAL DESCRIPTION
30
3) If B1, B2 are set smaller than β1 and β2, firstly, the response speed will be slower.
Besides, the primary control and supplementary control in area 2 will be activated.
Since the response speed is slower than the former conditions, the recovery time
taken by this procedure will be longer. In fact, such action is a degradation of the
frequency control process.
In addition to the previously explored conditions, if the values of the bias factors
are too large, the excessive control actions may even influence system stability. In
[5], an approach in which B = 0.5β is chosen has not been accepted yet. In [58], it
is illustrated that setting B = 0.5β is reasonable and logical.

CHAPTER 3 IR AND PFR BY USING A HYBRID ENERGY STORAGE SYSTEM
31
CHAPTER 3 INERTIAL RESPONSE AND
PRIMARY FREQUENCY CONTROL BY USING
A HYBRID ENERGY STORAGE SYSTEM
In this chapter, the utilization of hybrid energy storage system (HESS) for inertial
response (IR) and primary frequency response (PFR) improvement under system
contingencies is studied. First of all, the structure of the two-area interconnected
power system model used in this project is introduced. After that, some frequency
characteristics used for system dynamic performance description are presented.
Then, a practical control scheme is proposed for the HESS. Besides, the
determination of HESS sizes considering the requirement for power system
operation standards is introduced. The effectiveness of this control method and
sizing method is verified through both mathematical methods and simulation results.
3.1 Interconnected Power System Model for Simulation
The multi-area model is commonly used in the industry, since this structure can
adapt to various outside conditions. In such model, the location of each generating
unit is decided considering the distance to the main load demand, the cost impact,
etc. Different areas are connected through the tie-lines.
The simulation model of a two-area interconnected power system used in this
project is shown in Fig 3. 1. The main objective of this chapter is to investigate the
system frequency response after contingencies. Furthermore, implementing the
same contingency in these two areas respectively can also help to analyze the factors
which may influence the frequency performance. In this model, a step-up load
disturbance is used as the system contingency.

CHAPTER 3 IR AND PFR BY USING A HYBRID ENERGY STORAGE SYSTEM
32
Fig 3. 1 Simulation model of the interconnected power system
For the tie-line bias control, the output signal of the integral controller u(t) can be
calculated by:
( ) ( )i iu t K ACE t dt (3.1)
where Ki (i=1, 2) is the proportional gain of the integral controller and ACEi = BiΔfi
+ ΔP12 (i=1, 2)is the area control error. Bi is the bias factor.
It is obvious that the value of Ki will influence system dynamic performance. The
values of Ki (i=1, 2) can be optimized through the integral squared error (ISE)
method [59], which can be expressed by:
2 2
1 20
( )J ACE ACE dt
(3.2)
Since Δf1, Δf2 and ΔP12 are all included in J, minimizing J can be translated into a
smaller frequency deviation and a more stable power exchange, thus optimizing the

CHAPTER 3 IR AND PFR BY USING A HYBRID ENERGY STORAGE SYSTEM
33
system dynamic response. From Fig 3. 2, it can be seen that J has the lowest point,
which corresponds to the optimal values of K1 and K2.
22
12
AC
EA
CE
2
1ACE
22
ACE
Fig 3. 2 Values of J during the change of ACE1 and ACE2
3.2 Grid Frequency Characteristics
The system frequency response can be described using the following two identical
values: the frequency nadir (the lowest point of the frequency change) and rate of
change of frequency (RoCoF, df/dt). Besides, several more parameters can be
involved when discussing the frequency performance: the inertia constant H, the
droop coefficient Ri, the power/frequency characteristic λ and the load damping
ratio D.
Based on the analysis in [60], the inertia constant H of an isolated area is defined as
[12]:
21
2
k
B b
E JH
S S
(3.3)
where Ek is the kinetic energy stored in the rotor. ω is the rotational speed, and Sb is
the rated power of the whole system. Furthermore, for a power system with multi

CHAPTER 3 IR AND PFR BY USING A HYBRID ENERGY STORAGE SYSTEM
34
areas, the equivalent system inertia constant Hsys can be calculated through using
equation (2.13).
According to equation (2.15), the relationship between RoCoF and Hsys can be
expressed by:
0
2 sys G L b
b b
H P P Pdf
f dt S S
(3.4)
where ΔPb is the power deficit caused by the imbalance of power generation PG and
load demand PL.
As indicated by equation (3.4), the system dynamics is influenced by the inertia
coefficient H. To visualize this impact, the frequency and RoCoF curves changing
with different H values are shown in Fig 3. 3. It can be concluded from this figure
that a larger H can improve the frequency performance since a smaller frequency
deviation and RoCoF value are achieved.
(a) Frequency responses (b) RoCoF values
Fig 3. 3 Frequency responses and RoCoF of a single-area droop control model
under a 1% step-up load change (H = 2, 3, 4 and 5)
Apart from H, another important parameter which can also influence the system
frequency performance is the load damping ratio D, since the steady-state frequency
deviation ΔfSS can be calculated by: ΔfSS = -ΔPL/(1/R1+D1+1/R2+D2). The frequency
response curves with different D values are shown in Fig 3. 4. It is proved by this
Time (seconds) Time (seconds)
Fre
quen
cy (
Hz)
RoC
oF
(H
z/s)
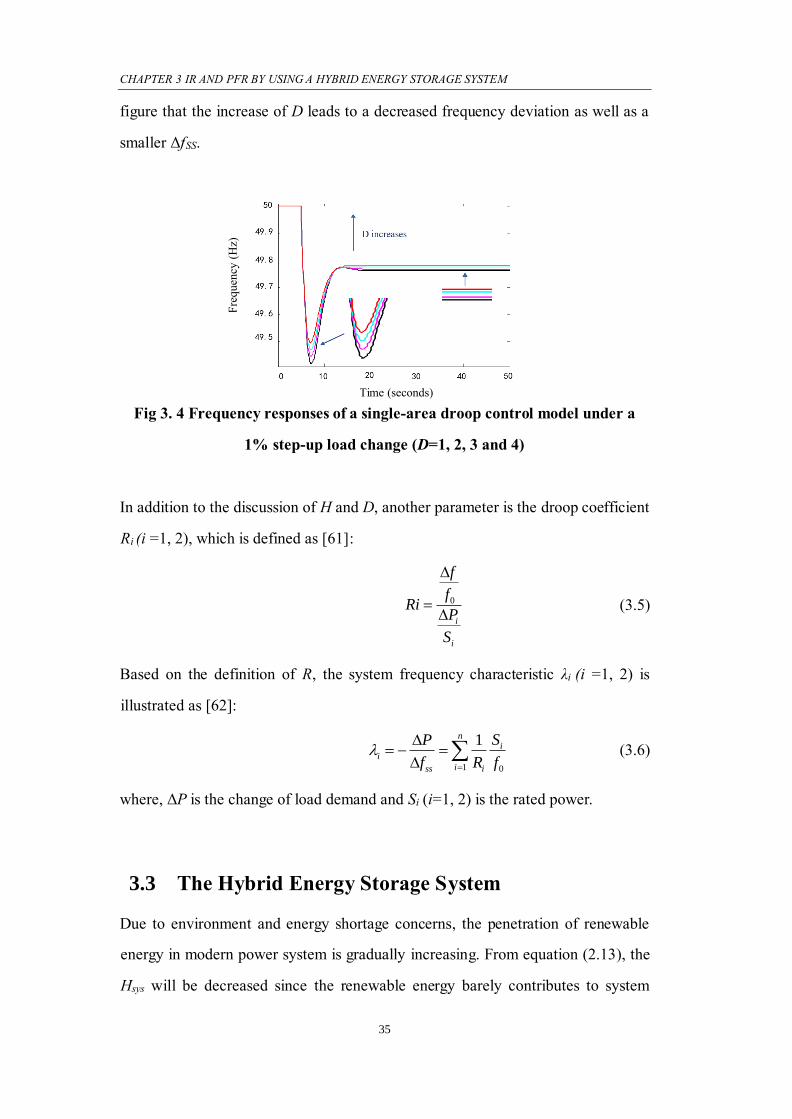
CHAPTER 3 IR AND PFR BY USING A HYBRID ENERGY STORAGE SYSTEM
35
figure that the increase of D leads to a decreased frequency deviation as well as a
smaller ΔfSS.
Fig 3. 4 Frequency responses of a single-area droop control model under a
1% step-up load change (D=1, 2, 3 and 4)
In addition to the discussion of H and D, another parameter is the droop coefficient
Ri (i =1, 2), which is defined as [61]:
0
i
i
f
fRi
P
S
(3.5)
Based on the definition of R, the system frequency characteristic λi (i =1, 2) is
illustrated as [62]:
1 0
1ni
i
iss i
SP
f R f
(3.6)
where, ΔP is the change of load demand and Si (i=1, 2) is the rated power.
3.3 The Hybrid Energy Storage System
Due to environment and energy shortage concerns, the penetration of renewable
energy in modern power system is gradually increasing. From equation (2.13), the
Hsys will be decreased since the renewable energy barely contributes to system
Time (seconds)
Fre
quen
cy (
Hz)

CHAPTER 3 IR AND PFR BY USING A HYBRID ENERGY STORAGE SYSTEM
36
inertia. Such decrease will weaken the system dynamic performance, and even
threaten the system stability when under extreme contingencies. Energy storage
system (ESS), which can be regarded as an energy buffer, can be used to solve this
problem. ESS is able to store the redundant energy when the power generation
exceeds the load demand and release the stored energy when needed.
Hybrid energy storage systems (HESSs) are drawing increasing research attention
recently since they can combine the advantages of different energy storage devices.
A HESS is often composed of two different types of energy storage devices. One of
them has high energy density while the other one has high power density [8]. As
discussed in the first chapter, the battery is one of the most popular energy storage
devices. But considering the requirement for fast response after load disturbances,
the battery alone might not be the best choice for frequency regulation due to its
low power density. Since the supercapacitor has high power density, it can be used
to achieve IR. Through proper selection of the battery size, the frequency deviations
which exceed the frequency limitations can be covered by PFR. Thus, in this project,
a HESS consisting of the battery and the supercapacitor is employed for LFC to
enhance system dynamics. After the implement of the HESS, the block diagram of
the power system becomes:
Fig 3. 5 Power system structure
LP
tieP
HESSP
GP 1
Ms Df
HESS
LP
tieP
HESSP
GP 1
Ms Df
HESS

CHAPTER 3 IR AND PFR BY USING A HYBRID ENERGY STORAGE SYSTEM
37
3.3.1 Control Blocks of the Supercapacitor for Inertial Response
The supercapacitor is a novel type of ESS, which has a considerably high power
density. The charging and discharging time constants of the supercapacitor can be
significantly small and the power density can be 10 times higher than batteries. Such
characteristics indicate that the supercapacitor is suitable for high-density energy
charging or discharging situations which last for a short period. The inertial
response (IR) is one of these situations. Based on [63], the model of using the
supercapacitor for IR is shown in Fig 3. 6.
/du dt1
0.05 1s bK/SCS Sb fSCP
Fig 3. 6 The supercapacitor used for IR
In IR, the maximum RoCoF cannot exceed 0.5 Hz/s. The main effective module in
the control block is the derivative element [64] and a first-order low-pass filter is
employed to remove noises caused by the derivative function. A small time-delay
is also provided by such filter so that the frequency control can be assisted by other
supporting units from a larger part of the power system [65]. Besides, a dead band
from -0.001 to 0.001 is included to eliminate the effect of small perturbations. Since
RoCoF should be within 0.5, Kb is chosen as 2 to guarantee a full-capacity power
output of the supercapacitor when RoCoF equals 0.5.
To analyze the effect of this derivative part, the system structure shown in Fig 3. 5
is used, and after the IR module is connected in parallel with the original power
system model, the transfer function of the power system G(s) = 1/Ms+D becomes:
1
1( )
( )1
Ms DG sKs M K s D
Ms D
(3.7)

CHAPTER 3 IR AND PFR BY USING A HYBRID ENERGY STORAGE SYSTEM
38
After implementing this module, the inertia constant M is changed. As discussed
previously, the system dynamic performance can be improved by the increase of M.
3.3.2 Control Blocks of the Battery for Primary Frequency
Response
The battery, which has a relatively high energy density, is one of the most popular
energy storage devices. Considering such characteristic, the battery is often used in
the situations where the power exchange will be needed for a long time-scale, but
the instantaneous energy demand is not quite high. PFR is one of these applications.
Based on the analysis in [66], the model of the battery used for PFR is shown in Fig
3. 7.
1
_ *f ref Rf
1
0.5 1s BatteryP /Battery bS S
Fig 3. 7 BESS used for PFR
Sat
ura
tio
n
Sat
ura
tion
0 50.1049.90
ES
S e
ffec
tiv
e p
ow
er (
p.u
.)
Frequency (Hz)
0
1
Fig 3. 8 Effective power droop characteristic of ESS

CHAPTER 3 IR AND PFR BY USING A HYBRID ENERGY STORAGE SYSTEM
39
In this model, R is the battery droop coefficient. The value of R is decided based on
the effective characteristic of the ESS droop (Fig 3. 8). It can be seen from this
figure that the value of R is influenced by the maximum frequency limitations. In
this project, the frequency deviation limits are chosen as ±0.1 Hz for PFR [67],
which means that when the frequency deviation equals 0.1 Hz, the whole capacity
of the battery needs to participate in the frequency regulation. To achieve such
purpose, it can be calculated through using equation (3.5) that R = (0.1/50)/(1/1) =
0.002.
The function of R can be illustrated through the mathematical method. After the
PFR model is connected in parallel with the power system model, the original
system transfer function G(s) = 1/Ms+D becomes:
1
1( )
1 1( )
1
Ms DG s
Ms DR R
Ms D
(3.8)
It can be observed that the value of the load damping ratio D is increased. From the
aforementioned discussion, the system dynamics can be enhanced by the increase
of D.
3.3.3 Sizing of the Hybrid Energy Storage System
To achieve the desired dynamic response under specific load disturbances, a sizing
method of the HESS is proposed mainly based on identifying the necessarily
required power scale for the battery and the supercapacitor.
From equation (3.4), the system inertia constant Hareai can be calculated by:
1
0
2
Lareai
sys
fP dfH
S dt
(3.9)

CHAPTER 3 IR AND PFR BY USING A HYBRID ENERGY STORAGE SYSTEM
40
It should be noted that the df/dt here is equal to the maximum value of RoCoF during
the whole dynamic process of the frequency change.
Similarly, the target value of the system inertia constant Htarget can be calculated and
the corresponding value of df/dt is 0.5 considering the objective of controlling the
maximum RoCoF within 0.5 Hz/s. Furthermore, the inertial contribution of the
supercapacitor HSC can be defined as:
1
0
2SC SC
fdfH p
dt
(3.10)
where pSC is the output of the supercapacitor.
Thus, the estimated capacity of the supercapacitor PSC can be obtained as [60]:
arg
arg
t et area
SC sys
SC t et
H HP S
H H
(3.11)
In addition, the size of the battery is decided based on the objective of PFR, which
is to adjust the steady-state frequency to 49.9 Hz. According to equation (3.6), the
target frequency characteristic λtarget can be calculated as:
argL
t et
ss
P
f
(3.12)
where ΔPL is the increase of load demand. Δf
’
SS is the target steady-state frequency
deviation 0.1 Hz.
Similarly, the frequency characteristic λareai of the power system can be got by:
Lareai
ss
P
f
(3.13)
where ΔfSS is the actual steady-state frequency deviation.

CHAPTER 3 IR AND PFR BY USING A HYBRID ENERGY STORAGE SYSTEM
41
Normally, λtarget is larger than λareai and the required capacity of the battery Pbattery
can be obtained as [60]:
0 arg( ) ( )battery Battery t et areaiP R f (3.14)
3.4 Simulation Results and Analysis
3.4.1 Power System Under Study
The proposed method can be utilized in the multi-area model shown in Fig 2. 10. In
this section, a two-area interconnected power system model is employed to verify
this strategy. The rated active power of the system is 1000 MW, and the total system
rating is 1125 MVA, based on the data in [60]. The inertia constant of Area 2 is 4,
while in Area 1, this value is only 3 due to the increased penetration of renewable
energy. Thus, the HESS is installed in Area 1 to improve the system dynamic
performance.
Assuming that at 5 seconds, a load demand increase of 65 MW occurs in Area 1,
which is then followed by another increase of 35 MW at 20 seconds in the same
area. Besides, to visualize the influence of the reduced inertia constant, the same
disturbance is also implemented in Area 2 in Case 1.
3.4.2 Case Study
A. Case 1
In this case, the function of the supercapacitor for IR improvement is discussed. Three
scenarios are compared: 1) Area 1 without supercapacitor; 2) Area 1 with
supercapacitor; 3) Area 2 under the same disturbances.
As previously discussed, RoCoF should be controlled within 0.5 Hz/s. From

CHAPTER 3 IR AND PFR BY USING A HYBRID ENERGY STORAGE SYSTEM
42
simulations, it is observed that the worst case of RoCoF occurs during the larger load
increase 65 MW, and the corresponding maximum value is 0.543 Hz/s. Using the values
of the load increase 65 MW, the nominal power 1125 MVA and equations (3.9)-(3.11),
it can be got that Harea1 is 2.66 s, Htarget is 2.889 s, and HSC is 21.2 s through the
simulation. Thus, the capacity of the supercapacitor PSC can be calculated by:
2.889 2.66
1125 14.0721.2 2.889
SCP
MW (3.15)
(a) Frequency response
(b) RoCoF
Fig 3. 9 Dynamic response of Area 1 without/with SC and Area 2
The dynamic performance of the system frequency and RoCoF are shown in Fig 3.
9. From Fig 3. 9 (a), the frequency nadir of Area 1 without HESS during the first
load disturbance is about 49.52 Hz. After implementing the supercapacitor, this
value is adjusted to 49.56 Hz. While in Area 2, this value is 49.66 Hz owning to a
higher inertia constant. During the later disturbance, the lowest point of the
frequency change in Area 1 without the HESS is about 49.63 Hz, and an
10 20 30 40 5049.5
49.6
49.7
49.8
49.9
50
Area 1 without SC
Area 1 with SC
Area 2
5 10 15 20 25 30 35 40-0.6
-0.4
-0.2
0
0.2
Area 1 without SC
Area 1 with SC
Area 2 -0.5
Time (seconds)
Fre
quen
cy (
Hz)
RoC
oF
(H
z/s)
Time (seconds)

CHAPTER 3 IR AND PFR BY USING A HYBRID ENERGY STORAGE SYSTEM
43
improvement of 0.02 Hz is provided by the supercapacitor, yet still lower than the
corresponding value of Area 2 which is 49.71 Hz. Besides, the frequency deviations
of Area 2 are the smallest during most time of the adjusting process, which can be
considered as that Area 2 is less affected by the same disturbances.
From Fig 3. 9 (b), the maximum absolute value of RoCoF which is 0.543 Hz/s occurs
when facing the former load increase of 65 MW, thus the required capacity of the
supercapacitor is calculated based on this value. After employing the supercapacitor,
the corresponding value can be adjusted to 0.5 Hz/s, while the maximum value of
RoCoF in Area 2 is only 0.4 Hz/s. Furthermore, the absolute value of RoCoF in Area 2
is the smallest during the changing process, followed by the value of Area 1 with the
supercapacitor, and the largest value occurs under the condition of Area 1 without the
supercapacitor.
Therefore, the influence of the decreased inertia constant is visualized. In addition, it
can be concluded that the supercapacitor can effectively enhance the dynamic
performance of IR.
B. Case 2
In this case, the function of the battery for PFR improvement is discussed. Two
scenarios are investigated: 1) Area 1 without the battery (with the supercapacitor only);
2) Area 1 with the HESS
The steady-state frequency deviation limit is set as ±0.1 Hz in this project. From
simulations, it can be noticed that the actual steady-state frequency is 49. 86 Hz after
the total load demand increase of 100 MW. After implementing these values in
equations (3.12)-(3.14), it can be obtained that λarea1 is 714.28 MW/Hz, λtarget is
1000MW/Hz. Thus, the capacity of the battery PBattery can be calculated by:
0.002 50 (1000 714.28) 28.58BatteryP MW (3.16)

CHAPTER 3 IR AND PFR BY USING A HYBRID ENERGY STORAGE SYSTEM
44
Fig 3. 10 Frequency response of Area 1 with only the supercapacitor (SC) and
Area 1 with the HESS
The frequency responses of Area 1 with only the SC and Area 1 with the HESS are
shown in Fig 3. 10. It is observed that the steady-state frequency can be adjusted to the
limit 49.9 Hz with the sized battery. Also, the dynamic performance during the adjusting
process is improved. The frequency nadir during the first load demand increase is
adjusted from 49.56 Hz to 49.72 Hz and another improvement of about 0.043 Hz can
be noticed during the later load increase. Therefore, the performance of PFR is
improved through using the battery.
C. Case 3
In this case, the dynamic response improvement contributed by the HESS for the system
with secondary control is discussed. Two scenarios are compared: 1) Area 1 without
the HESS; 2) Area 1 with the HESS. Through using the ISE method, it can be obtained
that the optimal value for K1 is -0.66, and for K2 is -0.01 in scenario 1. After the
employment of the HESS, the optimal values become -2.51 and -0.01 respectively.
20 40 60 80 100 120
49.6
49.7
49.8
49.9
50
Area 1 with only SC
Area 1 with HESS
Time(seconds)
Fre
quen
cy (
Hz)

CHAPTER 3 IR AND PFR BY USING A HYBRID ENERGY STORAGE SYSTEM
45
(a) Frequency response
(b) RoCoF
Fig 3. 11 Frequency response of tie-line bias control of Area 1 without/with
HESS
The frequency responses of Area 1 with/without the HESS are shown in Fig 3. 11. After
the implement of tie-line bias control method, the steady-state frequency is adjusted
to 50 Hz. Besides, it can be observed from Fig 3. 11 (a) that the lowest two extreme
values of frequency variations in Area 1 without the HESS are 49.55 Hz and 49.77 Hz.
With the employment of the HESS, these two values are increased to 49.75 Hz and
49.88 Hz respectively. Furthermore, under scenario 1, about 48 seconds are taken to
recover from the disturbances, while only 35 seconds are used under scenario 2.
Moreover, a remarkable decrease can be noticed for the frequency deviations during
the changing process. Additionally, from Fig 3. 11 (b), the maximum value of RoCoF
is reduced to the limit 0.5 Hz/s, and the stability of this system is also enhanced.
Therefore, the LFC for the system is significantly enhanced by the HESS.
10 20 30 40 50
49.6
49.8
50
50.2
Area 1 without HESS
Area 1 with HESS
10 20 30 40 50-0.6
-0.4
-0.2
0
0.2
0.4
Area 1 without HESS
Area 1 with HESS-0.5
Time (seconds)
Time (seconds)
Fre
quen
cy (
Hz)
R
oC
oF
(H
z/s)

CHAPTER 4 SECONDARY FREQUENCY CONTROL BY USING A HYBRID ENERGY STORAGE SYSTEM
46
CHAPTER 4 SECONDARY FREQUENCY
CONTROL BY USING A HYBRID ENERGY
STORAGE SYSTEM
In this chapter, the HESS used for secondary frequency control in normal operation
scenarios is studied. This chapter starts with the introduction of the secondary
frequency control scheme used in this project considering the battery SoC
regulation method. Simulations under normal operation scenarios are then
conducted to verify the feasibility of this strategy. In addition, several parameters
which may influence the HESS performance are investigated and the corresponding
impacts are visualized through simulation results.
4.1 Introduction of the Control Method
4.1.1 Filtered ACE Method
Fig 4. 1 The framework of filtered ACE method
In traditional frequency regulation methods, the responsibility of secondary control
is taken by the generators. Compared with the generator, the battery energy storage
system (BESS) can respond to fast fluctuating signals. Thus, in this project, the
BESS is used for secondary control improvement and the corresponding control
method is called the filtered ACE method [68]. The framework of this method is
shown in Fig 4. 1. Based on the balancing operation method of PJM [69], the ACE
signal can be divided into two parts and the high-frequency part can be extracted

CHAPTER 4 SECONDARY FREQUENCY CONTROL BY USING A HYBRID ENERGY STORAGE SYSTEM
47
through using a high-pass filter. Such signals are then sent to the BESS for further
regulation, while the remaining part will be sent to the generator for traditional
regulation.
4.1.2 The Control Blocks of the Battery
BatteryP
1
_ *f ref R
PoCPo High frequency_ACE/Battery bS S
PK
IK
s
Battery operation
regulation
1
2 1s
1
0.5 1s f
SoC
SoC PoC1
SoC regulation
Fig 4. 2 The control block of BESS
The control block of the BESS for frequency regulation is shown in Fig 4. 2. In this
method, the frequency deviation and the high-frequency part of the ACE signals are
used as the input. The primary frequency control has already been discussed in the
former chapter. The operation principle of the remained parts in this control block
is as follows:
When there is a frequency error, the ACE signal will be generated. The high-
frequency part of the ACE signal will then be extracted and sent into this control
block. After a small time-delay, the PI controller starts to work to eliminate this
input error signal. After that, the sum of the primary control power command, the
secondary control power request as well as the SoC regulation power command will
be sent to the battery operation regulation block as the input signal. Then, the
saturation module is employed to limit the total power output within the BESS
capacity. Afterwards, the power output of this control block PBattery will be combined
with the generator output to compensate for the power imbalance, thus to eliminate
the frequency error.

CHAPTER 4 SECONDARY FREQUENCY CONTROL BY USING A HYBRID ENERGY STORAGE SYSTEM
48
4.1.3 Battery Operation Regulation
The performance of the battery can be influenced by many factors and one of which
is the State of Charge (SoC) of the battery. The SoC, which represents the present
capacity of the battery compared to the maximum capacity, is an essential parameter
for the battery. For one thing, the SoC is an indicator of the battery’s remaining
capability for the contribution in future contingencies. For another, if the value of
SoC is too high or too low, detrimental damage might be caused to the battery [70].
The SoC of the battery can be calculated by:
0
1i BESS
BESS
SoC SoC P dtC
(4.1)
where SoCi=0 is the original value of SoC which is 50% in this research. CBESS is the
capacity of the battery. PBESS is the power output of the battery.
In order to maintain the safety operation of the battery, the SoC regulation method
is required to control the SoC within a desired range. The control block for SoC
regulation is shown in Fig 4. 3 (a), which can be expressed by [71]:
1= SoC Battery
SoC SoC_RefPoC K S
SoC_Ref
(4.2)
where PoC1 is the power command for SoC regulation. KSoC is the control gain of SoC
regulation. SoC_Ref is the reference for SoC which is 50%. SBattery is the capacity of the
battery. The SoC error is amplified by the control gain and leads to the adjustment of
the battery output. Since the SoC is the integration of battery power output, the SoC
can be regulated to SoC_Ref without steady-state error. The SoC regulation gain should
be determined with considerations of both cost and performance. In this project, the
value of KSoC is set as 1/(50-20).

CHAPTER 4 SECONDARY FREQUENCY CONTROL BY USING A HYBRID ENERGY STORAGE SYSTEM
49
(a) The control block for SoC regulation
upperCommand Power
PoC
lower
in out
-SBattery
SBattery
0
>20
>=80
0
100
*BatteryC s
Original SoC
State of Charge
SoC
Output Power
Po
(b) The control block for battery operation regulation and SoC
calculation
Fig 4. 3 The control blocks for battery regulation
Besides, the control block for battery operation regulation is shown in Fig 4. 3 (b).
The power command, which is the sum of the power requirements from the primary
control, the secondary control as well as SoC regulation, is used as the input signal.
Apart from the function of SoC calculation, the operation limitations considering
the values of the input signals can be provided by two switches at the left side of
this control block. The operation principle of this block is as follows:
When the SoC is equal to or smaller than 20%, the upper bound is set as 0, which
means that the battery cannot respond to the input signal until a negative value is
sent. The negative value represents the charging state of the battery, through which
the SoC can be increased. On the contrary, when the SoC is equal to or larger than
80, the lower bound is set as 0. Under this condition, the battery can only respond
to positive input signals, which correspond to the discharging state of the battery,
and thus the value of SoC can be decreased.

CHAPTER 4 SECONDARY FREQUENCY CONTROL BY USING A HYBRID ENERGY STORAGE SYSTEM
50
4.2 Simulation Results and Analysis
4.2.1 Power System Under Study
The control strategy proposed in this chapter can be utilized in multi-area models
as shown in Fig 2. 9. In this section, a two-area interconnected power system model
is employed to verify the feasibility. The nominal power of this system is 7000 MW.
The inertia constant of Area 2 is 4, while in Area 1, this value is only 3 due to the
increased penetration of renewable energy. Thus, the HESS is installed in Area 1 to
improve the dynamic performance.
Simulations based on normal operation scenarios are investigated in this chapter. In
simulations, the 24-hours PV plus load demand variation profile is used as the input
signal. Nevertheless, it should be noted that the time interval between each load
demand data is half an hour, but for PV, the corresponding interval is only one
second. Therefore, the fluctuations of the input power are mainly contributed by the
PV output change. Thus, in this section, the following analysis based on the
simulation results focuses on the system dynamic performance during the day when
the solar radiation changes are more significant, which is from 1.15×10⁵ s (about 8
a.m.) to 1.45×10⁵ s (about 4 p.m.).
1.15 1.2 1.25 1.3 1.35 1.4 1.45105
0.020.040.060.080.1
0.120.140.16
Time (seconds)
Inp
ut
pow
er
vari
atio
ns
(p.u
.)
(a) PV plus load demand variation profile

CHAPTER 4 SECONDARY FREQUENCY CONTROL BY USING A HYBRID ENERGY STORAGE SYSTEM
51
1.246 1.247 1.248 1.249 1.25 1.251 1.252 1.253 1.254 1.255105
0.020.040.060.080.10.120.140.16
Time (seconds)
Inp
ut
po
wer
vari
atio
ns
(p.u
.)
(b) Partial enlarged view of (a)
Fig 4. 4 PV plus load variation file
4.2.2 Simulation Results
4.2.2.1 Frequency Performance When With/Without the HESS
In chapter 3, the frequency performance under system contingencies is studied.
While in this section, the normal operation scenarios are investigated. Apart from
the system parameters introduced previously, in simulation, the sizes of the battery
and the supercapacitor are 100 MW and 20 MW respectively. The other control
parameters used in the simulation model are listed in Table 4. 1.
Table 4. 1 Controller tuning for the filtered ACE method
Controller tuning
Time constant of the high pass filter 30s
Low-frequency part High-frequency part
PI controller PI controller
KP 0.5 KI 0.5 KP 1 KI 0.5
Time constant
of delay
2s Time constant
of delay
2s

CHAPTER 4 SECONDARY FREQUENCY CONTROL BY USING A HYBRID ENERGY STORAGE SYSTEM
52
The simulation results for system dynamics when with/without the HESS are shown
in Fig 4. 5. From Fig 4. 5 (a) and (b), the frequency deviations are remarkably
decreased by the implementation of the HESS. For example, when without the
HESS, the maximum frequency deviation is 0.214 Hz. However, based on [4], this
value needs to be limited within ±0.2 Hz. After employing the HESS, this value is
successfully reduced to 0.146 Hz. Besides, the RoCoF is also decreased. The
maximum value of RoCoF is reduced from 0.1122 Hz/s to 0.0701 Hz/s. Therefore,
it can be concluded that the dynamic performance of this power system is
significantly improved. The stability of this system is also enhanced. Thus, the
effectiveness of this HESS control method is proved.
1.15 1.2 1.25 1.3 1.35 1.4 1.45105
49.849.8549.949.95
5050.0550.150.1550.2 Without HESS
With HESS
Time (seconds)
Fre
qu
ency
(H
z)
(a) Frequency performance when with/without HESS
1.254 1.2545 1.255 1.2555 1.256 1.2565 1.257 1.2575 1.258 10549.849.8549.9
49.9550
50.0550.150.15
50.2 Without HESSWith HESS
Time (seconds)
Fre
qu
ency
(H
z)
(b) Partial enlarged view of (a)
1.15 1.2 1.25 1.3 1.35 1.4 1.45105
-0.1
-0.05
0
0.05
0.1 Without HESSWith HESS
Time (seconds)
RoC
oF
(H
z/s)
(c) RoCoF when with/without the HESS
Fig 4. 5 Comparison of dynamic performance when with/without HESS

CHAPTER 4 SECONDARY FREQUENCY CONTROL BY USING A HYBRID ENERGY STORAGE SYSTEM
53
1.15 1.2 1.25 1.3 1.35 1.4 1.45105
49.449.6
49.850
50.2
50.450.6
Time (seconds)
So
C (
%)
Fig 4. 6 SoC profile of the battery
Besides, the SoC profile of the battery is shown in Fig 4. 6. It can be observed that
the battery SoC is limited between 49.4% and 50.6%. Thus, the effectiveness of the
SoC regulation method is verified.
4.2.2.2 Investigation on HESS Performance
The performance of the HESS is influenced by many factors, including the battery
size and capacity, the cut-off frequency of the high-pass filter and the parameter
tuning of the PI controller. In this section, a series of simulations are conducted to
investigate these effects.
A. The Influence of Battery Size and Capacity
One of the most important factors that influence system frequency performance is
the battery size. To visualize this impact, the frequency performance and RoCoF
under different battery sizes (SBattery = 50, 100 MW) are shown in Fig 4. 7. The size
of the supercapacitor is 20 MW in both situations.
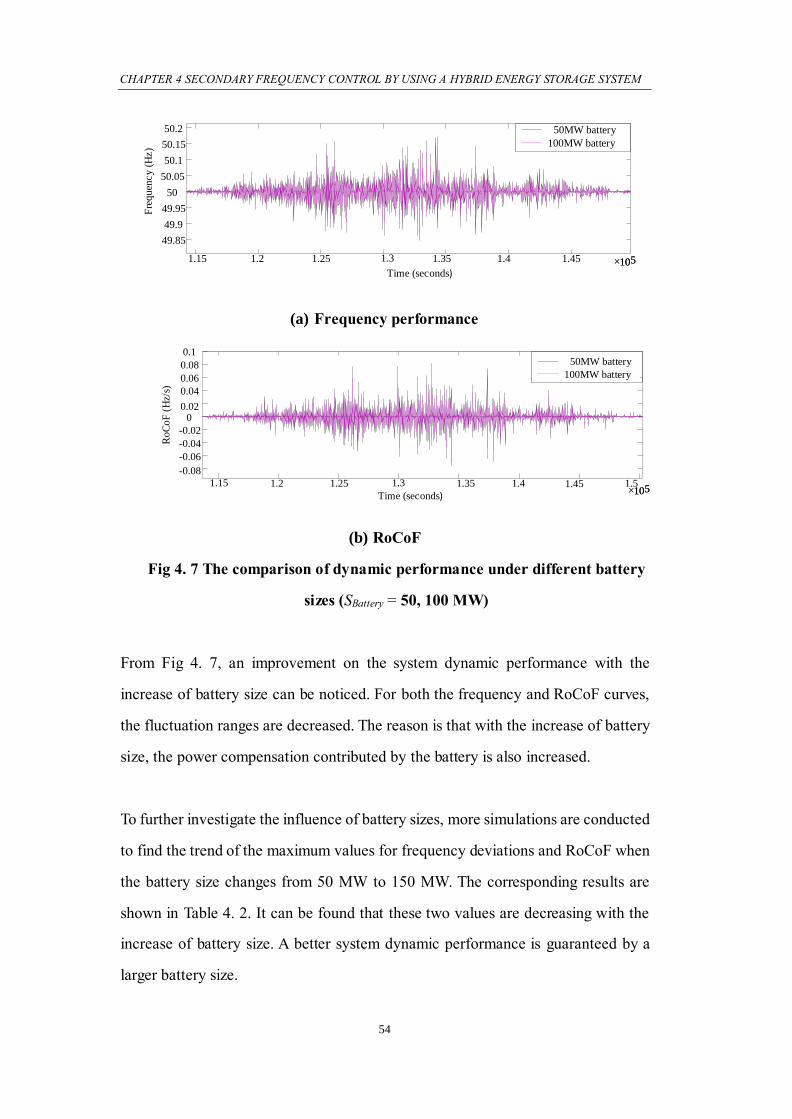
CHAPTER 4 SECONDARY FREQUENCY CONTROL BY USING A HYBRID ENERGY STORAGE SYSTEM
54
1.15 1.2 1.25 1.3 1.35 1.4 1.45
49.85
49.9
49.95
50
50.05
50.1
50.15
50.2 50MW battery
100MW battery
105105
Time (seconds)
Fre
qu
ency
(H
z)
(a) Frequency performance
1.15 1.2 1.25 1.3 1.35 1.4 1.45 1.5
-0.08
-0.06
-0.04
-0.02
00.02
0.04
0.06
0.08
0.1
105105
50MW battery
100MW battery
Time (seconds)
RoC
oF
(H
z/s)
(b) RoCoF
Fig 4. 7 The comparison of dynamic performance under different battery
sizes (SBattery = 50, 100 MW)
From Fig 4. 7, an improvement on the system dynamic performance with the
increase of battery size can be noticed. For both the frequency and RoCoF curves,
the fluctuation ranges are decreased. The reason is that with the increase of battery
size, the power compensation contributed by the battery is also increased.
To further investigate the influence of battery sizes, more simulations are conducted
to find the trend of the maximum values for frequency deviations and RoCoF when
the battery size changes from 50 MW to 150 MW. The corresponding results are
shown in Table 4. 2. It can be found that these two values are decreasing with the
increase of battery size. A better system dynamic performance is guaranteed by a
larger battery size.

CHAPTER 4 SECONDARY FREQUENCY CONTROL BY USING A HYBRID ENERGY STORAGE SYSTEM
55
Table 4. 2 Dynamic performance under different battery size
BESS size
(MW )
Maximum Frequency
deviation (Hz)
Maximum RoCoF (Hz/s)
50 0.172 0.0814
60 0.167 0.0778
70 0.163 0.0736
80 0.157 0.0725
90 0.152 0.0714
100 0.146 0.0701
110 0.139 0.0687
120 0.132 0.0671
130 0.125 0.0654
140 0.117 0.0632
150 0.109 0.0600
Apart from the battery size, the energy capacity of the battery may also influence
system dynamics. To account for the influence of battery capacities, the long-term
simulations of frequency regulation with a time-scale of several hours have been
conducted. For illustration, the curves of SoC, frequency, and RoCoF as functions
of battery capacities (CBattery = 50, 75, 100, 125, 175 MWh) are shown in Fig 4. 8.
Different capacities are indicated by the suffix of the corresponding legend. For
example, SoC_50 represents the curve for the battery SoC when the capacity is 50
MWh. It can be noticed from Fig 4. 8(c)-(f) that the differences among all the curves
are quite small. Specifically, the maximum differences of frequency deviation and
RoCoF are less than 1.5% and 0.6%, respectively. However, relatively significant
differences among SoC curves can be observed from Fig. 4. 8(a)-(b). The reason is
that the influence of battery capacities, which is often reflected by the values of SoC,
is compensated by the SoC regulation method adopted here. Since the SoC

CHAPTER 4 SECONDARY FREQUENCY CONTROL BY USING A HYBRID ENERGY STORAGE SYSTEM
56
regulation method is rapid and effective, the SoC limitations will never be reached
and the frequency regulation will not be influenced.
1.15 1.2 1.25 1.3 1.35 1.4 1.45 1.5105
48.849
49.249.449.649.8
5050.250.450.650.8 SoC_100
SoC_75SoC_50
SoC_125SoC_150
Time (seconds)
So
C (
%)
(a) SoC profile
1.185 1.186 1.187 1.188 1.189 1.19 1.191 1.192 1.193 1.194 1.195
105
49.549.649.749.849.950
50.150.2
SoC_100SoC_75SoC_50
SoC_125SoC_150
Time (seconds)
So
C (
%)
(b) Partial enlarged view of (a)
1.15 1.2 1.25 1.3 1.35 1.4 1.45 1.5105
49.85
49.9
49.95
50
50.05
50.1
50.15 f_100f_75f_50
f_125f_150
Time (seconds)
Fre
qu
en
cy (
Hz)
(c) Frequency performance
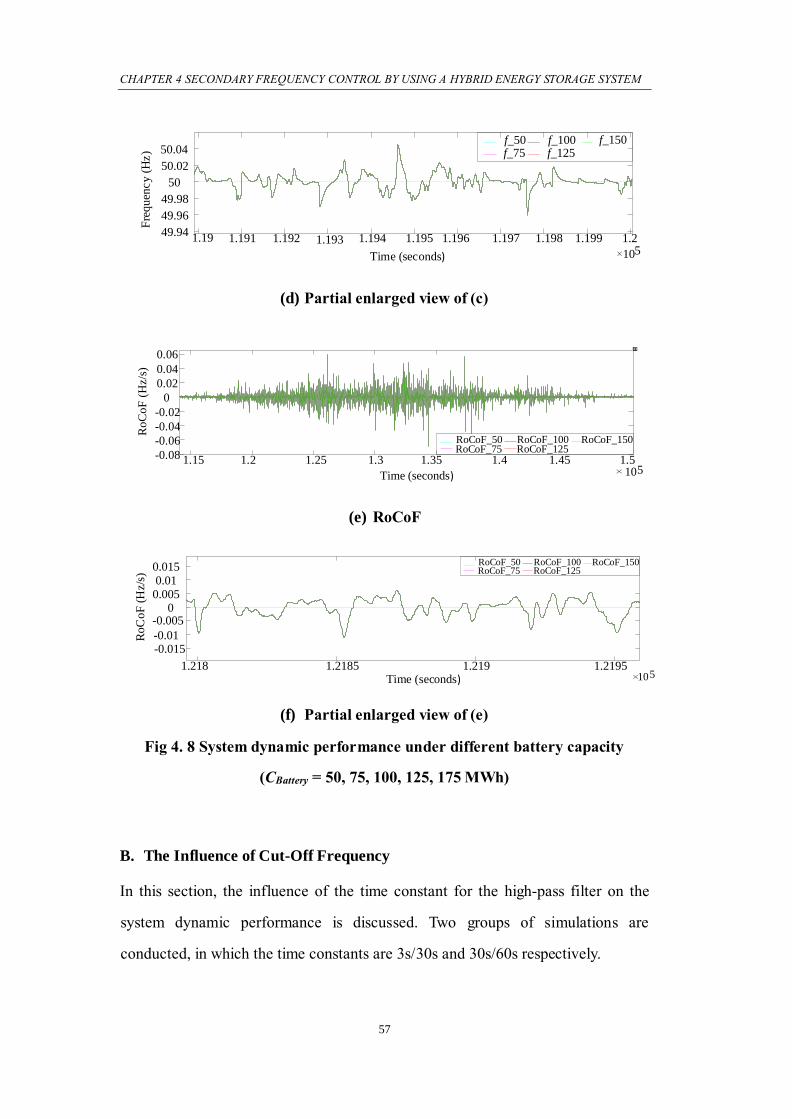
CHAPTER 4 SECONDARY FREQUENCY CONTROL BY USING A HYBRID ENERGY STORAGE SYSTEM
57
1.19 1.191 1.192 1.193 1.194 1.195 1.196 1.197 1.198 1.199 1.2
105
49.94
49.96
49.98
50
50.02
50.04f_100
f_75f_50
f_125f_150
Time (seconds)
Fre
qu
enc
y (
Hz
)
(d) Partial enlarged view of (c)
1.15 1.2 1.25 1.3 1.35 1.4 1.45 1.5105
-0.08
-0.06
-0.04
-0.02
0
0.02
0.04
0.06
RoCoF_100RoCoF_75RoCoF_50
RoCoF_125RoCoF_150
Time (seconds)
Ro
Co
F (
Hz/
s)
(e) RoCoF
1.218 1.2185 1.219 1.2195105
-0.015-0.01
-0.0050
0.0050.01
0.015 RoCoF_100RoCoF_75RoCoF_50
RoCoF_125RoCoF_150
Time (seconds)
RoC
oF
(H
z/s)
(f) Partial enlarged view of (e)
Fig 4. 8 System dynamic performance under different battery capacity
(CBattery = 50, 75, 100, 125, 175 MWh)
B. The Influence of Cut-Off Frequency
In this section, the influence of the time constant for the high-pass filter on the
system dynamic performance is discussed. Two groups of simulations are
conducted, in which the time constants are 3s/30s and 30s/60s respectively.

CHAPTER 4 SECONDARY FREQUENCY CONTROL BY USING A HYBRID ENERGY STORAGE SYSTEM
58
The cut-off frequency is inversely associated with the time constant of the high-pass
filter, which means that when the time constant increases, the cut-off frequency will
decrease. Thus, a higher proportion of the ACE signals will be assessed as the “high-
frequency” ones, as shown in Fig 4. 9 (e) and Fig 4. 10 (e). Therefore, the power
compensation contributed by the HESS for frequency control is also increased.
Owing to the fast response of ESS, a slight decrease of frequency deviations can be
seen in Fig 4. 9 (a)-(b) and Fig 4. 10 (a)-(b). Also, a slight improvement of RoCoF
can be observed. But some special cases where the dynamic performance is
weakened by the increased time constant can be noticed, as circled in the figures.
And this phenomenon becomes more serious when the time constant further
increases. The possible reason is that the battery is more sensitive to fast fluctuating
signals than the generators, thus when these signals are responded by the battery,
excessive power output may be caused.
1.15 1.2 1.25 1.3 1.35 1.4 1.45 1.5105
49.949.9249.9449.9649.98
5050.0250.0450.0650.0850.1 t=3s
t=30s
Time (seconds)
Fre
qu
enc
y (
Hz
)
(a) Frequency performance
1.2905 1.291 1.2915 1.292 1.2925105
49.9549.9649.9749.9849.99
5050.0150.0250.03
50.0450.05 t=3s
t=30s
Time (seconds)
Fre
qu
enc
y (
Hz
)
(b) Partial enlarged view of (a)

CHAPTER 4 SECONDARY FREQUENCY CONTROL BY USING A HYBRID ENERGY STORAGE SYSTEM
59
1.15 1.2 1.25 1.3 1.35 1.4 1.45105
-0.06
-0.04
-0.02
0
0.02
0.04t=3st=30s
Time (seconds)
Ro
Co
F (
Hz/
s)
(c) RoCoF
1.2826 1.2827 1.2828 1.2829 1.283 1.2831 1.2832 1.2833 1.2834 1.2835105
-0.01
-0.005
0
0.005
0.01
0.015
Time (seconds)
Ro
Co
F (
Hz/
s)
t=3st=30s
(d) Partial enlarged view of (c)
1.291 1.2915 1.292 1.2925 1.293 1.2935
-0.01
-0.005
0
0.005
0.01 t=3st=30s
105Time (seconds)
Hig
h F
req
uen
cy
AC
E
(e) Partial enlarged view of the filtered ACE signal
Fig 4. 9 Comparison of dynamic performance under different cut-off
frequency (t=3s, 30s)

CHAPTER 4 SECONDARY FREQUENCY CONTROL BY USING A HYBRID ENERGY STORAGE SYSTEM
60
1.15 1.2 1.25 1.3 1.35 1.4 1.45
49.9
49.95
50
50.05
50.1
50.15t=30st=60s
105Time (seconds)
Fre
qu
enc
y (
Hz
)
(a) Frequency performance
1.28 1.281 1.282 1.283 1.284 1.285 1.286
49.96
49.98
50
50.02
50.04
50.06t=30st=60s
105Time (seconds)
Fre
quen
cy (
Hz)
(b) Partial enlarged view of (a)
1.15 1.2 1.25 1.3 1.35 1.4 1.45 1.5
-0.06
-0.04
-0.02
0
0.02
0.04
105
t=30st=60s
Time (seconds)
RoC
oF
(H
z/s)
(c) RoCoF
1.18765 1.1877 1.18775 1.1878 1.18785 1.1879 1.18795 1.188
-6
-4
-2
0
2
4
6
105
10-3
t=30st=60s
Time (seconds)
RoC
oF
(H
z/s)
(d) Partial enlarged details view of (c)

CHAPTER 4 SECONDARY FREQUENCY CONTROL BY USING A HYBRID ENERGY STORAGE SYSTEM
61
1.352 1.3525 1.353 1.3535 1.354 1.3545 1.355-0.015
-0.01
-0.005
0
0.005
0.01 t=30st=60s
105Time (seconds)
Hig
h F
req
uen
cy
AC
E
(e) Partial enlarged view of filtered ACE signal
Fig 4. 10 Comparison of dynamic performance under different cut-off
frequency (t=30s, 60s)
C. The Influence of PI Controllers Tuning
In this part, the influence of PI controller tuning on system dynamic performance is
investigated. The system frequency dynamics when the parameters of the PI
controller used in the secondary control provided by the battery are Kp = 1&Ki = 0.5
or Kp = 10&Ki = 5 and Kp = 10&Ki = 5 or Kp = 50&Ki = 25 are compared through
simulations respectively.
The input signal is amplified by the P controller and integrated by the I controller.
Therefore, for the same input signals, the output of PI controller will be increased
by the increase of the P/I gain values. The power compensation provided by the
battery is thus increased. From Fig 4. 11 (a)-(b) and Fig 4. 12 (a)-(b), it can be seen
that the frequency deviations are decreased. Besides, from Fig 4.11 (c)-(d) and Fig
4.12 (c)-(d), the RoCoF is also decreased. Thus, it can be concluded that during
most of the time, the system frequency performance can be improved by a higher
value for the P/I gain. But some special cases where the system dynamics are
weakened by the increased controller gain values, as circled in the figures, can be
noticed. This phenomenon becomes more serious when the controller gains further
increase. The possible reason is that a larger power output can be provided by the
HESS with higher controller gains, as shown in Fig 4. 11 (e) and Fig 4. 12 (e), but

CHAPTER 4 SECONDARY FREQUENCY CONTROL BY USING A HYBRID ENERGY STORAGE SYSTEM
62
sometimes a relatively small output is already sufficient for the corresponding error
signal.
1.15 1.2 1.25 1.3 1.35 1.4 1.45 1.549.85
49.9
49.95
50
50.05
50.1
50.15
105
Kp=1,Ki=0.5
Kp=10,Ki=5
Time (seconds)
Fre
qu
enc
y (
Hz
)
(a) Frequency performance
1.276 1.2765 1.277 1.2775 1.278 1.2785 1.27949.94
49.96
49.98
50
50.02
50.04Kp=1,Ki=0.5
Kp=10,Ki=5
105Time (seconds)
Fre
qu
ency
(H
z)
(b) Partial enlarged view of (a)
1.15 1.2 1.25 1.3 1.35 1.4 1.45-0.08
-0.06
-0.04
-0.02
0
0.02
0.04
0.06
0.08
105
Kp=1,Ki=0.5
Kp=10,Ki=5
Time (seconds)
Ro
Co
F (
Hz/
s)
(c) RoCoF

CHAPTER 4 SECONDARY FREQUENCY CONTROL BY USING A HYBRID ENERGY STORAGE SYSTEM
63
1.2596 1.2597 1.2598 1.2599 1.26 1.2601 1.2602 1.2603 1.2604
-0.02
-0.015
-0.01
-0.005
0
0.005
0.01
0.015
0.02
0.025
105
Kp=1,Ki=0.5
Kp=10,Ki=5
Time (seconds)
Ro
Co
F (
Hz/
s)
(d) Partial enlarged veiw of (c)
1.232 1.2322 1.2324 1.2326 1.2328 1.233 1.2332 1.2334 1.2336 1.2338 1.234
-0.01-0.008-0.006-0.004-0.002
00.0020.0040.0060.0080.01 Kp=1,Ki=0.5
Kp=10,Ki=5
105Time (seconds)
HE
SS
po
wer
ou
tpu
t (p
.u.)
(e) Partial enlarged view of HESS power output
Fig 4. 11 Comparison of the dynamic performance under different PI
controller gains (Kp = 1&Ki = 0.5, Kp = 10&Ki = 5)
1.15 1.2 1.25 1.3 1.35 1.4 1.45
49.85
49.9
49.95
50
50.05
50.1
50.15
50.2
105
Kp=10,Ki=5Kp=50,Ki=25
Time (seconds)
Fre
qu
enc
y (
Hz
)
(a) Frequency performance

CHAPTER 4 SECONDARY FREQUENCY CONTROL BY USING A HYBRID ENERGY STORAGE SYSTEM
64
1.275 1.2755 1.276 1.2765 1.277 1.2775 1.278 1.2785 1.279 1.2795 1.28
49.94
49.96
49.98
50
50.02
50.04
50.06
50.08 Kp=10,Ki=5Kp=50,Ki=25
105Time (seconds)
Fre
qu
ency
(H
z)
(b) Partial enlarged view of (a)
1.15 1.2 1.25 1.3 1.35 1.4 1.45-0.1-0.08-0.06-0.04-0.02
00.020.040.060.080.1 Kp=10,Ki=5
Kp=50,Ki=25
105Time (seconds)
RoC
oF
(H
z/s)
(c) RoCoF
1.2774 1.2775 1.2776 1.2777 1.2778 1.2779 1.278-0.02
-0.015
-0.01
-0.005
0
0.005
0.01
0.015
1051.2774 1.2775 1.2776 1.2777 1.2778 1.2779 1.278
-0.02
-0.015
-0.01
-0.005
0
0.005
0.01
0.015
105
Kp=10,Ki=5
Kp=50,Ki=25
Time (seconds)
Ro
Co
F (
Hz/
s)
(d) Partial enlargede view of (c)

CHAPTER 4 SECONDARY FREQUENCY CONTROL BY USING A HYBRID ENERGY STORAGE SYSTEM
65
1.326 1.3265 1.327 1.3275 1.328 1.3285
-0.015
-0.01
-0.005
0
0.005
0.01
0.015 Kp=10,Ki=5
Kp=50,Ki=25
105105Time (seconds)
HE
SS
po
wer
ou
tpu
t (p
.u.)
(e) Partial enlarged view of HESS power output
Fig 4. 12 Comparison of dynamic performance under different PI
controller settings (Kp = 10&Ki = 5, Kp = 50&Ki = 25)

CHAPTER 5 CONCLUSION AND RECOMMENDATIONS FOR FUTURE WORK
66
CHAPTER 5 CONCLUSION AND
RECOMMENDATIONS FOR FUTURE WORK
5.1 Conclusion
This thesis investigates the issues introduced by decreased system inertia. Under
this condition, system dynamics when facing power variations will be weakened
and system stability is threatened. Considering different characteristics of the
supercapacitor and the battery, they were used together in a HESS to provide the
inertial response or primary frequency control and secondary frequency control,
respectively, to improve load frequency control performances and to meet the
corresponding operation standards.
First of all, under system contingencies, the function of the proposed HESS control
scheme used for inertial response and primary frequency control is analyzed
through mathematical methods developed in this thesis as well as the
implementation of the sizing method for the HESS. Simulation results visualize the
effect of the decreased inertia constant and it is demonstrated that the proposed
HESS method can improve LFC performances significantly.
After that, under normal power variation scenarios, the filtered ACE method is used
in the HESS for secondary frequency control performance improvement. The
battery operation regulation considering SoC limitations is also involved. Besides,
the influence of different parameters on the HESS performance, including the
battery size and capacity, the cut-off frequency of the filter and the PI controller
gains, is also investigated.

CHAPTER 5 CONCLUSION AND RECOMMENDATIONS FOR FUTURE WORK
67
From the aforementioned works, the proposed HESS method is verified to be quite
effective for the improvement of system frequency dynamics.
5.2 Recommendations for Future Work
Until now, the proposed HESS method was only implemented in a two-area
interconnected power system model. Different models can be studied for
verification purpose. Besides, a generalized model for energy storage devices is
used in this project. Specific details of particular types of energy storage technology
can be included in future work. In addition, the sizing method of the battery
proposed in this thesis only suits for system contingencies. The sizing method for
the battery under long-term power variations can also be researched. Several
recommendations for future work are listed in the following part.
5.2.1 Virtual Inertia
Using the virtual synchronous generators (VSGs), which aims at adjusting the
performance of grid-connected power converters to emulate synchronous
generators, is another well-known approach for frequency control [72]. After the
implementation of VSGs, the structure of modern power system becomes similar to
the traditional one. Based on which, the inertia performance of VSGs can be
designed to emulate the synchronous generators [73], [74]. It is also proved that the
VSG has a larger inertia than droop control, thus a better frequency performance
and system stability can be guaranteed [74]. Normally, the distributed generators
will be combined with the ESSs to provide virtual inertia. When without the ESSs,
the virtual inertia contributed by the VSGs will be decided by the DC-link energy
storage and the relationship of them has been discussed in [75].

CHAPTER 5 CONCLUSION AND RECOMMENDATIONS FOR FUTURE WORK
68
(a) VSG (b) Droop control
Fig 5. 1 Basic control scheme of VSG and droop control [73]
One special advantage of the VSGs is that the virtual inertia of it can be modified
dynamically according to the frequency regulation needs. The self-tuning control
method can be used to adjust the virtual inertia and the damping of VSGs, through
which, both the settling time and the ESS energy output can be reduced [76]. In [77],
a self-adaptive inertia and damping combination control (SAIDC) method is proved
to be effective for decreasing system frequency deviations.
It is proved that the VSGs can improve the performance of frequency regulation
significantly. Thus, future research can be conducted based on this approach. New
control algorithms can also be applied to VSGs to further improve the performance.
5.2.2 Virtual Energy Storage System
In this thesis, it is verified that the HESS is effective for LFC enhancement. But one
problem of this method is that the ESS is still quite expensive even after the cost
decrease in recent years. For example, the cost of 20 MW/20 MWh flywheel energy
storage systems (FESS) is about £25 million-£28 million [78]. Therefore, the large-
scale utilization of the ESS in the power system cannot be achieved in a short term.
Aggregated demand response (DR), which can adjust the power consumption of
loads, can be used to emulate the charging or discharging state of the ESSs.

CHAPTER 5 CONCLUSION AND RECOMMENDATIONS FOR FUTURE WORK
69
Furthermore, compared with the cost for the ESS, the cost of DR can be far smaller
[79]. Nevertheless, one disadvantage of DR is its uncertain response. Besides, the
reaction among different loads may not be simultaneous.
Therefore, the combination of the ESSs and DR, which can make up for the
uncertainty of DR response as well as reduce the cost of the ESSs, can be considered.
Fig 5. 2 Combination of flywheel energy storage system and refrigerators in a
VESS
Different types of the controllable parts in the power system can be included in the
virtual energy storage system (VESS), such as the ESSs, Microgrids, flexible loads,
distributed generators, local DC networks and multi-vector energy systems [80]. The
VESS can be used for power exchange with the power system based on the frequency
control needs. The refrigerators, which can provide DR [81], and the flywheel energy
storage system are combined as a VESS to improve frequency control in [80]. It is
proved that the VESS can provide low, high and continuous frequency response in a
similar way to the ESS. Besides, the economic benefits of this method are also verified.
Future research can be conducted based on the concept of VESS, since many control
schemes of the ESSs used in frequency regulation may also suit for the VESS. The

CHAPTER 5 CONCLUSION AND RECOMMENDATIONS FOR FUTURE WORK
70
possibility of combining the ESSs and other controllable components in the power
system can also be investigated.

71
Bibliography [1] Solar industry data, Solar Energy Industries Association. [Online]. Available:
http://www.seia.org/research-resources/solar-industry-data.
[2] Renewable energy statistics. [Online]. http://ec.europa.eu/eurostat/statistics-
explained/index.php/Renewable_energy_statistics
[3] Facilitating the Entry of Solar Energy into Singapore, Energy Market Authority.
[Online]. Available:https://www.ema.gov.sg/Solar_Photovoltaic_Systems.aspx.
[4] Operating Reserve Policy, Energy Market Authority. [Online]. Available:
https://www.ema.gov.sg/System_Planning.aspx.
[5] A. Oudalov, D. Chartouni and C. Ohler, “Optimizing a Battery Energy Storage
System for Primary Frequency Control”, IEEE Trans. Power Syst., vol. 22, pp.
1259-1266, Aug. 2007.
[6] UCTE, Operation Handbook 2004-2010. [Online]. Available: www. entsoe.eu.
[7] H.G. Kwatny et al., " An optimal tracking approach to load-frequency control,"
IEEE Trans. Power App. Syst., vol. 94, pp. 1635-1643, Sep. 1975.
[8] C. Concordia and L.K. Kirchmayer, "Tie line power and frequency control of
electric power systems - Part І," IEEE Trans. Power App. Syst., vol. 72, pp.562-
572, Jan. 1953.
[9] C. Concordia and L.K. Kirchmayer, "Tie line power and frequency control of
electric power systems - Part II," IEEE Trans. Power App. Syst., vol.73, pp.133-
146, Jan. 1954.
[10] N. Cohn, “Considerations in the regulation of interconnected areas”, IEEE
Transactions on Power Apparatus and Systems, vol. PAS-86, No. 12, pp. 1527-
1538, Dec. 1967.
[11] E. V. Bohn and S. M. Miniesy, “Optimum load-frequency sampled-data control
with randomly varying system disturbances”, IEEE Transactions on Power
Apparatus and Systems, vol. PAS-91, No. 5, pp. 1916-1923, Sep. 1972.
[12] A. Delavari and I. Kamwa, “Improved optimal decentralized load modulation
for power system primary frequency regulation”, IEEE Transactions on Power
Systems, vol. 33, No. 1, pp. 1013-1025, Jan. 2018.
[13] C. Mu et al. “Improved sliding mode design for load frequency control of power
system integrated an adaptive learning strategy”, IEEE Transactions on
Industrial Electronics, vol. 64, No. 8, pp. 6742-6751, Aug. 2017.
[14] S. Hanwate, “Adaptive policy for load frequency control”, IEEE Transactions
on Power Systems, vol. 33, No. 1, pp. 1142-1144, Jan. 2018.
[15] M. A. Sheirah and M. M. Abd-El-Fattah, “Improved load-frequency self-tuning
regulator”, International Journal of Control, vol. 39, No. 1, Jan. 1984.
[16] K. A. Lee et al. “Self-tuning algorithm for automatic generation control in an
interconnected power system”, Electric Power Systems Research, vol. 20, No. 2,
pp. 157-165, 1991.

72
[17] W. C. Chan and Y. Y. Hsu, “Automatic generation control of interconnected
power systems using variable-structure controllers,” IEEE P. C-Gener. Transm.
D., vol. 128, no. 5, pp. 269-279, 1981.
[18] U. Itkis, Control systems of variable structure. Halsted Press, 1976.
[19] Y. Mi et al. “Decentralized sliding mode load frequency control for multi-area
power systems”, IEEE Transactions on Power Systems, vol. 28, No. 4, pp. 4301-
4309, Nov. 2013.
[20] Y. Wang et al. “Robust load-frequency controller design for power systems”,
IEEE Proceedings C - Generation, Transmission and Distribution, vol. 140, No.
1, Jan. 1993.
[21] Z. Wang and M. Sznaier, “Robust control design for load frequency control
using µ-synthesis”, Conference Record Southcon, Mar. 1994.
[22] D. Rerkpreedapong and A. Feliachi, “Decentralized load frequency control using
LMI control toolbox”, Proceedings of the 2003 International Symposium on
Circuits and Systems, May 2003.
[23] H. Bevrani et al. “Robust frequency in an islanded microgrid: and μ-synthesis
approaches”, IEEE Transactions on Smart Grid, vol. 7, No. 2, Mar. 2016.
[24] P. Ojaghi and M. Rahmani, “LMI-based robust predictive load frequency control
for power systems with communication delays”, IEEE Transactions on Power
Systems, vol. 32, No. 5, Sep. 2017.
[25] W. C. Chan and Y. Y. Hsu, “Automatic generation control of interconnected
power systems using variable-structure controllers,” IEEE P. C-Gener. Transm.
D., vol. 128, no. 5, pp. 269-279, 1981.
[26] A.P. Birch et al. “An enhanced neural network load frequency control technique”,
1994 International Conference on Control, Mae. 1994.
[27] S. Nag and N. Philip, “Application of neural networks to automatic load
frequency control”, Proceedings of the 2014 International Conference on
Control, Instrumentation, Energy and Communication, Feb. 2014
[28] D. Chen and L. Wang, “Adaptive automatic generation control based on gain
scheduling and neural networks”, 2017 IEEE Power & Energy Society General
Meeting, Jul. 2017.
[29] H. A. Yousef et al. “Load frequency control of a multi-area power system: an
adaptive fuzzy logic approach,” IEEE Transactions on Power Systems, vol. 29,
No. 4, pp. 1822-1830, Jul. 2004.
[30] I. Kocaarslan, G. Akalin and T. Erfidan, “Application of fuzzy reasoning to load-
frequency control in two area power system,” 1999 European Control
Conference (ECC), pp. 27-31, Sep. 1999.
[31] H. A. Yousef, “Load Frequency Control of a Multi-Area Power System: An
Adaptive Fuzzy Logic Approach”, IEEE Transactions on Power Systems, vol.
29, No. 4, pp. 1822-1830, Jul. 2014.
[32] S. K. Aditya and D. Das, “Design of Load Frequency Controllers Using Genetic
Algorithm for Two Area Interconnected Hydro Power System”, Electric Power
Components & Systems, vol. 31, No. 1, Jan. 2003.

73
[33] P. Li et al. “Genetic algorithm optimization for AGC of multi-area power
systems”, 2002 IEEE Region 10 Conference on Computers, Communications,
Control and Power Engineering, Oct. 2002.
[34] F. Daneshfar and H. Bevrani, “Load-frequency control: a GA-based multi-agent
reinforcement learning”, Iet Generation Transmission & Distribution, vol. 4, No.
1, pp. 13-26, Jan. 2010.
[35] [Online]. Available: https://www.quora.com/What-are-different-types-of-
energy-storage-systems-and-what-is-its-role-in-Smart-Grid.
[36] H. Ibrahim et al. "Energy storage systems—characteristics and
comparisons." Renewable and sustainable energy reviews, vol. 12, pp. 1221-
1250, Jun. 2008.
[37] F. Díaz-González et al., “A review of energy storage technologies for wind
power applications,” Renewable and Sustainable Energy Reviews, vol. 16, pp.
2154-2171, May. 2012.
[38] D. Kottick et al. “Battery energy storage for frequency regulation in an island
power system,” IEEE Trans. Energy Convers., vol. 8, pp. 455-459, Sep. 1993.
[39] I. Serban and C. Marinescu, “Control strategy of three-phase battery energy
storage systems for frequency support in microgrids and with uninterrupted
supply of Local loads,” IEEE Trans. Power. Electr., vol. 29, pp. 5010-5020, Sep.
2014.
[40] S. K. Aditya and D. Das, “Battery energy storage for load frequency control of
an interconnected power system”, Electric Power Systems Research 2001, vol.
58, No. 3, pp.179-185, 2001.
[41] C. Lu et al. “Effect of battery energy storage system on load frequency control
considering governor deadband and generation rate constraint”, IEEE
Transactions on Energy Conversion, vol. 10, No. 3, pp. 555-561, Sep. 1995.
[42] S. Kalyani et al. “Load frequency control using battery energy storage system in
interconnected power system”, 2012 Third International Conference on
Computing, Communication and Networking Technologies, Jul. 2012.
[43] M-u-d. Mufti et al. “Super-capacitor based energy storage system for improved
load frequency control”, Electric Power Systems Research, vol. 79, No. 1, pp.
226-233, Jan. 2009.
[44] E. Çam and I. Kocaarslan, “Load frequency control in two area power systems
using fuzzy logic controller,” Energy Conversion and Management, vol.46, pp.
233-243, Jan. 2005.
[45] S. Z. N. Dar and M-u-d. Mufti, “Load frequency control in a two-area power
system with supercapacitor energy storage system”, 2017 International
Conference on Intelligent Computing, Instrumentation and Control
Technologies, Jul. 2017.
[46] M. Wakihara, “Recent developments in lithium-ion batteries,” Materials Science
and Engineering: R: Reports, vol. 33, pp. 109-134, Jan. 2001.
[47] Zhang, Shengqi, Yateendra Mishra, and Gerard Ledwich. "Battery energy
storage systems to improve power system frequency response." Power
Engineering Conference (AUPEC), 2014 Australasian Universities. IEEE, 2014.

74
[48] Y. Cheng et al. "Dynamic available AGC based approach for enhancing utility
scale energy storage performance." IEEE Transactions on Smart Grid, vol. 5,
No. 2, pp. 1070-1078, Mar. 2014
[49] A. Oudalov, D. Chartouni and C. Ohler, “Optimizing a Battery Energy Storage
System for Primary Frequency Control”, IEEE Trans. Power Syst., vol. 22, pp.
1259-1266, Aug. 2007.
[50] P. Kundur et al., Power Systems Stability and Control. New York, NY, USA:
McGraw-Hill Education, 1994.
[51] G. Delille et al., "Dynamic frequency control support by energy storage to reduce
the impact of wind and solar generation on isolated power system's inertia,"
IEEE Trans. Sustain. Energy, vol. 3, No. 4, pp. 931-939, Oct. 2012.
[52] O. I. Elgerd et al., "Optimum megawatt-frequency control of multiarea electric
energy systems," IEEE Trans. Power App. Syst., vol. PAS-89, No. 4, Apr. 1970.
[53] T. K. Nagsarkar, and M. S. Sukhija. Power system analysis. Oxford University
Press, 2007.
[54] H. H. Chen et al., "Effect of battery energy storage system on load frequency
control considering governor deadband and generation rate constraint," IEEE
Trans. Energy Convers., vol. 10, pp. 555-561, Sep. 1995.
[55] G. Shirai, "Load frequency control using Lyapunov's second method: Bang-bang
control of speed changer position," Proc. IEEE, vol. 67, pp. 1458-1459, Oct.
1979.
[56] N. Ewart, "Automatic generation control - performance under normal
conditions," Proc. IEEE, N.H. Henniker, Aug. 1975.
[57] N. Cohn, "Some aspects of tie line bias control on interconnected power
systems," IEEE Trans. Power App. Syst., vol. 75, pp. 1415-1436, Feb. 1957.
[58] J. L. Willems, "Sensitivity analysis of the optimum performance of conventional
load-frequency control,” IEEE Trans. Power App. Syst., vol. PAS-93, pp. 1287-
1291, Sep. 1974.
[59] S. K. Aditya and D. Das, “Battery energy storage for load frequency control of
an interconnected power system,” Electric power systems research, vol. 58, pp.
179-185, Jul. 2001.
[60] V. Knap et al., “Sizing of an energy storage system for grid inertial response and
primary frequency reserve,” IEEE Trans. Power Syst., vol. 31, pp. 3447-3456,
Sep. 2016.
[61] P. Schavemaker and L. van der Sluis, Electrical Power System Essentials. New
York, NY, USA: Wiley,2008.
[62] L.K. Kirchmayer, Economic Control of Interconnected Systems. John Wiley &
Sons, 1959.
[63] A.J. Wood and B.F. Wollenberg, Power Generation, Operation, and Control.
John Wiley & Sons, 1984.
[64] V. Knap et al., “Grid inertial response with lithium-ion battery energy storage
systems,” in Proc. 2014 IEEE Int. Symp. Ind. Electron. (ISIE), pp. 1813-1818,
Jun. 2014.
75
[65] P. W. Christensen and G. C. Tarnowski, “Inertial for wind power plants-State of
the art review-Year 2011”, Proc. 10th Int. Workshop Large-Scale Integration of
Wind Power into Power Systems, Aarhus, Denmark, Oct. 2011.
[66] A. Payman et al., “Energy control of supercapacitor/fuel cell hybrid power
source,” Energy Conversion and Management, vol. 49, pp. 1637-1644, Jun. 2008.
[67] J. Morren et al., “Wind turbines emulating inertia and supporting primary
frequency control”, IEEE Trans. Power Syst., vol. 21, pp. 433-434, Jan. 2006.
[68] Amano, Hiroyuki, et al. "Utilization of battery energy storage system for load
frequency control toward large-scale renewable energy penetration", Innovative
Smart Grid Technologies (ISGT Europe), 2012 3rd IEEE PES International
Conference and Exhibition on. IEEE, 2012.
[69] PJM manual12: Balancing Operations [EB/OL]. [2017-02-01]. [Online].
Available: http://www.pjm.com//media/documents/manuals/m12.ashx.
[70] S. Piller et al. "Methods for state-of-charge determination and their applications",
Journal of power sources, vol. 96, No. 1, pp. 113-120, Jun. 2001.
[71] Y. Wang et al. “Load frequency control in a two-area power system with
supercapacitor energy storage system”, Energy, Power and Transportation
Electrification (ACEPT), 2017 Asian Conference. IEEE, 2017.
[72] H.P. Beck and R. Hesse. "Virtual synchronous machine," Electrical Power
Quality and Utilisation, 2007. EPQU 2007. 9th International Conference on.
IEEE, Oct. 2007.
[73] H. Wu et al. "Small-signal modeling and parameters design for virtual
synchronous generators", IEEE Transactions on Industrial Electronics, vol. 63,
No. 7, pp. 4292-4303, Mar. 2016.
[74] J. Liu et al. "Comparison of dynamic characteristics between virtual synchronous
generator and droop control in inverter-based distributed generators", IEEE
Transactions on Power Electronics, vol. 31, No. 5, pp. 3600-3611, 2016.
[75] J. Fang et al. "Distributed Power System Virtual Inertia Implemented by Grid-
Connected Power Converters", IEEE Transactions on Power Electronics, 2017.
[76] M. A. Torres L. et al. "Self-tuning virtual synchronous machine: A control
strategy for energy storage systems to support dynamic frequency control", IEEE
Transactions on Energy Conversion, vol. 29, No. 4, pp. 833-840, Dec. 2014.
[77] D. Li et al. "A self-adaptive inertia and damping combination control of VSG to
support frequency stability", IEEE Transactions on Energy Conversion, vol. 32,
No. 1, pp. 397-398, Mar. 2017.
[78] G. Strbac et al. "Strategic assessment of the role and value of energy storage
systems in the UK low carbon energy future", Report for Carbon Trust 2012, Jun.
2012.
[79] M. Cheng et al. "Primary frequency response in the Great Britain power system
from dynamically controlled refrigerators", 22nd International Conference and
Exhibition on Electricity Distribution (CIRED 2013), pp. 0507-0507, 2013.
[80] M. Cheng et al. "Benefits of using virtual energy storage system for power
system frequency response", Applied energy, vol. 194, pp. 376-385, May 2017.

76
[81] M. Cheng et al. "Availability of l[oad to provide frequency response in the Great
Britain power system", Power Systems Computation Conference (PSCC), 2014.
IEEE, Aug. 2014.

77
Author’s Publication
Xiangyu Zhou, Chaoyu Dong, Jingyang Fang, Yi Tang*, “Enhancement of Load
Frequency Control through Using a Hybrid Energy Storage System”, Energy, Power
and Transportation Electrification (ACEPT), 2017 Asian Conference. IEEE, 2017.