Embed Size (px)
Citation preview

1
HY20 Result Presentation18 February 2020
Dig Howitt CEO & President
Brent Cubis CFO
22
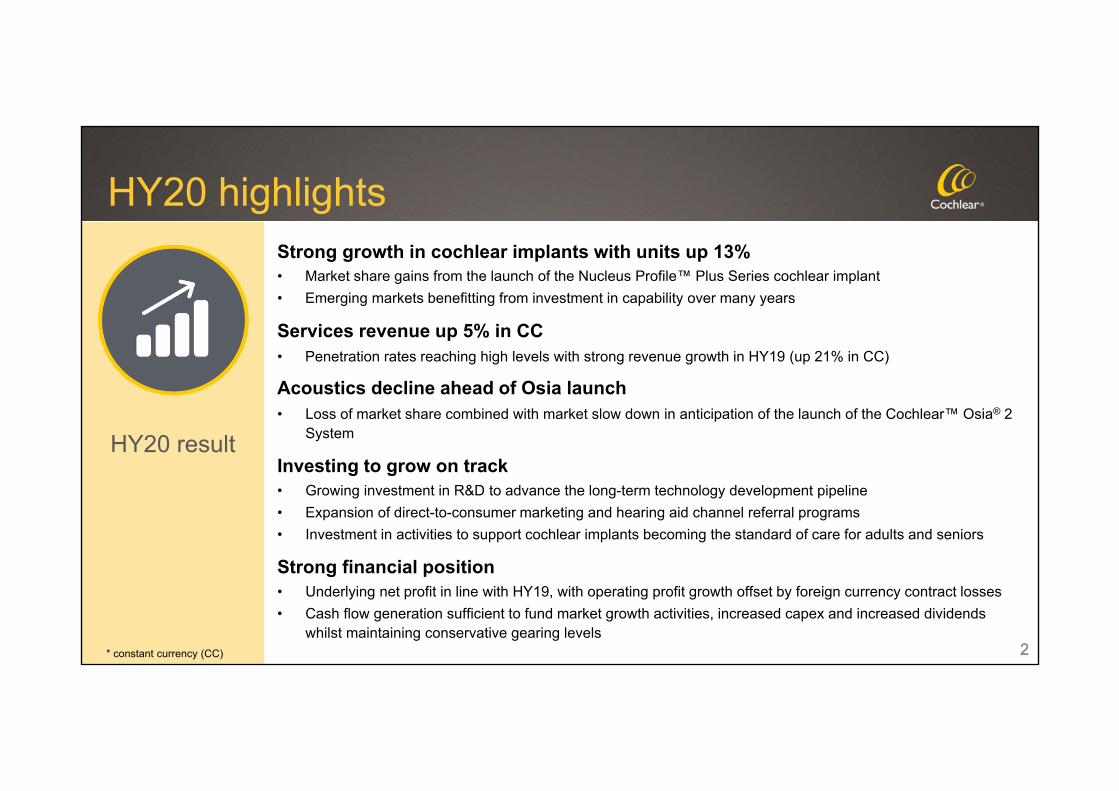
Strong growth in cochlear implants with units up 13%• Market share gains from the launch of the Nucleus Profile™ Plus Series cochlear implant• Emerging markets benefitting from investment in capability over many years
Services revenue up 5% in CC• Penetration rates reaching high levels with strong revenue growth in HY19 (up 21% in CC)
Acoustics decline ahead of Osia launch• Loss of market share combined with market slow down in anticipation of the launch of the Cochlear™ Osia® 2
System
Investing to grow on track• Growing investment in R&D to advance the long-term technology development pipeline • Expansion of direct-to-consumer marketing and hearing aid channel referral programs• Investment in activities to support cochlear implants becoming the standard of care for adults and seniors
Strong financial position• Underlying net profit in line with HY19, with operating profit growth offset by foreign currency contract losses• Cash flow generation sufficient to fund market growth activities, increased capex and increased dividends
whilst maintaining conservative gearing levels
HY20 result
HY20 highlights
* constant currency (CC)

33
Developed market units 7%• US up >10% driven by market share gains and
market growth• Western Europe up 5% with growth weighted to Q2
as availability expanded across the half• Western Europe market growth continues to be
challenging with many countries limited by funding caps or restrictive indications, with some recent wins – UK (Mar19) and Belgium (Aug19)
• Japan momentum continues following the expansion of indications in Oct17
Emerging market units >20%• Strong growth across the Middle East and China• Benefits from investment in expanded presence
Cochlear implants 60% of sales
revenue
* constant currency (CC)
Cochlear implant Sales revenue
CC* $m
Sales revenue 9% in CC*
Strong growth in cochlear implants with units up 13%

44
Services revenue up 5% in CCSales revenue 5% in CC*• Penetration rates high for Nucleus® 7 Sound
Processor at this point in the upgrade cycle• Strong revenue growth in HY19 (up 21% in CC)• Continued focus on recipient engagement with
Cochlear Family membership up >30% over the past 12 months to exceed 160,000 members
Services
29% of sales revenue
* constant currency (CC)
Services Sales revenue
CC* $m
Sales revenue 5% in CC*

55
Acoustics decline ahead of Osia launchSales revenue 13% in CC*• Some share loss from competitor product launch
as well as market slow down in anticipation of the launch of the Osia 2 System which received FDA clearance in November
• OSIA is the next generation of bone conduction implant with excellent results from pre-market studies and significant aesthetic appeal which was flagged at conferences ahead of FDA approval
• CE mark to take longer than expected – to be assessed under the new EU MDR
Acoustics
11% of sales revenue
* constant currency (CC)
Acoustics Sales revenue
CC* $m
Sales revenue 13% in CC*

Cochlear™ Osia® 2 SystemA hearing implant reimagined
Slim, connected & off‐the‐ear.To help patients hear without
getting in their way
High power, high gain &advanced signal processing.For hearing performance
in noise & quiet
Designed to implant. Made to last.For minimally invasive surgery
and reliability over time
6

Cochlear’s market leading portfolio of electrodes
Slim ModiolarElectrode
Slim Modiolar Electrode: An electrode designed to fit the natural shape of the inner ear• World’s thinnest and most advanced true perimodiolar electrode• Reliable placement preserving cochlea structures• Precise and effective stimulation of the auditory nerve• Delivering optimal hearing outcomes • Designed for the majority of CI candidates
Slim StraightElectrodes
Slim Straight Electrodes: World’s thinnest and most advanced lateral wall electrodes• Simplicity and ease of surgical use• Soft, flexible to minimise trauma to preserve structure• Introducing the Cochlear™ Nucleus® Profile™ Plus with Slim 20
Electrode (CI624), built on the proven Slim Straight platform, designed for surgeons preferring insertion depth to 20mm Slim 20 Electrode (CI624)
Slim Straight Electrode (CI622)
Slim Modiolar (CI632)

88
Regional review
HY20 result
Sales revenue 3% in CC• Strong CI growth with low
growth in Services and a decline in Acoustics
• CI units up >10% in the US• Growth in Latin American
Services
Sales revenue 3% in CC• Strong CI growth with low
growth in Services and a decline in Acoustics
• Growing momentum in W Eur as availability expands for new CI across the half
• Strong growth in Middle East
Sales revenue 13% in CC• Strong CI growth in Japan and
Korea• Strong growth in China
Americas Sales revenue
CC* $m
EMEA Sales revenue
CC* $m
Asia Pacific Sales revenue
CC* $m
* constant currency (CC)

9
HY20 Result Presentation18 February 2020
Brent Cubis CFO
1010
Financial highlights
HY20 result
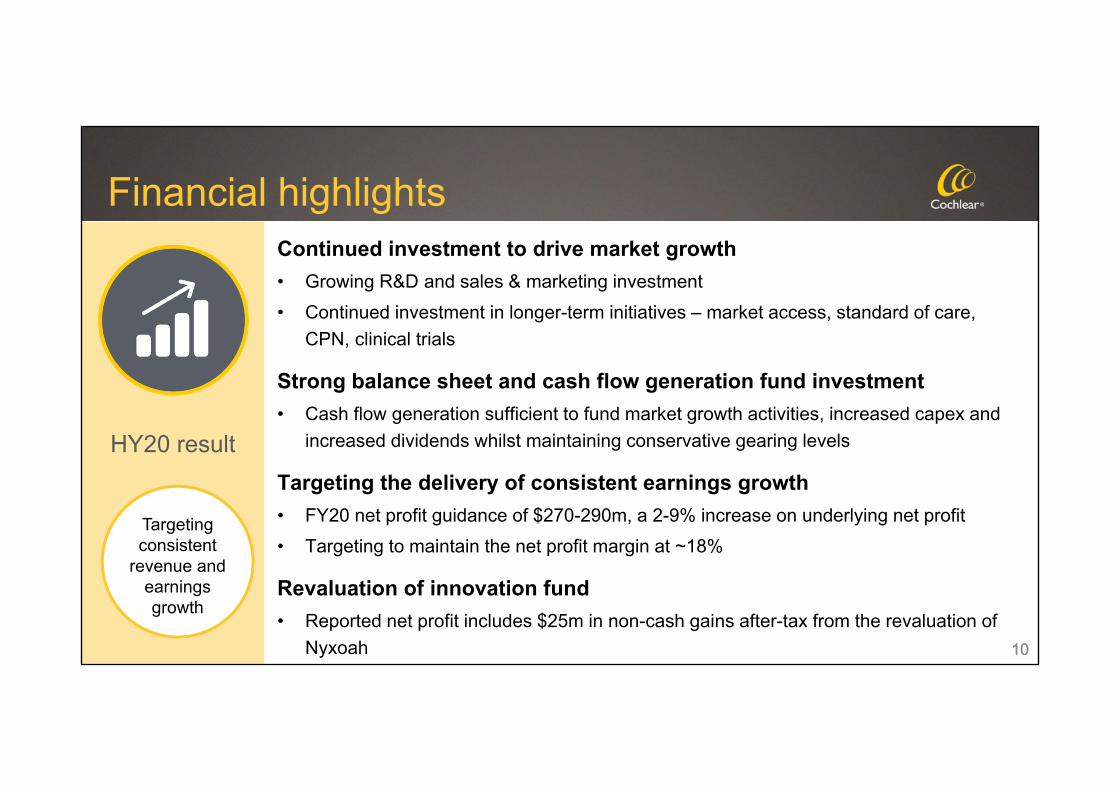
Continued investment to drive market growth • Growing R&D and sales & marketing investment• Continued investment in longer-term initiatives – market access, standard of care,
CPN, clinical trials
Strong balance sheet and cash flow generation fund investment• Cash flow generation sufficient to fund market growth activities, increased capex and
increased dividends whilst maintaining conservative gearing levels
Targeting the delivery of consistent earnings growth• FY20 net profit guidance of $270-290m, a 2-9% increase on underlying net profit• Targeting to maintain the net profit margin at ~18%
Revaluation of innovation fund• Reported net profit includes $25m in non-cash gains after-tax from the revaluation of
Nyxoah
Targeting consistent
revenue and earnings growth

1111
Profit & lossContinued investment in market growth activities and technology leadership
$m HY20 HY19 Change (reported)
Change (CC)
Sales revenue 777.6 711.9 9% 5%% GM 75% 75% 0 pts 0 ptsSelling, marketing and general expenses 243.5 216.1 13% 9%
R&D expenses% of sales revenue
94.412%
88.212%
7% 6%
Administration expenses 47.9 47.5 1% 0%Other income 6.0 8.0FX contract losses (21.9) (8.1)
EBIT*EBIT / sales revenue
183.724%
180.525%
2% 2%
Net finance costs 4.8 2.7 78%Taxation expense% effective tax rate
46.226%
45.726%
1%
Net profit (underlying)*% net profit margin (underlying)
132.717%
132.119%
0% 0%
Revaluation of innovation fund (after-tax)
Net profit (reported)
25.0
157.7
(3.5)
128.6 23% 22%
* Excluding revaluation of innovation fund
HY20 result
Re-investing gains from operating
efficiencies into market growth
activities

1212
Cash flowCash flow declines driven by increases in working capital and capex (China manufacturing facility, Denver office fitout and IT platform development)
$m HY20 HY19 $ change
EBIT (excluding revaluation of innovation fund) 183.7 180.5 3.2
Depreciation and amortisation (excl AASB 16 impact)* 21.3 17.5 3.8
Change in working capital and other (15.1) 15.5 (30.6)
Net interest paid (4.8) (2.7) (2.1)
Income taxes paid (58.3) (46.7) (11.6)
Operating cash flow 126.8 164.1 (37.3)
Capital expenditure (49.8) (36.0) (13.8)
Acquisition of other intangible assets (10.8) (8.7) (2.1)
Other net investments - (20.9) 20.9
Free cash flow 66.2 98.5 (32.3)
* Depreciation and amortisation excludes the impact of the adoption of AASB 16 to provide a like for like comparison to HY19
HY20 result
Targeting to fund growth
activities from operating cash
flows

1313
Capital employedIncrease driven by working capital, investments in China manufacturing facility and Denver office fitout and revaluation of investment in Nyxoah
$m Dec19 Jun19 $ change
Trade receivables 295.6 299.5 (3.9)
Inventories 204.0 195.4 8.6
Less: Trade payables (147.4) (160.8) 13.4
Working capitalWorking capital / sales revenue*
352.223%
334.123%
18.1
Property, plant and equipment 190.9 166.5 24.4
Intangible assets 428.2 424.4 3.8
Investments 83.0 47.8 35.2
Other net liabilities (104.0) (143.9) 39.9
Capital employed 950.3 828.9 121.4
* Based on doubling HY20 sales revenue
HY20 result
Investing activity drives
growth in capital
employed

1414
DividendsInterim dividend increased by 3%, fully franked, with the payout* on target at ~70%
$m HY20 HY19 % change
Interim ordinary dividend (per share) $1.60 $1.55 3%
Payout ratio* % 70% 68%
Franking % 100% 100%
HY20 result
Growing dividends with a payout of ~70% (or above) of net
profit since FY00
* Excluding after-tax gains or losses from innovation fund investments

15
HY20 Result Presentation18 February 2020
Dig Howitt CEO & President

1616
Deliver consistent revenue and earnings growthInvest to grow I Operational improvement I Strong financial position
Grow the hearing implant marketAwareness I Market access I Clinical evidence
Retain market leadershipMarket-leading technology I World-class customer experience
Strategic priorities

1717
Strategies to improve awareness and access vary by segment
Increase penetrationAdults & seniors
Developed marketsCurrent penetration*: 3%
Grow shareChildren
Developed marketsCurrent penetration*: 60%
Increase penetration, funding and affordability
Children Emerging marketsCurrent penetration*: 10%
Grow the hearing implant market
* Estimate based on information available to Cochlear

1818
• Strong cash flow generation funds investment in growth
• Aim: maintain the strong balance sheet position and continue to target a dividend payout of around 70% of underlying net profit
• Optimising cost of production strengthens our competitive position
• Aim: reinvest efficiency gains from growing scale in to market growth activities
Cochlear is investing operating cash flows to drive growth
Deliver consistent revenue
and earnings growth
• Building awareness and access requires multi-year investment in sales, marketing and R&D activities
• Aim: invest to grow, maintaining the net profit margin
Investing to grow
Delivering operational
improvements
Maintaining a strong financial
position
Investment priorities

1919
Revenue growth drivers
Deliver consistent revenue
and earnings growth
Cochlear implants• Growing awareness and uptake by adults
and seniors• Emerging market expansion• New products driving market growth and
market share
Services• Growing recipient base• Greater connectivity and engagement with
recipients• Next generation sound processor upgrades
Acoustics• New products • Market expansion
2020
FY20 outlook
Deliver consistent revenue
and earnings growth
FY20 net profit guidance* of $270-290m, up 2-9% on underlying net profitKey guidance considerations:• Expect strong H2 growth in cochlear implant units in developed markets
• Services revenue expected to grow although at a lower rate than previous years
• Acoustics revenue expected to decline for the full year driven following H1 declines, with H2 to benefit from US Osia launch
• Coronavirus impact: factoring in a significant decline in sales for Greater China in H2 due to hospitals deferring surgeries, including cochlear implants
• ~$10m reduction in FX contract losses expected in H2 v H1
• Includes an estimated $1.0-1.5m decline in net profit from the introduction of AASB16
• Capex and investments of ~$180m in FY20 and ~$100m in FY21
• Excludes after-tax gains or losses from innovation fund investments
• Forecasting a weighted average AUD/USD exchange rate of 68c for FY20 (72c in FY19) and AUD/EUR of 0.62 EUR (0.63 EUR in FY19)
* Excluding innovation fund investments

21
Appendix

2222
Cochlear at a glance
30+
countries with direct operations
550,000+
implants sold3
$180m+
in annual R&D
4,000+
employees100+
collaborative research programs
6key manufacturing
sites
$1.4b+
in sales revenue
Cochlear implants1
60%
~20%
Emerging markets
~80%
Developed markets
Services1
29%
Acoustics1
11%
Key products
49%
Americas34%
EMEA17%
Asia Pacific
Global sales
~60%
global market share2
1. % of sales revenue 2. based on Cochlear estimates for cochlear implants 3. includes cochlear and acoustic implants
Cochlear™ Osia® 2 System
Cochlear™ Baha® 5, Baha 5 Power and Baha 5 SuperPower
Cochlear™ Nucleus®
Kanso® Sound Processor (CP950)
Cochlear™ Nucleus® 7 Sound Processor
(CP1000)
Cochlear™ Nucleus®
Profile™ Plus with Slim Modiolar
Electrode (CI632)
Growing scale
Market leader

2323
Financial historyCochlear has a long track record of delivering growing sales revenue, profits and dividends
* FY12 excludes product recall costs of $101 million after tax, FY14 excludes patent dispute provision of $16 million after tax and FY19 excludes a net $11 million gain after tax from the revaluation of innovation fund investments.

2424
Investing to growCochlear takes a long term approach to investing and has invested in growing the market for implantable solutions since listing in 1995 Consistent investment in sales and marketingOur investment in sales and marketing activities is building awareness of and access to implantable solutions and driving market growth.The increase in investment in Selling, marketing & general expenses (SM&G) over the last six years has supported sales force expansion and investment in awareness building activities, particularly direct-to-consumer marketing initiatives, across a growing number of markets.
Growing research & development capabilityThe investment in R&D continues to strengthen our leadership position through the development of market-leading technology. Cochlear has a wide range of fully-featured products and a broad patent portfolio that protects the Company’s intellectual property. Over $1.9bn has been invested in R&D since listing with 13% of sales revenue invested in R&D in FY19.
2525
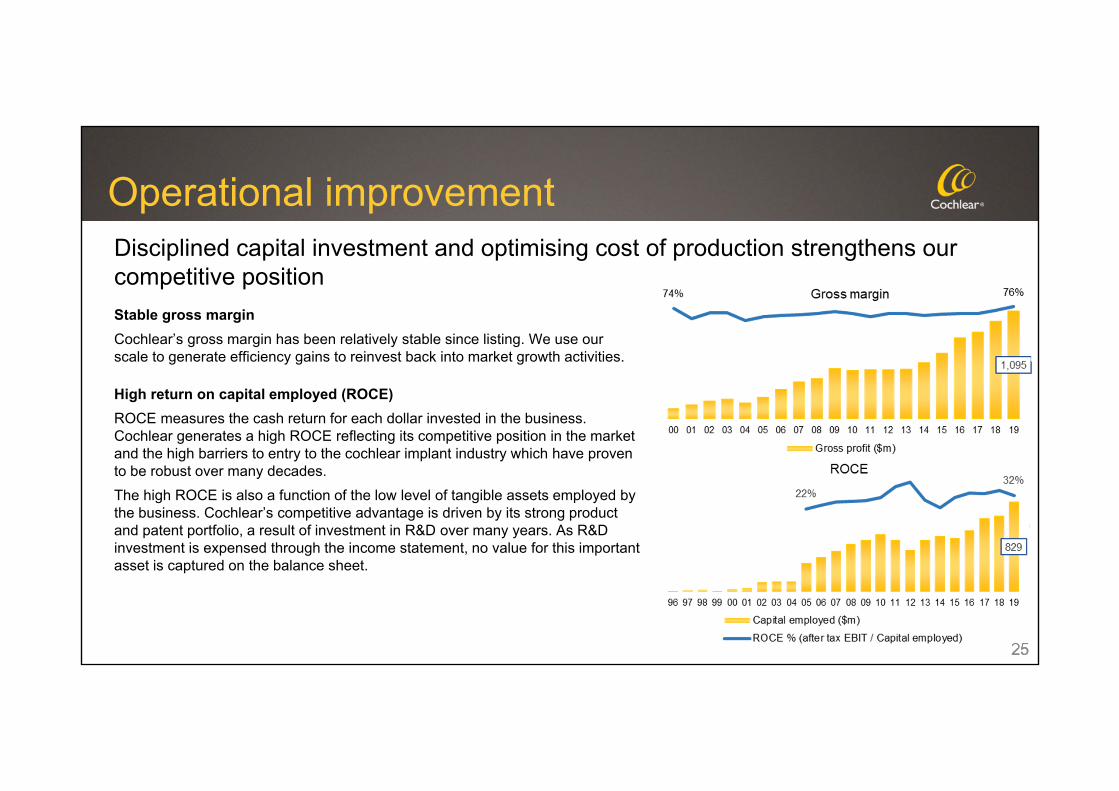
Operational improvementDisciplined capital investment and optimising cost of production strengthens our competitive positionStable gross marginCochlear’s gross margin has been relatively stable since listing. We use our scale to generate efficiency gains to reinvest back into market growth activities.
High return on capital employed (ROCE)ROCE measures the cash return for each dollar invested in the business. Cochlear generates a high ROCE reflecting its competitive position in the market and the high barriers to entry to the cochlear implant industry which have proven to be robust over many decades. The high ROCE is also a function of the low level of tangible assets employed by the business. Cochlear’s competitive advantage is driven by its strong product and patent portfolio, a result of investment in R&D over many years. As R&D investment is expensed through the income statement, no value for this important asset is captured on the balance sheet.

2626
Strong financial positionStrong free cash flow generation provides funding for market growth activities and R&D as well as the ability to reward shareholders with a growing dividend streamQuality operating cash flowsOne of the highlights of Cochlear’s financial history has been the conversion of reported profits to cash. There is a strong and consistent correlation between reported net profit and the operating cash flows generated by the business.
Disciplined use of capitalOperating cash flows have been primarily used to fund dividends, capital expenditure and acquisitions. The dividend policy has been to payout 70% of net profit as dividends to shareholders since FY00. Since listing, Cochlear has cumulatively paid out around 70% of operating cash flows as dividends.Key acquisitions have been focused on building the core implant business:• Sycle – hearing aid practice management software business (FY17)• Otologics – implantable microphone technology (FY10)• Brisbane manufacturing facility (FY07)• Entific – bone conduction implant business (FY05)

2727
Strong financial positionStrong free cash flow generation provides funding for market growth activities and R&D as well as the ability to reward shareholders with a growing dividend streamConservative gearing levelsCochlear has a strong balance sheet. It is a growth company that, since listing, has been able to fund investing activities, dividends, capital expenditure and acquisitions whilst maintaining conservative gearing levels.
Delivering stable net profit marginsCochlear will continue to invest operating cash flows in market growth activities with the objective of delivering consistent revenue and earnings growth over the long term. Through disciplined investment, we are targeting to maintain the net profit margin, reinvesting any efficiency gains, currency or tax benefits into market growth activities.
* FY12 excludes product recall costs of $101 million after tax, FY14 excludes patent dispute provision of $16 million after tax and FY19 excludes a net $11 million gain after tax from the revaluation of innovation fund investments.

2828
Notes Forward looking statementsCochlear advises that this document contains forward looking statements which may be subject to significant uncertainties outside of Cochlear’s control. No representation is made as to the accuracy or reliability of forward looking statements or the assumptions on which they are based. Actual future events may vary from these forward looking statements and it is cautioned that undue reliance not be placed on any forward looking statement.
Non-IFRS financial measuresGiven the significance of foreign exchange rate movements, the directors believe the presentation of the non-IFRS financial measure, constant currency, is useful for the users of this document as it reflects the underlying financial performance of the business. This non-IFRS financial measure has not been subject to review or audit. However, KPMG has separately undertaken a set of procedures to agree the non-IFRS financial measures disclosed to the books and records of the group.
Constant currencyConstant currency removes the impact of foreign exchange rate movements to facilitate comparability of operational performance for Cochlear. This is done by converting the prior comparable period net profit of entities in the group that use currencies other than Australian dollars at the rates that were applicable to the current period (translation currency effect) and by adjusting for current year foreign currency gains and losses (foreign currency effect). The sum of the translation currency effect and foreign currency effect is the amount by which reported EBIT and net profit is adjusted to calculate the result at constant currency.
Authorised for lodgement to the ASX by the Board of directors of Cochlear Limited