Embed Size (px)
Citation preview

HVTT15: FALCON IV: Validation of Smart Infrastructure Access Policy
1
FALCON IV: VALIDATION OF SMART INFRASTRUCTURE ACCESS POLICY
K. Kural, MEng.,
MSc, Senior Rese-
archer at HAN
University of
Applied Sciences,
PhD student at
TU/e.
F. Schmidt, MSc,
PhD, has been
working for Ifsttar
(former LCPC)
since 2009, as a
research engineer in
bridge engineering.
Sigurdur Erlingsson
Ph.D. in Civil
Engineering (1993)
and professor at
VTI and UoI.
Carl Van Geem
Doctor in technical
sciences (1996),
Senior Researcher
at the Belgian Road
Research Centre.
I. Vierth, MSc.
Senior Researcher
VTI specializing in
transport research.
D. Cebon, Professor
of Mechanical
Engineering at the
University of
Cambridge and
Director of SRF.
A. Lobig, Research
associate at the
German Aerospace
Center, specializing
at innovations in rail
and road freight
transport.
G. Liedtke, Head of
the Department of
Commercial
Transport at the
German Aerospace
Center.
Abstract
This paper describes part of the results of the ongoing CEDR-funded “FALCON” project,
which aims to introduce a step improvement in road freight transport efficiency in Europe
through the definition of a new performance-oriented legislative framework, and thus
ensuring a proper match between vehicles and the infrastructure. A Smart Infrastructure
Access Policy (SIAP) is being developed as the primary method of regulation, in which policy
explicitly specifies the performance level required from the road freight vehicle with respect
to safety, maneuverability, infrastructure loading, and environmental impact, while
considering national topologies and operational conditions. The vehicle combinations, which
are expected to operate within SIAP are in this paper validated against the number of criteria
being, the infrastructure damage and deterioration, congestions, safety, and the effect on the
modal split on national and cross border basis.
Keywords: Standards and regulations, Smart Infrastructure Access Policy, Commercial Road
Vehicle Technology

HVTT15: FALCON IV: Validation of Smart Infrastructure Access Policy
2
1. Introduction
The transport sector currently contributes to about a quarter of CO2 emissions in the EU and is
the only sector with an increasing trend according to European Environment Agency, 2017.
One of the drivers behind this trend is the growing demand for freight transport resulting from
the globalization. The road transport in the EU is the dominant mode that accounts for about
75% share of goods transport on land today, and is projected to increase in the forthcoming
decades. It is expected that by 2030 the total freight transport volumes will grow further by
approximately 38% with respect to 2011, while distributed over the transport modes, see
Figure 1. This represents an increasing load on existing European road infrastructure, which
cannot accommodate an additional transport demand without negative effects (damage on
infrastructure, congestion, safety issues, …). Expanding the capacity of current European road
infrastructure by nearly 40% is not viable within next decade due to the enormous financial
investments required and knowing that even road maintenance is already a financial difficulty,
carefully managed.
Therefore, the risk of
negative consequences as
severe traffic congestions or
increased costs for
infrastructure maintenance
appears to be in the future
unavoidable, when using
current legislative framework
that allows very limited
design of commercial vehicle
combinations.
Thus, the increasing demand for transport and mobility together with the congestion problem
explicitly calls for intrinsically more efficient road transport system. As proved by practice in
number of outside Europe, a Smart Infrastructure Access Policy (SIAP) and Performance
Based Standards (PBS), have significant potential to optimize the use of limited
infrastructure, while ensuring infrastructure protection, vehicle safety and numerous societal
benefits.
This paper describes interim results of the ongoing CEDR-funded “FALCON” project, which
aims to introduce a step improvement in transport efficiency through the definition of a new
tailor-made performance-oriented legislative framework for European road freight transport.
SIAP is being developed as the primary method of regulation, in which policy explicitly
specifies the performance level required from the road freight vehicles with respect to safety,
maneuverability, infrastructure loading, and environmental impact, while considering national
topologies and operational conditions. This method is fundamentally different to the
prescriptive approach, which mandates mass and dimension limits of vehicles and will be
ensuring a proper match between vehicles and the infrastructure. This paper emphasizes on
the validation of SIAP in number of key aspects, such as safety, congestion, infrastructure
deterioration, but also investigates what the impact will be on the modal split if the SIAP is
ratified.
Figure 1. Transport demand prognosis, European
Commission, 2011

HVTT15: FALCON IV: Validation of Smart Infrastructure Access Policy
3
2. Research approach
The validation of SIAP is based on previously achieved milestones within FALCON|CEDR
project. The results presented also in Schmidt, 2018, and de Saxe, 2018, include:
• the definition of representative vehicle fleet that is based on vehicle combinations,
which have good intermodal potential, and fit the logistic needs of selected EU-
countries,
• the definition of the representative EU-road network components including various
types of pavement structures, bridges, tunnels, and road geometry,
• through review of current EU policy related to the vehicle operation and infrastructure
design principles,
• SIAP definition.
This input will be used to validate the SIAP in number of key areas including, safety,
infrastructure damage considering both pavement and bridges, modal split, and the
congestions.
3. Validation of Smart Infrastructure Access Policy
3.1 Safety
Method at a glance
To validate the safety, initially, categories of critical infrastructure segments are identified
together with the Key Performance Indicators (KPI) for the vehicle combinations to quantify
and ensure their nominal operation on the infrastructure segments. Furthermore, the
framework to define the envelopes of the road classes for representative fleet is established.
Subsequently, a set of varying operational conditions will be defined covering both the
characteristics of the infrastructure and the current operational state of the vehicle
combination. At next the, safe vehicle operation is verified in terms of defined KPI’s through
simulation of varying input conditions and states to the validated multibody dynamical
models in a spirit of Monte Carlo approach. It is done on infrastructure segments that has been
already paired with given vehicle combination. Resulting histograms quantify the safety
performance of the vehicle combination.
Critical Infrastructure segments, KPI’s and Road Classes
A critical infrastructure segments have been identified in which the vehicle has a higher
chance of safety failures. Ensuring the vehicle operates nominally on these critical segments
is considered sufficient to infer the safe operation in less critical situations.
The identified segments are:
1. Highway Exits ensuring the transition from a highway to a lower level road. This involves
a curved exit from the highway which causes high levels of lateral acceleration and could
possibly lead to rollover, or jack-knifing. Due to the off tracking, there exists a chance that the
vehicle leaves its lane while negotiating low radius exits.
2.Single Lane Roundabouts (R<30m): Due to the off tracking, there exists a chance that the
vehicle leaves dedicated space while negotiating low radius exits resulting in damage.

HVTT15: FALCON IV: Validation of Smart Infrastructure Access Policy
4
3.Multi Lane Roundabout (R>30m): These roundabouts are of larger radius than the single
lane roundabouts. However, the existence of multiple lanes in the circular carriageway
reduces the amount of space available a vehicle combination and due to increase nominal
speed the risk of rollover is also present.
Considering rollover, jack-knifing, departure from the driving lane/space, and the inability to
maintain the longitudinal speed as main failure modes, a set of KPI in terms of vehicle
combination dynamical states in Table 1., has been defined.
Table 1 – KPIs | Vehicle Safety related states
Key Performance Indicator (KPI) Value Units
Lateral Acceleration < Static Rollover Threshold of vehicle
(3.5-4)
(m/s2)
Articulation angle < 30 (for high speeds above 40 km/h) (deg)
Distance of outermost points to lane
boundary
>0 (m)
Minimum Longitudinal Velocity 30 (km/h)
Safety assessment
Based on catalogue of representative infrastructure defined in Schmidt, (2018), two classes of
input parameters for the safety assessment can be identified related the infrastructure design
characteristics and the operational state of the vehicle combinations, both listed below.
Parameters Related to Infrastructure: Parameters Related to Operational State:
Radius of curvature Vehicle Load Density
Road Longitudinal Slope Road Frictional Condition
Road Cross Slope
As for the numerical values and the probability distribution per variable we refer to FALCON
final report to be published by end of 2018. Given the varying input conditions and the pairing
between the vehicle groups, defined in de Saxe, 2018, and the infrastructure levels, the Monte
Carlo analysis was done to analyze all input permutations in terms of defined KPI’s. The
output is represented by the histogram that is elaborated per vehicle, per KPI, and identified
critical infrastructure segment. An example is given in Figure 2. for vehicle combination
Tractor - Link Trailer - Link Trailer - Semitrailer at highway exit. The histogram gives the
confidence that lateral acceleration, being one of KPI, can be met even during the varying
operational conditions.

HVTT15: FALCON IV: Validation of Smart Infrastructure Access Policy
5
Figure 2. Histogram of lateral acceleration belonging to vehicle combination Tractor-
Link Trailer-Link Trailer-Semitrailer at highway exit scenario.
Complete set of dynamical simulations done in spirit of Monte Carlo approach governed the
definition of the road classes given in Table 2. Through approximately 1500 simulations done
per vehicle combination it is ensured a good fit between the vehicle combinations and the
critical infrastructure segments by satisfying all KPI’s.
Table 2 – Initial Draft of Road Classes
Road Level
Road Description
Lane Width
(straight Road)
Lane Width (in Exit)
Radius of Exit
Long. slope
Minimum Radius of Single
Lane Roundabout
Minimum Radius of Multi Lane Roundabout
Vehicles Permitted
Outer Inner Outer Inner
3 Motorways 3.5m (3.5+50/R)
m 70m – 150m
±4% 25m 17m Multi Lane
roundabouts not permitted
1.1, 1.2, 1.3, 1.4, 2.1, 2.2, 2.3, 3.1, 3.2, 3.3, 3.4, 4.1, 4.2, 4.3, 4.4, 4.5, 4.6, 4.7, 5.1, 5.2, 5.3, 5.4, 6.1, 6.2, 6.3, 6.4,
6.5
2
Inter Urban Arterial
Main Express Roads
3.25m (3.25+50/R)
m 40m – 150m
±6% 14m 2m 30m 24.7m
1.1, 1.2, 1.3, 1.4, 2.1, 2.2, 2.3, 3.1, 3.2, 3.4, 4.3, 4.4,
4.7
1 General Access
2.75m (2.75+50/R)
m 50m – 150m
±10% 12.5m 5.3m 30m 24.7m 1.1, 1.2, 1.3, 1.4
Besides the specification in Table 2., also the characteristics such as annual daily traffic, and
accident history should, or road roughness and healthiness should be considered as criteria to
make a paring between a vehicle combination and the infrastructure segments.

HVTT15: FALCON IV: Validation of Smart Infrastructure Access Policy
6
3.2 Modal Split
Previous work within the FALCON|CEDR project defined a representative vehicle fleet with
vehicle combinations, which have promising intermodal potential and fit the logistic needs of
selected EU-countries. High capacity vehicles may affect energy savings and lead to reduced
emissions of transport. However, as they also contribute to a reduction of transport costs, a
modal shift towards road freight can be expected. This may outweigh the positive effect on
the environment. The objective of this section is to give an estimate of this impact.
Method at a glance
The FALCON project developed 27 different vehicle concepts, which contain reference
vehicles and different kinds of high capacity vehicles. The estimation of modal shift effects
requires information about the amount of transports, which are suitable to be replaced by the
new vehicle concepts. Hence, in a first step, the theoretical substitution potential of selected
vehicle concepts must be determined. As a result, the market share of the respective vehicle
concept is derived. This work is done based on a DLR-internal data set about the usage of
vehicles registered in Germany in the year 2002. The substitution potential serves as an input
for the estimation of changes in modal split share for rail freight. This is done in the second
step. These changes are estimated using direct cost elasticities. Some assumptions are
necessary regarding e.g. transport prices for rail and road, average distances or transport cost
reduction due to new vehicle concepts.
Substitution potential
The developed vehicle concepts differ in several aspects, e.g. type of loading unit, number of
axles, volumetric capacity or operational gross vehicle weight. For the substitution potential
of new vehicle concepts, the most important variables from a logistics perspective are
transport volume (m³) and payload (tons). For the present analysis, the vehicle concepts
described in table 1 were defined.
In the analysis, all transported goods in the data set were considered (e.g. palletized or
packaged goods), except for bulk cargo. Typically, bulk cargo is not transported on the road
and therefore the vehicle concepts are mainly developed with general cargo in mind.
Furthermore, the transport costs (€/tkm) differ depending on transport distance. Concerning
this aspect, the following two distance classes were considered: national distance over 200 km
up to 500 km and international distance over 500 km. A vehicle is identified as substitutable,
if all of the following conditions apply:
• Vehicle has a payload of 23 tons or higher
• Vehicle has a high volume-utilization of at least 90%
• Increased transport volume (loading meters, pallet space) will not lead to a violation of
the weight limit
The results are depicted in Table 3. It becomes apparent, that both vehicle types have
comparable shares in both national and international distances. For national distances
approximately 24 % of the vehicles registered in Germany in 2002 fulfil the requested
conditions and can theoretically be replaced by the vehicle type 1 and 2. For international
distances about 35 % of the vehicles can be replaced by vehicle type 1 and 2. This theoretical
substitution potential doesn’t include vehicles, where the weight limit is reached but the
volume utilization is less than 90%. Therefore, the potential could be even higher.

HVTT15: FALCON IV: Validation of Smart Infrastructure Access Policy
7
Table 3 – Substitution potential of selected vehicle concepts
Reference
Vehicle
Vehicle
Type 1
Vehicle
Type 2
Volume
[m³] 80 117.5 143.7
Max. Payload [tons] 27 39.6 48.5
% vehicle on national distance 201 – 500 km - 24.4% 24.3%
% vehicle on international distance > 500 km - 34.5 % 34.5%
Modal Shift effects
The changes of the modal split can be estimated for the four different rail freight segments:
Maritime combined transport, continental combined transport, wagon load transport and block
train transport. The estimations are based on the use of elasticities, i.e. the change in demand
of rail freight due to changes in transport costs of road freight. For example, an elasticity of -2
means, that a reduction of costs of road freight of 1% results in a reduction of demand for rail
services of 2 %. Further aspects like rail and road freight transport pricing, average distance
and transport performance (tkm) in the different segments are also considered for the
estimation of the modal shift effect. Thus, the following assumptions were made:
• The cost reduction due to new vehicle concepts compared to a conventional
semitrailer may differ between the vehicle concepts. Kraaijenhagen et al. (2014)
calculated the total cost of ownership for different existing longer and heavier
vehicles. The cost reduction potential varied between 16 and 27 %. Simplifying for
this analysis, the cost reduction is fixed at 20 %.
• Prices for rail and road freight transport depend on transport distance
(national/international) and the respective segments (maritime combined transport,
continental combined transport, wagon load transport and block train transport)
(Sonntag, Liedtke 2015)
• Market share of the vehicle concept for national and international distances
(substitution potential)
• Average national and international distances in each transport segment (Sonntag,
Liedtke 2015)
• Discontinuation of rail freight services due to the introduction of new vehicle concepts
and further loss of market share (erosion effects)
The results of the modal shift analysis of vehicle type 1 are summarized in Table 4. The
results show, that the wagon load service is strongly affected by the introduction of the
vehicle type 1. The transport cost reduction for road freight transport strongly affects wagon
load services, leading to a cessation of said services. This induces a further loss of market
share of the wagon load services and leads to a reduction of wagon load services by about 22
%. In contrast to that, block trains seem to be resistant to the described effect. This is since the
block trains still focus on bulk transport, which is not considered here. The maritime and
continental combined transports have a moderate reduction by 11 % and 12 %. The
downstream erosion effects are less intense compared to the wagon load service, as the
service frequency is higher, in general. The analysis of vehicle type 2 yielded similar results,
which are therefore not described below.

HVTT15: FALCON IV: Validation of Smart Infrastructure Access Policy
8
Table 4 – Modal Shift effects according to the new vehicle concepts
Rail Freight Segments Vehicle Type 1
Maritime Combined Transport -11.2 %
Continental Combined Transport -12.0 %
Wagon load -22.4 %
Block train -2.4 %
The presented analyses identified a theoretical substitution potential of high capacity vehicles
with a volume up to 143.7 m³ and a maximum payload of 48.5 tons. Thus, on national
distances about 24 % of the registered vehicles in Germany in 2002 can be replaced by both
vehicle types. On international distances, about 35 % of the vehicles can theoretically be
replaced. Whether the full potential will be tapped depends on further aspects, e.g. the real
reduction of initial and variable costs, costs of retrofitting from rail to road service or the
usability of the vehicle concepts for the individual requirements. Nonetheless, the
introduction of high capacity vehicles causes a reduction of the demand for rail freight
services between 2 % and 22 % for the individual rail freight segments. The wagon load
service may go out of business due to the considered vehicle concepts. In this case the
downstream cessation of rail freight services is of high relevance and leads to further
reduction of modal split share.
To diminish these effects, a closer multimodal cooperation between rail and road services
should be achieved, as opposed to a competition between both transport modes. A multimodal
transport system requires: Highly automated technologies for the transshipment of general
cargo between road and rail, flexible container units suitable for road and rail, competitive rail
freight services and suitable rail freight infrastructure. The transport policy should permit new
vehicle concepts on the road and simultaneously strengthen the rail freight to prevent further
loss of rail freight market share.
Cross-border Scenario
The impacts of the use of high capacity vehicle for national transports in Sweden have been
simulated with help of the Swedish national freight model Samgods, see Vierth et al. (2008).
Between 1996 and 2015 the maximum truck dimensions were 60 tonnes and 25.25 meters in
Sweden compared to 40 tonnes and 18.75 meters in most other European countries. Sweden
extended the maximum weight to 64 tonnes in 2016 (in place) and 74 tonnes in 2018 (not yet
implemented). The annual volume of CO2 emissions is calculated to increase by about
240,000 tonnes in the whole of Sweden (correspondingly six percent) if no modal shifts are
assumed and to decrease by about 100,000 tonnes (correspondingly 2.5 percent) if modal
shifts are assumed. The shift is mainly from road to rail.
Vierth (2014) applied an updated version of the Samgods model to study the impacts of the
permission of longer trucks (maximum 25.25 meters instead of 18.75 meters) and longer
freight trains one by one and in combination in a cross-border long-distance corridor between
central Sweden and the Ruhr area in Germany. The modal shifts addressing longer trucks in
the cross-border corridor are calculated to be larger and relate to both rail and sea as, in
analysis of the impact of smaller truck dimensions for national transports in Sweden Vierth et
al. (2008). In the longer truck scenario, the CO2-emissions caused from trucks that drive on or
towards the cross-border corridor (inside and outside Sweden) are calculated increase by
16,000 tonnes per year. The outcome of these two studies indicate that the conditions for the
HVTT15: FALCON IV: Validation of Smart Infrastructure Access Policy
9
permission of High Capacity Vehicles and the operation of SIAP as well as the potential
impacts on the modal split and CO2-emissions differ between national and cross-border
freight transports. Other external effects as well as public and private investment costs need to
be considered as well and shall be investigated in the future.
3.3 Infrastructure Damage and deterioration
Method at a glance
For the road infrastructure damage assessment, a four representative pavement structures were
selected described in Schmidt, (2018), being as follows:
• thick bituminous
• flexible
• semi-rigid
• concrete pavement.
The structures were tested for the deterioration while considering the axle loads impact from
six of the vehicles of the representative fleet given in de Saxe, 2018, two of which are
currently in use on European roads. The loading condition of the axles comply with
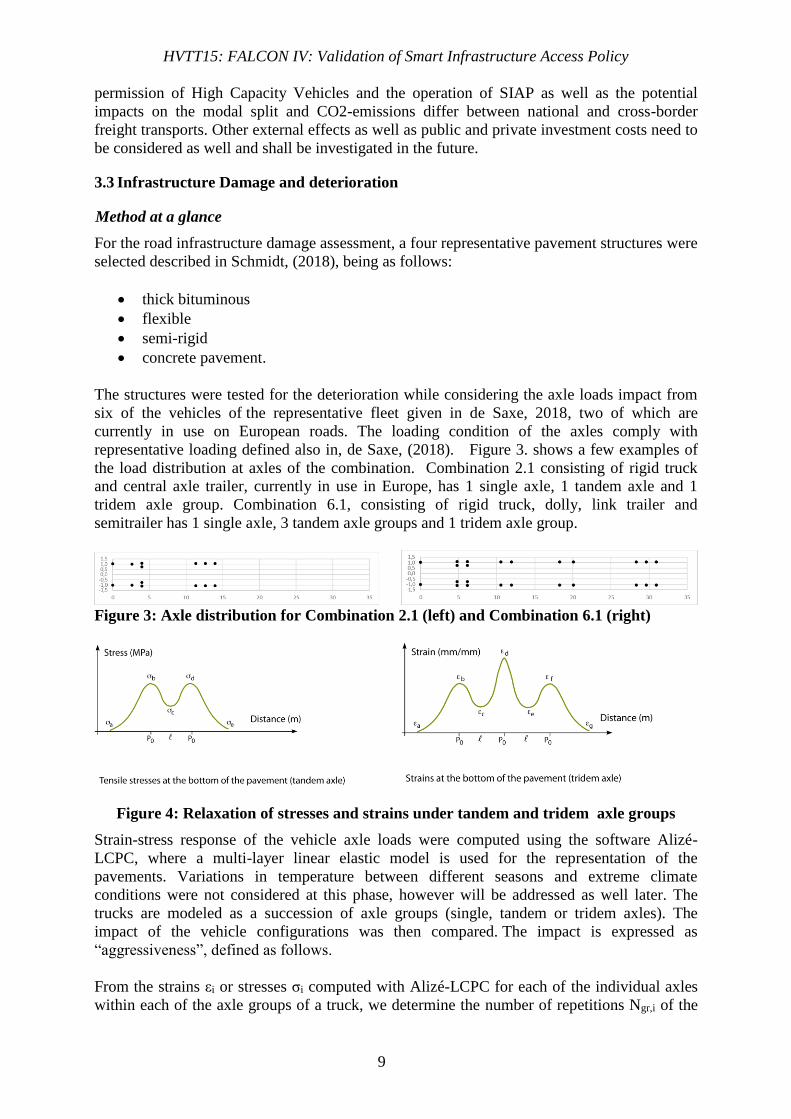
representative loading defined also in, de Saxe, (2018). Figure 3. shows a few examples of
the load distribution at axles of the combination. Combination 2.1 consisting of rigid truck
and central axle trailer, currently in use in Europe, has 1 single axle, 1 tandem axle and 1
tridem axle group. Combination 6.1, consisting of rigid truck, dolly, link trailer and
semitrailer has 1 single axle, 3 tandem axle groups and 1 tridem axle group.
Figure 3: Axle distribution for Combination 2.1 (left) and Combination 6.1 (right)
Figure 4: Relaxation of stresses and strains under tandem and tridem axle groups
Strain-stress response of the vehicle axle loads were computed using the software Alizé-
LCPC, where a multi-layer linear elastic model is used for the representation of the
pavements. Variations in temperature between different seasons and extreme climate
conditions were not considered at this phase, however will be addressed as well later. The
trucks are modeled as a succession of axle groups (single, tandem or tridem axles). The
impact of the vehicle configurations was then compared. The impact is expressed as
“aggressiveness”, defined as follows.
From the strains εi or stresses σi computed with Alizé-LCPC for each of the individual axles
within each of the axle groups of a truck, we determine the number of repetitions Ngr,i of the

HVTT15: FALCON IV: Validation of Smart Infrastructure Access Policy
10
loads applied by each of the axle groups before breaking of the pavement. For this, two
different fatigue laws were used: one for the thick-bituminous and flexible pavements, and
one for the semi-rigid and concrete pavements.
For the load applied by a reference axle (a 5kN single wheel of a 10kN reference axle) the
strains or stresses computed with Alizé-LCPC give rise to the number of repetitions Nref of the
load applied by the reference axle before breaking of the pavement. This number is obtained
from the application of the appropriate fatigue law. For an axle group gr that consists of 1
single axle, the number of repetitions Ngr,i is also directly obtained by the application of the
appropriate fatigue law. For tandem and tridem axle groups the number of repetitions Ngr,i is
obtained by the use of Miner’s rule, combining the effects of all the axles within the axle
group. For this, we compute the maximum number of repetitions of the loads applied by each
of the axles within the axle group before breaking of the pavement, whereby we take the
partial relaxation of strain or stress between the passages of the consecutive axles in the axle
group into account. Figure 4. illustrates the relaxation principle.
We define the aggressiveness Agr,i of the i-th axle group as the ratio between Nref and Ngr,i:
𝐴𝑔𝑟,𝑖 = 𝑁𝑟𝑒𝑓
𝑁𝑔𝑟,𝑖 (1)
We then define the aggressiveness A of a vehicle combination T as the sum of the
aggressiveness’s Agr,i of all m axle groups of the combination:
𝐴(𝑇) = ∑ 𝐴𝑔𝑟,𝑖𝑚𝑖=1 (2)
Subsequently, other indicators of aggressiveness are defined. To take the internal volume V
for cargo for each of the vehicles into account, we divide the aggressiveness A by V for each
combination T:
𝐴𝑝𝑒𝑟𝑉(𝑇) = 𝐴(𝑇)
𝑉(𝑇) (3)
Analogously, the differences in GCM between the vehicle combinations are acknowledged by
following formula:
𝐴𝑝𝑒𝑟𝐺𝐶𝑀(𝑇) = 𝐴(𝑇)
𝐺𝐶𝑀(𝑇) (4)
Considering the combination 1.3 (Tractor Semitrailer) the most frequently used in Europe, the
aggressiveness’s defined above for vehicles from groups 2-6, can be normalized with the
values obtained for this vehicle combination as e.g. for AperGCM:
𝐴𝑝𝑒𝑟𝐺𝐶𝑀𝑟𝑒𝑙1.3(𝑇) = 𝐴𝑝𝑒𝑟𝐺𝐶𝑀(𝑇)
𝐴𝑝𝑒𝑟𝐺𝐶𝑀(1.3) (5)
Next, we denote Mc(T) for the cargo mass transported by truck T, that be employed to obtain
the ratio R(T) between Mc(T) and GCM(T) of truck T indicating the net share of the cargo on
complete vehicle combination weight:
𝑅(𝑇) = 𝑀𝑐(𝑇)
𝐺𝐶𝑀(𝑇) (6)
Finally, we define last indicator of aggressiveness as follows:

HVTT15: FALCON IV: Validation of Smart Infrastructure Access Policy
11
𝐴𝑟𝑒𝑙𝐶𝑎𝑟𝑔𝑜(𝑇) = 𝐴𝑝𝑒𝑟𝐺𝐶𝑀𝑟𝑒𝑙1.3(𝑇)
𝑅(𝑇) (7)
Since the absolute values of “aggressiveness” depend on the pavement type, these indicators
cannot be compared cross-pavement type. For each of the pavement types, we computed the
values of A for each of the 6 trucks and then ordered them from smallest to largest value. In
this way, each truck gets a ranking (1 to 6) per pavement type and per aggressiveness
indicator. Then we computed for each truck the average of its rankings. For “aggressiveness
A” this is represented by the blue blocks in the diagram in Figure 5. The same is done for
respectively AperGCM, AperV and ArelCargo, in red, green, and purple, respectively. The
last block in the block diagram is the average of the values for each of the other blocks for
that truck.
Figure 5: relative rankings of trucks in function of different aggressiveness indicators
With the assumptions we made for the computations, it can be observed from the Figure 3.,
that raking of vehicle combination 2.1 reaches the highest values, indicating the most
significant impact on selected pavement structures in terms of introduced aggressiveness
measures. Given the fact the vehicle combination 2.1 fully comply with current EU directive
96/53, it is apparent that vehicles from groups 3-6 does not represent a potential threat for the
current infrastructure.
Besides the pavement related calculations, the impact on the bridges is also addressed. The
assessment of the impact of vehicles on the European bridge stock is done for all the vehicles
whose parameters have been gathered from the representative fleet, for the bridges listed in
the infrastructure catalogue, and by using the European design criteria, both listed in Schmidt,
2018. For each of these vehicles, the weights and dimensions are known; therefore,
computing the effect induced by each category is possible by calculating the convolution of
the axles loads with the influence line of the considered effect. These influence lines are
theoretical ones, as it has been done during the background works of Eurocode, EN 1991.
At first, the aggressiveness of all vehicles from the representative fleet have been compared to
the aggressiveness of vehicle 2.1, which is considered as the reference vehicle. Hence in
Figure 66., for each vehicle (designated by column and consistent with numbering of used in,

HVTT15: FALCON IV: Validation of Smart Infrastructure Access Policy
12
de Saxe 2018), the ratio of the damaging effect of this vehicle to the same damaging effect of
vehicle 2.1 is given, for all 25 chosen effects (and therefore the 25 colored dots).
It can be observed that for some effects, entire representative fleet displays similar
aggressiveness (for example effect 4 -E4, orange dot-) whereas other effects enable to
distinguish the differences per vehicle in terms of aggressiveness more considerably. This
highlights the need choose properly various influences lines, and therefore the critical
elements in specific bridges structures. Moreover, from a vehicle perspective, it can be seen
that combination 2.1 is not the least aggressive vehicle in the fleet: each other vehicle
exhibits ratios of effects higher and lower than 1, which means that there exist structural
elements which are less damaged and more damaged by other vehicles than vehicle 2.1. This
is the case even for the very long high-capacity vehicles (columns 19 to 27).
At this stage, it should be emphasized that HCVs allow to carry more weight and volume of
the cargo than the conventional vehicles in group 1 and 2 of the fleet. Therefore, the
calculated effects have been normalized by the volume and the weight of transported cargo
using the representative loading conditions, see Table 5. for an excerpt of the results.
Herewith, we can classify the vehicles depending on their effects: if all their effects are higher
than those of vehicle 2.1, they will be considered as more aggressive (coloured by red, in
Table 5). In the opposite case, they will be classified as less-damaging vehicles (marked as
green). When all the effects are of similar value, the vehicle will be marked in yellow.
Resulting ranking proved that, assessed HCVs are -generally- less aggressive than the
reference vehicle (or vehicles globally in use, like 1.3). Moreover, it should be noted that the
classification coming the normalization by volume/length is not the same as the one being
made with the mass-normalized values. Therefore, a more precise classification between the
damaging effect of the various vehicles could be done, but decisions should be made (type of
normalization, threshold of the meaning of higher/similar/lower, type of structures and effects
to be analyzed, …) mainly on national level.
Figure 6: Ratio of effect of vehicles with effect of reference vehicle (2.1) on vertical axis,
vehicle type, according to de Saxe, 2018, on horizontal axis.
0
0.5
1
1.5
2
2.5
0 5 10 15 20 25 30
E1 E2 E3 E4 E5 E6 E7 E8 E9 E10 E11 E12 E13
E14 E15 E16 E17 E18 E19 E20 E21 E22 E23 E24 E25

HVTT15: FALCON IV: Validation of Smart Infrastructure Access Policy
13
Table 5: Comparison of damaging effect of vehicles, compared to the reference vehicle
2.1.
Structure Normalization with
length† Normalization with
mass†
1
4.5, 5.1, 6.1
2.1, 3.1
1.3
4.5, 5.1, 6.1
2.1, 3.1
1.3
2 4.5, 5.1, 6.1
1.3, 2.1, 3.1
4.5, 5.1, 6.1
3.1
1.3, 2.1
3 4.5, 5.1, 6.1
1.3, 2.1, 3.1
4.5, 5.1, 6.1
1.3, 2.1, 3.1
4
4.5, 5.1, 6.1
1.3, 2.1
3.1
4.5, 5.1, 6.1
1.3, 2.1, 3.1
5
4.5
1.3, 2.1, 5.1, 6.1
3.1
4.5, 5.1, 6.1
1.3, 2.1, 3.1
6
4.5, 5.1, 6.1
3.1
1.3, 2.1
5.1, 6.1
3.1, 4.5
1.3, 2.1
7
4.5, 5.1, 6.1
3.1
1.3, 2.1
3.1, 4.5, 5.1, 6.1
1.3, 2.1
8 4.5, 5.1, 6.1
1.3, 2.1, 3.1
6.1
5.1
1.3, 2.1, 3.1, 4.5
9 4.5
1.3, 2.1, 3.1, 5.1, 6.1
4.5, 5.1, 6.1
1.3, 2.1, 3.1
10
5.1
1.3, 2.1, 4.5, 6.1
3.1
5.1
6.1
1.3, 2.1, 3.1, 4.5
† Vehicles more damaging than vehicle 2.1 are in red, vehicles damaging approximately in the
same amount than vehicle 2.1 are in yellow, and vehicles less damaging are in green)

HVTT15: FALCON IV: Validation of Smart Infrastructure Access Policy
14
3.4 Congestions
Using the model introduced in Morrison (2013), the simulations will be performed to
investigate the effects on motorway congestion and fuel consumption. Baseline scenarios will
be simulated with the traffic flow composed of passenger cars, light goods vehicles and
standard HCVs. A proportion of conventional articulated HCVs is then replaced by a smaller
number of HCVs recruited from the representative fleet, carrying the same total payload mass
and volume, the availability of the results is anticipated in August 2018.
4. Conclusion and Discussion
Results presented in this paper provided an insight related to the implementation of vehicles
from FALCON representative fleet, and operating within SIAP, into a practice. Number of
aspects is considered being the safety, infrastructure damage and modal split. It can be
concluded that none of newly proposed vehicles does represent load to the infrastructure
(represented by both pavement and bridges), which would exceed the impact caused by
reference vehicles from group 1-2, currently operating within European council directive
96/53/EC. In fact, some vehicles from group 3-6 are more infrastructure friendly then
reference vehicles when the impact is normalized by the vehicle combination capacity. As for
the safety, an approach has been outlined how the operation of arbitrary vehicle combination
may be assessed in terms established safety related KPI’s that guarantees the nominal
operation on critical infrastructure segments. Considering the results of the modal split, the
introduction of multimodal HCV’s operating in SIAP, will be most denotable for the wagon
load, and substantially less significant for or maritime combined transport or block trains. In
the future, it is expected that introduction of SIAP-like frameworks on EU level will
positively influence the logistic sector through more CO2 efficient multimodal transport, and it
will also allow to deal with gradually increasing transport demand on currently existing roads
through good matchmaking between the vehicles and the infrastructure.
5. References
• European Environment Agency (2017), EU-27 greenhouse gas emissions, breakdown
by sector (Global warming potential in million tonnes of CO2 equivalent); also
available at Eurostat (online data code: env_air_gge), retrieved 2017
• European Commission (2011), Roadmap to a Single European Transport Area –
Towards a competitive and resource efficient transport system, Brussels, 2011
• de Saxe, C.C., Kural, K., Kharrazi, S., Schmidt, F., van Geem, C., Berman, R.,
Woodrooffe, J., Cebon, D., (2018), FALCON III: Defining a performance-based
standards framework for high capacity vehicles in Europe, accepted paper to HVTT15,
Rotterdam, 2018
• Sonntag H., Liedtke, G. (2015): Studie zu Wirkungen ausgewählter Maßnahmen der
Verkehrspolitik auf den Schienengüterverkehr in Deutschland - Modal Split der
Transportleistungen und Beschäftigung, Berlin
• EN (1991), Eurocode 1: Actions on structures - Part 2: Traffic loads on bridges, 1991.
• Maryam Moshiri, Jeanette Montufar, Bernard Jacob, Franziska Schmidt, (2011),
Investigation on existing Bridge Formulae and background for the development of a
European Bridge Formula, PIARC World Congress, Mexico City, 2011.
• Kraaijenhagen, B.; Barth, T.; Kural, K.; Pauwelussen, J.; Besselink, I.; Prati, A.; Meijs,
M. and Nijmeijer, H. (2014): Greening and Safety Assurance of Future Modular Road
Vehicles. Book of Requirements.
• Morrison, G., Roebuck, R.L., Cebon, D., (2013), Effects of heavy vehicle size on traffic

HVTT15: FALCON IV: Validation of Smart Infrastructure Access Policy
15
congestion, Proceedings of the Institution of Mechanical Engineers, Part C: Journal of
Mechanical Engineering Science,
http://journals.sagepub.com/doi/pdf/10.1177/0954406213493384, 2013.
• Schmidt, F., Kharrazi, S., Erlingsson, S., van Geem, C., Cocu, X., Jacob, B., (2018),
FALCON II: Input for a European PBS definition: review of vehicle legislations and
infrastructure design criteria, accepted paper to HVTT15, Rotterdam, 2018
• Vierth, I., Karlsson, R., (2013), Effects of longer lorries and fraight trains in an
international corridor between Sweden and Germany, 41st European Transport
Conference 2013, Frankfurt, Germany
• Vierth, I., et. Al., (2008), The effects of long and heavy trucks on the transport system,
Report on governmental assignment, VTI, 2008