Embed Size (px)
Citation preview

Link https://www.hussmanfunds.com/comment/mc191203/
The Meaning of Valuation
John P. Hussman, Ph.D.
President, Hussman Investment Trust
December 2019
Stock prices have reached what looks like a permanently high plateau. – Professor Irving Fisher, October 15, 1929
A New York Times article published the following day elaborated on Fisher’s comments:
“After discussing the rise in stock values during the past two years, Mr. Fisher declared
realized and prospective increases in earnings, to a very large extent, had justified this
rise, adding that ‘time will tell whether the increase will continue sufficiently to justify the
present high level. I expect that it will… While I will not attempt to make any exact
forecast, I do not feel that there will soon, if ever, be a fifty or sixty-point break below
present levels such as Mr. Babson has predicted.’ While the tone of his address proper
reflected a moderate optimism, in the informal questioning that followed Professor
Fisher fell into an almost unqualified optimism. In reply to one question, he declared that
he expected ‘to see the stock market a good deal higher than it is today, within a few
months.’”
It’s worth noting that the stock index that Fisher was referencing in that speech was the
Dow Jones Industrial Average, which had peaked on September 3, 1929 at 381.17. The
“fifty or sixty-point break” that Fisher ruled out – soon, if ever – would have amounted to
a market decline of only 13-16%. In September 1929, economist Roger Babson had
actually told the National Business Conference in Massachusetts that “sooner or later a

crash is coming which will take in the leading stocks and cause a decline from 60 to 80
points.” Yet even that decline would have only amounted to 16-21%.
As it happened, the Dow would subsequently lose over 89% of its value, plunging to a
low of 41.22 on July 8, 1932.
Back in May (see Why A 60-65% Market Loss Would Be Run-Of-The-Mill) I noted that an
89% market loss essentially comprises a two-thirds loss in the value of the stock market,
followed by yet another two-thirds loss of its remaining value. At the 1929 peak, one of
these two-thirds losses was rather predictable, as it is at current market extremes:
“The first loss was a rather standard, run-of-the-mill retreat in market valuations from the
1929 extremes to levels that have historically been observed by the end of nearly every
market cycle in history. Yes, a two-thirds market loss seems severe, but in the context of
1929 valuation extremes, it was also fairly pedestrian. The first two-thirds loss merely
brought valuations to ordinary historical norms. The problem was that additional policy
mistakes contributed to a Depression that wiped out yet another two-thirds of the
market’s remaining value. The combination, of course, is how one gets an 89% market
loss. Lose two thirds of your money, and then lose two thirds of what’s left.”
The chart below shows our Margin-Adjusted P/E (MAPE), which is better correlated with
actual subsequent market returns than price/forward operating earnings, the Shiller
CAPE, the Fed Model and numerous alternative measures.
To demonstrate that a good valuation measure is simply shorthand for a proper
discounted cash flow analysis, I’ve also calculated – at each date in history – the present
value of all actual subsequent S&P 500 Index dividends up to the present date (which fully
include the impact of buybacks on per-share values), projecting future dividends beyond
2019 to reflect both current structural GDP growth and actual S&P 500 revenue growth
in recent decades, and discounting all of those cash flows using a benchmark discount
rate of 10% (representing typical long-term stock market returns across history). Let’s call
this the “discounted cash flow” or DCF value of the S&P 500. I then calculated the ratio
of the actual S&P 500 Index to that 10%-benchmark DCF.
Valuations measure the tradeoff between current prices and a very long-term stream of expected future cash flows. Every useful valuation ratio is just shorthand for that calculation. Every valuation ratio that fails that criterion is inferior, and you can show it in historical data.
As I’ve demonstrated a thousand ways, regardless of the impact of speculation or risk-
aversion over shorter portions of the market cycle, the higher the level of market
valuations, the lower the long-term and full-cycle market returns that have ultimately
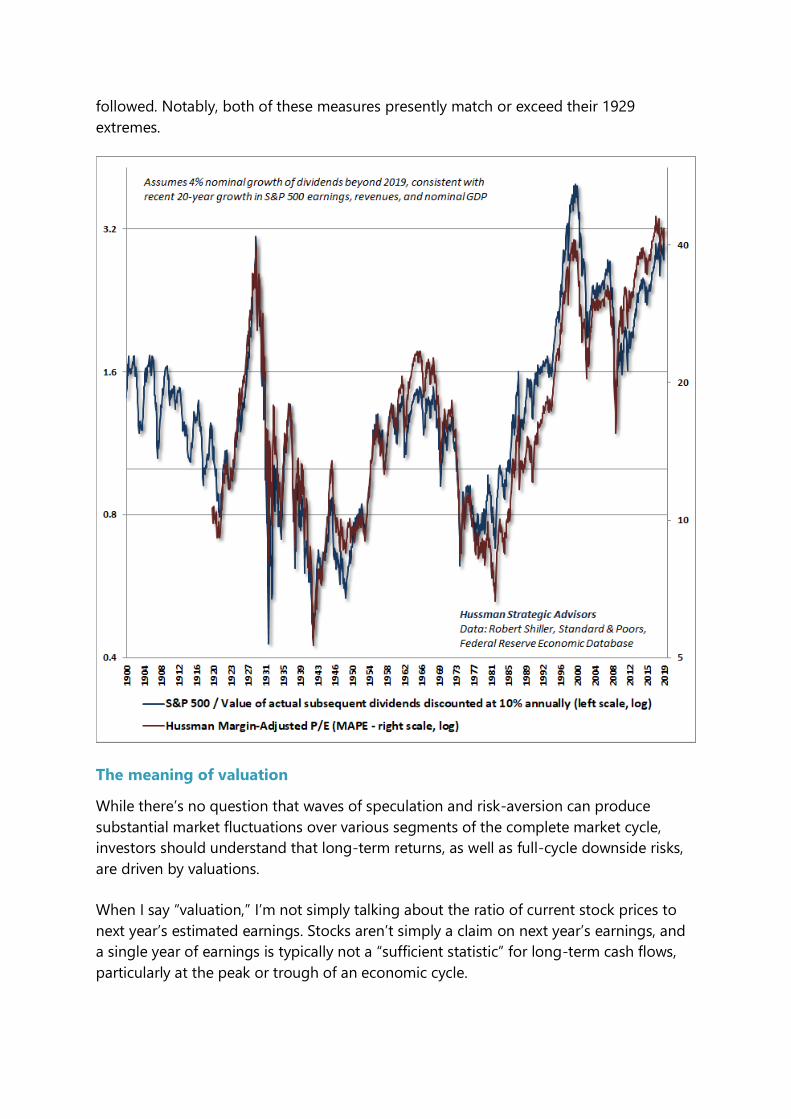
followed. Notably, both of these measures presently match or exceed their 1929
extremes.
The meaning of valuation
While there’s no question that waves of speculation and risk-aversion can produce
substantial market fluctuations over various segments of the complete market cycle,
investors should understand that long-term returns, as well as full-cycle downside risks,
are driven by valuations.
When I say “valuation,” I’m not simply talking about the ratio of current stock prices to
next year’s estimated earnings. Stocks aren’t simply a claim on next year’s earnings, and
a single year of earnings is typically not a “sufficient statistic” for long-term cash flows,
particularly at the peak or trough of an economic cycle.

Valuations measure the tradeoff between current prices and a very long-term stream of
expected future cash flows. Every useful valuation ratio is just shorthand for that
calculation. Every valuation ratio that fails that criterion is inferior, and you can show it in
historical data.
The valuation measures that investors use should survive two criteria. First, a good
valuation measure should reasonably mirror a proper discounted cash flow analysis, and
as you can see above, this is something we can check. Second, a good valuation measure
(technically, it’s log value) should be strongly correlated with actual subsequent market
returns in cycles across history. Again, this is something we can check.
Based on the most reliable valuation measures we’ve examined or introduced over more
than three decades, the current tradeoff between stock prices and likely future cash
flows now rivals the 1929 and 2000 extremes.
Yes, interest rates are low, but with them, so are the discount rates and long-term
returns that are embedded into current prices. Indeed, the most reliable valuation
measures suggest that stock prices are presently about three times the level that would
imply future long-term returns close to the historical norm. That may sound like a
preposterous assertion, but we’ve seen such extremes before, and they’ve ended quite
badly.
Worse, there is a great deal of evidence to support the assertion that interest rates are
low because structural economic growth rates are also low. In that kind of environment,
a proper discounted cash flow analysis would show that no valuation premium is
“justified” by the low interest rates at all. Hiking valuation multiples in response to this
situation only adds insult to injury.
Last week, our estimate of prospective 12-year nominal annual total returns on a
conventional portfolio mix (invested 60% in the S&P 500, 30% in Treasury bonds, and
10% in Treasury bills) fell to the lowest level in U.S. history, plunging below the level
previously set at the peak of the 1929 market bubble. The chart below shows these
estimates (blue), along with the actual subsequent 12-year total returns that have
followed (red).

Remember that at every bubble peak, actual returns over the most recent 12-year period
(red) have temporarily been higher than one would have projected 12 years earlier
(blue), because market valuations at the end of those 12-year horizons were so extreme.
You can see that, for example, in the difference between projected returns in 1988 and
actual returns over the following 12 years, precisely because valuations 12 years later, at
the 2000 bubble peak, were so extreme. You can see the same kind of gap today. As I’ve
detailed before, those gaps are typically associated with unusually high confidence
among investors and consumers at the bubble peak, and large gaps are typically
followed by violent reversion over the complete market cycle.
We see the same sort of extremes in other valuation measures that have historically
outperformed popular measures like price/forward earnings (see prior market
comments, such as A Striking Collection of Duck-Like Features, for data and analytical
background on the cyclical variation of profit margins).
Yes, interest rates are low, but with them, so are the discount rates and long-term returns that are embedded into current prices. Indeed, the most reliable valuation measures suggest that stock prices are presently about three times the level that would imply future long-term returns close to the historical norm.
During the midst of the 2000-2002 bear market, Warren Buffet gave an interview in
Fortune magazine, observing that ratio of stock market capitalization to GDP “is
probably the best single measure of where valuations stand at any given moment. And
as you can see, nearly two years ago the ratio rose to an unprecedented level. That
should have been a very strong warning signal.”
At present, that ratio is even more extreme than at the 2000 peak. For our part, we find
that the ratio of nonfinancial market capitalization to corporate gross value added
(including estimated foreign revenues) is even more reliable across history, and reflects a
more “apples-to-apples” comparison. Still, the differences between the best performing
valuation measures are rather minor in the sense that all of them uniformly suggest that
even a cycle completion to historically run-of-the-mill valuation levels would imply a 50-
65% market loss from recent extremes.

Specifically, if market valuations merely touch their long-term historical norms, without
breaking to undervalued levels (as they did as recently as 2009), the S&P 500 would lose
about two-thirds of its value. If instead valuations end this cycle at the highest levels ever
observed at the completion of a market cycle (October 2002, though even those lows
were breached several years later), the S&P 500 would lose about half of its value.
Emphatically, neither of those possibilities represents a “worst case” scenario. Given that
most market cycles end at valuations well below historical norms, a projected 50-65%
market loss over the completion of this cycle is actually somewhat optimistic.
Last week, our estimate of prospective 12-year nominal annual total returns on a conventional portfolio mix (invested 60% in the S&P 500, 30% in Treasury bonds, and 10% in Treasury bills) fell to the lowest level in U.S. history, plunging below the level previously set at the peak of the 1929 market bubble.
Below is a scatter of the most reliable measure we’ve studied or introduced: nonfinancial
market cap / gross value-added (including estimated foreign revenues). The axis is scaled
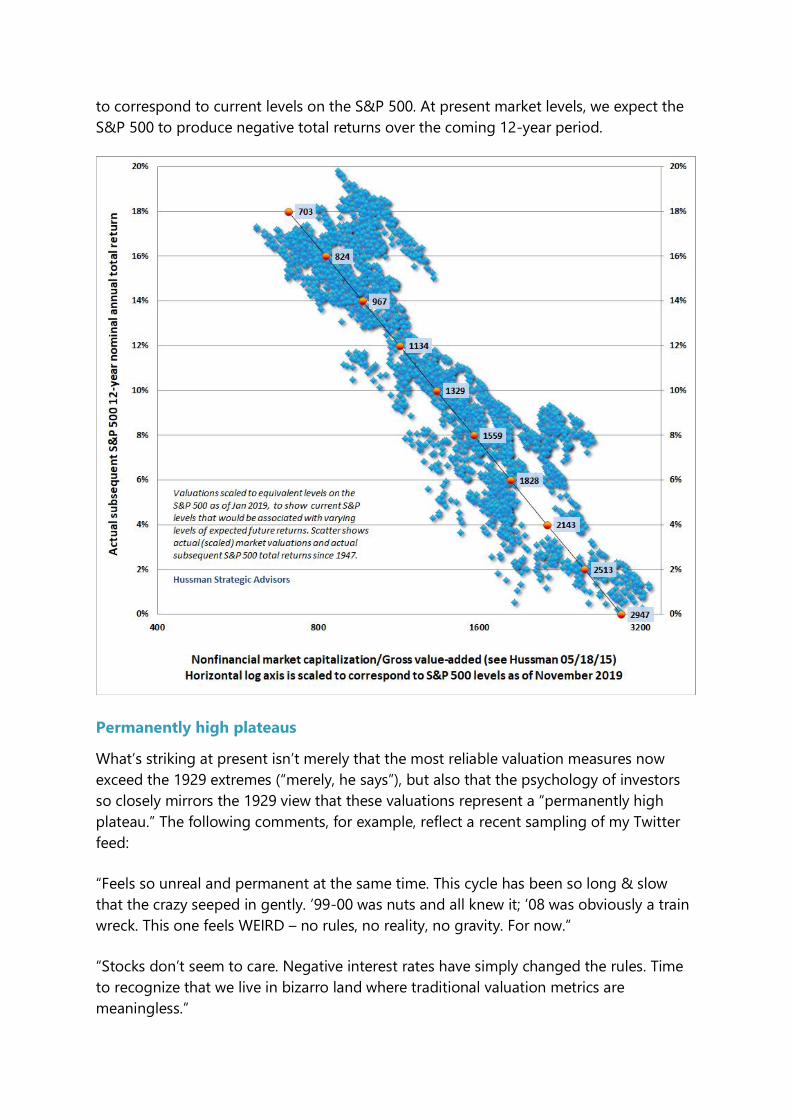
to correspond to current levels on the S&P 500. At present market levels, we expect the
S&P 500 to produce negative total returns over the coming 12-year period.
Permanently high plateaus
What’s striking at present isn’t merely that the most reliable valuation measures now
exceed the 1929 extremes (“merely, he says”), but also that the psychology of investors
so closely mirrors the 1929 view that these valuations represent a “permanently high
plateau.” The following comments, for example, reflect a recent sampling of my Twitter
feed:
“Feels so unreal and permanent at the same time. This cycle has been so long & slow
that the crazy seeped in gently. ’99-00 was nuts and all knew it; ’08 was obviously a train
wreck. This one feels WEIRD – no rules, no reality, no gravity. For now.”
“Stocks don’t seem to care. Negative interest rates have simply changed the rules. Time
to recognize that we live in bizarro land where traditional valuation metrics are
meaningless.”
“What happens if we go 20 years without a recession? Then what?”
“I think ‘growing into valuations’ has to be considered as a realistic possibility, and I
realize that would take >20 yrs. c.f. Japan. In an environment of QE & CBs buying assets
of all sorts, multi-decadal market stagnation without a meaningful pull-back in prices is
possible.”
A few responses to these comments may be useful. First, the sense of a “permanently
high plateau” has marked every bubble extreme in history. Yet if one studies (or lived
through) the market extremes in 1929, 2000, and 2007, there was a general sense –
occasionally expressed but then immediately dismissed – that the markets were extreme,
accompanied by various arguments – like Irving Fisher’s – that the elevated valuations
were “justified” by one thing or another. It was only in hindsight, after those bubbles
collapsed, that the preceding speculative episodes were commonly understood as “nuts.”
On the subject of zero and negative interest rates, there’s no question that the Federal
Reserve’s deranged policies amplified speculation during the recent market cycle. Yet it’s
also essential to understand that the response of the stock market to monetary easing is
wholly dependent on whether investors are inclined toward speculation or risk aversion
(which we infer from the uniformity of market internals).
Indeed, the entire cumulative total return of the S&P 500 across history, and even from
the 2007 market peak to the most recent peak in 2019, was accrued during periods when
our measures of market internals were favorable, while the steepest market losses,
including 2007-2009 as well as material market corrections since 2009, occurred when
those measures of market internals were ragged and divergent.
For more on our measures of market internals, and how they interact with various
monetary policy stances, see my July comment, Warning: Federal Reserve Easing Ahead.
Emphatically, both valuations and market internals have performed beautifully during the
recent market cycle. The source of our difficulty in recent years was our bearish response
to historically-reliable speculative “limits.” In the face of zero interest rate policy, those
limits proved useless, and our pre-emptive bearish response to them proved detrimental.
We abandoned that aspect of our investment discipline in late-2017. We now defer
adopting or amplifying a bearish market outlook until our measures of market internals
have explicitly deteriorated.
That adaptation was helpful in 2018, but in 2019 we’ve observed generally negative
internals as the behavior of individual stocks (particularly value-oriented stocks) has
diverged from the behavior of the large capitalization-weighted indices. That’s
historically been an important warning sign.

Frankly, I’m open to bullish arguments that rely on investors ignoring history because
they’ve got a speculative bit in their teeth. The problem is the condition of market
internals doesn’t even support that argument at present.
An explicit improvement in the uniformity of market internals is the main thing that would mitigate our immediate downside expectations. Ideally, we’ll observe a material retreat in valuations first, because we would then have the latitude to adopt a strongly positive or aggressive market outlook (rather than just a neutral or weakly constructive one) in response.
Similarly, we can’t rule out fresh episodes of extreme monetary easing, but even here, it’s
important to remember that (even in recent years) the response of stocks to Fed easing
has historically been dependent on the condition of investor psychology toward
speculation or risk-aversion, which is best inferred from the uniformity of market
internals. Presently, our own measures are still divergent, but that’s what we’ll monitor in
any event.
Even apart from our own measures of internals, the divergence of the broad market from
the capitalization-weighted indices can be observed in very simple “participation”
measures like the percentage of stocks that remain above their own respective 200-day
moving averages. The chart below (h/t barchart.com) shows how participation has
lagged during the recent blowoff advance.
With respect to the U.S. economy, it’s worth remembering two facts. First, the trajectory
of every U.S. economic recovery has followed a very simple mean-reverting path.
Specifically, the “output gap” at the recession low (the difference between actual GDP

and potential GDP as estimated by the CBO) has narrowed at a rate of about 8% per
quarter, utterly regardless of how aggressive or extreme monetary policy has been. That
output gap tends to narrow until it is closed. Sometimes the recovery extends further for
a couple of years, as has been the case in this instance, but economic recoveries are
largely just mean-reverting phenomena.
There’s utterly no reason to imagine that the economy will permanently avoid future
recessions just because the “can” of the recent expansion has been kicked down the road
a bit further, following a very long mean-reverting recovery from a very deep recession
trough that has finally closed the output gap. Indeed, with structural real GDP growth
(trend productivity + labor force growth) down to just 1.6%, even a sustained real GDP
growth rate above 2% would require a further decline in an already depressed
unemployment rate, a strong reversal in trend productivity, or a baby boom in which the
newborns are immediately of working age.
For more on structural GDP and mean-reverting trajectory that U.S. economic recoveries
have taken over time, see my April comment, You Are Here.
While we can’t rule out a “Japan-like” situation of low GDP growth and even low interest
rates in the years ahead, one shouldn’t imagine that this would imply decades of “market
stagnation without a meaningful pull-back in prices.” Yes, Japan cut interest rates
persistently and aggressively throughout the 1990s and has kept them low ever since.
Yes, the median short-term interest rate in Japan since 1990 has been less than one-
quarter of a percent. But stock market investors should also remember that Japan’s
Nikkei stock index lost over 60% from 1990-92, with a 40% loss from 1996-98, a 60% loss
from 2000-03, and a separate 60% loss from 2007-09.
The idea that low interest rates somehow put a “floor” under stock prices is a historically-
uninformed delusion. A market loss on the order of 60% would be wholly consistent with
low interest rates and easy monetary policy, especially at the valuation extremes we
observe at present. Recall that the Fed eased aggressively through the entire 2000-2002
and 2007-2009 market collapses.
Frankly, I’m open to bullish arguments that rely on investors ignoring history because they’ve got a speculative bit in their teeth. The problem is the condition of market internals doesn’t even support that argument at present.
“Buckle up” isn’t a forecast, it’s a precaution
From a shorter-term perspective, we’ve observed a type of market dispersion in recent
sessions that has typically been associated with steep and rather abrupt market plunges,
often representing the first leg of a more extended collapse. If our broader measures of
market internals were favorable, we would place less weight on these signs, but these
short-term signs are also consistent with unfavorable intermediate and long-term

considerations. As I noted in my special interim comment (see Marks of a Phase
Transition), we identify phase transitions by looking for a gestalt – several features that
form a coherent, recognizable whole – in this case reflecting dispersion in leadership
(new highs vs new lows), participation (the % of individual stocks joining a given market
advance), and breadth (advancing vs declining issues) emerging immediately near a
record market high.
We observed this condition on November 20, with a full leadership reversal (new highs
strictly above new lows) the next day, and another instance on Tuesday December 3.
While we’ve already seen a quick 2% market retreat from the market’s highs in the past
two trading sessions, you’ll notice several short yellow bars next to all of those previous
red bars. Those yellow bars indicate single-day S&P 500 declines of 2.9% or more within
12 trading sessions following a given signal. That’s not a forecast, and there’s no
assurance that we’ll observe that outcome in this particular instance. It is, however,
consistent with our broader view.
An explicit improvement in the uniformity of market internals is the main thing that
would mitigate our immediate downside expectations. Ideally, we’ll observe a material
retreat in valuations first, because we would then have the latitude to adopt a strongly
positive or aggressive market outlook (rather than just a neutral or weakly constructive
one) in response.
The recent half-cycle has been admittedly difficult. My bearish response to historically-
reliable “overvalued, overbought, overbullish” syndromes proved detrimental in the face
of zero-interest rate policies that amplified speculation, and we’ve adapted our discipline
to give priority to our measures of market internals – which we use to gauge that
speculation.
Still, it’s worth remembering that I’ve adopted a constructive, unhedged, or leveraged
market outlook after every bear market decline in over three decades. I have every
expectation that such opportunities will emerge over the completion of this market cycle.
The mistake would be to believe in a permanently high plateau.
Estimates of prospective return and risk for equities, bonds, and other financial markets
are forward-looking statements based the analysis and reasonable beliefs of Hussman
Strategic Advisors. They are not a guarantee of future performance, and are not
indicative of the prospective returns of any of the Hussman Funds. Actual returns may
differ substantially from the estimates provided. Estimates of prospective long-term
returns for the S&P 500 reflect our standard valuation methodology, focusing on the
relationship between current market prices and earnings, dividends and other
fundamentals, adjusted for variability over the economic cycle.