Embed Size (px)
Citation preview
Aon Benfield Analytics | Impact Forecasting
Risk. Reinsurance. Human Resources.
Hurricane Maria
Event Recap Report March 2018

Aon Benfield Analytics | Impact Forecasting
Hurricane Maria 2
Table of Contents
Executive Summary 3
Meteorological Recap 4
Event Details 11
Lesser Antilles 11
Greater Antilles 14
Energy Impacts 20
Transportation Impacts 22
Environmental Impacts 24
Historical Comparison 25
Impact Forecasting Reconnaissance Trip 26
Impact Forecasting: Modeled Results 29
Financial Losses 30
Appendix A 31
Appendix B 32
Appendix C 33
Appendix D 34
Contact Information 37
Aon Benfield Analytics | Impact Forecasting
Hurricane Maria 3
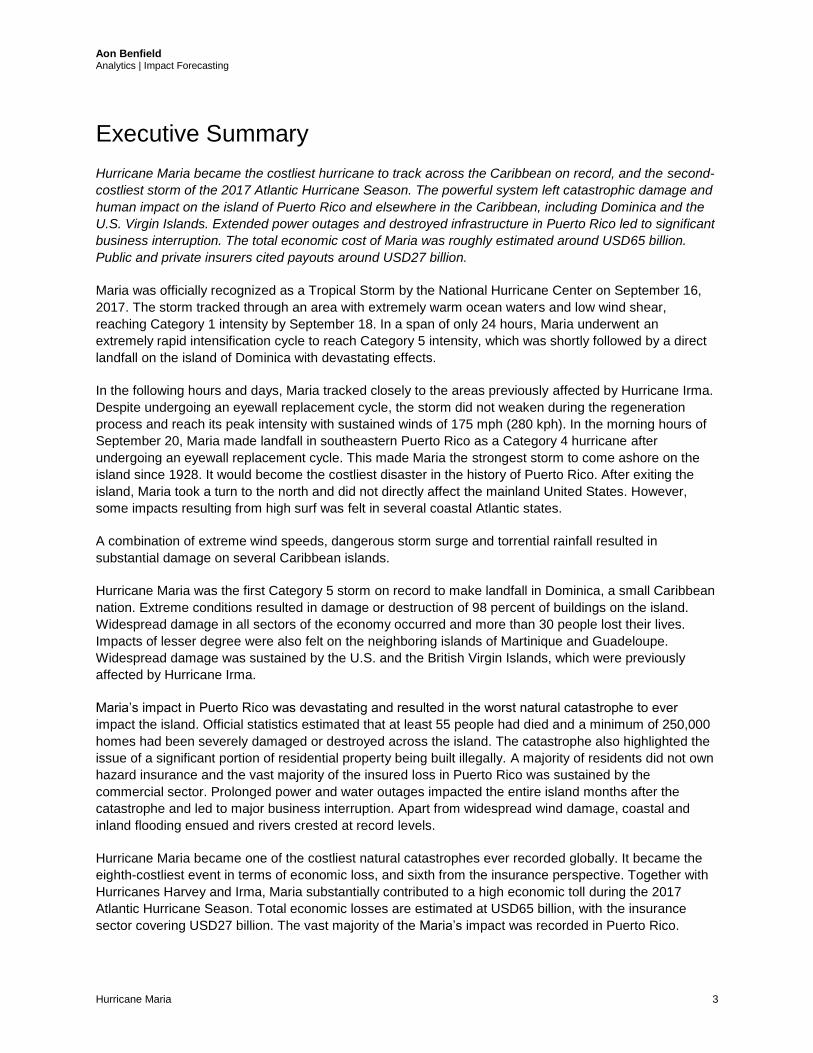
Executive Summary
Hurricane Maria became the costliest hurricane to track across the Caribbean on record, and the second-
costliest storm of the 2017 Atlantic Hurricane Season. The powerful system left catastrophic damage and
human impact on the island of Puerto Rico and elsewhere in the Caribbean, including Dominica and the
U.S. Virgin Islands. Extended power outages and destroyed infrastructure in Puerto Rico led to significant
business interruption. The total economic cost of Maria was roughly estimated around USD65 billion.
Public and private insurers cited payouts around USD27 billion.
Maria was officially recognized as a Tropical Storm by the National Hurricane Center on September 16,
2017. The storm tracked through an area with extremely warm ocean waters and low wind shear,
reaching Category 1 intensity by September 18. In a span of only 24 hours, Maria underwent an
extremely rapid intensification cycle to reach Category 5 intensity, which was shortly followed by a direct
landfall on the island of Dominica with devastating effects.
In the following hours and days, Maria tracked closely to the areas previously affected by Hurricane Irma.
Despite undergoing an eyewall replacement cycle, the storm did not weaken during the regeneration
process and reach its peak intensity with sustained winds of 175 mph (280 kph). In the morning hours of
September 20, Maria made landfall in southeastern Puerto Rico as a Category 4 hurricane after
undergoing an eyewall replacement cycle. This made Maria the strongest storm to come ashore on the
island since 1928. It would become the costliest disaster in the history of Puerto Rico. After exiting the
island, Maria took a turn to the north and did not directly affect the mainland United States. However,
some impacts resulting from high surf was felt in several coastal Atlantic states.
A combination of extreme wind speeds, dangerous storm surge and torrential rainfall resulted in
substantial damage on several Caribbean islands.
Hurricane Maria was the first Category 5 storm on record to make landfall in Dominica, a small Caribbean
nation. Extreme conditions resulted in damage or destruction of 98 percent of buildings on the island.
Widespread damage in all sectors of the economy occurred and more than 30 people lost their lives.
Impacts of lesser degree were also felt on the neighboring islands of Martinique and Guadeloupe.
Widespread damage was sustained by the U.S. and the British Virgin Islands, which were previously
affected by Hurricane Irma.
Maria’s impact in Puerto Rico was devastating and resulted in the worst natural catastrophe to ever
impact the island. Official statistics estimated that at least 55 people had died and a minimum of 250,000
homes had been severely damaged or destroyed across the island. The catastrophe also highlighted the
issue of a significant portion of residential property being built illegally. A majority of residents did not own
hazard insurance and the vast majority of the insured loss in Puerto Rico was sustained by the
commercial sector. Prolonged power and water outages impacted the entire island months after the
catastrophe and led to major business interruption. Apart from widespread wind damage, coastal and
inland flooding ensued and rivers crested at record levels.
Hurricane Maria became one of the costliest natural catastrophes ever recorded globally. It became the
eighth-costliest event in terms of economic loss, and sixth from the insurance perspective. Together with
Hurricanes Harvey and Irma, Maria substantially contributed to a high economic toll during the 2017
Atlantic Hurricane Season. Total economic losses are estimated at USD65 billion, with the insurance
sector covering USD27 billion. The vast majority of the Maria’s impact was recorded in Puerto Rico.

Aon Benfield Analytics | Impact Forecasting
Hurricane Maria 4
Meteorological Recap
The National Hurricane Center (NHC) began watching an organizing cluster of thunderstorms on
September 14 (00:00 UTC) after it had exited the west coast of Africa a few days prior. The agency
initially gave the tropical wave a 30 percent chance of developing into a tropical cyclone during the next
five days. However, the system began to organize more quickly than initially thought and the NHC
declared the system Potential Tropical Cyclone Fifteen on September 16 (15:00 UTC).
During this time, initial tropical storm watches were issued for parts of the Leeward Islands. (Beginning in
2017, the NHC started using the term ‘Potential Tropical Cyclone’ to describe a disturbance that is not yet
a tropical cyclone, but poses the threat of bringing tropical storm or hurricane conditions to land areas
within 48 hours.)
The NHC would officially deem the disturbance a Tropical Depression on September 16 (18:00 UTC) and
Tropical Storm Maria just three hours later. The storm continued to get better organized while tracking
west-northwestward through the Tropical Atlantic Ocean. Steady intensification occurred as Maria moved
through an area with minimal vertical wind shear and extremely warm ocean waters. The cyclone would
officially reach hurricane intensity with 75 mph (120 kph) winds on September 17 (21:00 UTC) while the
outer fringes of the system started to enter the Leeward Islands.
Maria’s explosive 24-hour intensification (Source: NASA, CSU)

Aon Benfield Analytics | Impact Forecasting
Hurricane Maria 5
By September 18, Maria was a Category 1 hurricane with
80 mph (130 kph) sustained winds. During the next 24
hours, it would undergo explosive rapid intensification to
Category 5 intensity. During the 24 hour span between
September 18 (00:00 UTC) and September 19 (00:00
UTC), the NHC projected that Maria would undergo
intensification with a likelihood of becoming a major
hurricane (Category 3 or greater) during the next 24 hours.
One of the more trusted statistically-based intensity
models – known as the SHIPS Rapid Intensification Index
– gave a 51 percent chance of rapid intensification by 30
knots during the upcoming 24 hour timeframe. Maria would
eventually intensify by 70 knots in the 24 hour stretch and
reaching an incredible intensity of 160 mph (260 kph) while
nearing the island of Dominica. The minimum central
pressure would fall from 982 millibars to 925 hours during
this time as well; further signifying Maria’s explosive
growth.
Maria would officially make landfall in Dominica at approximately 9:15 PM local time on September 18
(01:35 UTC September 19) as a Category 5 hurricane with 160 mph (260 kph) winds. This is the first time
on record that a Category 5 storm has made landfall in Dominica.
After landfall, Maria continued to track west-northwestward with slight wobbles as the system initially
started to show signs of an eyewall replacement cycle. This was significant given that the storm had a
small hurricane wind field, with hurricane-force winds only extending roughly 30 miles (45 kilometers)
from the center. Given the small wind radii, this meant that any slight wobble could have a major impact in
terms of wind-driven damage across the rest of the Caribbean.
Hurricane warnings were in effect for much of the northern Caribbean – including the U.S. Virgin Islands,
the British Virgin Islands, Puerto Rico, and other small islands in the Lesser Antilles – on September 19
as Maria moved closer to impacting areas only recently devastated by Hurricane Irma. After moving away
from Dominica, Maria briefly weakened below Category 5 intensity with 155 mph (250 kph) winds, but
would regain Category 5 strength in less than four hours while traversing very warm waters in the
Caribbean.
During the day on September 19, Maria continued to
track west-northwestward towards the Virgin Islands
(British and U.S.) and Puerto Rico. The system
maintained Category 5 strength with 160 mph (260
kph) winds as large swells began to batter many
islands. An eyewall replacement cycle did commence
as the hurricane and tropical storm-force wind field
radii began to expand. However, similarly to Hurricane
Irma, Maria did not weaken during the regeneration
process. In fact, pressure levels continued to drop and
wind speeds slightly increased during the day. The new
peak intensity was 175 mph (280 kph) as minimum
central pressure plunged to 909 millibars.
Maria landfall in Dominica (Source: Meteo France)
Maria’s eyewall passing USVI, September 20 (Source: NOAA)
Aon Benfield Analytics | Impact Forecasting
Hurricane Maria 6
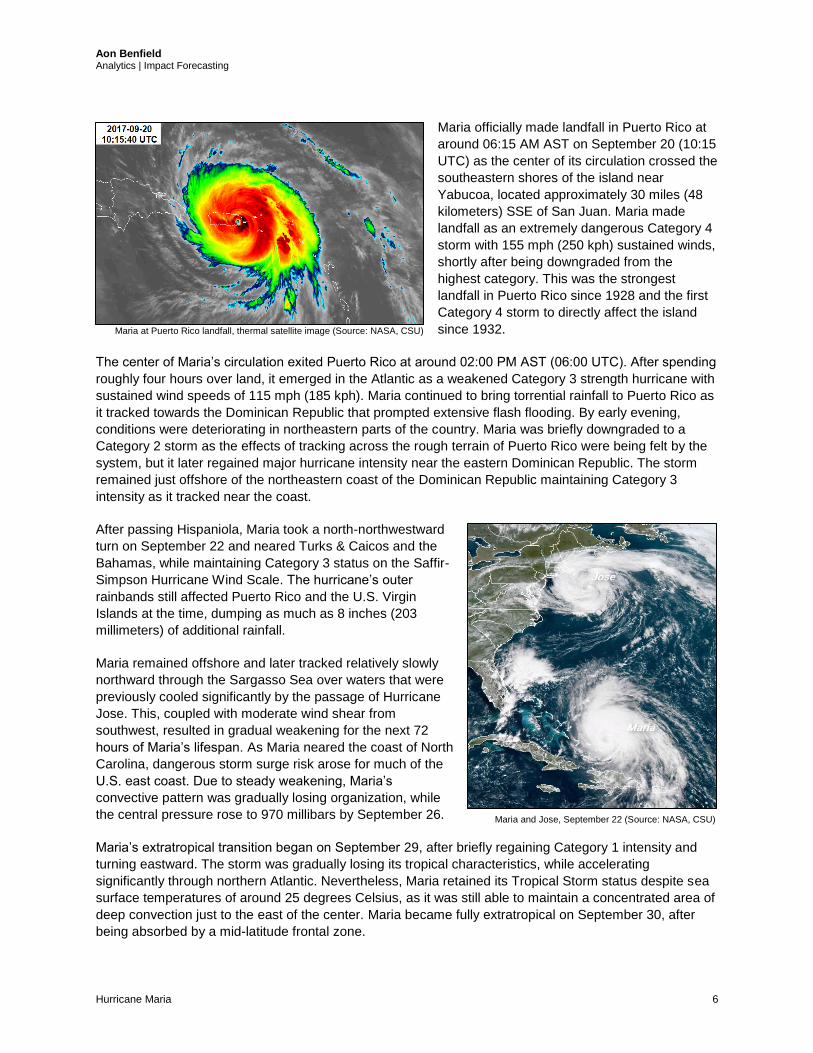
Maria officially made landfall in Puerto Rico at
around 06:15 AM AST on September 20 (10:15
UTC) as the center of its circulation crossed the
southeastern shores of the island near
Yabucoa, located approximately 30 miles (48
kilometers) SSE of San Juan. Maria made
landfall as an extremely dangerous Category 4
storm with 155 mph (250 kph) sustained winds,
shortly after being downgraded from the
highest category. This was the strongest
landfall in Puerto Rico since 1928 and the first
Category 4 storm to directly affect the island
since 1932.
The center of Maria’s circulation exited Puerto Rico at around 02:00 PM AST (06:00 UTC). After spending
roughly four hours over land, it emerged in the Atlantic as a weakened Category 3 strength hurricane with
sustained wind speeds of 115 mph (185 kph). Maria continued to bring torrential rainfall to Puerto Rico as
it tracked towards the Dominican Republic that prompted extensive flash flooding. By early evening,
conditions were deteriorating in northeastern parts of the country. Maria was briefly downgraded to a
Category 2 storm as the effects of tracking across the rough terrain of Puerto Rico were being felt by the
system, but it later regained major hurricane intensity near the eastern Dominican Republic. The storm
remained just offshore of the northeastern coast of the Dominican Republic maintaining Category 3
intensity as it tracked near the coast.
After passing Hispaniola, Maria took a north-northwestward
turn on September 22 and neared Turks & Caicos and the
Bahamas, while maintaining Category 3 status on the Saffir-
Simpson Hurricane Wind Scale. The hurricane’s outer
rainbands still affected Puerto Rico and the U.S. Virgin
Islands at the time, dumping as much as 8 inches (203
millimeters) of additional rainfall.
Maria remained offshore and later tracked relatively slowly
northward through the Sargasso Sea over waters that were
previously cooled significantly by the passage of Hurricane
Jose. This, coupled with moderate wind shear from
southwest, resulted in gradual weakening for the next 72
hours of Maria’s lifespan. As Maria neared the coast of North
Carolina, dangerous storm surge risk arose for much of the
U.S. east coast. Due to steady weakening, Maria’s
convective pattern was gradually losing organization, while
the central pressure rose to 970 millibars by September 26.
Maria’s extratropical transition began on September 29, after briefly regaining Category 1 intensity and
turning eastward. The storm was gradually losing its tropical characteristics, while accelerating
significantly through northern Atlantic. Nevertheless, Maria retained its Tropical Storm status despite sea
surface temperatures of around 25 degrees Celsius, as it was still able to maintain a concentrated area of
deep convection just to the east of the center. Maria became fully extratropical on September 30, after
being absorbed by a mid-latitude frontal zone.
Maria at Puerto Rico landfall, thermal satellite image (Source: NASA, CSU)
Maria and Jose, September 22 (Source: NASA, CSU)
Aon Benfield Analytics | Impact Forecasting
Hurricane Maria 7
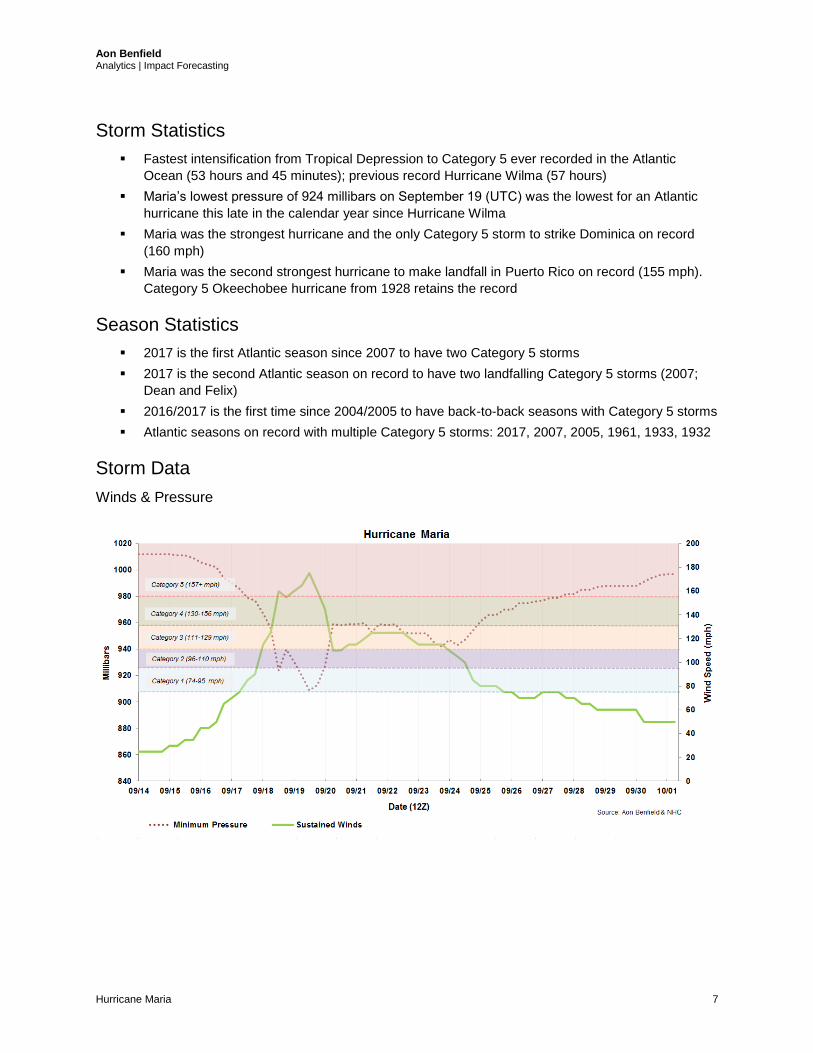
Storm Statistics
Fastest intensification from Tropical Depression to Category 5 ever recorded in the Atlantic
Ocean (53 hours and 45 minutes); previous record Hurricane Wilma (57 hours)
Maria’s lowest pressure of 924 millibars on September 19 (UTC) was the lowest for an Atlantic
hurricane this late in the calendar year since Hurricane Wilma
Maria was the strongest hurricane and the only Category 5 storm to strike Dominica on record
(160 mph)
Maria was the second strongest hurricane to make landfall in Puerto Rico on record (155 mph).
Category 5 Okeechobee hurricane from 1928 retains the record
Season Statistics
2017 is the first Atlantic season since 2007 to have two Category 5 storms
2017 is the second Atlantic season on record to have two landfalling Category 5 storms (2007;
Dean and Felix)
2016/2017 is the first time since 2004/2005 to have back-to-back seasons with Category 5 storms
Atlantic seasons on record with multiple Category 5 storms: 2017, 2007, 2005, 1961, 1933, 1932
Storm Data
Winds & Pressure

Aon Benfield Analytics | Impact Forecasting
Hurricane Maria 8
Rainfall (Puerto Rico)
Location Storm Total Rainfall (in.) Location Storm Total Rainfall (in.)
Garcia, PR 37.90 Bayamon, PR 16.40
Villalba, PR 27.80 Cambalache, PR 14.70
Lomas, PR 23.90 Lago Cidra, PR 12.20
Sumidero, PR 23.40 Bairoa, PR 12.20
Aibonito, PR 22.80 Marueno, PR 11.70
Lago El Guineo, PR 19.20 Maricao, PR 11.10
Coamo, PR 18.80 Pole Ojea, PR 7.90
Caguas, PR 18.50 Coco, PR 7.60
Utuado, PR 18.40 Maria Antonio, PR 7.10
Comerio, PR 17.50 Lares, PR 6.90
Yauco, PR 16.70 Naguabo, PR 6.30
Jagual, PR 16.50
While most focus from Maria was on the wind and storm surge component to the event, there was
extensive rainfall that affected much of the island. As seen in the table above and the graphics below,
rainfall totals in excess of 10 inches was widespread, including specific locations in southeast Puerto Rico
that recorded nearly 38.00 inches. A study by NOAA indicated that in one 12-hour time interval at landfall,
rainfall rates with an estimated return period of 1-in-1,000 years (or a 0.01 percent chance of happening
in any given year) were cited across eastern, central and western parts of the island.
Source: NOAA

Aon Benfield Analytics | Impact Forecasting
Hurricane Maria 9
Wind Speeds (Puerto Rico, US Virgin Islands)
*Measuring equipment was damaged by Hurricane Maria. The NWS
Doppler radar located near San Juan, Puerto Rico (see photo on the
left) was also destroyed. The radome of the radar together with its
tower was supposed to be capable of withstanding winds of up to 134
mph (216 kph).
Location Maximum Sustained Wind
(mph)
Maximum Wind Gust
(mph)
Minimum Pressure
(mb)
Buck Island, USVI* 106 137 952.1
Christiansted, St. Croix, USVI N/A 136 N/A
Salinas, PR N/A 118 N/A
Frederiksted, St. Croix, USVI N/A 115 N/A
St. Thomas, USVI 71 113 N/A
Savana Island, USVI* 58 89 N/A
Charlotte Amalie, St. Thomas, USVI* 59 87 969.6
San Juan, La Puntilla, PR 56 74 N/A
San Juan, PR 48 69 993.4
Marina Del Rey, PR 39 68 994.0
Roosevelt Roads, PR 48 66 991.0
41052 - BUOY (South of St. John, USVI) 51 64 992.4
41056 - BUOY (Vieques Island, USVI) 49 63 985.7
41053 - BUOY (San Juan, PR) 45 60 988.9
St. Croix, USVI 41 59 N/A
Henry E. Rohlsen Airport, St. Croix, USVI 38 58 995.9
Fajardo, PR 40 56 N/A
Source: NOAA
Source: NOAA

Aon Benfield Analytics | Impact Forecasting
Hurricane Maria 10
Storm Surge & Storm Tide
Location Storm Surge (feet) Storm Tide (feet)
Yabucoa Harbor, PR 5.44 6.00
Mayaguez, PR* 2.56 2.64
Vieques, PR 2.86 3.08
Mona Island, PR 2.50 2.99
Arecibo, PR 2.37 2.43
San Juan Bay, PR 2.35 3.74
Fajardo, PR* 2.35 2.55
Culebra, PR 2.08 2.12
St. Croix 2.07 2.71
St. Thomas, USVI 1.72 2.08
St. John, USVI 1.47 1.93
* preliminary, gauge not in operation (Source: USGS)

Aon Benfield Analytics | Impact Forecasting
Hurricane Maria 11
Event Details
Lesser Antilles
Dominica
Hurricane Maria made a catastrophic landfall on the island
of Dominica shortly after strengthening to Category 5
intensity. According to the prime minister of the tiny
Caribbean nation, Maria left “widespread devastation” in its
wake. Reports out of the island indicated mass devastation
as the vast majority of structures sustained some level of
damage. All communication with the island was severely
disrupted due to extensive damage to telecommunications
and the electrical grid infrastructure. By mid-November, the
government of Dominica reported that 31 people had been
killed while a further 37 were officially listed as missing, but
presumed dead.
Damage surveys revealed that 98 percent of all of Dominica’s buildings sustained roof damage while
approximately half sustained damage to the building framework. This left more than 50,000 of the
country’s 73,000 residents directly affected. The worst of the damage was sustained in the eastern part of
the island and in remote rural areas. The United Nations reported that it had conducted a survey of nearly
30,000 buildings and discovered that 44 percent were destroyed or severely damaged, 28.5 percent
experienced damage to at least one-quarter of its structure, and another 27 percent had minor damage to
the roof. The actual breakout counts included destroyed (4,804 homes), severe damage (6,559),
moderate damage (7,209), and minor damage (6,764). Of these totals, 163 facilities were educational
facilities such as schools (108) and daycare centers. All 13,575 students on the island were affected.
The Food and Agricultural Organization reported a
100-percent loss to the agricultural industry in
Dominica which employed 25 percent of the country’s
workforce at the time of Maria’s landfall and, over the
past five years, contributed on average 15 percent of
the country’s Gross Domestic Product (GDP). Severe
damage was additionally noted to farm buildings and
infrastructure (both traffic and irrigation), forest
reserves, and coastal fisheries. Unconfirmed
numbers of cattle, sheep, goats, pigs, poultry, and
other livestock were also lost. Fisheries were
additionally affected.
Maria was the first Category 5 hurricane on record to make landfall in Dominica. The previous record was
Hurricane David, which struck Dominica 38 years previously at Category 4 strength. That storm, which
brushed the southern coast of the island, left at least 37 people dead and the national economy
devastated. More recently, 2015’s Tropical Storm Erika caused more than USD500 million (2018 USD) in
damage – which equaled 90 percent of the country’s GDP. Prior to Maria’s landfall, Dominica was still
recovering from Erika’s flood impact.
Roseau, Dominica (Source: AFP)
Source: IRIN

Aon Benfield Analytics | Impact Forecasting
Hurricane Maria 12
In an Initial Post-Disaster Needs Assessment, conducted by the World Bank, the United Nations, the
Caribbean Development Bank, the Eastern Caribbean Central Bank and the European Union in
September 2017 it was revealed that the total direct damage inflicted in Dominica amounted to at least
XCD2.51 billion (USD931 million). Further indirect losses in agriculture, tourism and other sectors
amounted to an estimated XCD1.0 billion (USD382 million), bringing the preliminary total estimate of
damage to nearly USD1.4 billion, or 167 percent of the island’s GDP (USD525 million). Additional
assessments were ongoing by the aforementioned organizations, with a more complete detailed
summary to help assess the sustainability of the nation’s development goals.
A summary of damage and losses per sector, as provided in the executive summary of the initial
assessment, is provided in the chart below. The highest direct damage occurred on residential property
and on infrastructure. Losses can be defined as lost economic value of goods and services due to
business interruption, lost revenue, decreased number of tourists coming to the country, etc. The highest
indirect losses are expected in agriculture, as Maria’s impacts will likely affect the sector in the long-term
due to a combination of factors, including lost yields, damaged or destroyed equipment, temporary loss of
workforce and high cost of recovery.
Death toll: 31+ dead; 34+ missing
Economic loss: Billions USD (preliminary: USD1.4 billion)
Insured Loss: USD19.3 million (partial; Caribbean Catastrophe Risk Insurance Facility payment)
55
2
30
70
20
354
74
11
5
182
33
24
48
19
3
125
1
0
7
71
29
3
7
3
53
33
40
8
3
1
Agriculture
Fisheries
Forestry
Commerce
Tourism
Housing
Education
Health
Culture
Transport
Electricity
Water and Sanitation
Telecommunication
Airports and Ports
Disaster Risk Management
Pro
ductive S
ecto
rS
ocia
l S
ecto
rIn
frastr
uctu
re
Damages (Direct) Losses (Lost Economic Value) (USD millions)

Aon Benfield Analytics | Impact Forecasting
Hurricane Maria 13
French Caribbean (Guadeloupe & Martinique)
Power outages across Guadeloupe in the aftermath of
Maria affected some 80,000 people – 40 percent of the
country’s population. At least two people were killed while
two others were listed as missing following the capsizing
of their boat near La Desirade Island, east of the main
island of Guadeloupe. Extensive damage to roofs was
reported along with significant damage to vegetation in
Marie-Galante, La Desirade, and Les Santes. Several
areas of flooding were also reported in the aftermath of
Maria across the island, particularly in and around the
southern town of Basse-Terre.
Severe damage was reported to the agriculture sector as banana crops were decimated. Production of
the crop dropped to zero following the passage of Maria and was expected to remain at that level until
May 2018. Production for 2018 was forecast to account for just one-third of normal production. Total
economic damage to agriculture alone was listed at EUR50 million (USD62 million).
According to preliminary estimates of the French Ministry of Economy, the total economic loss on
Guadeloupe were minimally listed at EUR100 million (USD120 million), but expected to be higher.
Maria skirted the island of Martinique with the center of
the eye located approximately 25 miles (40 kilometers) off
the island’s coast. At least two people were injured.
Immediately following the passage of the storm, damage
surveys conducted by local Civil Security revealed that the
damage in Martinique was “minor” and “insignificant”.
Nevertheless 70,000 homes were left without power and
50,000 were deprived of water supply on the island. The
majority of those affected were in the communes of
Morne-Rouge and Gros-Morne.
Similarly to Guadeloupe, significant damage was reported to the agriculture sector as 70 percent of the
banana crop was badly affected. In the immediate aftermath of Maria, production of the crop dropped to
zero and was expected to remain at that level until May 2018. Production for 2018 was forecast to
account for just one-third of normal production. Total economic damage to agriculture was listed at
EUR35 million (USD44 million).
The French Insurance Federation (FFA) noted in early November, that 16,600 claims had been filed in
both Guadeloupe and Martinique, amounting to a total insured loss of at least EUR80 million (USD94
million). The agency noted that the total loss is likely to be revised upwards.
Death toll: 4 dead or missing
Economic loss: Hundreds of millions USD, including USD100 million to the agriculture sector alone
Insured Loss: USD94 million (16,600 claims)
Basse-Terre, Guadeloupe (Source: Reuters)
Fort-de-France, Martinique (Source: AFP)
Aon Benfield Analytics | Impact Forecasting
Hurricane Maria 14
Greater Antilles
U.S. & British Virgin Islands
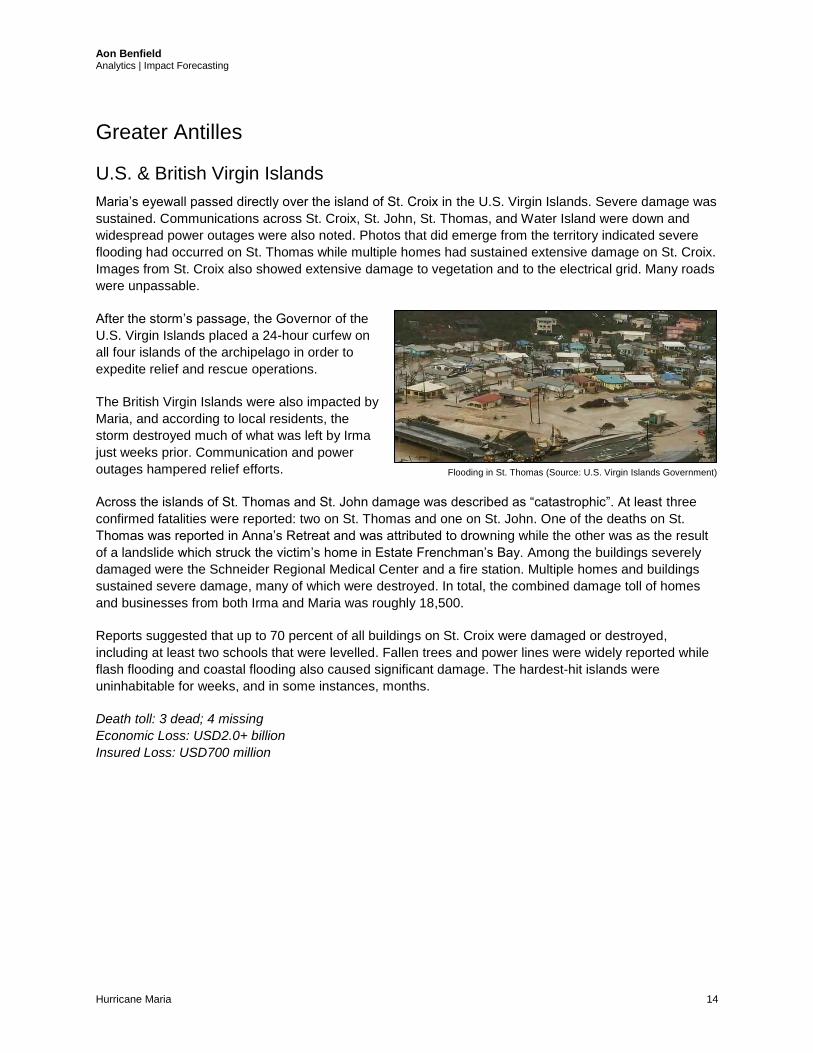
Maria’s eyewall passed directly over the island of St. Croix in the U.S. Virgin Islands. Severe damage was
sustained. Communications across St. Croix, St. John, St. Thomas, and Water Island were down and
widespread power outages were also noted. Photos that did emerge from the territory indicated severe
flooding had occurred on St. Thomas while multiple homes had sustained extensive damage on St. Croix.
Images from St. Croix also showed extensive damage to vegetation and to the electrical grid. Many roads
were unpassable.
After the storm’s passage, the Governor of the
U.S. Virgin Islands placed a 24-hour curfew on
all four islands of the archipelago in order to
expedite relief and rescue operations.
The British Virgin Islands were also impacted by
Maria, and according to local residents, the
storm destroyed much of what was left by Irma
just weeks prior. Communication and power
outages hampered relief efforts.
Across the islands of St. Thomas and St. John damage was described as “catastrophic”. At least three
confirmed fatalities were reported: two on St. Thomas and one on St. John. One of the deaths on St.
Thomas was reported in Anna’s Retreat and was attributed to drowning while the other was as the result
of a landslide which struck the victim’s home in Estate Frenchman’s Bay. Among the buildings severely
damaged were the Schneider Regional Medical Center and a fire station. Multiple homes and buildings
sustained severe damage, many of which were destroyed. In total, the combined damage toll of homes
and businesses from both Irma and Maria was roughly 18,500.
Reports suggested that up to 70 percent of all buildings on St. Croix were damaged or destroyed,
including at least two schools that were levelled. Fallen trees and power lines were widely reported while
flash flooding and coastal flooding also caused significant damage. The hardest-hit islands were
uninhabitable for weeks, and in some instances, months.
Death toll: 3 dead; 4 missing
Economic Loss: USD2.0+ billion
Insured Loss: USD700 million
Flooding in St. Thomas (Source: U.S. Virgin Islands Government)

Aon Benfield Analytics | Impact Forecasting
Hurricane Maria 15
Puerto Rico
Maria made its second landfall in Puerto Rico in the morning hours of September 20, bringing life-
threatening wind, storm surge and very heavy rainfall. Data from the National Weather Service indicated
that more than 80 percent of Puerto Rico received at least 10.0 inches (254 millimeters) of rainfall. A peak
rainfall total of 37.90 inches (963 millimeters) was recorded at Caguas, making Maria the wettest storm to
affect Puerto Rico since 1956 when Tropical Depression Fifteen in 1970 brought 41.70 inches (1,059
millimeters) of rain to Jayuya.
Prior to the arrival of Maria, more than 13,000 residents were evacuated to emergency shelters across
the island. The government of Puerto Rico officially listed the death toll at 55, including 26 direct fatalities
and 29 indirect fatalities. They additionally listed that 60 people were missing. Officials later reported that
472 more deaths occurred in Puerto Rico during the month of September 2017 compared to September
2016 leading many to speculate that Maria’s death toll was actually much higher. Several more people
were injured as tremendous wind gusts and excessive rainfall caused substantial flooding.
In the immediate aftermath of landfall, Maria prompted a country-wide power blackout – 100 percent of
the territory – as it decimated the power grid and destroyed telecommunication towers. It should be noted
that prior to Maria’s arrival, approximately 70,000 of the island’s 3.4 million residents remained without
power after Hurricane Irma grazed the country on September 6. The Puerto Rico Electric Power Authority
(PREPA) reported that much of the country was expected to remain without power for up to six months
(or longer) as the damage Maria inflicted to the grid was so severe. According to reports from PREPA, the
damage inflicted was historic and every part of the system was affected from transmission towers to
hydro-electric dams. They additionally noted that they had lost approximately 80 percent of their
transmission and distribution infrastructure.
Two weeks after the storm, on October 4, it was
reported that 95 percent of electricity customers
remained without power and 55 percent of the
population did not have access to clean drinking water
supplies. While power and water restoration occurred,
it was gradual in reaching all customers across the
island. As of late February 2018, roughly 20 percent –
or 253,000+ customers – remained without electricity.
At least 60 percent of residents were also without
access to clean water at the event’s peak, though most
water service had been restored. Guayama, Puerto Rico (Source: Reuters)
Damage to buildings and electrical grid (Source: Puerto Rico Governor)

Aon Benfield Analytics | Impact Forecasting
Hurricane Maria 16
Structural Damage
Structural damage was substantial across the entire island.
While most of the impacts resulted from wind-related
damage, there were also a notable percentage of structures
impacted by coastal flooding and inland riverine and flash
flooding. Puerto Rico, which had been severely affected by
an extended financial crisis well prior to Maria’s landfall, was
already marked by a significant portion of structures built
illegally and not to code. An extended study by The Miami
Herald in February 2018 highlighted that 44 percent of the
Puerto Rican population lived at or below the poverty level.
Given this reality, many homes had been constructed very
poorly and stood no chance against Maria’s high-end
Category 4 wind speeds at the time of landfall.
Statistics from the Puerto Rican government indicated that at least 250,000 homes had been severely
damaged, including 70,000 of those listed as destroyed. It was anticipated that final statistics would
indicate more than 300,000 homes with major damage. FEMA noted that at least 60,000 homes had roof
damage.
Despite new building code requirements in 2011 mandating that structures be built to withstand winds of
up to 140 mph (220 kph), the reality is that most homes were constructed under the previous code –
which required that structures be able to withstand winds of up to 125 mph (205 kph). Maria made landfall
with estimated sustained wind speeds of 155 mph (250 kph). It has been reported that as many as one
million homes in Puerto Rico – or half of the entire home building stock – had been built illegally and
without proper permits. Given Maria’s intensity and the reality of the poor construction of so many
structures, this enhanced the scope of structural damage in many communities.
Puerto Rico’s governor requested at least
USD31 billion to help repair and rebuild
homes in the territory, though The Miami
Herald study highlighted that many residents
in the poorest communities had rebuilt their
homes on their own using the same materials
as before (such as zinc roofing).
However, it is worth noting that many parts of
Puerto Rico, including San Juan, had many
homes and structures built to code that
performed very well. A sizeable portion of
Puerto Rico’s residential building stock
includes reinforced concrete bunker-type construction. This type of construction is known to be well-
performing during high intensity wind events, and it was confirmed during Maria.
During a damage survey of the island, Impact Forecasting determined that the only cases in which
concrete bunker homes incurred damage was when wood-frame or unreinforced masonry rooms or
porches were added. Other cases included when residents were not able to afford paying for an entire
concrete home and mixed other less reliable building materials not up to code. Commercial structures in
Puerto Rico are primarily built with reinforced concrete or reinforced masonry, and did well in Maria.
Poor home construction (Source: Impact Forecasting)
Well performing concrete bunker constructed home (Source: Impact Forecasting)
Aon Benfield Analytics | Impact Forecasting
Hurricane Maria 17
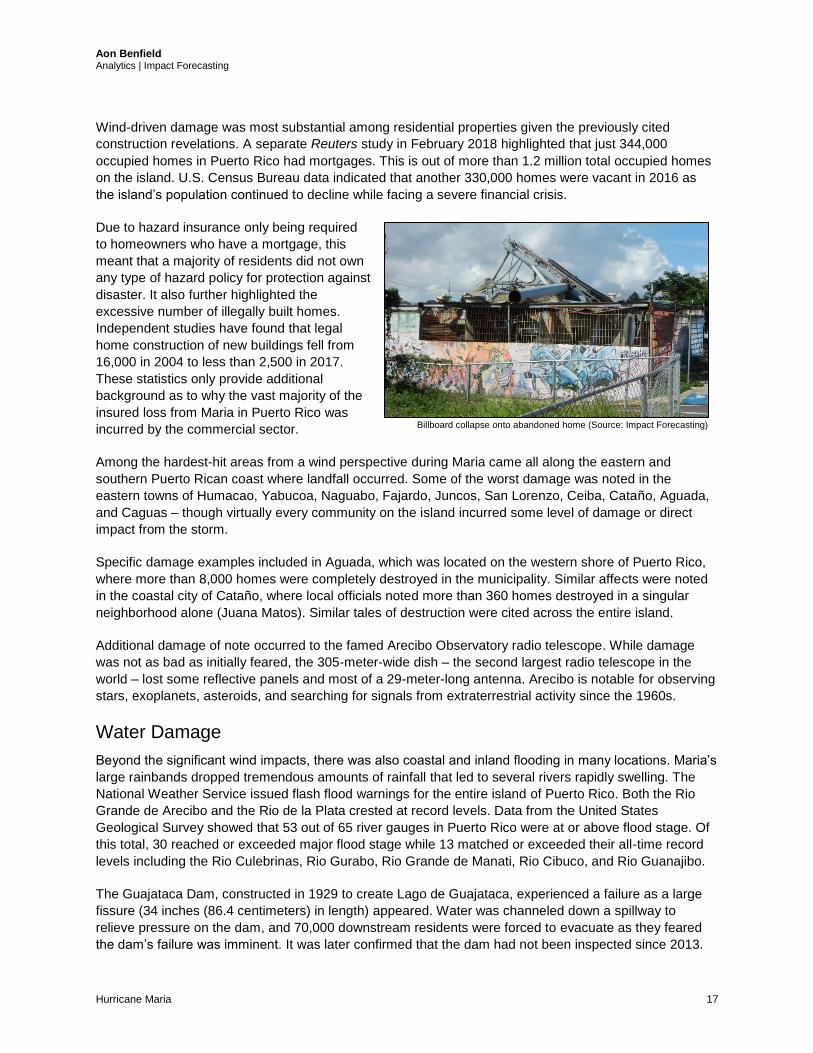
Wind-driven damage was most substantial among residential properties given the previously cited
construction revelations. A separate Reuters study in February 2018 highlighted that just 344,000
occupied homes in Puerto Rico had mortgages. This is out of more than 1.2 million total occupied homes
on the island. U.S. Census Bureau data indicated that another 330,000 homes were vacant in 2016 as
the island’s population continued to decline while facing a severe financial crisis.
Due to hazard insurance only being required
to homeowners who have a mortgage, this
meant that a majority of residents did not own
any type of hazard policy for protection against
disaster. It also further highlighted the
excessive number of illegally built homes.
Independent studies have found that legal
home construction of new buildings fell from
16,000 in 2004 to less than 2,500 in 2017.
These statistics only provide additional
background as to why the vast majority of the
insured loss from Maria in Puerto Rico was
incurred by the commercial sector.
Among the hardest-hit areas from a wind perspective during Maria came all along the eastern and
southern Puerto Rican coast where landfall occurred. Some of the worst damage was noted in the
eastern towns of Humacao, Yabucoa, Naguabo, Fajardo, Juncos, San Lorenzo, Ceiba, Cataño, Aguada,
and Caguas – though virtually every community on the island incurred some level of damage or direct
impact from the storm.
Specific damage examples included in Aguada, which was located on the western shore of Puerto Rico,
where more than 8,000 homes were completely destroyed in the municipality. Similar affects were noted
in the coastal city of Cataño, where local officials noted more than 360 homes destroyed in a singular
neighborhood alone (Juana Matos). Similar tales of destruction were cited across the entire island.
Additional damage of note occurred to the famed Arecibo Observatory radio telescope. While damage
was not as bad as initially feared, the 305-meter-wide dish – the second largest radio telescope in the
world – lost some reflective panels and most of a 29-meter-long antenna. Arecibo is notable for observing
stars, exoplanets, asteroids, and searching for signals from extraterrestrial activity since the 1960s.
Water Damage
Beyond the significant wind impacts, there was also coastal and inland flooding in many locations. Maria’s
large rainbands dropped tremendous amounts of rainfall that led to several rivers rapidly swelling. The
National Weather Service issued flash flood warnings for the entire island of Puerto Rico. Both the Rio
Grande de Arecibo and the Rio de la Plata crested at record levels. Data from the United States
Geological Survey showed that 53 out of 65 river gauges in Puerto Rico were at or above flood stage. Of
this total, 30 reached or exceeded major flood stage while 13 matched or exceeded their all-time record
levels including the Rio Culebrinas, Rio Gurabo, Rio Grande de Manati, Rio Cibuco, and Rio Guanajibo.
The Guajataca Dam, constructed in 1929 to create Lago de Guajataca, experienced a failure as a large
fissure (34 inches (86.4 centimeters) in length) appeared. Water was channeled down a spillway to
relieve pressure on the dam, and 70,000 downstream residents were forced to evacuate as they feared
the dam’s failure was imminent. It was later confirmed that the dam had not been inspected since 2013.
Billboard collapse onto abandoned home (Source: Impact Forecasting)

Aon Benfield Analytics | Impact Forecasting
Hurricane Maria 18
The graphics below show examples of flood damage and river gauge station heights during Maria.
Selected hydrograms from Puerto Rico (Source: USGS)
Flooding in Cataño, Puerto Rico (Source: AFP) Guajataca Dam (Source: El Nuevo Día)

Aon Benfield Analytics | Impact Forecasting
Hurricane Maria 19
Additional Information
More than 30 homes were severely damaged or destroyed on the island of Culebra. Damage to the
electricity grid and other infrastructure was so severe that the island is expected to remain without
electricity and portable water supplies for at least a few weeks. In the aftermath of landfall, media reports
showed large piles of debris and extensive vegetation damage, including numerous downed trees. The
nearby island of Vieques was similarly devastated. At the event’s peak, more than 9,000 inhabitants were
cut off from electricity and any communication channels after extensive impacts were recorded to homes
and infrastructure.
Death toll: Official: 55 dead; 60 missing. Unofficial: Hundreds+ dead
Economic Loss: ~USD62 billion
Insured Loss: ~USD26 billion
Dominican Republic
Nearly 10,000 people were evacuated and all of the country’s major ports were closed in advance of
Maria which prompted widespread flooding in the Dominican Republic.
Five fatalities were reported from the Dominican Republic, while 26,000 were displaced due to
widespread flooding that was caused by Maria’s torrential rainfall. Local Emergency Operations Center
noted that 57 communities were cut off from the outside world, following floods and landslides. According
to preliminary damage assessments, the hurricane caused damage on 14 bridges and numerous
highways. At least 188 homes were destroyed and 861 more were severely damaged. In total, 8,856
homes were reported to be flooded. Nearly a million inhabitants of the country were without water supply
as of September 25. At least 350,000 people were left without power throughout the country.
Damage on infrastructure was preliminary estimated by local authorities at USD63 million. The
agricultural sector was severely impacted. First damage estimates from banana producers were pegged
at USD21 million.
Death toll: 5
Economic loss: USD63 million
Haiti
Maria’s torrential rains caused severe flooding in several locations in Haiti. According to assessments by
the Ministry of Interior, three people were killed as a result of the storm’s passage. Total economic loss is
not expected to be significant.
Death toll: 3
Economic loss: TBD

Aon Benfield Analytics | Impact Forecasting
Hurricane Maria 20
0%
10%
20%
30%
40%
50%
60%
70%
80%
90%
100%
0
10,000
20,000
30,000
40,000
50,000
8-Oct 22-Oct 5-Nov 19-Nov 3-Dec 17-Dec 31-Dec 14-Jan 28-Jan
St. John St. Croix St. Thomas
0%
10%
20%
30%
40%
50%
60%
70%
80%
90%
100%
0
250,000
500,000
750,000
1,000,000
1,250,000
1,500,000
20-Sep 4-Oct 18-Oct 1-Nov 15-Nov 29-Nov 13-Dec 27-Dec 10-Jan 24-Jan 7-Feb 21-Feb
Puerto Rico
Energy Impacts
Electricity
In Dominica, 75 percent of the network infrastructure was estimated to be damaged. An estimated 80 to
90 percent of transformers on the islands were beyond repair. Several power generation stations reported
damage due to wind, landslide or flooding. Damage on the grid and lost revenues were estimated at
approximately USD67 million. It will take at least USD81 million to facilitate the restoration of the network.
More than 80 percent of the island’s residents remained without electricity more than five months after
Maria’s landfall. Additionally, at least 43 water systems were damaged in Dominica at the peak of the
event. This severely limited water access, and as of February 2018, only 31 had been repaired – leaving
26 percent of the country without direct water access.
The electricity grids of Puerto Rico and the US Virgin Islands were virtually decimated. Immediately after
the storm, close to 100% of power supply was down on all of the main islands. It is worth noting that the
blackout was prolonged and significant number of customers was still without power even months after
Maria swept through the region. At the time of this writing in February 2018, hundreds of thousands
continue to endure five-month long outage. Total number of power outages in USVI and Puerto Rico can
be seen in the charts below.

Aon Benfield Analytics | Impact Forecasting
Hurricane Maria 21
Petroleum Ports
All major petroleum-importing ports in Puerto Rico and the US Virgin Islands suffered prolonged closure
and restrictions continued through October. Yabucoa Port with an average import of 38,000 barrels per
day, which suffered direct hit by Maria, remained closed until October 1. Similarly, port in Ponce opened
on October 1. The U.S. Department of Energy reported significant damage in the port of Guayanilla.
By early October, the situation has stabilized as most of the petroleum ports in the region were open with
only some restrictions, including the limitation of all operation to daylight time. Authorities worked to
ensure the delivery of fuel for generators in critical facilities.
Source: NOAA/NASA

Aon Benfield Analytics | Impact Forecasting
Hurricane Maria 22
Transportation Impacts
Airports & Airlines
Both airports located in Dominica sustained damage. At Douglas Charles Airport, the terminal building
was flooded and damage occurred to security, communication and navigation equipment. At Canefield
Airport, the terminal building lost part of its roof and the navigation tower was severely damaged. Apart
from direct damage, losses due to lost revenue are expected are expected to mount as the tourism
industry declines.
Hurricane Maria caused considerable damage to the island’s main airport in San Juan, the busiest airport
in the Caribbean. For several days, the airport was not able to operate due to damage on its
infrastructure, including navigation, communications and fuel systems. Hundreds of passengers were
stranded at the airport for several days in hopes to leave the island. Full operation at the airport did not
fully resume until October 4, 2017.
Roadways
Widespread damage to roadways, bridges and adjacent structures in Dominica resulted in direct
economic damage of at least USD182 million. After the event, majority of local roads were covered by
large amounts of debris, trees and dozens of landslides. On many places, road infrastructure was flooded
and swept away by swollen rivers, which had massive erosive potential due to large amounts of debris
and deposits. At least six major bridges sustained considerable damage. Number of vehicles that were
damaged or destroyed on the island was preliminary estimated between 8 and 14 percent.
Infrastructure damage in Puerto Rico was heavy and widespread. According to initial assessments, there
were at least 1,500 instances of damaged roadways and bridges across the island and the cost of repairs
were estimated to exceed USD240 million.
Railways
Tren Urbano, the only functional railway service in Puerto Rico, which operates in San Juan and nearby
towns and serves thousands of residents, was out of service due to structural damage to several stations
and to the energy infrastructure. Majority of the railway route resumed operation on December 19.No
railways are located in Dominica.
Damaged road in Roseau, Dominica (Source: AFP) Damaged road in Toa Alta, Puerto Rico (Source: AFP)

Aon Benfield Analytics | Impact Forecasting
Hurricane Maria 23
Marine Industry
All major port facilities in Dominica were affected by Hurricane Maria. Buildings located in the Woodridge
Bay Port, including the main office building, were damaged. Further damage occurred in Roseau Cruise
Ship Berth, Portsmouth Port and Cabrits Cruise Ship Bert.
Maria caused damage to San Juan, Puerto Rico’s main port which led to a temporary closure for several
weeks. However, the port was reopened in October 2017 and cruise ships were again able to arrive. In
terms of recreational boats, the U.S. Coast Guard reported in February 2018 that it had used cranes to
remove more than 750 sunken or damaged boats from the water, beaches, or mangroves. This total
represented only a fraction of the assumed total number of boats impacted during the event.
Tourism Industry
According to an official report by the Government of Dominica, at least 666 out of 909 hotel rooms located
on the island were damaged. More than a half will likely be unavailable a year post-landfall. Total direct
damage to the tourism sector was preliminarily estimated at USD20 million, however revenue losses
resulting from the destruction, dysfunctional infrastructure and transport services and recovery costs will
amount to at least USD71 million.
Monthly data provided by the Puerto Rico Tourism Company (PRTC), a governmental body in charge of
tourism-related activities, suggests a dramatic decrease in number of tourists coming to the island after
Maria’s impact in September 2017. After a decade of steady annual growth, Puerto Rico experienced a
drop by more than 15 percent of hotel registrations in comparison with the previous year. 2017 thus
became the year with the lowest number of registrations since 2011. The drop is even more striking when
only the data for the fourth quarter are taken into account. Q4 2017 was the worst fourth quarter for
Puerto Rico tourism industry since 1985, considering total number of registrations, as the agency noted
an almost 70-percent reduction since 2016. Number of local residents who registered in accommodation
facilities in Q4 2017 was the lowest since 1971. Moreover, October 2017 was the worst October since
1965.
0.0
0.5
1.0
1.5
2.0
2.5
3.0
Mil
lio
ns
Total Registrations
Total Registration (Residents)
0.0
0.1
0.2
0.3
0.4
0.5
0.6
0.7
Mil
lio
ns
Q4 Total Registrations
Q4 Total Registrations (residents)

Aon Benfield Analytics | Impact Forecasting
Hurricane Maria 24
Environmental Impacts
Coastal Erosion
The mainland United States was spared from a direct impact of the hurricane. Nevertheless, Maria
triggered notable impacts along the coastline of North Carolina, Virginia and Maryland as it undertook a
sharp turn eastward near Cape Hatteras, maintaining Category 1 intensity. Large waves and storm surge
generated by the storm affected large portions of the shoreline. Prior to the storm’s passage, the United
States Geological Survey suggested that about two thirds of beaches from North Carolina to Maryland
were expected to be impacted by dune erosion and a small portion by overwash.
Flora & Fauna
Hurricane Maria dealt a serious blow to the environment of Dominica, notably to its forests, which are well
protected and considered one of the biggest assets of the local eco-friendly tourism industry. Large
swaths of forest were leveled or defoliated due to the extreme winds. The country is home to an endemic
parrot called Amazona imperialis (also known as Sisserou), which is considered to be the island’s symbol
and is also featured on the national flag. After the storm, there were concerns that the population of the
endangered species might lose part of its natural habitat and decline.
All six of the United States national parks in the Caribbean were closed in the aftermath of Hurricane
Maria. The affected parks were Virgin Islands National Park in Saint John, Virgin Islands Coral Reef
National Monument in Saint John, Christiansted National Historic Site in Saint Croix, Buck Island Reef
National Monument in Saint Croix, Salt River Bay National Historical Park and Ecological Reserve in
Saint Croix, and San Juan National Historic Site in Puerto Rico.
In Puerto Rico the El Yunque National Forest, the United States’ only tropical rainforest, was severely
damaged by Maria. Officials at the International Institute of Tropical Forestry reported that the majority of
trees had been defoliated leaving much of the 28,000-acre (11,330-hectare) forest bare. The forest was
home to some 240 tree species of which 23 were unique to Puerto Rico. The forest’s bird population was
also affected by Maria: dozens of blackbirds and pearly-eyed thrashers were known to have been killed
while the Puerto Rican Parrot Recovery Program expressed concerns over the fate of the endangered
Puerto Rican Parrot which is only found in Puerto Rico and is the only native parrot species in the United
States.

Aon Benfield Analytics | Impact Forecasting
Hurricane Maria 25
Historical Comparison
Dominica
Maria was the most powerful and the costliest tropical system to ever impact the island nation of
Dominica and the only Category 5 hurricane to make landfall there. However, the island faced similar
destruction for the third time in the last 40 years. Hurricane David (1979) made direct hit at southern tip of
Dominica as a powerful, Category 4 hurricane. It caused heavy damage on Dominica, mainly due to a
serious underestimation, unpreparedness and wrong forecasts of the event that initially put the storm’s
track near Barbados. At least 56 people died and three-quarters of the population were left homeless and
the catastrophe prompted influx of foreign aid. The whole agricultural sector, which was comprised mainly
of banana plantations, was destroyed.
Although Erika (2015) impacted Dominica as a weak tropical storm, torrential rainfall associated with it
caused widespread flooding and landslides on the island. The devastation caused by the relentless rain,
which included thousands of damaged homes, resulted in economic cost of nearly USD500 million.
Maria (2017) caused losses that were estimated to reach minimally USD1.3 billion. As the agricultural
sector constitutes one of the pillars of the island’s export, its vulnerability to repeated extreme weather
events affects the whole economy. Despite many successful economic reforms, Dominica retains a
relatively low GDP per capita.
Puerto Rico
Hurricane Maria was the most powerful storm to make landfall in Puerto Rico since 1932, when a
Category 4 storm, known as the San Ciprian Hurricane, came ashore and caused extensive damage on
the island. The only known Category 5 landfall, most commonly referred to as the Okeechobee Hurricane,
came ashore only a few miles to the southwest of Maria’s landfall location near Yabucoa port. The storm,
which is also known in Puerto Rico as Huracán San Felipe II, caused widespread devastation, damaged
tens of thousands of homes and left at least 374 fatalities in its wake.
The only other major Hurricane to directly impact Puerto Rico in the last 100 years was 1989 Hurricane
Hugo. As it brushed off the southeastern tip of the island, it caused major damage to housing, businesses
and infrastructure, particularly in eastern regions. Hurricane George crossed the island in 1998 as a
Category 2 storm and caused exceptional impact.

Aon Benfield Analytics | Impact Forecasting
Hurricane Maria 26
Impact Forecasting Reconnaissance Trip
Members of Aon Benfield’s Catastrophe Management and Impact Forecasting groups traveled to Puerto
Rico for an extended damage assessment from December 4-7, 2017. The surveys included visits to San
Juan and additional eastern communities such as Carolina, Luquillo, Fajardo, Ceiba, Humacao, Palmos
del Mar, Gurabo, and Juncos – among others.
Among the most notable findings:
1) Residential homes built to proper code often escaped with minimal damage. The most common
well-performing building type was of concrete construction with a bunker-style frame. However,
many homes outside of San Juan were built with non-code, wood-frame construction and/or
additions that suffered extensive, total loss damage.
2) Commercial properties were also prone to wind-related damage, but the loss was more
associated with roof or façade impacts. Most properties visited maintained their structural integrity
despite notable loss of shingles, storefronts or outdoor signage.
Concrete construction built to proper code (Source: Impact Forecasting) Failed add-on structure (Source: Impact Forecasting)
Storefront damage in Humacao (Source: Impact Forecasting) Storefront damage in Humacao (Source: Impact Forecasting)

Aon Benfield Analytics | Impact Forecasting
Hurricane Maria 27
3) A significant portion of observed damage to singular and multi-unit commercial structures was
incurred due to water intrusion. In many instances, windows were shattered by high winds and
heavy rains led to inside water accumulation. With Puerto Rico’s warm and humid climate,
standing water led to major formation of mold on inside walls and contents. Additional water
intrusion resulted from roof damage and subsequent leakage.
4) The scope of infrastructure damage – roads, bridges, electrical grid, solar farms, wind farms –
was staggering across the island. The quality of infrastructure was already poor prior to Maria’s
arrival, and the intensity of the storm’s impacts left complete devastation. The damage will require
a complete rebuild of the energy-producing grids in Puerto Rico.
5) Even with the best construction, some roofs and façades struggled with wind speeds gusting in
excess of 160 mph (260 kph) – especially at elevated locations, where wind speeds are often one
category higher in intensity. Spanish tile roof shingles were entirely stripped bare in some cases.
Water leakage from roof (Source: Impact Forecasting) Standing water resulted in mold formation (Source: Impact Forecasting)
Example of electrical grid damage (Source: Impact Forecasting) Partial destruction to solar panel farm (Source: Impact Forecasting)
Spanish tile roof shingles stripped by winds (Source: Impact Forecasting) Spanish tile roof shingles stripped by winds (Source: Impact Forecasting)

Aon Benfield Analytics | Impact Forecasting
Hurricane Maria 28
6) The biggest unknown regarding financial losses in the aftermath of Maria was the business
interruption component. Many businesses from a wide breadth of sectors – including retail,
hospitality, agriculture, energy, manufacturing, etc. – reported varying lengths of lost productivity
or revenue. In the case of direct physical damage leading to business interruption, many
instances involved high winds leading to roof damage or shattered windows that prompted
significant water damage. This required complete indoor repair and replacement of contents.
Additional damage incurred to infrastructure had secondary or tertiary effects to many sectors.
Many businesses informed during the survey that operations may not fully occur until a full
calendar year after Maria’s landfall.
7) Beyond wind impacts, many inland areas in Puerto Rico were subject to catastrophic flash flood,
riverine, and landslide damage. Given the island’s mountainous terrain, a substantial volume of
water cascaded down and turned small rivers and streams into raging torrents. This led to major
infrastructure damage and also swept through nearby homes and businesses.
Prolonged business shutdown (Source: Impact Forecasting) Broken windows led to water intrusion (Source: Impact Forecasting)
Remnant debris from river overflow (Source: Impact Forecasting) Riverine & flash flood damage debris (Source: Impact Forecasting)

Aon Benfield Analytics | Impact Forecasting
Hurricane Maria 29
Impact Forecasting: Modeled Wind Result for Puerto Rico
The track of Hurricane Maria through the U.S. Virgin Islands and Puerto Rico was reconstructed using the
preliminary best-track data from the National Hurricane Center’s Automated Tropical Cyclone Forecasting
system (ATCF). The ATCF, developed by the US Naval Research Laboratory, is a computer based
application designed to automate and optimize the forecasting process of tropical cyclones. The NHC and
the Joint Typhoon Warning Center (JTWC), among other institutes, are the operational users of the
ATCF.
The parameters utilized in the reconstruction included the position of hurricane eye (latitude and
longitude), minimum central pressure, forward speed, heading angle, and radius of maximum winds that
were reported in 6-hour increments. These hurricane parameters were imported into the wind field model
to calculate wind speeds. These wind speeds were next used in Impact Forecasting’s ELEMENTS
software program to estimate the potential insurable losses caused by the hurricane.
The Impact Forecasting wind field model is a spectral-based parametric model that solves equations of
motion by using the finite difference method. The wind field model has been calibrated, both spatially and
temporally, to the surface winds. The wind speed footprint, as modeled by Impact Forecasting, for
Hurricane Maria is presented below. This footprint has general agreements with the wind speed swath
from the NHC.
Impact Forecasting Modeled Loss Results
Based on the modeled results of Impact Forecasting’s wind model, it was determined that insurable
losses resulting from Hurricane Maria in Puerto Rico would range between USD19 and 23 billion. Please
note that “insurable losses” does not indicate the total economic loss estimate, nor the insured loss
estimate. This only includes the value of properties (homes, businesses, vehicles) that are potentially
insured by the private market. It does not include additional damage to such things as infrastructure.
Source: Impact Forecasting

Aon Benfield Analytics | Impact Forecasting
Hurricane Maria 30
Financial Losses
Hurricane Maria became of the costliest natural catastrophes ever recorded globally. With an aggregated
economic toll estimated around USD65 billion, it currently ranks as the eighth costliest natural
catastrophe, one place higher than Hurricane Irma. Insured losses, totaling to USD27 billion, place Maria
on the sixth place among the costliest events for the insurance industry. It also became the fourth
costliest tropical cyclone on record after Katrina (USD157 billion in 2018 US dollars), Harvey (USD100
billion) and Sandy (USD77 billion). From the insurance perspective, Maria ranks fifth after Hurricanes
Katrina, Harvey, Sandy, and Andrew when adjusting on an inflation-basis.
Maria caused devastating losses on several Caribbean islands. It became the costliest disaster to ever
strike Puerto Rico and the strongest storm since a Category 5 storm blasted the island in 1928, in an era
when total exposure was incomparable to today’s extent. Maria’s footprint was widespread and related to
all sectors and industries, with lasting effects on the economy, which struggled to cope given multiple
long-term issues and economic stagnation. Significant indirect economic loss is expected to linger as
many months after landfall, many areas have yet to fully return to normal. There are local concerns that
Maria may accentuate the economic crisis, which there are fears of further declines in the population.
These population decreases have been occurring throughout the 21st century.
Dominica, a small island nation in the Leeward Islands, suffered from the most devastating event in its
history, when Maria made landfall at its full strength as a Category 5 storm. The hurricane dealt a
substantial blow to the local economy, heavily dependent on agriculture and tourism. Long-term economic
and social impacts will result from the event. According to preliminary assessments, total economic loss
will reach approximately USD1.4 billion or 167 percent of the GDP; in a country with less than 75,000
inhabitants.
Further impacts were felt elsewhere, including the Virgin Islands archipelago, French Overseas territories
in Eastern Caribbean and on Hispaniola.

Aon Benfield Analytics | Impact Forecasting
Hurricane Maria 31
Appendix A
In terms of tropical cyclone development, the official Atlantic Hurricane season runs from June 1 to
November 30 – though tropical cyclones have been known to develop during any month. As seen in the
graphics below, the most likely months for cyclogenesis are during the peak months of August,
September, and October. During these months, atmospheric and oceanic conditions are climatologically
the most conducive for cyclones being influenced and/or steered by a strong Atlantic ridge of high
pressure and/or by the advancement of strong troughs that dig into the central and eastern United States.
The caveat to cyclogenesis is, of course, the eventual track of storms that do develop. While greater
frequency of storms increases the chance of a landfall, the reality is that it only takes one landfalling
storm to entirely change the perception of how active a season is to the general public – regardless of
how many storms actually make landfall in a single season.
Aon Benfield Analytics | Impact Forecasting
Hurricane Maria 32
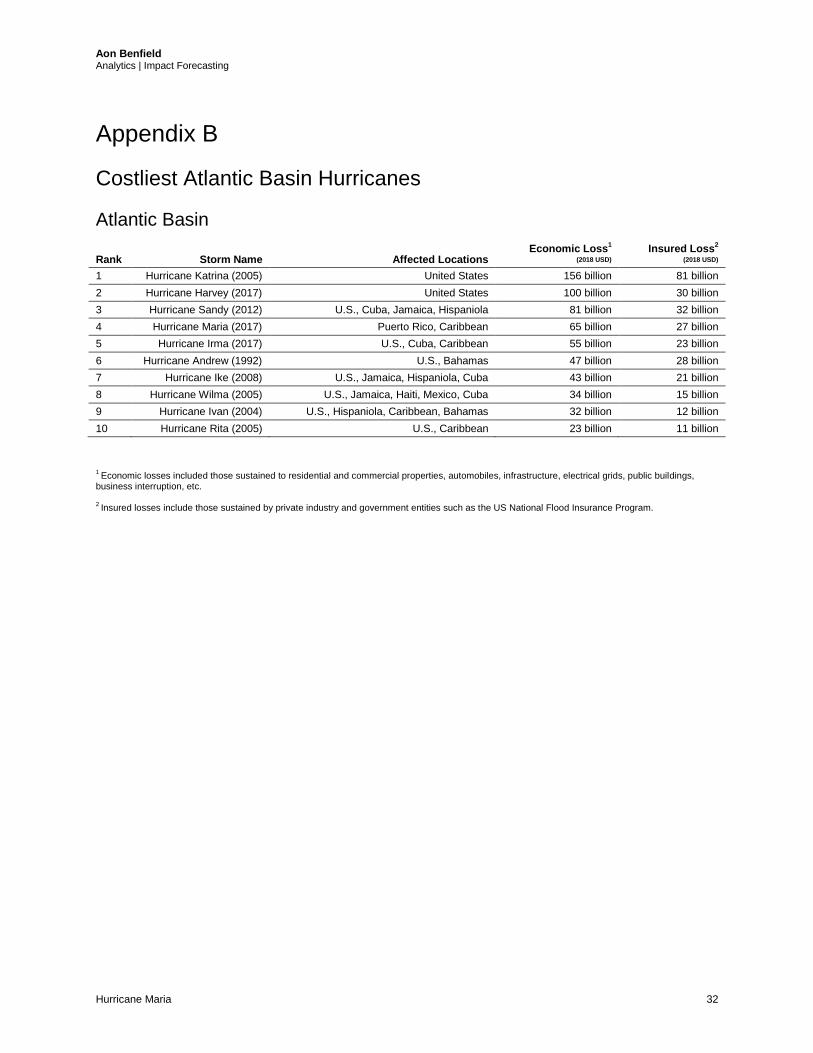
Appendix B
Costliest Atlantic Basin Hurricanes
Atlantic Basin
Rank
Storm Name
Affected Locations Economic Loss
1
(2018 USD) Insured Loss
2
(2018 USD)
1 Hurricane Katrina (2005) United States 156 billion 81 billion
2 Hurricane Harvey (2017) United States 100 billion 30 billion
3 Hurricane Sandy (2012) U.S., Cuba, Jamaica, Hispaniola 81 billion 32 billion
4 Hurricane Maria (2017) Puerto Rico, Caribbean 65 billion 27 billion
5 Hurricane Irma (2017) U.S., Cuba, Caribbean 55 billion 23 billion
6 Hurricane Andrew (1992) U.S., Bahamas 47 billion 28 billion
7 Hurricane Ike (2008) U.S., Jamaica, Hispaniola, Cuba 43 billion 21 billion
8 Hurricane Wilma (2005) U.S., Jamaica, Haiti, Mexico, Cuba 34 billion 15 billion
9 Hurricane Ivan (2004) U.S., Hispaniola, Caribbean, Bahamas 32 billion 12 billion
10 Hurricane Rita (2005) U.S., Caribbean 23 billion 11 billion
1 Economic losses included those sustained to residential and commercial properties, automobiles, infrastructure, electrical grids, public buildings,
business interruption, etc. 2 Insured losses include those sustained by private industry and government entities such as the US National Flood Insurance Program.

Aon Benfield Analytics | Impact Forecasting
Hurricane Maria 33
Appendix C
United States Emergency Declarations
Virgin Islands
Emergency Declaration made on 09/18/2017.
Districts: Saint Croix, Saint John, and Saint Thomas.
Puerto Rico
Emergency Declaration made on 09/18/2017.
Municipalities: Adjuntas, Aguada, Aguadilla, Aguas Buenas, Aibonito, Añasco, Arecibo, Arroyo,
Barceloneta, Barranquitas, Bayamón, Cabo Rojo, Caguas, Camuy, Canóvanas, Carolina, Cataño, Cayey,
Ceiba, Ciales, Cidra, Coamo, Comerío, Corozal, Culebra, Dorado, Fajardo, Florida, Guánica, Guayama,
Guayanilla, Guaynabo, Gurabo, Hatillo, Hormigueros, Humacao, Isabela, Jayuya, Juana Díaz, Juncos,
Lajas, Lares, Las Marías, Las Piedras, Loíza, Luquillo, Manatí, Maricao, Maunabo, Mayagüez, Moca,
Morovis, Naguabo, Naranjito, Orocovis, Patillas, Peñuelas, Ponce, Quebradillas, Rincón, Río Grande,
Sabana Grande, Salinas, San Germán, San Juan, San Lorenzo, San Sebastián, Santa Isabel, Toa Alta,
Toa Baja, Trujillo Alto, Utuado, Vega Alta, Vega Baja, Vieques, Villalba, Yabucoa, and Yauco.
United States Major Disaster Declarations
Virgin Islands
Major Disaster Declaration made on 09/20/2017.
Districts: Saint Croix, Saint John, and Saint Thomas.
Puerto Rico
Major Disaster Declaration made on 09/20/2017.
Municipalities: Adjuntas, Aguada, Aguadilla, Aguas Buenas, Aibonito, Añasco, Arecibo, Arroyo,
Barceloneta, Barranquitas, Bayamón, Cabo Rojo, Caguas, Camuy, Canóvanas, Carolina, Cataño, Cayey,
Ceiba, Ciales, Cidra, Coamo, Comerío, Corozal, Culebra, Dorado, Fajardo, Florida, Guánica, Guayama,
Guayanilla, Guaynabo, Gurabo, Hatillo, Hormigueros, Humacao, Isabela, Jayuya, Juana Díaz, Juncos,
Lajas, Lares, Las Marías, Las Piedras, Loíza, Luquillo, Manatí, Maricao, Maunabo, Mayagüez, Moca,
Morovis, Naguabo, Naranjito, Orocovis, Patillas, Peñuelas, Ponce, Quebradillas, Rincón, Río Grande,
Sabana Grande, Salinas, San Germán, San Juan, San Lorenzo, San Sebastián, Santa Isabel, Toa Alta,
Toa Baja, Trujillo Alto, Utuado, Vega Alta, Vega Baja, Vieques, Villalba, Yabucoa, and Yauco.

Aon Benfield Analytics | Impact Forecasting
Hurricane Maria 34
Appendix D
Glossary: Terms as defined by the National Hurricane Center
Advisory:
Official information issued by tropical cyclone warning centers describing all tropical cyclone watches and
warnings in effect along with details concerning tropical cyclone locations, intensity and movement, and
precautions that should be taken.
Best Track:
A subjectively-smoothed representation of a tropical cyclone's location and intensity over its lifetime. The
best track contains the cyclone's latitude, longitude, maximum sustained surface winds, and minimum sea-
level pressure at 6-hourly intervals. Best track positions and intensities, which are based on a post-storm
assessment of all available data, may differ from values contained in storm advisories.
Direct Hit:
A close approach of a tropical cyclone to a particular location. For locations on the left-hand side of a tropical
cyclone's track, a direct hit occurs when the cyclone passes to within a distance equal to the cyclone's
radius of maximum wind. For locations on the right-hand side of the track, a direct hit occurs when the
cyclone passes to within a distance equal to twice the radius of maximum wind.
Eye:
The roughly circular area of comparatively light winds that encompasses the center of a severe tropical
cyclone. The eye is either completely or partially surrounded by the eyewall cloud.
Eyewall:
An organized band or ring of cumulonimbus clouds that surround the eye, or light-wind center of a tropical
cyclone.
Extratropical:
A term used in advisories and tropical summaries to indicate that a cyclone has lost its "tropical"
characteristics. The term implies both northward displacement of the cyclone and the conversion of the
cyclone's primary energy source from the release of latent heat of condensation to baroclinic (the
temperature contrast between warm and cold air masses) processes. Cyclones can become extratropical
and still retain winds of hurricane or tropical storm force.
Extratropical Cyclone:
A cyclone of any intensity for which the primary energy source is baroclinic, that is, results from the
temperature contrast between warm and cold air masses.
Gale Warning:
A warning of 1-minute sustained surface winds in the range 34 knots (39 mph (63 kph)) to 47 knots (54 mph
(87 kph)) inclusive, either predicted or occurring and not directly associated with tropical cyclones.
High Wind Warning:
A high wind warning is defined as 1-minute average surface winds of 35 knots (40 mph (64 kph)) or greater
lasting for 1 hour or longer, or winds gusting to 50 knots (58 mph (93 kph)) or greater regardless of duration
that are either expected or observed over land.
Hurricane:
A tropical cyclone in which the maximum sustained surface wind (using the US 1-minute average) is 64
knots (74 mph (119 kph) or more.

Aon Benfield Analytics | Impact Forecasting
Hurricane Maria 35
Hurricane Warning: An announcement that hurricane conditions (sustained winds of 74 mph (119 kph) or higher) are expected
somewhere within the specified area of a tropical, subtropical or post-tropical cyclone. The warning can
remain in effect when high water or a combination of high water and waves continue, even though winds
may be less than hurricane-force.
Hurricane Watch:
An announcement that hurricane conditions (sustained winds of 74 mph (119 kph) or higher) are possible
within the specified area of a tropical, subtropical or post-tropical cyclone.
Indirect Hit:
Generally refers to locations that do not experience a direct hit from a tropical cyclone, but do experience
hurricane force winds (either sustained or gusts) or tides of at least 4.0 feet above normal.
Inundation:
The total water level that occurs on normally dry ground as a result of the storm tide, and is expressed in
terms of height above ground level.
Invest:
A weather system for which a tropical cyclone forecast center is interested in collecting specialized data sets
and/or running model guidance. The designation of a system as an invest does not correspond to any
particular likelihood of development of the system into a tropical cyclone.
Landfall:
The intersection of the surface center of a tropical cyclone with a coastline. Because the strongest winds in a
tropical cyclone are not located precisely at the center, it is possible for a cyclone's strongest winds to be
experienced over land even if landfall does not occur. Similarly, it is possible for a tropical cyclone to make
landfall and have its strongest winds remain over the water.
Major Hurricane:
A hurricane that is classified as Category 3 or higher on the Saffir-Simpson Hurricane Wind Scale.
Post-Tropical Cyclone:
This term describes a cyclone that no longer possesses sufficient tropical characteristics to be considered a
tropical cyclone. Post-tropical cyclones can continue carrying heavy rains and high winds. Former tropical
cyclones that have become fully extratropical or remnant lows are two classes of post-tropical cyclones.
Radius of Maximum Winds:
The distance from the center of a tropical cyclone to the location of the cyclone's maximum winds. In well-
developed hurricanes, the radius of maximum winds is generally found at the inner edge of the eyewall.
Rapid Intensification:
An increase in the maximum sustained winds of a tropical cyclone of at least 30 knots (35 mph (55 kph)) in a
24-hour period.
Remnant Low:
A post-tropical cyclone that no longer possesses the convective organization required of a tropical cyclone,
and has maximum sustained winds of less than 34 knots (39 mph (63 kph)).
Storm Surge:
An abnormal rise in sea level accompanying a hurricane or other intense storm, and whose height is the
difference between the observed level of the sea surface and the level that would have occurred in the
absence of the cyclone. Storm surge is usually estimated by subtracting the normal or astronomic high tide
from the observed storm tide.
Storm Tide:
The actual level of sea water resulting from the astronomic tide combined with the storm surge.
Aon Benfield Analytics | Impact Forecasting
Hurricane Maria 36
Storm Warning: A warning of 1-minute sustained surface winds of 48 knots (55 mph (88 kph)) or greater, predicted or
occurring, not directly associated with tropical cyclones.
Subtropical Cyclone:
A non-frontal low-pressure system that has characteristics of both tropical and extratropical cyclones. Like
tropical cyclones, they are non-frontal, synoptic-scale cyclones that originate over tropical or subtropical
waters, and have a closed surface wind circulation with a well-defined center. Unlike tropical cyclones,
subtropical cyclones derive a significant proportion of their energy from baroclinic sources, and are generally
cold-core in the upper troposphere, often being associated with an upper-level low or trough. In comparison
to tropical cyclones, these systems generally have a radius of maximum winds occurring relatively far from
the center and generally have a less symmetric wind field and distribution of convection.
Subtropical Depression:
A subtropical cyclone in which the maximum sustained surface wind speed (using the US 1-minute average)
is 33 knots (38 mph (62 kph)) or less.
Subtropical Storm:
A subtropical cyclone in which the maximum sustained surface wind speed (using the US 1-minute average)
is 34 knots (39 mph (63 kph)) or more.
Tropical Cyclone:
A warm-core non-frontal synoptic-scale cyclone, originating over tropical or subtropical waters, with
organized deep convection and a closed surface wind circulation about a well-defined center. Once formed,
a tropical cyclone is maintained by the extraction of heat energy from the ocean at high temperature and
heat export at the low temperatures of the upper troposphere.
Tropical Depression:
A tropical cyclone in which the maximum sustained surface wind speed (using the US 1-minute average) is
33 knots (38 mph (62 kph)) or less.
Tropical Disturbance:
A discrete tropical weather system of apparently organized convection originating in the tropics or
subtropics, having a non-frontal migratory character, and maintaining its identity for 24 hours or more.
Tropical Storm:
A tropical cyclone in which the maximum sustained surface wind speed (using the US 1-minute average)
ranges from 34 knots (39 mph (63 kph)) to 63 knots (73 mph (118 kph)).
Tropical Storm Warning:
An announcement that tropical storm conditions (sustained winds of 39 to 73 mph) are expected somewhere
within the specified area within 36 hours in association with a tropical, subtropical or post-tropical cyclone.
Tropical Storm Watch:
An announcement that tropical storm conditions (sustained winds of 39 to 73 mph) are possible within the
specified area within 48 hours in association with a tropical, subtropical or post-tropical cyclone.
Tropical Wave:
A trough or cyclonic curvature maximum in the trade-wind easterlies. The wave may reach maximum amplitude in the lower middle troposphere.
Aon Benfield Analytics | Impact Forecasting
Hurricane Maria 37
Contact Information
Adam Podlaha
Head of Impact Forecasting
Aon Benfield Analytics
Impact Forecasting
+44.20.7522.3820
Siamak Daneshvaran
Head of Research & Development
Aon Benfield Analytics
Impact Forecasting
+1.312.381.5886
Anwesha Bhattacharya
Senior Analyst
Aon Benfield Analytics
Impact Forecasting
+ 91.080.6621.8575
Steve Bowen
Director / Meteorologist
Aon Benfield Analytics
Impact Forecasting
+1.312.381.5883
Michal Lörinc
Catastrophe Analyst
Aon Benfield Analytics
Impact Forecasting
+420.234.618.222

Aon Benfield Analytics | Impact Forecasting
Hurricane Maria 38
About Aon Benfield
Aon Benfield, a division of Aon plc (NYSE: AON), is the world’s leading reinsurance intermediary and full-
service capital advisor. We empower our clients to better understand, manage and transfer risk through
innovative solutions and personalized access to all forms of global reinsurance capital across treaty,
facultative and capital markets. As a trusted advocate, we deliver local reach to the world’s markets, an
unparalleled investment in innovative analytics, including catastrophe management, actuarial and rating
agency advisory. Through our professionals’ expertise and experience, we advise clients in making
optimal capital choices that will empower results and improve operational effectiveness for their business.
With more than 80 offices in 50 countries, our worldwide client base has access to the broadest portfolio
of integrated capital solutions and services. To learn how Aon Benfield helps empower results, please
visit aonbenfield.com.
Copyright © by Impact Forecasting®
No claim to original government works. The text and graphics of this publication are provided for
informational purposes only. While Impact Forecasting® has tried to provide accurate and timely
information, inadvertent technical inaccuracies and typographical errors may exist, and Impact
Forecasting® does not warrant that the information is accurate, complete or current. The data presented
at this site is intended to convey only general information on current natural perils and must not be used
to make life-or-death decisions or decisions relating to the protection of property, as the data may not be
accurate. Please listen to official information sources for current storm information. This data has no
official status and should not be used for emergency response decision-making under any circumstances.
Cat Alerts use publicly available data from the internet and other sources. Impact Forecasting®
summarizes this publicly available information for the convenience of those individuals who have
contacted Impact Forecasting® and expressed an interest in natural catastrophes of various types. To find
out more about Impact Forecasting or to sign up for the Cat Reports, visit Impact Forecasting’s webpage
at impactforecasting.com.
Copyright © by Aon plc.
All rights reserved. No part of this document may be reproduced, stored in a retrieval system, or
transmitted in any form or by any means, electronic, mechanical, photocopying, recording or otherwise.
Impact Forecasting® is a wholly owned subsidiary of Aon plc.