Embed Size (px)
Citation preview
Page 116 of 171 Netherlands Environmental Assessment Agency
HUNGARY
National Focal Centre
Miklós Dombos, László Pásztor, József Szabó Research Institute for Soil Science and Agricultural Chemistry Hungarian Academy of Sciences 1022 Budapest Herman Ottó u. 15 tel: +36-1-3564682 fax: +36-1-3564682 [email protected]
Introduction
Critical loads for the Hungarian forest ecosystems have been updated in 2003. The database provided in 2003 has been derived from the AGROTOPO soil database and the CORINE Land Cover database linked to additional information on spatial distribution of forests. To improve critical load modelling further database has been involved. The Hungarian Soil Monitoring Database (TIM) used in last year fulfilled the requirements of input parameters of the models (e.g. MakeDep, SAFE). However results of modelling have to be tested further thus critical data for acidification provided in 2004 are still valid until the next call.
Data sources
Soil Information and monitoring system (TIM).
Based on physiographical-soil-ecological units 1236 representative observation points were selected of which 183 sites are in forests. Monitoring was in 1992, measurements are repeated 1, 3 or 6 years depending on the stability of soil variables. Most of the soil parameters in the model have been gathered from measured data (Table HU-1).
Biomass variables were derived from ICP sites (nutrient content) except the actual biomass, which was measured in sites (estimated from standing biomass classes) (Table HU-2).
Mineralogical data was gathered from a mineralogical map. This is the weakest point of the data acquisition, because of the spatial resolution and the method of the estimation of mineral composition (Table HU-3).
Results
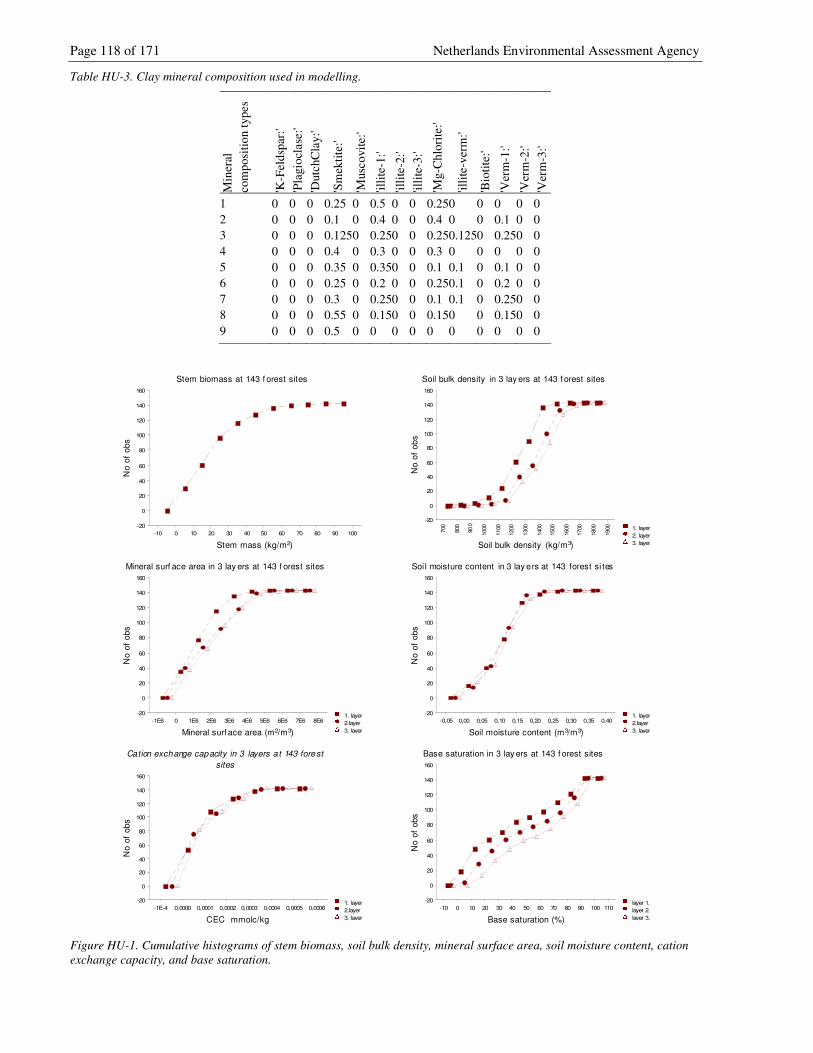
Cumulative distributions of some input parameters have been showed in figure HU-1. Values of these parameters are measured or estimated at sites. Histogram of base saturation differs significantly from dataset used in last years having a lower range. In Figure HU-2 time series of modelled response variables, like pH, base saturation and Bc:Al ratios have been illustrated in one site as an example. These curves are produced in all calibrated sites.
Figure HU-3 shows the results of critical load modelling. The most inner points show the exceedance of critical loads; red points correspond to the occurrence of an exceedance, sites with blue points are not exceedance and grey points indicate that the calibration failed. The outside circles show the base saturation and pH in the three soil layers. An earlier assessment of the soil acidification is illustrated in the background of the maps, showing the susceptibility of soil acidification in ordinal scale. Red and brawn patches are higher susceptibility to acidification, whereas blue patches are calcareous soils.
Conclusions:
• Hungarian soil monitoring database fulfilled the input requirements of MakeDep/SAFE models.
Netherlands Environmental Assessment Agency Page 117 of 171
• 183 forest sites were enough to characterize the spatial heterogeneity of soil acidification status in country scale.
• Calibration failed at several sites that are to be checked later on. • In many sites the results of the earlier soil susceptibility map and the critical load exceedances were
consistent although output inconsistencies occurred at several sites. This might be explained by the nutrient nitrogen exceedances that are in the focus of the next modelling goals.
Table HU-1. Soil parameters of the SAFE model.
Soil parameters layers 3 layers according to the soil genetic classification layer thickness Measured Evaporation fraction 0.2 Lateral flow 0 –not estimated rel Bc uptake Derived according to measured Bc concentrations in layer solution rel N uptake Derived according to measured NO3 conc. in layer solution soil bulk density Measured soil moisture content According to the potential plant available soil moisture content /measured values of pF=4.2-pF=2.5/
mineral surface area Derived from particle size distribution (Xi) that are measured at sites Mineral surface area = 0.3*Xsand+2.2*Xsilt +6*Xclay)*Bulk density*1000
cation exchange capacity Measured E Ca Measured E Mg Measured E K Measured soil solution DOC Arbitrary according to layers: in A layer =20, B = 5, C = 2 soil solution pCO2 Arbitrary according to layers: in A layer =2, B = 5, C = 10 Al solubility coefficient - SO4 to H ratio - q SO4 - p1 SO4 - p2 SO4 - field capacity - wilting point -
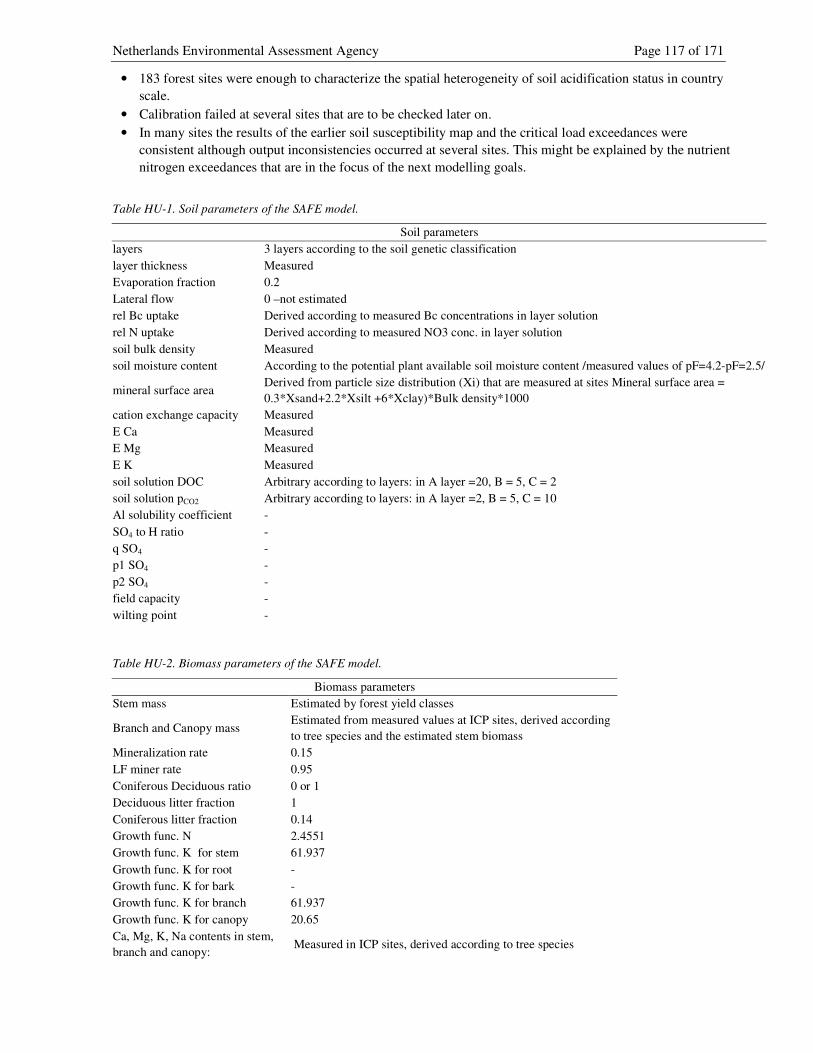
Table HU-2. Biomass parameters of the SAFE model.
Biomass parameters Stem mass Estimated by forest yield classes
Branch and Canopy mass Estimated from measured values at ICP sites, derived according to tree species and the estimated stem biomass
Mineralization rate 0.15 LF miner rate 0.95 Coniferous Deciduous ratio 0 or 1 Deciduous litter fraction 1 Coniferous litter fraction 0.14 Growth func. N 2.4551 Growth func. K for stem 61.937 Growth func. K for root - Growth func. K for bark - Growth func. K for branch 61.937 Growth func. K for canopy 20.65 Ca, Mg, K, Na contents in stem, branch and canopy:
Measured in ICP sites, derived according to tree species
Page 118 of 171 Netherlands Environmental Assessment Agency
Table HU-3. Clay mineral composition used in modelling.
Min
eral
co
mpo
sitio
n ty
pes
'K-F
elds
par:
' 'P
lagi
ocla
se:'
'Dut
chC
lay:
'
'Sm
ektit
e:'
'Mus
covi
te:'
'illit
e-1:
'
'illit
e-2:
' 'il
lite-
3:'
'Mg-
Chl
orite
:'
'illit
e-ve
rm:'
'Bio
tite:
'
'Ver
m-1
:'
'Ver
m-2
:' 'V
erm
-3:'
1 0 0 0 0.25 0 0.5 0 0 0.25 0 0 0 0 0 2 0 0 0 0.1 0 0.4 0 0 0.4 0 0 0.1 0 0 3 0 0 0 0.125 0 0.250 0 0.25 0.1250 0.25 0 0 4 0 0 0 0.4 0 0.3 0 0 0.3 0 0 0 0 0 5 0 0 0 0.35 0 0.350 0 0.1 0.1 0 0.1 0 0 6 0 0 0 0.25 0 0.2 0 0 0.25 0.1 0 0.2 0 0 7 0 0 0 0.3 0 0.250 0 0.1 0.1 0 0.25 0 0 8 0 0 0 0.55 0 0.150 0 0.15 0 0 0.15 0 0 9 0 0 0 0.5 0 0 0 0 0 0 0 0 0 0
Stem biomass at 143 f orest sites
-10 0 10 20 30 40 50 60 70 80 90 100
Stem mass (kg/m2)
-20
0
20
40
60
80
100
120
140
160
No
of o
bs
Soil bulk density in 3 lay ers at 143 f orest sites
1. layer 2. layer 3. layer
700
800
900
1000
1100
1200
1300
1400
1500
1600
1700
1800
1900
Soil bulk density (kg/m3)
-20
0
20
40
60
80
100
120
140
160
No
of o
bs
Mineral surf ace area in 3 lay ers at 143 f orest sites
1. layer 2.layer 3. layer
-1E6 0 1E6 2E6 3E6 4E6 5E6 6E6 7E6 8E6
Mineral surf ace area (m2/m3)
-20
0
20
40
60
80
100
120
140
160
No
of o
bs
Soi l moisture content in 3 lay ers at 143 forest si tes
1. layer 2.layer 3. layer
-0,05 0,00 0,05 0,10 0,15 0,20 0,25 0,30 0,35 0,40
Soil moisture content (m3/m3)
-20
0
20
40
60
80
100
120
140
160
No
of o
bs
Cation exchange capacity in 3 layers a t 143 forest
sites
1. layer 2.layer 3. layer
-1E-4 0,0000 0,0001 0,0002 0,0003 0,0004 0,0005 0,0006
CEC mmolc/kg
-20
0
20
40
60
80
100
120
140
160
No
of o
bs
Base saturation in 3 lay ers at 143 f orest sites
layer 1. layer 2. layer 3.
-10 0 10 20 30 40 50 60 70 80 90 100 110
Base saturation (%)
-20
0
20
40
60
80
100
120
140
160
No
of o
bs
Figure HU-1. Cumulative histograms of stem biomass, soil bulk density, mineral surface area, soil moisture content, cation exchange capacity, and base saturation.

Netherlands Environmental Assessment Agency Page 119 of 171
Model led time series of pH in 3 layers o f a monitoringsi te
Layer 1. Layer 2. Layer 3.
1700 1800 1900 2000 2100 2200 2300 2400 2500 2600
y ear
3,6
3,8
4,0
4,2
4,4
4,6
4,8
5,0
pH
Model led time series of base saturation in 3 layers of amo ni to rin g si te
Layer 1. Layer 2. Layer 3.
1700 1800 1900 2000 2100 2200 2300 2400 2500 2600
year
-0,05
0,00
0,05
0,10
0,15
0,20
0,25
0,30
0,35
0,40
Bas
e sa
tura
tion
(%)
Model led time series of Bc/Al in 3 layers of a
mo ni to rin g si te
Layer 1. Layer 2. Layer 3.
1700 1800 1900 2000 2100 2200 2300 2400 2500 2600
y ear
-5
0
5
10
15
20
25
30
35
40
45
wei
ghte
d m
olar
Bc
Al r
atio
Figure HU-2. Modelled time series of soil pH, base cation /Al ratios in soil solution and base saturation.

Page 120 of 171 Netherlands Environmental Assessment Agency
Figure HU-3. Critical load exceedances in Hungarian Soil Monitoring forest sites calculated by the SAFE model.