Embed Size (px)
Citation preview
HUMANA INC (HUM)
10-Q Quarterly report pursuant to sections 13 or 15(d)
Filed on 08/01/2011Filed Period 06/30/2011
Table of Contents
UNITED STATES
SECURITIES AND EXCHANGE COMMISSIONWashington, D.C. 20549
FORM 10-Q x QUARTERLY REPORT PURSUANT TO SECTION 13 OR 15 (d) OF THE SECURITIES EXCHANGE ACT OF 1934
For the quarterly period ended June 30, 2011
OR ¨ TRANSITION REPORT PURSUANT TO SECTION 13 OR 15 (d) OF THE SECURITIES EXCHANGE ACT OF 1934
For the transition period from to
Commission file number 1-5975
HUMANA INC.(Exact name of registrant as specified in its charter)
Delaware 61-0647538
(State or other jurisdiction ofincorporation or organization)
(I.R.S. EmployerIdentification Number)
500 West Main StreetLouisville, Kentucky 40202
(Address of principal executive offices, including zip code)
(502) 580-1000(Registrant's telephone number, including area code)
Indicate by check mark whether the registrant (1) has filed all reports required to be filed by Section 13 or 15(d) of the Securities Exchange Act of 1934during the preceding 12 months (or for such shorter period that the registrant was required to file such reports), and (2) has been subject to such filingrequirements for the past 90 days. Yes x No ¨
Indicate by check mark whether the registrant has submitted electronically and posted on its corporate Web site, if any, every Interactive Data Filerequired to be submitted and posted pursuant to Rule 405 of Regulation S-T during the preceding 12 months (or for such shorter period that the registrant wasrequired to submit and post such files). Yes x No ¨
Indicate by checkmark whether the registrant is a large accelerated filer, an accelerated filer, a non-accelerated filer, or a smaller reporting company.See the definitions of "large accelerated filer," "accelerated filer" and "smaller reporting company" in Rule 12b-2 of the Exchange Act. (Check one): Large accelerated filer x Accelerated filer ¨Non-accelerated filer ¨ Smaller reporting company ¨
Indicate by check mark whether the registrant is a shell company (as defined in Rule 12b-2 of the Act). Yes ¨ No x
Indicate the number of shares outstanding of each of the issuer's classes of common stock as of the latest practicable date.
Class of Common Stock Outstanding at June 30, 2011
$0.16 2/3 par value 166,829,524 shares
Table of Contents
Humana Inc.FORM 10-QJUNE 30, 2011
INDEX
Part I: Financial Information Page Item 1. Financial Statements
Condensed Consolidated Balance Sheets at June 30, 2011 and December 31, 2010 3 Condensed Consolidated Statements of Income for the three and six months ended June 30, 2011 and 2010 4 Condensed Consolidated Statements of Cash Flows for the six months ended June 30, 2011 and 2010 5 Notes to Condensed Consolidated Financial Statements 6
Item 2. Management's Discussion and Analysis of Financial Condition and Results of Operations 25 Item 3. Quantitative and Qualitative Disclosures about Market Risk 43 Item 4. Controls and Procedures 43
Part II: Other Information Item 1. Legal Proceedings 44 Item 1A. Risk Factors 44 Item 2. Unregistered Sales of Equity Securities and Use of Proceeds 45 Item 3. Defaults Upon Senior Securities 45 Item 4. Removed and Reserved 45 Item 5. Other Information 45 Item 6. Exhibits 46
Signatures 47 Certifications

Table of Contents
Humana Inc.CONDENSED CONSOLIDATED BALANCE SHEETS
(Unaudited)
June 30,
2011
December 31,
2010
(in thousands, except share amounts) ASSETS
Current assets: Cash and cash equivalents $ 1,567,824 $ 1,673,137 Investment securities 7,609,737 6,872,767 Receivables, less allowance for doubtful accounts of $80,195 in 2011 and $51,470 in 2010: 1,546,392 959,018 Securities lending invested collateral 29,737 49,636 Other current assets 721,537 583,141
Total current assets 11,475,227 10,137,699
Property and equipment, net 822,611 815,337 Long-term investment securities 1,592,919 1,499,672 Goodwill 2,577,511 2,567,809 Other long-term assets 1,126,637 1,082,736
Total assets $ 17,594,905 $ 16,103,253
LIABILITIES AND STOCKHOLDERS' EQUITY Current liabilities:
Benefits payable $ 3,953,185 $ 3,469,306 Trade accounts payable and accrued expenses 1,944,897 1,624,832 Book overdraft 217,287 409,385 Securities lending payable 35,536 55,693 Unearned revenues 204,859 185,410
Total current liabilities 6,355,764 5,744,626 Long-term debt 1,664,015 1,668,849 Future policy benefits payable 1,560,668 1,492,855 Other long-term liabilities 427,741 272,867
Total liabilities 10,008,188 9,179,197
Commitments and contingencies Stockholders' equity:
Preferred stock, $1 par; 10,000,000 shares authorized; none issued 0 0 Common stock, $0.16 2/3 par; 300,000,000 shares authorized; 192,739,787 shares issued at June 30, 2011 and
190,244,741 shares issued at December 31, 2010 32,123 31,707 Capital in excess of par value 1,897,852 1,737,207 Retained earnings 6,262,943 5,529,001 Accumulated other comprehensive income 189,030 120,584 Treasury stock, at cost, 25,910,263 shares at June 30, 2011 and 21,795,051 shares at December 31, 2010 (795,231) (494,443)
Total stockholders' equity 7,586,717 6,924,056
Total liabilities and stockholders' equity $ 17,594,905 $ 16,103,253
See accompanying notes to condensed consolidated financial statements.
3

Table of Contents
Humana Inc.CONDENSED CONSOLIDATED STATEMENTS OF INCOME
(Unaudited)
Three months ended
June 30,
Six months ended
June 30,
2011 2010 2011 2010
(in thousands, except per share results) Revenues:
Premiums $ 8,849,376 $ 8,376,751 $ 17,615,667 $ 16,538,614 Services 343,509 132,702 678,451 265,722 Investment income 91,246 79,790 180,731 165,245
Total revenues 9,284,131 8,589,243 18,474,849 16,969,581
Operating expenses: Benefits 7,269,768 6,869,096 14,614,522 13,686,478 Operating costs 1,192,405 1,093,690 2,448,248 2,154,547 Depreciation and amortization 67,781 64,381 133,890 123,240
Total operating expenses 8,529,954 8,027,167 17,196,660 15,964,265
Income from operations 754,177 562,076 1,278,189 1,005,316 Interest expense 27,663 26,222 54,891 52,536
Income before income taxes 726,514 535,854 1,223,298 952,780 Provision for income taxes 266,227 195,778 447,835 353,936
Net income $ 460,287 $ 340,076 $ 775,463 $ 598,844
Basic earnings per common share $ 2.76 $ 2.02 $ 4.64 $ 3.56
Diluted earnings per common share $ 2.71 $ 2.00 $ 4.57 $ 3.52
Dividends declared per common share $ 0.25 $ 0.00 $ 0.25 $ 0.00
See accompanying notes to condensed consolidated financial statements.
4

Table of Contents
Humana Inc.CONDENSED CONSOLIDATED STATEMENTS OF CASH FLOWS
(Unaudited)
For the six months ended
June 30,
2011 2010
(in thousands) Cash flows from operating activities
Net income $ 775,463 $ 598,844 Adjustments to reconcile net income to net cash provided by operating activities:
Net realized capital gains (5,109) (7,976) Stock-based compensation 40,978 39,627 Depreciation and amortization 150,583 132,046 Provision (benefit) for deferred income taxes 21,418 (81,267) Changes in operating assets and liabilities, net of effect of businesses acquired:
Receivables (587,374) (501,482) Other assets (174,800) 73,683 Benefits payable 483,879 607,149 Other liabilities 202,069 219,163 Unearned revenues 19,449 (19,471)
Other, net 30,109 19,646
Net cash provided by operating activities 956,665 1,079,962
Cash flows from investing activities Acquisitions, net of cash acquired (10,952) (1,669) Purchases of property and equipment (129,181) (91,427) Purchases of investment securities (1,902,083) (2,759,168) Maturities of investment securities 731,204 1,014,032 Proceeds from sales of investment securities 432,006 1,091,282 Change in securities lending collateral 20,157 74,809
Net cash used in investing activities (858,849) (672,141)
Cash flows from financing activities Receipts from CMS contract deposits 1,254,847 880,252 Withdrawals from CMS contract deposits (1,066,478) (643,976) Change in securities lending payable (20,157) (74,809) Change in book overdraft (192,098) (134,548) Common stock repurchases (300,788) (57,869) Excess tax benefit from stock-based compensation 11,287 1,264 Proceeds from stock option exercises and other 110,258 7,259
Net cash used in financing activities (203,129) (22,427)
(Decrease) increase in cash and cash equivalents (105,313) 385,394 Cash and cash equivalents at beginning of period 1,673,137 1,613,588
Cash and cash equivalents at end of period $ 1,567,824 $ 1,998,982
Supplemental cash flow disclosures: Interest payments $ 56,958 $ 55,855 Income tax payments, net $ 407,416 $ 356,390
See accompanying notes to condensed consolidated financial statements.
5
Table of Contents
Humana Inc. NOTES TO CONDENSED CONSOLIDATED FINANCIAL STATEMENTS
Unaudited
1. BASIS OF PRESENTATION
The accompanying condensed consolidated financial statements are presented in accordance with generally accepted accounting principles for interimfinancial information and with the instructions to Form 10-Q and Article 10 of Regulation S-X. Accordingly, they do not include all of the disclosuresnormally required by accounting principles generally accepted in the United States of America, or those normally made in an Annual Report on Form 10-K.For further information, the reader of this Form 10-Q should refer to our Form 10-K for the year ended December 31, 2010, that was filed with the Securitiesand Exchange Commission, or the SEC, on February 17, 2011. References throughout this document to "we," "us," "our," "Company," and "Humana" meanHumana Inc. and its subsidiaries.
The preparation of our condensed consolidated financial statements in accordance with accounting principles generally accepted in the United States ofAmerica requires us to make estimates and assumptions that affect the amounts reported in the condensed consolidated financial statements andaccompanying notes. The areas involving the most significant use of estimates are the estimation of benefits payable, the impact of risk sharing provisionsrelated to our Medicare and TRICARE contracts, the valuation and related impairment recognition of investment securities, and the valuation and relatedimpairment recognition of long-lived assets, including goodwill. These estimates are based on knowledge of current events and anticipated future events, andaccordingly, actual results may ultimately differ materially from those estimates. Refer to Note 2 to the consolidated financial statements included in our Form10-K for the year ended December 31, 2010 for information on accounting policies that the Company considers in preparing its consolidated financialstatements.
The financial information has been prepared in accordance with our customary accounting practices and has not been audited. In our opinion, theinformation presented reflects all adjustments necessary for a fair statement of interim results. All such adjustments are of a normal and recurring nature.
Realignment of Business Segments
During the first quarter of 2011, we realigned our business segments to reflect our evolving business model. We manage and report our operatingresults using the following segments: Retail, Employer Group, and Health and Well-Being Services. We also disclose results for Other Businesses. Historicalsegment information has been retrospectively adjusted to reflect the effect of this change. Our segment information is more fully described in Note 13.
As a result of changing our reportable segments, we also changed the classification of certain revenues and costs. Beginning January 1, 2011, costs ofcertain health and well-being services were reclassified as benefits expense including costs incurred by our wholly-owned home delivery pharmacy fromtransactions with our members that were historically classified as selling, general and administrative (and now titled operating costs), as well as depreciationand amortization expenses. The effect of this reclassification is to account for the cost of providing these benefits to our members similarly whether theservices are provided via a third party provider or internally through a stand-alone subsidiary. Likewise, co-share amounts from our members associated withour wholly-owned home delivery pharmacy operations, historically classified as other revenue, are now classified as a reduction of benefits expense. Theremaining items previously classified as other revenue, primarily consisting of patient service revenue associated with our recently acquired Concentra Inc.subsidiary, were combined with our previous administrative services fee revenue and are now classified as services revenue. Prior period amounts have beenreclassified to conform to the new presentation. These adjustments had no impact on net income, cash flows or equity. Further, none of these adjustmentsimpacted our regulated subsidiaries.
Depreciation and amortization expense associated with certain businesses in our Health and Well-Being Services segment delivering benefits to ourmembers, primarily associated with our pharmacy operations, are now included with benefits expense. The amount of this expense was $7.3 million and $4.9million for the three months ended June 30, 2011 and 2010, respectively. For the six months ended June 30, 2011 and 2010, the amount of this expense was$16.7 million and $8.8 million, respectively.
6
Table of Contents
Humana Inc.NOTES TO CONDENSED CONSOLIDATED FINANCIAL STATEMENTS—(Continued)
Unaudited
2. RECENTLY ISSUED ACCOUNTING PRONOUNCEMENTS
In July 2011, the Financial Accounting Standards Board, or FASB, issued new guidance regarding how health insurers should recognize and classifyfees mandated by The Patient Protection and Affordable Care Act and The Health Care and Education Reconciliation Act of 2010 (which we collectively referto as the Health Insurance Reform Legislation). The Health Insurance Reform Legislation imposes a non-deductible annual fee on health insurers for eachcalendar year beginning on or after January 1, 2014. The guidance requires that the liability for the fee should be estimated and recorded in full once weprovide qualifying insurance coverage in the applicable calendar year in which the fee is payable with a corresponding deferred cost that is amortized toexpense over the calendar year that it is payable. The new guidance is effective for us for calendar year 2014, when the fee initially becomes effective.
In June 2011, the FASB issued new guidance requiring the presentation of other comprehensive income in a statement presented with equal prominenceto the other primary financial statements. The new guidance eliminates the current option to report other comprehensive income and its components in thestatement of stockholders' equity and requires one of two alternatives for the presentation of items of net income and other comprehensive income: (1) in asingle continuous statement referred to as the statement of comprehensive income, or (2) in two separate, but consecutive statements. Under either alternative,each component of net income and each component of other comprehensive income, together with totals for each, as well as total comprehensive incomewould need to be displayed. The new guidance is effective for us, beginning with the filing of our Form 10-Q for the three months ending March 31, 2012,with retrospective application required. As the new guidance only affects the presentation of other comprehensive income, it will not have a material impacton our results of operations, financial condition, or cash flows.
In May 2011, the FASB issued new guidance intended to improve the comparability of fair value measurements presented and disclosed in financialstatements prepared in accordance with accounting principles generally accepted in the United States of America and those prepared in accordance withinternational financial reporting standards. While the new guidance is largely consistent with existing fair value measurement principles, it expands existingdisclosure requirements for fair value measurements and makes other amendments which could change how existing fair value measurement guidance isapplied. The new guidance will be effective for us beginning with the filing of our Form 10-Q for the three months ending March 31, 2012. We are currentlyevaluating the impact of the adoption of this new guidance on our results of operations, financial condition, or cash flows.
In January 2010, the FASB issued new guidance that expanded and clarified existing disclosures about fair value measurements. Under the newguidance, we are required to disclose additional information about movements of assets among the three-tier fair value hierarchy, present separately (that is,on a gross basis) information about purchases, sales, issuances, and settlements of financial instruments in the reconciliation of fair value measurements usingsignificant unobservable inputs (Level 3), and expand disclosures regarding the determination of fair value measurements. We adopted the new disclosureprovisions during the year ended December 31, 2010, except for the gross disclosures regarding purchases, sales, issuances and settlements in the roll forwardof activity in Level 3 fair value measurements which we adopted with the filing of our Form 10-Q for the three months ended March 31, 2011 as provided inNote 5.
There are no other recently issued accounting standards that apply to us or that will have a material impact on our condensed consolidated financialstatements.
3. ACQUISITION
On December 21, 2010, we acquired Concentra Inc., or Concentra, a health care company based in Addison, Texas, for cash consideration of $804.7million. During the first half of 2011, we accrued and paid $3.7 million related to the final determination of working capital that existed at the acquisition dateand recorded immaterial adjustments to the acquisition date fair value of Concentra's net tangible assets acquired with a corresponding adjustment togoodwill. Through its affiliated clinicians, Concentra delivers occupational medicine, urgent care, physical therapy, and wellness services to workers and thegeneral public through its operation of medical centers and worksite medical facilities. The Concentra acquisition provides us entry into the primary carespace on a national scale, offering additional means for achieving health and wellness solutions and providing an expandable platform for growth with amanagement team experienced in physician asset management and alternate site care. The total consideration of $808.4 million exceeded our estimated fairvalue of the net tangible assets acquired by approximately $724.5 million, of which we allocated $188.0 million to other intangible assets and $536.5 millionto goodwill. The goodwill was assigned to the Health and Well-Being Services segment. The other intangible assets, which primarily consist of customer
7
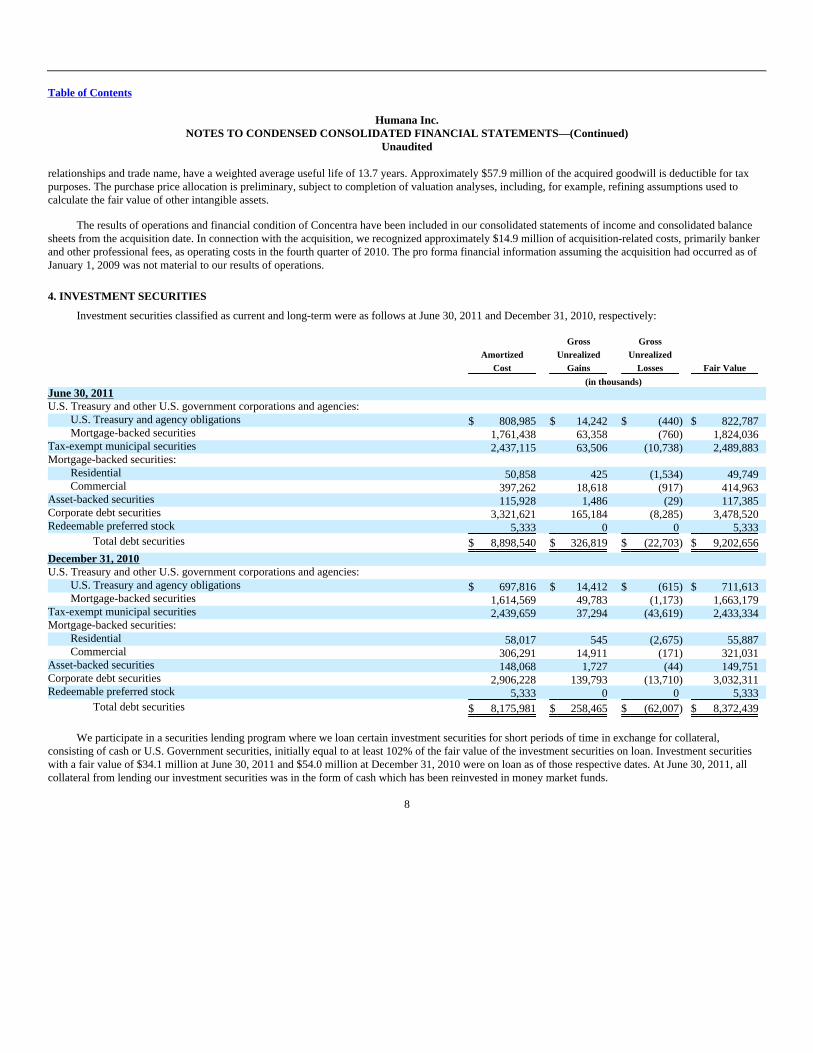
Table of Contents
Humana Inc.NOTES TO CONDENSED CONSOLIDATED FINANCIAL STATEMENTS—(Continued)
Unaudited
relationships and trade name, have a weighted average useful life of 13.7 years. Approximately $57.9 million of the acquired goodwill is deductible for taxpurposes. The purchase price allocation is preliminary, subject to completion of valuation analyses, including, for example, refining assumptions used tocalculate the fair value of other intangible assets.
The results of operations and financial condition of Concentra have been included in our consolidated statements of income and consolidated balancesheets from the acquisition date. In connection with the acquisition, we recognized approximately $14.9 million of acquisition-related costs, primarily bankerand other professional fees, as operating costs in the fourth quarter of 2010. The pro forma financial information assuming the acquisition had occurred as ofJanuary 1, 2009 was not material to our results of operations.
4. INVESTMENT SECURITIES
Investment securities classified as current and long-term were as follows at June 30, 2011 and December 31, 2010, respectively:
AmortizedCost
GrossUnrealized
Gains
GrossUnrealized
Losses Fair Value
(in thousands) June 30, 2011 U.S. Treasury and other U.S. government corporations and agencies:
U.S. Treasury and agency obligations $ 808,985 $ 14,242 $ (440) $ 822,787 Mortgage-backed securities 1,761,438 63,358 (760) 1,824,036
Tax-exempt municipal securities 2,437,115 63,506 (10,738) 2,489,883 Mortgage-backed securities:
Residential 50,858 425 (1,534) 49,749 Commercial 397,262 18,618 (917) 414,963
Asset-backed securities 115,928 1,486 (29) 117,385 Corporate debt securities 3,321,621 165,184 (8,285) 3,478,520 Redeemable preferred stock 5,333 0 0 5,333
Total debt securities $ 8,898,540 $ 326,819 $ (22,703) $ 9,202,656
December 31, 2010 U.S. Treasury and other U.S. government corporations and agencies:
U.S. Treasury and agency obligations $ 697,816 $ 14,412 $ (615) $ 711,613 Mortgage-backed securities 1,614,569 49,783 (1,173) 1,663,179
Tax-exempt municipal securities 2,439,659 37,294 (43,619) 2,433,334 Mortgage-backed securities:
Residential 58,017 545 (2,675) 55,887 Commercial 306,291 14,911 (171) 321,031
Asset-backed securities 148,068 1,727 (44) 149,751 Corporate debt securities 2,906,228 139,793 (13,710) 3,032,311 Redeemable preferred stock 5,333 0 0 5,333
Total debt securities $ 8,175,981 $ 258,465 $ (62,007) $ 8,372,439
We participate in a securities lending program where we loan certain investment securities for short periods of time in exchange for collateral,consisting of cash or U.S. Government securities, initially equal to at least 102% of the fair value of the investment securities on loan. Investment securitieswith a fair value of $34.1 million at June 30, 2011 and $54.0 million at December 31, 2010 were on loan as of those respective dates. At June 30, 2011, allcollateral from lending our investment securities was in the form of cash which has been reinvested in money market funds.
8
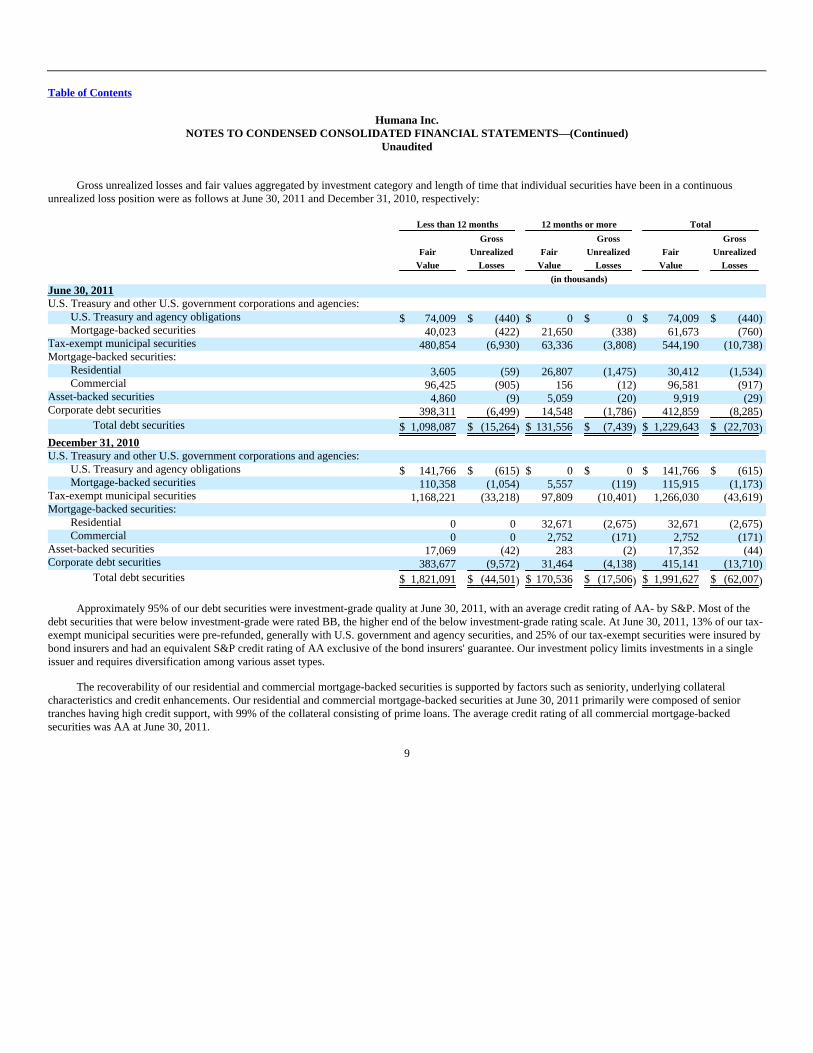
Table of Contents
Humana Inc.NOTES TO CONDENSED CONSOLIDATED FINANCIAL STATEMENTS—(Continued)
Unaudited
Gross unrealized losses and fair values aggregated by investment category and length of time that individual securities have been in a continuousunrealized loss position were as follows at June 30, 2011 and December 31, 2010, respectively: Less than 12 months 12 months or more Total
Gross Gross Gross
Fair Unrealized Fair Unrealized Fair Unrealized
Value Losses Value Losses Value Losses
(in thousands) June 30, 2011 U.S. Treasury and other U.S. government corporations and agencies:
U.S. Treasury and agency obligations $ 74,009 $ (440) $ 0 $ 0 $ 74,009 $ (440) Mortgage-backed securities 40,023 (422) 21,650 (338) 61,673 (760)
Tax-exempt municipal securities 480,854 (6,930) 63,336 (3,808) 544,190 (10,738) Mortgage-backed securities:
Residential 3,605 (59) 26,807 (1,475) 30,412 (1,534) Commercial 96,425 (905) 156 (12) 96,581 (917)
Asset-backed securities 4,860 (9) 5,059 (20) 9,919 (29) Corporate debt securities 398,311 (6,499) 14,548 (1,786) 412,859 (8,285)
Total debt securities $ 1,098,087 $ (15,264) $ 131,556 $ (7,439) $ 1,229,643 $ (22,703)
December 31, 2010 U.S. Treasury and other U.S. government corporations and agencies:
U.S. Treasury and agency obligations $ 141,766 $ (615) $ 0 $ 0 $ 141,766 $ (615) Mortgage-backed securities 110,358 (1,054) 5,557 (119) 115,915 (1,173)
Tax-exempt municipal securities 1,168,221 (33,218) 97,809 (10,401) 1,266,030 (43,619) Mortgage-backed securities:
Residential 0 0 32,671 (2,675) 32,671 (2,675) Commercial 0 0 2,752 (171) 2,752 (171)
Asset-backed securities 17,069 (42) 283 (2) 17,352 (44) Corporate debt securities 383,677 (9,572) 31,464 (4,138) 415,141 (13,710)
Total debt securities $ 1,821,091 $ (44,501) $ 170,536 $ (17,506) $ 1,991,627 $ (62,007)
Approximately 95% of our debt securities were investment-grade quality at June 30, 2011, with an average credit rating of AA- by S&P. Most of thedebt securities that were below investment-grade were rated BB, the higher end of the below investment-grade rating scale. At June 30, 2011, 13% of our tax-exempt municipal securities were pre-refunded, generally with U.S. government and agency securities, and 25% of our tax-exempt securities were insured bybond insurers and had an equivalent S&P credit rating of AA exclusive of the bond insurers' guarantee. Our investment policy limits investments in a singleissuer and requires diversification among various asset types.
The recoverability of our residential and commercial mortgage-backed securities is supported by factors such as seniority, underlying collateralcharacteristics and credit enhancements. Our residential and commercial mortgage-backed securities at June 30, 2011 primarily were composed of seniortranches having high credit support, with 99% of the collateral consisting of prime loans. The average credit rating of all commercial mortgage-backedsecurities was AA at June 30, 2011.
9

Table of Contents
Humana Inc.NOTES TO CONDENSED CONSOLIDATED FINANCIAL STATEMENTS—(Continued)
Unaudited
All issuers of securities we own that were trading at an unrealized loss at June 30, 2011 remain current on all contractual payments. After taking intoaccount these and other factors previously described, we believe these unrealized losses primarily were caused by an increase in market interest rates andtighter liquidity conditions in the current markets than when the securities were purchased. At June 30, 2011, we did not intend to sell the securities with anunrealized loss position in accumulated other comprehensive income, and it is not likely that we will be required to sell these securities before recovery oftheir amortized cost basis. As a result, we believe that the securities with an unrealized loss were not other-than-temporarily impaired at June 30, 2011.
The detail of realized gains (losses) related to investment securities and included within investment income was as follows for the three and six monthsended June 30, 2011 and 2010:
For the three months endedJune 30,
For the six months endedJune 30,
2011 2010 2011 2010
(in thousands) Gross realized gains $ 6,272 $ 3,840 $ 10,848 $ 23,753 Gross realized losses (5,089) (4,558) (5,739) (15,777)
Net realized capital gains (losses) $ 1,183 $ (718) $ 5,109 $ 7,976
There were no material other-than-temporary impairments for the three and six months ended June 30, 2011 or 2010.
The contractual maturities of debt securities available for sale at June 30, 2011, regardless of their balance sheet classification, are shown below.Expected maturities may differ from contractual maturities because borrowers may have the right to call or prepay obligations with or without call orprepayment penalties. Amortized Fair
Cost Value
(in thousands) Due within one year $ 410,307 $ 412,900 Due after one year through five years 1,993,459 2,066,110 Due after five years through ten years 2,450,596 2,547,202 Due after ten years 1,718,692 1,770,311 Mortgage and asset-backed securities 2,325,486 2,406,133
Total debt securities $ 8,898,540 $ 9,202,656
10

Table of Contents
Humana Inc.NOTES TO CONDENSED CONSOLIDATED FINANCIAL STATEMENTS—(Continued)
Unaudited
5. FAIR VALUE
Financial Assets
The following table summarizes our fair value measurements at June 30, 2011 and December 31, 2010, respectively, for financial assets measured atfair value on a recurring basis: Fair Value Measurements Using
Fair Value
Quoted Prices inActive Markets
for IdenticalAssets
(Level 1)
Significant OtherObservable Inputs
(Level 2)
SignificantUnobservable
Inputs
(Level 3)
(in thousands) June 30, 2011 Cash equivalents $ 1,470,957 $ 1,470,957 $ 0 $ 0 Debt securities:
U.S. Treasury and other U.S. government corporations and agencies: U.S. Treasury and agency obligations 822,787 0 822,787 0 Mortgage-backed securities 1,824,036 0 1,824,036 0
Tax-exempt municipal securities 2,489,883 0 2,468,830 21,053 Mortgage-backed securities:
Residential 49,749 0 49,749 0 Commercial 414,963 0 414,963 0
Asset-backed securities 117,385 0 116,286 1,099 Corporate debt securities 3,478,520 0 3,454,422 24,098 Redeemable preferred stock 5,333 0 0 5,333
Total debt securities 9,202,656 0 9,151,073 51,583 Securities lending invested collateral 29,737 29,737 0 0
Total invested assets $ 10,703,350 $ 1,500,694 $ 9,151,073 $ 51,583
December 31, 2010 Cash equivalents $ 1,606,592 $ 1,606,592 $ 0 $ 0 Debt securities:
U.S. Treasury and other U.S. government corporations and agencies: U.S. Treasury and agency obligations 711,613 0 711,613 0 Mortgage-backed securities 1,663,179 0 1,663,179 0
Tax-exempt municipal securities 2,433,334 0 2,381,528 51,806 Mortgage-backed securities:
Residential 55,887 0 55,887 0 Commercial 321,031 0 321,031 0
Asset-backed securities 149,751 0 148,545 1,206 Corporate debt securities 3,032,311 0 3,025,097 7,214 Redeemable preferred stock 5,333 0 0 5,333
Total debt securities 8,372,439 0 8,306,880 65,559 Securities lending invested collateral 49,636 24,639 24,997 0
Total invested assets $ 10,028,667 $ 1,631,231 $ 8,331,877 $ 65,559
11
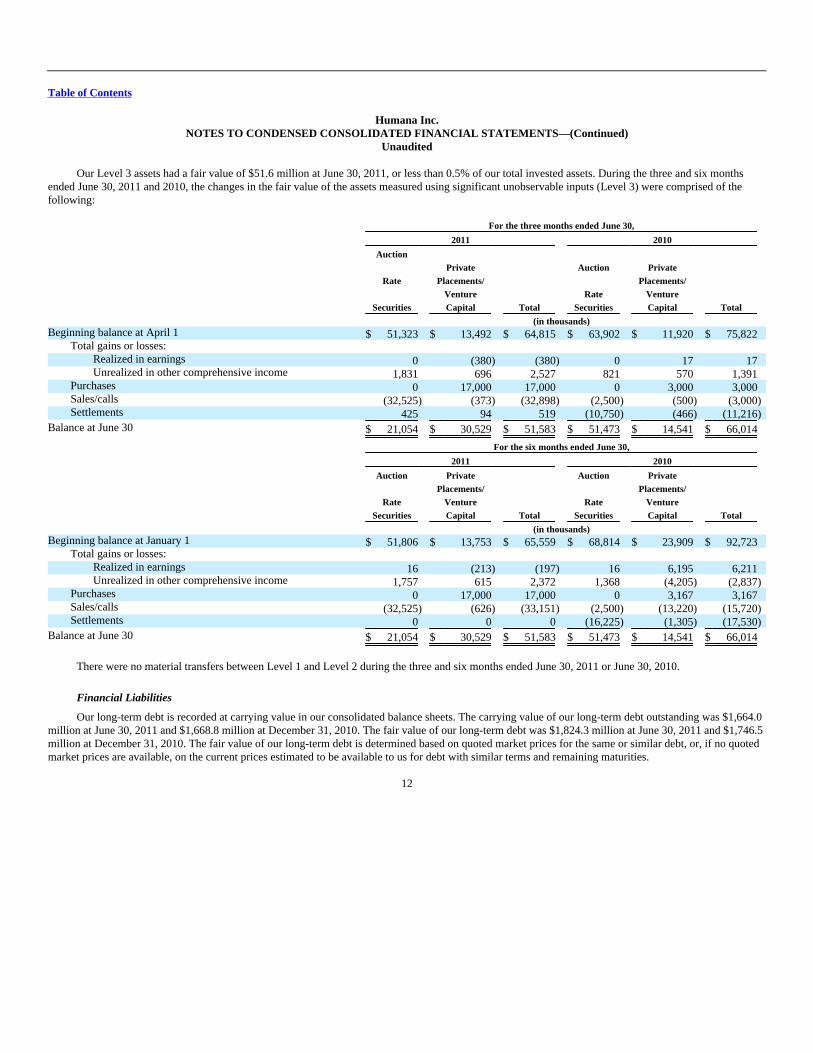
Table of Contents
Humana Inc.NOTES TO CONDENSED CONSOLIDATED FINANCIAL STATEMENTS—(Continued)
Unaudited
Our Level 3 assets had a fair value of $51.6 million at June 30, 2011, or less than 0.5% of our total invested assets. During the three and six monthsended June 30, 2011 and 2010, the changes in the fair value of the assets measured using significant unobservable inputs (Level 3) were comprised of thefollowing: For the three months ended June 30,
2011 2010
Auction
Rate
Securities
PrivatePlacements/
VentureCapital Total
Auction
RateSecurities
PrivatePlacements/
VentureCapital Total
(in thousands) Beginning balance at April 1 $ 51,323 $ 13,492 $ 64,815 $ 63,902 $ 11,920 $ 75,822
Total gains or losses: Realized in earnings 0 (380) (380) 0 17 17 Unrealized in other comprehensive income 1,831 696 2,527 821 570 1,391
Purchases 0 17,000 17,000 0 3,000 3,000 Sales/calls (32,525) (373) (32,898) (2,500) (500) (3,000) Settlements 425 94 519 (10,750) (466) (11,216)
Balance at June 30 $ 21,054 $ 30,529 $ 51,583 $ 51,473 $ 14,541 $ 66,014
For the six months ended June 30,
2011 2010
Auction
RateSecurities
PrivatePlacements/
VentureCapital Total
Auction
RateSecurities
PrivatePlacements/
VentureCapital Total
(in thousands) Beginning balance at January 1 $ 51,806 $ 13,753 $ 65,559 $ 68,814 $ 23,909 $ 92,723
Total gains or losses: Realized in earnings 16 (213) (197) 16 6,195 6,211 Unrealized in other comprehensive income 1,757 615 2,372 1,368 (4,205) (2,837)
Purchases 0 17,000 17,000 0 3,167 3,167 Sales/calls (32,525) (626) (33,151) (2,500) (13,220) (15,720) Settlements 0 0 0 (16,225) (1,305) (17,530)
Balance at June 30 $ 21,054 $ 30,529 $ 51,583 $ 51,473 $ 14,541 $ 66,014
There were no material transfers between Level 1 and Level 2 during the three and six months ended June 30, 2011 or June 30, 2010.
Financial Liabilities
Our long-term debt is recorded at carrying value in our consolidated balance sheets. The carrying value of our long-term debt outstanding was $1,664.0million at June 30, 2011 and $1,668.8 million at December 31, 2010. The fair value of our long-term debt was $1,824.3 million at June 30, 2011 and $1,746.5million at December 31, 2010. The fair value of our long-term debt is determined based on quoted market prices for the same or similar debt, or, if no quotedmarket prices are available, on the current prices estimated to be available to us for debt with similar terms and remaining maturities.
12

Table of Contents
Humana Inc.NOTES TO CONDENSED CONSOLIDATED FINANCIAL STATEMENTS—(Continued)
Unaudited
6. MEDICARE PART D
We cover prescription drug benefits in accordance with Medicare Part D under multiple contracts with the Centers for Medicare and Medicaid Services,or CMS. The condensed consolidated balance sheets include the following amounts associated with Medicare Part D as of June 30, 2011 and December 31,2010. The risk corridor settlement includes amounts classified as long-term because settlement associated with the 2011 provision will exceed 12 months as ofJune 30, 2011.
June 30, 2011 December 31, 2010
RiskCorridor
Settlement
CMSSubsidies
RiskCorridor
Settlement
CMSSubsidies
(in thousands) Other current assets $ 1,507 $ 77,686 $ 1,563 $ 16,211 Trade accounts payable and accrued expenses (400,806) (420,075) (389,203) (170,231)
Net current liability (399,299) (342,389) (387,640) (154,020)
Other long-term assets 4,349 0 0 0 Other long-term liabilities (147,235) 0 0 0
Net long-term liability (142,886) 0 0 0
Total net liability $ (542,185) $ (342,389) $ (387,640) $ (154,020)
7. GOODWILL AND OTHER INTANGIBLE ASSETS
The realignment of our business segments and corresponding change in our reportable segments, more fully described herein in Note 13, resulted in achange in the composition of our reporting units, the unit of accounting for goodwill. Accordingly, we reassigned goodwill to our reporting units as ofJanuary 1, 2011 using the relative fair value approach. Changes in the carrying amount of goodwill, by our new reportable segments, for the six months endedJune 30, 2011 were as follows:
Retail
EmployerGroup
Health &
Well-BeingServices
Other
Businesses Total
(in thousands) Balance at January 1, 2011 $ 592,844 $ 61,990 $ 1,855,522 $ 57,453 $ 2,567,809
Acquisitions 0 0 4,022 0 4,022 Subsequent adjustments 0 0 5,680 0 5,680
Balance at June 30, 2011 $ 592,844 $ 61,990 $ 1,865,224 $ 57,453 $ 2,577,511
The following table presents details of our other intangible assets included in other long-term assets in the accompanying condensed consolidatedbalance sheets at June 30, 2011 and December 31, 2010: Weighted June 30, 2011 December 31, 2010
Average Accumulated Accumulated
Life Cost Amortization Net Cost Amortization Net
(in thousands) Other intangible assets:
Customer contracts/relationships 10.7 yrs $ 417,285 $ 165,807 $ 251,478 $ 413,855 $ 145,997 $ 267,858 Trade names 19.6 yrs 87,400 4,565 82,835 87,400 2,268 85,132 Provider contracts 16.0 yrs 42,753 13,347 29,406 42,753 11,659 31,094 Noncompetes and other 7.4 yrs 36,937 6,331 30,606 19,475 4,085 15,390
Total other intangible assets 12.2 yrs $ 584,375 $ 190,050 $ 394,325 $ 563,483 $ 164,009 $ 399,474
13

Table of Contents
Humana Inc.NOTES TO CONDENSED CONSOLIDATED FINANCIAL STATEMENTS—(Continued)
Unaudited
Amortization expense for other intangible assets was approximately $26.0 million for the six months ended June 30, 2011 and $18.1 million for the sixmonths ended June 30, 2010. The following table presents our estimate of amortization expense for 2011 and each of the five next succeeding years: (in thousands) For the years ending December 31,:
2011 $ 53,280 2012 53,102 2013 49,847 2014 45,349 2015 40,017 2016 34,342
8. COMPREHENSIVE INCOME
The following table presents details supporting the computation of comprehensive income, net of tax, for the three and six months ended June 30, 2011and 2010:
Three months endedJune 30,
Six months endedJune 30,
2011 2010 2011 2010
(in thousands) Net income $ 460,287 $ 340,076 $ 775,463 $ 598,844 Net unrealized investment gains and other, net of tax 80,222 88,434 68,446 116,293
Comprehensive income, net of tax $ 540,509 $ 428,510 $ 843,909 $ 715,137
9. EARNINGS PER COMMON SHARE COMPUTATION
Detail supporting the computation of basic and diluted earnings per common share was as follows for the three and six months ended June 30, 2011 and2010:
Three months endedJune 30,
Six months endedJune 30,
2011 2010 2011 2010
(in thousands, except per common share results) Net income available for common stockholders $ 460,287 $ 340,076 $ 775,463 $ 598,844
Weighted average outstanding shares of common stock used to compute basic earnings per common share 167,021 168,472 167,146 168,336 Dilutive effect of:
Employee stock options 1,073 533 996 566 Restricted stock 1,466 1,224 1,405 1,252
Shares used to compute diluted earnings per common share 169,560 170,229 169,547 170,154
Basic earnings per common share $ 2.76 $ 2.02 $ 4.64 $ 3.56
Diluted earnings per common share $ 2.71 $ 2.00 $ 4.57 $ 3.52
Number of antidilutive stock options and restricted stock excluded from computation 139 4,770 1,441 4,904
14

Table of Contents
Humana Inc.NOTES TO CONDENSED CONSOLIDATED FINANCIAL STATEMENTS—(Continued)
Unaudited
10. STOCKHOLDERS' EQUITY
In April 2011, our Board of Directors approved a quarterly cash dividend policy and declared a cash dividend to stockholders of $0.25 per sharepayable on July 28, 2011 to stockholders of record on June 30, 2011. Accordingly, on July 28, 2011, we paid dividends aggregating $41.5 million.Declaration and payment of future quarterly dividends is at the discretion of the Board and may be adjusted as business needs or market conditions change.
In addition, in April 2011, the Board of Directors replaced its previously approved share repurchase authorization of up to $250 million with a newauthorization for repurchases of up to $1 billion of our common shares exclusive of shares repurchased in connection with employee stock plans. The newauthorization will expire June 30, 2013. Under this share repurchase authorization, shares could be purchased from time to time at prevailing prices in theopen market, by block purchases, or in privately-negotiated transactions, subject to certain regulatory restrictions on volume, pricing, and timing. During thesix months ended June 30, 2010, we repurchased 1.03 million shares in open market transactions for $50.0 million at an average price of $48.76 under thepreviously approved share repurchase authorization. During the six months ended June 30, 2011, we repurchased 0.8 million shares in open markettransactions for $52.6 million at an average price of $63.73 under the previously approved share repurchase authorization and we repurchased 2.5 millionshares in open market transactions for $200.1 million at an average price of $78.51 under the new authorization. As of August 1, 2011, the remainingauthorized amount under the new authorization totaled $799.9 million.
In connection with employee stock plans, we acquired 0.7 million common shares for $48.1 million and 0.2 million common shares for $7.9 millionduring the six months ended June 30, 2011 and 2010, respectively.
11. INCOME TAXES
The effective income tax rate was 36.6% for the three months ended June 30, 2011 compared to 36.5% for the three months ended June 30, 2010. Forthe six months ended June 30, 2011, the effective tax rate was 36.6% compared to 37.1% for the six months ended June 30, 2010. The higher tax rate for thesix months ended June 30, 2010 primarily was due to the cumulative adjustment associated with estimating the retrospective aspect of new limitations on thedeductibility of annual compensation in excess of $500,000 per employee as mandated by the March 2010 health insurance reforms.
12. GUARANTEES AND CONTINGENCIES
Government Contracts
Our Medicare business, which accounted for approximately 65% of our total premiums and services revenue for the six months ended June 30, 2011,primarily consisted of products covered under the Medicare Advantage and Medicare Part D Prescription Drug Plan contracts with the federal government.These contracts are renewed generally for a calendar year term unless CMS notifies us of its decision not to renew by August 1 of the calendar year in whichthe contract would end, or we notify CMS of our decision not to renew by the first Monday in June of the calendar year in which the contract would end. Allmaterial contracts between Humana and CMS relating to our Medicare business have been renewed for 2012 and we expect to learn in the Fall of 2011 thestatus of our product offerings filed with CMS for 2012.
CMS uses a risk-adjustment model which apportions premiums paid to Medicare Advantage plans according to health severity. The risk-adjustmentmodel pays more for enrollees with predictably higher costs. Under this model, rates paid to Medicare Advantage plans are based on actuarially determinedbids, which include a process whereby our prospective payments are based on a comparison of our beneficiaries' risk scores, derived from medical diagnoses,to those enrolled in the government's original Medicare program. Under the risk-adjustment methodology, all Medicare Advantage plans must collect andsubmit the necessary diagnosis code information from hospital inpatient, hospital outpatient, and physician providers to CMS within prescribed deadlines. TheCMS risk-
15

Table of Contents
Humana Inc.NOTES TO CONDENSED CONSOLIDATED FINANCIAL STATEMENTS—(Continued)
Unaudited
adjustment model uses this diagnosis data to calculate the risk adjusted premium payment to Medicare Advantage plans. We generally rely on providers tocode their claim submissions with appropriate diagnoses, which we send to CMS as the basis for our payment received from CMS under the actuarial risk-adjustment model. We also rely on providers to appropriately document all medical data, including the diagnosis data submitted with claims.
CMS is continuing to perform audits of various companies' selected Medicare Advantage contracts related to this risk adjustment diagnosis data. Theseaudits are referred to herein as Risk-Adjustment Data Validation Audits, or RADV audits. RADV audits review medical record documentation in an attemptto validate provider coding practices and the presence of risk adjustment conditions which influence the calculation of premium payments to MedicareAdvantage plans.
On December 21, 2010, CMS posted a description of the agency's proposed RADV sampling and payment adjustment calculation methodology to itswebsite, and invited public comment, noting that CMS may revise its sampling and payment error calculation methodology based upon the commentsreceived. We believe the audit and payment adjustment methodology proposed by CMS is fundamentally flawed and actuarially unsound. In essence, inmaking the comparison referred to above, CMS relies on two interdependent sets of data to set payment rates for Medicare Advantage (MA) plans: (1) fee forservice (FFS) data from the government's original Medicare program; and (2) MA data. The proposed methodology would review medical records for onlyone set of data (MA data), while not performing the same exercise on the other set (FFS data). However, because these two sets of data are inextricablylinked, we believe CMS must audit and validate both of them before determining the financial implications of any potential RADV audit results, in order toensure that any resulting payment adjustment is accurate. We believe that the Social Security Act, under which the payment model was established, requiresthe consistent use of these data sets in determining risk-adjusted payments to MA plans. Furthermore, our payment received from CMS, as well as benefitsoffered and premiums charged to members, is based on bids that did not, by CMS design, include any assumption of retroactive audit payment adjustments.We believe that applying a retroactive audit adjustment after CMS acceptance of bids would improperly alter this process of establishing member benefits andpremiums.
CMS has received public comments, including our comments and comments from other industry participants and the American Academy of Actuaries,which expressed concerns about the failure to appropriately compare the two sets of data. On February 3, 2011, CMS issued a statement that it was closelyevaluating the comments it has received on this matter and anticipates making changes to the proposed methodology based on input it has received, althoughwe are unable to predict the extent of changes that they may make.
To date, six Humana contracts have been selected by CMS for RADV audits for the 2007 contract year, consisting of one "pilot" audit and five"targeted" audits for Humana plans. We believe that the proposed methodology for these audits is actuarially unsound and in violation of the Social SecurityAct. We intend to defend that position vigorously. However, if CMS moves forward with implementation of the proposed methodology without changes toadequately address the data inconsistency issues described above, it would have a material adverse effect on our revenues derived from the MedicareAdvantage program and, therefore, our results of operations, financial position, and cash flows.
Our Medicaid business, which accounted for approximately 2% of our total premiums and services revenue for the six months ended June 30, 2011,consists of contracts in Puerto Rico and Florida, with the vast majority in Puerto Rico. Effective October 1, 2010, as amended in May 2011, the Puerto RicoHealth Insurance Administration, or PRHIA, awarded us three contracts for the East, Southeast, and Southwest regions for a three year term through June 30,2013.
The loss of any of the contracts above or significant changes in these programs as a result of legislative action, including reductions in premiumpayments to us, or increases in member benefits without corresponding increases in premium payments to us, may have a material adverse effect on ourresults of operations, financial position, and cash flows.
16
Table of Contents
Humana Inc.NOTES TO CONDENSED CONSOLIDATED FINANCIAL STATEMENTS—(Continued)
Unaudited
Our military services business, which accounted for approximately 10% of our total premiums and services revenue for the six months ended June 30,2011, primarily consists of the TRICARE South Region contract. The original 5-year South Region contract expired on March 31, 2009 and was extendedthrough March 31, 2011. On October 5, 2010, we were notified that the Department of Defense, or DoD, TRICARE Management Activity, or TMA, intendedto negotiate with us for an extension of our administration of the TRICARE South Region contract, and on January 6, 2011, an Amendment of Solicitation/Modification of Contract to the TRICARE South Region contract became effective. The Amendment added one additional one-year option period, OptionPeriod IX (which runs from April 1, 2011 through March 31, 2012). The TMA exercised Option Period IX on March 17, 2011.
As required under the current contract, the target underwritten health care cost and underwriting fee amounts are negotiated separately. Any variancefrom the target health care cost is shared with the federal government. Accordingly, events and circumstances not contemplated in the negotiated target healthcare cost amount may have a material adverse effect on us. These changes may include an increase or reduction in the number of persons enrolled or eligibleto enroll due to the federal government's decision to increase or decrease U.S. military deployments. In the event government reimbursements were to declinefrom projected amounts, any failure to reduce the health care costs associated with these programs may have a material adverse effect on our results ofoperations, financial position, and cash flows.
In July 2009, we were notified by the DoD that we were not awarded the third generation TRICARE program contract for the South Region which hadbeen subject to competing bids. We filed a protest with the Government Accountability Office, or GAO, in connection with the award to another bidder citingdiscrepancies between the award criteria and procedures prescribed in the request for proposals issued by the DoD and those that appear to have been used bythe DoD in making its contractor selection. In October 2009, we learned that the GAO had upheld our protest, determining that the TMA evaluation of ourproposal had unreasonably failed to fully recognize and reasonably account for the likely cost savings associated with our record of obtaining networkprovider discounts from our established network in the South Region. On February 25, 2011, TMA awarded the South Region contract to us. On March 7,2011, the competing bidder filed a protest of the award with the GAO. Also on March 7, 2011, as provided in the Federal Acquisition Regulations, TMAissued a stop work order to us in connection with the award. On June 14, 2011, the GAO upheld the award of the contract to us and TMA subsequently liftedthe stop work order. On June 21, 2011, the competing bidder filed a complaint in the United States Court of Federal Claims objecting to the award of thecontract to us. That case is currently pending before the Court. Ultimate disposition of the contract award is subject to the resolution of the complaint filed bythe unsuccessful bidder.
Legal Proceedings and Certain Regulatory Matters
Provider Litigation
Humana Military Healthcare Services, Inc. ("Humana Military") was named as a defendant in Sacred Heart Health System, Inc., et al. v. HumanaMilitary Healthcare Services Inc., Case No. 3:07-cv-00062 MCR/EMT (the "Sacred Heart" Complaint), a purported class action lawsuit filed on February 5,2007 in the U.S. District Court for the Northern District of Florida asserting contract and fraud claims against Humana Military. The Sacred Heart Complaintalleged, among other things, that, Humana Military breached its network agreements with a class of hospitals in six states, including the seven namedplaintiffs, that contracted for reimbursement of outpatient services provided to beneficiaries of the DoD's TRICARE health benefits program ("TRICARE").The Complaint alleged that Humana Military breached its network agreements when it failed to reimburse the hospitals based on negotiated discounts for non-surgical outpatient services performed on or after October 1, 1999, and instead reimbursed them based on published CHAMPUS Maximum AllowableCharges (so-called "CMAC rates"). Humana Military denied that it breached the network agreements with the hospitals and asserted a number of defenses tothese claims. The Complaint sought, among other things, the following relief for the purported class members: (i) damages as a result of the alleged breach ofcontract by Humana Military, (ii) taxable costs of the litigation, (iii) attorneys fees, and (iv) any other relief the court deems just and proper. Separate andapart from the class relief, named plaintiff Sacred Heart Health System Inc. requested damages and other relief for its individual claim against
17
Table of Contents
Humana Inc.NOTES TO CONDENSED CONSOLIDATED FINANCIAL STATEMENTS—(Continued)
Unaudited
Humana Military for fraud in the inducement to contract. On September 25, 2008, the district court certified a class consisting of all institutional healthcareservice providers in TRICARE former Regions 3 and 4 which had network agreements with Humana Military to provide outpatient non-surgical services toCHAMPUS/TRICARE beneficiaries as of November 18, 1999, excluding those network providers who contractually agreed with Humana Military to submitany such disputes with Humana Military to arbitration. On March 3, 2010, the Court of Appeals reversed the district court's class certification order andremanded the case to the district court for further proceeding. On June 28, 2010, the plaintiffs sought leave of the district court to amend their complaint tojoin additional hospital plaintiffs. Humana Military filed its response to the motion on July 28, 2010. The district court granted the plaintiffs' motion to join 33additional hospitals on September 24, 2010. On October 27, 2010, the plaintiffs filed their Fourth Amended Complaint claiming the U.S. District Court for theNorthern District of Florida has subject matter jurisdiction over the case because the allegations in the complaint raise a substantial question under federallaw. The amended complaint asserts no other material changes to the allegations or relief sought by the plaintiffs. Humana Military's Answer to the FourthAmended Complaint was filed on November 30, 2010.
On March 2, 2009, in a case styled Southeast Georgia Regional Medical Center, et al. v. Humana Military Healthcare Services, Inc., the namedplaintiffs filed an arbitration demand, seeking relief on the same grounds as the plaintiffs in the Sacred Heart litigation. The arbitration plaintiffs originallysought certification of a class consisting of all institutional healthcare service providers that had contracts with Humana Military to provide outpatient non-surgical services and whose agreements provided for dispute resolution through arbitration. Humana Military submitted its response to the demand forarbitration on May 1, 2009. The plaintiffs have subsequently withdrawn their motion for class certification. On June 18, 2010, plaintiffs submitted theiramended arbitration complaint. Humana Military's answer to the complaint was submitted on July 9, 2010. On November 12, 2010, the arbitrators issued arevised case management and scheduling order and scheduled a hearing to begin on September 26, 2011.
Humana intends to defend each of these actions vigorously.
Internal Investigation
With the assistance of outside counsel, we are conducting an ongoing internal investigation related to certain aspects of our Florida subsidiaryoperations, and have voluntarily self-reported the existence of this investigation to CMS, the U.S. Department of Justice and the Florida Agency for HealthCare Administration. Matters under review include, without limitation, the relationships between certain of our Florida-based employees and providers in ourMedicaid and/or Medicare networks, practices related to the financial support of non-profit or provider access centers for Medicaid enrollment and relatedenrollment processes, and loans to or other financial support of physician practices. We have reported to the regulatory authorities noted above on the progressof our investigation to date, and intend to continue to discuss with these authorities our factual findings as well as any remedial actions we have taken or maytake.
Other Lawsuits and Regulatory Matters
Our current and past business practices are subject to review or other investigations by various state insurance and health care regulatory authorities andother state and federal regulatory authorities. These authorities regularly scrutinize the business practices of health insurance and benefits companies. Thesereviews focus on numerous facets of our business, including claims payment practices, provider contracting, competitive practices, commission payments,privacy issues, utilization management practices, and sales practices, among others. Some of these reviews have historically resulted in fines imposed on usand some have required changes to some of our practices. We continue to be subject to these reviews, which could result in additional fines or other sanctionsbeing imposed on us or additional changes in some of our practices.
On September 10, 2009, the Office of Inspector General, or OIG, of the United States Department of Health and Human Services issued subpoenas tous and our subsidiary, Humana Pharmacy, Inc., seeking documents related to
18
Table of Contents
Humana Inc.NOTES TO CONDENSED CONSOLIDATED FINANCIAL STATEMENTS—(Continued)
Unaudited
our Medicare Part D prescription plans and the operation of RightSourceRx®, our home delivery pharmacy in Phoenix, Arizona. In July 2010, the governmentinformed us that no additional materials will be sought pursuant to the subpoenas.
We also are involved in various other lawsuits that arise, for the most part, in the ordinary course of our business operations, including employmentlitigation, claims of medical malpractice, bad faith, nonacceptance or termination of providers, anticompetitive practices, improper rate setting, failure todisclose network discounts and various other provider arrangements, general contractual matters, intellectual property matters, and challenges to subrogationpractices, certain of which may be styled as class-action lawsuits. We also are subject to claims relating to performance of contractual obligations toproviders, members, and others, including failure to properly pay claims, improper policy terminations, challenges to our implementation of the Medicare PartD prescription drug program and other litigation.
Personal injury claims and claims for extracontractual damages arising from medical benefit denials are covered by insurance from our wholly ownedcaptive insurance subsidiary and excess carriers, except to the extent that claimants seek punitive damages, which may not be covered by insurance in certainstates in which insurance coverage for punitive damages is not permitted. In addition, insurance coverage for all or certain forms of liability has becomeincreasingly costly and may become unavailable or prohibitively expensive in the future.
We record accruals for such contingencies to the extent that we conclude it is probable that a liability has been incurred and the amount of the loss canbe reasonably estimated. No estimate of the possible loss or range of loss in excess of amounts accrued, if any, can be made at this time regarding the mattersspecifically described above because the inherently unpredictable nature of legal proceedings may be exacerbated by various factors, including: (i) thedamages sought in the proceedings are unsubstantiated or indeterminate; (ii) discovery is not complete; (iii) the proceeding is in its early stages; (iv) thematters present legal uncertainties; (v) there are significant facts in dispute; (vi) there are a large number of parties (including where it is uncertain howliability, if any, will be shared among multiple defendants); or (vii) there is a wide range of potential outcomes.
The outcome of any current or future litigation or governmental or internal investigations, including the matters described above, cannot be accuratelypredicted, nor can we predict any resulting penalties, fines or other sanctions that may be imposed at the discretion of federal or state regulatory authorities.Nevertheless, it is reasonably possible that any such penalties, fines or other sanctions could be substantial, and the outcome of these matters may have amaterial adverse effect on our results of operations, financial position, and cash flows and may affect our reputation.
13. SEGMENT INFORMATION
During the first quarter of 2011, we realigned our business segments to reflect our evolving business model. As a result, we reassessed and changed ouroperating and reportable segments in the first quarter of 2011 to reflect managements' new view of the business and to align our external financial reportingwith our new operating and internal financial reporting model. Historical segment information has been retrospectively adjusted to reflect the effect of thischange. Our new reportable segments and the basis for determining those segments are discussed below.
We manage our business with three reportable segments: Retail, Employer Group, and Health and Well-Being Services. In addition, we includebusinesses that are not individually reportable because they do not meet the quantitative thresholds in an Other Businesses category. These segments are basedon a combination of the type of health plan customer and adjacent businesses centered on well-being solutions for our health plans and other customers, asdescribed below. These segment groupings are consistent with information used by our Chief Executive Officer to assess performance and allocate resources.
The Retail segment consists of Medicare and commercial fully-insured medical and specialty health insurance benefits, including dental, vision, andother supplemental health and financial protection products, marketed directly to individuals. The Employer Group segment consists of Medicare andcommercial fully-insured medical and specialty health insurance benefits, including dental, vision, and other supplemental health and financial protection
19

Table of Contents
Humana Inc.NOTES TO CONDENSED CONSOLIDATED FINANCIAL STATEMENTS—(Continued)
Unaudited
products, as well as administrative services only products marketed to employer groups. The Health and Well-Being Services segment includes servicesoffered to our health plan members as well as to third parties that promote health and wellness, including primary care, pharmacy, integrated wellness, andhome care services. The Other Businesses category consists of our Military services, primarily our TRICARE South region contract, Medicaid, and closed-block long-term care businesses as well as our contract with CMS to administer the Limited Income Newly Eligible Transition (LI-NET) program.
Our Health and Well-Being Services intersegment revenues primarily relate to managing prescription drug coverage for members of our other segmentsthrough Humana Pharmacy Solutions®, or HPS, and includes the operations of RightSourceRx®, our home delivery pharmacy business. These revenuesconsist of the prescription price (ingredient cost plus dispensing fee), including the portion to be settled with the member (co-share) or with the government(subsidies), plus any associated administrative fees. Service revenues related to the distribution of prescriptions by third party retail pharmacies in ournetworks are recognized when the claim is processed. Product revenues from dispensing prescriptions from our home delivery pharmacies are recorded whenthe prescription or product is shipped. Our pharmacy operations, which are responsible for designing pharmacy benefits, including defining member co-shareresponsibilities, determining formulary listings, selecting and establishing prices charged by retail pharmacies, confirming member eligibility, reviewing drugutilization, and processing claims, act as a principal in the arrangement on behalf of members in our other segments. As principal, our Health and Well-BeingServices segment reports revenues on a gross basis including co-share amounts from members collected by third party retail pharmacies at the point ofservice.
We present our consolidated results of operations from the perspective of the health plans. As a result, the cost of providing benefits to our members,whether provided via a third party provider or internally through a stand-alone subsidiary, is classified as benefits expense and excludes the portion of the costfor which the health plans do not bear responsibility, including member co-share amounts and government subsidies of $1.0 billion and $0.9 billion for thethree months ended June 30, 2011 and 2010, respectively. For the six months ended June 30, 2011 and 2010, these amounts were $2.0 billion and $1.7 billion,respectively.
Other than those described previously, the accounting policies of each segment are the same and are described in Note 2 to the consolidated financialstatements included in our Form 10-K for the year ended December 31, 2010. Transactions between reportable segments consist of sales of services renderedby our Health and Well-Being Services segment, primarily pharmacy and behavioral health services, to our Retail and Employer Group customers.Intersegment sales and expenses are recorded at fair value and eliminated in consolidation. Members served by our segments often utilize the same providernetworks, enabling us in some instances to obtain more favorable contract terms with providers. Our segments also share indirect costs and assets. As a result,the profitability of each segment is interdependent. We do not report total assets by segment since this is not a metric used to assess performance and allocateresources. We allocate most operating expenses to our segments. Certain corporate income and expenses are not allocated to the segments, includinginvestment income not supporting segment operations, interest expense on corporate debt, and certain corporate expenses. These items are managed at thecorporate level and are not the responsibility of segment management. These corporate amounts are reported separately from our reportable segments andincluded with intersegment eliminations in the tables presenting segment results below.
20
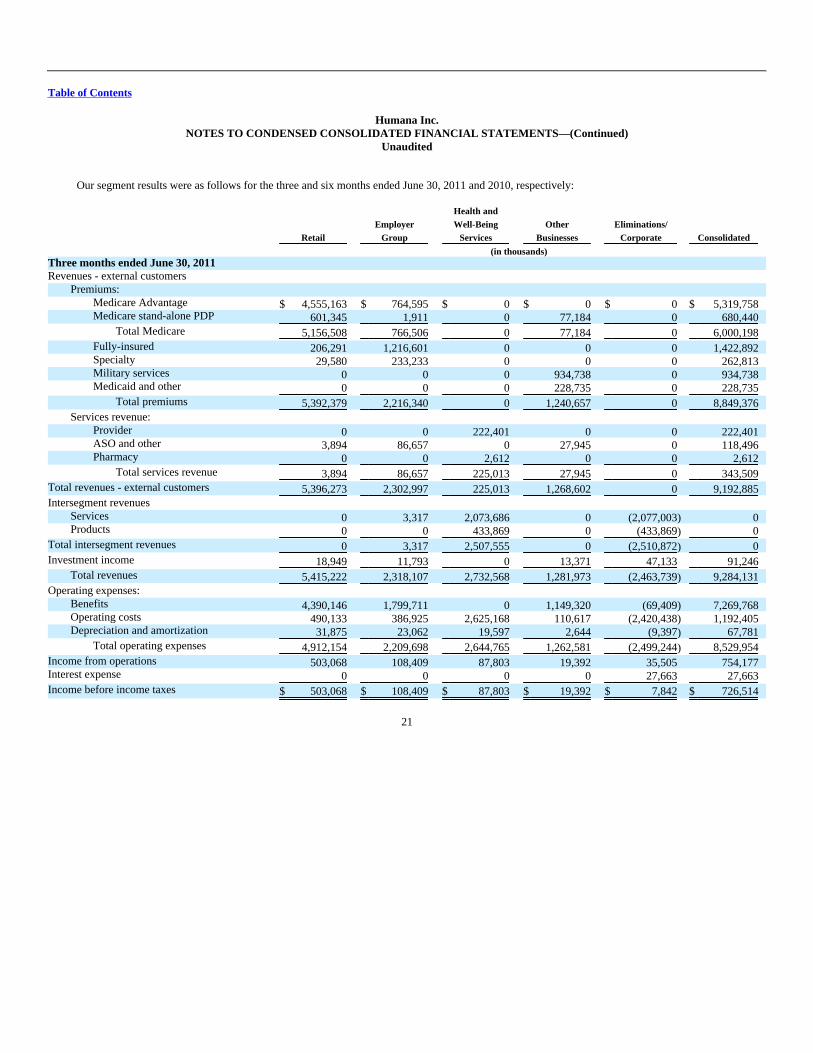
Table of Contents
Humana Inc.NOTES TO CONDENSED CONSOLIDATED FINANCIAL STATEMENTS—(Continued)
Unaudited
Our segment results were as follows for the three and six months ended June 30, 2011 and 2010, respectively:
Retail
EmployerGroup
Health andWell-Being
Services
OtherBusinesses
Eliminations/Corporate Consolidated
(in thousands) Three months ended June 30, 2011 Revenues - external customers
Premiums: Medicare Advantage $ 4,555,163 $ 764,595 $ 0 $ 0 $ 0 $ 5,319,758 Medicare stand-alone PDP 601,345 1,911 0 77,184 0 680,440
Total Medicare 5,156,508 766,506 0 77,184 0 6,000,198
Fully-insured 206,291 1,216,601 0 0 0 1,422,892 Specialty 29,580 233,233 0 0 0 262,813 Military services 0 0 0 934,738 0 934,738 Medicaid and other 0 0 0 228,735 0 228,735
Total premiums 5,392,379 2,216,340 0 1,240,657 0 8,849,376
Services revenue: Provider 0 0 222,401 0 0 222,401 ASO and other 3,894 86,657 0 27,945 0 118,496 Pharmacy 0 0 2,612 0 0 2,612
Total services revenue 3,894 86,657 225,013 27,945 0 343,509
Total revenues - external customers 5,396,273 2,302,997 225,013 1,268,602 0 9,192,885
Intersegment revenues Services 0 3,317 2,073,686 0 (2,077,003) 0 Products 0 0 433,869 0 (433,869) 0
Total intersegment revenues 0 3,317 2,507,555 0 (2,510,872) 0
Investment income 18,949 11,793 0 13,371 47,133 91,246
Total revenues 5,415,222 2,318,107 2,732,568 1,281,973 (2,463,739) 9,284,131
Operating expenses: Benefits 4,390,146 1,799,711 0 1,149,320 (69,409) 7,269,768 Operating costs 490,133 386,925 2,625,168 110,617 (2,420,438) 1,192,405 Depreciation and amortization 31,875 23,062 19,597 2,644 (9,397) 67,781
Total operating expenses 4,912,154 2,209,698 2,644,765 1,262,581 (2,499,244) 8,529,954
Income from operations 503,068 108,409 87,803 19,392 35,505 754,177 Interest expense 0 0 0 0 27,663 27,663
Income before income taxes $ 503,068 $ 108,409 $ 87,803 $ 19,392 $ 7,842 $ 726,514
21

Table of Contents
Humana Inc.NOTES TO CONDENSED CONSOLIDATED FINANCIAL STATEMENTS—(Continued)
Unaudited
Retail
EmployerGroup
Health andWell-Being
Services
OtherBusinesses
Eliminations/Corporate Consolidated
(in thousands) Three months ended June 30, 2010 Revenues - external customers
Premiums: Medicare Advantage $ 4,106,667 $ 778,542 $ 0 $ 0 $ 0 $ 4,885,209 Medicare stand-alone PDP 504,296 1,154 0 194,772 0 700,222
Total Medicare 4,610,963 779,696 0 194,772 0 5,585,431
Fully-insured 183,261 1,300,759 0 0 0 1,484,020 Specialty 19,668 224,093 0 0 0 243,761 Military services 0 0 0 885,368 0 885,368 Medicaid and other 0 0 0 178,171 0 178,171
Total premiums 4,813,892 2,304,548 0 1,258,311 0 8,376,751
Services revenue: Provider 0 0 2,891 0 0 2,891 ASO and other 2,540 100,234 0 27,037 0 129,811 Pharmacy 0 0 0 0 0 0
Total services revenue 2,540 100,234 2,891 27,037 0 132,702
Total revenues - external customers 4,816,432 2,404,782 2,891 1,285,348 0 8,509,453
Intersegment revenues Services 0 3,279 1,923,802 0 (1,927,081) 0 Products 0 0 306,983 0 (306,983) 0
Total intersegment revenues 0 3,279 2,230,785 0 (2,234,064) 0
Investment income 19,529 10,207 0 10,027 40,027 79,790
Total revenues 4,835,961 2,418,268 2,233,676 1,295,375 (2,194,037) 8,589,243
Operating expenses: Benefits 3,923,278 1,870,910 0 1,127,876 (52,968) 6,869,096 Operating costs 555,035 414,505 2,176,392 115,248 (2,167,490) 1,093,690 Depreciation and amortization 31,710 25,097 6,411 3,129 (1,966) 64,381
Total operating expenses 4,510,023 2,310,512 2,182,803 1,246,253 (2,222,424) 8,027,167
Income from operations 325,938 107,756 50,873 49,122 28,387 562,076 Interest expense 0 0 0 0 26,222 26,222
Income before income taxes $ 325,938 $ 107,756 $ 50,873 $ 49,122 $ 2,165 $ 535,854
22

Table of Contents
Humana Inc.NOTES TO CONDENSED CONSOLIDATED FINANCIAL STATEMENTS—(Continued)
Unaudited
Retail
EmployerGroup
Health andWell-Being
Services
OtherBusinesses
Eliminations/Corporate Consolidated
(in thousands) Six months ended June 30, 2011 Revenues - external customers
Premiums: Medicare Advantage $ 9,079,789 $ 1,561,349 $ 0 $ 0 $ 0 $ 10,641,138 Medicare stand-alone PDP 1,158,817 3,728 0 153,080 0 1,315,625
Total Medicare 10,238,606 1,565,077 0 153,080 0 11,956,763
Fully-insured 407,179 2,415,191 0 0 0 2,822,370 Specialty 55,355 462,884 0 0 0 518,239 Military services 0 0 0 1,858,015 0 1,858,015 Medicaid and other 0 0 0 460,280 0 460,280
Total premiums 10,701,140 4,443,152 0 2,471,375 0 17,615,667
Services revenue: Provider 0 0 437,447 0 0 437,447 ASO and other 6,767 179,203 0 50,215 0 236,185 Pharmacy 0 0 4,819 0 0 4,819
Total services revenue 6,767 179,203 442,266 50,215 0 678,451
Total revenues - external customers 10,707,907 4,622,355 442,266 2,521,590 0 18,294,118
Intersegment revenues Services 0 6,598 4,195,077 0 (4,201,675) 0 Products 0 0 868,509 0 (868,509) 0
Total intersegment revenues 0 6,598 5,063,586 0 (5,070,184) 0
Investment income 37,945 23,408 0 25,675 93,703 180,731
Total revenues 10,745,852 4,652,361 5,505,852 2,547,265 (4,976,481) 18,474,849
Operating expenses: Benefits 8,944,389 3,551,115 0 2,258,759 (139,741) 14,614,522 Operating costs 1,022,545 810,832 5,281,450 229,571 (4,896,150) 2,448,248 Depreciation and amortization 58,860 43,250 40,226 4,352 (12,798) 133,890
Total operating expenses 10,025,794 4,405,197 5,321,676 2,492,682 (5,048,689) 17,196,660
Income from operations 720,058 247,164 184,176 54,583 72,208 1,278,189 Interest expense 0 0 0 0 54,891 54,891
Income before income taxes $ 720,058 $ 247,164 $ 184,176 $ 54,583 $ 17,317 $ 1,223,298
23
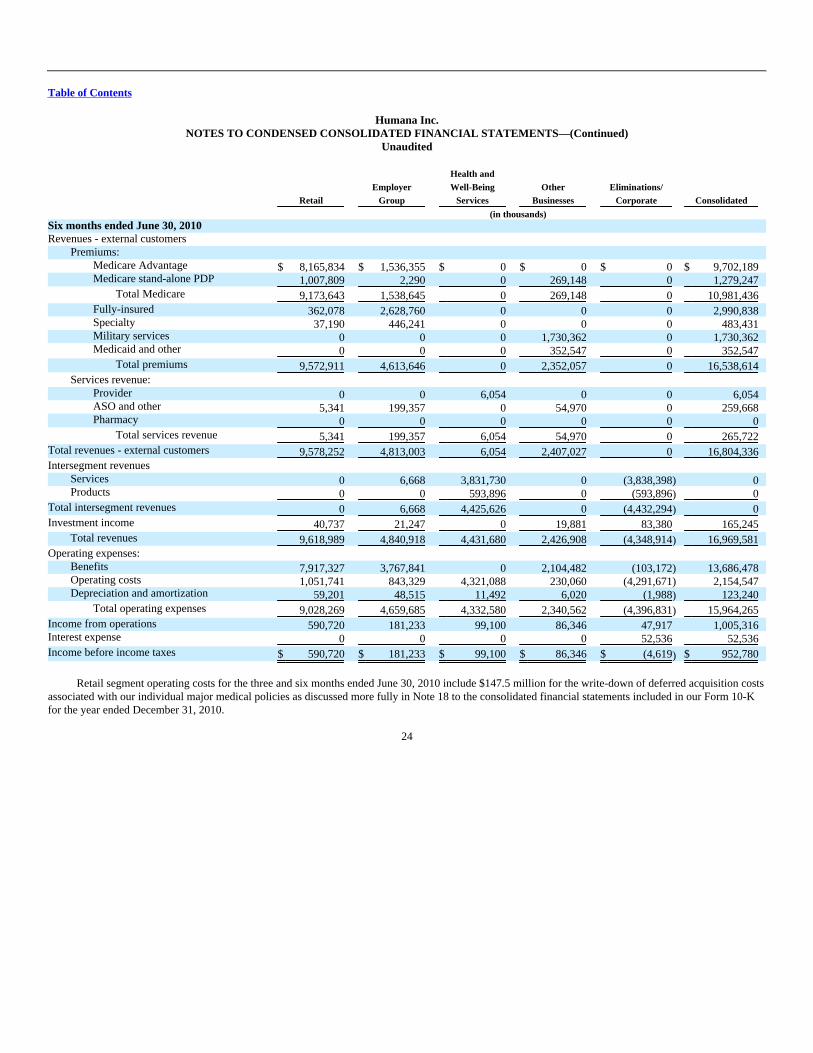
Table of Contents
Humana Inc.NOTES TO CONDENSED CONSOLIDATED FINANCIAL STATEMENTS—(Continued)
Unaudited
Retail
EmployerGroup
Health andWell-Being
Services
OtherBusinesses
Eliminations/Corporate Consolidated
(in thousands) Six months ended June 30, 2010 Revenues - external customers
Premiums: Medicare Advantage $ 8,165,834 $ 1,536,355 $ 0 $ 0 $ 0 $ 9,702,189 Medicare stand-alone PDP 1,007,809 2,290 0 269,148 0 1,279,247
Total Medicare 9,173,643 1,538,645 0 269,148 0 10,981,436
Fully-insured 362,078 2,628,760 0 0 0 2,990,838 Specialty 37,190 446,241 0 0 0 483,431 Military services 0 0 0 1,730,362 0 1,730,362 Medicaid and other 0 0 0 352,547 0 352,547
Total premiums 9,572,911 4,613,646 0 2,352,057 0 16,538,614
Services revenue: Provider 0 0 6,054 0 0 6,054 ASO and other 5,341 199,357 0 54,970 0 259,668 Pharmacy 0 0 0 0 0 0
Total services revenue 5,341 199,357 6,054 54,970 0 265,722
Total revenues - external customers 9,578,252 4,813,003 6,054 2,407,027 0 16,804,336
Intersegment revenues Services 0 6,668 3,831,730 0 (3,838,398) 0 Products 0 0 593,896 0 (593,896) 0
Total intersegment revenues 0 6,668 4,425,626 0 (4,432,294) 0
Investment income 40,737 21,247 0 19,881 83,380 165,245
Total revenues 9,618,989 4,840,918 4,431,680 2,426,908 (4,348,914) 16,969,581
Operating expenses: Benefits 7,917,327 3,767,841 0 2,104,482 (103,172) 13,686,478 Operating costs 1,051,741 843,329 4,321,088 230,060 (4,291,671) 2,154,547 Depreciation and amortization 59,201 48,515 11,492 6,020 (1,988) 123,240
Total operating expenses 9,028,269 4,659,685 4,332,580 2,340,562 (4,396,831) 15,964,265
Income from operations 590,720 181,233 99,100 86,346 47,917 1,005,316 Interest expense 0 0 0 0 52,536 52,536
Income before income taxes $ 590,720 $ 181,233 $ 99,100 $ 86,346 $ (4,619) $ 952,780
Retail segment operating costs for the three and six months ended June 30, 2010 include $147.5 million for the write-down of deferred acquisition costsassociated with our individual major medical policies as discussed more fully in Note 18 to the consolidated financial statements included in our Form 10-Kfor the year ended December 31, 2010.
24

Table of Contents
Humana Inc.MANAGEMENT'S DISCUSSION AND ANALYSIS OF
FINANCIAL CONDITION AND RESULTS OF OPERATIONS
The condensed consolidated financial statements of Humana Inc. in this document present the Company's financial position, results of operations andcash flows, and should be read in conjunction with the following discussion and analysis. References to "we," "us," "our," "Company," and "Humana" meanHumana Inc. and its subsidiaries. This discussion includes forward-looking statements within the meaning of the Private Securities Litigation Reform Act of1995. When used in filings with the SEC, in our press releases, investor presentations, and in oral statements made by or with the approval of one of ourexecutive officers, the words or phrases like "expects," "anticipates," "intends," "likely will result," "estimates," "projects" or variations of such words andsimilar expressions are intended to identify such forward–looking statements. These forward–looking statements are not guarantees of future performanceand are subject to risks, uncertainties and assumptions, including, among other things, information set forth in Item 1A. – Risk Factors in our Form 10-K forthe year ended December 31, 2010 that was filed with the SEC on February 17, 2011, as modified by any changes to those risk factors included in thisdocument and in other reports we filed subsequent to February 17, 2011, in each case incorporated by reference herein. In making these statements, we arenot undertaking to address or update these factors in future filings or communications regarding our business or results. In light of these risks, uncertaintiesand assumptions, the forward–looking events discussed in this document might not occur. There may also be other risks that we are unable to predict at thistime. Any of these risks and uncertainties may cause actual results to differ materially from the results discussed in the forward–looking statements.
Executive Overview
General
Headquartered in Louisville, Kentucky, Humana is a leading health care company that offers a wide range of insurance products and health andwellness services that incorporate an integrated approach to lifelong well-being. By leveraging the strengths of our core businesses, we believe that we canbetter explore opportunities for existing and emerging adjacencies in health care that can further enhance wellness opportunities for the millions of peopleacross the nation with whom we have relationships.
Our industry relies on two key statistics to measure performance. The benefit ratio, which is computed by taking total benefit expenses as a percentageof premiums revenue, represents a statistic used to measure underwriting profitability. The operating cost ratio, which is computed by taking total operatingcosts as a percentage of total revenue less investment income, represents a statistic used to measure administrative spending efficiency.
2011 Business Segment Realignment
During the first quarter of 2011, we realigned our business segments to reflect our evolving business model. As a result, we reassessed and changed ouroperating and reportable segments in the first quarter of 2011 to reflect managements' new view of the business and to align our external financial reportingwith our new operating and internal financial reporting model. Historical segment information has been retrospectively adjusted to reflect the effect of thischange. Our new reportable segments and the basis for determining those segments are discussed below.
Business Segments
We now manage our business with three reportable segments: Retail, Employer Group, and Health and Well-Being Services. In addition, we includeother businesses that are not reportable because they do not meet the quantitative thresholds in an Other Businesses category. These segments are based on acombination of the type of health plan customer and adjacent businesses centered on well-being solutions for our health plans and other customers, asdescribed below. These segment groupings are consistent with information used by our Chief Executive Officer to assess performance and allocate resources.
The Retail segment consists of Medicare and commercial fully-insured medical and specialty health insurance benefits, including dental, vision, andother supplemental health and financial protection products, marketed directly
25

Table of Contents
to individuals. The Employer Group segment consists of Medicare and commercial fully-insured medical and specialty health insurance benefits, includingdental, vision, and other supplemental health and financial protection products, as well as administrative services only products marketed to employer groups.The Health and Well-Being Services segment includes services offered to our health plan members as well as to third parties that promote health andwellness, including primary care, pharmacy, integrated wellness, and home care services. The Other Businesses category consists of our Military services,primarily our TRICARE South region contract, Medicaid, and closed-block long-term care businesses as well as our contract with CMS to administer theLimited Income Newly Eligible Transition (LI-NET) program.
The results of each segment are measured by income before income taxes. Transactions between reportable segments consist of sales of servicesrendered by our Health and Well-Being Services segment, primarily pharmacy and behavioral health services, to our Retail and Employer Group customers.Intersegment sales and expenses are recorded at fair value and eliminated in consolidation. Members served by our segments often utilize the same providernetworks, enabling us in some instances to obtain more favorable contract terms with providers. Our segments also share indirect costs and assets. As a result,the profitability of each segment is interdependent. We do not report total assets by segment since this is not a metric used to assess performance and allocateresources. We allocate most operating expenses to our segments. Certain corporate income and expenses are not allocated to the segments, includinginvestment income not supporting segment operations, interest expense on corporate debt, and certain corporate expenses. These items are managed at thecorporate level and are not the responsibility of segment management. These corporate amounts are reported separately from our reportable segments andincluded with intersegment eliminations.
Seasonality
Our Retail segment offers Medicare stand-alone prescription drug plans, or PDPs, under the Medicare Part D program. These plans provide varyingdegrees of coverage. Our quarterly Retail segment earnings and operating cash flows are impacted by the Medicare Part D benefit design and changes in thecomposition of our membership. The Medicare Part D benefit design results in coverage that varies as a member's cumulative out-of-pocket costs passthrough successive stages of a member's plan period which begins annually on January 1 for renewals. These plan designs generally result in us sharing agreater portion of the responsibility for total prescription drug costs in the early stages and less in the latter stages. As a result, the PDP benefit ratio generallydecreases as the year progresses. In addition, the number of low-income senior members as well as year-over-year changes in the mix of membership in ourstand-alone PDP products affect the quarterly benefit ratio pattern.
2011 Highlights
Consolidated
• We experienced favorable prior-period medical claims reserve development of approximately $55.1 million, or $0.21 per diluted common share,for the three months ended June 30, 2011 and $117.0 million, or $0.44 per diluted common share, for the three months ended June 30, 2010. Forthe six months ended June 30, 2011, we experienced favorable prior-period development of approximately $116.8 million, or $0.44 per dilutedcommon share, compared to $137.5 million, or $0.51 per diluted common share, for the six months ended June 30, 2010.
• In April 2011, our Board of Directors approved a quarterly cash dividend policy and declared a cash dividend to stockholders of $0.25 per share.The dividend aggregating $41.5 million was paid on July 28, 2011 to stockholders of record on June 30, 2011.
• In addition, in April 2011, the Board of Directors replaced its previously approved share repurchase authorization of up to $250 million with anew authorization for repurchases of up to $1 billion. The new authorization will expire June 30, 2013. As of August 1, 2011, the remainingauthorized amount under the new authorization totaled $799.9 million.
• Our year-over-year quarterly and year-to-date comparisons are impacted by the $147.5 million write-down of deferred acquisition costsassociated with our individual major medical policies during the three months
26
Table of Contents
ended June 30, 2010 as discussed more fully in Note 18 to the consolidated financial statements included in our Form 10-K for the year endedDecember 31, 2010.
Retail
• On April 4, 2011, CMS announced that Medicare Advantage payment rates will increase on average 0.4% sector-wide in 2012. We believe thatwe can effectively design Medicare Advantage products based upon this level of rate increase while continuing to remain competitive comparedto both the combination of original Medicare with a supplement policy as well as other Medicare Advantage competitors within our industry. Inaddition, we will continue to pursue our cost-reduction and outcome-enhancing strategies, including care coordination and disease management,which we believe will mitigate the adverse effects of the rates on our Medicare Advantage members. Nonetheless, there can be no assurance thatwe will be able to successfully execute operational and strategic initiatives with respect to changes in the Medicare Advantage program. Failureto execute these strategies may result in a material adverse effect on our results of operations, financial position, and cash flows.
• Individual Medicare Advantage membership of 1,602,500 at June 30, 2011 increased 141,800 members, or 9.7%, from 1,460,700 atDecember 31, 2010 and increased 139,600, or 9.5%, from 1,462,900 at June 30, 2010 primarily due to a successful enrollment season associatedwith the 2011 plan year.
• Individual Medicare stand-alone PDP membership of 2,408,700 at June 30, 2011 increased 738,400 members, or 44.2%, from 1,670,300 atDecember 31, 2010 and increased 700,700, or 41.0%, from 1,708,000 at June 30, 2010, primarily due to sales of our new lowest premiumnational stand-alone Medicare Part D prescription drug plan co-branded with Wal-Mart Stores, Inc., the Humana Walmart-Preferred Rx Plan, thatwe began offering for the 2011 plan year.
• Our year-over-year quarterly and year-to-date Retail segment comparisons are impacted by the $147.5 million write-down of deferred acquisitioncosts associated with our individual major medical policies during the three months ended June 30, 2010 as discussed above.
Other Businesses
• As more fully discussed in Note 12 to the condensed consolidated financial statements, on February 25, 2011, the TMA awarded the TRICARESouth Region contract to us. On March 7, 2011, the competing bidder filed a protest of the award with the GAO. Also on March 7, 2011, asprovided in the Federal Acquisition Regulations, TMA issued a stop work order to us in connection with the award. On June 14, 2011, the GAOupheld the award of the contract to us and TMA subsequently lifted the stop work order. On June 21, 2011, the competing bidder filed acomplaint in the United States Court of Federal Claims objecting to the award of the contract to us. That case is currently pending before theCourt. As a result of the award of the TRICARE South Region contract to us, we no longer expect a goodwill impairment to occur during thesecond half of 2011. Ultimate disposition of the contract award is, however, subject to the resolution of the complaint filed by the unsuccessfulbidder.
Health Insurance Reform
In March 2010, the President signed into law The Patient Protection and Affordable Care Act and The Health Care and Education Reconciliation Act of2010 (which we collectively refer to as the Health Insurance Reform Legislation) which enact significant reforms to various aspects of the U.S. healthinsurance industry. While regulations and interpretive guidance on some provisions of the Health Insurance Reform Legislation have been issued to date bythe Department of Health and Human Services (HHS), the Department of Labor, the Treasury Department, and the National Association of InsuranceCommissioners, there are many significant provisions of the legislation that will require additional guidance and clarification in the form of regulations andinterpretations in order to fully understand the impacts of the legislation on our overall business, which we expect to occur over the next several years.
Implementation dates of the Health Insurance Reform Legislation vary from as early as six months from the date of enactment, or September 23, 2010,to as late as 2018. The following outlines certain provisions of the Health Insurance Reform Legislation:
27
Table of Contents
• Changes effective for plan years beginning on or after September 23, 2010 included: elimination of pre-existing condition limits for enrolleesunder age 19, elimination of certain annual and lifetime caps on the dollar value of benefits, expansion of dependent coverage to include adultchildren until age 26, a requirement to provide coverage for preventive services without cost to members, new claim appeal requirements, and theestablishment of an interim high risk program for those unable to obtain coverage due to a pre-existing condition or health status.
• Effective January 1, 2011, minimum benefit ratios were mandated for all commercial fully-insured medical plans in the large group (85%), smallgroup (80%), and individual (80%) markets, with annual rebates to policyholders if the actual benefit ratios do not meet these minimums. Initialrebate payments will be made in mid-2012.
• Medicare Advantage payment benchmarks for 2011 were frozen at 2010 levels and beginning in 2012, additional cuts to Medicare Advantageplan payments will begin to take effect (plans will receive a range of 95% in high-cost areas to 115% in low-cost areas of Medicare fee-for-service rates), with changes being phased-in over two to six years, depending on the level of payment reduction in a county. In addition,beginning in 2011, the gap in coverage for Medicare Part D prescription drug coverage has begun to incrementally close.
• Beginning in 2014, the Health Insurance Reform Legislation requires: all individual and group health plans to guarantee issuance and renewcoverage without pre-existing condition exclusions or health-status rating adjustments; the elimination of annual limits on coverage on certainplans; the establishment of state-based exchanges for individuals and small employers (with up to 100 employees); the introduction ofstandardized plan designs based on set actuarial values; the establishment of a minimum benefit ratio of 85% for Medicare Advantage plans; andinsurance industry assessments, including an annual premium-based assessment ($8 billion levied on the insurance industry in 2014 withincreasing annual amounts thereafter), which is not deductible for income tax purposes.
The Health Insurance Reform Legislation also specifies required benefit designs, limits rating and pricing practices, encourages additional competition(including potential incentives for new market entrants) and expands eligibility for Medicaid programs. In addition, the law will significantly increase federaloversight of health plan premium rates and could adversely affect our ability to appropriately adjust health plan premiums on a timely basis. Financing forthese reforms will come, in part, from material additional fees and taxes on us and other health insurers, health plans and individuals beginning in 2014, aswell as reductions in certain levels of payments to us and other health plans under Medicare as described above.
As discussed above, implementing regulations and related interpretive guidance continue to be issued on several significant provisions of the HealthInsurance Reform Legislation, and certain aspects of the Health Insurance Reform Legislation are also being challenged in federal court, seeking to limit thescope of or have all or portions of the Health Insurance Reform Legislation declared unconstitutional. Judicial proceedings are subject to appeal and could lastfor an extended period of time, and we cannot predict the results of any of these proceedings. Congress may also withhold the funding necessary to implementthe Health Insurance Reform Legislation, or may attempt to replace the legislation with amended provisions or repeal it altogether. Given the breadth ofpossible changes and the uncertainties of interpretation, implementation, and timing of these changes, which we expect to occur over the next several years,the Health Insurance Reform Legislation could change the way we do business, potentially impacting our pricing, benefit design, product mix, geographicmix, and distribution channels. The response of other companies to the Health Insurance Reform Legislation and adjustments to their offerings, if any, couldcause meaningful disruption in the local health care markets. Further, various health insurance reform proposals are also emerging at the state level. It isreasonably possible that the Health Insurance Reform Legislation and related regulations, as well as future legislative changes, in the aggregate may have amaterial adverse effect on our results of operations, including restricting revenue, enrollment and premium growth in certain products and market segments,restricting our ability to expand into new markets, increasing our medical and administrative costs, lowering our Medicare payment rates and increasing ourexpenses associated with the non-deductible federal premium tax and other assessments; our financial position, including our ability to maintain the value ofour goodwill; and our cash flows. If the new non-deductible federal premium tax is imposed as enacted, and if we are unable to adjust our business model toaddress this new tax, there can be no assurance that the non-deductible federal premium tax would not have a material adverse effect on our results ofoperations, financial position, and cash flows.
28
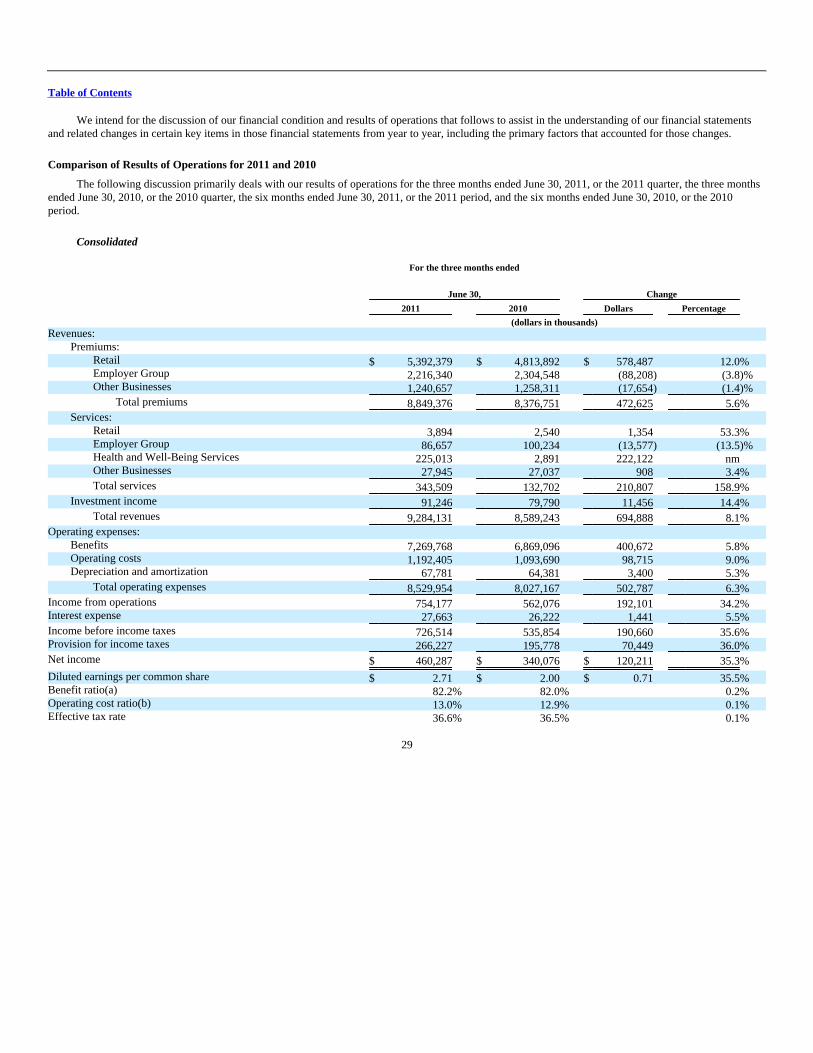
Table of Contents
We intend for the discussion of our financial condition and results of operations that follows to assist in the understanding of our financial statementsand related changes in certain key items in those financial statements from year to year, including the primary factors that accounted for those changes.
Comparison of Results of Operations for 2011 and 2010
The following discussion primarily deals with our results of operations for the three months ended June 30, 2011, or the 2011 quarter, the three monthsended June 30, 2010, or the 2010 quarter, the six months ended June 30, 2011, or the 2011 period, and the six months ended June 30, 2010, or the 2010period.
Consolidated
For the three months ended
June 30, Change
2011 2010 Dollars Percentage
(dollars in thousands) Revenues:
Premiums: Retail $ 5,392,379 $ 4,813,892 $ 578,487 12.0% Employer Group 2,216,340 2,304,548 (88,208) (3.8)% Other Businesses 1,240,657 1,258,311 (17,654) (1.4)%
Total premiums 8,849,376 8,376,751 472,625 5.6%
Services: Retail 3,894 2,540 1,354 53.3% Employer Group 86,657 100,234 (13,577) (13.5)% Health and Well-Being Services 225,013 2,891 222,122 nm Other Businesses 27,945 27,037 908 3.4%
Total services 343,509 132,702 210,807 158.9%
Investment income 91,246 79,790 11,456 14.4%
Total revenues 9,284,131 8,589,243 694,888 8.1%
Operating expenses: Benefits 7,269,768 6,869,096 400,672 5.8% Operating costs 1,192,405 1,093,690 98,715 9.0% Depreciation and amortization 67,781 64,381 3,400 5.3%
Total operating expenses 8,529,954 8,027,167 502,787 6.3%
Income from operations 754,177 562,076 192,101 34.2% Interest expense 27,663 26,222 1,441 5.5%
Income before income taxes 726,514 535,854 190,660 35.6% Provision for income taxes 266,227 195,778 70,449 36.0%
Net income $ 460,287 $ 340,076 $ 120,211 35.3%
Diluted earnings per common share $ 2.71 $ 2.00 $ 0.71 35.5% Benefit ratio(a) 82.2% 82.0% 0.2% Operating cost ratio(b) 13.0% 12.9% 0.1% Effective tax rate 36.6% 36.5% 0.1%
29
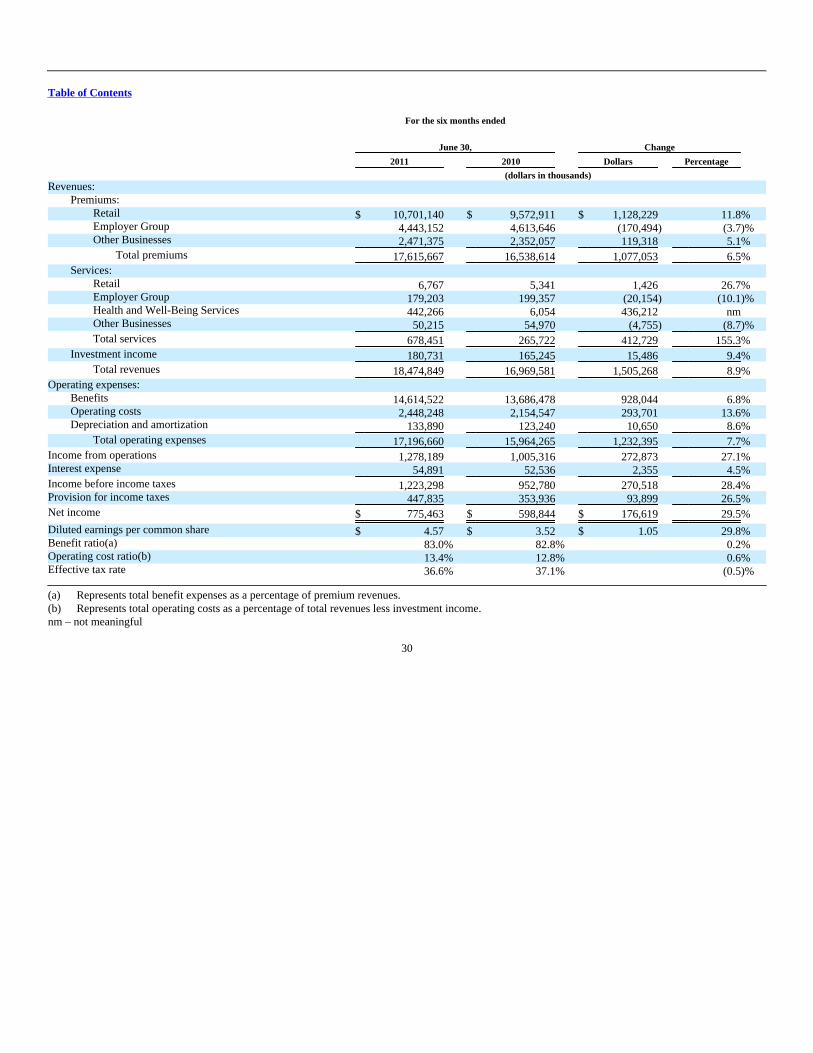
Table of Contents
For the six months ended
June 30, Change
2011 2010 Dollars Percentage
(dollars in thousands) Revenues:
Premiums: Retail $ 10,701,140 $ 9,572,911 $ 1,128,229 11.8% Employer Group 4,443,152 4,613,646 (170,494) (3.7)% Other Businesses 2,471,375 2,352,057 119,318 5.1%
Total premiums 17,615,667 16,538,614 1,077,053 6.5%
Services: Retail 6,767 5,341 1,426 26.7% Employer Group 179,203 199,357 (20,154) (10.1)% Health and Well-Being Services 442,266 6,054 436,212 nm Other Businesses 50,215 54,970 (4,755) (8.7)%
Total services 678,451 265,722 412,729 155.3%
Investment income 180,731 165,245 15,486 9.4%
Total revenues 18,474,849 16,969,581 1,505,268 8.9%
Operating expenses: Benefits 14,614,522 13,686,478 928,044 6.8% Operating costs 2,448,248 2,154,547 293,701 13.6% Depreciation and amortization 133,890 123,240 10,650 8.6%
Total operating expenses 17,196,660 15,964,265 1,232,395 7.7%
Income from operations 1,278,189 1,005,316 272,873 27.1% Interest expense 54,891 52,536 2,355 4.5%
Income before income taxes 1,223,298 952,780 270,518 28.4% Provision for income taxes 447,835 353,936 93,899 26.5%
Net income $ 775,463 $ 598,844 $ 176,619 29.5%
Diluted earnings per common share $ 4.57 $ 3.52 $ 1.05 29.8% Benefit ratio(a) 83.0% 82.8% 0.2% Operating cost ratio(b) 13.4% 12.8% 0.6% Effective tax rate 36.6% 37.1% (0.5)% (a) Represents total benefit expenses as a percentage of premium revenues.(b) Represents total operating costs as a percentage of total revenues less investment income.nm – not meaningful
30

Table of Contents
Summary
Net income was $460.3 million, or $2.71 per diluted common share, in the 2011 quarter compared to $340.1 million, or $2.00 per diluted commonshare, in the 2010 quarter. Net income was $775.5 million, or $4.57 per diluted common share, in the 2011 period compared to $598.8 million, or $3.52 perdiluted common share, in the 2010 period. The increases during the 2011 quarter and period primarily were due to improved operating performance in theRetail, Health and Well-Being Services, and Employer Group Segments. Our diluted earnings per common share include the beneficial impact of favorableprior-period medical claims reserve development of approximately $0.21 per diluted common share for the 2011 quarter compared to $0.44 per dilutedcommon share for the 2010 quarter and $0.44 per diluted common share for the 2011 period compared to $0.51 per diluted common share for the 2010 period.Net income for the 2010 quarter and period also included the negative impact of a $147.5 million ($0.55 per diluted common share) write-down of deferredacquisition costs associated with our individual major medical policies in our Retail Segment.
Premiums
Consolidated premiums increased $472.6 million, or 5.6%, from the 2010 quarter to $8.8 billion for the 2011 quarter, and increased $1.1 billion, or6.5%, from 2010 period to $17.6 billion for the 2011 period. The increases primarily were due to a $578.5 million, or 12.0%, and $1.1 billion, or 11.8%, year-over-year increase in Retail segment premiums for the 2011 quarter and period, respectively, partially offset by a decline in Employer Group segmentpremiums. The increase in Retail segment premiums primarily resulted from higher average individual Medicare Advantage membership. The decrease inEmployer Group segment premiums primarily resulted from lower average fully-insured commercial group medical membership. Average membership iscalculated by summing the ending membership for each month in a period and dividing the result by the number of months in a period.
Services Revenue
Consolidated services revenue increased $210.8 million from the 2010 quarter to $343.5 million for the 2011 quarter. For the 2011 period, servicesrevenue was $678.5 million, an increase of $412.7 million, or 155.3%, compared to the 2010 period. The increases during the 2011 quarter and period wereprimarily the result of the increase in primary care services revenue in our Health and Well-Being Services segment primarily as a result of the acquisition ofConcentra on December 21, 2010.
Investment Income
Investment income totaled $91.2 million for the 2011 quarter, an increase of $11.5 million from the 2010 quarter. For the 2011 period, investmentincome totaled $180.7 million, an increase of $15.5 million from the 2010 period. These increases primarily reflect higher average invested balances as aresult of the reinvestment of operating cash flow.
Benefit Expenses
Consolidated benefit expenses were $7.3 billion for the 2011 quarter, an increase of $400.7 million, or 5.8%, from the 2010 quarter. For the 2011period, consolidated benefit expenses increased by $928.0 million, or 6.8%, from the 2010 period to $14.6 billion. The increases were primarily due to a$466.9 million, or 11.9%, and $1.0 billion, or 13.0%, year-over-year increase in Retail segment benefit expenses in the 2011 quarter and period, respectively,primarily driven by an increase in the average number of Medicare members.
The consolidated benefit ratio was 82.2% for the 2011 quarter and 83.0% for the 2011 period, each representing a 20 basis point increase from thecomparable 2010 quarter and period primarily driven by lower favorable prior-period medical claims reserve development in the 2011 quarter and period thanin the 2010 quarter and period.
Operating Costs
Our segments incur both direct and shared indirect operating costs. We allocate the indirect costs shared by the segments primarily as a function ofrevenues. As a result, the profitability of each segment is interdependent.
Consolidated operating costs increased $98.7 million, or 9.0%, during the 2011 quarter compared to the 2010 quarter. For the 2011 period, consolidatedoperating costs increased $293.7 million, or 13.6%, compared to the 2010 period. The increases primarily were due to an increase in operating costs in ourHealth and Well-Being Segment as
31
Table of Contents
a result of the acquisition of Concentra on December 21, 2010. The 2010 quarter and period include $147.5 million of operating costs for the write-down ofdeferred acquisition costs associated with our individual major medical policies in our Retail Segment.
The consolidated operating cost ratio for the 2011 quarter was 13.0%, an increase of 10 basis points from the 2010 quarter. For the 2011 period, theconsolidated operating cost ratio was 13.4%, a 60 basis point increase from the 2010 period. The $147.5 million write-down of deferred acquisition costs inthe 2010 quarter and period increased the operating cost ratio 180 basis points for the 2010 quarter and 90 basis points for the 2010 period. Excluding theimpact of the write-down of deferred acquisition costs in 2010, the increases primarily reflect the greater percentage of our revenues derived from our Healthand Well-Being Services segment, which carries a higher operating cost ratio than our other business segments.
Depreciation and Amortization
Depreciation and amortization for the 2011 quarter totaled $67.8 million, an increase of $3.4 million, or 5.3%, from the 2010 quarter. Depreciation andamortization for the 2011 period totaled $133.9 million, an increase of $10.7 million or 8.6% from the 2010 period. The increases primarily reflectdepreciation and amortization expense associated with our Concentra operations, acquired on December 21, 2010.
Interest Expense
Interest expense was $27.7 million for the 2011 quarter, increasing $1.4 million, or 5.5% from the 2010 quarter, and $54.9 million for the 2011 period,increasing $2.4 million, or 4.5%, from the 2010 period.
Income Taxes
Our effective tax rate during the 2011 quarter was 36.6% compared to the effective tax rate of 36.5% in the 2010 quarter. The effective tax rate for the2011 period of 36.6% declined from 37.1% for the 2010 period. The higher tax rate for the 2010 period primarily was due to the cumulative adjustmentassociated with estimating the retrospective aspect of new limitations on the deductibility of annual compensation in excess of $500,000 per employee asmandated by the Health Insurance Reform Legislation.
32

Table of Contents
Retail Segment June 30, Change
2011 2010 Members Percentage Membership: Medical membership:
Medicare Advantage 1,602,500 1,462,900 139,600 9.5% Medicare stand-alone PDP 2,408,700 1,708,000 700,700 41.0%
Total Medicare 4,011,200 3,170,900 840,300 26.5% Individual 456,600 407,100 49,500 12.2%
Total medicalmembers 4,467,800 3,578,000 889,800 24.9%
Specialty membership(a) 680,500 440,400 240,100 54.5%
(a) Specialty products include dental, vision, and other supplemental products. Members included in these products may not be unique to each product
since members have the ability to enroll in multiple products.
For the three months ended
June 30, Change
2011 2010 Dollars Percentage
(in thousands) Premiums and Services Revenue:
Premiums: Medicare Advantage $ 4,555,163 $ 4,106,667 $ 448,496 10.9% Medicare stand-alone PDP 601,345 504,296 97,049 19.2%
Total Medicare 5,156,508 4,610,963 545,545 11.8% Individual 206,291 183,261 23,030 12.6% Specialty 29,580 19,668 9,912 50.4%
Total premiums 5,392,379 4,813,892 578,487 12.0%
Services 3,894 2,540 1,354 53.3%
Total premiums andservices revenue $ 5,396,273 $ 4,816,432 $ 579,841 12.0%
Income before income taxes $ 503,068 $ 325,938 $ 177,130 54.3% Benefit ratio 81.4% 81.5% (0.1)% Operating cost ratio 9.1% 11.5% (2.4)%
For the six months ended
June 30, Change
2011 2010 Dollars Percentage
(in thousands) Premiums and Services Revenue:
Premiums: Medicare Advantage $ 9,079,789 $ 8,165,834 $ 913,955 11.2% Medicare stand-alone PDP 1,158,817 1,007,809 151,008 15.0%
Total Medicare 10,238,606 9,173,643 1,064,963 11.6% Individual 407,179 362,078 45,101 12.5% Specialty 55,355 37,190 18,165 48.8%
Total premiums 10,701,140 9,572,911 1,128,229 11.8%
Services 6,767 5,341 1,426 26.7%
Total premiums andservices revenue $ 10,707,907 $ 9,578,252 $ 1,129,655 11.8%
Income before income taxes $ 720,058 $ 590,720 $ 129,338 21.9% Benefit ratio 83.6% 82.7% 0.9% Operating cost ratio 9.5% 11.0% (1.5)%
33

Table of Contents
Pretax Results
• Retail segment pretax income was $503.1 million in the 2011 quarter, an increase of $177.1 million, or 54.3%, compared to $325.9 million in the2010 quarter. For the 2011 period, the Retail segment's pretax income was $720.1 million compared to $590.7 million in the 2010 period, anincrease of $129.3 million, or 21.9%. Pretax income for the 2010 quarter and period included the negative impact of a $147.5 million write-downof deferred acquisition costs associated with our individual major medical policies. In addition, the Retail segment's pretax income for the 2011quarter and period included the beneficial effect of an estimated $38 million and $72 million, respectively, in favorable prior-period medicalclaims reserve development versus $40 million and $120 million in the 2010 quarter and period, respectively. Excluding these items, the increasein pretax income for the 2011 quarter and period primarily was driven by higher average Medicare membership.
Enrollment
• Individual Medicare Advantage membership increased 139,600 members, or 9.5%, from June 30, 2010 to June 30, 2011 due to a successfulenrollment season associated with the 2011 plan year.
• Individual Medicare stand-alone PDP membership increased 700,700 members, or 41.0%, from June 30, 2010 to June 30, 2011 primarily fromhigher gross sales year-over-year, particularly due to our low-price-point Humana Walmart-Preferred Rx Plan that we began offering for the 2011plan year.
• Specialty membership increased 240,100, or 54.5%, from June 30, 2010 to June 30, 2011 primarily driven by increased sales in dental and visionofferings.
Premiums
• Retail segment premiums increased $578.5 million, or 12.0%, from the 2010 quarter to the 2011 quarter and increased $1.1 billion, or 11.8%,from the 2010 period to the 2011 period. The increases primarily were due to a 9.4% and 10.0% increase for the 2011 quarter and period,respectively, in average individual Medicare Advantage membership compared to the 2010 quarter and period. Medicare stand-alone PDPpremium revenues increased $97.0 million, or 19.2%, during the 2011 quarter compared to the 2010 quarter and increased $151.0 million, or15.0%, during the 2011 period compared to the 2010 period. These increases primarily were due to a 39.5% and 36.4% increase in average PDPmembership for the 2011 quarter and period, respectively, compared to the 2010 quarter and period, partially offset by decreases in Medicarestand-alone PDP per member premiums for the same periods. This was primarily a result of sales of our low-price-point Humana Walmart-Preferred Rx Plan that we began offering for the 2011 plan year.
Benefit expenses
• The Retail segment benefit ratio decreased 10 basis points from 81.5% in the 2010 quarter to 81.4% in the 2011 quarter. For the 2011 period, theRetail segment benefit ratio increased 90 basis points to 83.6% from 82.7% for the 2010 period, primarily due to lower favorable prior-periodmedical claims reserve development in the 2011 period than in the 2010 period. This favorable reserve development decreased the Retail segmentbenefit ratio by approximately 70 basis points in both the 2011 quarter and period versus approximately 80 basis points and 130 basis points inthe 2010 quarter and period, respectively. Excluding the impact of the favorable development, the increase in the benefit ratio in the 2011 periodcompared to the 2010 period reflects a significant increase in our Medicare stand-alone PDP membership in the 2011 period. As discussedpreviously, the Medicare stand-alone PDP product design carries a higher benefit ratio in the first quarter and the benefit ratio generally decreasesas the year progresses.
Operating costs
• The Retail segment operating cost ratio of 9.1% for the 2011 quarter decreased 240 basis points from 11.5% for the 2010 quarter. The Retailsegment operating cost ratio of 9.5% for the 2011 period decreased 150 basis points from 11.0% for the 2010 period. The $147.5 million write-down of deferred acquisition costs in the 2010 quarter and period increased the operating cost ratio 300 basis points for the 2010 quarter and 160basis points for the 2010 period. Excluding the impact of the write-down of deferred acquisition costs, the increase in the operating cost ratioyear-over-year primarily reflects a higher percentage of membership in the Humana Walmart-Preferred Rx Plan which carries a higher operatingcost ratio than other Medicare stand-alone PDP products.
34

Table of Contents
Employer Group Segment June 30, Change
2011 2010 Members Percentage Membership: Medical membership:
Medicare Advantage 282,000 269,500 12,500 4.6% Medicare Advantage ASO 27,700 28,700 (1,000) (3.5)%
Total Medicare Advantage 309,700 298,200 11,500 3.9%
Medicare stand-alone PDP 4,100 2,400 1,700 70.8%
Total Medicare 313,800 300,600 13,200 4.4% Fully-insured medical 1,186,200 1,295,400 (109,200) (8.4)% ASO 1,313,600 1,582,600 (269,000) (17.0)%
Total medical members 2,813,600 3,178,600 (365,000) (11.5)%
Specialty membership(a) 6,669,600 6,806,900 (137,300) (2.0)%
(a) Specialty products include dental, vision, and other supplemental products. Members included in these products may not be unique to each product
since members have the ability to enroll in multiple products.
For the three months ended
June 30, Change
2011 2010 Dollars Percentage
(in thousands) Premiums and Services Revenue:
Premiums: Medicare Advantage $ 764,595 $ 778,542 $ (13,947) (1.8)% Medicare stand-alone PDP 1,911 1,154 757 65.6%
Total Medicare 766,506 779,696 (13,190) (1.7)% Fully-insured medical 1,216,601 1,300,759 (84,158) (6.5)% Specialty 233,233 224,093 9,140 4.1%
Total premiums 2,216,340 2,304,548 (88,208) (3.8)%
Services 86,657 100,234 (13,577) (13.5)%
Total premiums and services revenue $ 2,302,997 $ 2,404,782 $ (101,785) (4.2)%
Income before income taxes $ 108,409 $ 107,756 $ 653 0.6% Benefit ratio 81.2% 81.2% 0.0% Operating cost ratio 16.8% 17.2% (0.4)%
35

Table of Contents
For the six months ended
June 30, Change
2011 2010 Dollars Percentage
(in thousands) Premiums and Services Revenue:
Premiums: Medicare Advantage $ 1,561,349 $ 1,536,355 $ 24,994 1.6% Medicare stand-alone PDP 3,728 2,290 1,438 62.8%
Total Medicare 1,565,077 1,538,645 26,432 1.7% Fully-insured medical 2,415,191 2,628,760 (213,569) (8.1)% Specialty 462,884 446,241 16,643 3.7%
Total premiums 4,443,152 4,613,646 (170,494) (3.7)%
Services 179,203 199,357 (20,154) (10.1)%
Total premiums and services revenue $ 4,622,355 $ 4,813,003 $ (190,648) (4.0)%
Income before income taxes $ 247,164 $ 181,233 $ 65,931 36.4% Benefit ratio 79.9% 81.7% (1.8)% Operating cost ratio 17.5% 17.5% 0.0%
Pretax Results
• Employer Group segment pretax income increased $0.7 million, or 0.6%, from the 2010 quarter to $108.4 million in the 2011 quarter, andincreased $65.9 million, or 36.4%, from the 2010 period to $247.2 million for the 2011 period primarily due to a shift to a more profitable mix ofmembership. In addition, the quarterly comparison reflects lower favorable prior-period medical claims reserve development in the 2011 quarterthan in the 2010 quarter. The Employer Group segment's pretax income for the 2011 quarter and period included the beneficial effect of anestimated $17 million and $33 million, respectively, in favorable prior-period medical claims reserve development versus $77 million and $18million in the 2010 quarter and period, respectively.
Enrollment
• Employer Group fully-insured commercial medical membership decreased 109,200, or 8.4%, from June 30, 2010 to June 30, 2011 primarily dueto the continued pricing discipline in a highly competitive environment for large group business partially offset by small group businessmembership gains.
• Employer Group ASO commercial medical membership decreased 269,000, or 17.0%, from June 30, 2010 to June 30, 2011 primarily due to theloss of a large ASO account in July 2010 and continued pricing discipline in a highly competitive environment for self-funded accounts.
Premiums
• Employer Group segment premiums decreased $88.2 million, or 3.8%, to $2.2 billion for the 2011 quarter from $2.3 billion for the 2010 quarter.For the 2011 period, Employer Group segment premiums decreased by $170.5 million, or 3.7%, from the 2010 period to $4.4 billion. Thesedeclines primarily were due to lower average commercial group medical membership year-over-year.
Benefit expenses
• The Employer Group segment benefit ratio of 81.2% for the 2011 quarter was unchanged from the 2010 quarter. The Employer Group segmentbenefit ratio decreased 180 basis points from 81.7% in the 2010 period to 79.9% in the 2011 period. These ratios primarily reflect lowerutilization of benefits year-over-year, particularly in our commercial business, combined with a higher percentage of the segment's membershipin small group accounts which generally have a lower benefit ratio than larger group accounts, with the quarter comparison offset by lowerfavorable prior-period medical claims reserve development in the 2011 quarter versus the 2010 quarter. This favorable reserve developmentdecreased the Employer Group segment benefit ratio by approximately 80 basis points in both the 2011 quarter and period, respectively, versus330 basis points and 30 basis points in the 2010 quarter and period, respectively.
36

Table of Contents
Operating costs
• The Employer Group segment operating cost ratio of 16.8% for the 2011 quarter decreased 40 basis points from 17.2% for the 2010 quarterprimarily reflecting administrative scale efficiencies associated with an increase in average fully-insured Medicare Advantage group membership.The Employer Group segment operating cost ratio of 17.5% for the 2011 period was unchanged from the 2010 period.
Health and Well-Being Services Segment
For the three months ended
June 30, Change
2011 2010 Dollars Percentage
(in thousands) Revenues: Services:
Primary care services $ 219,509 $ 417 $ 219,092 nm Integrated wellness services 2,892 2,474 418 16.9% Pharmacy solutions 2,612 0 2,612 100.0%
Total services revenues 225,013 2,891 222,122 nm
Intersegment revenues: Pharmacy solutions 2,402,697 2,146,170 256,527 12.0% Primary care services 44,707 34,245 10,462 30.6% Integrated wellness services 41,805 42,407 (602) (1.4)% Home care services 18,346 7,963 10,383 130.4%
Total intersegment revenues 2,507,555 2,230,785 276,770 12.4%
Total services and intersegment revenues $ 2,732,568 $ 2,233,676 $ 498,892 22.3%
Income before income taxes $ 87,803 $ 50,873 $ 36,930 72.6% Operating cost ratio 96.1% 97.4% (1.3)%
For the six months ended
June 30, Change
2011 2010 Dollars Percentage
(in thousands) Revenues: Services:
Primary care services $ 431,498 $ 908 $ 430,590 nm Integrated wellness services 5,949 5,146 803 15.6% Pharmacy solutions 4,819 0 4,819 100.0%
Total services revenues 442,266 6,054 436,212 nm
Intersegment revenues: Pharmacy solutions 4,857,556 4,257,396 600,160 14.1% Primary care services 87,424 69,082 18,342 26.6% Integrated wellness services 83,681 83,909 (228) (0.3)% Home care services 34,925 15,239 19,686 129.2%
Total intersegment revenues 5,063,586 4,425,626 637,960 14.4%
Total services and intersegment revenues $ 5,505,852 $ 4,431,680 $ 1,074,172 24.2%
Income before income taxes $ 184,176 $ 99,100 $ 85,076 85.8% Operating cost ratio 95.9% 97.5% (1.6)%
nm – not meaningful
37

Table of Contents
Pretax results
• Health and Well-Being Services segment pretax income increased $36.9 million, or 72.6%, from the 2010 quarter to $87.8 million for the 2011quarter. The segment's pretax income for the 2011 period increased $85.1 million, or 85.8%, from the 2010 period to $184.2 million. Theincreases primarily were due to growth in our pharmacy solutions business together with the addition of the Concentra business, acquired onDecember 21, 2010.
Services revenue
• Primary care services revenue increased $219.1 million and $430.6 million from the 2010 quarter and period, respectively, to $219.5 million and$431.5 million for the 2011 quarter and period, respectively, primarily due to the acquisition of Concentra on December 21, 2010.
Intersegment revenues
• Intersegment revenues increased $276.8 million, or 12.4%, from the 2010 quarter to $2.5 billion for the 2011 quarter and increased $638.0million, or 14.4%, from the 2010 period to $5.1 billion for the 2011 period. The increases primarily were due to growth in our pharmacysolutions business as it serves our growing membership, particularly Medicare stand-alone PDP.
Operating costs
• The Health and Well-Being Services segment operating cost ratio of 96.1% for the 2011 quarter decreased 130 basis points from the 2010quarter. The operating cost ratio for the 2011 period was 95.9%, decreasing 160 basis points from the 2010 period. These declines primarilyreflect scale efficiencies associated with growth in our pharmacy solutions business together with the addition of our recently acquired Concentraoperations which carry a lower operating cost ratio than other lines of business in this segment.
Other Businesses
Pretax income for our Other Businesses of $19.4 million for the 2011 quarter compares to $49.1 million for the 2010 quarter. The pretax income for ourOther Businesses for the 2011 period decreased $31.8 million compared to the 2010 pretax income. The declines were primarily due to a decrease in pretaxincome associated with our contract with CMS to administer the Limited Income Newly Eligible Transition (LI-NET) program.
38

Table of Contents
Liquidity
Our primary sources of cash include receipts of premiums, service revenues, and investment and other income, as well as proceeds from the sale ormaturity of our investment securities and borrowings. Our primary uses of cash include disbursements for claims payments, operating costs, interest onborrowings, taxes, purchases of investment securities, acquisitions, capital expenditures, repayments on borrowings, dividends, and share repurchases.Because premiums generally are collected in advance of claim payments by a period of up to several months, our business normally should produce positivecash flows during periods of increasing premiums and enrollment. Conversely, cash flows would be negatively impacted during periods of decreasingpremiums and enrollment. From period to period, our cash flows may also be affected by the timing of working capital items. The use of operating cash flowsmay be limited by regulatory requirements which require, among other items, that our regulated subsidiaries maintain minimum levels of capital.
For additional information on our liquidity risk, please refer to the section entitled "Risk Factors" in this report and in our annual report on Form 10-Kfor the fiscal year ended December 31, 2010.
Cash and cash equivalents decreased to $1,567.8 million at June 30, 2011 from $1,673.1 million at December 31, 2010. The change in cash and cashequivalents for the six months ended June 30, 2011 and 2010 is summarized as follows: 2011 2010
(in thousands) Net cash provided by operating activities $ 956,665 $ 1,079,962 Net cash used in investing activities (858,849) (672,141) Net cash used in financing activities (203,129) (22,427)
(Decrease) increase in cash and cash equivalents $ (105,313) $ 385,394
Cash Flow from Operating Activities
The decrease in operating cash flows from the 2010 period to the 2011 period primarily results from the timing of working capital items, partially offsetby an increase in earnings.
Comparisons of our operating cash flows are impacted by changes in our working capital. The most significant drivers of changes in our workingcapital are typically the timing of receipts for premiums and payments of benefit expenses. We illustrate these changes with the following summaries ofreceivables and benefits payable.
The detail of total net receivables was as follows at June 30, 2011 and December 31, 2010: June 30,
2011
December 31,
2010
2011 Period
Change
2010 Period
Change
(in thousands) Military services:
Base receivables $ 483,606 $ 424,786 $ 58,820 $ 17,564 Change orders 3,035 2,052 983 (173)
Military services subtotal 486,641 426,838 59,803 17,391 Medicare 725,252 216,080 509,172 400,044 Commercial and other 414,694 367,570 47,124 84,376 Allowance for doubtful accounts (80,195) (51,470) (28,725) (329)
Total net receivables $ 1,546,392 $ 959,018 $ 587,374 $ 501,482
Military services base receivables consist of estimated claims owed from the federal government for health care services provided to beneficiaries andunderwriting fees. The claim reimbursement component of military services
39
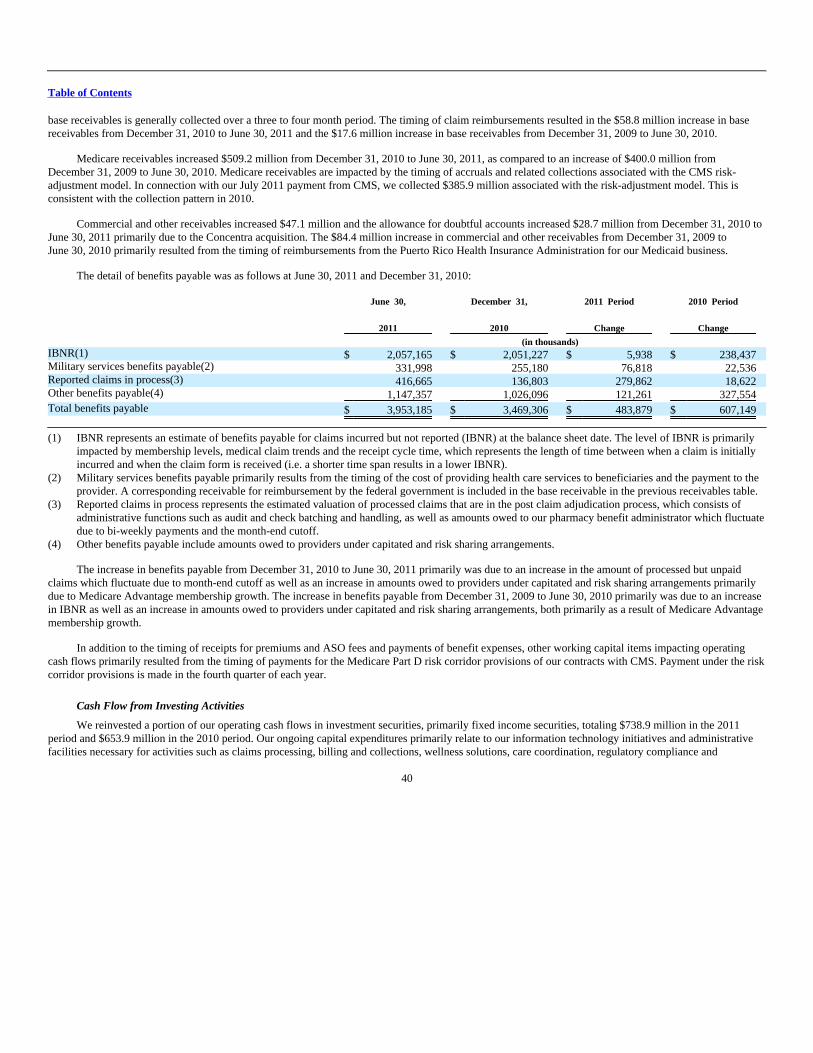
Table of Contents
base receivables is generally collected over a three to four month period. The timing of claim reimbursements resulted in the $58.8 million increase in basereceivables from December 31, 2010 to June 30, 2011 and the $17.6 million increase in base receivables from December 31, 2009 to June 30, 2010.
Medicare receivables increased $509.2 million from December 31, 2010 to June 30, 2011, as compared to an increase of $400.0 million fromDecember 31, 2009 to June 30, 2010. Medicare receivables are impacted by the timing of accruals and related collections associated with the CMS risk-adjustment model. In connection with our July 2011 payment from CMS, we collected $385.9 million associated with the risk-adjustment model. This isconsistent with the collection pattern in 2010.
Commercial and other receivables increased $47.1 million and the allowance for doubtful accounts increased $28.7 million from December 31, 2010 toJune 30, 2011 primarily due to the Concentra acquisition. The $84.4 million increase in commercial and other receivables from December 31, 2009 toJune 30, 2010 primarily resulted from the timing of reimbursements from the Puerto Rico Health Insurance Administration for our Medicaid business.
The detail of benefits payable was as follows at June 30, 2011 and December 31, 2010: June 30,
2011
December 31,
2010
2011 Period
Change
2010 Period
Change
(in thousands) IBNR(1) $ 2,057,165 $ 2,051,227 $ 5,938 $ 238,437 Military services benefits payable(2) 331,998 255,180 76,818 22,536 Reported claims in process(3) 416,665 136,803 279,862 18,622 Other benefits payable(4) 1,147,357 1,026,096 121,261 327,554
Total benefits payable $ 3,953,185 $ 3,469,306 $ 483,879 $ 607,149
(1) IBNR represents an estimate of benefits payable for claims incurred but not reported (IBNR) at the balance sheet date. The level of IBNR is primarily
impacted by membership levels, medical claim trends and the receipt cycle time, which represents the length of time between when a claim is initiallyincurred and when the claim form is received (i.e. a shorter time span results in a lower IBNR).
(2) Military services benefits payable primarily results from the timing of the cost of providing health care services to beneficiaries and the payment to theprovider. A corresponding receivable for reimbursement by the federal government is included in the base receivable in the previous receivables table.
(3) Reported claims in process represents the estimated valuation of processed claims that are in the post claim adjudication process, which consists ofadministrative functions such as audit and check batching and handling, as well as amounts owed to our pharmacy benefit administrator which fluctuatedue to bi-weekly payments and the month-end cutoff.
(4) Other benefits payable include amounts owed to providers under capitated and risk sharing arrangements.
The increase in benefits payable from December 31, 2010 to June 30, 2011 primarily was due to an increase in the amount of processed but unpaidclaims which fluctuate due to month-end cutoff as well as an increase in amounts owed to providers under capitated and risk sharing arrangements primarilydue to Medicare Advantage membership growth. The increase in benefits payable from December 31, 2009 to June 30, 2010 primarily was due to an increasein IBNR as well as an increase in amounts owed to providers under capitated and risk sharing arrangements, both primarily as a result of Medicare Advantagemembership growth.
In addition to the timing of receipts for premiums and ASO fees and payments of benefit expenses, other working capital items impacting operatingcash flows primarily resulted from the timing of payments for the Medicare Part D risk corridor provisions of our contracts with CMS. Payment under the riskcorridor provisions is made in the fourth quarter of each year.
Cash Flow from Investing Activities
We reinvested a portion of our operating cash flows in investment securities, primarily fixed income securities, totaling $738.9 million in the 2011period and $653.9 million in the 2010 period. Our ongoing capital expenditures primarily relate to our information technology initiatives and administrativefacilities necessary for activities such as claims processing, billing and collections, wellness solutions, care coordination, regulatory compliance and
40
Table of Contents
customer service. Total capital expenditures, excluding acquisitions, were $129.2 million in the 2011 period compared to $91.4 million in the 2010 period.Excluding acquisitions, we expect total capital expenditures in 2011 of approximately $280 million versus $222 million for the full year 2010.
Cash Flow from Financing Activities
Receipts from CMS associated with Medicare Part D claim subsidies for which we do not assume risk were $188.4 million higher than claims paymentsduring the 2011 period and $236.3 million higher than claim payments during the 2010 period.
During the 2011 period, we repurchased 3.4 million shares for $252.7 million under the stock repurchase plans authorized by the Board of Directors inDecember 2009 and April 2011. During the 2010 period, we repurchased 1.03 million shares for $50.0 million under the stock repurchase plan authorized bythe Board of Directors in December 2009. During the 2011 period, we also acquired 0.7 million common shares in connection with employee stock plans foran aggregate cost of $48.1 million compared to 0.2 million shares for an aggregate cost of $7.9 million in the 2010 period.
The remainder of the cash used in or provided by financing activities in the 2011 and 2010 periods primarily resulted from the change in the bookoverdraft and proceeds from stock option exercises.
Future Sources and Uses of Liquidity
Dividends
In April 2011, our Board of Directors approved a quarterly cash dividend policy and declared a cash dividend to stockholders of $0.25 per share. Thedividend aggregating $41.5 million was paid on July 28, 2011 to stockholders of record on June 30, 2011. Declaration and payment of future quarterlydividends is at the discretion of the Board and may be adjusted as business needs or market conditions change.
Stock Repurchase Authorization
In April 2011, the Board of Directors replaced its previously approved share repurchase authorization of up to $250 million with a new authorizationfor repurchases of up to $1 billion of our common shares exclusive of shares repurchased in connection with employee stock plans. The new authorizationwill expire June 30, 2013. Under this share repurchase authorization, shares may be purchased from time to time at prevailing prices in the open market, byblock purchases, or in privately-negotiated transactions, subject to certain regulatory restrictions on volume, pricing, and timing. As of August 1, 2011, theremaining authorized amount under the new authorization totaled $799.9 million.
Senior Notes
We previously issued $500 million of 6.45% senior notes due June 1, 2016, $500 million of 7.20% senior notes due June 15, 2018, $300 million of6.30% senior notes due August 1, 2018, and $250 million of 8.15% senior notes due June 15, 2038. The 7.20% and 8.15% senior notes are subject to aninterest rate adjustment if the debt ratings assigned to the notes are downgraded (or subsequently upgraded) and contain a change of control provision thatmay require us to purchase the notes under certain circumstances. All four series of our senior notes, which are unsecured, may be redeemed at our option atany time at 100% of the principal amount plus accrued interest and a specified make-whole amount.
Credit Agreement
Our 3-year $1.0 billion unsecured revolving agreement expires December 2013. Under the credit agreement, at our option, we can borrow on either acompetitive advance basis or a revolving credit basis. The revolving credit portion bears interest at either LIBOR or the base rate plus a spread. The spread,currently 170 basis points, varies depending on our credit ratings ranging from 150 to 262.5 basis points. We also pay an annual facility fee regardless ofutilization. This facility fee, currently 30 basis points, may fluctuate between 25 and 62.5 basis points, depending
41

Table of Contents
upon our credit ratings. The competitive advance portion of any borrowings will bear interest at market rates prevailing at the time of borrowing on either afixed rate or a floating rate based on LIBOR, at our option.
The terms of the credit agreement include standard provisions related to conditions of borrowing, including a customary material adverse event clausewhich could limit our ability to borrow additional funds. In addition, the credit agreement contains customary restrictive and financial covenants as well ascustomary events of default, including financial covenants regarding the maintenance of a minimum level of net worth of $5,645.6 million at June 30, 2011and a maximum leverage ratio of 3.0:1. We are in compliance with the financial covenants, with actual net worth of $7,586.7 million and a leverage ratio of0.7:1, as measured in accordance with the credit agreement as of June 30, 2011. In addition, the credit agreement includes an uncommitted $250 millionincremental loan facility.
At June 30, 2011, we had no borrowings outstanding under the credit agreement. We have outstanding letters of credit of $11.6 million secured underthe credit agreement. No amounts have ever been drawn on these letters of credit. Accordingly, as of June 30, 2011, we had $988.4 million of remainingborrowing capacity under the credit agreement, none of which would be restricted by our financial covenant compliance requirement. We have othercustomary, arms-length relationships, including financial advisory and banking, with some parties to the credit agreement.
Other Long-Term Borrowings
Other long-term borrowings of $36.7 million at June 30, 2011 represent junior subordinated debt of $36.1 million and financing for the renovation of abuilding of $0.6 million. The junior subordinated debt, which is due in 2037, may be called by us without penalty in 2012 and bears a fixed annual interestrate of 8.02% payable quarterly until 2012, and then payable at a floating rate based on LIBOR plus 310 basis points. The debt associated with the buildingrenovation bears interest at 2.00%, is collateralized by the building, and is payable in various installments through 2014.
Liquidity Requirements
We believe our cash balances, investment securities, operating cash flows, and funds available under our credit agreement or from other public orprivate financing sources, taken together, provide adequate resources to fund ongoing operating and regulatory requirements, future expansion opportunities,and capital expenditures for at least the next twelve months, as well as to refinance or repay debt and repurchase shares.
Adverse changes in our credit rating may increase the rate of interest we pay and may impact the amount of credit available to us in the future. Ourinvestment-grade credit rating at June 30, 2011 was BBB according to Standard & Poor's Rating Services, or S&P, and Baa3 according to Moody's InvestorsServices, Inc., or Moody's. A downgrade by S&P to BB+ or by Moody's to Ba1 triggers an interest rate increase of 25 basis points with respect to $750million of our senior notes. Successive one notch downgrades increase the interest rate an additional 25 basis points, or annual interest expense by $1.9million, up to a maximum 100 basis points, or annual interest expense by $7.5 million.
In addition, we operate as a holding company in a highly regulated industry. The parent company is dependent upon dividends and administrativeexpense reimbursements from our subsidiaries, most of which are subject to regulatory restrictions. Cash, cash equivalents and short-term investments at theparent company increased $436.8 million to $990.4 million at June 30, 2011 compared to $553.6 million at December 31, 2010 primarily due to dividends toour parent company from our operating subsidiaries partially offset by share repurchases. Such dividends were approximately $1.0 billion in the 2011 periodcompared to approximately $747 million in 2010. We continue to maintain significant levels of aggregate excess statutory capital and surplus in our state-regulated operating subsidiaries.
Regulatory Requirements
Certain of our subsidiaries operate in states that regulate the payment of dividends, loans, or other cash transfers to Humana Inc., our parent company,and require minimum levels of equity as well as limit investments to approved securities. The amount of dividends that may be paid to Humana Inc. by thesesubsidiaries, without prior approval
42

Table of Contents
by state regulatory authorities, is limited based on the entity's level of statutory income and statutory capital and surplus. In most states, prior notification isprovided before paying a dividend even if approval is not required.
Although minimum required levels of equity are largely based on premium volume, product mix, and the quality of assets held, minimum requirementscan vary significantly at the state level. Based on the most recently filed statutory financial statements as of March 31, 2011, our state regulated subsidiarieshad aggregate statutory capital and surplus of approximately $4.7 billion, which exceeded aggregate minimum regulatory requirements.
Item 3. Quantitative and Qualitative Disclosure about Market Risk
Our earnings and financial position are exposed to financial market risk, including those resulting from changes in interest rates.
Interest rate risk also represents a market risk factor affecting our consolidated financial position due to our significant investment portfolio, consistingprimarily of fixed maturity securities of investment-grade quality with an average S&P credit rating of AA- at June 30, 2011. Our net unrealized gain positionincreased $107.6 million from a net unrealized gain position of $196.5 million at December 31, 2010 to a net unrealized gain position of $304.1 million atJune 30, 2011. At June 30, 2011, we had gross unrealized losses of $22.7 million on our investment portfolio primarily due to an increase in market interestrates and tighter liquidity conditions in the current markets than when the securities were purchased, and as such, there were no material other-than-temporaryimpairments during the three and six months ended June 30, 2011. While we believe that these impairments are temporary and we currently do not have theintent to sell such securities, given the current market conditions and the significant judgments involved, there is a continuing risk that future declines in fairvalue may occur and material realized losses from sales or other-than-temporary impairments may be recorded in future periods.
Duration is the time-weighted average of the present value of the bond portfolio's cash flow. Duration is indicative of the relationship between changesin fair value and changes in interest rates, providing a general indication of the sensitivity of the fair values of our fixed maturity securities to changes ininterest rates. However, actual fair values may differ significantly from estimates based on duration. The average duration of our investment portfolio,including cash and cash equivalents, was approximately 3.8 years as of June 30, 2011. Based on the duration including cash equivalents, a 1% increase ininterest rates would generally decrease the fair value of our securities by approximately $410 million.
Item 4. Controls and Procedures
Under the supervision and with the participation of our Chief Executive Officer, or CEO, our Chief Financial Officer, or CFO, and our PrincipalAccounting Officer, we carried out an evaluation of the effectiveness of the design and operation of our disclosure controls and procedures for the quarterended June 30, 2011.
Based on our evaluation, our CEO, CFO, and Principal Accounting Officer concluded that our disclosure controls and procedures are effective toprovide reasonable assurance that information the Company is required to disclose in its reports under the Securities Exchange Act of 1934 is recorded,processed, summarized and reported within the time periods specified in SEC rules and forms, including, without limitation, ensuring that such information isaccumulated and communicated to the Company's management, including its principal executive and principal financial officers, or persons performingsimilar functions, as appropriate to allow timely decisions regarding required disclosure.
There have been no changes in the Company's internal control over financial reporting during the quarter ended June 30, 2011 that have materiallyaffected, or are reasonably likely to materially affect, the Company's internal control over financial reporting.
43
Table of Contents
Part II. Other Information
Item 1. Legal Proceedings
For a description of the legal proceedings pending against us, see "Legal Proceedings and Certain Regulatory Matters" in Note 12 to the condensedconsolidated financial statements beginning on page 17 of this Form 10-Q.
Item 1A. Risk Factors
Except as set forth below, there have been no changes to the risk factors included in our Annual Report on Form 10-K for the fiscal year endedDecember 31, 2010, filed with the SEC on February 17, 2011, as modified by the changes to those risk factors included in other reports we filed with the SECsubsequent to February 17, 2011:
• On February 25, 2011, the Department of Defense TRICARE Management Activity, or TMA, awarded the TRICARE South Region contract tous. On March 7, 2011, the competing bidder filed a protest of the award with the Government Accountability Office, or GAO. Also on March 7,2011, as provided in the Federal Acquisition Regulations, TMA issued a stop work order to us in connection with the award. On June 14, 2011,the GAO upheld the award of the contract to us and TMA subsequently lifted the stop work order. On June 21, 2011, the competing bidder filed acomplaint in the United States Court of Federal Claims objecting to the award of the contract to us. That case is currently pending before theCourt. As a result of the award of the TRICARE South Region contract to us, we no longer expect a goodwill impairment to occur during thesecond half of 2011. Ultimate disposition of the contract award is, however, subject to the resolution of the complaint filed by the unsuccessfulbidder.
• Our business activities are subject to extensive government regulation relating to the privacy of individually identifiable information.
The Health Information Technology for Economic and Clinical Health Act, or the HITECH Act – which was one part of the American Recoveryand Reinvestment Act of 2009 – significantly broadened the scope of the privacy and security regulations of the Health Insurance Portability andAccountability Act of 1996, or HIPAA. Among other requirements, the HITECH Act mandates individual notification in the event of a breach ofunsecured, individually identifiable health information, provides enhanced penalties for HIPAA violations, and grants enforcement authority tostates' Attorneys General in addition to the HHS Office of Civil Rights. On October 30, 2009, HHS issued an Interim Final Rule implementingamendments to the enforcement regulations under HIPAA. On July 14, 2010, HHS issued a Proposed Rule containing modifications to privacystandards, security standards and enforcement actions. In addition, HHS is currently in the process of finalizing regulations addressing securitybreach notification requirements. HHS initially released an Interim Final Rule for breach notification requirements on August 24, 2009. HHSthen drafted a Final Rule which was submitted to OMB but subsequently withdrawn by HHS on July 29, 2010. Currently, the Interim Final Ruleremains in effect but the withdrawal suggests that when HHS issues the Final Rule, which it has indicated it intends to do in the next severalmonths, the requirements for how covered entities should respond in the event of a potential security breach involving protected healthinformation are likely to be more onerous than those contained in the Interim Final Rule. On May 31, 2011, HHS issued a Proposed Rule onAccounting of Disclosures greatly expanding the scope of the technical logging requirements to mandate inclusion of the names, dates and timeswhen a record was accessed even if no action is taken on the record.
In addition, there are numerous federal and state laws and regulations addressing patient and consumer privacy concerns, including unauthorizedaccess or theft of personal information. State statutes and regulations vary from state to state and could impose additional penalties. Violations ofHIPAA or applicable federal or state laws or regulations could subject us to significant criminal or civil penalties, including significant monetarypenalties. Compliance with HIPAA and other privacy regulations requires significant systems enhancements, training and administrative effort.An investigation or initiation of civil or criminal actions could have a material adverse effect on our results of operations, financial position andcash flows, and our business reputation could suffer significantly.
44
Table of Contents
• Federal government contracts account for a substantial portion of our revenue and earnings. A delay by Congress in raising the federalgovernment's debt ceiling, should it occur, could lead to a reduction, suspension or cancellation of federal government spending that could,in turn, have a material adverse effect on our business and profitability.
Since 1917, the federal government's debt ceiling, or the amount of debt the federal government is permitted to borrow, has been limited bystatute and can only be raised by an act of Congress. If the federal government should approach its debt ceiling, and if Congress does not act atthat time to raise the debt ceiling, federal government spending may be subject to reduction, suspension or cancellation. Because a significantportion of our revenues relates to federal government health care coverage programs, including the Medicare, Military and Medicaid programs,failure to raise the debt ceiling under these circumstances could have a material adverse effect on our results of operations, financial position andcash flows.
This list of important factors is not intended to be exhaustive, and should be read in conjunction with the more detailed description of these risks thatmay be found in our reports filed with the SEC from time to time, including our annual report on Form 10-K, quarterly reports on Form 10-Q, and currentreports on Form 8-K.
Item 2: Unregistered Sales of Equity Securities and Use of Proceeds
(a) None.
(b) N/A
(c) The following table provides information about purchases by us during the three months ended June 30, 2011 of equity securities that areregistered by us pursuant to Section 12 of the Exchange Act:
Period
Total Numberof Shares
Purchased(1)
AveragePrice Paidper Share
Total Number ofShares Purchasedas Part of PubliclyAnnounced Plansor Programs(1)(2)
Dollar Value ofShares that May
Yet Be PurchasedUnder the Plansor Programs(1)
April 2011 0 0 0 1,000,000,000 May 2011 1,918,494 78.41 1,918,494 849,621,501 June 2011 630,671 78.79 630,671 799,947,644
Total 2,549,165 $ 78.51 2,549,165 $ 799,947,644
(1) As announced on April 26, 2011, in April 2011, the Board of Directors replaced its previously approved share repurchase authorization of
up to $250 million with a new authorization for repurchases of up to $1 billion of our common shares exclusive of shares repurchased inconnection with employee stock plans. The new authorization will expire June 30, 2013. Under this share repurchase authorization,shares may be purchased from time to time at prevailing prices in the open market, by block purchases, or in privately-negotiatedtransactions, subject to certain regulatory restrictions on volume, pricing, and timing. As of August 1, 2011, the remaining authorizedamount under the new authorization totaled $799.9 million.
(2) Excludes 741,047 shares repurchased in connection with employee stock plans.
Item 3: Defaults Upon Senior Securities
None.
Item 4: Removed and Reserved
None.
Item 5: Other Information
None.
45
Table of Contents
Item 6: Exhibits 3(i)
Restated Certificate of Incorporation of Humana Inc. filed with the Secretary of State of Delaware on November 9, 1989, as restated toincorporate the amendment of January 9, 1992, and the correction of March 23, 1992 (incorporated herein by reference to Exhibit 4(i) toHumana Inc.'s Post-Effective Amendment No. 1 to the Registration Statement on Form S-8 (Reg. No. 33-49305) filed February 2, 1994).
3(ii)
By-Laws of Humana Inc., as amended on January 4, 2007 (incorporated herein by reference to Exhibit 3 to Humana Inc.'s Annual Report onForm 10-K for the year ended December 31, 2006).
12 Computation of ratio of earnings to fixed charges.31.1 Principal Executive Officer certification pursuant to Section 302 of Sarbanes–Oxley Act of 2002.31.2 Principal Financial Officer certification pursuant to Section 302 of Sarbanes–Oxley Act of 2002.32
Principal Executive Officer and Principal Financial Officer certification pursuant to 18 U.S.C. Section 1350, as adopted pursuant to Section 906of the Sarbanes-Oxley Act of 2002.
101.INS** XBRL Instance Document101.SCH** XBRL Taxonomy Extension Schema Document101.CAL** XBRL Taxonomy Calculation Linkbase Document101.DEF** XBRL Taxonomy Definition Linkbase Document101.LAB** XBRL Taxonomy Label Linkbase Document101.PRE** XBRL Taxonomy Presentation Linkbase Document ** Submitted electronically with this report.
Attached as Exhibit 101 to this report are the following documents formatted in XBRL (Extensible Business Reporting Language): (i) the CondensedConsolidated Balance Sheets at June 30, 2011 and December 31, 2010; (ii) the Condensed Consolidated Statements of Income for the three and six monthsended June 30, 2011 and June 30, 2010, respectively; (iii) the Condensed Consolidated Statements of Cash Flows for the six months ended June 30, 2011 andJune 30, 2010, respectively; and (iv) Notes to Condensed Consolidated Financial Statements. Pursuant to applicable securities laws and regulations, we aredeemed to have complied with the reporting obligation relating to the submission of interactive data files in such exhibits and are not subject to liability underany anti-fraud provisions of the federal securities laws as long as we have made a good faith attempt to comply with the submission requirements andpromptly amend the interactive data files after becoming aware that the interactive data files fail to comply with the submission requirements. Users of thisdata are advised pursuant to Rule 406T of Regulation S-T that this interactive data file is deemed not filed or part of a registration statement or prospectus forpurposes of sections 11 or 12 of the Securities Act of 1933, is deemed not filed for purposes of section 18 of the Securities Exchange Act of 1934, andotherwise is not subject to liability under these sections.
46

Table of Contents
SIGNATURES
Pursuant to the requirements of the Securities Exchange Act of 1934, the registrant has duly caused this report to be signed on its behalf by theundersigned thereunto duly authorized. HUMANA INC. (Registrant) Date: August 1, 2011 By: /S/ JAMES H. BLOEM
James H. BloemSenior Vice President, Chief Financial
Officer and Treasurer(Principal Financial Officer)
Date: August 1, 2011 By: /S/ STEVEN E. MCCULLEY
Steven E. McCulleyVice President and Controller(Principal Accounting Officer)
47

Exhibit 12
Humana Inc.Computation of Ratio of Earnings to Fixed Charges
For the sixmonths ended
June 30, For the twelve months ended December 31,
2011 2010 2009 2008 2007 2006
(Dollars in thousands) Income before income taxes $ 1,223,298 $ 1,749,562 $ 1,601,760 $ 992,848 $ 1,289,300 $ 762,085 Fixed charges 89,163 156,795 159,485 127,917 109,266 98,045
Total earnings $ 1,312,461 $ 1,906,357 $ 1,761,245 $ 1,120,765 $ 1,398,566 $ 860,130
Interest charged to expense $ 54,891 $ 105,060 $ 105,843 $ 80,289 $ 68,878 $ 63,141 One-third of rent expense 34,272 51,735 53,642 47,628 40,388 34,904
Total fixed charges $ 89,163 $ 156,795 $ 159,485 $ 127,917 $ 109,266 $ 98,045
Ratio of earnings to fixed charges (1)(2) 14.7x 12.2x 11.0x 8.8x 12.8x 8.8x
Notes
(1) For the purposes of determining the ratio of earnings to fixed charges, earnings consist of income before income taxes and fixed charges. Fixed chargesinclude gross interest expense, amortization of deferred financing expenses and an amount equivalent to interest included in rental charges. One-third ofrental expense represents a reasonable approximation of the interest amount.
(2) There are no shares of preferred stock outstanding.
Exhibit 31.1
CERTIFICATION PURSUANT TO SECTION 302 OF SARBANES-OXLEY ACT OF 2002
I, James H. Bloem, principal financial officer of Humana Inc., certify that:
1. I have reviewed this Quarterly Report of Humana Inc. (the "Company") on Form 10-Q for the period ending June 30, 2011;
2. Based on my knowledge, this quarterly report does not contain any untrue statement of a material fact or omit to state a material fact necessary tomake the statements made, in light of the circumstances under which such statements were made, not misleading with respect to the period covered by thisquarterly report;
3. Based on my knowledge, the financial statements, and other financial information included in this quarterly report, fairly present in all materialrespects the financial condition, results of operations and cash flows of the registrant as of, and for, the periods presented in this quarterly report;
4. The registrant's other certifying officer(s) and I are responsible for establishing and maintaining disclosure controls and procedures (as defined inExchange Act Rules 13a-15(e) and 15d-15(e)) and internal control over financial reporting (as defined in Exchange Act Rules 13a-15(f) and 15d-15(f)) for theregistrant and have:
a) Designed such disclosure controls and procedures, or caused such disclosure controls and procedures to be designed under our supervision, toensure that material information relating to the registrant, including its consolidated subsidiaries, is made known to us by others within those entities,particularly during the period in which this report is being prepared;
b) Designed such internal control over financial reporting, or caused such internal control over financial reporting to be designed under oursupervision, to provide reasonable assurance regarding the reliability of financial reporting and the preparation of financial statements for externalpurposes in accordance with generally accepted accounting principles;
c) Evaluated the effectiveness of the registrant's disclosure controls and procedures and presented in this report our conclusions about theeffectiveness of the disclosure controls and procedures, as of the end of the period covered by this report based on such evaluation; and
d) Disclosed in this report any change in the registrant's internal control over financial reporting that occurred during the registrant's most recentfiscal quarter (the registrant's fourth fiscal quarter in the case of the annual report) that has materially affected, or is reasonably likely to materiallyaffect, the registrant's internal control over financial reporting; and
5. The registrant's other certifying officer(s) and I have disclosed, based on our most recent evaluation of internal control over financial reporting, to theregistrant's auditors and the audit committee of the registrant's board of directors (or persons performing the equivalent functions):
a) All significant deficiencies and material weaknesses in the design or operation of internal control over financial reporting which are reasonablylikely to adversely affect the registrant's ability to record, process, summarize and report financial information; and
b) Any fraud, whether or not material, that involves management or other employees who have a significant role in the registrant's internalcontrol over financial reporting.
Date: August 1, 2011Signature: /s/ James H. Bloem
James H. BloemPrincipal Financial Officer

Exhibit 31.2
CERTIFICATION PURSUANT TO SECTION 302 OF SARBANES-OXLEY ACT OF 2002
I, Michael B. McCallister, principal executive officer of Humana Inc., certify that:
1. I have reviewed this Quarterly Report of Humana Inc. (the "Company") on Form 10-Q for the period ending June 30, 2011;
2. Based on my knowledge, this quarterly report does not contain any untrue statement of a material fact or omit to state a material fact necessary tomake the statements made, in light of the circumstances under which such statements were made, not misleading with respect to the period covered by thisquarterly report;
3. Based on my knowledge, the financial statements, and other financial information included in this quarterly report, fairly present in all materialrespects the financial condition, results of operations and cash flows of the registrant as of, and for, the periods presented in this quarterly report;
4. The registrant's other certifying officer(s) and I are responsible for establishing and maintaining disclosure controls and procedures (as defined inExchange Act Rules 13a-15(e) and 15d-15(e)) and internal control over financial reporting (as defined in Exchange Act Rules 13a-15(f) and 15d-15(f)) for theregistrant and have:
a) Designed such disclosure controls and procedures, or caused such disclosure controls and procedures to be designed under our supervision, toensure that material information relating to the registrant, including its consolidated subsidiaries, is made known to us by others within those entities,particularly during the period in which this report is being prepared;
b) Designed such internal control over financial reporting, or caused such internal control over financial reporting to be designed under oursupervision, to provide reasonable assurance regarding the reliability of financial reporting and the preparation of financial statements for externalpurposes in accordance with generally accepted accounting principles;
c) Evaluated the effectiveness of the registrant's disclosure controls and procedures and presented in this report our conclusions about theeffectiveness of the disclosure controls and procedures, as of the end of the period covered by this report based on such evaluation; and
d) Disclosed in this report any change in the registrant's internal control over financial reporting that occurred during the registrant's most recentfiscal quarter (the registrant's fourth fiscal quarter in the case of the annual report) that has materially affected, or is reasonably likely to materiallyaffect, the registrant's internal control over financial reporting; and
5. The registrant's other certifying officer(s) and I have disclosed, based on our most recent evaluation of internal control over financial reporting, to theregistrant's auditors and the audit committee of the registrant's board of directors (or persons performing the equivalent functions):
a) All significant deficiencies and material weaknesses in the design or operation of internal control over financial reporting which are reasonablylikely to adversely affect the registrant's ability to record, process, summarize and report financial information; and
b) Any fraud, whether or not material, that involves management or other employees who have a significant role in the registrant's internalcontrol over financial reporting.
Date: August 1, 2011Signature: /s/ Michael B. McCallister
Michael B. McCallisterPrincipal Executive Officer

Exhibit 32
CERTIFICATION PURSUANT TO 18 U.S.C. SECTION 1350, AS ADOPTEDPURSUANT TO SECTION 906 OF THE SARBANES-OXLEY ACT OF 2002
In connection with the Quarterly Report of Humana Inc. (the "Company") on Form 10-Q for the period ending June 30, 2011 as filed with the Securitiesand Exchange Commission on the date hereof (the "Report"), each of the undersigned hereby certifies, pursuant to 18 U.S.C. Sec. 1350, as adopted pursuantto Sec. 906 of the Sarbanes-Oxley Act of 2002, in his capacity as an officer of Humana Inc., that:
(1) The Report fully complies with the requirements of Section 13(a) or 15(d) of the Securities Exchange Act of 1934; and
(2) The information contained in the Report fairly presents, in all material respects, the financial condition and result of operations of theCompany.
/s/ Michael B. McCallisterMichael B. McCallisterPrincipal Executive OfficerAugust 1, 2011/s/ James H. BloemJames H. BloemPrincipal Financial OfficerAugust 1, 2011
A signed original of this written statement required by Section 906 has been provided to Humana Inc. and will be retained by Humana Inc. andfurnished to the Securities and Exchange Commission or its staff upon request.