Embed Size (px)
Citation preview

NUMBER 48 SUMMER 1999
Summaries of articles in this issue; mast . . . . . . . . . . . . . . . . 2Contributions to Human Power . . . . . . . . . . . . . . . . . . . . . . . 7
ArticlesPropeller simulation with PropSim
Theo Schmidt. . . . . . . . . . . . . . . . . . . . . . . . . . . . . . . . . . . . . . 3The Bodysail: improved bicycle sailing
Peter A. Sharp . . . . . . . . . . . . . . . . . . . . . . . . . . . . . . . . . . . . . 8Simple approximations for the effects of tire resistance,
wind, weight and slope, Jim Papadopoulos . . . . . . . . . . . 10Minical: … determination of power use while cycling
John G. Tetz. . . . . . . . . . . . . . . . . . . . . . . . . . . . . . . . . . . . . . 13
Technical notesOptimum bodies for bicyclists
Mark Drela and Doug Milliken . . . . . . . . . . . . . . . . . . . . . 16Aerodynamic advantage from using fewer spokes
Mark Drela. . . . . . . . . . . . . . . . . . . . . . . . . . . . . . . . . . . . . . . 16Crank-arm length, Danny Too . . . . . . . . . . . . . . . . . . . . . . . . 17A tandem recumbent design, Charles Brown . . . . . . . . . . . 19Crashworthiness analysis of ultralight metal
structures, Sigit P. Santosa . . . . . . . . . . . . . . . . . . . . . . . . . 19Optimum pilot for a human-powered helicopter
Mark Drela. . . . . . . . . . . . . . . . . . . . . . . . . . . . . . . . . . . . . . . 20Transmission efficiencies, Dave Wilson . . . . . . . . . . . . . . . . 20
ReviewPedalling passengers for a living: Carl Etnier reviews
Chasing rickshaws by T. Wheeler & R. l’Anson . . . . . . . . 22
LettersCorrection to Human Power numbering system
Warren Berger . . . . . . . . . . . . . . . . . . . . . . . . . . . . . . . . . . . . . 7Wind resistance pedaling vs. coasting, Wayne Estes . . . . . . 9Bottom bracket height, Jeff Del Papa . . . . . . . . . . . . . . . . . . . 9Suspension specifications, Richard Drdul. . . . . . . . . . . . . . 24
EditorialsHPVs, health and spinning, Dave Wilson . . . . . . . . . . . . . . . 25Different strokes?, Dave Larrington . . . . . . . . . . . . . . . . . . 25
Number 48Summer 1999 $5.00
TECHNICAL JOURNAL OF THE IHPVA
HUMANPOWER

ABSTRACTPropSim is an easy-to-use propeller
simulation program for evaluating
cruising propellers. The basic functions
and usefulness are described in a first
part, and the way it works in a second,
where emphasis is given to explaining
propeller physics in simple terms.
INTRODUCTION
Many years ago I needed a propellerfor my first human-powered boat.The power-boat propellers avail-
able seemed unsuitable, so I wrote toGene Larrabee, then a professor at MIT,who had designed propellers for PaulMacCready’s Gossamer human-poweredaircraft and had published various articleson optimal propeller design [1], [2].Larrabee designed two propellers for me;the experimental models I made from hisdesigns worked very well. However, I real-ly wanted to know more about the topicand to design propellers myself.
Larrabee’s minimum-induced-dragdesign method had two disadvantages.The main one was that I couldn’t suffi-ciently understand the calculus involved!The other was that his method designedan optimum for a specified operatingpoint. This is great for records and racing,where you do have a specific operatingpoint (i.e., power required at a certainspeed) and can change propellers for dif-ferent events. I was more interested incruising, where wind and waves dictatequite different loads at different times. Iwanted a good compromise over a largeoperating range. The Larrabee designs hadhigh-efficiency peaks of over 90% at theirdesign points, but tended to stall (sudden-ly lose lift) when overloaded, thus losingefficiency. This is typical for the slender,aeronautical-type blades with highpitch/diameter ratios.
On the other hand, traditional boat orship propellers don’t stall, but don’t reachvery high efficiencies anywhere in theiroperating range. They are designed for rel-atively high loadings in order to minimisethe craft’s draft, and often for high speeds.Such propellers have wide, sometimeseven overlapping blades, resulting in both
HUMAN POWERHUMAN POWERis the technical journal of theInternational Human Powered VehicleAssociationNumber 48, summer 1999
EditorDavid Gordon Wilson21 Winthrop StreetWinchester, MA 01890-2851 [email protected]
Associate editorsToshio Kataoka, Japan1-7-2-818 Hiranomiya-MachiHirano-ku, Osaka-shi, Japan [email protected]
Theodor Schmidt, EuropeOrtbühlweg 44CH-3612 Steffisburg, [email protected]
Philip Thiel, Watercraft4720 - 7th Avenue, NESeattle, WA 98105 USA
ProductionJS Design & JW Stephens
IHPVAPaul MacCready, Honorary presidentTheo Schmidt, Switzerland, ChairChristian Meyer, Germany, Vice-chair,Jean Seay, USA, Secretary/treasurer
PublisherIHPVAPO Box 1307 San Luis Obispo, CA 93406-1307 USAPhone: +805-545-9003; [email protected]
Human Power (ISSN 0898-6908)is published irregularly, ideally quarter-ly, for the International Human PoweredVehicle Association, an organization ded-icated to promoting improvement, inno-vation and creativity in the use of humanpower generally, and especially in thedesign and development of human-pow-ered vehicles.Material in Human Power is copyright-ed by the IHPVA. Unless copyrightedalso by the author(s), complete articlesor representative excerpts may be pub-lished elsewhere if full credit is givenprominently to the author(s) and theIHPVA. Individual subscriptions are avail-able to non-IHPVA or HPVA members, asare individual issues.
considerable wetted-surface drag and tip-losses. Typical stall-proof boat propellersalso have relatively low pitch/diameterratios. They must thus turn quite fast,again resulting in much wetted-surfacedrag. Another con-sideration importantwith today’s high-powered boats is
cavitation, which occurs when the localpressure on the propeller blade’s convexsurface becomes so low that a cavityoccurs, or more accurately, that the waterbegins to boil even at ambient tempera-
Number 48 Summer 1999 $5.00/IHPVA members, $3.50
IN THIS ISSUEPropeller simulation with PropSim
Our IHPVA chair Theo Schmidtexplains how he came to write a pro-peller-simulation program, what one cando with it, and how it works. He does soin a delightfully modest way, but it is avery useful program for all but out-and-out racers, and even then some raceshave been won with propellers designedwith Prop-Sim. Theo makes it available toIHPVA members.
The Bodysail: improved bicycle sailingThere is now general agreement that
fully faired HPVs are dangerous in cross-winds. Therefore Peter Sharp’s report ofthe development in Canada of aseemingly huge sail carried high up on an“upright” bicycle and operated safely(though not in streets!) in high winds isstimulating and stunning.
Simple approximations for the effects oftire resistance, wind, weight and slope
Jim Papadopoulos provides rule-of-thumb (but mathematically derived)methods of estimating the effects ofchanges in the roadway, weather and HPVon speed. The rules often go againstaccepted beliefs.
MiniCal: an introductory spreadsheet fordetermination of power use while cycling
John Tetz’s treatment of the powerequation for vehicle propulsion is thecomplement to Jim Papadopoulos’approximations that can be used whileriding. The spreadsheet MiniCal is usedon a computer to generate points or linesor complete plots, often quite beautiful,showing the effects of various changes(in road slope, vehicle conditions, andwind) on the power input required. It issomething that would therefore be usedin the design stage of a new vehicle or inthe analysis of the performance ofexisting vehicles.
MiniCal itself is not given here, but isavailable at cost to members as a sepa-rately published (and edited) monograph.
Optimum body shapes for bicyclistsMark Drela, Jim Papadopoulos and
Doug Milliken discuss the effects of bodyshape on bicycling performance in thisshort technical note.
Aerodynamic advantage from usingfewer spokes, and Optimum pilot for ahuman-powered helicopter
These are two more technical notes byMark Drela, who produces elegant simpleand, for your editor, irresistible models ofinteresting aspects of HPV performance.
Crank-arm lengthDanny Too updates his article in the
last issue and gives a great deal ofinformation on the optimum crank lengthfor different circmstances.
A tandem recumbent designCharles Brown gives sketches of his
own tandems and discusses reasons fordesign choices.
Crashworthiness analysis of ultralight metal structures
This technical note is an abstract of anMIT doctoral thesis by Sigit P. Santosa.
Transmission efficiencies.Your editor has constructed a technical
note from various contributions givingsometimes varying measurements andestimations of the efficiencies of differenttransmissions.
Review: Chasing ricksawsCarl Etnier, who is a pedicab driver,
reviews an intriguing new book.
EditorialsYour editor has contributed a piece on
HPVs, health and spinning. A longer andvery interesting guest editorial on non-circular drives is by Dave Larrington,editor of the newsletter of the BritishHuman Power Club.
LettersLetters are on the effects of pedalling
on wind resistance; on bottom-bracketheight; on suspension specifications; andon a correction to the new numberingsystem introduced in the last issue (whichbecomes issue 47).
Propeller simulation with PropSimby Theo Schmidt
The two propellersshown here in twosolar-boat applica-tions, were developedfor human-poweredboats. The two-bladedprop is my standardcruising propellerwhich has been usedfor numerous boatspowered by one or twopersons, and in onecase, twelve persons.The six-bladed propcan be pitch-adjustedand also used withfewer blades. JochenEwert’s flying hydro-foil craft uses a two-bladed version of thispropeller. Photos,Theo Schmidt.
Figure 1. Two-bladed propeller.
Figure 2. Six-bladed propeller.
2 Number 48, summer 1999 Human Power Human Power Number 48, summer 1999 3

ture. With human-powered propellers andhydrofoils this is not a problem so far.
It is plausible that good all-round cruis-ing propellers for low-powered boats aresomewhere between the aeronautical-typeand the ship-type propellers. In order toevaluate designs suitable for cruising Ireally needed a simulation rather than adesign program. With nothing available tome to run on my “toy” computer, I wrotemy own program PropSim in the BASICprogramming language and published thefirst version in Human Power [3], alongwith a specification for a good cruisingpropeller which has since been madeabout 50 times. Quite a few peopleinquired and got copies of the program.Some, like Christian Meyer, expanded andimproved it. Many people weren’t able touse the program because their computer’sunderstanding of BASIC was different tomine: there are quite a few dialects about.Therefore I’ve rewritten the program in anew version with some improvements andam making it available as a stand-aloneapplication, at present only for theMacintosh PowerPC, free to Human
Power subscribers.
PART 1: WHAT CAN YOU DO WITH IT?PropSim is suitable for studying the
behaviour of air or water propellers usedfor human-powered craft. It can also beused for power applications as long asreasonable speeds and blade loadings arenot exceeded. Although a simulation pro-gram, PropSim does calculate and outputsuitable chord and twist-angle values ofthe blades when given the maximumchord (i.e., blade width), propeller diame-ter, and pitch. You further specify the boatspeed, medium (fresh water, sea water, orair), and number of blades.
The following (fig. 3) is a PropSiminput/output page with data correspond-ing nearly to the propeller in fig. 1.
You thus get a table of output values(e.g., power and efficiency) for a suitablerange of propeller speeds starting at thatspeed at which the propeller freewheels,i.e., produces no thrust. If your input val-ues are reasonable, one propeller speed(i.e., output line) will correspond to thevalues of a particular craft and situation.The better you know the thrust requiredfor your boat at a particular speed, thebetter you can optimise the propeller by
adjusting the input val-ues until you get theefficiency peak whereyou want it.
For a racing pro-peller you would thenconcentrate on varyingseveral values in orderto maximise the peakefficiency.
For a cruising pro-peller, you wouldexamine the behaviourat several boat speedsand come to a compro-mise which best suitsthe intended use.
Figure 4 is thegraphical output of aspreadsheet program,corresponding to thedata in figure 3. Agood overall effi-ciency requires aFroude efficiency(ETA F in fig. 3)
between 95% and 99%
ASSUMPTIONS AND LIMITATIONS• PropSim assumes and outputs
unshrouded straight blades with correcttwist for light loading. Things like sim-ple flat plates or variable-pitch propsused off the design point cannotpresently be modelled, nor can highly
skewed or bent blades (“weedless”designs) or props used in rings or tubes(e.g., bow thrusters, Kort nozzles).
• You have a choice of four reasonableblade planforms without knowingwhich of these (if any) is the optimalone. Yet the program assumes anoptimal planform, so in a general casethe output values will be slightly opti-mistic. (This is the consequence of notusing Larrabee’s minimum-induced-drag method.)
• The program uses a basic medium-thickness flat-bottomed round-nosedfoil section (Clark-Y). Stronglydiffering sections are not correctlymodelled.
• Reverse thrust (braking or turbinemodes) is not modelled.
• Overloaded (stalled) blades are onlyapproximately modelled.
• Hubs are modelled, but the larger thehub, the less accurate the result.
• No solid-material properties areassumed. Thus it is possible to designhighly efficient propellers that are notbuildable in practice (although a littlecommon sense or carbon fiber goes along way!).
• Present program versions (e.g., 4/99) runonly on Power Macintosh computers(probably any type). Sorry Bill Gates!
• Present program versions can print, butdo not save files or copy to the clip-board. To draw diagrams, you wouldhave to enter the data into an appropri-ate program manually or with an OCRprogram. The program remembers yourinput values only as long as it is keptrunning.
• The only unit system presentlysupported is metric SI with propellerspeed in revolutions per minute andangles in degrees.
WHAT GOOD IS IT?With all these limitations you might
wonder what good the whole thing is. Itturns out that most of the limitations arenot very important unless you are afterextreme achievements, where only thevery best is good enough. For most practi-cal purposes it is the overall performancewhich counts, and this is highly dependenton the basic geometry: diameter, pitch,and blade area. Planforms and sectionsare then of secondary importance. Using
the program, you can for example deter-mine a geometry which “feels” good atlow speeds, which may result in a morepopular product than some, or indeedavoid really poor mismatches sometimesproposed even by large companies orknowledgable people. The program is noweasy to use and runs quite fast, so themissing graphical and filing capabilitiesare not catastrophic.
VALIDATIONAlthough there is good agreement [3]
between some results from PropSim andthose of more sophisticated programs,this is probably a coincidence. As I havenever accurately measured any propellersand there are so many influencing factors,it is very difficult to say how accurate theresults are. My cruising propellersdesigned by this method have been verysuccessful and some have even won races,but I think the program is probably notgood enough to make propellers suitablefor breaking present hydrofoil and aircraftspeed and distance records.
WHERE CAN YOU GET IT?The new versions of PropSim are
available free of charge to members ofHPV or research organisations forpersonal use. In order to get PropSim, e-mail me at <[email protected]>. Forthose without online access, disks maybe made available subject to a postageand handling charge. Programmers inter-ested in improving the program orporting it to other operating systemsthan Power Macintosh should ask for theBASIC source code.
PART 2: HOW PROPSIM WORKSAs PropSim is not a design program,
but rather a simulation program, youhave to enter some halfway-sensibleparameters to begin with and theprogram will behave like a virtual testtank. It is mathematically inelegant,using no calculus, but only simple theoryand numerical methods to arrive at solu-tions, a task well suited to fast number-crunching computers. The underlyingmethod used is the actuator-disc theory,which describes the behaviour of a“perfect propulsor” acting continuouslyon a “disc” perpendicular to the directionof fluid flow. One could say it “couples”
perfectly to a disc of fluid which iscontinuously replaced. This theory isvalid for any fluid and for our purposesthere is no difference between air andwater as long as the physical characteris-tics are correctly modelled. Secondaryeffects like cavitation or supersonic flowalso have no bearing on the type ofpropulsor we are interested in and arenot modelled.
Because there are many misconcep-tions on the way a propeller (or indeedany propulsor) works, the remainder ofthis article attempts to explain propulsionphysics in simple terms, using PropSim’sinner working as an example. The sourcecode is available from the author or theessential parts can be found in [3].
BASICS BEHIND THE ACTUATOR-DISC THEORY
In order to produce any propulsiveforce on any craft, you must have matterto react against. In the case of land vehi-cles using wheels (or barges using poles)to push against the ground, this matter isthe ground underneath the vehicle, and asthe ground is very stiff, you are pushingagainst the whole earth, a huge masswhich moves backward a tiny amount asyou move forward. (This is action � reac-tion, Newton’s third law.) As the earth hasvery much more mass than have you andyour vehicle, you move forward almostthe full amount defined by your wheelrotation and the earth moves back only animperceptible amount. Discounting thesmall amount of tire slip, you have apropulsive efficiency of practically 100%.
Instead of reacting against the earth byturning the wheels with pedal cranks, youcould instead throw bricks out the backand propel your vehicle this way. This isthe principle by which rockets move but itis really the same thing: you are reactingagainst the mass of the brick as you throwit, producing a propulsive force equal toits mass times its acceleration (i.e., theapplied speed increase), Newton’s secondlaw. The faster you can throw the brick,the lighter it can be for the same effect,and the more bricks you can carry (space-propulsion systems emitting ions at nearlythe speed of light can operate for yearswhile expending very little mass). In orderthat you don’t run out of bricks, you couldpreviously lay them out to pick up on the
PropSim Data (default values at 2 m/s boat speed)
0
200
400
600
800
1000
1200
150 160 170 180 190 200 210 220 230 240 250 260 270 280 290 300
[rpm]
P IN [W]
P OUT [W]
ETA [%]*10
ETA F [%]*10
THRUST [N]
TORQUE [NM]*10
Figure 4. This is the graphical output of PropSim via a spreadsheet program, corresponding approxi-mately to the two-bladed Prop in Fig. 1. A good overall efficiency requires a Froude efficiency (ETA Fin figure 3) between 95% and 99%.
Figure 3. Input/output page from PropSim.
Figure 1 (smaller version from page 3). Two-bladed propeller.
4 Number 48, summer 1999 Human Power Human Power Number 48, summer 1999 5

way; this would then be the principle bywhich jets or indeed propellers operate:they intercept the fluid at rest along theirpath and act on it. To propel a boat or air-plane you are thus “picking up” and“throwing” parcels of water or air out theback; it is exactly the same as with bricksand has little to do with the Victoriannotion that a propeller pulls its waythrough a medium like a screw through ablock of wood, although the geometricalconcept of “pitch” (distance between twoscrew threads) is useful in the specialcase where there is no “slip”: at each turnthe screw advances by the distance equalto the pitch.
Now you can produce the requiredforce either by intercepting a large parcelof fluid with a large propeller and speed-ing this up only slightly, or by using asmall propeller or even a ducted impellerin order to speed up a small parcel agreater amount, right up to a high-speedjet. The propulsive force is created at thepoint where the fluid is accelerated(impeller and nozzle) and not because thejet pushes against the water or air, asmany people think. Thus the jets of manymotorised water craft actually exit abovethe water line. Now these small unitswould be really neat except for one thing:each parcel of of fluid also carries a kinet-ic energy equal to 1/2 times its mass timesits velocity squared, energy which is lostto the propulsive system. Doubling the jetspeed you need only half the mass, butyou get twice the energy loss, i.e., theinherent loss of a propulsive system is alinear function of the jet velocity.
Therefore it is clear that we must strivetowards a small velocity increase and alarge mass. The mass available per secondis equal to the fluid density times the vol-ume acted upon by the actuator per sec-ond. This is equal to the distance travelledper second times the actuator area (per-pendicular to the direction of motion). A high propulsive efficiency thus requireseither a high vehicle speed or a large actu-ator disc, whether this is a propeller, oar,or paddle wheel. Boats with relativelysmall propellers or narrow high-speed jetshave very poor propulsive efficiencies atlow speeds. At high speeds, the situationimproves, as more parcels of water arepresented to the propeller or jet drive andthus must be accelerated only slightly in
order to achieve the high mass-per-secondthroughput desired. Thus high-speed craftcan use smaller propellers or even jetssomewhat efficiently when planing orhydrofoiling, whereas slow craft or heavi-ly loaded craft need the largest propellersthat are practically possible.
The state of affairs above is describedin simple equations by the actuator-disctheory. The efficiency of an ideal propul-sor worked out this way is called theFroude efficiency and is a natural limitwhich cannot be exeeded by any device,no matter how good it is. Any propulsorwhich has virtually zero slip in the water,whether this is a very large propeller or ahuge drag device, approaches 100%Froude efficiency. The essence of theactuator-disc theory is that if the slip isdefined as the ratio of fluid velocityincrease to vehicle velocity, the Froudeefficiency is 1��slip � 1�.
BLADE FORCESThe second component needed to cal-
culate propellers is simple foil theoryapplied to propeller blades. A blade orwing moved through a fluid generates aforce by the very act of accelerating andredirecting fluid as described above. Thisforce can be resolved into componentswhich are perpendicular or parallel to theblade movement, called lift and drag,respectively, or into another pair of com-ponents perpendicular or parallel to thedirection of vehicle motion, called torque(when multiplied by the local radius) andthrust, in the case of a screw propeller.This is very similar to a wing except thatthe blade is twisted, so that the blademust be divided into several segmentswhich are treated separately.
Using the propeller diameter, pitch,and rotational speed and also the boatspeed, PropSim first works out the anglesof ten segments corresponding to anideal helix which would slide through thewater with no disturbance at all if rotatedat exactly the specified speed. A thin foilshape corresponding to this helix wouldgenerate no lift and no thrust at the pro-peller speed which corresponds to onerevolution in the time it advances alength equal to its pitch, i.e., the pitch pertime unit must equal the boat speed, giv-ing a zero angle of incidence on theblades. When the propeller is turned
faster, this angle increases and propellertheory predicts a lift force increasing inproportion. At angles under 10 degreesthis is the same for all usual wing shapesand agrees closely with what is measuredin practice. Other values affecting lift arethe surface area and the aspect ratio ofthe complete three-dimensional blade:short fat blades have considerable pres-sure loss around the tips whereas longnarrow blades are less affected this way.(This is where the first propeller design-ers erred: thinking in terms of the wood-screw model they thought they would getminimal slip with wood-screw-like pro-pellers. However these have tremendouspressure losses around the edges andwere thus particularly bad, until one dayone got broken accidently and performedmuch better, leading the way to modernpropellers!)
Now PropSim must determine the dragforce of each blade segment. At thispoint, propeller theory becomes verycomplicated or unknown and we mustmake use of values measured in tanks orwind tunnels, which are available astables or diagrams for a great variety ofdifferent wing sections. Sets of measure-ments are always similar if the so-calledReynolds number is the same, no matterwhat the size or speed of the blade orwhether the fluid is water or air. All thatis needed are tabular data at variousReynolds numbers and the size, speed,and angle of the blade. PropSim looks upthe drag data in a table as a function oflift and Reynolds number, using data forthe Clark-Y foil section, which is similarto the Eppler 193g.u. and Eppler 205 pro-files, and is relatively easy to define andmake because of the flat bottom surface.The segment forces are resolved intothrust and torque components and addedup. A further correction is also applied inorder to compensate for the tip lossesmentioned above. This is called induceddrag. In calculating this, PropSim deductsonly the theoretical minimum loss, i.e., itassumes that the blade’s planform is opti-mal. This corresponds to an elliptical liftdistribution of an untwisted blade. In thecase of a screw propeller, Larrabee hasshown that the requirement for minimuminduced drag is a uniform wash velocity,i.e., the same local slip values for all seg-ments [1]. It is therefore planned to add a
numerical optimisation routine into Prop-Sim to adjust the segments’ chord dimen-sion in order to arrive at this condition.Until this is implemented, PropSim simu-lations will be slightly optimistic forblade planforms which do not happen tobe exactly correct.
NUMERICAL SOLVINGNow we must marry the two sets of cal-
culations described above. The propellerblades sweep out a virtual disc in thefluid: this is our actuator disc. Initially weassumed no slip for the force calculationsalthough physically there must be some ifthe prescribed force is to be generated.Using the first results, we can work outthe slip or stream velocity required to pro-duce the same forces in the actuator disc.The force calculations are now repeatedusing the new slip value, and they will beseen to have changed a bit. PropSimkeeps doing this until the values no longerchange. These calculations almost alwaysquickly converge towards a solutionunless wild, nonsense, values are used asinputs. The result is thus a numerical solu-tion for the velocity of the slip stream andall corresponding forces, whence totalpower and efficiency values can bederived. Once this solution has beenfound, all desired values are printed, giv-ing a single line of output correspondingto a single operating point.
The propeller speed is now increasedby a specified increment and everythingrepeated until we have a table of pro-peller values as a function of propellerspeed, which is shown on the screen orprinted out, as shown above in Part 1.Now the boat speed could be increasedand the whole procedure repeated, so theend result is a set of tables describing thepropeller behaviour over a wide operat-ing range. It is important to develop afeeling for the physical parameters andnot to go outside sensible boundaries. Ihope that future versions of PropSim willdraw fancy diagrams or at least preparefiles suitable for drawing diagrams inother programs. Far-future versions mayeven have some optimisation routines,but I would be delighted if some of yougentle readers accomplish these improve-ments before I do!
ACKNOWLEDGEMENTSThanks to Gene Larrabee for having
started it all, and Dave Wilson, BobStuart and Michael Lampi for reviewingthis article and giving suggestions.
REFERENCES[1] Larrabee, E. Five Years’ Experience
with Minimum-Induced-Loss Propellers.SAE Technical Papers #840026 and#840027, February 1984.
[2] Larrabee, E. Propellers for human-powered vehicles. Human Power Vol. 3No. 2 (1984).
[3] Schmidt, T. A Simple Program forPropeller-Performance Prediction.Human Power Vol. 7 No. 2, (1988).
[4] Schmidt, T. Basic PropellerPerformance Prediction. Amateur YachtReseach Society Publication 109,October 1991.
[5] Poole, P.K. Propeller Design. Human
Power Vol. 9 No. 1 (1991).
Theodor B. Schmidt, 44, has lived in the
USA, Wales, England and now in
Switzerland, married, in an old farm-
house full of HPV and boat components
(but few actually functioning vehicles!).
Degree: BSc (Wales) in Physical
Oceanography and Electronic Engineer-
ing. Occupations have included domes-
tic solar installation, kite-sail, solar
hydrogen, vehi-
cle safety, and
Stirling-engine
research (with
the Center of
Appropriate
Technology in
Langenbruck,
Switzerland),
and now mainly
human- and solar-boat consulting. HPVs
and boats are a vocation, as is lobbying
for and trying to live in, a car-free
healthy environment. Vehicles built and
owned include several solar/human-
powered tricycles and electric bicycles,
scooters, and boats powered by just
about everything except internal-com-
bustion engines. Theo is current chair-
man of the IHPVA.
LETTER
AN OVERLOOKED ISSUEI enjoyed the latest issue of Human
Power, as always. I read it cover to coverwhen it first arrived. This morning, desper-ate for an HPV fix, I looked back throughit, hoping I had missed something. It turnsout that I had not gone over the renumber-ing list. I came across a few things you willwant to know.1. Issue no. 4 is labelled fall 1979 (issues
2, 3 and 4 have no volume or issuenumbers).
2. Issue no. 5 is labelled Spring 1980.3. Alas, you missed volume 2 number 2
…as a consequence, issue 46 is actuallyno. 47.
Hope I haven’t spoiled your day.—Warren A. Berger
Mea culpa! You did spoil my day, Warren!
However, it is good to have errors correct-
ed early rather than late. A corrected table
(see p. 23 of the last issue, now no. 47),
will be printed in the next issue.
—Dave Wilson
CONTRIBUTIONS TO HUMAN POWER
The editor and associate editors (youmay choose with whom to correspond;see mast, p. 2) welcome contributions toHuman Power. They should be of long-term technical interest (notices andreports of meetings, results of races andrecord attempts. Articles in the style of“Building my HPV” should be sent to HPV
News). Contributions should also beunderstandable by any English-speaker inany part of the world: units should be inS.I. (with local units optional), and the useof local expressions such as “two-by-fours” should be either avoided orexplained. Ask the editor for the contribu-tor’s guide (available in paper, e-mail orPDF formats). Many contributions aresent out for review by specialists. Alas!We cannot pay for contributions. Theyare, however, extremely valuable for thegrowth of the human-power movement.Contributions include papers, articles,reviews and letters. We welcome all typesof contributions, from IHPVA-affiliatemembers and nonmembers.
6 Number 48, summer 1999 Human Power Human Power Number 48, summer 1999 7

Previous attempts to combine bicy-cles and sails have achieved verylimited success. They have included
conventional triangular sails mounted ona mast held outboard on one side of thebicycle or mounted on a mast extendingup from the head tube, or small sailsmounted behind the rider. Typically, theyhave been difficult to control if they werelarge enough to provide significant power.
But Linc Alexander, an airplane pilotliving (or once living) in British Columbia,Canada, devised a sophisticated and pow-erful sailing system for bicycles (fig. 2)that has proven to be remarkably stable.The system is called the “Bodysail” (alsocalled “Bodisail”) because it is worn like aback pack with shoulder straps and a hipharness. It achieves a considerable degreeof control over the sail and is well suitedfor recreational use with either bicycles ora specially designed scooter (with a highplatform and handle bars that can bequickly adjusted to the size of the rider,plus other amenities; fig. 1). [We haven’tbeen able to locate Alexander, so that we
don’t know the current state of the sys-tem. —Editor]
The rectangular, symmetrical sail issurprisingly large to be used on a bicy-cle—3 meters tall by 1 meter wide. Aneven larger, advanced model is 3.5 meterstall. (That sail area is about the same asfor small, racing sand sailers, which placetheir rear wheels about 2 meters apart inorder to keep from tipping over.) TheBodysail rider achieves stability by lean-ing against the wind, somewhat like a sailboarder or a sail skater on ice. The sail,itself, is always rotated around the backof the rider to the windward side. Thesail and its controls are sophisticated yetsimple to use.
The sail is mounted on pivot armswhich extend from lockable hingesmounted on the rider’s “back pack”, andthe middle of the sail is at about the heightof the rider’s shoulders. Viewed fromabove with the sail vertical, the sail formsthe concave top of a “T”, the pivot armsform the body of the “T”, and the lockablehinges are located at the bottom of the
“T”. A cloth sail isstretched between twovertical masts at (andperpendicular to) thetips of the “T” top, oneof which contains areefer roller (springloaded) used to storethe sail. The masts arespread apart by pairs ofupper and lower sup-port arms, which areadjustable for widthusing an hydraulic handpump. That enables therider to decrease thearea of the sail by anyamount in strongwinds. The camber, orbelly, of the sail can beadjusted as well by firstlocking the reefer rollerand then moving themasts closer togetheror farther apart.
While riding, therider uses one handperiodically to adjust
the control arm, which rotates the sail andalso locks it into position. The control armis fixed to the pivot arms, and then curvesaround the right side of the rider, underthe rider’s armpit. The control arm alsohas an elbow joint that permits the handleof the control arm to be moved sidewaysinto a comfortable position. The handle ofthe control arm has three release controls:a hinge-release lever, a roller-reeferrelease lever, and an hydraulic-pressurerelease button.
Simultaneously pressing the hydraulic-release button, while squeezing therelease handle for the roller reefer, col-lapses and reefs the sail completely withintwo seconds. The handle of the hydraulichand pump is located close to the rider’sright hip. It also has a release for the rollerreefer. In addition to these controls, therider can lean forward so as to change theposition of the sail from near vertical tonear horizontal. This technique reducesdrag when turning into the wind and whenrotating the sail to the other side.
The weight of the last-known version ofthe Bodysail system is about 15 kg.(32 lbm), but the use of advanced materi-als is expected to reduce that weight. Thecomfortable “back pack” arrangementenables the rider to feel the wind as a firmbut gentle push against his back. While theBodysail is not recommended for streetriding—because the large, tall sail isleaned to the side, and because the windforce of the sail can be reduced quicklybut not instantly—experienced ridershave occasionally ridden on appropriateroads. Control of the sail, and the neces-sary balancing techniques, are learnedquickly. This is apparently due to the sim-plicity of the controls and the feedbackprovided by “wearing” the sail.
Falls are rare. An experienced rider cansteer straight ahead, without swerving,even in strong winds. For instance,Alexander has ridden in winds gusting ashigh as 18 m/s (40 mph), and he notes thathe has never fallen. The top speed of theBodysail is about twice the speed of thewind, as compared to low (recumbent)“sand sailer” tricycles which achieveabout two and a half times the speed ofthe wind. This difference is due to thehigher aerodynamic drag produced by theupright position of the Bodysail rider. Butit is the higher center of gravity of the
Bodysail rider whichhelps to providegood stability ontwo wheels.Balancing theBodysail seems tobe very similar tobalancing a bicycle.When riding the spe-cial scooter, therider’s center ofgravity is even high-er than when ridinga bicycle, thusincreasing stability.On the other hand,when using humanpower, it is easier topropel a bicyclethan a scooter. Thescooter’s mainadvantage is that itfurther improves thefun factor byincreasing therider’s freedom toshift, twist, andbend his body while sailing.
Because the Bodysail is rotated out tothe windward side of the rider, the aero-dynamic force vector of the sail usually
passes through, or in front of, the rider’scenter of gravity, even though the centerof pressure of the sail is somewhat to therear of the rider. This may partially
explain the good stability of the Bodysail.(Placing the sail’s center of pressuredirectly to the rear of the rider might oth-erwise be expected to cause instabilities.)
The Bodysail is convenient to transportand to store when folded and installed inits carrying bags. It therefore has thepotential to become the basis of a newcycle-sailing sport. It is also likely toencourage other inventors to explore thecombination of sails and cycles. If so, theBodysail could turn out to be an importantstep toward eventually transforming thenature of cycling in the 21st century.Bodisail Systems Corp. was formerly at1830 Kingsway Ave., Port Coquitlam, B.C.,Canada V3C 1S5, but is no longer there. Ifanyone knows about its present where-abouts or that of Linc Alexander, wouldshe/he please let me know? Peter A.Sharp, 2786 Bellaire Place, Oakland, CA94601 USA; <[email protected]>
Peter Sharp is a self-employed craftsman
and an amateur inventor. He rides a
Tour-Easy, a folding Dahon, and a 30-
year-old Schwinn with a fat seat. His
long-range goal is to make HPV the pri-
mary mode of transportation around the
world. In two upcoming articles he out-
lines how that might be done.
Figure 2. Bodysail worn by bicyclist.
The Bodysail: improved bicycle sailingby Peter A. Sharp
Figure 1. “Bodisailor” on a specially-designed scooter.—Photos provided by author
LETTERS
Wind resistance pedaling vs. coastingWhile on a six-day bike tour in
Colorado recently I had several occa-sions to notice that I had significantlygreater wind resistance while pedalingcompared to while coasting. This was onmy Speed Ross SWB recumbent, with anair speed of 25–30 mph (11–13.5 m/s).The typical situation would be when Iwas coasting down a gentle grade at20 mph (9 m/s) with a 10-mph (4.5 m/s)headwind (resulting in a 30-mph(13.5 m/s) airspeed). If I started to pedalmy speed would instantly decrease to18.5 mph (8.3 m/s) and it would take atleast five seconds of vigorous pedaling toregain the 20-mph speed that I had whilecoasting, and my speed would level out aabout 21 mph. So I would generally quitpedaling since the effort didn’t result inmuch speed increase.
I’ll have to do more experiments at
home with my new Fiberglass/Vivaknosecone. I presume that pedaling willhave less effect on my wind resistancewhen my legs are sheltered by thenosecone.
–Wayne Estes, Mundelein, IL, USA
BOTTOM-BRACKET HEIGHTThis concerns the letters about bottom-
bracket height and climbing, particularlyZach Kaplan’s in HP 45 (13/3). My experi-ence is about the opposite, I climb betterwith high-bottom-bracket machines. Zachand I have very different morphology (sig-nificant height difference), so there mightbe an anatomic reason to explain the dif-ference….
Watching someone go through a“FitKit™” on a “headfirst” bike, onepossibility came to mind: Response tobottom-bracket heights may be therecumbent equivalent of the “knee overpedal spindle” (KOPS) adjustment for
which the saddle of an upright has slides,albeit in a much less convenient form.The KOPS adjustment is supposed toaffect “efficiency”.
On uprights, I would slide the saddle toits rear limit (long upper leg, much shorterlower). Zach, how about you?
–Jeff DelPapa <[email protected]>
_________Zach Kaplan responded as follows.
Back when I rode uprights I’d generallyslide the saddle to or close to its forwardlimit. However I think I did this becausemy upper body is short in relation to myleg length and it made it easier to reachthe handlebars.
Interestingly, the same cycling podia-trist who told me the low-bottom-bracketrecumbent position was better for methan the high-bottom-bracket position hadpreviously told me when he fitted myupright that I should have the seat fartherback. –Zach Kaplan <[email protected]>
8 Number 48, summer 1999 Human Power Human Power Number 48, summer 1999 9

make sure that your power level remainsapproximately constant.
3. EFFECT OF WIND ON OUT-AND-BACK LEVEL RIDING
When you ride out and back with aconstant wind parallel to the road ofvelocity Vhw, it slows you in one direc-tion, and speeds you in the other. Unfor-tunately you spend more time goingslowly than going fast, so the averagespeed drops somewhat.
There is a tendency to assume that aheadwind simply subtracts its value fromyour speed, but this is not true. Normallyyou have to solve the cubic equation tofind what actually happens. Thankfully,the main effect can be approximated.The general rule is: �V�Vfl ���Vhw�Vfl)��3
On the left is the decrease in averagespeed, as a fraction of the no-wind ridingspeed Vfl.* On the right is the ratio of thewind’s speed to the no-wind speed,
squared and divided by three. For exam-ple, if the wind’s speed is half the rider’sno-wind speed, that wind will reduce aver-age out-and-back velocity by �0.5���3 or0.08, that is 8%.
When the rider is unfaired, a steadycrosswind causes just half the average-speed reduction found for a parallel wind.
4. EFFECT OF MASS ON SPRINTINGNow for another effect of rider-plus-
bicycle weight: sprinting. How far aheadwould you be at the end of a sprint if youcould shed one percent of your totalmass? There is a tendency to assume thatthe gain would be one percent of thesprint distance, but this is never the case.A longer sprint involves more time at a vir-tually constant speed (top speed), whenthere can be little effect of mass becauseacceleration has virtually ended. So thegain in distance approaches a fixed value.
For this situation the power equationmust be modified, by adding an accelera-tion term ��V��t�Mef inside the squarebrackets. (Effective mass Mef is just slight-ly greater than M, by approximately the
T he power required from the rider ofa human-powered vehicle (or theengine of an automobile) moving at
steady speed is given by P = VD�V+Vhw�� � MG(Crr � S)] P is rider powerV is HPV speed relative to the roadVhw is headwind velocity relative to the
road D is the aerodynamic-drag factor (half the
product of frontal area A, drag coeffi-cient Cd, and the air density �), with avalue around 0.2 kg/m for an uprightcyclist.
MG (kg 9.81) is the total systemweight in N (that is, pounds 4.448)
Crr is coefficient of rolling resistancewith a value between 0.002 and 0.006
S defines the uphill slope in terms of thesine of the angle (negative if downhill).Since the sine and tangent are virtuallyequal for real-world hills (S up to 0.25),S is also approximately the ‘percentslope’ divided by 100.This equation should not be considered
‘exact’, inasmuch as each term involvesapproximations. But as far as I know it isa reasonable approximation to the mostimportant drag phenomena.
The power equation can be used topredict effects on speed in any circum-stance (e.g., hill, headwind, etc.), due tochanges in any quantity (e.g., aero drag,total weight, rolling resistance) for afixed power level. But to do so generallyrequires numerical solution of the cubicequation for V, which very few of us cando routinely. (And cubic equations don’tlend themselves to “thinking about”magnitudes.) It turns out that one canstill make progress in many cases, byderiving simplified laws which give agood idea of some effects of practicalinterest. In fact they are simple enoughto be remembered, and used mentallyduring a ride, if the user is so inclined.
These simplified laws are presentedhere. Their actual derivations, which aresomewhat complicated, may possibly befound in the next, third, edition ofBicycling Science, in preparation, and/orin a future issue of Human Power.
1. EFFECT OF ROLLING RESISTANCE ON LEVEL SPEED
Let’s look at rolling resistance. Definean ideal ‘no rolling resistance’ level speed,Vnr, as the speed reached for a givenpower output when rolling resistance isabsent. Then we can calculate the approx-imate fractional speed decrease (at thatsame power level) due to any amount ofrolling resistance:�V�Vnr � �MGCrr���DVnr����3, or �V � �MGCrr���3 DVnr�
It can be seen that the speed loss �V isproportional to Crr, and inversely propor-tional to the ideal or no-rolling-drag speed,which is very close to the actual speed.(Note: here and subsequently, a ‘�’ in frontof a quantity represents a ‘delta’ or‘change’ in that quantity.)
In the fraction in square brackets in thefirst of these two equations, the numera-tor is the rolling drag (typically a littlemore than 2N or 0.5 pound), and thedenominator is the aerodynamic drag atfull speed (typically 15N or 3.5 pounds ifunfaired, or half that if well streamlined).Ordinary rolling resistance therefore caus-es a decrease from ideal speed of about5% in the first case, and 10% in the second.
As a specific example, suppose that ona level road on a day without wind youfind that you can ride at 11 m/s, 24.6 mph,with tires that have a Crr of 0.003, and youwould like to know how much additionalspeed you could expect if you invested inexpensive tires that had a Crr of 0.002. Youand the machine total 80 kg, and yourvalue of D is 0.18 kg/m (from Cd � 0.9,A � 0.33 m�, and air density � 1.2 kg/m �.Using the second equation and insertingas an approximation your actual speedinstead of your ideal speed, you calculatethe full loss of speed due to rolling resis-tance as �809.810.003���30.1811�, orabout 0.4 m/s. (If you wish, you can thenmake a closer approximation to Vnr as11.4 m/s, and make a closer calculation ofthe speed loss as 0.38 m/s or 0.86 mph.)The gain in speed from reducing the tirerolling resistance by a third is, then, one-third of this, about 0.13 m/s or 0.29 mph.This is a 1.2% speed increase, which
would lead to a time saving of 43 secondsin an hour. (For a recreational rider thismay not seem to be much, but for a racerit is enough to clinch a race decisively. )
This equation also shows the effect ofsystem weight on level speed. But where-as rolling resistance can be reduced by(say) 33% relatively easily, it is hard toreduce total weight by more than two orthree percent. Thus the time savings in anhour would be four seconds or less. Ifsomeone goes noticeably faster withlighter components, it is probably becauseof being psyched up!
2. EFFECT OF WEIGHT ON UPHILL CLIMBING SPEED
Now let’s look at the effect of reducingrider-plus-vehicle weight, W � MG, on thespeed of climbing any size of hill. A one-percent reduction in system weight willincrease speed for fixed power output, butby how much? Most people would assumea speed increase of one percent, but theywould be wrong. The result dependsstrongly on the slope of the hill and theaerodynamic drag.
Luckily, one needn’t solve the cubicpower �velocity equation to find the effectof mass. The general rule is:
��Vhl�Vhl� 1 � �Vhl�Vnr� ———— � ——————���W/W� 1 � 2 (Vhl�Vnr�
On the left is the ratio of expectedpercentage increase in hill speed Vhl, topercentage weight or mass decrease. Inthe expression on the right, �Vhl�Vnr� isthe ratio of speed on any given hill, toideal (no rolling resistance) speed on theflat, assuming the same rider power. As agood first approximation, instead of Vnr
you could use Vfl, your actual speed onthe flat.
To apply this relation, you have to knowyour own ratio for your own hill—does itslow you to half your normal speed? or toone third? On a hill which slows you tohalf your normal speed for constantpower output, �Vhl�Vfl� is 1�8, and theright side of the equation is 0.7. Thereforea one-percent weight savings will lead to a0.7-percent speed increase.
The main problem in using this simple‘hill speed ratio’ is that many riders‘attack’ short hills, and ride up them atmuch higher power than on the level. Youmight want to monitor your heart rate, to
mass of two tires and two rims. This dif-ference will be ignored here.)
This is a much harder problem to solve,because it involves a differential equationwhich must be integrated through hun-dreds or thousands of time steps. Ofcourse this can be done by computer, butsuch results are in no way general.The general rule is:Distance gained ������M��Vext�L�
On the right is ��M�M�, your fractionalor percentage decrease in mass orweight. The quantity in curly brackets is afictitious distance, computed fromsprinting time t, velocity reached (whenexiting the sprinting zone) Vex, and sprintdistance L. The constant-power sprintcan be assumed to start either at rest orat any initial velocity—the value of initialvelocity does not enter the expressiondirectly. Fictitious distance is always lessthan the actual sprint distance, typicallyabout a quarter or third the value in thecase of one or two hundred meters.
In words: the distance gained in a t-sec-ond sprint is the percent decrease in mass,times the difference between the sprint
Simple approximations for the effects of tire resistance, wind, weight and slopeby Jim Papadopoulos
* This was derived assuming no rolling
resistance, in which case Vfl � Vnr. The
inaccuracy introduced when rolling resis-
tance is present has not been investigated.
10 Number 48, summer 1999 Human Power Human Power Number 48, summer 1999 11

Q uite often we hear generalizedstatements being made concerningissues such as the amount of
power required to climb a hill, or deter-mining the amount of power an individualis capable of delivering or the differencein power demand of adding or subtract-ing a weight on a vehicle, or determiningaerodynamic drag (CdA) and rolling resis-tance (Crr) and many other interestingmatters. With the resources availabletoday we can be more specific than aregeneral statements.
The now ubiquitous personal computerallows an individual to leave behind meregeneralizations and guesses in favor ofmore specific and objective answers tothe power question. Spreadsheet pro-grams, which merchants often provide aspart of the software package of a newcomputer, manipulate equations with the
noted in coasting down any slope.
6. ESTIMATING THE AERODYNAMICDRAG FACTOR, D
D is almost always important to HPVspeed. Apart from measuring it accuratelywith coast-down instrumentation or awind tunnel, how can you get a rough ideaof its value for your size, riding position,and typical clothing?
Find a very level stretch of road severalhundred meters long. You also need tofind a time (like dawn) when the air iscalm—wind will badly upset the results.Finally, you need a speedometer whichresponds quickly, and measures in tenthsof mph or kph.
Mark off a test distance, 50 m or 100 m.(Once you’ve calibrated your gearing, youcan do this in terms of a certain number ofpedal revolutions. Also, telephone poles inmy neighborhood are 51.5 m apart.) Theessence of the test will be to coastthrough that measured distance, startingat 9–11 m/s (20–25 mph), and note thespeed at the beginning (Vin) and the end(Vex). Then the average drag force inNewtons is MVav�Vin�Vex)�L , where Mis the total mass in kg, the velocities aregiven in m/s (note that m/s is mph 0.45),and L is the distance in m. Vav is definedas (Vin�Vex)�2.
Where you proceed from there dependson the accuracy you seek. If you do thistest multiple times, in both directions, atroughly the same initial speed, you may beable to cancel the effect of slope, andaverage the effects of bumps and wind.
At high speeds, at which the drag forceis almost all aerodynamic, you couldapproximate D as F/Vav�, or M�Vin�Vex���LVav�. Coasting atvarious initial speeds should give roughlythe same value for D.
If you wished to try your hand atdetermining values for D, Crr, and S, youwould plot the computed force versusVav� for each of your trials. Ideally thepoints would fall on two straight, parallellines. The slope of the lines would be D.The average of the two intercepts wouldbe MGCrr. The difference of the twointercepts would be MG2S. (But Iwould be very surprised if real-worldconditions allowed you to succeed atthis! You might well find a large cloud of
data points, which hint at somethingphysically impossible, such as negativerolling resistance….)
BIOGRAPHICAL NOTEJim Papadopoulos
<[email protected]> is a reg-
istered engineer who has spent much of
his life trying to understand bicycles. He
has a Ph.D. in the areas of mechanics
and materials, and works in R&D at
Rexnord, a manufacturer of power trans-
mission hardware in Milwaukee,
Wisconsin. In previous years he co-
founded the Cornell University Bicycle
Research Project, offered bicycle engi-
neering services as BICYCLE R&D, and
started the internet mailing list
Hardcore Bicycle Science. He has been
engineering editor for the journal
Cycling Science, and chair of the ASTM
task group on handlebar testing. He has
patents on single-pass computerized
wheel truing, and on a regenerative
brake for bicycles.
same ease as the more familiar wordprocessors manipulate text.
The simple spreadsheet layoutdescribed herein, Mini Calculator orMiniCal, introduces the first of a series ofincreasingly sophisticated spreadsheetswhich Jo-el Sanders, John Snyder and Ideveloped to explore a range of differentcycling situations. The tentative names ofsome give a hint as to their function:Power, Gearing, %Power Distribution;Power Comparitor; CoastdownCalculator; CdA Estimator. These will bemade available to the public as completeddigital files via the HPVA web site, andother sources as demand so warrants.
Spreadsheets are only as good as thequality of their formulation. The formula-tions used in the series are meticulouslydetailed in “A Primer on BicycleMechanics, with a Spreadsheet for PowerCalculations” by Joël Sanders, publishedas a separate monograph and available, atcost, through the HPVA. The primerexplains the expressions according to“first principles.” It is recommended read-ing for anyone who wishes to study theempirical basis of these spreadsheets.
The primer’s primary audience repre-sents the “artisan” community—thosewho design and build human-poweredvehicles, yet who do not possess a formalengineering background. The primer,along with MiniCal and the rest of theseries, provides these individuals withaccess to a cycling-focused treatment ofmechanical theory via a versatile compu-tational instrument, such that they maybetter understand and quantify theirefforts. The spreadsheet as an integralpart of any tool collection enables adesigner to isolate effects, to study pat-terns, and to predict outcomes with rea-sonable accuracy, greatly lessening thetrial-and-error phase demanded by unguid-ed experimentation. MiniCal’s intendedaudience also includes avid cyclists whowish to begin exploring the relationshipsof inter-related parameters, thus increas-ing their riding skill and greatly expandingwhat they can accomplish aboard a bicy-
800 W, and 27.3 mph would have implied1000 W.)
5. IMPROVEMENT IN LEVEL SPEED PREDICTED FROMINCREASE IN COASTING SPEED
If you find a long, constant-slope hill,your steady-state coasting speed is justsuch that your total drag equals the hillslope S times your weight. (Beware—achieving steady state is slow. A smalldeviation from the true steady-statespeed is reduced by about 63% only aftercoasting a distance of M��2D�, or about200 m. You may have to pedal to theexpected coasting speed, then watchyour speedometer to see if you guessedcorrectly.)
One trouble with this experiment isthat it requires measuring the hill’s slope.Another is that your total drag force ,alone, is not enough information todetermine your aerodynamic drag factor.
Something simple you can do, however,is to coast the same hill with two differentriding positions. (Or two different bikes,as long as the wheels are switched to keeprolling resistance constant!) If one hasless aerodynamic drag, you will coastfaster. It might take an afternoon of trials(good training!), but if there is no wind,you ought to be able to establish the speedadvantage quantitatively.
That information can be used to inferthe improvement in aerodynamic dragfactor: ��D�D � 2 �Vcs �Vcs
(Here, Vcs is steady coasting speed on adownslope. Delta Vcs refers to the differ-ence in speed for the two cases.)
The percentage decrease in the dragcoefficient is twice the observed percent-age increase in speed on the slope.
In turn, the decrease in drag factor canbe used to predict the improvement to Vfl,your speed on the flat: �Vfl�Vfl �����D�D� � 3��WCrr���DVfl����� 2��Vcs�Vcs) � 3 ��WCrr���DVfl���
As shown in the first section, the sec-ond term in the square brackets variesbetween 0.14 and 0.29 at high speeds forunfaired and faired bicycles, respectively.Ignoring this small contribution for sim-plicity, we can say that the percentagespeed increase on the level, expected dueto reduced aerodynamic drag, is approxi-mately 2/3 the percentage speed increase
cle, and to make more meaningful com-parisons to different vehicles and riders.
MAKING A MINICAL SPREADSHEETThe following will describe how an
individual may build MiniCal from scratch.The spreadsheet layouts have beendesigned around user inputs which are aset of variables defining the bicycle, theenvironmental conditions, and the intend-ed or observed riding technique used. Theequations in turn reveal the correspondingpower value in either horsepower orwatts.
The velocity, grades, weights and otheruser inputs depicted in the example willserve to confirm the accuracy of yourreplication. Later, new values will be usedto illustrate how the spreadsheet can beutilized. It is assumed that the reader willposses some familiarity with the spread-sheet program that he or she chooses touse. If you do not have sufficient experi-ence it pays to find a friend to help withthe initial set up. Building your ownspreadsheet gives the advantage of a deep-er understanding of the workings andoperations.
MiniCal may be generated in either oftwo basic versions: feet per sec units(U.S.) or SI metric units. The authorsused the spreadsheet applicationMicrosoft Excel™ to create these instruc-tions. Other computer programs willfunction in a similar manner, although theuser should consult relevant documenta-tion for her/his specific application.
Start by opening a spreadsheet programand checking to see if you have up to Lcolumns. If not you can change the % sizein the zoom control in the right side of thetool bar. Cell letters represent horizontalrows, whereas numbers representcolumns. Cells may contain text, numeri-cal values, or mathematical equations asentered by the user. Start in cell A1 andtype in MINICAL in 14 pt bold text. Thiswill be the name of the spreadsheet.
The sections below provide the celladdress (A3:, B3:, etc.) followed by theinformation typed into the cells. These are
distance, and the distance that could havebeen covered in t seconds at the finalvelocity Vex.
The trouble is, many of us have neverhad a constant-power sprint timed andmeasured. So a graph has been provided,to illustrate the concept. It wasconstructed to depict one slightly heavyindividual, with system mass M�100 kg,aerodynamic-drag factor D�0.2 kg�m,and Crr�0.003.
The main curves reflect sprinting atconstant power, starting at rest. Theyshow how speed rises as more distance iscovered, and are marked with time sincethe start. But most sprints do not startfrom a dead stop. With this graph, you canpick an initial speed, and determineelapsed time and elapsed distance asvelocity increases.
Consider the rider travelling at 22 mph(9.9 m/s), with a steady power output of223 W. Power is suddenly raised to 600 Wfor a long sprint of 300 m. Enter the600 W curve at 9.9 m/s, which gives astarting distance of 68 m and a startingtime of 10 s. Adding 300 m for a final dis-tance of 368 m reveals a final time of34.3 s (elapsed time 24.3), and a finalspeed of 13.6 m/s (30.2 mph). The ‘ficti-tious distance’ is then 13.624.3�300 �30.5 m. Reducing system mass by 1%(1 kg) will move the rider forward by305 mm, or almost exactly one foot—about 0.1% of the total sprint distance.
When I consider reducing the weight ofmy bicycle, I put it in the context of howmuch I care about gaining a distanceadvantage like this. If I was routinely los-ing by more, there’d hardly be any point.
Note that the graph can also be usedto estimate power output for those indi-viduals whom it ‘fits’. Consider a ridertravelling at 7 m/s (15.5 mph) in an 80"gear (6.38 m per crank revolution).Suppose that ten crank revolutions atmaximum effort brings the speed up to12 m/s or 26.7 mph. The graph is used byseeking the proper power curve, whichshows a speed increase from 7 to 12 m/s,over the elapsed distance of 64 m. Imarked the speed increase and distanceincrease on tracing paper, and concludedthat they would have fallen on a 920-Wcurve, if such had been present. (A finalspeed of 25.8 mph would have indicated
Minical: an introductory spreadsheet for determination of power use while cyclingby John Tetz
Continued from page 12
12 Number 48, summer 1999 Human Power Human Power Number 48, summer 1999 13

patterns with “drop and drag”. Drop anddrag allows the computer user to repeatthe spreadsheet layout numerous timeswithout having to re-type the entries.
Click on cell A5. While hovering overthe cell the cursor appears as a white“plus” sign but when moved to the lowerright corner of the cell it will change to adark � sign. With the cursor appearing as adark plus sign hold down the mouse but-ton while dragging across to the last cellto the right, L5, and release the mouse but-ton. All the cells in row 5 should now beselected as indicated by a darkened back-ground. Without touching the mouse but-tons move the cursor to the lower rightcorner of L5 until the cursor changes intoa dark cross. Click and drag down at leastten rows. Drag down farther if you sowish. All of the data and formulas willhave been repeated ten times or more.
Select cell J5: velocity. Change its pre-sent value to 1. Move down one cell to J6typing in the formula. �J5�1. Press the“enter” key. The value “2” will appear.Once again select J6. Using the black �cursor, click the mouse while drawing thecursor down the row from J6 to J16.Release the button: you will observe thedisplayed velocity increasing in 1 mph (orkm/h) increments in each sequential row,with the corresponding changes in powerappearing in column “L”. You can do thisoperation to all user-defined non-formulacells such as weights, grade, wind, CdAand Crr. You may also insert single valuesin user-defined cells to compare the para-meter sets of different bicycles or differ-ent riding conditions. Enjoy exploring!
POWER CAPABILITYAn exciting prospect in conjunction
with MiniCal’s ability to quantify power isthe capability of almost any bicycle tohave the potential of functioning as anergometer. With our ability to calculatepower over a wide range of speeds andgrades we have the first step in findingyour power capability. The second step isin locating a suitable hill of uniform slopeand steepness—enough that you can raiseyour effort near your normal higher-levelhill-climbing ability. You could also climbat your more typical effort to learn whatthat power level is. So look for a rathersteep hill (5%–6%) long enough to get agood workout.
titles for which I generally capitalize thefirst letter and use bold to differentiatethese labels from other cells. Titles will bein 10-pt. text size. Our first row will berow 3. The same titles are used for bothU.S. and metric. U.S. and MetricA3: CdA G3: Total WtB3: Crr H3: WindC3: Eff I3: Grade ���D3: Rider Wt J3: VelocityE3: Vehicle Wt K3: PowerF3: Cargo Wt L3: Power (used only
for U.S. version)
UNITSNow is the time to make a choice to
configure MiniCal as either in U.S. or inS.I. metric units. Type in the words, or let-ters and symbols, exactly as they appearbelow, including the parentheses, exclud-ing the cell location and colon as before.U.S.A4: (Cd x ft2 G4: (lbm)B4: (no units) H4: (mph)C4: (percent) I4: (percent)D4: (lbm) J4: (mph)E4: (lbm) K4: (hp)F4: (lbm) L4: (watts)MetricA4: (Cd x m2) G4: (kg)B4: (no units) H4: (km/h)C4: (percent) I4: (percent)D4: (kg) J4: (km/h)E4: (kg) L4: (watts)F4: (kg)Note: (lbm) denotes pounds-mass todifferentiate it from pounds-force. Thecoefficient of rolling resistance is a ratioand is thus dimensionless.
INPUT PARAMETERSFor the moment type in the user inputs
as they appear below. Set the number ofdecimal places to appear the same asshown if possible (adjust by clicking onthe decimal buttons on Excel’s tool barto increase or decrease). You may alsowish to use the underline feature todifferentiate user inputs from calculatedvalues. Notice in the following listingcertain cells do not have a suggestedinput. These cells (G5, K5 and I5) will befilled in later with formulas.U.S. MetricA5: 2.4 G5: A5: .223 G5:B5: .0070 H5: 2.0 B5: .0070 H5: 3.2C5: 95 I5: 2.0 C5: 95 I5: 2.0
D5: 160 J5: 10.0 D5: 72.6 J5:16.2E5: 27 K5: E5: 12.3 K5:F5: 5.0 I5: F5: 2.27
FORMULASNow begin to carefully enter the
formulas. The first will add the Vehicle,Rider and Cargo weights to provide TotalWeight. U.S. and MetricG5: �D5�E5�F5
In Microsoft Excel™ an equals (�) signsignals to the program that an equationfollows. After typing in the formula pressthe “enter” key. A value of 192 lbm(87.1 kg) should appear in cell G5. If not,recheck your entries ensuring they havebeen typed exactly as shown above. Theformula will appear in the tool bar if youclick on cell G5. There you may correctany errors.
In cell K5 you will enter the Powerequation which consists of the sum of sep-arate formulas representing Gravity,Aerodynamic Drag, and RollingResistance, divided by Drive-TrainEfficiency. (More sophisticated formula-tions in the series account for additionalterms including; air temperature and pres-sure, wheel weight, acceleration, etc.)MiniCal’s power equation appears belowas a group of three lines, but it must betyped in as one continuous string (no car-riage returns or spaces). U.S. formula for cell K5: ��((2.66710^(�3)G5J5I5/100) �(6.6710^(�6) A5(J5+H5)^2J5) �(2.667*10^(�3) B5G5J5))/(C5/100)Cell L5:L5 �K5746SI metric formula for cell K5:� ((2.706G5J5I5/100)��(1.24710^(�2)A5(J5�H5)^2J5)�(2.706B5G5J5))/C5/100)Press the “enter” key.
If everything has been entered correctlythe power output will read 0.170 hp and/or127 watts. Caution: after the spreadsheetis checked to be working properly make acopy because if in the future you make amistake by typing something in a formulacell you will erase that formula.
EXPLORINGOne of the most useful features, of a
computerized spreadsheet like MiniCal isan ability to explore an array of numerical
Suggestion: because you have to climbthis hill several times you may want to usethis same hill to determine your CdA valueas you go back down. To compare theaerodynamic efficiency of your vehicleagainst others it is necessary only to com-pare effective frontal area (CdA), which isthe product of the aerodynamic drag coef-ficient (Cd) and the frontal area (A). Youcan determine your actual CdA by usingour Coasting Calculator. The Coaster alsois used to determine your Crr (rollingresistance) on flat ground at low speeds.
I happen to have a hill that has acontinuous climb of 67 m in 1125 m,which is a 6% grade (I measured theelevation gain on a geodetic map). On amap look for elevation lines that areevenly spaced meaning the grade isreasonably uniform. Four-lane center-divided highways generally have moreuniform grades (and wider shoul-ders). Try to get an accurate valuefor percentage grade because thiswill affect your results. The moreaccurately you set up the test themore accurate your results canbecome.
Now comes the physical work.Do your tests on a relatively calmday. You could put in a wind condi-tion ( �� for wind coming behind—or from passing cars) but wind isgenerally not steady. Also our cal-culators are set up for wind in linewith the vehicle travel. You shouldmake your calibration run as “pure”as you can. Later you can play withwind values on your spreadsheetand see what that does.
Do a warm-up ride, then go tothe bottom of the hill, zero yourodometer/bike/computer/timer. Ideallythis computer should read in tenths ofkm/h or mph and have a manual start-stop button. A heart-rate monitor wouldbe handy but not absolutely necessary.Now take a breath and start climbing. Tryto climb at a uniformly hard rate andwhen you arrive at a known stopping(distance/altitude) point write down thetime, distance, average speed. Do at leastthree to four runs or until your body says“enough”. Go home. Have a cool drinkand get out your spreadsheet programs.
At this point you will have to estimateyour CdA and Crr (see table 1). CdA and
Crr values have a small impact for this testif the grade is steep and the speed is low.Then insert your test values in the propercells and read your power. For instance,for four runs on a 6% grade, with an aver-age heart rate of 140 beats per min with apeak of 154 beats (close to my max) myaverage speed is 6.5 mph. This converts to0.233 hp (176 watts) with other userinputs of, Eff 95, CdA 2.4, Crr 0.007, Bike27 lbm, rider 160 lbm.
By climbing more slowly my more typi-cal power level is 0.150 hp, 110 watts. (Ifthese power levels seems very low waittill you get to my age!). If you type in a 3-mph (4.9 km/h) speed into MiniCal it willshow a surprisingly low power level. Do afew more runs on different days to seehow uniform your data are and also tocalibrate your internal sensation of whatvarious power levels feels like.
OTHER INVESTIGATIONSAs a way to understand the effects of
different variables, reduce the grade tozero, increase the speed to 15 mph andchange the value of CdA to zero. For mybike the value of 0.055 hp is the powerrequired to overcome a Crr of 0.007. Thenreduce Crr to zero and insert CdA of 2.4and you will see that CdA and Crr areabout equal at the surprising speed of 15mph. As CdA drops to 1.0 the speed climbsto 23 mph for them to be equal. So youcan see the contribution of these twoterms. Some of our spreadsheets includean automatic percentage power distribu-tion of gravity, air resistance, rolling resis-
tance, acceleration, efficiency, pedalpower, and power to the wheel.
LIMITATIONS AND STRENGTHSThe accuracy of any calculation is only
as good as the quality of its input values.How well defined the inputs are dependson such external factors as: one’s ability todetermine grade, the accuracy of weightscales, the calibration of the cycle com-puter used to determine velocity, the accu-racy of reported wind speed, etc.Additionally MiniCal must be recognizedas an entry-level tool. Many potentiallydefined variables such as air density, winddirection, and nuances in the calculationof grade were omitted for the sake ofbrevity. In the same spirit the tablesaccompanying this article are to beregarded as guidelines.
CONCLUSIONThe MiniCal is simple enough to build
from scratch allowing a user to becomeacquainted with the formulation andoperation of computerized spreadsheets.It is compact enough to be used in suchbicycle-portable computer platforms aspersonal digital assistants and palmtops.
Other spreadsheet layouts in the serieswill serve as a set of tools which give auser the ability to determine customizedparameter sets for her/his individualvehicle. Quantifiable differences amongvehicles are finally possible.
REFERENCES, ADDITIONAL READING1. Sanders, Joël. A primer on bicycle
mechanics, with a spreadsheet forpower calculations, a monograph pub-lished by the HPVA, 1999.
2. Martin, James C., Douglas Milliken,John Cobb, Kevin McFadden andAndrew Coggan. Validation of aMathematical Model for Road CyclingPower, Jl of Applied Biomechanics,1998, 14, 276–291.
3. Whitt, Frank Rowland, and DavidGordon Wilson. Bicycling Science, 2nded. ISBN 026273060X, MIT Press, 1982.
4. HPVA web site: www.ihpva.org/hpva/
John Tetz <[email protected]> is
an engineer who retired after 38 years at
Bell Laboratories, and who is having the
time of his life. He writes that he just
cannot stay off his bikes.
Table 1. Representative parameter valuesPara-meter Value Ref Comment
ft2 m2
(CdA) 6.0 0.56 2 Upright roadster4.3 0.40 Touring (arms straight)3.4 0.32 Racing (full crouch)2.9 0.27 Open recumbent1.9 0.18 Racing (draft position)1.4 0.13 Typical faired recumbent0.5 0.046 Streamlined faired
recumbentCr 0.005–0.010 1 1-1/4-inch tire; good
road0.002–0.007 Various tires; smooth
surface0.002–0.005 3 Various tires; smooth
surface� 0.95 1 ~2% chain, 1% bearings,
2% limbs
14 Number 48, summer 1999 Human Power Human Power Number 48, summer 1999 15

ciple of specificity of training, I would sus-pect performance to be better with thecrank-arm length that the second individ-ual had been training with. Using the“optimal” crank-arm length (found for thefirst individual) by the second individualwould, initially, result in a decrement inperformance before there is an adaptationand training effect (and an increase in per-formance that may surpass that the othercrank-arm length originally trained with).
Fourth, there are also inter-individualvariability and intra-individual variabilityin cycling performance. Individuals (evenelite cyclists) will vary in performancefrom one day to another (intra-individualvariability) and some individuals will havegreater day-to-day variability than others(inter-individual variability). A certaincrank-arm length that maximizes perfor-mance on one day may result in anincreased or decreased performance onanother day. Multiple trials would be need-ed to determine what would be consid-ered to be an average performance valuefor that particular crank-arm length. Thisis on the assumption that there is nolonger a learning curve or training effectdue to repeated trials. The exact sameprocedure would have be repeated for dif-ferent crank-arm lengths and statisticalanalysis undertaken to determine if differ-ences in average performance betweendifferent crank-arm lengths are attributedto chance (random performance variabili-ty from a day-to-day basis), or truly to dif-ferences in crank-arm length. (Note: thereare other factors to consider, such as ran-domizing the crank-arm length experimen-tal conditions and trials). This is obviouslya lengthy and tedious process since itbecomes a research-oriented project withcontrols implemented to remove any con-founding variable(s) that may affect theresults. But controls of this sort wouldreveal (to the person willing to undertakethis task) what is the crank-arm lengththat would maximize his/her performancefor that particular test protocol. There arealso other difficulties encountered, suchas what crank-arm lengths to examine.Based on my research, 35-mm changes incrank-arm length will clearly (althoughnot always statistically significantly)affect performance. Changes of this mag-nitude will significantly alter hip and kneeangles. However, will there be a difference
The force on the spoke (diameter D) atsome radius r, pointing mostly normal tothe spoke, is therefore:
dF � 0.5 � Vn�� Cd D dr (� is the air density)
The power required to drive the spokeagainst this force is dP � dF Vn
Also,dP � horizontal-force V � torque �
which gives the same result. The bottomline is dP � 0.5 � �Vn� Cd D dr
The quantity r/R � cos��� relating V andVn is negative only for a circular regionjoining the ground-contact point to thehub, the circle is the set of points wheredP � 0� and is never less than �1. So leav-ing it out has little effect on the final resultfor P.
dP is easily integrated, first over 0..r..Rto get the power of one spoke at angletheta, and then averaged over 0..�..2� todetermine its typical contribution over theentire wheel revolution. 2�P ���� from 0 to R���integral from 0 �2 �) 0.5 ��V� [r�R � cos�����Cd D dr d�This gives:P � 0.5 � V Cd A where A � DR is the frontal area of spoke. Therefore the average power needed todrive a single spoke around on the wheelis the same as if it were simply held in thebreeze at right angles to the flow (e.g.,attached upright to the bike frame).
—Mark Drela <[email protected]>
[This was taken, with permission, from
some correspondence on the HBS mail
list. —Ed.]
CRANK-ARM LENGTHby Danny Too
Since there has been quite a bit of inter-est and discussion about crank-armlengths, and since I referred to my studyin the last issue of Human Power, Ithought I would provide some additionalcomments.
First, it is very difficult to generalize aspecific crank length that would be opti-mal for everyone, and it is just as difficultto specify an exact crank length thatwould be optimal for any one person. Thereason? There are many factors thatwould affect the “optimal” crank-armlength to maximize/optimize cycling per-formance, and there is a complex interac-tion among these factors. These factors
include: height of the person, total leglength, thigh-length-to-leg-length ratio,seat-to-pedal distance, type of recumbentposition, load/resistance/gear ratio used,pedalling rate, type of measurement (peakpower, average power), training effect orfamiliarity with a specific crank-armlength, inter-individual variability, andintra-individual variability.
Second, it may not be the crank-armlength that is as important in determiningcycling performance as the crank-armlength that optimizes the hip and kneejoint angles (which then optimizes musclelengths) to maximize force and torque tothe pedals in cycling performance. Forinstance, the optimal crank-arm length forone individual 6 ft (1.80 m) tall (who hasshort legs but a long trunk) may not beoptimal for another 6 ft individual (whohas long legs but a short trunk). I wouldsuspect that the joint angles (hip, knee,ankle) and joint kinematics during a pedalcycle between the two 6-ft individualswould be different and how/where force,torque, and power are produced (and dur-ing which part of the pedal cycle it is pro-duced) would also be different and couldhave a major effect on cycling perfor-mance. By the same token, two 6-ft indi-viduals with the same total leg lengthsmay have different ratios of the lengths ofthigh to lower leg. One individual mayhave a very long thigh and a very shortlower leg, and the other one may have avery short thigh and very long lower leg.Therefore, what is an optimal crank-armlength for one person may not be optimalfor another (since the joint angles andkinematics of the hip and knee are proba-bly more important variables to considerthan crank-arm length).
Third, on the assumption that a certaincrank-arm length is found that maximizescycling performance on a recumbent foran individual (with a certain height, totalleg length, thigh-to-lower-leg-length ratio,etc.), would this crank-arm length alsomaximize cycling performance for a sec-ond individual having the same anthropo-metric characteristics? The answer couldbe yes and no. It depends. If the secondindividual has had significant experienceon a recumbent (while the first individualdid not) and this second individual consis-tently trained and cycled with some givencrank-arm length, then based on the prin-
TECH NOTES
OPTIMUM BODIES FOR BICYCLISTSby Mark Drela and Doug Milliken
Mark Drela wrote: Jim Papadopoulosgave some data on the physiology of bicy-clists and the speeds they attained. I triedto correlate speed with power/drag-area. Idefine an average diameter “d” by repre-senting the rider as a circular cylinder ofthe same mass and height. This thendefines a body aspect ratio a � h�d and afrontal area A � hd. If all riders are geo-metrically similar, then A should be pro-portional to the frontal and drag areas,and P�A should be proportional to V3.
When I plot P�A versus V3 from thecolumns below, I don’t get a straight line.It’s more like a meatball! This implies thatrider shape is a critical parameter. This isevident in the last column CD�, which is amodified drag coefficient based on theequivalent area rather than the truefrontal area. CD� should be a constant forall riders of the same shape. Clearly,shape matters.
Looks like rider A had rather stream-lined parents.
—Mark Drela ([email protected])
Doug Milliken commented, with regardto Mark Drela’s statement, “Looks likerider A had rather streamlined parents.”
Or maybe he/she spent some time in thewind tunnel, working on position. Smalladjustments in riding position can makerelatively large changes in drag.
John Cobb (Bicycle Sports) has beenpart of the Texas A & M tests run by SteveHed (Hed Wheels) for the last 10� years.John has a great deal of experience work-ing in the tunnel with different athletes,and has established a real “eye” forputting riders in positions for low drag,without any major changes in rider poweroutput. There are a lot of subtle changesthat can make significant differences, inthe context of racing.
—Doug Milliken
[This was extracted, with permission,
from the HBS mail list. For subscrip-
tion information on the HBS (Hardcore
bicycle science) list, see: www.sheldon-
brown.com/hbs.html
For frequently-asked questions, see:
www.sheldonbrown.com/glossary.html]
AERODYNAMIC ADVANTAGE FROMUSING FEWER SPOKESby Mark DrelaTed Bennett writes:“My question is two-part: is there any sig-nificant aerodynamic gain in using fewerspokes, especially on front wheels whichare in the slipstream, unfaired by forks orthe rider’s body?”
The spoke drag should be very nearlyproportional to the total frontal area of allthe spokes. If you hold the spoke stressfixed, then the frontal area varies as thesquare-root of the number of spokes. Sogoing from 36 2-mm spokes to nine 4-mmspokes should theoretically cut the spoke
drag in half. Other considerations obvious-ly preclude using nine spokes.
Theoretically, the effective drag of aspoke rotating in a wheel is roughly thesame as if the spoke were held fixed atright angles to the airflow, as shownbelow. Assuming a coefficient of drag, Cd,of 1.2 for a cylinder, the CdA of 36 spokesis about 0.025 m�. The actual CdA will beconsiderably less than this, since thespokes draft the rim and each other to var-ious extents depending on the crosswind.
[Jim Papadopoulos points out that
there isn’t much drafting effect from one
spoke to another because they are not
close enough: see the technical note on
interference drag by Jim and Mark in
issue 46.]
The whole bike � rider in a crouch hasCdA = 0.3 m� (from Bicycling Science,Whitt & Wilson), so the worst-case spokedrag for one wheel is about 0.025/0.3 = 8%of the total for the bike. Maybe 3-5% mightbe the actual number—I can’t say.
The rest of this technical note gives thereasoning behind the statement on thetheoretical effective drag of a spoke. Thewind resistance force on a spoke is mostlyat right angles to the spoke, since this isthe direction that pressure forces must actregardless of the wind direction. Only fric-tion forces can act along the length of thespoke, and these are quite small by com-parison. The drag coefficients are, approx-imately, Cd � 1.0 for round cylinder in subcriticalflow at a Reynolds number of about 3000.andCd � 0.044 for very thin 3-mm-long airfoilsat 13.5 m/s (30 mph).
Mainly pressure forces act on the cylin-der, and only friction forces act on thethin airfoil. The latter should be represen-tative of the friction forces on the spoke.Furthermore, the pressure forces dependonly on the flow velocity component nor-mal to the spoke—the flow componentalong the spoke has little influence. Thisis why jets have swept wings: the wingairfoils think they are flying at the Machnumber times the cosine of the sweepangle, instead of at the full flight Mach.
The normal velocity component Vn
seen by the spoke at some radius r (in awheel of radius R) for bike speed V is
Vn � Vr/R + cos���� where � is theangle of the spoke from the vertical.
M � �b h d� �/4 �body density: �b � 1000 kg�m3��
A ��hd ����Mh���b
CD� � �P�A���0.5 �V � �air density: ����1.225 kg/m3�Ri- t M h LT P(1hr) a A P/A V3 CD�der (min) (kg) (cm) (l/min) (W) (m2) (W/m2) (m3/s3)A 51.0 79.8 1.8700 4.40 376. 8.022 0.1900 1978.9 2233.7 1.4465B 52.5 71.3 1.8150 4.14 359. 8.115 0.1648 2178.8 2047.6 1.7373C 52.5 74.8 1.8450 4.40 363. 8.121 0.1757 2065.8 2047.6 1.6472D 54.0 80.7 1.8300 3.94 357. 7.723 0.1880 1898.6 1881.7 1.6473E 54.0 70.2 1.7400 3.71 336. 7.677 0.1555 2160.4 1881.7 1.8745F 54.0 77.1 1.8500 4.08 360. 8.031 0.1816 1982.3 1881.7 1.7199G 55.5 62.4 1.7480 3.50 307. 8.199 0.1389 2210.6 1733.2 2.0823H 55.5 66.4 1.7400 3.93 331. 7.894 0.1471 2250.1 1733.2 2.1196
I 56.0 73.2 1.7750 3.77 325. 7.746 0.1654 1964.6 1687.2 1.9011J 57.0 73.9 1.7850 3.95 335. 7.775 0.1680 1994.6 1599.9 2.0354K 59.0 81.2 1.8380 4.23 336. 7.750 0.1900 1768.2 1442.7 2.0010L 59.0 69.0 1.7330 3.84 326. 7.697 0.1523 2141.2 1442.7 2.4232M 61.0 75.7 1.8080 3.60 313. 7.831 0.1743 1796.1 1305.4 2.2465N 59.0 62.1 1.7300 3.34 300. 8.092 0.1368 2193.2 1442.7 2.4820O 65.0 62.0 1.6850 3.08 256. 7.785 0.1330 1924.6 1078.9 2.9124
16 Number 48, summer 1999 Human Power Human Power Number 48, summer 1999 17

would gear up the front wheel nicely. Agood design is one made from an old backhub. A cog is attached to one of the hubflanges, and a chain runs down from thisto a single sprocket on the front wheel.The ‘power’ or highly-tensioned side of thechain should be nearly parallel to thesteering axis. One end or the other of thischain can be a little closer to the steeringaxis than the other, but looking at it fromthe top, the chain must be going straightout from the steering axis. This is so thatthe forces from pedalling do not try toturn the steering a little bit to the right orleft with each pedal stroke, which forcesmust be resisted by the rider’s hands onthe handlebars.
A freewheel or cassette would beattached to this upper hub, allowing gearchanges, and a second chain would runforwards from this to the crankset. Properpositioning of the intermediate gear unit isessential, and the builder might want toallow for some fore-and-aft adjustment ofit. This would allow fine-tuning of thechain line of the final drive if someonewants to change the gearing there. Themountings for this intermediate drivemust be made very strong and rigid.
Gearing up the 20" (500-mm) rear wheelis more problematical. A rear cassettewith an 11-tooth top cog combined with a60-tooth big chain ring would give a 110-inch top gear. Alternatively, an internally-geared hub could step up the gearing.
Bicycles are controlled by a combina-tion of balancing and steering; it helps thecaptain pilot the machine if she or he hasfirm control over the balance. A stokermoving around unexpectedly can make atandem hard to manage. To improve this,the captain’s center of gravity should beup higher than the stoker’s, so the person
steering the craftalso has more lever-age, and thus morecontrol, over thebalance. This is par-ticularly important ifthe lighter persondoes the steering. In the sketch I’ve
placed the captain’sseat over the stok-er’s pedals to makethe bike more com-pact: other arrange-
or their particular recumbent position. —Danny Too <[email protected]>
Dept. of Physical Education & Sport
State University New York at Brockport
Brockport, NY 14420-2989
Tel: (716)-395-2403
Fax: (716)-395-2771
A TANDEM RECUMBENT DESIGNby Charles Brown
I’d like to share some thoughts with youon the design of recumbent tandems.Reliability tends to be a problem ontandems, whether upright or recumbent,because they often take parts which weredesigned for single bikes and impose onthem twice the load.
Wheel strength varies with size, so awheel that’s half the diameter needsapproximately half the spokes for equiva-lent strength. 20" (500 mm) rims and hubsare readily available with 36-hole drilling;these should provide a sturdy foundationfor your steed. Further, the drive wheel(s)could be built up without dish, the off-cen-ter rims being compensated for by movingboth dropouts 1/3" (10 mm) to the right.This gives even more strength withoutadded weight, just from using the materi-als more intelligently.
Drive-train troubles caused by havingthe power of two applied to parts madefor one could be reduced if the front riderpowered the front wheel, and the rearrider powered the back. Independent ped-alling cadence comes automatically withsuch a design. This may incur a slightweight gain, but you get the advantage ofnot having to transfer the front rider’spower seven feet (2 m) to the back wheel,with the attendant losses of power.
The two-stage drive train often used infixed-boom front-wheel-drive designs
ments are of course possible. Note that ontandem recumbents with a 20" front wheelunder the captain’s knees, like this one, a20" back wheel makes for a better front-to-rear balance than the more usual 20"front-, 27" rear-wheel sizes, improving theride and handling. In the drawing, adjust-ment for different-size riders is by movingthe rear seat forwards and back, and bymoving the front pair of pedals fore andaft. This will probably require changingthe length of the chain, but the captain’swill probably not require adjustment veryoften.
—Charles Brown
1875 Sunset Point Rd., #206
Clearwater, FL 33765
[Editor’s note: chain management takes
on critical significance in front-wheel-
drive systems. There must be no chance
that the chain could come off and lock the
front wheel. Dave Wilson.]
CRASHWORTHINESS ANALYSIS OF ULTRALIGHT METAL STRUCTURESby Sigit P. SantosaAbstract of a doctoral thesis presented at
MIT, May 1999.
In the design of lightweight crashwor-thy metal structures, thin-walled prismaticcomponents have been widely used in air-craft, high-speed trains, fast ships, andautomobiles. Two new types of such com-ponents are proposed, both of which con-sist of a thin-walled member and anultralight metal core such as an aluminum
Figure 1. Side view. Drawings provided by author.
Figure 2. Front details.
largest power output. However, as fatiguesets in during the latter part of the test(especially during the last five seconds),the pedalling rate decreases to some-where between 82 rpm (for the 110-mmcrank) and 93 (for the 230-mm crank).This decrement in pedal rate with theload selected favours the use of a longercrank (230 mm for this study). The 180-mm crank happened to be most advanta-geous if the power production (meanpower) over the entire 30-second test wasconsidered. Would the results have beendifferent if a significantly greater or less-er load/resistance was used (or if trainedrecumbent cyclists were used)? I wouldthink so. Care must be take in interpret-ing the results of any study. It should benoted that the average leg lengths of thesubjects were: total leg length measuredfrom the greater trochanter to the floorwas 941 mm; upper leg length measurefrom the greater trochanter to the kneecenter of rotation was 409 mm, and thelower leg length was 534 mm. Not all sub-jects showed the same parabolic trend inpower production with increments incrank-arm length from 110 to 265 mm.This is attributed to intra- and inter-indi-vidual variability and the a training effectwith repeated testing. However, this train-ing effect was accounted for in theresearch design of the study where eachsubject was tested with a different crank-arm length test sequence. Finally, thisstudy was a power test for 30 secondsand not an extended aerobic study. Again,I have other data sets collected, but havenot had the time to analyze them.
To provide information about cranksthat is a little bit more substantial, I haverun regression analyses on the data set forthat particular study. The results from theregression equations obtained predict thatpeak power (5-second interval) would beobtained with 124-mm cranks, highestaverage power (for 30 seconds) would beobtained with 175-mm cranks, and thelargest minimum power (last 5 seconds inan 30-second all-out power test) would beobtained with a 215-mm crank.
One final caveat. These predictedcrank-arm lengths are limited to thesubjects, recumbent position, and testprotocol used in that particular experi-ment. It is not necessarily true or applic-able for experienced recumbent cyclists
in cycling performance between cranksthat differ by 10 mm (e.g., 170 vs. 180 mm)or 5 mm (e.g., 145 vs. 150 mm) or 2 mm or1 mm? And will the differences be equallyapplicable to individuals of differentheights and leg lengths? I don’t know.There are a lot of questions, but very fewanswers because very few people areinvolved in this area of human-powered-vehicle research (especially for recum-bents). In addition, if the test protocolinvolves a maximum-endurance test, or atest for an extended period of time, thenmotivation becomes a very large andimportant factor and could confound theresults. This is the reason why I have useda 30-second all-out power test for myexperiments (since it has been determinedto be extremely simple, reliable, consis-tent, and a robust test with minimal intra-individual variability from day to day. Butthen the training effect has to be account-ed for if the same individual is testedrepeatedly over time). To illustrate theeffect of motivation on performance, asimple example will be used. If you wereto cycle the same route (e.g., 42 km,26 miles) each day with maximal effort,but on some days you were chased by afairly large dog for several miles at variousparts of the route, I would predictfaster/shorter average times during thosedays being chased (although maximaleffort is given on all days). This informa-tion was provided by a friend of mine (a“regular” cyclist) who, with his friends,noted that their cycling times were signifi-cantly faster on days they were chased byfarm dogs in open areas along their route.
Fifth, to add to the confusion, there isan interaction among crank-arm length,pedalling rate, and load/resistance gearratio. This would suggest that there maynot be one optimal crank-arm length thatmaximizes power production, but several(depending on the load and pedalling rateselected). The optimal crank-arm lengthto maximize power would be dependenton the load and pedalling rate, and couldbe one where the maximum pedallingrate is maintained with the largest loadthat can be applied (without a decrementin maximum pedalling rate). Based on themuscle force-velocity-power relationship,for a given power output, optimal ped-alling rate would decrease with increas-ing load (with a constant crank-arm
length). This would suggest thatincreased loads to maximize power,resulting in a decreased pedal rate, wouldfavour longer crank-arm lengths. For agiven power output, it is possible that ashorter crank-arm length with a higherpedalling rate and lower resistance wouldbe equally effective when compared to alonger crank-arm length pedalling at alower rate (but higher resistance). I havecollected data examining these interac-tions, but have not had the opportunity tocrunch and analyze them. I have been toobusy making revisions to reviewers’ com-ments to a manuscript submitted to theJournal of Sports Sciences (on howchanges in crank-arm length affect powerproduction in upright-cycle ergometry.With the same load, it appears the effectson power production are different inrecumbent-cycle ergometry. But this is apaper that is currently in review for publi-cation in Ergonomics).
To conclude, and to perhaps, shedsome light on the “optimal” crank-armlength to maximize power, I will providea brief summary of my paper currently inreview. In that paper, a recumbent posi-tion was used to test crank-arm lengthsof 110, 145, 180, 235, and 265 mm. Nine-teen untrained males (most have nevercycled a recumbent) were each tested inall five crank-arm-length conditionsaccording to a different randomized testsequence for each subject. The test was a30-second all-out power test with a loadof 85 gm/kg of body mass. The results onpower production showed a parabolic(inverted U-shape) curve with incrementin crank-arm lengths from 110 to 265 mm.Peak power (highest power produced inany five-second interval during the 30-second test) was found with the 145-mmcrank. The largest mean power (averagepower produced for the entire 30-secondtest) was found with the 180-mm crank,and the largest minimum power (powerproduced during the last five seconds ofthe test) was found with the 230-mmcrank. What does all this mean? It meansthat there is an interaction among crank-arm length, load, pedalling rate, andpower output. For the load selected (85g/kg of body mass), a crank-arm length of145 mm (based on the five cranks used inthis study) with a pedalling rate ofapproximately 170 rpm will produce the
18 Number 48, summer 1999 Human Power Human Power Number 48, summer 1999 19
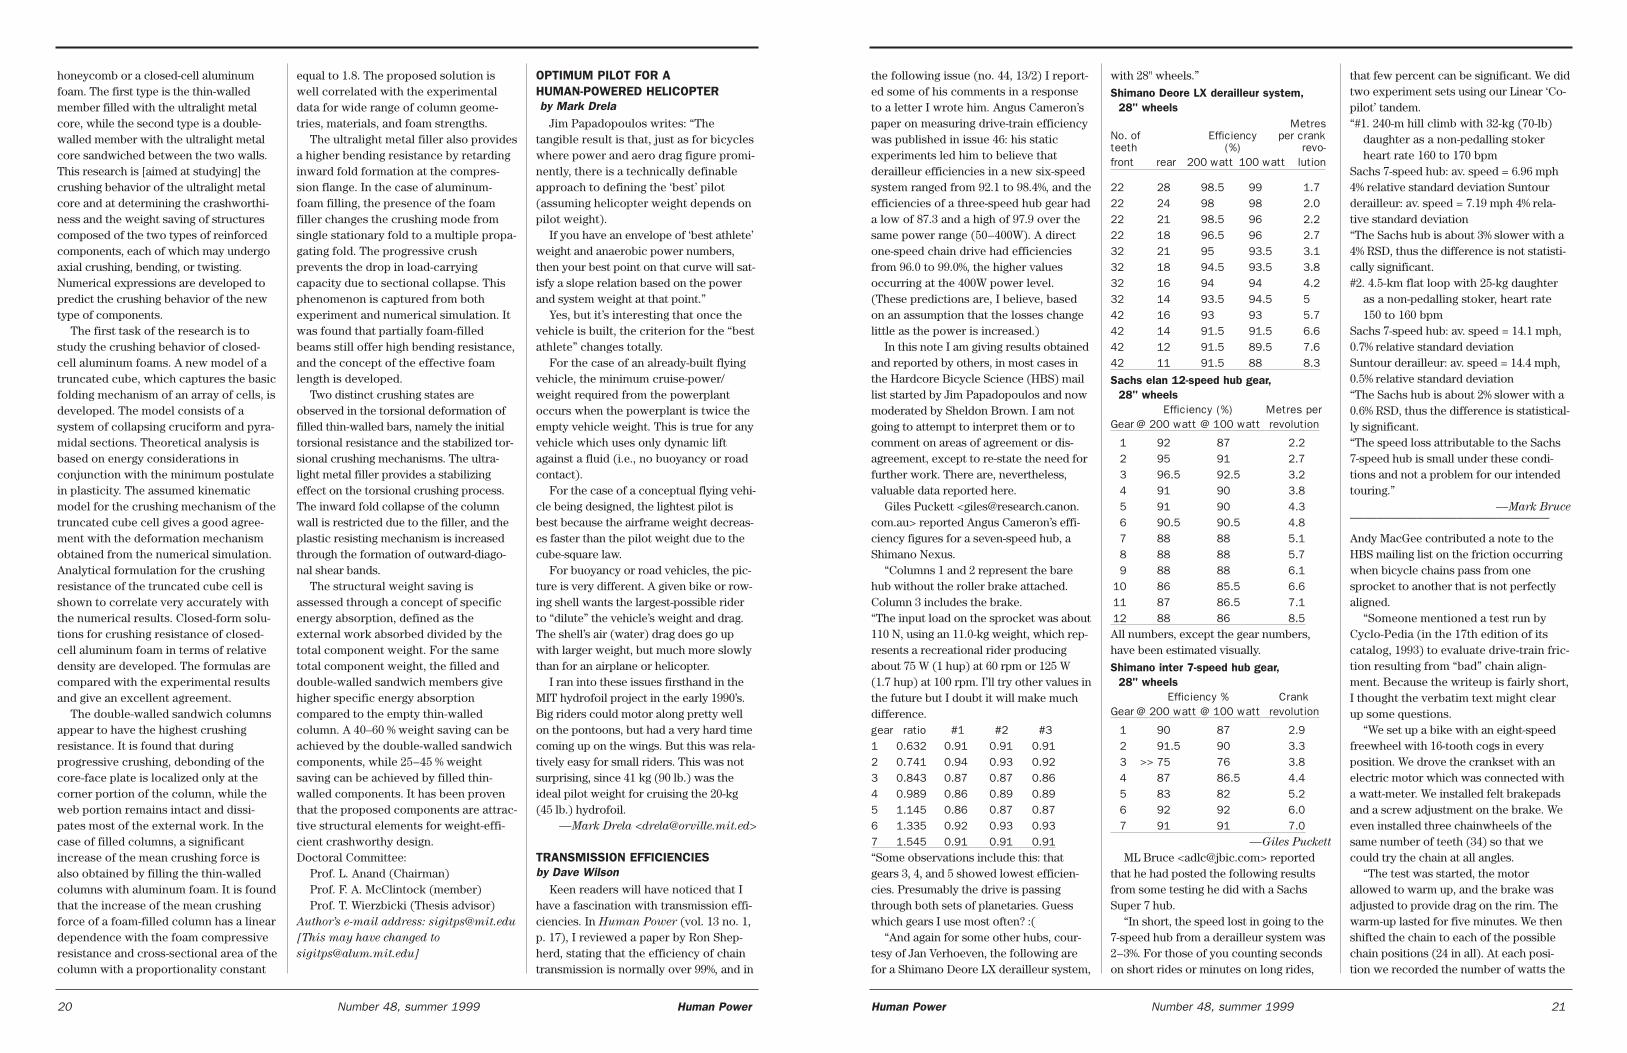
the following issue (no. 44, 13/2) I report-ed some of his comments in a responseto a letter I wrote him. Angus Cameron’spaper on measuring drive-train efficiencywas published in issue 46: his staticexperiments led him to believe thatderailleur efficiencies in a new six-speedsystem ranged from 92.1 to 98.4%, and theefficiencies of a three-speed hub gear hada low of 87.3 and a high of 97.9 over thesame power range (50–400W). A directone-speed chain drive had efficienciesfrom 96.0 to 99.0%, the higher valuesoccurring at the 400W power level.(These predictions are, I believe, basedon an assumption that the losses changelittle as the power is increased.)
In this note I am giving results obtainedand reported by others, in most cases inthe Hardcore Bicycle Science (HBS) maillist started by Jim Papadopoulos and nowmoderated by Sheldon Brown. I am notgoing to attempt to interpret them or tocomment on areas of agreement or dis-agreement, except to re-state the need forfurther work. There are, nevertheless,valuable data reported here.
Giles Puckett <[email protected]> reported Angus Cameron’s effi-ciency figures for a seven-speed hub, aShimano Nexus.
“Columns 1 and 2 represent the barehub without the roller brake attached.Column 3 includes the brake.“The input load on the sprocket was about110 N, using an 11.0-kg weight, which rep-resents a recreational rider producingabout 75 W (1 hup) at 60 rpm or 125 W(1.7 hup) at 100 rpm. I’ll try other values inthe future but I doubt it will make muchdifference. gear ratio #1 #2 #31 0.632 0.91 0.91 0.912 0.741 0.94 0.93 0.923 0.843 0.87 0.87 0.864 0.989 0.86 0.89 0.895 1.145 0.86 0.87 0.876 1.335 0.92 0.93 0.937 1.545 0.91 0.91 0.91“Some observations include this: thatgears 3, 4, and 5 showed lowest efficien-cies. Presumably the drive is passingthrough both sets of planetaries. Guesswhich gears I use most often? :(
“And again for some other hubs, cour-tesy of Jan Verhoeven, the following arefor a Shimano Deore LX derailleur system,
with 28" wheels.”
Shimano Deore LX derailleur system, 28" wheels
MetresNo. of Efficiency per crankteeth (%) revo-front rear 200 watt 100 watt lution
22 28 98.5 99 1.722 24 98 98 2.022 21 98.5 96 2.222 18 96.5 96 2.732 21 95 93.5 3.132 18 94.5 93.5 3.832 16 94 94 4.232 14 93.5 94.5 542 16 93 93 5.742 14 91.5 91.5 6.642 12 91.5 89.5 7.642 11 91.5 88 8.3
Sachs elan 12-speed hub gear, 28" wheels
Efficiency (%) Metres perGear @ 200 watt @ 100 watt revolution
1 92 87 2.22 95 91 2.73 96.5 92.5 3.24 91 90 3.85 91 90 4.36 90.5 90.5 4.87 88 88 5.18 88 88 5.79 88 88 6.1
10 86 85.5 6.611 87 86.5 7.112 88 86 8.5All numbers, except the gear numbers,have been estimated visually.
Shimano inter 7-speed hub gear, 28" wheels
Efficiency % CrankGear @ 200 watt @ 100 watt revolution
1 90 87 2.92 91.5 90 3.33 >> 75 76 3.84 87 86.5 4.45 83 82 5.26 92 92 6.07 91 91 7.0
—Giles Puckett
ML Bruce <[email protected]> reportedthat he had posted the following resultsfrom some testing he did with a SachsSuper 7 hub.
“In short, the speed lost in going to the7-speed hub from a derailleur system was2–3%. For those of you counting secondson short rides or minutes on long rides,
that few percent can be significant. We didtwo experiment sets using our Linear ‘Co-pilot’ tandem. “#1. 240-m hill climb with 32-kg (70-lb)
daughter as a non-pedalling stokerheart rate 160 to 170 bpm
Sachs 7-speed hub: av. speed = 6.96 mph4% relative standard deviation Suntourderailleur: av. speed = 7.19 mph 4% rela-tive standard deviation“The Sachs hub is about 3% slower with a4% RSD, thus the difference is not statisti-cally significant.#2. 4.5-km flat loop with 25-kg daughter
as a non-pedalling stoker, heart rate150 to 160 bpm
Sachs 7-speed hub: av. speed = 14.1 mph,0.7% relative standard deviationSuntour derailleur: av. speed = 14.4 mph,0.5% relative standard deviation“The Sachs hub is about 2% slower with a0.6% RSD, thus the difference is statistical-ly significant.“The speed loss attributable to the Sachs7-speed hub is small under these condi-tions and not a problem for our intendedtouring.”
—Mark Bruce———————————————
Andy MacGee contributed a note to theHBS mailing list on the friction occurringwhen bicycle chains pass from onesprocket to another that is not perfectlyaligned.
“Someone mentioned a test run byCyclo-Pedia (in the 17th edition of itscatalog, 1993) to evaluate drive-train fric-tion resulting from “bad” chain align-ment. Because the writeup is fairly short,I thought the verbatim text might clearup some questions.
“We set up a bike with an eight-speedfreewheel with 16-tooth cogs in everyposition. We drove the crankset with anelectric motor which was connected witha watt-meter. We installed felt brakepadsand a screw adjustment on the brake. Weeven installed three chainwheels of thesame number of teeth (34) so that wecould try the chain at all angles.
“The test was started, the motorallowed to warm up, and the brake wasadjusted to provide drag on the rim. Thewarm-up lasted for five minutes. We thenshifted the chain to each of the possiblechain positions (24 in all). At each posi-tion we recorded the number of watts the
OPTIMUM PILOT FOR A HUMAN-POWERED HELICOPTERby Mark Drela
Jim Papadopoulos writes: “Thetangible result is that, just as for bicycleswhere power and aero drag figure promi-nently, there is a technically definableapproach to defining the ‘best’ pilot(assuming helicopter weight depends onpilot weight).
If you have an envelope of ‘best athlete’weight and anaerobic power numbers,then your best point on that curve will sat-isfy a slope relation based on the powerand system weight at that point.”
Yes, but it’s interesting that once thevehicle is built, the criterion for the “bestathlete” changes totally.
For the case of an already-built flyingvehicle, the minimum cruise-power/weight required from the powerplantoccurs when the powerplant is twice theempty vehicle weight. This is true for anyvehicle which uses only dynamic liftagainst a fluid (i.e., no buoyancy or roadcontact).
For the case of a conceptual flying vehi-cle being designed, the lightest pilot isbest because the airframe weight decreas-es faster than the pilot weight due to thecube-square law.
For buoyancy or road vehicles, the pic-ture is very different. A given bike or row-ing shell wants the largest-possible riderto “dilute” the vehicle’s weight and drag.The shell’s air (water) drag does go upwith larger weight, but much more slowlythan for an airplane or helicopter.
I ran into these issues firsthand in theMIT hydrofoil project in the early 1990’s.Big riders could motor along pretty wellon the pontoons, but had a very hard timecoming up on the wings. But this was rela-tively easy for small riders. This was notsurprising, since 41 kg (90 lb.) was theideal pilot weight for cruising the 20-kg(45 lb.) hydrofoil.
—Mark Drela <[email protected]>
TRANSMISSION EFFICIENCIES by Dave Wilson
Keen readers will have noticed that Ihave a fascination with transmission effi-ciencies. In Human Power (vol. 13 no. 1,p. 17), I reviewed a paper by Ron Shep-herd, stating that the efficiency of chaintransmission is normally over 99%, and in
honeycomb or a closed-cell aluminumfoam. The first type is the thin-walledmember filled with the ultralight metalcore, while the second type is a double-walled member with the ultralight metalcore sandwiched between the two walls.This research is [aimed at studying] thecrushing behavior of the ultralight metalcore and at determining the crashworthi-ness and the weight saving of structurescomposed of the two types of reinforcedcomponents, each of which may undergoaxial crushing, bending, or twisting.Numerical expressions are developed topredict the crushing behavior of the newtype of components.
The first task of the research is tostudy the crushing behavior of closed-cell aluminum foams. A new model of atruncated cube, which captures the basicfolding mechanism of an array of cells, isdeveloped. The model consists of asystem of collapsing cruciform and pyra-midal sections. Theoretical analysis isbased on energy considerations inconjunction with the minimum postulatein plasticity. The assumed kinematicmodel for the crushing mechanism of thetruncated cube cell gives a good agree-ment with the deformation mechanismobtained from the numerical simulation.Analytical formulation for the crushingresistance of the truncated cube cell isshown to correlate very accurately withthe numerical results. Closed-form solu-tions for crushing resistance of closed-cell aluminum foam in terms of relativedensity are developed. The formulas arecompared with the experimental resultsand give an excellent agreement.
The double-walled sandwich columnsappear to have the highest crushingresistance. It is found that duringprogressive crushing, debonding of thecore-face plate is localized only at thecorner portion of the column, while theweb portion remains intact and dissi-pates most of the external work. In thecase of filled columns, a significantincrease of the mean crushing force isalso obtained by filling the thin-walledcolumns with aluminum foam. It is foundthat the increase of the mean crushingforce of a foam-filled column has a lineardependence with the foam compressiveresistance and cross-sectional area of thecolumn with a proportionality constant
equal to 1.8. The proposed solution iswell correlated with the experimentaldata for wide range of column geome-tries, materials, and foam strengths.
The ultralight metal filler also providesa higher bending resistance by retardinginward fold formation at the compres-sion flange. In the case of aluminum-foam filling, the presence of the foamfiller changes the crushing mode fromsingle stationary fold to a multiple propa-gating fold. The progressive crushprevents the drop in load-carryingcapacity due to sectional collapse. Thisphenomenon is captured from bothexperiment and numerical simulation. Itwas found that partially foam-filledbeams still offer high bending resistance,and the concept of the effective foamlength is developed.
Two distinct crushing states areobserved in the torsional deformation offilled thin-walled bars, namely the initialtorsional resistance and the stabilized tor-sional crushing mechanisms. The ultra-light metal filler provides a stabilizingeffect on the torsional crushing process.The inward fold collapse of the columnwall is restricted due to the filler, and theplastic resisting mechanism is increasedthrough the formation of outward-diago-nal shear bands.
The structural weight saving isassessed through a concept of specificenergy absorption, defined as theexternal work absorbed divided by thetotal component weight. For the sametotal component weight, the filled anddouble-walled sandwich members givehigher specific energy absorptioncompared to the empty thin-walledcolumn. A 40–60 % weight saving can beachieved by the double-walled sandwichcomponents, while 25–45 % weightsaving can be achieved by filled thin-walled components. It has been proventhat the proposed components are attrac-tive structural elements for weight-effi-cient crashworthy design. Doctoral Committee:
Prof. L. Anand (Chairman)Prof. F. A. McClintock (member)Prof. T. Wierzbicki (Thesis advisor)
Author’s e-mail address: [email protected]
[This may have changed to
20 Number 48, summer 1999 Human Power Human Power Number 48, summer 1999 21

ronmentalist’s ideal, the very opposite ofplanned obsolescence, it also is probablyone factor discouraging design improve-ments that could make them more friendlyto the driver, like lower vehicle weight.“The new pedicabs I build have to com-pete for sales with every other pedicabthat has ever been constructed,” com-mented Steve Meier, of Main StreetPedicabs in Denver, Colorado. So it is inAsia, as well. Even in cities where tens ofthousands of pedicabs are operated, nosingle manufacturer puts out more thansome dozens of new vehicles each year. Itis easy to see how the smallness of themarket for new vehicles, together with arisk aversion surely merited where a sin-gle design has dominated for decades,could work together to keep a lid on inno-vation.
The pedicabs’ capabilities vary greatlywith the design. The Singapore sidecarcannot take more than one adult, whetherof European or Asian dimensions. A strik-ing photo shows thirteen pedicabs in arow on a street in Singapore, each of thedrivers highly visible in a yellow shirt, andbut one passenger in each. Judging fromthe selection of photos for this book, atleast, it seems that the delta trishaws ofAgra are the real pack horses. They areshown chock full with kids in school uni-forms and festooned with hanging schoolbags, or full with a 2.5-m-high load ofmetal containers, securely tied down. The social impact of pedicabs
“Socialism can arrive only on abicycle,” predicted José Antonio Viera-Gallo, Assistant Secretary of Justice inthe government of Salvador Allende.[1]
But what if thebicycle (ortricycle) ispedalled bysomeone else?The social andeconomic lot ofthe rickshawoperator variesconsiderablyfrom place toplace, as we seeclearly in theportraits thatWheeler andl’Anson provide.
Explaining why 95% of his colleaguesare bachelors, 54-year-old Penang rick-shaw operator David Kok says that it istoo dangerous an occupation for him toget married. In Dhaka, in a crowded “rick-shaw dormitory,” all the floor space isused for sleeping; everything else in theoperators’ lives must go on outside.Breaking into a rare editorial commentabout the operators, Wheeler says ofCalcutta, “[I]f there is a job anywhere onearth which reeks of exploitation andindignity it must be pulling a Calcutta rick-shaw.”
On the other hand, tourists and thenight life provide a large part of theincome for the 300 trishaws in Singapore,and it seems that pay there is better. As inNorth America and Europe, some of theSingapore operators are university stu-dents, financing their studies. The ridersin Macau cater exclusively to tourists, tak-ing $20 an hour for a tour; they are lessthan aggressive about drumming up busi-
ness, however, so it ishard to know howmany of these $20hours they actuallywork each week.Beijing trishaw opera-tors apparently getgood pay, and gener-ally view their jobs asbetter than workingin a factory.
In the end , itseems difficult tomake generalizationsabout the level ofexploitation of pedi-cab operators. The lot
of those who make their living by ped-alling may be more closely tied to the gen-eral condition of workers in a givensociety than it is to the trade itself. Itseems that even where socialism hasarrived on its bicycle, there is room forsome people to make their living by ped-alling others around.
I would have liked to know more aboutthe function of the pedicabs in the citiesportrayed. My passengers in Oslo aremostly people who hop aboard on a whim,treating the pedicab as an amusement-park ride appearing in the middle of thecity, or, occasionally, those who pre-orderthe pedicab for ceremonies like weddings.But what is the niche that pedicabs fill inthe twelve cities Wheeler and l’Anson por-tray? It is clear that the tourist trade domi-nates the business in Hong Kong andMacau, and that the pedicab is a schoolbus in Agra and Penang, but a lot moreinformation about the pedicabs as practi-cal transformation would be interesting.What other sorts of transportation arepedicabs’ chief competition, and how dothey compare in price, comfort, andspeed? Where pedicabs are used as practi-cal transportation, why do the passengerschoose to pay to ride instead of using theirown bicycles?
Whatever the details of the passengerprofile, it is clear that there is quite ademand for exactly the services that rick-shaws provide. This is brought to life bothby all the photos—I especially like theones of broad streets caught in rickshawgridlock—and the interesting history ofthe rickshaw at the end of the book. Themany stories of regulations hostile to pedi-cabs show that they often have to be
motor required. The recording procedurewas done six times and results were aver-aged and are provided in the chart below.All components were new at the start ofthe test: after break-in some of these wattfigures may decline. However a couple ofour highest readings were taken in the lasttest series.
ChainwheelsA B C
1 20.0 21.0 23.02 18.8 19.9 20.33 17.7 18.6 19.74 16.5 17.0 18.55 16.7 16.2 17.36 17.4 16.3 16.57 19.3 17.3 16.68 22.6 18.9 17.7“We feel that this simple test shows that
people who use 8-speed drive cogs arepaying a severe penalty for the addedgears that they get. Taking the lowest wattreading (16.2) and dividing it into the high-est (23.0) you will find that the drive-trainfriction is taking a considerable amount ofadded energy (23.0/16.2� 1.42). In our test,using the outermost chainwheel andinnermost cog costs the rider over 40% inadded drive-train friction. It really doespay to keep that drive chain asaligned aspossible.”
“The illustration shows that cog 1 andchainwheel “A” are closest to the bicyclecenterline. Presumably the best alignmentis between the middle chainwheel anddrive-cog number 5.
“Some of my questions about this testare: how consistent is friction from ascrew-adjusted felt pad? –how scatteredare the data from all six tests?”
—Andy MacGee
I asked Jim Papadopoulos to commenton chain losses: “I would like to see losses‘resolved’ into (1) those on the drive sideof the chain loop; (2) those on the non-drive side of the chain loop (mostly forderailleur losses); and (3) the hub losses(mostly for internal gearing).
“I wish there were a facility with aproven, calibrated efficiency tester so thatwe could be certain of the accuracy of thelosses and efficiencies reported above!”
—Jim Papadopoulos
–Dave Wilson <[email protected]>
REVIEWSPedalling for a livingChasing Rickshawsby Tony Wheeler and Richard l’AnsonLonely Planet Publications, Hawthorn,Australia. 1998. 191 pp. ISBN 0 86442 640 2Accompanying photos are from the book,
by permission of Lonely Planet.
I was unprepared for the reaction of thevisiting foreign colleague whom I oncesurprised with a pedicab tour of Oslo. Shewas captivated by the unconventional tourof the city, but also commented that shehad resolved never to take human-pow-ered transportation again after a visit toNepal. There she had felt like a GreatWhite Exploiter, sitting passively whilebeing pedalled around by poor, thinAsians. In my delight at how environmen-tally friendly my new hobby was in Oslo,my thoughts had passed lightly over thestatus of full-time colleagues in Asia.
Are pedicabs a form of exploitation, orare they an ideal form of transporta-tion—a decent job for those who earntheir living transporting others, and alow-pollution, low-noise means ofmoving people and goods through thecity? Are they an environmental boon, ora health hazard for the operators? Manyof my fellow pedicab chauffeurs inEurope and North America would joinme in characterizing a well-run pedicabbusiness as good, honorable work thatalso is good for the environment. Whatabout in Asia, where pedicabs are morefirmly established and much more oftenprovide serious transportation? A defini-tive answer is not to be found in thepainstakingly researched and beautifullyphotographed Chasing Rickshaws, butbetween its two large covers is a wonder-fully detailed and vibrant visual record ofpedicab transportation in twelve Asiancities, and here there are many clues.Variations on four rickshaw designs
While it’s not clear how author TonyWheeler and photographer Richardl’Anson selected the places visited, thetwelve cities represent quite a range ofpedicab design and use. The delta trike,with passengers behind the driver, isused in Agra (India), Beijing, Dhaka(Bangladesh), and Macau (a Portugueseprovince over which China will takecontrol in 1999). The reverse design, withpassengers between two wheels in front
of the driver, is found in Hanoi, Penang(Malaysia), and Yogyakarta (Indonesia).
Ordinary bicycles furnished with side-cars fill the pedicab niche in Manila,Rangoon, and Singapore. The originaljinrickshaw, basically a horse cart with ahuman runner replacing the horse, is alsostill used, both in Hong Kong andCalcutta.
Within these four major pedicab types,each city has its own distinctive model,which usually has remained unchangedfor decades. Schematic drawings of eachvehicle in profile and top view convey themost important lines of the design, whileaccompanying tables give informationabout size and weight, in both BritishImperial and French (metric) units, plusan estimate of the number of such pedi-cabs in the city.
All the pedicabs portrayed are “ratherhorrible examples of design,” saysWheeler, with excessive weight onecommon fault. Most range from 90 to 125kg. While Hong Kong’s pull rickshaws arethe lightest vehicle documented (60 kg),their 500-mm-wide seats seem toonarrow for anything more than one adult.The Sai Kaas (a corruption of “side cars”)of Rangoon are the lightest pedalledpedicab (73 kg with the bike), but withone passenger seat facing forward andone facing backward, they weigh signifi-cantly less per passenger than their HongKong cousins.
While heavy, these machines are gener-ally very solidly constructed. This robust-ness, together with the ingenuity of therickshaw mechanics, means that an indi-vidual pedicab can last many decades.While this longevity sounds like an envi-
"Beijing's tricycles are less than elegant, especially with their raggedwinter hoods. The Qianmen Gate at the southern end of TiananmenSquare is in the background."
“With more than a third of a million rickshaws filling the streets of Dhaka,traffic jams like this one in Old Dhaka are commonplace.”
Nino Quilon’s full stereo sidecar in Manila alsohas a built-in light show. The equipment weighsas much as a passenger and makes the vehiclemore costly to rent, but the wired sidecarsattract more business.
22 Number 48, summer 1999 Human Power Human Power Number 48, summer 1999 23

forced out of business before they disap-pear, and sometimes are resilient enoughthat the pedicabs outlive the regulationsagainst them. (Although the history unfor-tunately ignores all use of pedicabs inEurope and the Americas, there, too, aremany stories of motorized taxis and otherinterests colluding to keep the streets freeof pedicabs.)
Wheeler and l’Anson set out partly “torecord a fascinating means of transportand human activity before it disappeared,”and also to create a book which “cele-brates rickshaws.” They do a lovely job ofboth recording and celebrating, but it’s notat all clear that rickshaws are on the wayto disappearing. Pedicabs can pop up inlarge numbers many places, both wheredemanded by economic necessity, as inwartime Poland and post-Soviet Cuba, andfor other reasons, as in Berlin, Denver andmany other wealthy cities. Many of thereaders of this book could find themselveschasing rickshaws closer to home thanthey thought possible.
ENDNOTES[1] Quoted in Illich, Ivan, Energy and
equity, London: Calder & Boyars, 1974.____________________________________Carl Etnier is a research ecologist at the
Agricultural University of Norway, and,
as a hobby, a part-time pedicabber in
Oslo. E-mail: [email protected]
LETTER
SUSPENSION SPECIFICATIONSDiscussion of wimpy recumbent sus-
pension led me to a few observations anda couple of questions about recumbentsuspension. Of course, I expect most peo-ple to disagree with at least one thing thatI’ve written, so feel free to comment andcorrect me. No flames, please—I’m a sen-sitive new age kinda guy, and my feelingshurt easily.Observation #1 – Front suspension is a“must have” feature on a SWB. This isbecause there’s a lot more weight on thefront wheel than on a LWB or even aCLWB, and the small-diameter frontwheel is more susceptible to road-surface irregularities (nice term forpotholes, eh?). Because you steer withthe front wheel (we’ll leave rear-wheel-steered vehicles out of this for now), anyjolts to the front wheel do more than justaffect your comfort—they also affectyour stability. At 50 mph (22 m/s), I wantthe front wheel to be able to hit a bumpand keep on going in the same directionas before. With a rigid fork, a good joltcan knock the wheel sideways.Observation #2 – Rear suspension isn’t abig deal. I used to think rear suspension(in addition to front suspension) was a“must have” feature on the “ultimate”recumbent (I’m still waiting for someoneto build the ultimate recumbent, but that’sa whole other thread). What got me think-ing this way was my switch from a no-sus-pension to a full-suspension MTB. Foroff-road riding (and riding on really poor-ly-maintained paved roads), I would stillconsider full suspension a “must have”feature, but for recumbent riding on “typi-cal” paved roads, I would now downgraderear suspension to a “nice if it’s doneright” category. The reason for the down-grade is that rear suspension typicallyadds weight, complexity, maintenancerequirements and cost, and when it’s poor-ly designed it robs power, creates annoy-ing bio-pacing, and generally ceases to bea net benefit. On a recumbent, a decentamount of rear “suspension” can beachieved with a well-designed seat and fattires. For most conditions and most riders,this is probably sufficient, particularlygiven the overall high level of comfort ona recumbent. Don’t get me wrong, though
—I’d love to have rear suspension on my’bent, but only if it worked well, didn’t addmuch weight, and wasn’t a maintenanceheadache. Which leads me to…Observation #3 – Simple is good. Oneexample of where this would apply isrear suspension. Rather than construct aMTB-style rear suspension unit with oneor more pivots and a shock, which wouldbe heavy, costly to manufacture, mightcreate unwanted bio-pacing and othereffects, and would require regular main-tenance, an alternative would be passiverear suspension. This could be achievedwith cantilevered chainstays, forexample, or a compliant material such astitanium. This type of simple solution iswell-suited to recumbents (as opposed tooff-road MTBs), as the need for suspen-sion is less, given that the surfaces overwhich a recumbent typically travels arereasonably smooth, and other features ofthe recumbent already provide someform of suspension. Why build MTB-stylerear suspension for a non-MTB, whensomething much simpler will do? Observation #4 – More suspension travelisn’t necessarily better. Sure, there arerecumbent applications where a lot oftravel is desirable, but in many casesmore travel doesn’t equate with bettersuspension. Travel is marketing hype inthe MTB world, especially for down-hillers. For road riding, all you need isenough travel to soak up vibrations andsmall bumps. Unless you’re ridingthrough big potholes on a regular basis,you won’t be using the extra travel 99.9%of the time. Why carry around the extraweight? The Ballistic fork on my SWBrecumbent has only 25 mm of travel, andI have never felt the need for more, evenwhen I’ve hit large potholes at speed.Sure, I feel the bump (!), but the suspen-sion I have is enough to take the edge offand allow me to maintain control. Asproof of this observation, considerupright bikes (just for a moment). TheRock Shox Ruby fork for road bikes hasonly 30 mm of travel, whereas mostcross-country MTB forks have about 90to 100 mm of travel. As an aside, mostpeople for whom I’ve helped adjust theirMTB suspension weren’t using anywherenear all of their travel.Question #1 – Why is anti-dive a desirablefeature? I’ve never felt that dive was a
DIFFERENT STROKES?by Dave Larrington
Dear reader: When the Mad Professor (a.k.a. David
Gordon Wilson) asked me to contribute aguest editorial for this publication, notonly did I have a horrible feeling that hehad become so mad that he now hadother madmen living in his beard, but Ialso worried that I would be unable tocontribute anything worthwhile. Hewants me to write something about non-circular drives? What do I know?Anyway, after enough head-scratching tomake those sitting nearby worry that Ihad become infested with some sort ofespecially repellent parasite, I haveproduced the following. While it’s notvery technical, I hope it will be of someinterest. Errors of fact are all mine.
Throughout the history of cycling, therehave been many alternatives to the regularcircular pedal motion. In spite of claimingmany advantages, notably “increasing thelength of the power stroke”, few havebeen successful. John Kingsbury, my pre-decessor as editor of the British HumanPower Club Newsletter, opines that thehuman engine, like an internal-combus-tion engine, requires an “exhaust stroke”,and moreover that the duration of thisexhaust stroke is of the order of six timesthat of the preceding “power stroke”.Increasing the length of the power strokewill therefore not produce a gain in powerfor any significant period. (Misguided peo-ple are always trying to do this.)
Some studies, and as I’m neither anacademic nor particularly technicallyadept, I can’t cite references, have foundthe circular pedal motion to producemore power than non-circular ones, but Ibelieve I’m right in saying that few ofthem have allowed the victim, or rathersubject, sufficient time to acclimatise toa different pedal motion.
However, one case where a non-circu-lar pedal movement may be of some netgain is that of the streamlined HPV.Constraining the rider’s feet to move morehorizontally than vertically means that theheight of the front end of the vehicle canbe reduced, to the considerable benefit ofaerodynamic efficiency. One such systemwas re-invented for about the fifth time byMiles Kingsbury a few years ago, and wasdubbed the “K-drive”. This utilises an
EDITORIALS
HPVS, HEALTH AND SPINNINGby Dave Wilson
The hpv internet mail list has beendiverted recently by self-congratulationbecause medical researchers arereporting that exercise conveys benefitson more and more conditions, mentaland physical. Sage voices have inter-jected words of caution into the celebra-tion, warning that exercise is not a magicbullet, even when taken in a comfortablerecumbent position. Let me nail mycolors to the mast: I am old and very fitand convinced that my daily commute of26 km, including some steep grades, is tobe credited, at least with keeping theheart, lungs and associated pipework ingood shape.
I have also been self-satisfied that therecumbent position enabled one toimpose a load of greater than my weighton my legs. The reason I was smug aboutthis was a report in one of the medicalnewsletters that seem to multiply like rab-bits to the effect that bicycling (of the“regular” sort) does not benefit sufferersfrom osteoporosis, or fragile bones. Forthis condition to be ameliorated, we wereinformed, weight-bearing exercise mustbe practised, and bicycling did not qualify.Well, I thought haughtily, I survived a con-siderable drop onto asphalt when a ladderI was using to fix the gutter over our sec-ond-floor windows slipped. I bent the lad-
der considerably and knocked myself out,but the fact that no bones broke showedthat recumbent biking is better than regu-lar biking because we can easily push withmore than our body weight. To add to thispaean of self-approval, I considered thatthere is something virtuous in not being aspinner, because people who pedal at highRPM, 90–170, produce high power withlow pedal forces, whereas I am more inthe cart-horse category and use low RPMand high pedal forces.
I was rash enough to mention this toJim Papadopoulos, who was visitingbecause we are collaborating on thethird edition of Bicycling Science (whichwill change from being by Whitt andWilson to Wilson and Papadopoulos). Inmy opinion he is the foremost scientist-engineer working in, in fact totally dedi-cated to, the bicycle-human-power fieldtoday. He immediately put my hypothesisto the test, getting me to ride up the 20-percent grade of the hill we live on usinga regular bike in a gear that just requiredme to stand up on the pedals. When I putmy recumbent in the same gear I couldn’tget up the hill: I was not in fact putting aforce equal to my weight on the pedals.
So are recumbents no better thanregular bikes in combatting osteo-porosis? Is strong pedalling at slow RPMno better than spinning? Would expertsplease comment!
—Dave Wilson
"A pint-sized rickshaw wallah takes a well-earned rickshaw rest." (Dhaka)
problem on my MTB or my recumbent,both of which use telescoping forks.Given that simple is good, what justifiesthe additional complexity of an anti-divefork as compared with a simple telescop-ing fork (telescoping legs or telescopingsteerer/head tube)? Question #2 – What are the power losseswith rear suspension? For those whohave rear suspension on their recum-bents, I’d be interested to hear observa-tions on this issue. I know I lose about2% of my power in the drivetrain(assuming that derailleur gears are 98%efficient), and I’m sure some power getslost in frame flex and seatback compres-sion. How do power losses to rearsuspension compare with these losses?
Question #3 – Would cantilevered tita-nium stays with a 20" (406-mm) wheelprovide decent suspension and minimizepower losses? What would be the poten-tial for sideways flex (which is bad, ascompared with vertical flex which isgood) and torsional flex? My mentalpicture of the “ultimate” recumbentincludes dual 20" wheels, a titaniumframe and an Action-Tec/Headshock-style suspension fork.
—Richard Drdul
Vancouver, BC, Canada
Note: More letters appear on pages
7 and 9.
Letters (continued from previous page)
24 Number 48, summer 1999 Human Power Human Power Number 48, summer 1999 25

are up for sale. Double unfaired championDave Richards has promised a fully-fairedmachine, but so far only the chassis hasappeared. Yorkshireman Mike Weaver,whose Mikew 4 has been intermittentlyeffective (due to Mike’s inability to attendmany of the race meetings), has a newmachine on the drawing board for ’99, butthis too has yet to appear, while theMikew 4, now owned by Ian Chattington,suffered a variety of problems on its debutwhich prevented it from even completingthe race. In short, people are discoveringjust what a lengthy process building anHPV—whether “just” a fairing or a com-plete machine—can be.
Meanwhile, the Wasps roll on, withthree wins to Steve Slade and three sec-ond places to Steve Donaldson. And thereal high-performance non-circular-driveHPV is still confined to bed in HighWycombe….
Dave Larrington (fig. 6) is editor of
the British Human Power Club
Newsletter, and has been an HPV enthu-
siast since being part of the Imperial
College team which set a Round-Britain
HPV record in 1983.
—Dave Larrington
166 Higham Hill Road, London E17 6EJ,
United Kingdom e-mail:
The Plastic Maggot is perhaps worthyof a little further elaboration, as under-neath, it too is a K-drive-equipped Wasp.The brainchild of Liverpudlian architectNigel Sleigh, the machine’s fairing is anangular but effective construction of thecorrugated plastic known in the UK as“Correx” or “Corriboard” (“Coroplast” inthe USA, “Corflute” in Australia), with anose cone derived from part of a pilotlessmilitary target aircraft. Like most fully-enclosed bikes, it can be a bit of a handfulin windy conditions, but has been unoffi-cially clocked at speeds of more than 80km/h (50 mph).
Of course, uppermost in the designers’minds when the K-drive was conceivedwas to use it in a serious streamliner -something lower, smaller and faster thanthe Yellow Bean and Bean II machines inwhich Pat Kinch set numerous records afew years back. The first fruit of this trainof thought was the Beano (fig. 4), raced bySteve Slade at the 1995 World Champion-ships in Lelystad, The Netherlands. It wasquick alright, but…it turned out to be toosmall for intended pilot Pat Kinch, whileits still-born little brother the Bambeanowas found to be too small for anybody.The Beano ultimately found a new homein Switzerland, where Rosmarie Bühlerhas used it to set a women’s one-hourrecord (as yet unratified) of 55.5 km. Butfor the past two-and-a-half years,observers have been eagerly awaiting thefirst appearance of the K2….
The chassis made its public debut inApril 1997, another FWD low bike but thistime running on ISO 406 wheels, shodwith fat slick tyres. And full suspension!
Variations on the theme appeared inter-mittently during 1997 and ’98, but one hasyet, to the best of the writer’s knowledge,to be united with its fairing. The shells,exquisite carbon-Kevlar mouldings, have
been spotted, but not yet in public. Andfurther delays may yet come from the col-laboration between John Kingsbury andgNick Green (himself racing a fully-fairedK-drive-equipped machine based aroundassorted ex-Kingsbury bits and pieces) toconstruct some lighter carbon-fibreframes. So we’re still waiting.
In the meantime, we were at least hope-ful that someone might come up with abetter all-round vehicle/rider combinationthan Steve Slade and the Wasp.
gNick Green’s “Morse's Law” (fig. 5)and its successor, the “Wooden Fish OnWheels” are usefully rapid machines, butlack the engine power to be winners,while Paul Davies’ prosaically-named“Faired Bike” has a better motor, butprobably more drag. Nigel Leaper’s
machine is rathermore at home ontracks with easiercorners than thevenues used so farin the ’99 season.And Oscar istaking a year offwhile JonathanWoolrich concen-trates on the arm-powered machinebeing campaignedsuccessfully byKevin Doran.
A full hard shellwas on the cards forRoy MacDonald’smachine, but I’veheard that Roy hasdecided to stop rac-ing and that both the“95% complete” plugand the bike itself
Figure 6. Dave Larrington, author, here racing “The Pink Fairy”, a faired,standard Kingcycle. Dave is editor of the BHPC Newsletter. Photographerunknown.
Figure 4 (above). TheKingcycle Beano(left) and theKingcycle Wasp, with(left to right) Meindert Valenteyn(Netherlands recum-bent builder), SteveSlade, SteveDonaldson and MilesKingsbury. Photo:Dave Cormie
Figure 5 (left).Morse's Law withgNick Green: A much-modified K-driveTchaikowski com-bined with a cast-offKingsbury fairing.Photo: TinaLarrington
machines are FWD recumbent bicycles,with a seat height around 0.30 m (12'').They carry fibreglass nose and tail fair-ings, with a nylon fabric fairing enclosingthe remainder, but leaving a fairly substan-tial gap at the bottom, around the frontwheel. Thus the aerodynamics could fairlybe described as sub-optimal, and on areally fast course, where manoeuvrabilityis less important that straight-line perfor-mance, they have sometimes suffered atthe hands of fully-enclosed machines,such as the latest incarnation of Jonathan
Woolrich’s “Oscar” (fig. 3), Nigel Leaper’stiny “Low” and Nigel Sleigh’s “PlasticMaggot”, ridden by Ian Chattington. Not tomention the time when Andy Wilkinsonappeared with his multiple-road-record-breaking Windcheetah trike for a hilly 50-km road time trial and blew everyone intothe weeds. Much the same applies inEuropean competition, though here thereis an additional problem with which tocontend, namely gigantic Dutchmen.
arrangement of secondary cranks, sprock-ets and chains, with the net result that thefeet move in an elliptical path, with thelong axis horizontal (see fig. 1). TheKingsburys, father and son, had long beenexperimenting with non-circular drives, sotheir first move was to acquire a test sub-ject, set him up on the trainer, measure hispower output, and repeat over a pro-longed period until he felt at home withthe system. They found that once the riderhad become acclimatised, although therewas a small reduction in power output, itshould be more than offset by the gains inaerodynamic efficiency the transmissionwould make possible. Great was therejoicing in High Wycombe that day.
If I remember rightly, the K-drive trans-mission first appeared on the experimen-tal Tchaikowski front-drive recumbentbicycles. Lessons learned from this appli-cation, and the transmission system itself,were rapidly transferred to the semi-pro-duction Wasp low racers (fig. 2). Initiallythere were a few bugs in the system, mostnotably the inability of various custom-machined parts to withstand the stressesimposed on them by Steve Donaldson (K-Drive tester-in-chief), but reliability waseventually achieved and the machineshave dominated the faired class of theBritish Human Power Club’s annualChampionship race series ever since, cul-minating in 1998’s clean sweep, with SteveSlade taking the title for the fifth succes-sive year, from Roy MacDonald’s andSteve Donaldson’s similar machines. Thisin spite of the steel-framed bikes weighingin somewhere well above 20 kg.
As raced by the above-named three, the
Figure 3. Jonathan Woolrich in “Oscar” leadsgNick Green in “Morse's Law”.
Photo: Ian Chattington
Figure 2. The K-Drive being worked on by Steve Slade and MilesKingsbury.
Figure. 1. K-drive-equipped Tchaikowski. Photographer unknown.
26 Number 48, summer 1999 Human Power Human Power Number 48, summer 1999 27

International HumanPowered Vehicle
AssociationIHPVA
PO Box 1307San Luis Obispo, CA 93406 USA
http://www.ihpva.org