Embed Size (px)
Citation preview

Human Factors and Haptic Interfaces
Lynette Jones,Department of Mechanical Engineering, Massachusetts Institute of Technology.

Surface of average sized adult human: 1.8 m2
(1000 times that of retinae)
Density: 1250 kg/m3
Weight: 5 kg
Total number of axons converging on CNS: 1.1*106 Retina: 106 axons, Cochlea: 6*104 axons
Human skin

Haptics and Vision
Information Temporal capacity (bits/sec) acuity
Fingertip 102 5 ms
Ear 104 0.01 ms
Eye 106-109 25 ms
Time delays differ for hand and eye – hand is quicker than the eye

SENSORY7 classes of Mechanoreceptor (17,000 – glabrous skin)2 classes of Thermoreceptor4 classes of Nocioceptors3 classes of Proprioceptor (0-300 in different muscles)
Information Channels in Human Hand

Sensory Receptor Properties and Haptic Display Design
Resolution and sensitivity of the sensors Temporal processing characteristics
(adaptation, summation) Spatial features of processing Delays in processing information (0.4-120
m/s)

Tactile Receptor Types (7)
Cutaneous and subcutaneous Fiber ModalityMechanoreceptors group
Meissner corpuscle A, Stroking, fluttering
Merkel disk receptor A, Pressure, texture
Pacinian corpuscle A, Vibration
Ruffini ending A, Skin stretch
Hair tylotrich, hair-guard A, Stroking, fluttering
Hair-down A Light stroking
Field A , Skin stretch

Receptors Processing Vibration, Texture

Tactile Tuning Curves
0.0001
0.001
0.01
0.1
1
0.1 10 1000
Frequency (Hz)
Abs
olut
e th
resh
old
(mm
)
Merkel cell: 5-15 Hz
Meissner’s corpuscles: 20-50 Hz
Pacinian corpuscles: 60-400 Hz

Perceived intensity of vibration varies as a function of frequency as well as amplitude
If the amplitude of vibration is changed while frequency is maintained constant, at certain levels a noticeable change in rate occurs
Perception of Vibrotactile Stimuli – Frequency and Intensity Interact
Equal subjective intensity curves
-5
-4
-3
-2
-1
0
1
20 30 40 50 60 70
PSE
(db
re:
sta
ndar
d)
Comparison frequency (Hz)
Standard 25 Hz

Spatial acuity of the skin Skin movement: 0.1-0.2 mm (Gould et al.,
1979)
Spatial frequency of grating: fingertip can distinguish 40-50 µm in spatial period of 0.7-1.0 mm (Morley et al., 1983)
On smooth glass surface, dot of height 1-3 µm and diameter of 550 µm can be detected by the fingertip (Johansson & LaMotte, 1983)
Temporal variation often improves acuity and spatially extensive stimuli improve performance
(Johnson & Phillips, 1981)

Temporal acuity and touch
Successiveness - 2 stimuli (1 ms duration) must be separated by 5.5 ms to be perceived as 2 at a single locus
Temporal order – 2 successive stimuli at separate sites must be separated by 20 ms in order to determine which site first
20 ms5 ms
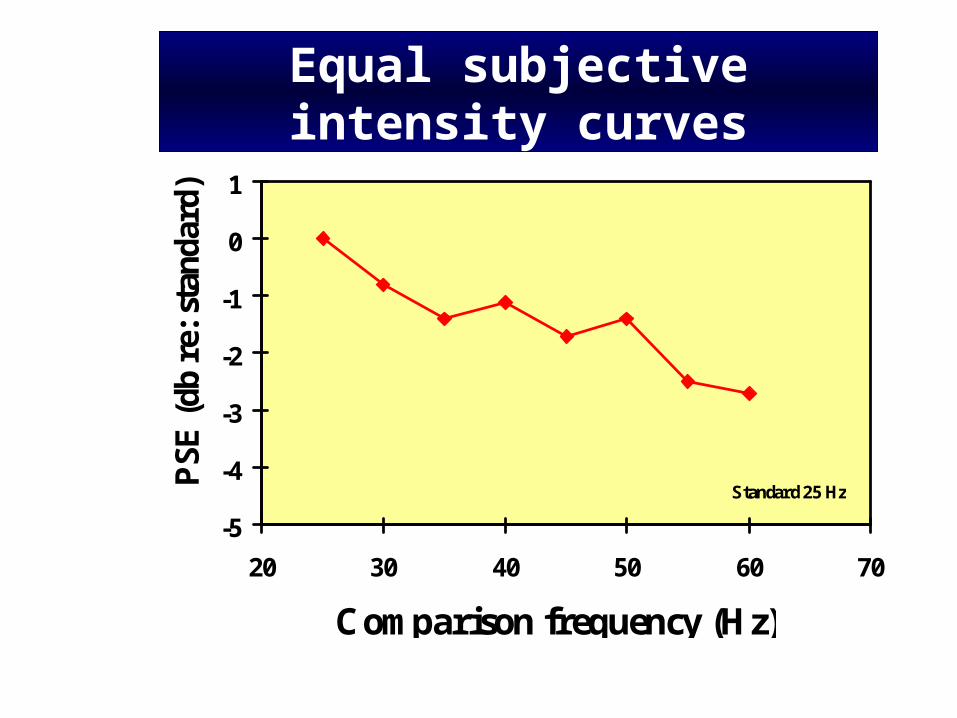
Haptic Displays
Surface texture of object Contact in the environmentMoving probe across surface - volumeCompliance/stiffness of objectMass of objectThermal properties of object

Human Perception and Haptic Display Design
Scaling (gain) of information between object and operator
Bandwidth required to present information Mechanical properties of interface Magnitude of delays that are tolerable -
symmetric, modality specific

Force-reflecting Interfaces
Scaling (gain) of force between object and operatorRing finger
Women: 10 NMen: 18 N
Middle fingerWomen: 14 N
Men: 26 N
Index fingerWomen: 19 N
Men: 35 N
Activation force <1 N
Mean force: 0.8-0.9 N
Peak force: 1.8-3.3 N

GOLGI TENDON ORGANTendon of Achilles
0-20 in mammalian musclesActivation force: 0.5 – 1.7 mN
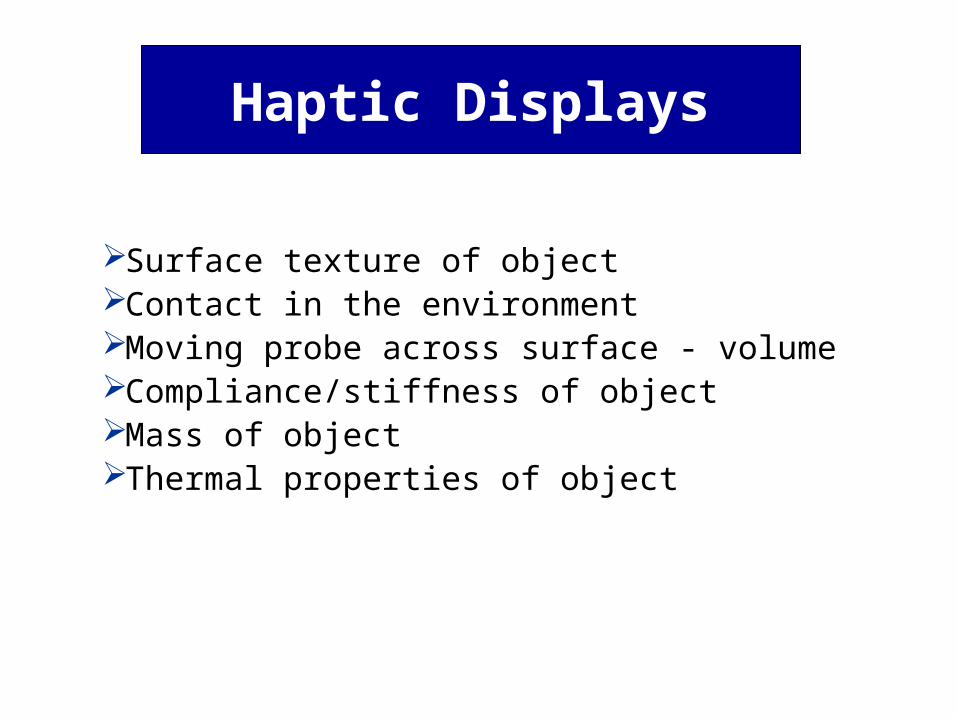
Force Discrimination
0.01
0.1
1
10
0.1 10 1000
Force (N)
Dif
fere
ntia
l thr
esho
ld (
N)
6%
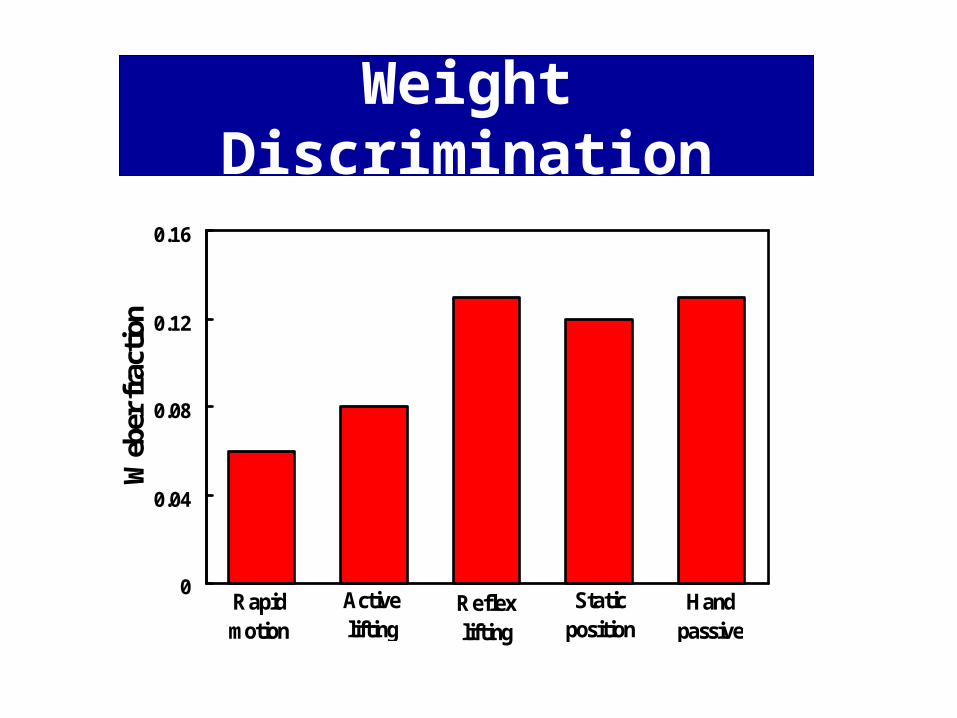
Weight Discrimination
0
0.04
0.08
0.12
0.16
Active lifting
Reflexlifting
Staticposition
Handpassive
Web
er fr
actio
n
Rapid motion

Fatigue and Perceived Force
0
20
40
60
80
100
0 50 100 150 200 250 300
Time (s)
Per
ceiv
ed fo
rce
(%M
VC
)
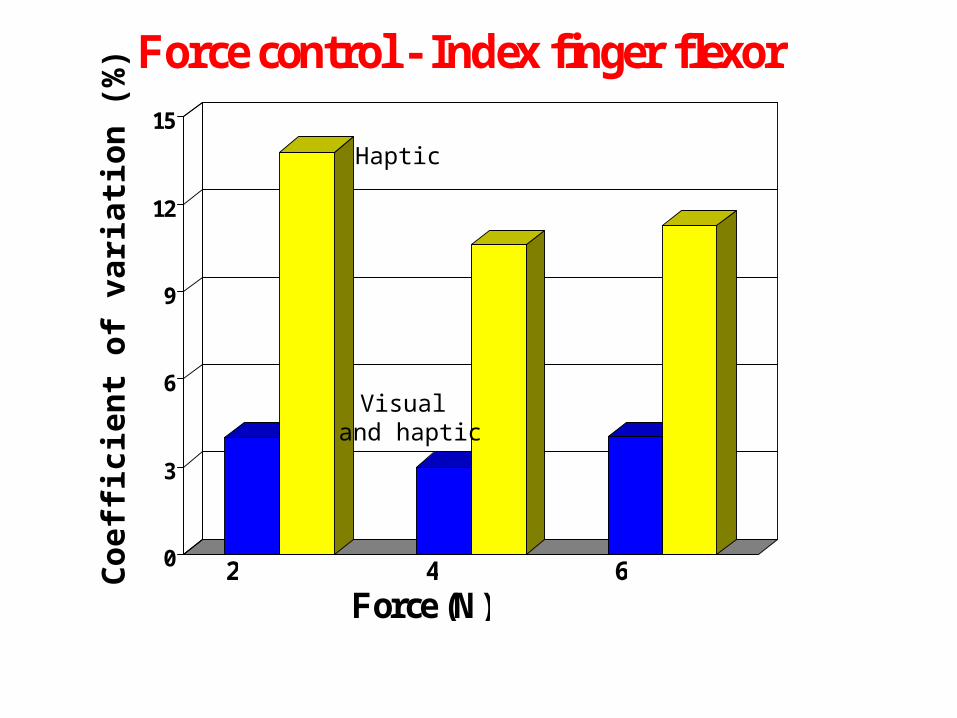
0
3
6
9
12
15
Force control - Index finger flexor
2 4 6
Force (N)
Coe
ffic
ien
t of
var
iati
on (
%)
Haptic
Visual and haptic

1
10
100
1000
1 10 100 1000
Dif
fere
nti
al t
hre
shol
d (
N.s
/m)
Reference Viscosity (N.s/m)
Viscosity Discrimination

Viscosity Discrimination
0
20
40
60
1 100 10000
Viscosity (N.s/m)
Web
er f
ract
ion
(%)
19%

Discriminability Parameters
Variable Weber fraction ResolutionAmplitude of vibrotactile 25% 0.1m stimulation (20-300 Hz)Frequency of vibrotactile11% 0.4 Hz stimulation (5-200 Hz)Pressure on skin 12% 2 gm/mm2
Force 7% 30 mN
Stiffness/compliance 17%
Viscosity 19%
Temperature (cold) 2% 0.02oC

Discriminability Parameters
Variable Weber fraction Range
Limb position 7% 5-9%
Limb movement 8% 4-19%
Force 7% 5-12%
Stiffness/compliance 17% 7-26%
Viscosity 19% 10-29%

Hand movements and physical properties
Surface texture
Size/volume
Temperature
Hardness
Weight

0
0.1
0.2
0.3
0.4
Subjects
Web
er fr
acti
on
Individual Variability

0
5
10
15
20
25
30
35
40
1 100
SD
Pos
itio
n (
mm
)
Reference Viscosity (N.s/m)
Movement Amplitudes
low
high

0
20
40
60
80
100
120
1 100
SD
Vel
ocit
y (m
m/s
)
Reference Viscosity (N.s/m)
Movement Velocities
low
high

Training for the haptically inept
FeedbackOptimal motor strategyImprove discrimination but not detection
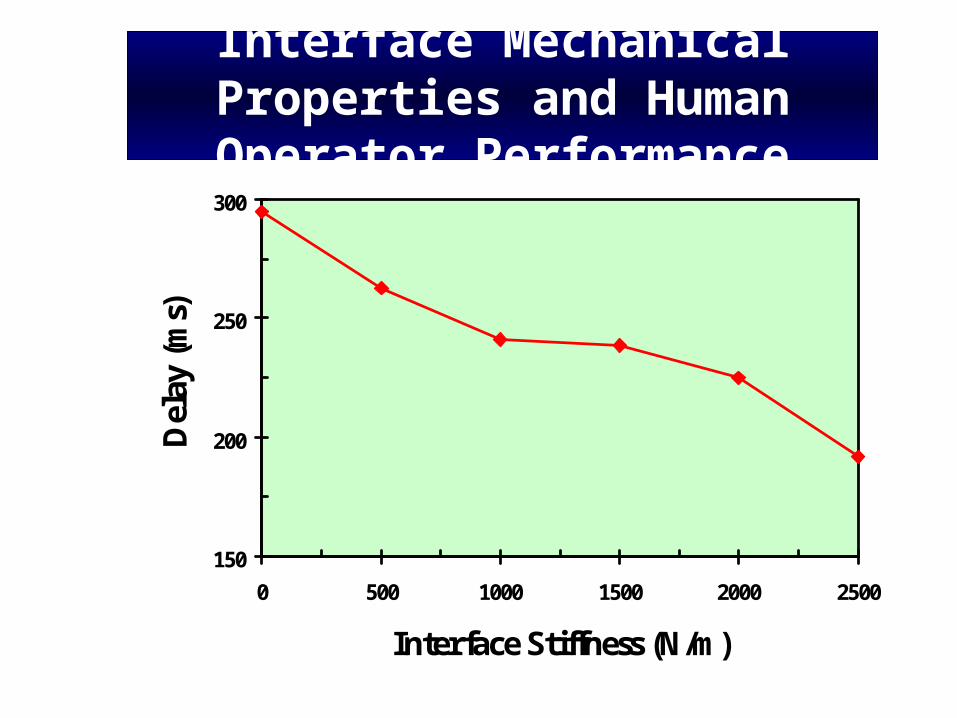
Interface Mechanical Properties and Human Operator Performance
150
200
250
300
0 500 1000 1500 2000 2500
Interface Stiffness (N/m)
Del
ay (
ms)
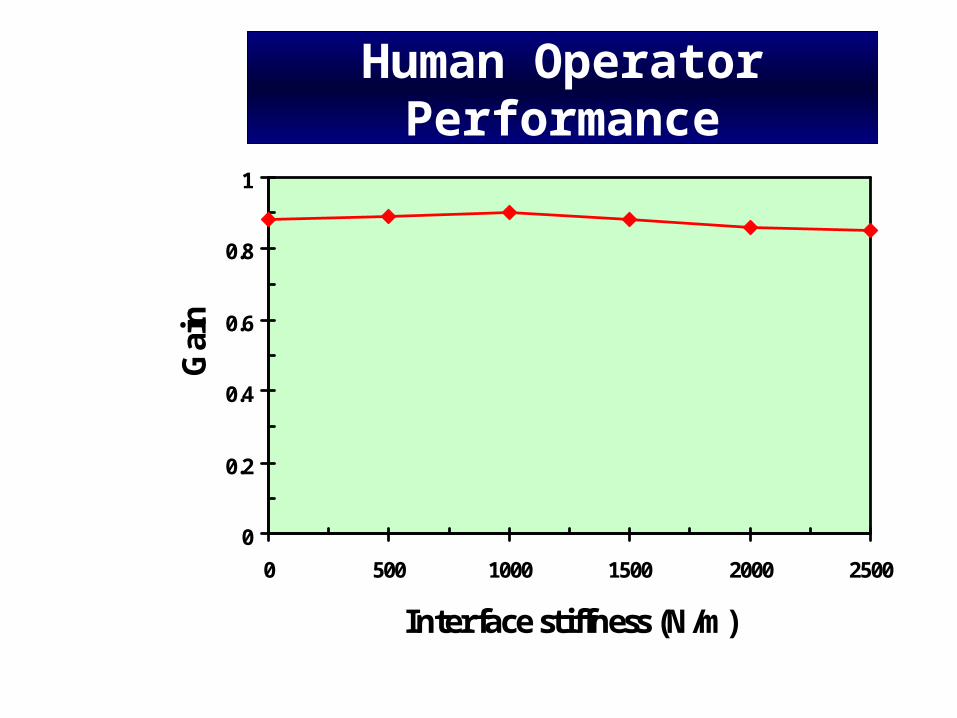
Human Operator Performance
0
0.2
0.4
0.6
0.8
1
0 500 1000 1500 2000 2500
Interface stiffness (N/m)
Gai
n

Human Operator Performance
450
500
550
600
650
700
750
10 1000
Interface Viscosity (N.s/m)
Tim
e to
0.5
pt o
n St
ep
Res
pons
e Fu
nctio
n

Human Operator Performance
0
0.2
0.4
0.6
0.8
1
10 1000
Interface Viscosity (N.s/m)
Gai
n

Thermal Interfaces and Perception
Thermoreceptor range: 13-45o C Resolution: 0.02-0.05o C (transient) Thermal discriminability: 2% Neutral thermal sensation: 31-36o C Skin temperature correlates well with
perception of cold not warmth Thermoreceptors are NOT thermometers
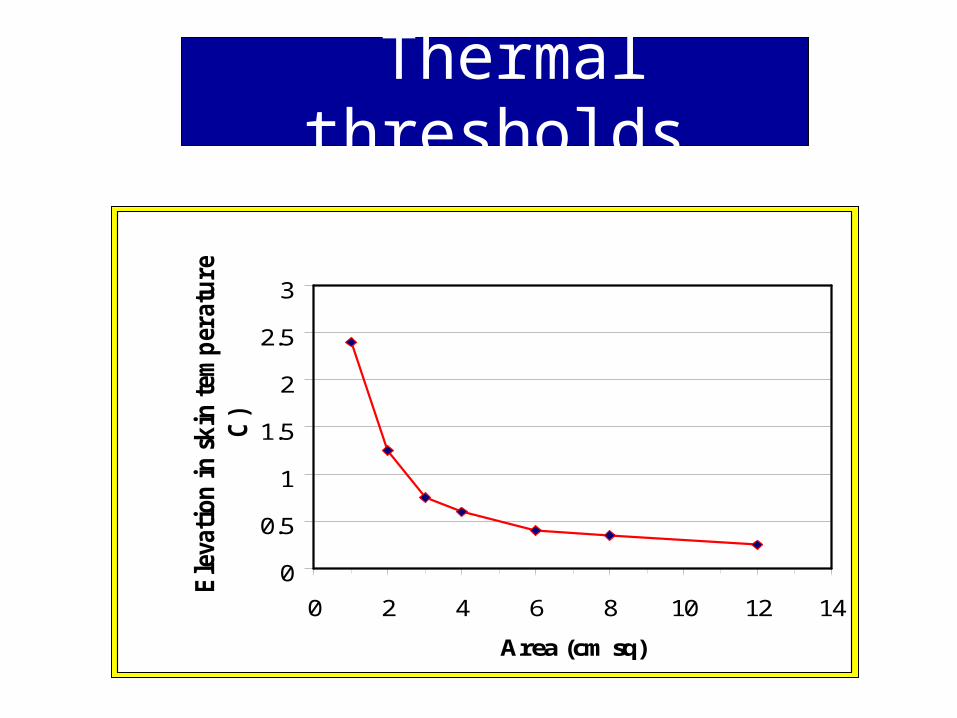
Thermal thresholds
0
0.5
1
1.5
2
2.5
3
0 2 4 6 8 10 12 14
Area (cm sq)
Ele
vati
on
in
sk
in t
emp
eratu
re (
deg
C)

Thermal Interfaces
Disadvantages Slow response Poor localization (improves with increases
in temperature – 40° C) Prodigious capacity for adaptation and
summation (intensity and areal extent traded)But could be analogous to color in visual
displays.

Illusions – can they be used to trick the haptic
system?
Size-weight illusions – visual and haptic phenomenon
Saltation effect Use auditory cues to enhance haptic
perception

Size-weight Illusion
0
5
10
15
20
0 200 400 600 800
Weight (g)
Perc
eive
d M
agni
tude
LARGE
SMALL
1.4
1.8
2.2
2.6
3
100Volume (cc)
350 gm
904 gm
Visual Haptic
(Masin & Crestoni, 1988) (Ellis & Lederman, 1993)

Saltation effect
At short and long time intervals (20-30 and > 200 ms) P1 will appear near to or coincident with P2
Warning stimulus (P1) 1 s prior to two taps on skin. Present a stimulus at one location (P2 red) and a second at another (P3 blue).
As time disparity increases above 50 ms the first stimulus travels back to its veridical locus
P1/P2 locus P3 locus
150 ms
110 ms
75 ms
< 25 ms
100 mm

Conclusions
• Spatial and temporal processing characteristics of different modalities (pressure, vibration, temperature, force) vary, but can be used to enhance stimulus presentation in a haptic display
• Cross-modal interactions provide an additional tool for representing object properties


![Multilayer Haptic Feedback for Pen-Based Tablet Interaction · 2019-02-14 · jamming interfaces [20] and Tablehop [67] provide flexible and shape-changing user interfaces with controllable](https://img.dokumen.tips/doc/110x75/5f5b1cbbe785d96702135b17/multilayer-haptic-feedback-for-pen-based-tablet-interaction-2019-02-14-jamming.jpg)


![Haptic Perception of Viscous Friction of Rotary Switches · Index Terms: H.5.2 [Information Interfaces And Presentation]: User Interfaces—Haptic I/O 1 INTRODUCTION Viscous friction](https://img.dokumen.tips/doc/110x75/60040a8607df00242211d6a9/haptic-perception-of-viscous-friction-of-rotary-switches-index-terms-h52-information.jpg)
![Frictional Widgets: Enhancing Touch Interfaces with ......Haptics, tactile feedback, touch screen. ACM Classification Keywords H5.2. [User Interfaces]: Interaction Styles, Haptic I/O](https://img.dokumen.tips/doc/110x75/5f75daffe7192372e220d9ff/frictional-widgets-enhancing-touch-interfaces-with-haptics-tactile-feedback.jpg)