Embed Size (px)
Citation preview

Scientia Iranica E (2017) 24(4), 2050{2061
Sharif University of TechnologyScientia Iranica
Transactions E: Industrial Engineeringwww.scientiairanica.com
Human errors incorporation in work-in-process groupmanufacturing system
C.W. Kang, M. Ullah and B. Sarkar�
Department of Industrial and Management Engineering, ERICA Campus, Hanyang University, Ansan, 426-791, Republic of Korea.
Received 11 June 2015; received in revised form 1 May 2016; accepted 18 June 2016
KEYWORDSHuman error Type I;Human error Type II;Group-technology;Optimal lot size.
Abstract. Decisions, about product acceptance or rejection, based on technicalmeasurement report in ultra-precise and high-tech manufacturing environment is highlychallenging as product reaches �nal stage after high value-added processes. Moreover,the role of technical personnel in decision making process for inventory models with focuson group-technology manufacturing setup has been considered relatively less. Most ofthe literature assumes that decisions are perfect and error free. However, in reality,human errors exist in making such decisions based on measurement reports. This paperincorporates human errors into the decision making process focusing on group-technologyinventory model, where high value-added machining processes are involved. Therefore,a mathematical model is developed for the optimal lot size considering human errors inthe decision making process and the imperfect production process with focus on work-in-process inventory. Lot size is optimized based on average cost minimization by incorporatinghuman error Type I and human error Type II. Numerical examples are used to illustrate andcompare the proposed model with the previously developed models for group-technologyhigh-tech manufacturing setups. The proposed model is considered more exible as itincorporates imperfection in process with human errors in decision making process.© 2017 Sharif University of Technology. All rights reserved.
1. Introduction
Work-In-Process (WIP) based inventory models forgroup-technology environment are highly recom-mended when manufacturing of production units takesa relatively longer time. Such type of conditions can beobserved particularly in the �eld of tool manufacturing,automobile industries, and aerospace products manu-facturing industries. Ullah and Kang [1] developed aninventory model for group-technology based manufac-turing environment focusing on work-in-process inven-tory. Their model answered several questions related tooptimum lot size calculation for group-technology man-ufacturing setup. Manufacturing process was assumedimperfect whereas process of inspection was considered
*. Corresponding author. Tel.: +82 1074981981;E-mail address: [email protected] (B. Sarkar)
to be a perfect one. However, in most of the high-tech ultra-precise industries, as mentioned above, therole of decision makers regarding product quali�cationor rejection based on technical measurement reportcannot be ignored. Decisions, taken by inspectors, playan important role as products reach decision stage afterhigh value-added processes. Therefore, the role of hu-man errors associated with decision process regardingproduct quali�cation or rejection cannot be overlookedwhile developing such kind of models. The purposeof this study is to incorporate human errors in thedecision making process that may a�ect optimum lotsize in group-technology environment. Others who con-tributed to this speci�c direction of group-technologybased inventory models include Boucher [2] and Bar-zoki et al. [3]. Boucher [2] introduced the conceptof group-technology work environment and computedoptimum lot size based on average cost minimization.

C.W. Kang et al./Scientia Iranica, Transactions E: Industrial Engineering 24 (2017) 2050{2061 2051
Barzoki et al. [3] extended his model by incorporatingrework operation to rectify re-workable products. Theirdeveloped model was named group-technology orderquantity model considering rework. Extensive researchhas been conducted in the �eld of inventory manage-ment in general since the introduction of economicorder quantity model in 1913 [4]. Researchers puttheir e�orts to relax assumptions as per the realisticindustry situations. One major assumption of thesemodels is that processes are perfect and produce non-defective products. However, in reality, processes devi-ate from ideal conditions. Several internal and externalfactors a�ect the process, which result in defectiveproducts. The research carried out by Rosenblattand Lee [5] remains among pioneers that introducedthe idea of re-working defective products with certaincost. Porteus [6] pointed out that the process may goout-of-control during production process, resulting indefective products. The impact of defective productswas highlighted in an Economic Order Quantity (EOQ)model. It was recommended that investment in qualityimprovement programs would decrease the probabilityof the process to go out-of-control.
Ben-Daya and Hariga [7] developed economic lotsize policy by incorporating the e�ect of imperfectquality products and process restoration. Salamehand Jaber [8] considered imperfect quality productswhile using economic order quantity models. Lotsize increased with increase in imperfect quality items.Later, Goyal and C�ardenas-Barr�on [9] used a simplealgebraic approach to calculate optimum lot size forSalameh and Jaber's model [8]. The results of thisapproach were almost similar to those obtained bySalameh and Jaber [8]. Jamal et al. [10] assumedimperfection in a single-stage manufacturing setup. Itwas considered that rework was performed either at theend of each cycle or at the end of N cycles. C�ardenas-Barr�on [11] presented some modi�cations to the modeldeveloped by Jamal et al. [10] and provided improvedlot size policy through numerical examples. Biswasand Sarker [12] came with the idea that scrap productscould be identi�ed before, during, and after the reworkprocess in a lean manufacturing system. C�ardenas-Barr�on [13] further extended the model of Jamal etal. [10] by incorporating planned backorders to thesingle-stage manufacturing setup.
Maddah et al. [14] assumed that imperfect prod-ucts had their own importance in some industries andwere not considered as a part of inventory. Two modelswere developed for optimum lot size and average costminimization by considering that imperfect items wereremoved from inventory without any cost. Whereas,in the second case, imperfect items were shipped atcost with other perfect quality products. Wee andWidyadana [15] developed economic production lotsize for deteriorating items. They assumed rework
operation for deteriorating items and stochastic pre-ventive maintenance policy using search technique.Sarkar and Moon [16] extended economic productionorder quantity model for imperfect production setupwith stochastic demand distribution. It was assumedthat life-time of defective products followed Weibulldistribution. Sarkar [17] focused on reliability aspectof the production processes with pro�t maximizationin an imperfect production setup. Control theorywas used to develop an integrated cost function withreliability as decision variable. Recently, Pal etal. [18] developed a mathematical model by incorpo-rating stochastic demand and preventive maintenanceschedule, following a known probability distribution.The model assumed that defective products were re-worked just after the regular production phase. Sarkaret al. [19] considered that imperfect items producedduring processes followed either uniform, triangular, orbeta distribution for the model developed by C�ardenas-Barr�on [13]. Analytical methods were used to obtainthe optimum lot size and backorder quantity at averagecost minimization. Lin and Hou [20] recently developedan optimal lot size where re-workable items were storedin warehouse. They developed a new policy of overlap-ping and advance receiving in order to prevail goodrelationship between retailer and supplier. Taleizadehet al. [21] used a simple approach to cycle timeand backorder quantity optimization for an imperfectproduction setup. It was assumed that production wascarried out under limited capacity of the manufacturingsystem.
Inspection has been considered as a process todecide about the product acceptance, rejection, andrework in comparison to the desired requirements.Salameh and Jaber [8] incorporated a screening processto extend the economic order quantity model. Theirapproach focused on screening at raw-material stage,i.e. before the manufacturing process. Productionprocess was subject to random defect rate and 100%screening was performed at the end of each cycle. Ben-Daya and Rahim [22] assumed that the process mightgo out-of-control during the multistage production pro-cess and inspection was needed at every stage. Impactof inspection errors on lot size and total cost functionwas calculated. Taleizadeh et al. [23] developed pro-duction order model assuming that defective productsproduced either follow-normal or a uniform distributionwith limited production by only one machine during theproduction cycle. Taleizadeh et al. [24] also developedtwo models for multiproduct single-machine scenariowith emphasis on with or without immediate reworkoperation. Khan et al. [25] extended [8] the model byincorporating inspection errors in the proposed model.Inspection was considered imperfect with errors ininspection process. Hsu [26] modi�ed few shortcomingsin the mathematical model of [25]. Khan et al. [27]

2052 C.W. Kang et al./Scientia Iranica, Transactions E: Industrial Engineering 24 (2017) 2050{2061
introduced an idea of learning in inspection process.It was assumed that as production continued fromone cycle to another one, knowledge was transferredthrough the learning process from one cycle to anotherone. Chen [28] added errors in the process of pre-ventive maintenance. It was assumed that preventivemaintenance with error resulted in increased out-of-control state during the production process. Unitpro�t was maximized by incorporating inspection in-terval, inspection frequency, and production quantity.Taheri-Tolgari et al. [29] introduced an idea of pro�tmaximization in addition to incorporation of Type Iand Type II inspection errors. Inspection station wasadded at the end of processes in order to check thequality issues in reworked products. They assumedthat the inspection of the last stage was error-free.All calculations were based on the present value ofmoney. Recently, Mohammadi et al. [30] developedan integrated model by considering optimal productionruntime with inspection schedule. Inspection wasassumed to have errors. However, they assumed thatinspection consumed a negligible time. Chang etal. [31], Sarkar and Saren [32], and Zhou et al. [33]are some, just to name few, who contributed to thesame direction in the recent past.
The aforementioned models mainly focused oneither economic order quantity or production orderquantity model. Inspection errors were incorporatedto make these models as realistic as possible in orderto address industry problems. Most of these developedmodels helped organizations to calculate optimum lotsize based on average cost minimization. However,these inventory models did not focus on the humanaspect, whose role is highly signi�cant in makingdecision about the product quali�cation or rejectionwhile considering WIP based inventory models. Man-ufacturing or inspection process may be imperfect dueto di�erent internal or external factors. This imperfect-ness a�ects optimum lot size calculation as observed inthe literature. However, the soft side of these decisionmaking processes (human errors) has been less concen-trated in the literature. Decisions taken by operators(humans) are a�ected by di�erent factors, includingskill level, job experience, training, job complexity,workload, mental and physical conditions, �nancialstatus, and relationship with management. Therefore,probability of making errors during decision processexists. Consequently, the objective of this article is,as research gap exists, to incorporate human errors indecision making process for the group-technology basedmanufacturing organizations. A simple optimizationapproach has been used to calculate optimum lot sizeat average cost minimization. The rest of the paper isorganized as follows:
The next section provides mathematical modelingincluding notation, assumptions, and problem formula-
tion. Numerical examples and results are discussed inSection 3. Conclusions, managerial insight, and futuredirections are presented in the last section.
2. Mathematical model
The mathematical model consists of notation, assump-tions, and problem formulation and modeling.
2.1. NotationThe following notation and assumptions are used inthis mathematical model as used.
ParametersD Customer demand in a cycle time
(units/unit time)CM Raw material cost per unit product
($/unit)Cp Purchase cost per unit of cycle time
($/unit of time)Cs Setup cost per unit of cycle time
($/unit of time)Cmi Measurement cost per unit of cycle
time ($/unit of time)CWIP Work-in-process holding cost per unit
of cycle time ($/unit of time)Ch Inventory holding cost per unit of time
($/unit of time)Ctotal Total cost per unit of cycle time
($/unit of time)s Setup time for each lot (unit
time/setup)m1 Machining time for each product in
regular production phase (time/unitproduct)
mr Machining time for each re-workableproduct (time/unit re-workableproduct)
P10 Poor quality products produced inregular production phase (%)
P11 Perfect quality products produced inregular production phase (%)
P21 Perfect quality products produced inrework phase (%)
P20 Poor quality products produced inrework phase (%)
P1r Re-workable products produced incycle time (%)
Pb Poor quality products in each cycle(%)
Pg Perfect quality products produced ineach cycle (%)

C.W. Kang et al./Scientia Iranica, Transactions E: Industrial Engineering 24 (2017) 2050{2061 2053
Tc Cycle timeTp Processing time�T Average manufacturing time for each
product item�I Average inventory at the end of each
cycle (units)�W Average monetary value of the WIP
inventory ($)i Inventory holding cost per unit of time
($/unit of time)c Average unit value of each product
cost (unit of money) ($/unit product)R Rate charged per unit of cell production
time including all overheads, movingcost, loading/unloading cost, etc.($/unit of time)
� Human error Type I (%)� Human error Type II (%)
Decision variableQ� Lot size per unit cycle time (units/unit
cycle time)
2.2. AssumptionsThe following assumptions have been used:
1. Manufactured production units are processedthrough quality control section to measure fea-tures/characteristics developed during machiningprocess;
2. Measurement is taken as a time consuming process;
3. Probability of committing human errors in decisionmaking process is approximated and considered tobe known;
4. Rework operation may produce poor quality prod-ucts;
5. Parameters including setup times, carrying charge,and machining time are �xed and known;
6. Demand is known and continuous;
7. Shortage is not allowed.
2.3. Problem formulation and modelingThe working mechanism of a group-technology man-ufacturing setup is shown in Figure 1. In a group-technology manufacturing environment, lot size, Q,is arrived at the manufacturing cell and is processedthrough the manufacturing stations for similar kind offeatures. Manufactured production units then proceedtowards measurement section of quality control tomeasure the features developed in products as perdesired requirements. Technical measurement reportsare generated (e.g., the report generated by usingcoordinate measurement machine, autocollimator, andpro�le projector) and processed for onward decision byinspectors at the decision support desk. It has beenpreviously assumed that decisions taken based on thereport are error free. However, in reality, human errorsexist, which may a�ect lot size. Therefore, this modelincorporates human errors in the developed work-in-process based inventory models.
Lot size, Q, arrives at the processing station ineach cycle and stays for its onward process on themachine. Due to imperfection in machining process,QP10 percentage of products is rejected in the initialphase and QP1r is the number of units that areforwarded for rework operation. Q(1 � (P10 + P1r))is the number of production units considered to bequali�ed.
Re-workable products are processed again andQP20 units are considered defective in the secondphase of the same lot production, whereas QP21 unitsare considered to be of good quality in the secondphase. The paper assumes that no further re-workableproducts are produced in this lot manufacturing.
Measurement reports generated by the measure-
Figure 1. Working mechanism of group-technology manufacturing setup with decision making process.

2054 C.W. Kang et al./Scientia Iranica, Transactions E: Industrial Engineering 24 (2017) 2050{2061
Figure 2. Human errors impact on the lot received in the group-technology manufactured cell.
ment station are forwarded to the decision supportdesk. As mentioned earlier, human decision makingprocess is a�ected by a number of factors. Therefore,chances of errors exist in the decision process. Theseassociated errors are named human errors. The mostcommon type of errors that may be committed duringthis process is classi�ed under:
1. Human error Type I;2. Human error Type II.
The impact of these human errors upon the manu-factured lot in the above-mentioned model has beenhighlighted in Figure 2.
During manufacturing of lot size Q, QPg = Q(1�Pb) is the proportion of production units that remainquali�ed. Due to human error Type I, Q(1�Pb)(�) willbe the number of units that are considered defectivealthough they are non-defective. The remaining Q(1�Pb)(1� �) are considered to be non-defective units.
Similarly, QPb is the proportion of products thatare rejected during the manufacturing process. How-ever, due to human error Type II, (QPb)(�), productionunits are considered non-defective although they aredefective originally. On the other hand, (QPb)(1 ��) is the proportion of lot size that is consideredto be defective products among the total defectiveproduction units.
It may be noted that customer returns thoseproduction units that have been wrongly consideredas non-defective due to human error Type II. It is theresponsibility of the manufacturing company to replaceall such production units.
Therefore, in order to meet customer actual de-mand (D) in a production cycle, we have:
Q�Q(1�Pb)(�)�(QPb)(1��)�DTc+(QPb)(�);
Q�Q(1�Pb)(�)�(QPb)(1��)=DTc+(QPb)(�);
Q�Q(1�Pb)(�)�(QPb)(1��)�(QPb)(�)=DTc:
After simpli�cation:
Tc =Q(1� �)(1� Pb)
D: (1)
The total processing time (Tp) of lot size, Q, is the sum-mation of setup time for each lot size, manufacturingtime per unit item, measurement time per unit item(I), rework time, and re-measurement time for eachunit. It is given by the following relation:
Tp = s+Qm1 + IQ+QmrP1r + IQP1r: (2)
Average operation time can be obtained as follows:
�T =TpQ:
Machining timesm1 andmr are assumed to be di�erentas machining time of regular production might bedi�erent as compared to re-workable production units.
It is known that, in a group-technology environ-ment, value is added to each product as it movesfrom raw material state towards the �nal product.Therefore, average value added to each product duringits manufacturing cycle is given by:
c=CM+R�s+Qm1+IQ+QmrP1r+IQP1r
Q
�: (3)
2.3.1. Purchasing costAverage cost associated with the raw material pur-chased for an imperfect manufacturing setup per unitcycle time is given by:
Cp = CMQ=Tc;
Cp =CMD
(1� Pb)(1� �): (4)
2.3.2. Setup costSetup cost occurs once for lot size, Q, during each cycleand is assumed as Cs:
Cs =ATc;
Cs =AD
Q(1� Pb)(1� �); (5)
where A is the setup cost. It is a product of setup timeper cycle (s) and the rate charged by the productioncycle (R).

C.W. Kang et al./Scientia Iranica, Transactions E: Industrial Engineering 24 (2017) 2050{2061 2055
2.3.3. Measurement costMeasurement cost is of two types. In Phase 1,every production unit in lot is measured (100%) uponmanufacturing. In Phase 2, re-workable products aremeasured. The measurement cost, Cmi, per unit ofcycle time is given by:
Cmi =IQTc
+IQP1r
Tc;
Cmi =ID
(1� Pb)(1� �)+
IDP1r
(1� Pb)(1� �);
Cmi =�
ID(1� Pb)(1� �)
�(1 + P1r): (6)
2.3.4. Inventory holding costThe inventory holding cost per unit time is de�ned bythe following equation [34]:
Ch = ic�I; (7)
where �I is the average inventory over each cycle by thecycle period, having unit monetary value of c for eachitem and i as the carrying charge.
The average holding inventory is equal to the sumof �nished production units that are declared to begood quality products by decision support desk andthose defective products that are declared to be non-defective products due to human error:
�I =12 (Q(1� Pb)(1� �) + (QPb)(�))Tc
Tc;
�I =12
(Q(1� Pb)(1� �) + (QPb)(�)): (8)
Given Eqs. (3) and (8), the inventory holding cost perunit of time will be:
Ch=12i
�CM+R
�s+Qm1+IQ+QmrP1r+IQP1r
Q
��(Q(1� Pb)(1� �) + (QPb)(�))
!: (9)
2.3.5. Work-in-process holding costSilver et al. [34] highlighted that the work-in-processinventory holding cost could be calculated by:
CWIP = i �W; (10)
where i is the carrying charge per unit of time.
�W = average work-in-process inventory.
�W can be computed by summation of the followingtypes of inventories in the workshop:
(a) Raw material (subassembly) units waiting for pro-cessing on machines;
(b) Production units that are rejected due to imper-fection of the production system;
(c) Production units rejected due to human erroralthough they were non-defective (human errorType I);
(d) Accepted production units carried in a unit cycle;(e) Production units considered to be quali�ed due to
human error Type II.Therefore, the average value of the total work-in-process inventory will be equal to:
�W =� 1
2QTpTc
�CM +
� 12Q(Pb)(1� �)Tp
Tc
�c
+� 1
2Q(1� Pb)(�)TpTc
�c
+� 1
2Q(1� Pb)(1� �)TpTc
�c+
� 12Q(Pb)�Tp
Tc
�c;
�W =12QTpTc
(CM + (Pb)(1� �)c+ (1� Pb)(�)c
+ (1� Pb)(1� �)c+ (Pb)(�)c);
�W =12
�D
(1� Pb)(1� �)
�(s+Qm1 +QI
+QP1rmr +QP1rI)(CM + c):
Given Eq. (3), we have the average work-in-processinventory equal to:
�W =12
�D
(1� Pb)(1� �)
�(s+Qm1 +QP1rmr +QI +QIP1r)�
2CM+RsQ
+Rm1+RmrP1r+IR+IRP1r
�:(11)
Therefore, given Eqs. (10) and (11), the average car-rying charge of the work-in-process inventory will beequal to:
Cwip =12
�Di
(1� Pb)(1� �)
��2CM+
RsQ
+Rm1
+RmrP1r+IR+IRP1r
�(s+Qm1
+QP1rmr +QI +QIP1r): (12)
2.3.6. Total cost per unit of time and optimum lot sizeAverage total cost function is the sum of all relatedcost functions given by the following equations:
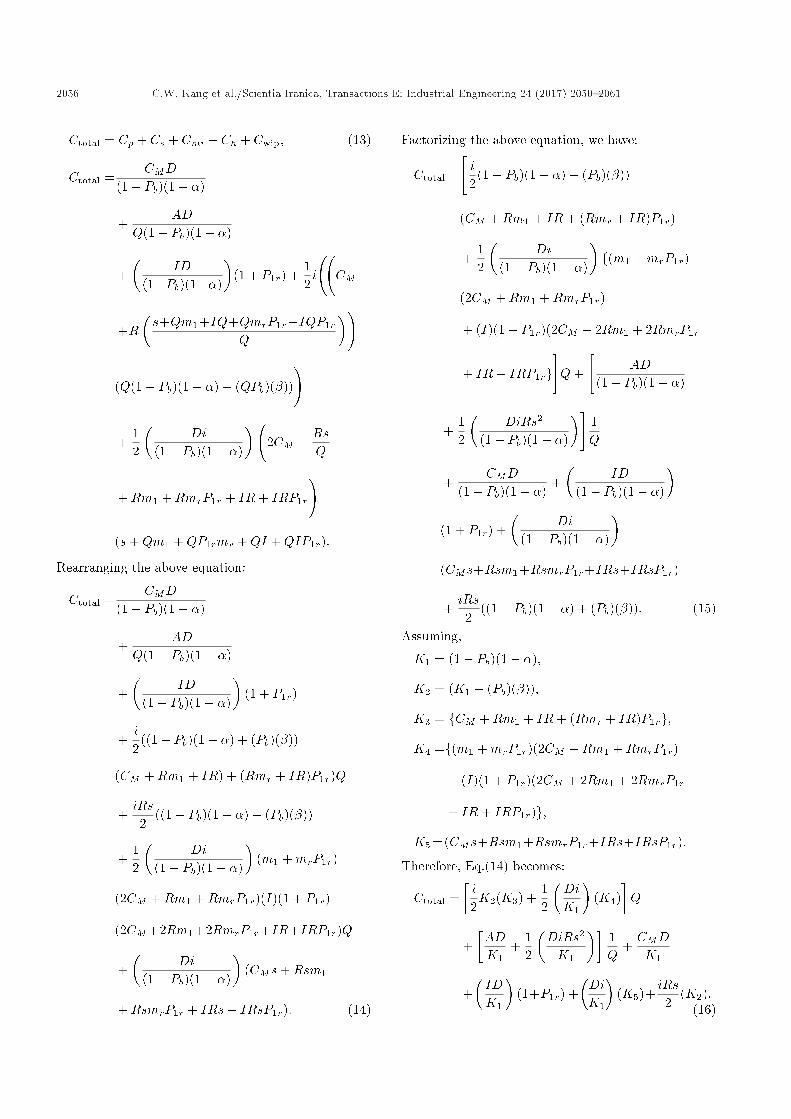
2056 C.W. Kang et al./Scientia Iranica, Transactions E: Industrial Engineering 24 (2017) 2050{2061
Ctotal = Cp + Cs + Cmi + Ch + Cwip; (13)
Ctotal =CMD
(1� Pb)(1� �)
+AD
Q(1� Pb)(1� �)
+�
ID(1�Pb)(1��)
�(1 + P1r) +
12i
CM
+R�s+Qm1+IQ+QmrP1r+IQP1r
Q
�!(Q(1� Pb)(1� �) + (QPb)(�))
!+
12
�Di
(1� Pb)(1� �)
� 2CM +
RsQ
+Rm1 +RmrP1r + IR+ IRP1r
!(s+Qm1 +QP1rmr +QI +QIP1r):
Rearranging the above equation:
Ctotal =CMD
(1� Pb)(1� �)
+AD
Q(1� Pb)(1� �)
+�
ID(1� Pb)(1� �)
�(1 + P1r)
+i2
((1� Pb)(1� �) + (Pb)(�))
(CM +Rm1 + IR) + (Rmr + IR)P1r)Q
+iRs2
((1� Pb)(1� �) + (Pb)(�))
+12
�Di
(1� Pb)(1� �)
�(m1 +mrP1r)
(2CM +Rm1 +RmrP1r)(I)(1 + P1r)
(2CM+2Rm1+2RmrP1r+IR+IRP1r)Q
+�
Di(1� Pb)(1� �)
�(CMs+Rsm1
+RsmrP1r + IRs+ IRsP1r): (14)
Factorizing the above equation, we have:
Ctotal =
"i2
(1� Pb)(1� �) + (Pb)(�))
(CM +Rm1 + IR+ (Rmr + IR)P1r)
+12
�Di
(1� Pb)(1� �)
�f(m1 +mrP1r)
(2CM +Rm1 +RmrP1r)
+ (I)(1 + P1r)(2CM + 2Rm1 + 2RmrP1r
+ IR+ IRP1rg#Q+
"AD
(1� Pb)(1� �)
+12
�DiRs2
(1� Pb)(1� �)
�#1Q
+CMD
(1� Pb)(1� �)+�
ID(1� Pb)(1� �)
�(1 + P1r) +
�Di
(1� Pb)(1� �)
�(CMs+Rsm1+RsmrP1r+IRs+IRsP1r)
+iRs2
((1� Pb)(1� �) + (Pb)(�)): (15)
Assuming,
K1 = (1� Pb)(1� �);
K2 = (K1 + (Pb)(�));
K3 = fCM +Rm1 + IR+ (Rmr + IR)P1rg;K4 =f(m1 +mrP1r)(2CM +Rm1 +RmrP1r)
+ (I)(1 + P1r)(2CM + 2Rm1 + 2RmrP1r
+ IR+ IRP1r)g;K5 =(CMs+Rsm1+RsmrP1r+IRs+IRsP1r):
Therefore, Eq.(14) becomes:
Ctotal =�i2K2(K3) +
12
�DiK1
�(K4)
�Q
+�ADK1
+12
�DiRs2
K1
��1Q
+CMDK1
+�IDK1
�(1+P1r) +
�DiK1
�(K5)+
iRs2
(K2):(16)

C.W. Kang et al./Scientia Iranica, Transactions E: Industrial Engineering 24 (2017) 2050{2061 2057
Eq. (16) is of the form y(x) = a1(x) + a2x + a3.
Therefore, algebraic optimization method can be usedto obtain the optimum lot size by minimization of thetotal cost function (Eq. (16)).
x =ra2
a1;
Q� =
vuuut ADK1
+ 12
�DiRs2K1
�hi2K2(K3) + 1
2
�DiK1
�(K4)
i : (17)
Eq. (17) gives the optimum lot size for WIP based in-ventory model considering human errors in the decisionmaking process. The global minimum cost function isgiven by:
Ctotal(Q�) = 2pa1a2 + a3;
Ctotal(Q�) =
2
s�i2K2(K3)+
12
�DiK1
)���
(K4)ADK1
+12
�DiRs2
K1
��+
CMDK1
+�IDK1
�(1+P1r)+
�DiK1
�(K5)+
iRs2
(K2)
!:(18)
The following few special cases can be obtained fromEq. (17).
Special case 1: The optimum lot size obtained byEq. (17) can be reduced to the lot size calculated by
Ullah and Kang [1], assuming that human errors do notexist.
Special case 2: The optimum lot size obtained byEq. (17) can be reduced to the lot size of Bouchermodel [2] if it is assumed that the manufacturingprocess produces only perfect products, inspection ormeasurement process does not take any time, and hu-man errors do not exist in the decision making process.
3. Illustration through numerical examples
Five numerical examples have been used for numer-ical computation of the proposed model. Data hasbeen obtained from US tool manufacturing companyBarzoki et al. [3]. Models are compared based ontheir optimum lot size and optimum average cost.Demand rate, setup time, manufacturing time, and rawmaterial cost are di�erent for each example. However,process imperfection and measurement time have beenassumed �xed for all �ve examples. Manufacturingprocess imperfection level is considered to be 20% forthe rejected products, i.e. Pb = 20%, and 5% for re-workable products. Moreover, human errors in theprocess of decision making are � = 20% and � = 5%.Optimum lot size for the GTOQ [2], GTOQIR [1], andour proposed model is shown in Table 1. Optimumtotal cost for the proposed model is shown in Tables 1and 2. It can be observed that for �xed values of humanerror in the decision making processes, the optimum lotsize calculated by our proposed model is comparativelyhigher at lower values of demand rate. However, athigher demand rates, our proposed lot size is higher
Table 1. Comparison of models for di�erent values of parameters (Example 1).
D(units/year)
CM($/unit)
s(mints/setup)
m1
(mints/unit)GTOQ(units)
GTOQIR(units)
Q�
(units)Ctotal
($)77 5.63 574 100 26 31 37 633.63233 1.57 510 32 81 86 101 542.93580 1.42 518 87 87 88 96 1234.981877 1.64 574 67 135 124 130 4344.175361 1.12 691 41 255 208 213 8440.42
Table 2. Comparison of models for di�erent values of human error Type I (Example 2).
� D(units/year)
s(mints/setup)
m1
(mints/unit)GTOQ(units)
GTOQIR(units)
Q�
(units)Ctotal
($)0 14000 204.00 0.12 959 1161 1154 17866.115 14000 204.00 0.12 959 1161 1209 18788.5610 14000 204.00 0.12 959 1161 1269 19813.5715 14000 204.00 0.12 959 1161 1336 20959.2420 14000 204.00 0.12 959 1161 1409 22248.19

2058 C.W. Kang et al./Scientia Iranica, Transactions E: Industrial Engineering 24 (2017) 2050{2061
Figure 3. Lot size variation of the proposed model withincrease in human error-Type I.
than that in the GTOQIR model and lower than thatin the GTOQ model.
In Table 2, models are compared regarding theirsensitivity against relatively higher demand rates withhuman error Type I. All parameters are assumed �xedas in Example 2 [3]. Human error Type 1 variesfrom 0% to 20%, whereas human error Type II hasbeen considered �xed at 5%. Optimum lot sizes andoptimum total costs are shown in Table 2. It can beobserved that optimum lot sizes calculated by GTOQand GTOQIR remain �xed at di�erent levels of humanerror in the decision making process. Variations of lotsize in the proposed model with human error Type Ihave been shown in Figure 3. Lot size increases withincrease in human error Type I. Similarly, total costincreases with increase in human error Type I.
The impact of human error Type II for Example 2has been shown in Table 3. Human error Type II hasbeen changed from 0 to 20% at a �xed value of 10%for the human error Type I. Furthermore, percentageof rejection produced in the process is taken 20% andre-workable products are considered 5%. It can beobserved that lot size decreases with increase in humanerror Type II. However, this change in optimum lot sizein comparison to human error-Type I is relatively low.The change in optimal cost function is less signi�cantwith change in human error Type II.
The relative signi�cance of the proposed lot sizemodel under the in uence of human errors can beobserved in Table 4. It can be observed that lot sizeincreases with increase in errors during the decisionmaking process. Sensitivity to those changes in optimallot size by the most relevant models has also beenshown. This sensitivity is higher than that in theGTOQ model, which is based on the assumption ofperfect production processes without any process ofdecision making or inspection. Similarly, change inoptimal lot size in comparison to imperfect productionprocesses with perfect inspection (GTOQIR) is alsosigni�cant. The change in optimal cost function withhuman errors is highly signi�cant. Total system costsigni�cantly increases with increase in human errors
Table 3. Comparison of models for di�erent values of human error Type II.
�(%)
D(units/year)
s(mints/setup)
m1
(mints/unit)GTOQ(units)
GTOQIR(units)
Q�
(units)Ctotal
($)0 14000 204.00 0.12 959 1161 1277 19811.242 14000 204.00 0.12 959 1161 1274 19812.174 14000 204.00 0.12 959 1161 1271 19813.116 14000 204.00 0.12 959 1161 1268 19814.048 14000 204.00 0.12 959 1161 1265 19814.9710 14000 204.00 0.12 959 1161 1262 19815.9012 14000 204.00 0.12 959 1161 1259 19816.8214 14000 204.00 0.12 959 1161 1255 19817.7416 14000 204.00 0.12 959 1161 1252 19818.6618 14000 204.00 0.12 959 1161 1249 19819.5820 14000 204.00 0.12 959 1161 1246 19820.50
Table 4. Sensitivity analysis of models for di�erent values of human errors Types I and II.
�(%)
�(%)
GTOQ(units)
GTOQIR(units)
Q�
(units)Q�/GTOQ Q�/GTOQIR
Ctotal
($)0 0 959 1161 1161 1.21 1.00 17863.995 5 959 1161 1209 1.26 1.04 18788.5610 10 959 1161 1262 1.32 1.09 19815.9015 15 959 1161 1319 1.38 1.14 20964.1220 20 959 1161 1381 1.44 1.19 22255.9125 25 959 1161 1449 1.51 1.25 23719.9830 30 959 1161 1524 1.59 1.31 25393.2535 35 959 1161 1606 1.67 1.38 27324.02

C.W. Kang et al./Scientia Iranica, Transactions E: Industrial Engineering 24 (2017) 2050{2061 2059
in the decision making process. It would be muchappropriate for manufacturing engineers to considerhuman errors if technical personnel are involved in thedecision making process as the impact is signi�cant.
4. Conclusions
Optimum lot size for group-technology based man-ufacturing environment, focusing on work-in-processinventory, has been developed. It was assumed, pre-viously, that process of decision regarding acceptanceor rejection was perfect even in high-tech ultra-precisemanufacturing setups. However, human errors exist,which a�ect optimal lot size. E�ects of these humanerrors have been incorporated in this model for group-technology based manufacturing setups. An optimiza-tion approach was used to obtain the optimum lotsize based on average cost minimization. Numericalexamples were used to highlight the impact of hu-man errors on optimal lot size. Optimum lot sizesobtained were compared with those in the previouslydeveloped models. Sensitivity analysis highlighted thesigni�cance of the proposed model in comparison to theexisting models for group-technology manufacturingsetups. Numerical examples emphasized that thee�ect of human error Type I on optimal lot sizeremained highly signi�cant in comparison to humanerror Type II. Cost has increased signi�cantly withincrease in human error Type I. However, optimallot size and cost were relatively less signi�cant forhuman error Type II. The paper provides an insight formanufacturing engineers working in group-technologyenvironments to consider human errors associated withdecision making process in ultra-precision manufactur-ing processes. The proposed model can be extended byincorporating shortages and machine breakdowns. An-other possible extension of the proposed model wouldbe to consider the learning and forgetting phenomenaduring the rework process and decision making process,simultaneously. Moreover, the model can be extendedby comparing these production order quantity modelswith Just In Time (JIT) approach based on totalinvestment considering process imperfections in partic-ular.
References
1. Ullah, M. and Kang, C.W. \E�ect of rework, rejectsand inspection on lot size with work-in-process inven-tory", International Journal of Production Research,52(8), pp. 2448-2460 (2014).
2. Boucher, T.O. \Lot sizing in group technology pro-duction systems", International Journal of ProductionResearch, 22(1), pp. 85-93 (1984).
3. Barzoki, M.R., Jahanbazi, M. and Bijari, M. \E�ectsof imperfect products on lot sizing with work in process
inventory", Applied Mathematics and Computation,217(21), pp. 8328-8336 (2011).
4. Harris, F.W. \How many parts to make at once",Operations Research, 38(6), pp. 947-950 (1990).
5. Rosenblatt, M.J. and Lee, H.L. \Economic productioncycles with imperfect production processes", IIE trans-actions, 18(1), pp. 48-55 (1986).
6. Porteus, E.L. \Optimal lot sizing, process qualityimprovement and setup cost reduction", OperationsResearch, 34(1), pp. 137-144 (1986).
7. Ben-Daya, M. and Hariga, M. \Economic lot schedul-ing problem with imperfect production processes",Journal of the Operational Research Society, 51(7), pp.875-881 (2000).
8. Salameh, M. and Jaber, M. \Economic productionquantity model for items with imperfect quality",International Journal of Production Economics, 64(1),pp. 59-64 (2000).
9. Goyal, S.K. and C�ardenas-Barr�on, L.E. \Note on:economic production quantity model for items withimperfect quality-a practical approach", InternationalJournal of Production Economics, 77(1), pp. 85-87(2002).
10. Jamal, A.M.M., Sarker, B.R. and Mondal, S. \Op-timal manufacturing batch size with rework processat a single-stage production system", Computers &Industrial Engineering, 47(1), pp. 77-89 (2004).
11. C�ardenas-Barr�on, L.E. \On optimal manufacturingbatch size with rework process at single-stage pro-duction system", Computers & Industrial Engineering,53(1), pp. 196-198 (2007).
12. Biswas, P. and Sarker, B.R. \Optimal batch quantitymodels for a lean production system with in-cycle re-work and scrap", International Journal of ProductionResearch, 46(23), pp. 6585-6610 (2008).
13. C�ardenas-Barr�on, L.E. \Economic production quan-tity with rework process at a single-stage manufactur-ing system with planned backorders", Computers &Industrial Engineering, 57(3), pp. 1105-1113 (2009).
14. Maddah, B., Salameh, M.K. and Karame, G.M. \Lotsizing with random yield and di�erent qualities",Applied Mathematical Modelling, 33(4), pp. 1997-2009(2009).
15. Wee, H.M. and Widyadana, G.A. \Economic pro-duction quantity models for deteriorating items withrework and stochastic preventive maintenance time",International Journal of Production Research, 50(11),pp. 2940-2952 (2011).
16. Sarkar, B. and Moon, I. \An EPQ model with in- ation in an imperfect production system", AppliedMathematics and Computation, 217(13), pp. 6159-6167 (2011).
17. Sarkar, B. \An inventory model with reliability in animperfect production process", Applied Mathematicsand Computation, 218(9), pp. 4881-4891 (2012).

2060 C.W. Kang et al./Scientia Iranica, Transactions E: Industrial Engineering 24 (2017) 2050{2061
18. Pal, B., Sana, S.S. and Chaudhuri, K. \A mathemat-ical model on EPQ for stochastic demand in an im-perfect production system", Journal of ManufacturingSystems, 32(1), pp. 260-270 (2013).
19. Sarkar, B., C�ardenas-Barr�on, L.E., Sarkar, M. andSinggih, M.L. \An economic production quantitymodel with random defective rate, rework processand backorders for a single stage production system",Journal of Manufacturing Systems, 33(3), pp. 423-435(2014).
20. Lin, T.-Y. and Hou, K.-L. \An imperfect qualityeconomic order quantity with advanced receiving",TOP, pp. 1-17 (2014).
21. Taleizadeh, A.A., C�ardenas-Barr�on, L.E. and Mo-hammadi, B. \A deterministic multi product singlemachine EPQ model with backordering, scraped prod-ucts, rework and interruption in manufacturing pro-cess", International Journal of Production Economics,150(0), pp. 9-27 (2014).
22. Ben-Daya, M. and Rahim, A. \Optimal lot-sizing,quality improvement and inspection errors for multi-stage production systems", International Journal ofProduction Research, 41(1), pp. 65-79 (2003).
23. Taleizadeh, A., Naja�, A. and Akhavan Niaki, S.\Economic production quantity model with scrappeditems and limited production capacity", Scientia Iran-ica Transaction E: Industrial Engineering, 17(1), pp.58-69 (2010).
24. Taleizadeh, A.A., Sadjadi, S.J. and Niaki, S.T.A.\Multiproduct EPQ model with single machine, back-ordering and immediate rework process", EuropeanJournal of Industrial Engineering, 5(4), pp. 388-411(2011).
25. Khan, M., Jaber, M.Y. and Bonney, M. \An EconomicOrder Quantity (EOQ) for items with imperfect qual-ity and inspection errors", International Journal ofProduction Economics, 133(1), pp. 113-118 (2011).
26. Hsu, L.-F. \Erratum to \An economic order quantity(EOQ) for items with imperfect quality and inspectionerrors", Int. J. Prod. Econ., 133, pp. 113-118 (2011)".
27. Khan, M., Jaber, M.Y. and Wahab, M.I.M. \Economicorder quantity model for items with imperfect qualitywith learning in inspection", International Journal ofProduction Economics, 124(1), pp. 87-96 (2010).
28. Chen, Y.-C. \An optimal production and inspectionstrategy with preventive maintenance error and re-work", Journal of Manufacturing Systems, 32(1), pp.99-106 (2013).
29. Taheri-Tolgari, J., Mirzazadeh, A. and Jolai, F. \Aninventory model for imperfect items under in ationaryconditions with considering inspection errors", Com-puters & Mathematics with Applications, 63(6), pp.1007-1019 (2012).
30. Mohammadi, B., Taleizadeh, A.A., Noorossana, R.,and Samimi, H. \Optimizing integrated manufacturingand products inspection policy for deteriorating man-ufacturing system with imperfect inspection", Journalof Manufacturing Systems, 37, pp. 299-315 (2015).
31. Chang, C.T., Cheng, M.C. and Soong, P.Y. \Impactsof inspection errors and trade credits on the economicorder quantity model for items with imperfect quality",International Journal of Systems Science: Operations& Logistics, 3(1), pp. 34-48 (2016).
32. Sarkar, B. and Saren, S. \Product inspection policy foran imperfect production system with inspection errorsand warranty cost", European Journal of OperationalResearch, 248(1), pp. 263-271 (2016).
33. Zhou, Y., Chen, C., Li, C., and Zhong, Y. \A synergiceconomic order quantity model with trade credit,shortages, imperfect quality and inspection errors",Applied Mathematical Modelling, 40(2), pp. 1012-1028(2016).
34. Silver, E.A., Pyke, D.F. and Peterson, R., InventoryManagement and Production Planning and Scheduling,3, Wiley New York (1998).
Biographies
Chang-Wook Kang received BS in Industrial Engi-neering from Hanyang University and PhD in Statis-tics from University of Minnesota in 1990. He hasbeen teaching in the Department of Industrial andManagement Engineering at Hanyang University since1991. His main areas of research are SPC, projectmanagement, reliability engineering, and 6-sigma. Hehas written various books related to statistics andquality, such as `Probability and Statistics' and `BasicStatistical Tools for Improving Quality.' He hasalso published several research papers in internationaljournals of repute. He was President of the KoreanSociety of Industrial and System Engineering and theKorean Society of Project Management.
Misbah Ullah is an Assistant Professor in IndustrialEngineering Department, University of Engineering &Technology Peshawar, Pakistan. He received his PhDdegree from Statistical Engineering for Advanced Qual-ity Laboratory, Hanyang University, Republic of Korea.He received the BS degree in Mechanical Engineeringin 2002 and the MS in Industrial Engineering in 2006.His area of interest includes quality control, qualitymanagement, 6-sigma, and design of experiment. Hehas several years of practical experience in high-techindustries. He has successfully undertaken variousprojects related to quality control and costing, and 6-sigma for the small- and medium-scale industries. Hehas published several papers in national and interna-tional journals.
Biswajit Sarkar is currently an Assistant Professor inthe Department of Industrial and Management Engi-neering at Hanyang University, Korea. He was an As-sistant Professor in the Department of Applied Mathe-matics with Oceanology and Computer Programming,

C.W. Kang et al./Scientia Iranica, Transactions E: Industrial Engineering 24 (2017) 2050{2061 2061
Vidyasagar University, India, during 2010 to 2014. Heserved as an Assistant Professor in the Department ofMathematics at Darjeeling Government College, India,during 2009 to 2010. He received his BSc, MSc, andPhD degrees from Jadavpur University, India, in 2002,2004, and 2010, respectively. He was awarded MPhilin 2008 at Annamalai University, India. His researchincludes optimization in inventory management, supplychain management, reliability, transportations, andproduction system. He has published several research
papers in international journals of repute, includingEuropean Journal of Operational Research, Inter-national Journal of Production Economics, AppliedMathematical Modelling, Applied Mathematics andComputation, Annals of Operation Research, ExpertSystems with Applications, Economic Modelling, etc.Presently, he is serving as the Editorial Board Memberof several journals. Recently, he became the Editor-in-Chief of the Journal of Engineering and AppliedMathematics, DJ Publications.