Embed Size (px)
Citation preview

47
CALIFORNIA DEPARTMENT OF FISH AND GAMEDecember 2001
California’s Living Marine Resources:A Status Report
Human Benefits of the Marine Ecosystem
Marine ecosystems provide opportunities for consump-tive and non-consumptive uses of marine resources.
Some activities, such as commercial, recreational and subsistence shing, kelp harvesting and harvesting of marine specimens for aquarium use, are consumptive in the sense that they result in permanent removal of eco-system resources. Other activities (tidepooling, marine mammal and bird watching, kayaking and observational diving) are more commonly characterized as non-con-sumptive. However, the distinction between consumptive and non-consumptive use is not always clear cut, as activi-ties that are not necessarily intended to be consumptive may sometimes result in inadvertent injury to marine animals or disruption of their habitat.
Marine ecosystems also benet people who may never use or even see marine resources but nevertheless value their existence. Non-use value may be motivated by the desire to have ecosystem resources available for future use or by the satisfaction of knowing that such resources exist, regardless of whether they are ever put to human use.
The remainder of this report focuses on the two major consumptive uses of marine resources— commercial and recreational shing. The intent is not to diminish the importance of other sources of use and non-use value but rather to address informational and reporting require-ments of the Marine Life Management Act.
Factors Affecting Commercial and Recreational Fishery Activity
Commercial and recreational shery landings are affected by many factors. Landings tend to increase
with stock abundance, as sh are easier and less costly to locate and harvest when they are at higher levels of abundance. The availability of some species on local sh-ing grounds may vary across seasons or years, depending on ocean temperature and other environmental factors. Weather conditions and economic circumstances (market demand and prices) may discourage or encourage shing activity. Fishing behavior is also affected by regulatory restrictions, which are imposed for a variety of reasons and take a variety of forms.
Regulations may be imposed for biological reasons. For instance, harvest restrictions may be imposed to protect a particular sh stock or to reduce incidental take of other stocks that are caught simultaneously with that stock. Regulations may be imposed to protect habitat or to reduce injury or mortality to marine mammals or seabirds
that may result from interactions with shing operations. Regulations may be imposed for economic reasons. For instance, seasons may be set to coincide with periods when a sh stock is in prime marketable condition or when market demand is high. Regulations may be imposed for social reasons, such as providing equitable harvest opportunities or reducing the potential for conict among different sectors of a shery.
Regulations can take a variety of forms, including license and permit programs, harvest quotas, season closures, area closures, trip limits, bag limits (for recreational anglers), size limits and restrictions on quantity and type of gear. Reporting requirements such as landings receipts, logbooks or on-board observers may be imposed to ensure that shery monitoring, management, enforcement and research needs are met. A particular type of regulation may serve different objectives, depending on the context in which the regulation is imposed. For instance, trip limits may be used to discourage targeting on a particular species while allowing a limited amount of incidental take of that species. Trip limits may be used to slow the harvest rate to enhance real-time monitoring capability in sheries where quotas would otherwise be quickly exhausted. Trip limits may also serve eco-nomic objectives, such as lengthening the duration of the
Human Ecosystem Dimension H
uman Ecosystem
Dim
ension

48
CALIFORNIA DEPARTMENT OF FISH AND GAMEDecember 2001
California’s Living Marine Resources:A Status Report
shing season or ensuring that landings do not exceed processing capacity.
For shing vessels and sh dealers, net economic benet is properly measured as the difference between their gross revenues and economic costs. However, net eco-nomic benets cannot be estimated for either of these shery sectors, due to lack of complete economic data. Instead, landings by shing vessels and landings receipts by sh dealers are described in terms of their ex-vessel value. Ex-vessel value overstates the economic value of the shery to shing vessels, as it does not include any consideration of harvesting costs. For dealers, ex-vessel value represents the cost of obtaining sh. Information on revenues earned from processing/marketing these land-ings is not generally available. In addition, some dealers may also process/market sh imported from other states or countries; the revenues and costs associated with these imported products are also not known.
Commercial Fisheries Landings and Ex-vessel Value
This section describes trends in the volume and ex-vessel value of California commercial landings. The
harvest information presented here is based on landings receipts and therefore excludes discards and live bait catch. Fish may be discarded in commercial shery opera-tions for a variety of reasons. Discards may include sh that are of sublegal size, exceed a vessel’s hold capacity or trip limit, or are not of marketable size or species. Information on the level of discards and discard mortality is generally not known. Live bait used by recreational shermen is also not reported on landings receipts, since transactions between buyers and sellers of live bait typi-cally take place at sea. Logbook data indicate that bait haulers harvest a maximum of 12 million pounds of live bait each year.
Commercial landings in California decreased from 791.4 million pounds in 1981 to 472.1 million pounds in 1999. Ex-vessel revenues also fell during this period from $475.7 million to $144.4 million in 1999. All dollar values pre-sented here and throughout the remaining of this report have been corrected for ination to 1999 dollars. The precipitous decline experienced during the early-1980s was largely the result of a shift in tuna landings from Cali-fornia ports to less costly cannery operations in American Samoa and Puerto Rico. The decline in tuna landings and revenues has been compounded by declines in landings of species such as groundsh, urchin, shark and swordsh, salmon, abalone. Other species (e.g., market squid, lob-ster, prawn, coastal pelagics) have been the target of expanding sheries, while still others (e.g., crab, Pacic herring, shrimp) exhibit no obvious pattern or trend in landings and revenues.
From 1995 through 1999, the species groups accounting for most of the ex-vessel value of California landings were (in descending order of value) groundsh, market squid, crab, albacore/other tunas, sea urchin, herring, shark/swordsh, salmon, coastal pelagics, lobster, prawn, shrimp and abalone. The species composition of landings and revenues varies signicantly by area. Over 90 percent of the ex-vessel value of landings in northern California consists of groundsh, crab, shrimp and sea urchin. In central California, 90 percent of total ex-vessel value is contributed by groundsh, herring, salmon, crab, prawn, shark/swordsh and coastal pelagics. In southern Califor-nia, 90 percent of total value is contributed by squid, albacore/other tuna, sea urchin, coastal pelagics, shark/swordsh, lobster and groundsh. Landings and revenues have historically been higher in southern California than in central or northern California. The major reason for this difference is the large contribution made by the high-volume squid and coastal pelagic sheries to southern California landings and revenues.
The State of California requires that all commercial shing vessels, crew members, and sh businesses be licensed
Hum
an Ecosystem D
imension

49
CALIFORNIA DEPARTMENT OF FISH AND GAMEDecember 2001
California’s Living Marine Resources:A Status Report
to operate in the state, and further requires that all businesses and shermen who accept seafood for com-mercial purposes maintain landings receipts. The state also imposes additional license and permit requirements that are specic to certain types of shing activities. In addition, federal permits are required for vessels that qualify to participate in the groundsh and coastal pelag-ics limited-entry sheries. Permits and licenses represent upper-bound estimates of shery participation, as not all permit/license holders actively engage in shery activity each year. The next two sections of this report describe the extent of actual participation in the harvesting and processing sectors.
Harvesting Sector
The number of commercial shing vessels that land sh in California declined from 6,897 in 1981 to 2,690 in
1999. While the majority of these boats land sh solely at California ports, a signicant minority also makes landings in Oregon or Washington. California boats may sh in other states as well (e.g., Alaska); however, the extent of such activity is not known.
Categorizing vessels according to their “principal area” (i.e., the area in which they made the plurality of their revenues from California landings), the statewide pattern of declining eet size is evident in all areas. From 1981 to 1999, the number of boats declined from 2,256 to 532 (76 percent) in northern California, from 2,848 to 1,191 (58 percent) in central California, and from 1,793 to 967 (46 percent) in southern California. The number of boats has been consistently higher in central California than in the other two areas.
Just as some vessels engage in interstate shing activity, a small but signicant minority of vessels lands sh both inside and outside of their principal shing area within California. From 1981 through 1999, 82 percent of vessels whose principal area was northern California made land-ings in northern California only, while the remaining 18 percent also made landings in other areas (mostly central California). Of vessels whose principal area was central California, 87 percent made landings in central California only, and 13 percent also made landings in northern and/or southern California. Of vessels whose principal area was southern California, 88 percent made landings in southern California only, and the remaining 12 percent also made landings in other areas (mostly central California).
The percent of boats earning less than $5,000 per year declined from 53 percent during the period from 1981 through 1985 to 34 percent during the 1995 through 1999 period, while the percent of boats accounting for 90 per-cent of the ex-vessel value of statewide landings increased from 20 percent (1981-1985) to 35 percent (1995-1999). The highly skewed revenue distribution characteristic of the early 1980s reects the sizeable contribution of tuna shery participants to total statewide revenues during those years. The tendency toward a less skewed distribu-tion of revenue after the mid-1980s was apparent in north-ern, central and southern California as well as statewide. Nevertheless, the commercial shery remains character-ized by a large number of low-revenue vessels and a small number of high-revenue vessels, with hook-and-line
Hum
an Ecosystem D
imension
Street fish market, Fisherman’s Wharf, San Francisco, CACredit: UC Davis Sea Grant

50
CALIFORNIA DEPARTMENT OF FISH AND GAMEDecember 2001
California’s Living Marine Resources:A Status Report
salmon and groundsh vessels disproportionately repre-sented in the low-revenue segment.
From 1981 through 1999, ex-vessel revenue from California landings averaged $46,500 per boat and did not exhibit any consistent trend or pattern. However, the statewide average masks signicant regional differences in this regard. From the 1981-1985 period to the 1994-1999 period, average revenue per boat increased signicantly in northern California from $24,500 to $60,800, increased less dramatically in central California from $20,800 to $30,100, and declined in southern California from $126,000 to $74,900. The shing opportunities that developed in southern California after the mid-1980s were not sufcient to compensate for the decline in revenues from the highly lucrative tuna shery. Nevertheless, average revenue per boat is still higher in southern California than elsewhere in the state.
For the years 1995 through 1999, commercial landings and revenues were categorized into 23 different com-binations of species and gear that depict major types of shery activity in the state. Table II-7 describes aver-age annual landings and revenues in each major shery in northern, central and southern California during the 1995-1999 period, presented in declining order of revenue. For each shery, the table also includes the number of participating vessels (dened as vessels who earned at least ve percent of their California revenue from that shery) and the number of participating vessels for whom the shery is their “principal shery” (that is, the shery from which they derive the plurality of their California revenue).
Table II-8 characterizes the vessels in each principal sh-ery category in terms of average landings and revenues per year from the vessel’s principal California shery, from other California sheries, and from Oregon and Washing-ton sheries. Average revenue per boat varies widely among sheries, and tends to be lowest in the groundsh and salmon hook-and-line sheries and highest in the trawl and seine sheries. The distribution of average rev-
enue per vessel among sheries is suggestive of vessels’ economic dependence on their principal shery relative to other California sheries and to Oregon and Washington sheries. For instance, some vessels (e.g., shrimp trawl in northern California) earn more revenue from their out-of-state landings than their California landings. For these vessels in particular, adverse conditions in their out-of-state sheries can result in a signicant diversion of effort to the California sheries in which they also participate, and vice versa. At the other end of the spectrum are ves-sels that derive most if not all of their revenue from their principal shery (e.g., urchin diving in central California). Because of this lack of diversication, such vessels are particularly vulnerable to changing conditions in the shery in which they do participate. It should be cau-tioned that ex-vessel revenue comparisons are merely sug-gestive of differences in economic value, as such compari-sons do not account for differences in operating costs across sheries.
According to Tables II-7 and II-8, the highest-revenue sh-eries do not necessarily support the largest numbers of boats or generate large ex-vessel revenues per boat. For instance, the salmon hook-and-line shery is the third largest contributor to ex-vessel revenue in central Cali-fornia ($6.5 million) and serves as the principal shery for 579 vessels, yet generates only $9,000 in ex-vessel revenue per boat per year. The tuna seine shery is the third largest contributor to ex-vessel revenue in southern California ($9.6 million) and yields higher revenue per boat than any other shery statewide ($914,600 per boat per year); yet tuna seine is the principal shery for only 10 boats.
The Tables in II-3 describe the most common combinations of sheries in which vessels participated from 1995 through 1999. The number in each rectangle represents the average annual number of vessels that participated solely in that shery during the 1995-1999 period, and the number on each line connecting the rectangles represents the average annual number of vessels that participated
Hum
an Ecosystem D
imension

51
CALIFORNIA DEPARTMENT OF FISH AND GAMEDecember 2001
California’s Living Marine Resources:A Status Report
in that particular two-shery combination. The asterisks denote the most common three-shery combinations. Only sheries or shery combinations that represent an annual average of at least three vessels appear in the gure. Since the abalone dive shery has been closed to com-mercial shing since 1998, the 1995-1999 statistics on that shery included in Tables II-7, II-8 and II-3 include the recent years of zero shing activity (1998-1999).
Patterns of behavior vary signicantly by area. In north-ern California, crab pot is the predominant shery in terms of the number of vessels that participate solely in that shery (153) and the frequency with which crab pot vessels also engage in other sheries. In central California, the largest numbers of vessels engage in the salmon hook-and-line (419), groundsh hook-and-line (332) and herring (121) sheries. The most common combina-tions involve salmon and groundsh hook-and-line (92), and salmon hook-and-line and crab pot (88). In southern California, the largest numbers of vessels engage in the sea urchin (156), groundsh hook-and-line (119) and lob-ster pot (102) sheries. Groundsh hook-and-line vessels are also notable in terms of the number of other sheries in which they participate. While interactions exist among the prawn, groundsh and cucumber trawl sheries, trawl sheries in southern California are seldom pursued in combination with other gear types.
The Processing Sector
Between 1981 and 1999, the number of sh dealers increased statewide from 519 to 888. Categorizing
dealers according to their “principal area” (e.g., the area of California accounting for the plurality of the ex-vessel value of their landings receipts), the number of dealers increased from 86 to 143 (+66 percent) in northern Califor-nia, from 213 to 366 (+42 percent) in central California, and from 220 to 379 (+72 percent) in southern California. The number of dealers has been consistently lower in northern California than in other areas of the state.
The increase in numbers of dealers has followed a distinc-tive pattern: a relatively stable number of dealers during the 1981-1986 period, followed by a stepwise increase in 1987 and relatively stable (albeit higher) numbers there-after. The ex-vessel value of average annual landings receipts per dealer shows a parallel though opposite step-wise pattern. From the 1981-1986 period to the 1987-1999 period, the average annual number of dealers increased from 547 to 825, while the value of landings receipts per dealer decreased from $531,500 to $209,500 over the same period. The decline in average value per dealer is largely due to the post-1986 increase in the number of dealers for whom the value of landings was less than $5,000. Many of these small dealers are commercial sh-ing vessel operators who sell their landings directly to restaurants and markets rather than to a processor. The decline in annual value per dealer has been particularly severe in southern California (falling from $805,500 in 1981-1985 to $233,900 in 1986-1999), where the effect of the post-1986 increase in the number of small dealers was compounded by the drastic reduction in high-priced tuna landings experienced in that area through the early 1980s. Since the decline of the tuna shery, northern California has generally replaced southern California as the area with the highest average value of landings per dealer.
The distribution of landings receipts among dealers is highly skewed, with 16 percent of the dealers responsible for 90 percent of the value of landings from 1987 through 1999. This pattern is repeated throughout the state, with 20 percent of dealers in northern California and 16 percent of dealers in central and southern California accounting for 90 percent of ex-vessel value in their respective areas of the state.
The Trade Sector
Generally speaking, imports into the U.S. are catego-rized by their initial port of entry, which is not neces-
sarily their nal destination. Thus, some imports that
Hum
an Ecosystem D
imension

52
CALIFORNIA DEPARTMENT OF FISH AND GAMEDecember 2001
California’s Living Marine Resources:A Status Report
enter the U.S. at Nogales, Arizona and Honolulu, Hawaii likely end up in California markets. For this reason, sea-food imports into California should be considered sug-gestive rather than denitive estimates of California con-sumer demand for imported seafood.
Like imports, exports from the U.S. are categorized in terms of the port from which they left the U.S. Thus, not all exports from a state necessarily originate from sheries in that state. California exports may include sh landed in Mexico and subject to additional handling or processing in California before being sold to a third country. Exports also include sh that were imported and not sold, then re-exported in substantially the same condition as when imported.
The dollar value attached to imports represents the Cus-toms value, that is, the price actually paid for merchan-dise when sold to the U.S., excluding U.S. import duties, freight, insurance and other charges incurred in bringing the goods to the U.S. The dollar values attached to exports and re-exports is the “free alongside ship” value, that is, the value at the port of export, dened as the transaction price including charges and transportation costs incurred in bringing the merchandise to the port of exportation.
Between 1989 and 1999, the value of seafood products imported into California increased from $1.6 trillion to $2.4 trillion, while imports into the U.S. as a whole increased from $6.9 trillion to $9.0 trillion. About 30 percent of the value of U.S. imports enters the country at California ports. Shrimp imports, which have increased dramatically over the past decade, have consistently com-prised about 60 percent of the value of California seafood imports. The average annual value of shrimp imports was $1.6 trillion during the 1997-1999 period. Signicant though much smaller amounts of tuna ($187.6 million), unspecied marine sh ($104.1 million), scallop ($65.1 million), lobster ($62.2 million) and squid ($47.0 million) were also imported during that period. The countries from which California received most of its seafood imports
during the 1997-1999 period (in order of declining annual import value) were Thailand ($999.6 million), Indonesia ($179.1 million), China ($162.5 million), Ecuador ($157.9 million), India ($148.6 million) and Taiwan ($99.4 million). Imports from all of these countries except China have been on a generally increasing trend over the past decade.
From 1989 through 1999, the value of seafood products exported from California and from the U.S. as a whole averaged $246.2 million and $3,215.3 million respectively. About eight percent of total U.S. seafood exports origi-nated from customs districts in California. In recent years (1997-1999), squid has replaced sea urchin as California’s major export. The major species groups comprising Cali-fornia exports during the 1997-1999 period (in order of declining average annual value) were squid ($37.9 million), sea urchin ($28.5 million), shrimp ($18.3 million), lobster ($17.4 million), salmon ($16.6 million) and groundsh ($14.7 million). Although exports to Japan have declined signicantly over the past decade, Japan remains the major recipient of California exports. California’s major seafood export trading partners from 1997 through 1999 (in order of declining annual export value) were Japan ($61.7 million), Taiwan ($30.6 million), China ($22.2 mil-lion), Australia ($15.7 million), Mexico ($11.9 million) and Hong Kong ($10.8 million).
Sport and Subsistence Fisheries
Some shermen do not earn revenue from their catch but rather sh for pleasure and/or to provide food
for personal consumption. The economic value of the sport/subsistence (hereafter loosely referred to as “recre-ational”) shery depends on which segment of the shery is being considered. For instance, the value of shing to anglers would be measured by consumer surplus, that is, the maximum amount that anglers would be willing to pay for the shing experience over and above what they actually pay. The value of shing to businesses that provide services to anglers, such as commercial passenger
Hum
an Ecosystem D
imension

53
CALIFORNIA DEPARTMENT OF FISH AND GAMEDecember 2001
California’s Living Marine Resources:A Status Report
shing vessels (CPFVs), would be measured by the differ-ence between their gross revenues and economic costs. The economic impact of shing on local economies would be measured by the multiplier effects on income and employment that occur as money spent by anglers moves through the economy. Collection and analysis of data needed to estimate these various types of economic effects are underway. Until such studies are completed, all that is available at this time are approximate estimates of angler expenditures.
Effort and Harvest
Approximately 4.7 million marine recreational angler trips were made annually in California during
1998-1999 — 2.9 million trips (61 percent) in southern California (Santa Barbara County and southward) and 1.9 million trips (39 percent) in central/northern California (San Luis Obispo County and northward). The proportion of total effort in each area associated with man-made structures (e.g., piers), beaches, CPFVs and private boats was 22 percent, 10 percent, 22 percent and 46 percent respectively in southern California, and 24 percent, 18 percent, nine percent and 49 percent in central/northern California. Approximately 17.8 million sh were harvested annually during 1998-1999, of which 9.6 million were landed in whole condition, 7.1 million were discarded alive, and 1.2 million were used as bait, lleted, given away or discarded dead.
Harvest levels vary signicantly across species groups. During 1998-1999, the major components of harvest included rocksh (3.4 million sh), sea basses and tuna/mackerel (2.5 million sh each), and smelt, surfperch, croakers and Pacic barracuda (1.1 million sh each). Flatsh, silversides, jacks, sharks, rays, scorpionsh, striped bass, herring greenlings, sculpins and sea chubs made smaller though signicant contributions to total harvest. The percentage of total catch retained by anglers or discarded dead (e.g., not released alive)
Hum
an Ecosystem D
imension
varies widely, ranging from a high of 85-90 percent for smelt, rocksh, jacks and herring to a low of 11 percent for cartilaginous sh.
Harvests vary across shing modes and areas as well as species. During 1998-1999, annual harvests (excluding sh released alive) ranged from highs of 1,995,000 sh for CPFV anglers and 2,171,000 sh for private boat anglers in southern California, to lows of 344,000 sh for southern California beach anglers and 600,000 sh for central/northern California anglers shing from man-made struc-tures. Sea basses, tuna/mackerel, Pacic barracuda, Cali-fornia scorpionsh and jacks are much more commonly caught in southern California, while striped bass and salmon are more commonly caught in central/northern California. Rockshes are an important component of boat-based harvests in southern California and the domi-nant component in northern California.
Recreational Fishery Expenditures
Based on the average annual number of marine rec-reational shing trips made in U.S. waters during
1998-1999, aggregate annual trip-related expenditures were estimated to be approximately $202.0 million for southern California and $107.9 million for central/northern California. These estimates, combined with license, sh-ing gear and boat-related expenses of $128.4 million in southern California and $68.6 million in central/northern California, bring total annual statewide angler expendi-tures to $506.9 million.
Additional Information on the Salmon and CPFV Sport Fisheries
DFG sponsors a number of data collection programs that provide detailed information regarding certain
segments of the marine sport shery. One such program is the Ocean Salmon Project (OSP), which provides informa-

54
CALIFORNIA DEPARTMENT OF FISH AND GAMEDecember 2001
California’s Living Marine Resources:A Status Report
tion on harvest and effort in California’s ocean salmon sheries (both recreational and commercial). It also spon-sors a CPFV logbook program. Not all CPFVs participate in the program and the participation rate varies somewhat from year to year. Nevertheless, logbook-based estimates of effort and catch are generally considered to be useful indicators of trends in the CPFV shery.
According to data collected in the OSP, recreational salmon landings and effort in both central and northern California were lower and less variable in the years prior to 1985 than they have been in subsequent years 1985 through 2000. Record low levels of landings and effort were experienced by both CPFV and private boat anglers in 1992 and record highs in 1995. While CPFV and private boat landings have been markedly similar over time, sh-ing effort has been consistently higher for private boats than CPFVs. From 1985 through 2000, annual salmon land-ings averaged 91,600 sh for CPFVs and 93,600 for private boats, while annual effort averaged 86,200 CPFV trips and 128,300 private boat trips. Neither landings nor effort exhibit any consistent long term trend.
According to data collected in CPFV logbooks, the number of CPFVs that participate annually in the marine recre-ational shery averaged 297 boats from 1980 through 1998. Categorizing CPFVs according to their “principal area” (e.g., the area in which they made the plurality of their shing trips), the number of northern California CPFVs increased from an annual average of 18 boats during the 1980-1987 period to 30 boats during the 1988-1991 period, then decreased to an average of 13 boats during the 1992-1998 period. The number of central California CPFVs declined from an annual average of 137 boats during the 1980-1991 period to 105 boats during the 1992-1998 period. The CPFV eet in southern California, many of which sh in Mexican as well as U.S. waters, increased in size from an average of 145 boats (1980-1994) to 183 boats (1995-1998). Of these 183 boats, 119 shed exclusively in U.S. waters, 58 shed in both U.S. and
Mexican waters, and ve shed exclusively in Mexican waters.
The number of CPFV angler trips in northern California averaged 6,782 (1980-1984), increased to 13,271 (1985-1991), then declined to 6,087 (1992-1998). In central California, shing effort declined from an annual average of 206,121 angler trips (1980-1991) to 159,634 angler trips (1992-1998). For CPFVs based in southern California, sh-ing effort in U.S. waters experienced peaks in 1980-1982, 1990 and 1997-1998, while effort in Mexican waters peaked in 1984-1985 and 1997-1998. Fishing effort in southern California (in both U.S. and Mexican waters) displays no obvious trend over time.
Paralleling the changes in shing effort, CPFV landings in northern California also increased through the 1980s, peaked in the late 1980s and early 1990s, then declined throughout the 1990s. This same trend was followed by both major components of northern California landings – rocksh/lingcod and salmon. Landings of “other” species, which have historically been very modest, were augmented by crab harvests from 1995 through 1998, when CPFVs began employing crab pots on shing trips to help supplement declining harvests of nshes. Cen-tral California landings, which ranged from 1.5 to 1.8 mil-lion sh during the early 1980s, have declined to well under one million sh in recent years. This decline has been largely driven by the precipitous decline in rocksh/lingcod landings. Salmon landings and landings of “other” species (including species such as crab, striped bass, stur-geon, atshes, mackerel, tuna, shark) followed no obvi-ous trend. Landings associated with southern California trips in U.S. waters declined from well over four million sh during the early 1980s to around two million sh during the late 1990s. Increases in sea bass and barracuda landings during 1980-1998 were overshadowed by much larger declines in rocksh, mackerel and bonito landings. Tuna/jack landings do not follow any obvious long term trend, although they have been unusually high in recent years. “Other” landings include a diversity of species, including California scorpionsh, ocean whitesh, sea chubs, wrasses, croakers and atshes among others.
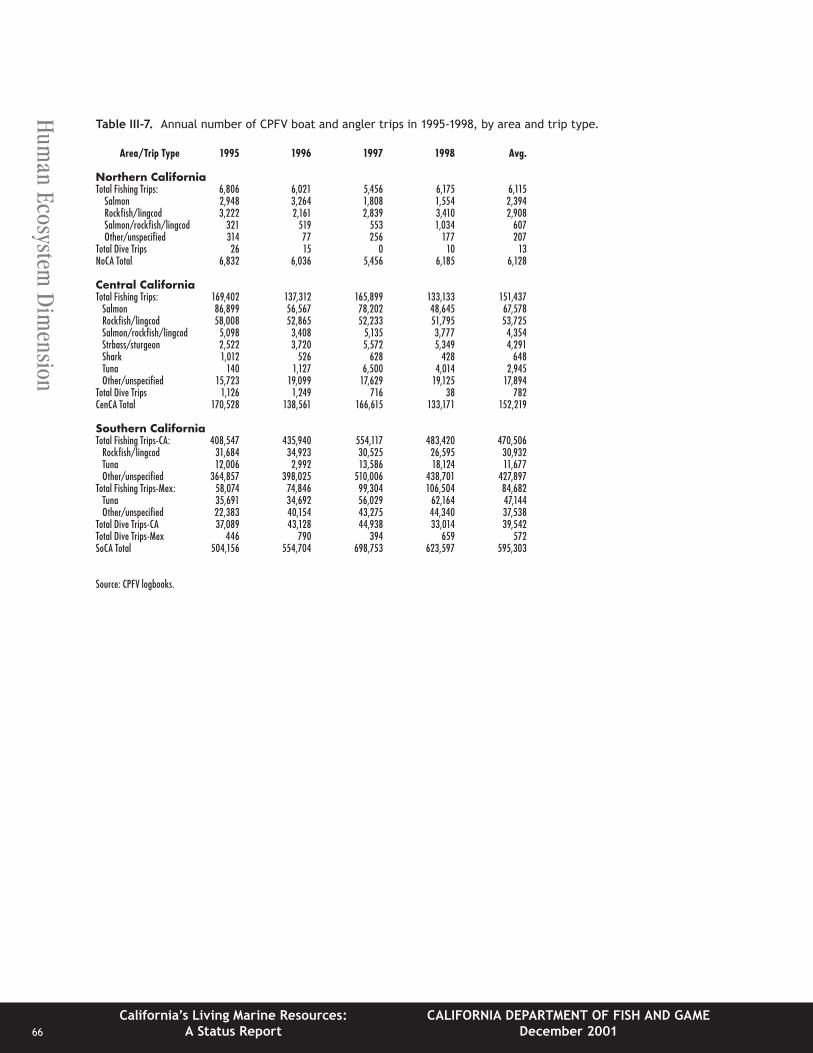
Since 1995, the CPFV logbook database has included infor-mation that allows shing trips to be distinguished from diving trips and also allows trips to be distinguished by target species. From 1995 through 1998, diving trips comprise a very modest proportion of total CPFV activity in both northern and central California. CPFV shing trips in northern California were targeted largely at salmon (39 percent), rocksh/lingcod (48 percent) and salmon and rocksh/lingcod combined (10 percent). CPFV shing trips in central California were targeted at salmon (45 percent), rocksh/lingcod (35 percent), salmon and rocksh/lingcod (three percent), and striped bass/sturgeon, shark, tuna
Hum
an Ecosystem D
imension

55
CALIFORNIA DEPARTMENT OF FISH AND GAMEDecember 2001
California’s Living Marine Resources:A Status Report
Table II-1. Commercial landings (millions of pounds), by year and species group, 1981-1999.1
Year Groundfish Squid Crab Alb/Other Tuna Urchin Herring Shark/Sword Salmon1981 94.4 51.8 11.8 337.1 26.5 13.1 4.8 6.01982 116.7 36.9 8.2 251.6 19.5 23.4 5.7 8.01983 90.0 4.0 6.7 248.7 17.8 17.7 5.8 2.41984 90.1 1.2 7.0 182.4 15.1 8.5 7.6 2.91985 95.0 22.7 7.9 68.2 20.1 17.6 8.9 4.31986 92.5 46.9 9.8 69.0 34.1 16.9 6.7 7.31987 91.8 44.1 8.6 80.6 46.1 18.6 5.3 8.81988 88.5 82.1 12.7 75.7 52.0 19.1 4.3 14.21989 94.4 90.2 7.2 55.5 51.4 20.6 4.5 5.61990 86.7 62.7 12.3 37.4 45.3 16.5 3.5 4.31991 79.7 83.2 6.0 19.0 42.3 16.3 3.1 3.71992 77.3 28.9 9.9 20.6 33.2 14.2 3.3 1.61993 62.4 94.4 13.5 24.9 27.0 9.6 3.5 2.51994 54.8 122.0 14.6 26.0 23.9 6.7 3.4 3.11995 63.5 154.9 10.4 26.1 22.3 10.4 2.4 6.61996 62.4 177.6 13.6 42.4 20.1 12.2 2.5 4.11997 65.5 155.1 11.3 37.2 18.1 20.8 3.1 5.31998 50.6 6.6 12.1 38.1 10.4 4.5 2.8 1.81999 33.1 201.8 9.6 24.6 14.2 5.2 3.8 3.8
and other/unspecied species (17 percent). From 1995 through 1998, the contribution of salmon to total CPFV landings in northern and central California (seven percent and 10 percent respectively) was much lower than the proportion of trips targeted at salmon. Conversely, the rocksh/lingcod contribution to total northern and central California landings (88 percent and 84 percent respec-tively) was much higher than the proportion of trips tar-geted at rocksh/lingcod. Such marked disproportion-alities between landings and effort highlight the large differences in catch-per-unit-effort that can exist among species groups. The singular reliance of northern and central California CPFVs on salmon, rocksh and ling-cod harvests and the unprecedented regulatory restric-tions on harvests of these species in recent years are signicant contributing factors to the decline in effort and landings experienced in northern and central California in recent years.
Southern California CPFVs participate in a range of shing and diving activities. From 1995 through 1998, about 79 percent of angler trips made by southern California boats involved shing in U.S. waters, 14 percent involved shing in Mexican waters, seven percent involved diving in U.S. waters, and less than one percent involved dive trips in Mexican waters. Of the 183 CPFVs that operated in southern California during 1995-1998, 63 shed in Mexican waters. Mexican as well as California shing regulations are an important consideration for this signicant minority of southern California CPFVs.
From 1995 through 1998, 91 percent of southern California CPFV shing trips in U.S. waters were not targeted at any particular species, reecting the prevalence of freelance trips on which anglers are provided with the opportunity to catch a diversity of species. Of the remaining nine per-cent of trips, two percent were specically targetine tuna and seven percent rocksh/lingcod. About 55 percent of total rocksh/lingcod landings in southern California were made on trips specically targeting rocksh/lingcod and the remaining 45 percent landed on freelance trips. This highlights one of the complexities associated with management of the southern California CPFV shery, that is, how to meet harvest goals for managed species (like rocksh and lingcod) that are taken jointly with other species without unduly restricting harvests of these other species.
Cynthia J. ThomsonNational Marine Fisheries Service
ReferencesThomson, Cynthia J. and Daniel D. Huppert. 1987. Results of the Bay Area Sportsh Economic Study (BASES), NOAA Technical Memorandum NOAA-TM-NMFS-SWFSC-78, 70 pp.
Thomson, Cynthia J. and Stephen J. Crooke. 1991. Results of the southern California Sportsh Economic Survey. NOAA Technical Memorandum NOAA-TM-NMFS-SWFSC-164, 264 pp.
Hum
an Ecosystem D
imension

56
CALIFORNIA DEPARTMENT OF FISH AND GAMEDecember 2001
California’s Living Marine Resources:A Status Report
Hum
an Ecosystem D
imension
Table II-1. Commercial landings (millions of pounds), by year and species group, 1981-1999.1 (continued)
Year CPS Lobster Prawn Shrimp Nearshore Abalone All Else Total1981 232.6 0.5 0.6 5.3 2.6 1.1 3.2 791.41982 215.7 0.5 0.4 5.4 2.3 1.2 3.2 697.81983 122.9 0.5 0.3 2.1 1.5 0.8 1.7 522.81984 123.7 0.4 0.6 3.0 2.3 0.8 1.5 447.31985 102.0 0.4 1.0 4.6 3.0 0.8 1.3 357.61986 120.8 0.5 0.8 7.0 2.1 0.6 1.1 416.11987 124.7 0.4 0.3 8.2 2.1 0.8 1.5 442.11988 129.2 0.6 0.3 11.5 2.3 0.6 1.7 494.81989 136.1 0.7 0.4 14.6 2.1 0.7 3.6 487.51990 106.2 0.7 0.4 10.3 2.0 0.5 6.0 394.91991 99.9 0.6 0.4 11.8 2.9 0.4 1.7 371.21992 85.7 0.6 0.3 19.6 1.8 0.5 1.3 298.91993 67.9 0.6 0.4 8.6 2.1 0.5 1.8 319.81994 57.6 0.5 0.6 12.1 3.1 0.3 1.7 330.41995 115.7 0.6 0.8 6.8 3.2 0.3 1.4 425.41996 107.5 0.7 1.1 10.6 3.4 0.2 3.3 461.61997 151.2 0.9 1.1 15.7 2.7 0.1 4.2 492.31998 147.2 0.7 1.3 3.0 1.4 0.0 3.3 283.91999 163.4 0.5 2.0 5.8 1.4 0.0 2.9 472.11 “Nearshore” includes non-rockfish species caught in nearshore areas (e.g., California sheephead, white croaker, white seabass).
Table II-2. Ex-vessel value ($millions, base year=1999), by year and species group, 1981-1999.1
Year Groundfish Squid Crab Alb/Other Tuna Urchin Herring Shark/Sword Salmon1981 38.3 8.5 17.2 317.6 8.4 7.9 9.6 25.31982 46.5 5.6 13.6 198.7 5.6 15.8 12.5 31.51983 36.5 1.1 14.0 163.1 5.8 18.9 13.7 7.01984 35.8 0.4 14.3 118.2 5.3 2.8 20.7 11.41985 39.9 5.3 14.7 36.6 6.8 8.7 23.1 15.31986 42.8 6.2 17.9 38.3 13.4 7.6 20.8 20.21987 44.5 5.3 15.2 48.3 17.9 7.9 18.2 32.61988 40.1 10.2 21.0 55.1 25.2 7.4 15.2 52.51989 40.7 8.7 11.3 32.8 28.4 5.9 16.6 16.51990 37.2 5.7 21.8 18.4 29.7 10.5 10.7 14.11991 34.4 7.2 10.0 9.4 39.5 11.1 9.3 10.51992 34.9 2.8 14.1 11.5 33.9 10.5 9.6 5.11993 28.0 11.3 16.4 15.2 29.4 2.8 10.9 6.31994 28.2 15.6 21.4 16.5 27.7 3.5 11.5 7.01995 38.7 23.7 16.9 11.4 24.1 10.3 7.8 12.41996 37.8 22.8 19.5 23.5 19.6 15.8 7.1 6.31997 35.8 21.2 20.8 20.1 15.7 15.6 7.3 7.51998 25.0 1.7 21.8 19.0 8.0 0.6 6.7 3.11999 22.4 33.3 18.2 16.3 13.4 2.2 9.1 7.4
Year CPS Lobster Prawn Shrimp Nearshore Abalone All Else Total1981 23.7 2.7 1.6 5.3 2.8 3.5 4.0 475.71982 21.1 3.0 1.7 5.4 1.2 3.6 4.0 369.61983 15.5 3.0 0.8 2.1 0.9 2.6 1.2 286.31984 14.7 2.6 0.8 3.0 1.1 3.2 1.2 238.41985 11.5 2.7 1.3 4.6 1.8 3.4 1.0 174.41986 12.7 3.1 1.5 7.0 1.3 2.6 0.9 194.71987 11.0 2.9 1.0 8.2 1.3 3.3 1.2 218.71988 12.7 4.2 1.3 11.5 1.4 2.6 1.3 256.71989 12.3 5.0 1.3 14.6 1.2 3.9 2.0 193.41990 7.9 4.8 1.9 10.3 1.2 3.0 3.6 176.51991 8.3 4.4 2.1 11.8 1.5 2.1 1.5 158.81992 7.1 4.4 1.7 19.6 1.0 3.2 1.4 149.31993 4.2 4.0 2.6 8.6 0.6 3.5 2.6 141.21994 4.1 3.8 3.2 12.1 2.0 2.9 2.0 157.01995 5.6 5.1 3.3 6.8 2.1 2.7 1.0 170.51996 5.6 5.3 4.4 10.6 2.0 2.3 1.4 180.51997 8.4 7.0 5.8 15.7 1.8 1.1 1.2 176.51998 6.8 4.8 6.4 3.0 1.6 0.0 1.3 109.01999 7.4 3.7 5.8 5.8 1.3 0.0 1.1 144.4
1 “Nearshore” includes non-rockfish species caught in nearshore areas (e.g., California sheephead, white croaker, white seabass).

57
CALIFORNIA DEPARTMENT OF FISH AND GAMEDecember 2001
California’s Living Marine Resources:A Status Report
Hum
an Ecosystem D
imension
Table II-3. Average annual landings and ex-vessel value during 1995-1999, by area and major species group.
Northern California Species Group Pounds x 1000 Percent (Base Year $=1999) PercentGroundfish 30,233.7 57% 13,564.4 38%Crab 8,067.0 15% 13,257.6 37%Shrimp 6,425.7 12% 3,531.2 10%Urchin 3,321.6 6% 2,724.9 8%Albacore/Other Tuna 1,105.3 2% 951.8 3%All Else 3,402.0 7% 1,467.9 4%Total 52,555.3 100% 35,497.8 100%
Central California Species Group Pounds x 1000 Percent (Base Year $=1999) PercentGroundfish 22,771.8 27% 14,985.8 32%Herring 10,431.2 12% 8,800.1 19%Salmon 4,131.5 5% 6,939.9 15%Crab 2,428.0 3% 5,135.0 11%Prawn 335.6 0% 2,279.0 5%Shark/Swordfish 758.9 1% 2,093.4 5%Coastal Pelagics 32,000.3 38% 1,499.2 3%Albacore/Other Tuna 1,618.6 2% 1,448.6 3%Shrimp 1,912.5 2% 1,314.0 3%Market Squid 7,709.4 9% 1,197.8 2%All Else 1,192.4 1% 1,181.2 2%Total 85,290.2 100% 46,874.0 100%
Southern California Species Group Pounds x 1000 Percent (Base Year $=1999) PercentMarket Squid 131,468.9 45% 19,344.8 26%Albacore/Other Tuna 30,924.4 11% 15,662.8 21%Urchin 13,057.8 5% 12,906.9 18% Coastal Pelagics 104,979.2 36% 5,261.4 7%Shark/Swordfish 2,059.3 1% 5,229.5 7%Lobster 683.1 0% 5,174.6 7%Groundfish 2,007.4 1% 3,382.5 5%Prawn 915.9 0% 2,813.2 4%Crab 891.2 0% 1,067.1 1%All Else 2,237.8 1% 2,974.6 4%Total 289,225.0 100% 73,817.4 100%
Total California Species Group Pounds x 1000 Percent (Base Year $=1999) PercentGroundfish 55,012.9 13% 31,932.7 20%Market Squid 139,187.8 33% 20,546.4 13%Crab 11,386.1 3% 19,459.6 13%Albacore/Other Tuna 33,648.2 8% 18,063.1 12%Urchin 17,040.0 4% 16,151.1 10%Herring 10,628.9 2% 8,910.9 6%Shark/Swordfish 2,915.3 1% 7,609.2 5%Salmon 4,348.7 1% 7,347.7 5%Coastal Pelagics 137,003.8 32% 6,764.9 4%Lobster 683.2 0% 5,175.5 3%Prawn 1,261.4 0% 5,157.7 3%Shrimp 8,373.9 2% 4,876.8 3%Abalone 121.7 0% 1,205.1 1%All Else 5,458.6 1% 2,988.4 2%Total 427,070.5 100% 156,189.2 100%

58
CALIFORNIA DEPARTMENT OF FISH AND GAMEDecember 2001
California’s Living Marine Resources:A Status Report
Hum
an Ecosystem D
imension
Table II-4. Number of vessels that make commercial landings in California, categorized according to whether or not they also make landings in Oregon or Washington, 1981-1999.
Year CA Only CA & OR CA & WA CA, OR & WA Total1981 5,832 787 135 143 6,8971982 5,762 555 106 130 6,5531983 5,257 396 83 94 5,8301984 4,779 261 103 31 5,1741985 4,451 235 87 37 4,8101986 4,305 365 106 69 4,8451987 4,162 352 104 76 4,6941988 4,204 354 135 92 4,7851989 4,376 309 125 64 4,8741990 4,155 273 122 48 4,5981991 4,032 214 102 40 4,3881992 3,536 170 118 46 3,8701993 3,271 196 93 58 3,6181994 3,102 161 107 52 3,4221995 3,074 184 83 35 3,3761996 2,994 205 74 30 3,3031997 2,857 190 96 20 3,1631998 2,505 119 51 24 2,6991999 2,495 128 45 22 2,690
Table II-5. Number of vessels by principal area, categorized according to whether or not they also make landings outside their principal area, 1981-1999. Principal Area=Northern CA Principal Area=Central CA Principal Area=Southern CA No.CA No.& Other Cen.CA No.& So.& Other So.CA So.& OtherYear Only Cen. Comb. Total Only Cen. Cen. Comb. Total Only Cen. Comb. Total
1981 1920 311 25 2256 2488 259 82 19 2848 1635 135 23 17931982 1842 289 36 2167 2274 232 110 29 2645 1566 155 19 17401983 1472 141 10 1623 2269 190 139 21 2619 1325 159 35 15191984 1066 160 16 1242 2008 177 102 15 2302 1313 230 20 15631985 891 198 23 1112 2033 147 105 13 2298 1160 152 24 13361986 1127 198 20 1345 1935 164 108 16 2223 1112 121 26 12591987 951 241 57 1249 1843 244 99 21 2207 1025 132 23 11801988 940 211 49 1200 2035 250 101 16 2402 979 90 53 11221989 858 240 60 1158 2069 296 69 20 2454 1056 89 64 12091990 842 130 48 1020 2011 184 84 14 2293 1111 76 40 12271991 767 127 40 934 1944 189 82 18 2233 1080 101 27 12081992 597 71 83 751 1778 90 83 18 1969 998 90 47 11351993 605 94 65 764 1562 132 63 20 1777 954 73 42 10691994 521 101 33 655 1370 155 101 23 1649 958 107 42 11071995 470 76 33 579 1539 97 116 14 1766 903 96 21 10201996 507 112 24 643 1428 92 70 7 1597 929 95 25 10491995 512 68 24 604 1406 88 84 9 1587 858 86 18 9621998 445 76 17 538 1105 64 76 11 1256 806 64 17 8871999 459 59 14 532 1057 56 74 4 1191 846 98 11 955

59
CALIFORNIA DEPARTMENT OF FISH AND GAMEDecember 2001
California’s Living Marine Resources:A Status Report
Hum
an Ecosystem D
imension
Table II-6. Average annual number of boats that make California landings, ex-vessel revenue per boat from California landings, number and percent of boats earning less than $5,000 per year from California landings, and number and percent of boats accounting for 90 percent of ex-vessel value of aggregate landings, by principal area and time period. 1981-1985 1986-1994 1995-1999
Principal Area=Northern CA:Number of Boats 1,680 1,008 579Ex-Vessel Revenue Per Boat $24,500 $48,300 $60,800#(%) Boats Earning <$5K Per Year 983(59%) 386(37%) 162(28%)#(%) Boats Accting for 90% of Ex-Vessel Value
of Northern California Landings 419(25%) 341(35%) 236(41%)
Principal Area=Central CA:Number of Boats 2,542 2,134 1,479
Ex-Vessel Revenue Per Boat $20,800 $25,100 $30,100#(%) Boats Earning <$5K Per Year 1,420(56%) 967(46%) 627(43%)#(%) Boats Accting for 90% of Ex-Vessel Value
of Central California Landings 727(29%) 737(34%) 512(35%)
Principal Area=Southern CA:Number of Boats 1,630 1,201 988
Ex-Vessel Revenue Per Boat $126,000 $67,400 $74,900#(%) Boats Earning <$5K Per Year 682(42%) 402(33%) 256(26%)#(%) Boats Accting for 90% of Ex-Vessel Value
of southern California Landings 290(18%) 401(34%) 382(39%)
Total California:Number of Boats 5,853 4,344 3,046Ex-Vessel Revenue Per Boat $50,600 $41,800 $50,700#(%) Boats Earning <$5K Per Year 3,085(53%) 1,755(40%) 1,045(34%)#(%) Boats Accting for 90% of Ex-Vessel Value
of Total California Landings 1,119(20%) 1,375(32%) 1,072(35%)
Table II-7. Average annual 1995-1999 landings, ex-vessel value of landings, and vessel participation in major commercial sheries, by area.# VesselsMajor Northern CA Landings Value ($1000s, # Participating Participating AsFisheries (1000 lbs) Base Year=1999) Vessels Principal FisheryCrab trap 7,886.0 13,095.5 309 247Groundfish trawl 28,683.7 11,322.9 71 56Shrimp trawl 6,084.1 3,179.5 58 25Urchin dive 3,318.9 2,742.1 64 61Groundfish H&L 1,562.8 1,925.4 158 103Tuna H&L 966.4 837.6 43 17Salmon H&L 406.1 654.5 86 44Groundfish/misc. trap 363.9 459.4 35 16Shark/swordfish gillnet 102.0 308.9 9 4Herring 121.1 104.4 5 4
# VesselsMajor Central CA Landings Value ($1000s, # Participating Participating AsFisheries (1000 lbs) Base Year=1999) Vessels Principal FisheryGroundfish trawl 17,406.2 9,097.8 73 61Herring 10,014.2 8,585.5 149 136Salmon H&L 3,847.1 6,512.4 704 579Crab trap 2,564.3 5,209.2 207 127Groundfish H&L 4,056.2 4,710.2 520 415Prawn trawl 317.9 2,039.2 18 13Shark/swordfish gillnet 581.9 1,683.5 30 21Squid seine/other net 8,817.7 1,282.9 13 5Tuna H&L 1,470.1 1,248.1 123 44CPS seine 20,333.9 961.6 13 7Shrimp trawl 985.7 956.9 19 10Urchin dive 686.7 546.9 17 10Groundfish/misc. trap 153.1 382.5 34 13Abalone dive 31.8 313.1 9 8Prawn trap 34.4 249.2 8 3Shark/swordfish H&L 101.2 240.9 9 3

60
CALIFORNIA DEPARTMENT OF FISH AND GAMEDecember 2001
California’s Living Marine Resources:A Status Report
Hum
an Ecosystem D
imension
Table II-7 (continued).
# VesselsMajor Southern CA Landings Value ($1000s, # Participating Participating AsFisheries (1000 lbs) Base Year=1999) Vessels Principal FisherySquid seine/other ne t 129,556.2 19,150.2 87 70Urchin dive 13,007.9 12,835.5 223 207Tuna seine 23,001.5 9,644.1 21 10Tuna H&L 7,473.2 5,736.9 115 65CPS seine 115,869.4 5,671.8 46 23Lobster trap 680.7 5,157.5 202 168Shark/swordfish gillnet 1,053.9 2,548.2 80 50Groundfish H&L 1,588.5 2,193.8 205 157Shark/swordfish H&L 795.6 1,875.9 42 27Prawn trawl 745.3 1,679.9 27 19Groundfish/misc. net 810.8 1,232.3 58 31Crab trap 900.4 1,097.2 76 35Prawn trap 135.1 1,011.9 28 18Abalone dive 87.6 877.0 33 13Groundfish/misc. trap 219.1 663.2 66 19Shark/swordfish dive 119.3 632.0 24 20Groundfish trawl 255.0 525.3 32 20Cucumber dive 398.6 244.3 22 21Salmon H&L 89.8 171.1 18 7Cucumber trawl 236.4 167.1 12 5Shrimp other net 63.5 22.2 3 3
Table II-8. Average annual 1995-1999 landings and ex-vessel revenue per boat from the principal shery, from other California sheries and from Oregon and Washington sheries, by vessels’ principal area and principal shery.
Landings/Boat/Year (1000 Pounds) Ex-Vessel Revenue/Boat/Year ($1000s) Northern California Principal Other Principal OtherPrincipal Fisheries Fishery CA OR/WA Total Fishery CA OR/WA TotalCrab trap 26.0 17.1 9.8 52.9 43.8 12.7 8.8 65.2 Groundfish trawl 473.1 61.1 385.7 919.8 185.1 37.2 44.8 267.2Shrimp trawl 110.2 38.9 249.4 398.5 58.6 30.1 134.5 223.2Urchin dive 54.2 0.7 2.7 57.6 43.9 1.5 2.5 47.9Groundfish H&L 10.6 3.1 1.6 15.3 12.7 4.3 2.3 19.4Tuna H&L 27.1 2.7 30.6 60.5 24.0 3.6 28.3 55.9Salmon H&L 1.8 0.8 0.2 2.8 3.2 1.1 0.3 4.6Groundfish/misc. trap 10.8 3.7 3.5 18.0 14.8 5.1 6.3 26.2Shark/swordfish gillnet 13.2 10.3 107.6 131.0 42.3 11.3 102.9 156.5Herring 25.9 1.2 0.0 27.1 19.4 1.2 0.0 20.5Groundfish trawl 275.3 18.8 333.9 628.0 145.4 11.1 52.9 209.4 Herring 64.2 18.5 1.8 84.5 53.4 2.9 1.3 57.7Salmon H&L 5.3 1.4 1.9 8.6 9.0 1.8 2.3 13.1Crab trap 16.1 9.1 1.9 27.0 32.7 8.4 1.9 43.1Groundfish H&L 8.6 0.8 0.2 9.6 10.2 1.1 0.2 11.5Prawn trawl 23.3 44.7 87.4 155.4 153.8 34.0 46.3 234.1Squid seine/other net 573.8 479.3 0.0 1053.1 85.7 46.0 0.0 131.6Tuna H&L 17.1 2.7 17.9 37.6 14.4 4.0 16.7 35.2CPS seine 2030.9 334.9 0.0 2365.9 99.2 53.2 0.0 152.4Shrimp trawl 26.1 4.2 78.7 109.0 52.7 4.9 52.4 110.0Urchin dive 60.3 1.1 0.0 61.4 47.6 2.2 0.0 49.7Groundfish/misc. trap 8.1 2.2 0.0 10.3 20.8 4.3 0.0 25.1Abalone dive 2.3 2.0 0.1 4.4 22.5 2.1 0.1 24.7Prawn trap 8.1 16.2 0.9 25.2 59.8 12.6 0.5 72.8Shark/swordfish H&L 11.2 2.7 0.7 14.6 27.0 7.5 1.9 36.4

61
CALIFORNIA DEPARTMENT OF FISH AND GAMEDecember 2001
California’s Living Marine Resources:A Status Report
Hum
an Ecosystem D
imension
Table II-8 (cont.) Landings/Boat/Year (1000 Pounds) Ex-Vessel Revenue/Boat/Year ($1000s) Southern California Principal Other Principal OtherPrincipal Fisheries Fishery CA OR/WA Total Fishery CA OR/WA TotalSquid seine/other net 1516.9 674.7 5.2 2196.7 226.0 44.9 4.5 275.4Urchin dive 60.2 3.0 5.1 68.2 58.8 4.2 0.9 63.8Tuna seine 1882.1 1288.6 4.9 3175.6 806.4 104.0 4.1 914.6Tuna H&L 105.0 15.1 36.2 156.3 70.5 9.4 31.3 111.3CPS seine 2475.8 482.5 0.4 2958.8 132.0 89.5 0.1 221.6Lobster trap 3.7 3.8 0.1 7.6 28.2 6.4 0.1 34.7Shark/swordfish gillnet 16.4 23.5 8.3 48.2 42.9 19.7 7.1 69.7Groundfish H&L 8.9 1.7 0.3 11.0 12.2 1.4 0.3 13.9Shark/swordfish H&L 26.8 6.7 3.0 36.5 62.8 15.3 2.4 80.4Prawn trawl 32.5 9.2 56.5 98.2 79.4 11.6 12.2 103.2Groundfish/misc. other net 17.5 12.1 0.6 30.3 28.1 10.6 0.5 39.2Crab trap 15.1 1.4 0.0 16.6 18.3 4.7 0.0 23.0Prawn trap 6.1 2.6 0.5 9.1 47.4 9.1 0.4 56.9 Abalone dive 2.1 9.1 0.4 11.7 21.4 9.7 0.3 31.5Groundfish/misc. trap 4.6 2.9 0.0 7.5 14.0 7.2 0.0 21.3Shark/swordfish dive 5.2 1.2 0.0 6.3 27.3 1.8 0.0 29.1Groundfish trawl 9.0 8.0 7.9 24.9 20.9 6.0 2.7 29.6Cucumber dive 2.6 4.0 0.5 32.9 15.1 9.8 0.0 24.8
Table II-9. Number of sh dealers by principal area, categorized according to whether or not they also receive landings outside their principal area, 1981-1999.
Principal Area=Northern CA Principal Area=Central CA Principal Area=Southern CA
No.CA No.& Other Cen.CA No.& So.& Other So.CA So.& Other CAYear Only Cen. Comb. Total Only Cen. Cen. Comb. Total Only Cen. Comb. Total Dealers1981 81 3 7 86 182 15 12 4 213 201 17 2 220 5191982 77 8 1 86 209 9 11 4 233 227 18 2 247 5661983 67 6 0 73 221 14 12 4 251 217 27 4 248 5721984 53 11 0 64 211 8 9 4 232 207 28 2 237 5331985 59 9 0 68 200 9 19 2 230 187 35 1 223 5211986 65 7 2 74 213 4 18 3 238 188 24 6 218 5301987 103 12 4 119 420 22 17 4 463 275 29 5 309 8911988 102 6 2 110 361 21 15 2 399 272 29 10 311 8201989 108 10 5 123 329 15 12 5 361 294 37 11 342 8261990 85 11 5 101 322 14 21 2 359 285 34 12 331 7911991 85 12 3 100 312 21 19 6 358 290 26 9 325 7831992 85 10 6 101 307 21 24 11 363 257 26 15 298 7621993 104 14 4 122 318 21 21 5 365 237 31 17 285 7721994 98 14 12 124 333 24 27 9 393 331 59 15 405 9221995 54 14 12 80 284 9 27 6 326 292 37 8 337 7431996 88 13 6 107 274 19 18 6 317 267 30 12 309 7331997 89 24 4 117 301 17 18 8 344 297 30 7 334 7951998 78 19 6 103 360 16 19 5 400 312 29 10 351 8541999 120 16 7 143 339 11 13 3 366 328 43 8 379 888

62
CALIFORNIA DEPARTMENT OF FISH AND GAMEDecember 2001
California’s Living Marine Resources:A Status Report
Hum
an Ecosystem D
imension
Table II-10. Average annual number of sh dealers, ex-vessel value of California landings receipts per dealer, number and percent of dealers accounting for less than $5,000 per year in California landings receipts, and number and percent of dealers accounting for 90 percent of ex-vessel value of aggregate landings receipts, 1981-1986 and 1987-1999, by dealers’ principal area. 1981-1986 1987-1999Principal Area – Northern CA: Number of Dealers 75 112 Ex-Vessel Value of CA Landings Receipts/Dealer $542,700 $380,300 #(%) Dealers With<$5K Per Year in CA Receipts 18(23%) 52(46%) #(%) Dealers Accounting for 90% of Ex-Vessel Value of Northern California Landings 25(33%) 22(20%)
Principal Area – Central CA: Number of Dealers 233 370 Ex-Vessel Value of CA Landings Receipts/Dealer $246,700 $138,800 #(%) Dealers With<$5K Per Year in CA Receipts 76(33%) 186(50%) #(%) Dealers Accounting for 90% of Ex-Vessel Value of Central California Landings 50(21%) 58(16%)
Principal Area – Southern CA: Number of Dealers 239 344 Ex-Vessel Value of CA Landings Receipts/Dealer $805,500 $233,900 #(%) Dealers With<$5K Per Year in CA Receipts 69(29%) 131(38%) #(%) Dealers Accounting for 90% of Ex-Vessel Value of southern California Landings 28(12%) 55(16%)
All California: Number of Dealers 547 825 Ex-Vessel Value of CA Landings Receipts/Dealer $531,500 $209,500 #(%) Dealers With<$5K Per Year in CA Receipts 163(30%) 369(45%) #(%) Dealers Accounting for 90% of Ex-Vessel Value of Total California Landings 103(19%) 134(16%)
Table II-11. Volume and value of imports and exports of edible sh products at California customs districts and at all United States customs districts, by year, 1989-1999. Imports Exports $Millions $Millions Millions of Pounds (Base Year=1999) Millions of Pounds (Base Year=1999)
Year Calif. U.S. Calif. U.S. Calif. U.S. Calif. U.S. 1989 569.8 3,243.0 1,636.7 6,863.7 106.6 1,406.0 255.2 2,940.81990 627.4 2,884.6 1,808.6 6,289.9 99.2 1,947.3 231.7 3,463.11991 687.0 3,014.8 1,895.1 6,595.2 131.6 2,058.6 260.1 3,669.51992 710.3 2,894.0 2,015.5 6,491.3 105.2 2,087.6 223.6 3,942.71993 708.9 2,917.2 1,948.3 6,477.0 86.7 1,986.0 216.6 3,407.31994 777.1 3,034.8 2,325.8 7,207.3 135.9 1,978.5 284.8 3,390.61995 729.8 3,066.5 2,230.8 7,217.5 183.8 2,047.2 293.8 3,466.81996 759.6 3,169.8 2,222.9 7,017.3 218.7 2,112.1 281.8 3,161.91997 832.0 3,338.8 2,533.5 7,961.2 248.3 2,018.9 269.7 2,785.51998 911.1 3,647.0 2,513.8 8,289.2 142.6 1,663.9 158.9 2,291.81999 979.0 3,887.9 2,471.5 9,013.9 285.4 1,961.1 232.3 2,848.5

63
CALIFORNIA DEPARTMENT OF FISH AND GAMEDecember 2001
California’s Living Marine Resources:A Status Report
Hum
an Ecosystem D
imension
Table III-1. Average annual marine recreational shing effort and harvest during 1998-1999 in southern and central/northern California, by shing mode (1000s of sh).
1000s of Landed Released OtherArea/Fishing Mode Angler Trips Whole Alive Disposition Total
Southern California Man-made 624 837 644 233 1,714 Beach 281 327 247 17 590 CPFV 641 1,733 973 262 2,968 Private 1,324 1,960 4,075 211 6,246 Total 2,869 4,857 5,939 723 11,518
Central/Northern California Man-made 440 533 192 67 792 Beach 344 1,582 206 17 1,805 CPFV 168 1,131 122 171 1,423 Private 921 1,459 648 205 2,311 Total 1,872 4,705 1,168 460 6,331
Total California Man-made 1,064 1,370 836 300 2,506 Beach 625 1,909 453 34 2,395 CPFV 808 2,864 1,095 433 4,391 Private 2,245 3,419 4,723 416 8,557 Total 4,741 9,562 7,107 1,183 17,849
Source: Marine Recreational Fishery Statistics Survey.Includes harvests in U.S. waters only. “Other Disposition” refers to fish used as bait, filleted, given away or discarded dead. All landings are in 1000s of fish.
Table III-2. Average annual marine recreational harvest (excluding sh released alive) during 1998-1999 in southern and central/northern California, by shing mode and species category. Southern California Central/Northern CaliforniaSpecies Category 1000s of Fish (%) Species Category 1000s of Fish (%)–––––––––––––––––––––––––––––––––––––––– Man-Made –––––––––––––––––––––––––––––––––––––––––Tuna/mackerel 413 (39%) Silversides 185 (31%)Croaker 204 (19%) Surfperch 164 (27%)Silversides 150 (14%) Croaker 78 (13%)Herring 145 (14%) Herring 61 (10%)Surfperch 71 (7%) Anchovy 47 (8%)Other 87 (8%) Other 65 (11%)Total 1,070 (100%) Total 600 (100%)
–––––––––––––––––––––––––––––––––––––––––– Beach ––––––––––––––––––––––––––––––––––––––––––Surfperch 218 (63%) Smelt 1,145 (72%)Croaker 59 (17%) Surfperch 343 (21%)Silversides 24 ( 7%) Silversides 41 (3%)Sea chub 16 (5%) Other 70 (4%)Other 27 (8%) Total 1,599 (100%)Total 344 (100%)
–––––––––––––––––––––––––––––––––––––––––– CPFV ––––––––––––––––––––––––––––––––––––––––––Rockfish 668 (33%) Rockfish 1,204 (92%)Sea basses 313 (16%) Salmon 50 (4%)Tuna/mackerel 281 (14%) Greenling 21 (2%)Pacific barracuda 269 (13%) Other 27 (2%)Calif scorpionfish 151 (8%) Total 1,302 (100%)Other 313 (16%)Total 1,995 (100%)
–––––––––––––––––––––––––––––––––––––––– Private Boat –––––––––––––––––––––––––––––––––––––––Sea basses 502 (23%) Rockfish 1,034 (60%)Tuna/mackerel 379 (17%) Tuna/mackerel 89 (5%)Rockfish 328 (15%) Croaker 85 (5%)Pacific barracuda 192 (9%) Flatfish 80 (5%)Jacks 168 (8%) Striped bass 70 (4%)Croaker 156 (7%) Greenling 68 (4%)Flatfish 125 (6%) Salmon 55 (3%)Calif scorpionfish 86 (4%) Other 237 (14%)Other 235 (11%) Total 1,718 (100%)Total 2,171 (100%)
Source: Salmon harvest estimates obtained from DFG’s Ocean Salmon Project. All other harvest estimates obtained from Marine Recreational Fishery Statistics Survey.

64
CALIFORNIA DEPARTMENT OF FISH AND GAMEDecember 2001
California’s Living Marine Resources:A Status Report
Hum
an Ecosystem D
imension
Table III-3. Estimated average annual expenditures by marine anglers during 1998-1999 in southern and central/northern California ($millions, base year=1999), by expenditure category.
Expenditure Category Southern CA Northern CA Total CA
Trip-Related Expenses Man-Made $ 18.1 $ 13.2 $ 31.3 Beach 9.8 15.1 24.9 CPFV 81.4 17.0 98.4 Private 92.7 62.6 155.3Total $202.0 $107.9 $309.9
Licenses/Fishing Gear 54.3 29.0 83.3 Boat-Related Expenses 74.1 39.6 113.7Grand Total $330.4 $176.5 $506.9
Source: Trip-related expenses based on average annual 1998-1999 effort estimates (Table III-1) and estimates of average expenditures per trip by fishing mode derived from Thomson and Crooke (1991) for southern California and from Thomson and Huppert (1987) for central/northern California and corrected for inflation to 1999 dollars. License/gear and boat-related expenses based on the observation from Thomson and Crooke (1991) that license/gear and boat-related expenses are 27 percent and 37 percent respectively of total trip expenditures in southern California, and extrapolating that result to central/northern California.
Table III-4. Number of CPFVs participating in the marine recreational shery during 1980-1998, by vessels’ principal shing area.
Year NoCA CenCA U.S.Only SoCA:U.S. &Mex MexOnly Total All Boats1980 14 142 83 57 6 147 3031981 15 125 85 52 14 151 2911982 20 136 92 50 9 151 3071983 21 145 96 52 6 154 3201984 19 140 80 65 17 162 3211985 17 142 78 58 19 155 3141986 18 140 82 53 7 142 3001987 22 134 76 45 10 131 2871988 27 132 102 47 8 157 3161989 41 146 83 55 14 152 3391990 32 135 87 45 11 143 3101991 21 125 87 23 15 125 2711992 16 120 91 39 3 133 2691993 16 107 90 32 6 128 2511994 13 107 98 34 7 139 2591995 13 99 117 47 6 170 2821996 10 105 121 47 6 174 2891997 11 105 125 66 4 195 3111998 13 95 114 73 5 192 300
Source: CPFV logbooks. Southern California CPFVs distinguished according to whether they fish in U.S. and/or Mexican waters.

65
CALIFORNIA DEPARTMENT OF FISH AND GAMEDecember 2001
California’s Living Marine Resources:A Status Report
Hum
an Ecosystem D
imension
Table III-5. Number of CPFV angler trips, by year and area.
Year NoCA CenCA SoCA Total U.S. Waters Mexican Waters Grand Total1980 5,665 204,146 492,290 702,101 59,739 761,8401981 6,948 205,380 556,721 769,049 61,460 830,5091982 6,694 213,206 503,280 723,180 52,756 775,9361983 8,024 180,898 433,514 622,436 69,210 691,6461984 6,577 188,275 415,036 609,888 91,666 701,5541985 11,591 210,894 413,102 635,587 81,601 717,1881986 11,064 189,780 407,614 608,458 51,755 660,2131987 13,251 208,989 396,309 618,549 59,862 678,4111988 12,496 217,284 427,610 657,390 53,967 711,3571989 15,595 226,333 420,976 662,904 74,681 737,5851990 14,724 222,149 474,761 711,634 57,433 769,0671991 14,179 175,329 434,945 624,453 37,100 661,5531992 7,586 164,792 407,831 580,209 55,258 635,4671993 5,617 169,566 377,125 552,308 40,626 592,9341994 4,949 161,637 364,774 531,360 51,765 583,1251995 6,806 169,402 408,547 584,755 58,074 642,8291996 6,021 137,312 435,940 579,273 74,846 654,1191997 5,456 165,899 554,117 725,472 99,304 824,7761998 6,175 133,133 483,420 622,728 106,504 729,232
Source: CPFV logbooks. “Mexican waters” pertains to trips departing from southern California ports to fish in Mexican waters.
Table III-6. Landings on CPFV shing trips (1000s of sh), by year and area.
Year NoCA CenCA SoCA Total U.S. Waters Mexican Waters Grand Total1980 24.2 1,545.4 4,517.1 6,086.6 321.2 6,407.81981 51.9 1,747.0 4,267.0 6,065.9 248.6 6,314.51982 42.4 1,781.8 3,363.5 5,187.7 182.9 5,370.61983 60.9 1,654.9 2,547.0 4,262.7 362.2 4,624.91984 33.5 1,485.3 2,249.5 3,768.3 404.0 4,172.31985 53.5 1,364.3 2,471.2 3,889.0 290.1 4,179.11986 41.6 1,198.9 2,617.9 3,858.4 217.1 4,075.51987 50.4 1,314.3 2,485.0 3,849.7 256.2 4,105.91988 56.9 1,390.1 2,651.2 4,098.2 254.2 4,352.41989 82.4 1,574.1 2,618.9 4,275.4 321.6 4,597.01990 111.1 1,606.5 2,824.5 4,542.1 243.5 4,785.61991 73.0 1,345.9 2,694.5 4,113.4 175.9 4,289.21992 69.7 1,526.7 2,275.7 3,872.1 219.6 4,091.71993 31.4 1,312.3 2,112.2 3,455.9 166.7 3,622.61994 30.8 1,049.1 1,945.7 3,025.6 189.4 3,215.11995 43.9 923.2 1,980.0 2,947.1 222.8 3,169.81996 32.1 743.7 2,350.6 3,126.5 249.0 3,375.51997 43.4 957.3 2,356.1 3,536.8 384.2 3,921.01998 53.7 882.8 2,008.1 2,944.6 377.9 3,322.5
Source: CPFV logbooks. “Mexican waters” pertains to harvests on trips that depart from southern California ports to fish in Mexican waters.
66
CALIFORNIA DEPARTMENT OF FISH AND GAMEDecember 2001
California’s Living Marine Resources:A Status Report
Hum
an Ecosystem D
imension
Table III-7. Annual number of CPFV boat and angler trips in 1995-1998, by area and trip type. Area/Trip Type 1995 1996 1997 1998 Avg.
Northern CaliforniaTotal Fishing Trips: 6,806 6,021 5,456 6,175 6,115 Salmon 2,948 3,264 1,808 1,554 2,394 Rockfish/lingcod 3,222 2,161 2,839 3,410 2,908 Salmon/rockfish/lingcod 321 519 553 1,034 607 Other/unspecified 314 77 256 177 207Total Dive Trips 26 15 0 10 13NoCA Total 6,832 6,036 5,456 6,185 6,128
Central CaliforniaTotal Fishing Trips: 169,402 137,312 165,899 133,133 151,437 Salmon 86,899 56,567 78,202 48,645 67,578 Rockfish/lingcod 58,008 52,865 52,233 51,795 53,725 Salmon/rockfish/lingcod 5,098 3,408 5,135 3,777 4,354 Strbass/sturgeon 2,522 3,720 5,572 5,349 4,291 Shark 1,012 526 628 428 648 Tuna 140 1,127 6,500 4,014 2,945 Other/unspecified 15,723 19,099 17,629 19,125 17,894Total Dive Trips 1,126 1,249 716 38 782CenCA Total 170,528 138,561 166,615 133,171 152,219
Southern CaliforniaTotal Fishing Trips-CA: 408,547 435,940 554,117 483,420 470,506 Rockfish/lingcod 31,684 34,923 30,525 26,595 30,932 Tuna 12,006 2,992 13,586 18,124 11,677 Other/unspecified 364,857 398,025 510,006 438,701 427,897Total Fishing Trips-Mex: 58,074 74,846 99,304 106,504 84,682 Tuna 35,691 34,692 56,029 62,164 47,144 Other/unspecified 22,383 40,154 43,275 44,340 37,538Total Dive Trips-CA 37,089 43,128 44,938 33,014 39,542Total Dive Trips-Mex 446 790 394 659 572SoCA Total 504,156 554,704 698,753 623,597 595,303
Source: CPFV logbooks.