Embed Size (px)
Citation preview

University of Minnesota and USGS-Biological Resources Division Minnesota Cooperative Fish and Wildlife Research Unit and Cooperative Park Studies Program
BRD-2000-1
Human Dimensionsof Natural Resource
Management:Emerging Issues andPractical Applications


Human Dimensions of NaturalResource Management:
Emerging Issues and Practical Applications
WorkshopFebruary 1-3, 2000Earle Brown Center
University of MinnesotaSt. Paul Campus
David C. Fulton, Kristen C. Nelson, Dorothy H. Anderson, andDavid W. Lime, editors
Minnesota Cooperative Fish and Wildlife Research UnitDepartment of Fisheries and Wildlife
andCooperative Park Studies Program
Department of Forest Resources
University of MinnesotaSt. Paul, Minnesota
December 2000

i
Contents
Acknowledgements . . . . . . . . . . . . . . . . . . . . . . . . . . . . . . . . . . . . . . . . . . . . . . . . . . . . . ii
Priority Issues and Future Directions in Human Dimensions Research . . . . . . . . . . . . . 1David C. Fulton, Kristen C. Nelson, Dorothy H. Anderson, and David W. Lime
Human Dimensions of Visitor Issues . . . . . . . . . . . . . . . . . . . . . . . . . . . . . . . . . . . . . . . . 9Facilitating high-quality visitor experiences at national wildlife refuges . . . . . . . . . . 11
Joseph W. RoggenbuckDefining and establishing indicators and standards of quality . . . . . . . . . . . . . . . . . . 30
Robert E. ManningCommunication campaigns for wildlife management . . . . . . . . . . . . . . . . . . . . . . . . 40
Alan D. BrightEstimating visitor use . . . . . . . . . . . . . . . . . . . . . . . . . . . . . . . . . . . . . . . . . . . . . . . 47
John B. DavisA decision process to maintain the quality of recreation resources and visitor experiences . . . . . . . . . . . . . . . . . . . . . . . . . . . . . . . . . . . . . . . . . . . . . . 58
David W. Lime, Dorothy H. Anderson, and Theresa L. WangApplying outcomes-based management to fish- and wildlife-based recreation . . . . . 70
David C. Fulton
Human Dimensions of Community Issues . . . . . . . . . . . . . . . . . . . . . . . . . . . . . . . . . . . 81Measuring the social dimensions of managing natural resources . . . . . . . . . . . . . . . 83
Cornelia Butler FloraResearch on minorities, social justice, and natural resource management: An agenda and three examples . . . . . . . . . . . . . . . . . . . . . . . . . . . . . . . . . . . . . . . 100
Patrick C. WestApplied demography and natural resource management: A perspective on social change along the Upper Mississippi Flyway . . . . . . . . . . . . . . . . . . . . . . 105
Donald R. Field, Roger Hammer, Tracy Kuczenski, Paul Voss, andAlice Hagen
Community relations, conflict management, and collaborative partnerships . . . . . . 114Kristen C. Nelson and Barry W. Steiglitz
Environmental values related to fish and wildlife lands . . . . . . . . . . . . . . . . . . . . . 126David N. Bengston
Social impact assessment: How we assess the effects of our actions on visitors, neighbors, and other stakeholders . . . . . . . . . . . . . . . . . . . . . . . . . . . . . . 133
Stewart D. Allen
Workshop Participants . . . . . . . . . . . . . . . . . . . . . . . . . . . . . . . . . . . . . . . . . . . . . . . . . 143

ii

Acknowledgments
Seventy-six managers, researchers, and administrators met at the University ofMinnesota February 1-3, 2000, to discuss human dimensions issues confrontingdecisionmakers in Region 3 of the U.S. Fish and Wildlife Service (USFWS) as well asother public land management agencies in the Midwest. In the Human Dimensions ofNatural Resource Management workshop, the primary objective was to identify,describe, and begin to prioritize critical social issues in need of solutions. Anotherworkshop objective was to educate participants about new research and ideasconcerning human dimensions and resource management.
The workshop was collaboratively sponsored and funded by the USFWS, the U.S.Geological Survey-Biological Resources Division (USGS-BRD), and the University ofMinnesota, College of Natural Resources and Agricultural Experiment Station. Particular acknowledgment for aiding in the funding of the workshop goes to WilliamF. Hartwig, Regional Director, Region 3, USFWS; Ronald Kirby, Center Director,Northern Prairie Wildlife Research Center, USGS-BRD; and B. Ken Williams,Cooperative Research Units Program, USGS-BRD.
The workshop was planned by an interagency committee composed of members fromthe sponsoring partners—USFWS-Region 3, the USGS-BRD, and the University ofMinnesota. In April 1999 the steering committee began to guide the development andexecution of the workshop. Committee members included: Joan Guilfoyle, JohnSchomaker, Rick Schuldt, and Tom Worthington from Region 3, USFWS; RodSando, USFWS and MN Department of Natural Resources; and Dorothy H.Anderson, David C. Fulton, David W. Lime, Kristen C. Nelson, and Jerrilyn L.Thompson from the University of Minnesota, College of Natural Resources.
The organizers and sponsors of the workshop express their sincere appreciation to allthe participants who took time to attend and take part in the workshop discussions. Particular acknowledgment goes to the authors and coauthors that presented a sessionand prepared papers for these proceedings. Their presentations at the workshop andpapers reflect a wide range of experiences concerning human dimensions of naturalresource planning and management. The free exchange of ideas at the workshop ledto a lively dialogue and contributed greatly to the development of a prioritized list ofinformation and research needs that would aid resource management now as well as inthe years ahead. These needs are specified in the first paper.
We would like to thank staff and graduate and undergraduate student volunteers forhelping facilitate the nominal group sessions and taking notes during the workshop.Thanks to Cynthia Warzecha, Research Fellow; Joanna Rosendahl, undergraduateresearch assistant; and to graduate students Leigh Currie, Erin Dougherty, JohnEpton, Tom Fish, Samantha Hayes, E. B. James, Chad Pierskalla, and Liz Weaver

iviv Acknowledgments
for serving as session and room hosts and “other duties as assigned.” You helpedmake this successful workshop!
A special thanks is due to Jerrilyn Thompson in the Department of Forest Resourcesand Teri Kanikula in the Department of Fisheries and Wildlife at the University ofMinnesota for taking leadership in making arrangements and coordinating all phases ofthe workshop and preparation of these proceedings for publication.
Special thanks also is due to Clara M. Schreiber, Word Processing Supervisor in theDepartment of Forest Resources, who helped design the layout of this publication andreformatted and retyped all of the papers appearing herein.

1Fulton, D. C., K. C. Nelson, D. H. Anderson, and D. W. Lime, eds. 2000. Priority issues and futuredirections in human dimensions research. In Human Dimensions of Natural Resource Management: Emerging Issues and Practical Applications. St. Paul, MN: Cooperative Park Studies Program, University ofMinnesota, Department of Forest Resources.
2Assistant Professor and Assistant Leader, Wildlife, USGS Biological Resources Division, MNCooperative Fisheries and Wildlife Research Unit, University of Minnesota, Department of Fisheries andWildlife, 200 Hodson Hall, 1980 Folwell Avenue, St. Paul, MN 55108. Assistant Professor, University ofMinnesota, Department of Forest Resources, 115 Green Hall, 1530 Cleveland Avenue North, St. Paul, MN 55108. Respectively, Professor and Leader, and Senior Research Associate, Cooperative Park StudiesProgram, University of Minnesota, Department of Forest Resources, 115 Green Hall, 1530 Cleveland AvenueNorth, St. Paul, MN 55108.
Priority Issues and Future Directions inHuman Dimensions Research1
David C. Fulton, Kristen C. Nelson, Dorothy H. Anderson, and David W. Lime2
Introduction
Workshop goals were twofold: (1) to identify, describe, and begin to prioritizeresearch issues related to social, or “human dimensions,” that confront managers anddecision makers in Region 3—U.S. Fish and Wildlife Service (USFWS), and (2) toprovide background information about human dimensions for USFWS employees andtheir colleagues from other federal and state natural resource and environmentalmanagement agencies.
Human dimensions research is the application of social science theory and methods tohelp understand the cultural, sociological, psychological, economic, biological, andphysical aspects of natural resource management and environmental problem solving. During the past 30 years, there has been a growing interest in the human dimensions ofnatural resources due to fundamental changes in the management environment. Forexample, natural resource managers face an increasingly complex managementenvironment that now includes many diverse public stakeholders who demand anactive role in planning and decision-making. Also, natural resource agencies typicallyhave a dual mission of protecting resources while providing benefits to the public. Forsuch reasons, most natural resource managers are now aware that solving naturalresource issues requires understanding the sociopolitical environment as well asunderstanding biological and ecological principles.
Despite the recognition that human dimensions information is important to managingnatural resources, most natural resource professionals still lack specific answers to thepractical question, “What can human dimensions information and research do for me?” The papers and other information presented in this volume begin to answer that

2 Priority Issues and Future Directions in Human Dimensions Research
question and provide future direction for natural resource professionals who want tobegin integrating social science information into planning and decision-making.
Workshop organization
The workshop was organized around two thematic areas: Human Dimensions ofVisitors’ Issues and Human Dimensions of Community Issues. The first day of theworkshop was devoted to the visitors’ issues theme, while the second day focused oncommunity issues. Plenary presentations each morning focused on providing anoverview of research and knowledge gaps related to each principal theme. Thesepresentations provided a starting point for small group discussions facilitated througha modified nominal group process to encourage discussion on the topic. The objectiveof these small group discussions was to identify USFWS research needs within eachworkshop theme. Following each small group session, workshop participants werereconvened and a representative of each small group presented a summary of thegroup’s ideas.
The workshop afternoons were devoted to concurrent presentations that providedmore in-depth discussion about topics introduced during the plenary presentations. While these sessions varied in format, each focused on issues and applicationspertinent to that day’s thematic area. The panel session on the final morning of theworkshop focused on opportunities and constraints in pursuing research and programsrelated to the human dimensions of natural resource within the USFWS and other stateand federal agencies.
Workshop products
These proceedings provide a means to distribute two products from the workshop:
1. State-of-knowledge papers from plenary and concurrent presentations2. Set of recommendations for USFWS management and administration
< Research needs< Research priorities
An evaluation of the workshop was performed and distributed earlier (Thompson et al.2000).
State-of-knowledge papers
The papers developed for the plenary and concurrent sessions are presented in theremaining sections of this report. These papers are organized around the two thematicareas developed for the workshop and their titles and content are summarized below.

Priority Issues and Future Directions in Human Dimensions Research 3
Human dimensions: Visitor issues
Six papers are presented addressing the general theme of the Human Dimensions ofVisitor Issues. In the plenary paper, Joe Roggenbuck (Virginia Polytechnic Instituteand State University) provides an overview of approaches and research for“Facilitating High-quality Visitor Experiences at National Wildlife Refuges.” Thispaper identifies the key approaches to understanding natural resource recreation andwhat characterizes high-quality recreation. In addition, the role refuge managers playin supporting quality recreation experiences is discussed and research and informationneeds on this topic are identified.
The remaining five papers (presented in concurrent sessions) focus on additionalinformation concerning research and application on the human dimensions of refugevisitors. Bob Manning (University of Vermont) provides an overview of the role ofdefining and establishing indicators and standards for providing quality recreationopportunities. Alan Bright (Colorado State University) highlights the key aspects ofcommunicating information concerning wildlife and wildlife recreation to the public viacommunications campaigns. John Davis (Southern Vermont College) summarizes thecurrent knowledge and techniques used for estimating visitor numbers and use levels. David W. Lime, Dorothy Anderson (University of Minnesota) and Theresa Wang(West Virginia University) describe a process for maintaining quality visitorexperiences as well as the biophysical resources that support such experienceopportunities. David Fulton (University of Minnesota) presents an outcomes-basedplanning framework for implementing management of quality recreation opportunitiesand experiences.
Human dimensions: Community issues
Cornelia Flora, in her plenary paper, discusses the research issues involved withmeasuring the community dimensions of managing natural resources with a focus onwhat sociological research can contribute to understanding refuge management. Sheprovides a concise review of the concept of capital and the role of refuges and refugemanagement in building or enhancing various forms of capital. Further, she describeshow sociological research can be used in planning, increasing progress, assessingperformance, and reaching potentials to increase our accountability in management.
Five additional papers (presented in concurrent sessions) focus on the humandimensions of community issues. Pat West (University of Michigan) develops anagenda for research about minorities, social justice, and natural resource management. Don Field (University of Wisconsin) provides the perspective of applied demographyin examining social change along the upper Mississippi. Kristen Nelson (University ofMinnesota) and Berry Steiglitz (USFWS) provide a review of conflict managementand community relations in the context of natural resource management. David

4 Priority Issues and Future Directions in Human Dimensions Research
Bengston (USDA Forest Service) examines environmental values related to fish and wildlife lands, and Stewart Allen (USFWS) provides a framework for conductingsocial impact assessments of actions on USFWS lands.
Priority issues and future directions
An important product from the workshop is identification of priority humandimensions research needs within Region 3, USFWS. The modified nominal groupsessions held after each plenary presentation were the primary means used to identifypriority research needs for both of the workshop thematic areas. Results of themodified nominal group sessions identified priority research needs for both the humandimensions of visitor and community issues.
The five nominal groups considering research and information needs related tounderstanding visitors were asked to address the following question: “What refugeproblems could be helped by knowing more about visitors?”
Common themes emerged from the lists enumerated by these groups (Table 1). Thesecommon themes include:
< How do we improve communication about the refuge system and its functions andbenefits?
< What research can help us improve the match between refuge services andproducts and visitor motivations, expectations and knowledge (aka Marketing)?
< How can we balance use and visitor impacts on the resource?
< How can we address conflicts among users?
< How do we improve local community support?
< What can be done to increase use/access for diverse publics?
< How can we develop funding for facilities and staff?
To identify research and information needs and priorities concerning communityissues, four separate nominal groups were asked, “What information do we need toenhance USFWS work with communities?” Common themes that emerged from thesediscussions (Table 2) include:
< How do we identify and define “community” relative to USFWS Refuges?

Priority Issues and Future Directions in Human Dimensions Research 5
Table 1. Research and information needs concerning human dimensions of visitor issues.
Question 1: What refuge problems could be helped by knowing more about visitors?
Group 1.1. Lack of public understanding of USFWS Refuge identity, functions, and past experiences with USFWS 2. Inadequate/non-existent information for visitors (e.g. orientation sites) 3. Poor visitor understanding of their impact (e.g. unleashed dogs, off-trail use, feeding wildlife, ORVs, horses,
trespassing) 4. Public expectations that conflict with management objectives (e.g., timber, burning, firearms) 5. Defining satisfactory/unsatisfactory visitor experiences 6. Defining what makes USFWS a good neighbor. 7. Multiple Use Conflicts
Group 2.1. The changing wants of the public and their misconception of what a refuge is and its appropriate use.2. Tailor management to match the wants and needs of visitors.3. Building congressional support and visitor ownership/support via volunteerism, public endeavors and lobbying.4. The lack of budgets or funding to develop programs displays or accessible facilities5. Conflict between users.6. Better relationships with and acceptance by the local community.7. Managing for the connection between visitor use and resource protection.
Group 3.1. Lack of funding to support facilities and staff2. Plans do not address user expectations3. Accessibility to special populations (e.g., language, economics, physical, etc.)4. Lack of recognition by the public5. Compliance with refuge regulations6. Programming that addresses needs of visitors7. Impacts of secondary uses on primary refuge purposes
Group 4.1. Marketing (mission, program support, funding healthy wildlife populations)2. Management resource allocation considering visitor expectations3. Influencing visitor expectations (tie with #4)4. Habitat protection (acquisition, easement, etc.)5. Lack of local support for refuge programs6. Measuring how effective USFWS is with its message7. Competition among users
Group 5.1. Balance visitor choice and resource protection2. Why do people come to refuges3. What refuge experiences most foster caring about nature4. How to deal with/conflicts between user groups/What changes in management would improve visitor
quality/Understanding institutional obstacles affecting visitor use5. How to market refuge to the public6. Measure visitor understanding of refuge purpose/Why don’t more minority groups visit refuges7. Disjunct between visitor perception of how they want to use resources and manager perception of how they want
to manage the resource
Source: From the Human Dimensions of Natural Resource Management Workshop, February 1-3, 2000.

6 Priority Issues and Future Directions in Human Dimensions Research
Table 2. Research and information needs concerning human dimensions of community issues.
Question 2: What information do we need to enhance USFWS work with communities?
Group 1.1. Who are “they”?—group relationships, leadership, goals2. How to identify and measure USFWS contributions/benefits (human capital, economic)3. Understanding of community values4. Community perception and knowledge USFWS5. USFWS fulfilling revenue sharing6. Whose other resources can we build with?7. Training in sociology/social psychology
Group 2.1. Training on building mutual goals with multiple stakeholders2. Who is the community?3. What are the perceived attitudes of the USFWS4. What does the community perceive as their assets and problems5. Who are the opinion leaders in the community6. Identify common values7. What does the community perceive as their desired future condition
Group 3.1. Real or perceived benefits and negatives of the resource or project to the community (tie with #2)2. Who (local, stare, federal, congressional, NGO’s, national, local, community, interest groups)
supports/opposes/is neutral toward proposal3. Community values, perceptions, expectations, needs, wants, and fears4. Future county, state, federal, and NGO directions and plans5. Who are political players at local/state/federal levels?6. Local opinion leaders and editors7. Community demographics and trends
Group 4.1. Identification of community leaders, supporters, and detractors2. Identify communities and stakeholders USFWS is dealing with3. Identify current conditions and future trends in communities’ economy, politics, and demographics4. Knowing what the goals of the refuge are5. Knowing community values, attitudes, and behaviors (why they live in the area)6. Community values, attitudes, and behaviors regarding USFWS goals/Goals of the local community7. Identify segments of community not currently served/Know effective communication media, content, style/Study
and evaluate refuge establishment/CCP processes
Source: From the Human Dimensions of Natural Resource Management Workshop, February 1-3, 2000.

Priority Issues and Future Directions in Human Dimensions Research 7
< Who are community opinion leaders (supporters/detractors) and what are theirideas and their influence on USFWS Refuge planning?
< What are current and future trends of community goals, values, attitudes, andbehaviors relative to USFWS Refuges?
< What are the shared goals and values USFWS and the community?
< What are the future trends in community demographics, economics, and politics?
< How do we measure social capital/benefits and negatives of USFWS refuges?
< Training is needed on collaborative processes with communities/stakeholders,conducting natural/social science research projects, and application of socialscience research.
The common themes identified by the small groups represent workshop participants’priorities for human dimensions research. These lists can be used as a starting pointfor initiating human dimensions research relevant to the needs of Region 3, USFWS. It should be noted that these lists highlight the common themes found among thenominal groups. Furthermore, the order of the common theme does not indicaterelative priority of the issues.
These themes also are relevant to the needs of all resource professionals who grapplewith understanding the human dimensions of resource management. This informationcan be used to begin prioritizing research issues related to social or human dimensionsin any agency, in any part of the country.
Opportunities for the future
The final workshop event involved a panel discussion among Bill Hartwig, USFWS,Regional Director, Region 3; Bill Schenk, NPS, Regional Director, Midwest Region;B. Ken Williams, USGS, Chief of the Cooperative Research Units; Darrell Lewis,Corps of Engineers, Chief of Natural Resource Management; and Barry Stieglitz,USFWS, Chief of Planning and Policy for Refuges.
Each panel participant provided a brief summary of issues concerning implementationof human dimensions research and practice in federal agencies. All speakers agreedthat understanding the human, or social, dimensions of natural resource managementwas a requirement for effective management decisions. Each also agreed the agencieswould continue to encourage human dimensions research and incorporate its resultsinto agency decision-making because it was necessary to do so. However, each alsoacknowledged that incorporating human dimensions into their agencies will be anincremental process requiring some time to accomplish.

8 Priority Issues and Future Directions in Human Dimensions Research
Three key strategies identified for furthering these efforts included: (1) more trainingand educational workshops focused on human dimensions for current agencyemployees, (2) recruiting and hiring more people with social science and other humandimensions backgrounds and creating jobs focused on these areas, and (3) supportingmore research projects and management programs focused on human dimensionsissues.
We believe the information and recommendations provided by the collected papers inthis volume will prove to be useful in provoking ideas and dialogue among resourcemanagers, planners, and policy makers about research and programs in the humandimensions arena. We hope the papers in this workshop proceedings reinforce thebelief that social science makes essential contributions to resource policy, planning,and management.
Literature cited
Thompson, J. L., J. M. Rosendahl, and D. H. Anderson. 2000. Human dimensions ofnatural resource management: Emerging issues and practical applications,workshop evaluation. Report to the Biological Resources Division, US GeologicalSurvey, Northern Prairie Wildlife Research Center, and US Fish and WildlifeService. St. Paul, MN: University of Minnesota, Department of ForestResources, Cooperative Park Studies Program. 36 pp.

9
Human Dimensionsof Visitor Issues

10

1Roggenbuck, J. W. 2000. Facilitating high-quality visitor experiences at national wildlife refuges. In Human Dimensions of Natural Resource Management: Emerging Issues and Practical Applications, eds.Fulton, D. C., K. C. Nelson, D. H. Anderson, and D. W. Lime. St. Paul, MN: Cooperative Park StudiesProgram, University of Minnesota, Department of Forest Resources.
2Professor, Department of Forestry, Virginia Polytechnic Institute and State University, CheathamHall, Blacksburg, VA 24061-0324.
Facilitating High-quality Visitor Experiencesat National Wildlife Refuges3
Joseph W. Roggenbuck4
Introduction
The general goal of this paper is to review and summarize past approaches tounderstanding natural resource recreation and to make recommendations forfacilitating high-quality visitor experiences at national wildlife refuges and other unitsof the U.S. Fish and Wildlife Service. More specific objectives are to:
< Identify the key approaches to understanding natural resource recreation;
< Identify the characteristics of high-quality natural resource recreation;
< Discuss the important person, social, and environmental and contextual variablesthat shape high-quality recreation;
< Discuss the role/capability of wildlife refuge managers to shape high-qualityexperiences; and
< Identify the general information/research needs to assess and increase the personal,group, and societal values of recreation on national wildlife refuges.
Defining natural resource recreation
Taking time to define what we mean by recreation seems at first glance to do theobvious. We all know what recreation is; it is fun. Engaging in natural resourcerecreation at a wildlife refuge is doing something fun that is dependent upon or shapedby wildlife values. But leisure theorists, recreation planners, and recreation providers,including wildlife refuge managers, have found that, while thinking of recreation as funhelps a bit, it fails to encompass the total meaning and value of recreation toindividuals, groups, and society at large. Some have suggested that fun is a necessarybut insufficient condition for an experience to be considered recreational. For

12 Facilitating High-quality Visitor Experiences
example, some have suggested that, in addition to being fun, the experience needs tobe re-creational of the mind, spirit, or body. Others have implied that for fun to beconsidered recreational, it must be an activity that has normative approval by society. In effect, it must be declared beneficial fun. Another complexity seems to be thatsome recreational experiences, or some parts of recreational experiences, do not seemlike fun. For example, sitting in a duck blind in a cold rain with no ducks flying hardlyseems like fun. But many duck hunters call that recreation, if not at the moment, thenmore likely when they reminisce about the experience from the warmth of their woodstoves in their homes. Also, two people can be engaging in the same recreationalactivity in the same setting, and one person may call it great fun, but the other personmay feel bored or anxious. Another common scenario is that a given person canengage in the same recreational activity in the same setting over multiple episodes, buthave somewhat different experiences each time. What a person brings to therecreational situation shapes in part the experience gained there. The human mindplays games with fun, and that makes it harder for us to understand recreation,measure it, and manage for it.
Thus, recreation seems a complex human activity. Leisure theorists continue to debateits meaning, function, and value. For the purposes of this paper, we view as criticalfour elements of recreation upon which most leisure theorists (e.g., Driver and Tocher1970) agree. First, recreation is an experience; it takes place in the minds, bodies, andspirits of individuals. Second, recreation is intrinsically motivated; it is done for itsown sake. Third, recreation involves personal and free choice. This means that therecreationist freely chooses the activity, and once engaged, has relative freedom topursue the activity as the individual chooses. Finally, the experience must beenjoyable. What defines enjoyment in recreation is also complex, and as we will see,different conceptions of recreation and leisure approach the study of enjoyment indifferent ways. For example, theorists who emphasize the cognitive aspects of leisuresuggest that the optimal experience of pleasure can be characterized as intense focuson a stimulus, an altered sense of time, and a loss of consciousness of the self (e.g., seeWalker et al. 1998). Theorists who focus on the affective components of leisure focuson such pleasurable moods as being joyful, happy, excited, calm, friendly, cheerful,energetic, active, and alert (e.g., see Hull and Michael 1995; Hull et al. 1992; Hull et al1996).
Recreation is thus an enjoyable experience, done for its own sake, freely chosen, andfreely acted out. Natural resource recreation represents a class of such enjoyableexperiences that occurs within, and is in some sense dependent upon, the naturalenvironment. For the purposes of this paper, natural resource recreation represents aclass of enjoyable experiences that occurs within wildlife refuges and is at leastpartially dependent on the wildlife values of the refuge.

3Some might argue that a fifth perspective, the economic approach, deserves consideration, andindeed one of the first textbooks on the study of outdoor recreation (i.e., Clawson and Knetsch 1966)represents this viewpoint. However, while the notions of rational positivism, economic man, and consumersovereignty have been powerfully influential in decisions on the supply of recreational goods and services inAmerica, in the author’s opinion, economists have not been big players in the development of leisure theoryand research.
Facilitating High-quality Visitor Experiences 13
Approaches to understanding and valuing outdoor recreation
Public policy discussion and scientific interest in the meanings and values of outdoorrecreation in the United States began in earnest in the 1960s with the publication of theOutdoor Recreation Resources Review Commission reports. Since then, four primaryperspectives have developed: recreation as supply of land and facilities; recreation asparticipation in activities; recreation as an experience; and recreation as personal,social and cultural, economic, and environmental benefits.5 Approaching the study ofrecreation as an experience, the dominant academic and scientific paradigm today, canbe further divided into three distinct but related perspectives: the experience outcomeapproach, the flow experience approach, and the lived and reflective experienceapproach.
Recreation as supply of land and facilities
Viewing recreation as acres of land or water, miles of trail or rivers, or number ofswimming pools and ice rinks has been common in the past. For example, professionalrecreation societies, the now defunct federal Bureau of Outdoor Recreation, states,counties, and cities published standards of how many acres of what kind of land orwater, how many miles of trail, and how many units of facilities were needed percapita for the population served. Leisure professionals typically developed thesestandards based on their own assessment of what was ideal or acceptable. Whatcriterion they used is uncertain, but presumably the amount of land and facilitiesalready being provided by the “better” recreation agencies served as a guide. Arecreation agency could then judge its success and develop future plans based on howit stood against the recreation standards.
While standards have some general value in assessment of the recreation servicedelivery system, they have little or no value in assessing the quality and amount of therecreation service delivered to people. The supply approach studies the wrongpopulation. It focuses on land, water, and facilities, not people. Recall that recreationis first and foremost an experience that occurs within the individual. Also, thepresumption in the supply approach is that more is better, but this is not necessarily thecase. For some kinds of recreation, fewer facilities are better. Finally, wildlife refugesexist for wildlife; counting wildlife refuge land as recreation land seems inappropriate

14 Facilitating High-quality Visitor Experiences
and to judge the success of the USFWS’s recreation program based on its supply ofland, water, and facilities. Thus, we will drop the supply view from further discussion.
Recreation as an activity
Viewing recreation as an activity is common, and it represents a marked improvementover the supply approach. At least it studies the right population, i.e., people. In thisapproach, recreation is considered doing activities that are considered fun. (There isalso a tacit assumption, at least in the public policy arena, that these fun activities are socially acceptable.) In the case of outdoor recreation, we all know what theseactivities are; they are activities like hiking, camping, bird watching, hunting, andfishing. From this perspective, the measure of success of an outdoor recreationdelivery system is the number of people engaged in the various activities, or better yet,the total amount of time that the number of people engaged in the various activities. The general assumption is that more people doing more recreation is better.
Given this perspective, recreation research and management agencies in the 1960s and1970s spent considerable effort to develop strategies and technologies to estimatenumber of visitors, visits, and recreation visitor days on recreation land. Resourcemanagement agencies still typically use the activity counts as their primary measure ofrecreation output and struggle to this day to increase the accuracy of their counts. Recreation planners also buy into the approach when they do general populationsurveys of participation rates in the various activities to estimate system output. Theyare also accepting the activity paradigm when they use participation rates andpopulation and other socioeconomic growth parameters to project recreation demandinto the future.
But the activity approach is a necessary but insufficient approach to understandingrecreation. It fails to measure the experience—a key element of what constitutesrecreation. From the visitor counts, we do not necessarily know what happens in themind, spirit, and body of the recreationist. We do not know whether the person has asatisfactory or high-quality experience. More is not necessarily better if individualrecreationists are increasingly dissatisfied with the experience. Activity counts bythemselves do not tell us whether all sectors of the population are being served, nor dothey tell us whether the experience gained is the type desired by the recreationprovider. For example, the USWFS presumably would not consider providing a largenumber of nonwildlife-dependent recreation visitor days an ideal target.
Recreation as an experience
By far the dominant approach to theoretical and practical understanding of recreationin academic circles in the last quarter century is the experience approach. Thisapproach focuses on what happens inside the individual during the recreationalengagement. Researchers of recreational engagement have typically studied the on-

Facilitating High-quality Visitor Experiences 15
site experience phase and have rarely included the anticipation and recollection phases. But since change, hopefully positive change, in the individual is the variable of interest,all phases of the experience would logically be of interest. With the experienceapproach, the measure of success of an outdoor recreation delivery system is thenumber of satisfactory or high-quality visitor experiences of the right type. Presumably, within legal and environmental constraints, the more of the right kind ofhigh-quality experiences, the better.
While there is widespread agreement that we should view recreation as an experience,debate has raged on about what is high-quality recreation, how to measure it, and howto manage for it. To a lesser extent, the research community has looked at the extentto which the experience is resource-dependent, and that issue is no less thorny. Threerelated but distinctive perspectives on studying (and presumably managing for)recreation experiences have evolved: the experience outcome approach, the flowexperience approach, and the lived and reflective experience approach.
The experience outcome approach. The experience outcome approach is themost researched, discussed, debated, and influential of all perspectives on recreationexperiences. Championed by Driver and his colleagues (e.g., see Driver and Tocher1970; Driver and Knopf 1977; Manfredo et al. 1983; Brown 1984; and Driver et al.1991), this approach basically suggests that people are motivated to engage inrecreation to fulfill needs that are unfulfilled during their nonleisure time. High-qualityrecreation exists when pre-existing needs or wants are satisfied by the leisureengagement. In early formulations, Driver based his conceptual model in personalitytheory (see Driver and Knopf 1977), and recreation engagements were seen assatisfying basic unmet needs of the individual. Thus, high sensation-seekingpersonalities would consistently tend to choose high adventure kinds of recreation.
However, this view of recreation seemed to be of little help in recreation resourcemanagement decisions (Driver et al. 1991), so Driver shifted the theoretical basis awayfrom the trait-like needs of personality types to the expectancy-valence theory ofhuman motivation and behavior (Lawler 1973, Ajzen 1985). This theory suggests thatpersons act to achieve certain outcomes, whether or what action is taken is shaped bythe attractiveness (the valence) of the outcome and the expectancy that taking anaction will achieve the desired outcome (the expectancy). The attractiveness orvalence of the outcome is shaped by unmet needs or wants. These needs can be basic,but the wants and needs can be learned and highly situational or contextual. Theexpectancy component of the model can also be seen as highly variable. Thus, theattractiveness of a given recreational resource or activity and the decision to pursue itcan be highly variable across individuals and within individuals across time.
For the model to have value for recreation resource planners and managers, otherassumptions about human behavior must be made. First, people are able to know theirwants or needs, they know what recreational opportunities are available, and they

16 Facilitating High-quality Visitor Experiences
know what activity/setting combinations have a high probability of meeting their wantsor needs. Second, the setting and/or activity do make a difference in whether a givenunmet need is satisfied. Third, people can and do make rational decisions to satisfytheir individual needs.
While some doubt that recreational choices are so rational (Williams 1985), Stewart(1998) recently criticized the experience outcome approach as viewing recreation astoo dispositional or trait-like, the approach has directly resulted in the most highlyvalued and frequently adopted innovation in recreation management in the last quartercentury, i.e., the Recreation Opportunity Spectrum (ROS) (Brown et al. 1978). Muchempirical work has shown that people often have different preferences (i.e., seekdifferent outcomes) when they choose to engage in recreation. These include suchexpected and valued outcomes as nature enjoyment, physical fitness, escape physicalstressors, outdoor learning, independence achievement, family bonding, makingfriends, and introspection (Driver et al. 1991). Some but not all these outcomes, orcombinations of outcomes, have been found to be dependent upon recreationactivity/setting combinations (Brown and Ross 1982; McLaughlin and Paradice 1980;Vogelsong et al. 1998; Shafer and Hammitt 1995; Floyd and Gramann 1997). TheROS provides a resource planning and classification scheme that describes the kinds ofexperiences most likely to be achieved in various land units, based upon thecombination of biophysical, social, and managerial conditions found there and theempirically established relationships between resource settings and experienceoutcomes.
The flow experience approach. The notion of recreation experiences as flow restson the contention that leisure offers opportunities for self-actualization that moreconstrained contexts do not (Kelly 1987). The psychologist Abraham Maslow definedself-actualization as “ . . . the full use and exploration of talents, capacities, andpotentialities” (Maslow 1970:150). He saw peak optimal experiences as moments ofgreatest maturity, individuation, and fulfillment (Maslow 1968, Csikszentmihalyi andKleiber 1991), and these moments were most conducive to self-actualization. Morerecently, leisure theorists have called these ideal states of consciousness or flowexperiences, because people in such enjoyable states feel like they are being carriedalong by a current (Csikszentmihalyi and Csikszentmihalyi 1988). Flow experiencesare thus seen as the most enjoyable and fulfilling experiences of one’s life, and idealrecreation or leisure can be judged on the extent to which it fosters flow.
Psychologists and theorists attempted to learn the essence of flow and what shapedflow through interviews with individuals who reported states of great joy whileengaged in such active forms of leisure as rock-climbing. Somewhat surprisingly,people from a variety of cultures engaging in a variety of recreational activitiesreported the same experiential states during their peak experiences. The universalcharacteristics associated with such enjoyable experiences were (1) a matching ofchallenges and skills, with (2) clear goals and immediate feedback, (3) a depth of

Facilitating High-quality Visitor Experiences 17
concentration that prevents worry and the intrusion of unwanted thoughts intoconsciousness, and (4) result in a transcendence of the self (Csikszentmihalyi andKleiber 1991). For example, a deer hunter might experience flow when the followingconditions apply. The hunter decides how many deer (or accepts the number therefuge manager suggests) are likely to be seen on a given day. By counting andkeeping track of the number of deer seen, the hunter has immediate feedback on thegoal. The density of the deer population and the characteristics of the forest provide achallenge that matches or perhaps slightly exceeds the hunter’s perceived skill level. Ifthe challenge far exceeds the hunter’s skill level, the hunter will become worried,frustrated, and anxious. If the hunter’s skill level exceeds the challenge, then thehunter will become bored. But if the challenge of the forest and the deer numbersmatch the hunter’s skill, then the hunter most likely begins to experience a depth ofconcentration on the activity at hand. Then the hunter begins to slip out of the dualityof consciousness typical of ordinary life, no longer an outside observer of the forestand the deer. Instead, the hunter feels as one with the forest and the deer. When thishappens, the individual has begun to experience flow. All irrelevant thoughts,anxieties, and fears of everyday life begin to slip away in this stage of highconcentration. In this state, the hunter has at least for the moment transcended theboundaries of self. The experience is so absorbing that the individual forgets theconfines of self-image and becomes part of a larger whole, in this case, a part of theforest. The individual is in flow. Finally, in this condition the hunter feels particularlyfree to grow. The hunter knows the deer hunt is not over-challenging (i.e., knows thegoals, the rules of the game, has clear feedback, has matched skills with the challenge),is not worried about self-image, and is free to try some new techniques. It is thisexperience of high concentration and absorption into the environment and the activity,of loss of a sense of the constraints of self, and feelings of freedom to grow that makesfor flow, self-actualization, or peak recreation. Of course, if the hunter does increasein skill through the freedom to grow and experiment, eventually the deer hunt willneed to be more challenging.
The interest in recreation as providing opportunities for flow or self-actualization, andtherefore as a condition to be highly valued, goes back a long way, perhaps even to theGreek philosophers (Hemingway 1988). The model was presented to me in my firstuniversity recreation course in the 1960s. Yet its potential to guide natural resourcerecreation policy, planning, and management remains largely untested. Only recentlyhave wildland recreation theorists and researchers begun to explore its usefulness inhelping us understand the meaning and value of adventure recreation (e.g., see Ewertand Hollenhorst 1989).
Recreation as a lived and reflective experience. This view of recreation as alived and reflective experience is not so much a new approach to understandingrecreation experiences as it is an extension and perhaps a critique of the twoexperience-based models described above. As such, it cannot yet be called a separateparadigm; it does not provide a new conceptual model of ideal recreation. Instead, its

18 Facilitating High-quality Visitor Experiences
main tenets are that a recreation experience is complex, dynamic, emergent, andembedded with personal stories (Stewart 1998). It in particular criticizes theexperience outcome approach, at least as it has come to be operationalized, forviewing recreation as too deterministic (i.e., too determined by dispositional traits ofthe individual or by the characteristics of the recreational setting), for focusing toomuch on predispositions and outcomes and not enough on the actual experience as itunfolds, for focusing too much on need fulfillment and not enough on changed leisurestates during the leisure engagement, and finally, for failing to recognize thatrecreationists construct and reconstruct stories of the experience to assign it meaning. These stories change the meaning and value of the experience as they are told andretold to self and to others. Thus, the recreation experience and its value extend andchange beyond the on-site experience.
Viewing recreation as a lived and reflective experience thus recognizes the subjectivenature of leisure experiences and adds considerable complexity to a recreationexperience model. This seemingly would both make the task of managing for idealrecreation experiences much more difficult and also reduce the likelihood thatrecreation resource managers can facilitate high-quality experiences in any major orpredictable way. But to this point, proponents of the lived and reflective experienceapproach are not focusing on managerial applications, but instead are callingresearchers and theoreticians back to the as-yet unfinished task of developing a preciseand accurate conceptualization of leisure (Stewart 1998).
Recreation as a benefit
A final and recent innovation in understanding recreation is to view recreation andleisure as producing personal, social and cultural, economic, and environmentalbenefits. This approach, rapidly becoming a separate paradigm, was initially calledBenefits-based Management (BBM) (Lee and Driver 1996) and more recently theBenefits Approach to Leisure (BAL) (Driver and Bruns 1999). The BAL, developedby Driver and his colleagues, builds upon and extends the experience outcomeapproach to understanding recreation in two important ways. First, it extends the“chain of causality” of satisfying experience (as outlined by the experience outcomeapproach) to benefits accruing to the satisfied recreationist across time and space. Thus, the stressed CEO who goes fishing at a wildlife refuge may find stress relief andtherefore have a satisfying experience. This satisfying experience may be called abenefit, but the benefit likely does not stop there. The CEO likely stays in a morerelaxed state for some time after disengaging from the recreational activity. Inaddition, the increased stress relief may have other secondary benefits to the individualand to society. For example, because of the stress relief, the CEO may have betterhealth, make better decisions on the job, and end up in the hospital less.
The second extension of the BAL over the experience outcome approach is theproposition that benefits of recreation accrue to society and the environment beyond

Facilitating High-quality Visitor Experiences 19
the primary and secondary benefits to the individual. Many of these benefits areeconomic, such as reduced health costs, less work absenteeism, local and regionaleconomic growth because of tourism, or contributions to national net economicdevelopment. Social and cultural benefits of recreation include family bonding,community cohesion, cultural identity, cultural and historical awareness andappreciation, and community and national pride. Finally, natural resource recreationcan help protect the environment by preserving natural areas, areas of biodiversity,areas of historical value, and can also foster understanding of the natural world,improved relationships with the natural world, and an environmental ethic (for a largelist of the benefits of leisure, see Driver and Bruns1999).
The BAL approach seems to me to have conceptual value as a way of looking at thetask of providing recreation goods and services. If recreation providers see their workas beneficial to individuals, society, and/or to the environment, that is very differentfrom seeing the job as simply providing fun. This new perspective would likely havebenefits to recreation providers, enhancing their sense of responsibility and status, andmay result in more thoughtful decisions.
The BAL is also obviously designed to influence public policy decisions affecting theprovision of recreation goods and services. If the recreation profession in general, andwildlife managers in particular, can make a convincing case that engaging in recreationhas the purported primary, secondary, and tertiary benefits to individuals, and thatrecreation has economic, cultural, and environmental benefits, then recreationmanagers can expect to gain increased public funding. Some work suggests that theremay be a “chain of causality” from experiences on the ground to off-site benefitsdescribed above, at least for some experiences and some benefits (e.g., see Stein andLee 1995). But much work remains to be done.
Also, we need to ask ourselves whether the BAL really helps us to understandrecreation and whether it helps recreation managers make better decisions on theground. Because the BAL rests solidly on the experience outcome approach, itrecognizes that benefit has its source in experience of individuals. As such, the BALsteers us in the direction of understanding the essence of recreation as we haveportrayed it. But some benefits listed by BAL have little or no link to individualrecreational experiences. For example, can we understand the process or meaning ofrecreation if we study acres of land protected for diversity; can we understand themeaning of recreation to the individual by studying local and regional economicdevelopment? I think not. Also, the BAL is subject to all the criticisms levied by thelived and reflective experience proponents on the experience outcome approach. Amajor criticism is not recognizing and measuring the dynamic and emergent nature ofrecreation experiences as they unfold. Finally, if managers’ decisions on the groundare to make a difference in benefit, especially a predictable difference, then all thelinkages between and among preferred outcomes, activity/setting combinations thatmeet preferences, satisfying experiences, first-order benefits, possibly second-order

20 Facilitating High-quality Visitor Experiences
benefits, and even third-order benefits must all function in the expected and knownmanner.
Predictors of recreation experience quality
While the serious study of outdoor recreation as an academic endeavor goes back onlyabout 30 years in the United States, we do have general agreement on at least a fewfindings. First, people are complex manipulators of informational stimuli; they areactive players in the construction of their own experiences. A deterministic,mechanistic, stimulus-response model of the recreation experience simply does notreflect reality. Instead, people filter the environmental, contextual, and situational cuesthat impinge upon them during the recreational engagement; they attend to somestimuli and ignore others. Thus, the experience and experiential outcomes have asmuch to do with the person as they do with the environment over which the refugemanager has some control. A second general finding is that “the average camper doesnot exist.” This principle recognizes that there is much diversity in what recreationistsseek and receive from a wildlife refuge visit, and that in responding to the averageparticipant, the refuge manager may be responding to no one. Instead, the refugemanager needs to begin to think about providing a variety of opportunities for thediversity of experiences desired, expected, and enjoyed by recreationists.
We thus know that desired recreational experiences are varied and complex. But whatshapes the experiences desired, and what shapes whether a high-quality experience isachieved? What can a refuge manager do to shape high-quality experiences? Webegin with the first two questions.
Table 1 provides an overview of four types of variables that shape recreationparticipation and/or recreation experience quality. These include person,social/cultural, environmental, and situational/contextual variables. Which of thesevariables is considered most important depends on the conceptual model of outdoorrecreation that one accepts. For example, the experience-outcome model places heavyemphasis on motivations and environmental variables, some emphasis on pastexperience and knowledge, and little emphasis on anything else. In contrast, the flowexperience model contends that personality, skill level, and knowledge of the person,and the challenges provided by the environment, are most important, followed by someimportance given to the person’s past experience in the activity or place. The livedand reflective experience approach recognizes the primary importance of the situationand context when attempting to understand the rise and fall of recreationists’ focus ofattention and mood states during recreational engagements.
In general, outdoor recreation planners and managers have emphasized environmentalvariables above all others, and probably have overemphasized the role of thesevariables in the recreation experience. But this, of course, is to be expected. Landmanagers, and especially national wildlife refuge managers, know most about the

Facilitating High-quality Visitor Experiences 21
Table 1. General factors that shape outdoor recreation participation and recreationexperience quality.a
Person variables Social/culturalvariables
Environmental variables Contextual/situationalvariables
Demographics: Age Gender Race/ethnicity Education
Personality: Gregarious - Solitary Extrovert - Introvert Sensation seeker or not
Motivations (e.g.,huntingb): Nature Escapism Shooting Skill Socializing Vicariousness Trophy display Harvest Equipment
Past experience: Frequency of participation Length of time since first participationKnowledge/Skill Level
Background variables: Socialization Community Status group dynamicsOn-site Variables: Social group
Recreation OpportunitySpectrum Variablesc: Managerial regimentation Interaction among user groups Evidence of human modification of the environment Size of the area Remoteness Facilities provided
Other: Biodiversity of setting Challenge of environment
Weather
Psychological StateLength of Stayd
a Much information in this table is taken from Manning (1999).b Hunter motivations were adapted from Potter et al. (1973).c Recreation Opportunity Spectrum variables were taken from Brown et al. (1978).d Williams and Knopf (1985) found length of stay and degree of whitewater to most affect experience qualityon river rafting trips.

22 Facilitating High-quality Visitor Experiences
environment, and they have responsibility for and some control over this resource. The importance of the individual characteristics that recreationists bring to therecreational setting in shaping experiences is gradually being seen as more important. This is a welcomed development. Past experience, knowledge, and skill levelprofoundly affect recreational experiences. In addition, the natural resource recreationprofession in general, and wildlife refuge managers in particular, need to devotegreater attention to the age, gender, and racial/ethnic makeup of their visitors, if for noother reason than to determine whether the diverse populations that live near wildliferefuges are indeed enjoying them and receiving their benefits in appropriate numbers. That outdoor recreation managers have not focused much on contextual/situationaland on social group variables is understandable. There seems little that can be done toshape the weather, the psychological state of mind a person brings to the recreationalresource, or whether groups get along during their recreational engagement. But allthese variables are really important in shaping experiences, and managers can in fact atleast indirectly affect some of them.
Facilitating high-quality recreational experiences
Thus far I have tried to describe what is high-quality recreation, various conceptualmodels of recreation or leisure, and the multiple variables that shape satisfyingrecreational experiences. I will now draw on this content to suggest general ways thatwildlife refuge managers can facilitate high-quality recreational experiences. I listrecommendations with the proviso that nothing I say here should be seen as takingaway from the Fish and Wildlife Service’s efforts to protect wildlife and wildlifehabitats. I recognize and support the mandate that any outdoor recreation on awildlife refuge must be wildlife-dependent. But I also believe in the BAL enough tosuggest that the right kind of recreation can provide satisfying experiences and fostersuch environmental benefits as knowledge about and care for wildlife.
Recommendation #1: Guard visitor freedom
Defining characteristics of recreation experiences are freedom and intrinsic motivation. Also, the models of recreation discussed here rest on the assumption that recreationistsknow their needs, can effectively evaluate their environmental options to satisfy theirneeds, and can and do act to achieve desired outcomes. Also, we know thatrecreationists are adept at constructing their own experience, sometimes on the landbut more often in the mind. Given all this, my recommendation is not to attempt tooverprogram the experience, and to take heed lest decisions made to achieve othermultiple goals of a wildlife refuge unnecessarily restrict visitor freedom and choice. The beneficial aspects of recreational experiences for people, and the role of freedom and choice in achieving them, should be constantly in the minds of refuge managersand staff.

Facilitating High-quality Visitor Experiences 23
Recommendation #2: Make information easily available aboutrecreational opportunities at the refuge
Conceptions of outdoor recreation going all the way back to the 1960s state that it hasmultiple phases (e.g., anticipation, on-site, recollection). Recreationists gain benefitfrom all phases, and information about the refuge and its experience opportunities canenhance all phases. Such information also helps recreationists make better choices. For example, with the experience outcome model, information about opportunities toachieve fulfillment of various motives, or motive packages, in various zones of therefuge could be provided. With the flow experience perspective, refuge managerscould provide information on the challenge level and skill required to do variousactivities in various zones of the refuge; information would also need to be provided tohelp recreationists have clear goals about the experience opportunity. Without suchinformation, both models of recreation suggest that the visitor experience isdiminished. Providing this type of information to recreationists or potentialrecreationists is now entirely possible using the Internet and other computerizedcommunication systems.
Recommendation #3: Identify wildlife-dependent experiences
Wildlife-dependent activities that occur at refuges include hunting, fishing, wildlifeobservation, photography, environmental education, and nature interpretation. Butrecall that we said that counting the number of recreation visitor days of hunting, forexample, was not a sufficient measure of the meaning and value of recreation. Overalluse numbers tell us little about the quality of a recreational experience for individuals. Also, as shown in Table 1, people engage in an activity like hunting for varyingreasons, and people seeking different experiences may require very different social,environmental, and contextual/situational conditions if they are to be satisfied. Finally,some of these preferred experiences may differ in their dependency on wildlife, andrefuge managers seem obliged to give preference to those experiences more wildlife-dependent. For example, people may go to the deer camp primarily for socializing andbonding with their mates. This experience, while likely most beneficial to the huntinggroup, seems less dependent on wildlife than developing such skills as stalking game.
Recommendation #4: Develop a defensible specification of high-quality wildlife-dependent experiences
Wildlife refuge managers must decide on which of the several perspectives on high-quality recreation laid out here seems most relevant and feasible to them. At least fourperspectives seem possible. At the most basic level, quality might be defined as theextent to which recreationists doing various wildlife-dependent activities at the refugeexpress satisfaction. A better measure of quality would be the level of satisfactionwith wildlife-dependent experiences. At a deeper and perhaps more ideal level, high-

24 Facilitating High-quality Visitor Experiences
quality recreation might be the extent to which people experience “flow” during therecreation engagement. With the experience outcome approach (by far the mostdeveloped application in outdoor recreation contexts), high-quality experiences resultwhen the recreational engagement meets or satisfies the motives of the individual. Finally, while the BAL would generally define high-quality experiences the way theexperience outcome approach does, it extends measures of the quality of a recreationprogram to include positive social, economic, and environmental outcomes beyond theindividual. The satisfactions, flow experiences, experiences meeting expressed wants,and benefits must, of course, be wildlife-dependent.
Recommendation #5: Identify social, environmental, and/orsituational elements of the resource setting that shape high-qualityexperiences
Ideally, managers would have at least some control over these important elements; theelements would be to some degree manipulatable, and they could be reduced to amanageable number. Simply looking for elements that shape satisfaction will probablyprove futile because people engage in such activities as fishing for a variety of reasons. The experience of anglers seeking to catch lots of fish likely depends on differentsetting attributes than do anglers who want to experience the flow of the river. Thus,resource planners and managers seeking simply to manage for activity satisfaction arequickly drawn in deeper, most likely into an experience outcome or lived experienceapproach. The ROS approach represents one such experience outcome-basedapproach. This framework contends that amount and type of managerialregimentation of recreationists, amount and type of interaction among users, groupson the site, evidence of human modification of the environment, amount and type offacilities and services provided, size of the area, and remoteness all affect the nature ofrecreation experiences (see table 1). To this, others have added the type and size ofthe group the recreationist is with and length of stay. In the case of wildlife refuges, itseems that number, density, and type of wildlife, and characteristics of the wildlifehabitat might also be important. Extending this to the flow models of recreationexperiences, the challenge level of the environment for varying wildlife-dependentexperiences would also be important.
Recommendation #6: Inventory and classify wildlife refuge landsand waters based on experience-affecting resource attributes
Such inventory and land classification activities would be an overlay to more basicwildlife habitat and wildlife protection mapping. Certain zones of the refuge mighttherefore be closed to all recreational use. But when recreation is appropriate, therange of values of critical factors that shape wildlife-dependent experiences would beinventoried and mapped. Professional judgment, along with public input, would beused to demarcate the range of values among the important factors most conducive to

Facilitating High-quality Visitor Experiences 25
facilitating a given kind of high-quality experience. Through this means, a map ofmultiple overlays would be developed which would denote a range of differentexperience opportunities on the refuge. One such zone on a refuge providing deerhunting experiences might offer a high challenge experience for stalking deer, withfew management restrictions, with little chance of seeing other people, and moderatechances of seeing deer. To make this manageable to resource professionals and thepublic alike, there should be relatively few experience-based opportunity classes, andthey should be given names descriptive of the opportunity and meaningful to potentialvisitors.
Once such experience opportunity zones are established, they would be communicatedto the public as called for in Recommendation #2.
Recommendation #7: Monitor experience quality
Monitoring is one of the most neglected aspects of all resource management activities,and this is certainly the case for the outdoor recreation service delivery system. But inboth an ideal and a very practical sense, public policymakers and resource managersneed to know how many people are engaged in outdoor recreation on wildlife refuges,who are and are not enjoying the wildlife refuges, what experiences visitors areseeking and receiving, and whether experiences received meet some acceptable level ofquality.
Thus, counting the number of refuge visitors who engage in a variety of recreationalactivities is a necessary but insufficient measure of program output. In addition,refuge managers must specify the types of wildlife-dependent experiences to beprovided at the refuge, determine number of people gaining those experiences, andmeasure the quality level of the experiences received. Quality might be measured bylevel of satisfaction with prescribed wildlife-dependent activities, or better yet, bysatisfaction level with prescribed wildlife-dependent experiences. Another approachwould be to determine whether the recreationist receives a designated level of joy,happiness, calmness, energy, or alertness during the wildlife-dependent activity orexperience. An even more precise measure of experience quality might be to measurethe extent to which recreationists achieve appropriate preferred and expectedexperiences, or the extent to which they experience flow, peak experiences, or self-actualization. Another type of measure of the value of recreation on a wildlife refuge,albeit perhaps even harder to track, is to look to off-site benefits. These benefits mightinclude health benefits to recreationists, community pride from knowing the wildliferefuge is there, economic benefits to the community from tourism, or the existence ofan environmental protection ethic that might logically flow from visits to the refuge.

26 Facilitating High-quality Visitor Experiences
Needed research
In this call for greater attention and commitment to the provision of recreationalexperiences on wildlife refuges, I have given broad-brush coverage to the nature ofnatural resource recreation experiences, to the characteristics of what might be calledideal or high-quality recreation experiences, and to approaches that scholars have usedto study outdoor recreation. From this analysis, I have given my best educatedguesses on what most shapes the nature of leisure experiences, and then maderecommendations on how refuge managers might facilitate the delivery of high-qualityrecreational services to visitors and the public. I acknowledge that there is much wedo not know about the meaning and value of outdoor recreation, what most affects itsquality, and why some people engage in it but other segments of the Americanpopulation do not. As the Fish and Wildlife Service moves forward to provide moreand better outdoor recreation opportunities for more segments of the Americanpeople, critical information will be needed to make the best possible decisions. I closethen by listing a series of questions important to recreation resource managementabout which a social science program of research could shed more light.
< What is the nature of recreational experiences on wildlife refuges? Are theseexperiences wildlife dependent?
< What is the diversity of wildlife-dependent recreational experiences sought andachieved at wildlife refuges?
< What is the process recreationists use at wildlife refuges to judge the quality oftheir experiences? Are wildlife refuge visitors receiving high-quality experiences?
< How do wildlife refuge recreationists construct their experience during all phasesof the recreational experience, but especially during the on-site and reflectivephases?
< What conflicts, if any, occur among recreationists seeking wildlife-dependentexperiences on wildlife refuges?
< What benefits do recreationists receive from their engagement in recreationalactivities at wildlife refuges?
< What person, social, environmental, and situational variables most shaperecreational experiences? Which of these can resource managers most influencefor better or for worse?
< What are the critical variables affecting recreational experiences that should guidea recreation resource inventory, classification, and mapping system?

Facilitating High-quality Visitor Experiences 27
< What kinds of information should be communicated to potential or actual wildliferefuge recreationists to most enhance their experience and facilitate recreationalchoice?
< How and when should this information be communicated to recreationists?
< What segments of the population are over-represented and under-representedamong wildlife refuge visitors? Why do some segments of the population visitrefuges in low numbers?
< What are the social, cultural, and economic benefits and costs of recreation onwildlife refuges to adjacent communities, to the region, and to the nation at large?
< Finally, what are the benefits and costs of recreational visits to wildlife refuges toenvironmental protection, management, and care?
Planning, organizing, and funding a program of research to begin to answer thesequestions is, of course, a long-term effort. But if we have clarity of purpose, clearfeedback on our journey to achieve our goals, and if we are able to construct thechallenge to match or slightly exceed our communal skills, then at least one theory ofhuman behavior would suggest our experience will be optimal. Such an effort wouldalso enhance the provision of high-quality recreational experiences and the protectionof wildlife on our national wildlife refuges.
Literature cited
Ajzen, I. 1985. From intentions to action: A theory of planned behavior. In Action-Control: from Cognition to Behavior, eds. Kuhl, J. and J. Bechman, 11-39. Heidelberg, Germany: Springer.
Brown, P., B. Driver, and C. McConnell. 1978. The opportunity spectrum concept inoutdoor recreation supply inventories: background and application. InProceedings, Integrated Renewable Resource Inventories Workshop, 73-84. USDA Forest Service General Technical Report RM-55.
Brown, P., and D. Ross. 1982. Using desired recreation experiences to predictsetting preferences. In Forest and river recreation: Research update, 105-110. Miscellaneous Report 18. St. Paul, MN: University of Minnesota, AgriculturalExperiment Station.
Brown, P. J. 1984. Benefits of outdoor recreation and some ideas for valuingrecreation opportunities. In Valuation of Wildland Resource Benefits, eds.,Peterson, G. L., and A. Randall, 209-220. Boulder, CO: Westview Press.
Clawson, M., and J. Knetsch. 1966. Economics of Outdoor Recreation. Baltimore,MD: The Johns Hopkins Press.

28 Facilitating High-quality Visitor Experiences
Csikszentmihalyi, M., and I. Csikszentmihalyi, eds. 1988. Optimal Experience:Psychological studies of flow in consciousness. New York, NY: CambridgeUniversity Press. 416pp.
Csikszentmihalyi, M., and D.A. Kleiber. 1991. Leisure and self-actualization. InBenefits of Leisure, eds., Driver, B. L., P. J. Brown, and G. L. Peterson, 97-102. State College, PA: Venture Publishing, Inc.
Driver, B., and S. R. Tocher. 1970. Toward a behavioral interpretation ofrecreational engagements, with implications for planning. In Elements of OutdoorRecreation Planning, 9-31. Ann Arbor, MI: University Microfilms.
Driver, B. L., and D. H. Bruns. 1999. Concepts and uses of the benefits approach toleisure. In Leisure Studies, Prospect for the Twenty-First Century, eds., Jackson,E. L., and T. L. Burton, 349-369. State College, PA: Venture Publishing, Inc.
Driver, B. L., and R. C. Knopf. 1977. Personality, outdoor recreation, and expectedconsequences. Environment and Behavior 9:169-193.
Driver, B. L., H. E. A. Tinsley, and M. J. Manfredo. 1991. The paragraphs aboutleisure and recreation experience preference scales: results from two inventoriesdesigned to assess the breadth of the perceived psychological benefits of leisure. In Benefits of Leisure, eds., Driver, B. L., P. J. Brown, and G. L. Peterson, 263-286. State College, PA: Venture Publishing, Inc.
Ewert, A., and S. Hollenshorst. 1989. Testing the adventure model: empiricalsupport for a model of risk recreation participation. Journal of Leisure Research21:124-139.
Floyd, M. F., and J. H. Gramann. 1997. Experience-based setting management:Implications for market segmentation of hunters. Leisure Sciences 19(2):113-128.
Hemingway, J. 1988. Leisure and civility: Reflections on the Greek ideal. LeisureSciences 10:179-181.
Hull, R. B., IV, and S. E. Michael. 1995. Nature-based recreation, mood change, andstress reduction. Leisure Sciences 17:1-14.
Hull, R. B,. IV, S. E. Michael, G. J. Walker, and J. W. Roggenbuck. 1996. Ebb andflow of brief leisure experiences. Leisure Sciences 18:299-314.
Hull, R. B., IV, W. P. Stewart, and Y. K. Yi. 1992. Experience patterns: Capturingthe dynamic nature of a recreation experience. Journal of Leisure Research24:240-252.
Kelly, J. R. 1987. Freedom to Be: Toward a New Sociology of Leisure. New York,NY: Macmillan. 248pp.
Lawler, E. E. 1973. Motivations in Work Organizations. Monterey, CA:Brooks/Cole. 224pp.
Lee, M., and B. Driver. 1996. Benefits-based management: a new paradigm formanaging amenity resources. In Survival of the Organizationally Fit: EcosystemManagement as an Adaptive Strategy for Natural Resource Organizations in the21st Century, eds., Burch, W., Jr., J. Aley, B. Conover, and D. Field. New York,NY: Taylor and Francis Publishers.

Facilitating High-quality Visitor Experiences 29
Manfredo, M., B. L. Driver, and P. J. Brown. 1983. A test of concepts inherent inexperience-based setting management for outdoor recreation area. Journal ofLeisure Research 15:263-283.
Manning, R. E. 1999. Studies in Outdoor Recreation, Search and Research forSatisfaction. Corvallis, OR: State University Press. 374pp.
Maslow, A. 1970. Motivation and Personality. New York, NY: Harper and Row. 369pp.
Maslow, A. 1968. Toward a Psychology of Being. New York, NY: Van NostrandReinhold. 240pp.
McLaughlin, W. J. and W. E. J. Paradice. 1980. Using visitor preference informationto guide dispersed winter recreation management for cross-country skiing andsnowmobiling. In Proceedings of the North American Symposium on DispersedWinter Recreation, 64-70. Education Series 2-3. St. Paul, MN: University ofMinnesota, Office of Special Programs.
Potter, D., J. Hendee, and R. Clark. 1973. Hunting satisfaction: game, guns, ornature. In Human Dimensions in Wildlife Programs, 62-71. Washington, DC: The Wildlife Management Institute.
Shafer, C. S., and W. E. Hammitt. 1995. Congruency among experience dimensions,condition indicators, and coping behaviors in wilderness. Leisure Sciences17(4):263-279.
Stein, T., and M. Lee. 1995. Managing recreation resources for positive outcomes:an application of benefits-based management. Journal of Park and RecreationAdministration 13(3):52-70
Stewart, W. P. 1998. Leisure as multiphase experiences: challenging traditions. Journal of Leisure Research 30(4):391-400.
Vogelsong, H., A. Graefe, J. Confer, D. Solan, and J. Kramp. 1998. Relationshipsbetween motivations, activities, and settings: the recreation opportunity spectrumwithin the Delaware State Park System. In Proceedings of the 1997 NortheasternResearch Symposium, 124-127. USDA Forest Service General Technical ReportNE-241.
Walker, G. J., R. B. Hull, IV, and J. W. Roggenbuck. 1998. On-site optimalexperiences and their relationship to off-site benefits. Journal of Leisure Research30(4):453-471.
Williams, D. 1985. A developmental model of recreation choice behavior. InProceedings, Symposium on Recreation Choice Behavior, 31-37. USDA ForestService General Technical Report INT-184.
Williams, D., and R. Knopf. 1985. In search of the primitive-urban continuum—thedimensional structure of outdoor recreation settings. Environment and Behavior17:351-370.

6Manning, R. E. 2000. Defining and establishing indicators and standards of quality. In HumanDimensions of Natural Resource Management: Emerging Issues and Practical Applications, eds. Fulton, D.C., K. C. Nelson, D. H. Anderson, and D. W. Lime. St. Paul, MN: Cooperative Park Studies Program,University of Minnesota, Department of Forest Resources.
7Professor, School of Natural Resources, Recreation Management Program, George D. Aiken Centerfor Natural Resources, Burlington, VT 05405-0088.
Defining and Establishing Indicators and Standards of Quality6
Robert E. Manning7
Growing interest in outdoor recreation on public lands has given rise to a substantialbody of scientific literature on management of parks, wilderness, and related areas. While this literature is diverse in terms of its scope, methodology, and geographicapplication, several frameworks have been developed to help guide planning andmanagement of outdoor recreation. These frameworks include Limits of AcceptableChange, Visitor Impact Management, and Visitor Experience and ResourceProtection. A central focus of these frameworks is formulation of indicators andstandards of quality of the visitor experience. Indicators of quality are measurable,manageable variables that define the quality of the visitor experience. Standards ofquality define the minimum acceptable condition of indicator variables. Onceindicators and standards of quality have been formulated, indicator variables aremonitored and management action is taken to ensure that standards of quality aremaintained.
The purpose of this paper is to describe the concept of indicators and standards ofquality, and how the concept can be used to manage outdoor recreation in parks,wilderness, and related areas. An application of indicators and standards of quality toArches National Park, Utah, will be used for illustration. Specific objectives of thepaper are as follows:
< Define indicators and standards of quality and their role in contemporary outdoorrecreation planning and management frameworks.
< Illustrate the formulation and application of indicators and standards of quality atArches National Park, Utah.
Evolution of indicators and standards of quality
The question of how much recreation can be accommodated on public lands is oftenframed in terms of carrying capacity. The concept of carrying capacity has a rich

Defining and Establishing Indicators and Standards of Quality 31
history in the natural resource professions, where it has been interpreted primarilyfrom a biological or ecological perspective. In particular, it has proven to be a usefulconcept in wildlife and range management, where it refers to the number of animalsthat can be maintained in a given habitat before undue biological or ecological impactsoccur (Dasmann 1964).
Carrying capacity has obvious parallels and intuitive appeal in the field of outdoorrecreation. Carrying capacity was first suggested in the mid-1930s, as an outdoorrecreation concept in the context of the national parks (Sumner 1936). However, thefirst rigorous applications of carrying capacity to outdoor recreation did not occuruntil the 1960s.
The early work on carrying capacity has since blossomed into an extended literaturebase on outdoor recreation and carrying capacity (Lime and Stankey 1971; Stankeyand Lime 1973; Graefe et al. 1984; Manning 1985, 1999; Shelby and Herberlein 1986;Stankey and Manning 1986; Kuss et al. 1990). But despite this research base, effortsto determine and apply the concept of carrying capacity to public lands have remainedproblematic. The principal difficulty lies in determining how much impact, such ascrowding, is too much. Theoretical development, backed up by empirical research,generally confirms that increasing contacts or encounters between visitors leads toincreased perceptions of crowding. But how much crowding should be allowed? Thisbasic question is often referred to as “the limits of acceptable change” (Frissell andStankey 1972). Given substantial demand for outdoor recreation on public lands,some decline or change in the quality of the visitor experience (e.g., some crowding)seems inevitable. But how much decline or change is acceptable or appropriate?
Definition of indicators and standards of quality
Answers to the above questions can be found through formulation of managementobjectives and development of indicators and standards of quality (Shelby et al. 1992;National Park Service 1997; Roggenbuck et al. 1993). This approach to carryingcapacity and outdoor recreation focuses principal emphasis on defining the type ofvisitor experience to be provided and maintained, and then monitors conditions overtime to assess whether acceptable conditions have been exceeded. Managementobjectives are broad, narrative statements that define the type of visitor experience tobe provided. They are based on review of the purpose and significance of the areaunder consideration. Formulation of management objectives may involve review oflegal, policy, and planning documents; consideration by an interdisciplinaryplanning/management team; and public involvement.
Indicators of quality are more specific measurable variables that reflect the essence ormeaning of management objectives; they are quantifiable proxies or measures ofmanagement objectives. Indicators of quality may include elements of both thephysical and social environment that are important in determining the quality of the

32 Defining and Establishing Indicators and Standards of Quality
visitor experience. Standards of quality define the minimum acceptable condition ofindicator variables.
An example of management objectives, indicators, and standards may be helpful. Review of the Wilderness Act of 1964 suggests that areas contained in the NationalWilderness Preservation System are to be managed to provide opportunities for visitorsolitude. Thus, providing opportunities for solitude is an appropriate managementobjective for most wilderness areas. Moreover, research on wilderness visitorssuggests that the number of other visitors encountered along trails and at campsitesmay be important in determining the quality of the visitor experience in wilderness. Thus, trail and camp encounters may be key indicator variables and help to make thegeneral management objective of solitude operational. Further research suggests thatwilderness visitors often have normative standards about how many trail and campencounters can be tolerated before the quality of the visitor experience declines to anunacceptable degree (Heberlein et al. 1986; Vaske et al. 1986; Whittaker and Shelby1988; Roggenbuck et al. 1991; Shelby and Vaske 1991; Lewis et al. 1996). This typeof information can help managers formulate standards of quality. By definingindicators and standards of quality, carrying capacity can be determined and managedthrough a monitoring program. Indicator variables can be monitored over time andonce standards have been reached, carrying capacity has been reached as well. Thisapproach to carrying capacity is central to contemporary outdoor recreationmanagement frameworks, including Limits of Acceptable Change (LAC) (Stankey etal. 1985), Visitor Impact Management (VIM) (Graefe et al. 1990), and VisitorExperience and Resource Protection (VERP) (National Park Service 1997).
Application of indicators and standards of quality
The VERP framework noted above was developed by the National Park Service toguide carrying capacity and related outdoor recreation. VERP was initially applied atArches National Park, Utah. Visitation to Arches increased 91 percent in the decadeof the 1980s, and the park now receives more than three-quarters of a million visitsannually.
A social carrying capacity research program at Arches was approached in two phases. Phase I was aimed at identifying potential indicators of quality of the visitor experience(Manning et al. 1993). Personal interviews were conducted with 112 visitorsthroughout the park. In addition, another 83 people expressed their views during 10focus-group sessions with park visitors, park staff, and local community residents. Respondents and participants were selected through a purposive rather than randomsampling procedure. Thus, data are primarily qualitative in nature. The purpose ofthis exploratory effort was to begin learning about a variety of human-use aspects ofvisitation to Arches and to develop insights into potential indicators of the quality ofthe visitor experience. Interviews and focus-group sessions were guided by astandardized questionnaire.

Defining and Establishing Indicators and Standards of Quality 33
The questionnaire contained two major sections that focused on identifying potentialindicators of the quality of the visitor experience. The first section contained a batteryof open-ended questions that probed for park conditions and issues that visitors andothers considered important to determining the quality of the park experience. Thesecond section of the questionnaire contained a battery of closed-ended questions thatalso probed for indicators of quality. Fifty-three wide-ranging park conditions orissues were presented to respondents, who were asked to indicate whether each itemwas considered a “big problem,” a “small problem,” or “not a problem”; a “noopinion” option was also presented. The items were developed based on literaturereview, discussion with park planners and staff, and personal observations in the park.
Findings from this first phase of research provided important insights into parkconditions and issues that add to or detract from the quality of the visitor experience atArches National Park. Potential indicators of quality range widely, spanning a varietyof categories, including:
< orientation, information, and interpretive services;< visitor facilities;< visitor crowding;< visitor behavior and activities;< resource impacts of visitor use;< park management activities; and < quality and condition of natural features.
Phase II research had two objectives: (1) to determine the relative importance ofindicator variables, and (2) to assist in setting standards of quality for selectedindicator variables (Lime et al. 1994). A survey of park visitors was conducted atseveral locations throughout the park. The survey was administered to arepresentative sample of park visitors and was conducted by means of both personalinterviews and mail-back questionnaires.
The survey instruments contained two major sections related to carrying capacity. Thefirst section focused on determining the relative importance of indicator variablesidentified in Phase I research. Fourteen indicator variables were distilled from theprevious phase of research and respondents were asked to rate the importance of eachvariable in determining the quality of their experience at the particular location in thepark where they were interviewed. This section of the questionnaire was needed fortwo reasons. First, Phase I research was qualitative in nature; its purpose was simplyto explore for potential indicator variables. Phase II research had to be quantitative:respondents were asked to rate the relative importance of these potential indicators ofquality. This required a larger and more representative sample. Second, investigatorshypothesized that indicator variables might vary by location within the park. Samplingwas conducted in all of the major zones within the park and questions were keyed

34 Defining and Establishing Indicators and Standards of Quality
directly to those specific areas. Study findings helped identify the most importantindicator variables in each area of the park.
The second major section of the survey questionnaires was directed at determiningstandards of quality for selected indicator variables. Three indicator variables receivedspecial attention: (1) the number of people at one time at major attraction sites withinthe park, (2) the number of people at one time along trails, and (3) the amount ofenvironmental impact to soil and vegetation caused by off-trail hiking. All three ofthese variables were addressed by a series of photographs that illustrated a range ofimpact conditions. Photographs were developed using a computer-based imagecapture technology (Chenoweth 1990; Lime 1990; Nassauer 1990; Pitt 1990). Basephotographs of park sites were taken and these images were then modified to present arange of impact conditions. A set of 16 photographs was developed for eachattraction site and trail. Each photograph presented a different number of visitorspresent. An analogous set of photographs was developed for a range of environmentalimpacts caused by off-trail hiking. Respondents rated the acceptability of eachphotograph. Representative photographs are shown in Figure 1.
Study data were used to help select standards of quality for each zone within the park. The following example illustrates the nature of these data and how they can be used insetting standards of quality. Delicate Arch is a major visitor attraction in the park. Because of its importance and uniqueness, this feature, along with the trail corridorserving it, was established as a separate zone within the park. Study findingssuggested that the number of people at any one time at Delicate Arch is an importantindicator variable. Thus, a series of 16 photographs presenting a wide-ranging numberof people at one time at this feature was developed as described above.
Respondent ratings of these photographs are graphically illustrated by Figure 2. Theline presented in this figure is a regression line representing the best fit between thenumber of people in each photograph and acceptability ratings. There is a strongrelationship between these variables, with the number of people in the photographsexplaining 49 percent of the variance in acceptability ratings (F< 0.0001). The type ofcurve shown in Figure 2 is generally referred to as a social norm (Shelby and Heberlein1986; Vaske et al. 1986). Social norms can be useful in helping to formulate standardsof quality. This is especially so when, as is the case with Delicate Arch, there is aconsiderable consensus among respondents about the social norm.
The literature on social norms suggests three potential points along the norm curvethat might be used to help formulate a standard of quality. The first point is defined asthe highest point along the curve, and might be referred to as the optimum. Studyfindings from Delicate Arch indicate that photograph 1 (Figure 2), with no visitors inthe scene, is rated as most acceptable; thus, zero people at one time might beconsidered a standard of quality. However, this clearly is not feasible given thedemand to see this popular feature.

13
A B
Figure 1. Representative photographs showing (A) increasing levels of visitor use (B) increasing levels of environmental impact

36 Defining and Establishing Indicators and Standards of Quality
-4
-3
-2
-1
0
1
2
3
4
0 10 20 30 40 50 60 70 80 90 100 110
PAOT
Acc
epta
bili
ty
X = 28
Figure 2. Relationship between number of people inphotographs and acceptability ratings for Delicate Arch,Arches National Park
The second point is defined as the point at which the norm curve crosses from theacceptable range into the unacceptable range. This might be called the minimumstandard of quality. For Delicate Arch, the norm curve crosses into the unacceptablerange at 28 people at one time, as indicated in Figure 2.
The third point that might be used to help formulate a standard of quality is defined byany inflection points along the social norm curve. An inflection point is a point alongthe norm curve that falls (or rises) especially steeply. Inflection points may representthresholds of tolerance (or preference) among the sample population. However, thereare no inflection points along the norm curve for Delicate Arch.
Given the above findings, a standard of quality of maximum of 30 people at one timewas set for Delicate Arch. This was based on the figure of 28 people at one time, asnoted above, but rounded up slightly to reflect the extreme demand to see thisimportant natural feature. Study findings were used to help set other standards ofquality throughout the remaining zones in the park.
Conclusion
Indicators and standards of quality can play an important role in the management ofoutdoor recreation on public lands, and are the focus of contemporary carryingcapacity and related outdoor recreation management frameworks, including Limits ofAcceptable Change and Visitor Experience and Resource Protection. Indicators of

Defining and Establishing Indicators and Standards of Quality 37
quality are measurable, manageable variables that help define resource conditions andthe quality of the visitor experience. Standards of quality define the minimumacceptable condition of indicator variables. Indicator variables are monitored andmanagement action is taken to ensure that standards of quality are maintained. Research at Arches National Park illustrates how indicator and standards of qualitycan be applied to outdoor recreation management.
Research is warranted on several aspects of indicators and standards of quality. First,more research is needed on identifying and formulating indicators and standards ofquality. Within the biophysical domain, what variables best reflect the integrity ofnatural and cultural resources? Within the social domain, what variables best reflectthe quality of visitor experiences? Once indicators of quality have been identified, howcan research be used to guide formulation of appropriate standards of quality? Second, research is needed on developing and testing monitoring techniques andprocedures. Monitoring indicator variables can be time-consuming and costly. Howcan monitoring be made more efficient and effective? Finally, more research is neededon testing the effectiveness of alternative outdoor recreation management practices. Management is needed to maintain a standard of quality. But which managementpractices are most effective, and under what conditions do they apply?
Literature cited
Chenoweth, R. 1990. Image-capture computer technology and aesthetic regulation oflandscapes adjacent to public lands. In Managing American’s EnduringWilderness Resource, ed. Lime, D., 563-568. St. Paul, MN: University ofMinnesota Press.
Dasmann, R. 1964. Wildlife Biology. New York: John Wiley and Sons. Frissell, S., and G. Stankey. 1972. Wilderness environmental quality: Search for
social and ecological harmony. In Proceedings of the Society of AmericanForesters Annual Conference, 170-83. Hot Springs, AR: Society of AmericanForesters.
Graefe, A., F. Kuss, and J. Vaske. 1990. Visitor Impact Management: A PlanningFramework, vol. 2. Washington, D.C.: National Parks and ConservationAssociation.
Graefe, A., J. Vaske, and F. Kuss. 1984. Social carrying capacity: An integration andsynthesis of twenty years of research. Leisure Sciences 6:395-431.
Heberlein, T., G. Alfano, and L. Ervin. 1986. Using a social carrying capacity modelto estimate the effects of marina development at the Apostle Islands NationalLakeshore. Leisure Sciences 8:257-74.
Kuss, F., A. Graefe, and J. Vaske. 1990. Visitor Impact Management: A Review ofResearch. Washington, D.C.: National Parks and Conservation Association.
Lewis, M., D. Lime, and D. Anderson. 1996. Paddle canoeists encounter norms inMinnesota’s Boundary Waters Canoe Area wilderness. Leisure Science 18:143-60.

38 Defining and Establishing Indicators and Standards of Quality
Lime, D. 1990. Image capture technology: An exciting new tool for wildernessmanagers. In Managing America’s Enduring Wilderness Resource, ed., Lime, D.,549-552. St. Paul, MN: University of Minnesota Press.
Lime, D., R. Manning, M. Lewis, and W. Friemund. 1994. Indicators and standardsof quality for the visitor experience at Arches National Park: Phase II research. St. Paul, MN: University of Minnesota, Cooperative Park Studies Unit.
Lime, D., and G. Stankey. 1971. Carrying capacity: Maintaining outdoor recreationquality. In Recreation Symposium Proceedings, 174-84. USDA Forest Service.
Manning, R. 1985. Crowding norms in backcountry settings: A review and synthesis. Journal of Leisure Research 17:75-89.
Manning, R. 1999. Studies in Outdoor Recreation: Search and Research forSatisfaction. Corvallis, OR: Oregon State University Press.
Manning, R., D. Lime, R. McMonagle, and P. Nordin. 1993. Indicators andstandards of quality for the visitor experience at Arches National Park: Phase Iresearch. St. Paul, MN: University of Minnesota, Cooperative Park Studies Unit.
Nassauer, J. I. 1990. Using image capture technology to generate wildernessmanagement solutions. In Managing America’s Enduring Wilderness Resource,ed., Lime, D., 553-562. St. Paul, MN: University of Minnesota Press.
National Park Service, USDI. 1997. VERP: The Visitor Experience and ResourceProtection (VERP) Framework: A Handbook for Planners and Managers. Denver, CO: Denver Service Center.
Pitt, D. 1990. Developing an image capture system to see wilderness managementsolutions. In Managing America’s Enduring Wilderness Resource, ed., Lime D.,541-548. St. Paul, MN: University of Minnesota Press.
Roggenbuck, J., D. Williams, S. Bang, and D. Dean. 1991. River float trip encounternorms: Questioning the use of the social norms concept. Journal of LeisureResearch 23:133-53.
Roggenbuck, J., D. Williams, and A. Watson. 1993. Defining acceptable conditionsin wilderness. Environmental Management 17:187-97.
Shelby, B., and T. Herberlein. 1986. Carrying Capacity in Recreation Settings. Corvallis, OR: Oregon State University Press.
Shelby, B., G. Stankey, and B. Shindler, eds. 1992. Defining Wilderness Quality: The Role of Standards in Wilderness Management?a Workshop Proceedings. USDA Forest Service General Technical Report PNW-GTR-305.
Shelby, B., and J. Vaske. 1991. Using normative data to develop evaluative standardsfor resource management. A comment on three recent papers. Journal of LeisureResearch 23:173-87.
Stankey, G., D. Cole, R. Lucas, M. Peterson, S. Frissell, and R. Washburne. 1985. Limits of Acceptable Change (LAC) System for Wilderness Planning. USDAForest Service General Technical Report INT-176.
Stankey, G., and D. Lime. 1973. Recreational Carrying Capacity: An AnnotatedBibliography. USDA Forest Service General Technical Report INT-3.

Defining and Establishing Indicators and Standards of Quality 39
Stankey, G., and R. Manning. 1986. Carrying capacity of recreation settings. In ALiterature Review: The President’s Commission on Americans Outdoors. Washington, D.C.: U.S. Government Printing Office, M-47-M-57.
Sumner, E. 1936. Special Report on a Wildlife Study in the High Sierra in Sequoiaand Yosemite National Parks and Adjacent Territory. Washington, D.C.: U.S.National Park Service Records, National Archives.
Vaske, J., A. Graefe, B. Shelby, and T. Heberlein. 1986. Backcountry encounternorms: Theory, method, and empirical evidence. Journal of Leisure Research18:137-53.
Whittaker, D., and B. Shelby. 1988. Types of norms for recreation impact: Extending the social norms concept. Journal of Leisure Research 20:261-73.

8Bright, A. D. 2000. Communication campaigns for wildlife management. In Human Dimensions ofNatural Resource Management: Emerging Issues and Practical Applications, eds. Fulton, D. C., K. C.Nelson, D. H. Anderson, and D. W. Lime. St. Paul, MN: Cooperative Park Studies Program, University ofMinnesota, Department of Forest Resources.
9Associate Professor, Department of Natural Resource Recreation and Tourism, 241 ForestryBuilding, Colorado State University, Fort Collins, CO 80521.
Communication Campaigns for Wildlife Management8
Alan D. Bright9
Communications generally inform, educate, or persuade their audience. The mostcommon function of communication for wildlife agencies is to inform the public ofmanagement practices and to educate about biological processes (Stout and Knuth1993). Wildlife recreation information often includes available opportunities,regulations, ethics, and techniques for participating and may even work to change thepublic’s beliefs and attitudes toward management methods or goals. Somecommunication efforts have had enormous influence (Rice and Atkin 1994), illustratedby the dramatic public awareness of Smokey Bear after extensive informationalcampaigns (McNamara et al. 1981). However, such success is usually limited by timeand money (Pierce and Manfredo 1997). The purpose of this paper is to review aprocess for developing an information campaign that may be applied to wildlifemanagement.
Developing an information and education program forwildlife viewing
The conceptualization, development, implementation, and evaluation of an informationprogram can be described using six phases.
Phase 1. Determine the Objectives of the Information CampaignPhase 2. Identify Target Audience(s) in the CampaignPhase 3. Define the Target Audience Response to the CampaignPhase 4. Develop the MessagePhase 5. Select the Media Strategy and Implement the CampaignPhase 6. Evaluate the Information Campaign
This process is applicable in determining the overall communication plan for wildlifemanagement and in developing the individual information products. For example,state wildlife viewing guides have become one of the important products and symbolsassociated with agency viewing programs. However, their production requires twoquestions that are often overlooked. First, how does the viewing guide fit within the

Communication Campaigns for Wildlife Management 41
overall or statewide plan for the agency's viewing program? Second, what are theobjectives for producing the guide and how can they be addressed within the guideusing good principles of communication and information design? Most viewing guidesfollow a typical format, describing wildlife which may be viewed in the state andwhere. While this information addresses a specific need, it may be advantageous toidentify whether other information should be included (e.g., general guidelines onviewing), whether there are ways to increase interest (e.g., including other photos andpictures of viewers in the field), and an actual evaluation of its effectiveness. It shouldalso be considered whether other types of information about wildlife viewing should beprovided using media other than the traditional viewing guide. Similar questionsshould be addressed for other types of information programs.
Phase 1. Determine the objectives of the information campaign
This phase addresses the question: Why are you providing information? Objectivesprovide the starting point for developing the campaign strategy and establishing thestandards by which success of the campaign can be measured. Objectives also mayindicate the connection between the information program and the service philosophyof the wildlife agency. Objectives should be realistic, measurable, precede decisionsabout messages or media, and specify a completion date.
Phase 2. Identify target audience(s) in the campaign
This phase addresses the question: To whom will the information be provided? Thisinvolves identifying specific target audiences and determining whether those targetaudiences are relevant to the goals and objectives of the information campaign. Thisinformation is used to determine the strategy that will be used to provide informationabout wildlife viewing.
Segmenting target audiences. Target audiences may be described in terms of“target descriptors” of individuals making up that segment. Target descriptors canrelate to geographic (e.g., residence), sociodemographic (e.g., age or gender),psychographic (lifestyles, benefits desired), and behavioral (e.g., skill level or season ofparticipation in wildlife related activity) characteristics.
Criteria for viable target segments. The public may vary from several targetsegments to only one. Regardless of the number of segments, it is important todetermine what segments are useful as target audiences for a particular informationand education program. For a single segment to be useful it must exhibit fivecharacteristics. First, target audience segments must be pertinent to the goals andobjectives of the agency and the information campaign. Second, the agency should beable to measure the characteristics by which the segment is based (measurability). Third, the segment must be reachable with communications (accessibility). Fourth, thesegment should be large enough to merit spending resources on the information

42 Communication Campaigns for Wildlife Management
program (substantiality). Traditionally, “large enough” suggests the segment beprofitable. However in a social marketing sense, large enough means that the socialneed of providing the information to the segment, regardless of size, be considered.Fifth, the most crucial criterion is that segments respond differently to acommunication strategy (e.g., they are looking for different experiences from hunting).
Strategies for reaching the target audience(s). There are several kinds ofstrategies for reaching your target audience(s). In an undifferentiated strategy, thetarget audience is treated as one group with similar needs and interests. Under adifferentiated strategy, distinct target audiences with varying needs and interestsreceive information that differs in content and/or media channel. In a concentratedstrategy, differences among target audiences and their needs and interests are servedwith information targeted to only some segments. For example, an informationcampaign about wildlife viewing experiences might be developed and focused solelyon ecotourists. The decision about the appropriate strategy is based primarily on thenature of opportunities available, wildlife viewing audiences, and available funds. Forexample, an agency may choose a concentrated strategy because it does not haveenough resources to focus on the entire population or to design several specificcampaigns. An undifferentiated strategy is best if the audience is homogeneous in thetypes of wildlife viewing experiences they prefer.
Phase 3. Define the target audience response to the campaign
Once the target audiences have been identified, desired responses to the informationshould be determined consistent with the objectives developed in phase 1. The desiredresponses to an information program can be described using the AIDA model (Fine1991). This model addresses four levels of response to an information campaign: attention (including awareness and knowledge), interest, desire, and action. It is basedon the idea that to influence behavior, recipients of information must first go throughattention, interest, and desire phases. However, not all information campaigns havebehavior change as their ultimate goal. Some campaigns may have, as a primaryobjective, increasing knowledge of the public for its own sake.
The first response level is attention. Attention focuses primarily on increasing thetarget audience’s awareness and knowledge of the wildlife agency, issues related towildlife management, and wildlife viewing opportunities. The second response level isinterest. The target audience may be aware of wildlife viewing opportunities,however, they may not have seriously considered participating. This stage attempts tomotivate the audience to learn more. This may be done by not only focusing on theexperiences and resources that are available to a target audience but also on thebenefits to the target audience in taking advantage of specific wildlife viewingopportunities. The final response level is action. At this stage, the audience isencouraged to take some action, including actually participating in wildlife viewingactivities or less physical behavior, such as support for specific wildlife management

Communication Campaigns for Wildlife Management 43
activities. Information should focus on the benefits of participation as well as theremoval of perceived constraints to participation.
Phase 4. Develop the message
This phase addresses the question: What kinds of information will you provide? Theextent to which a target audience receives, pays attention to, understands, remembers,and/or responds to an information and education campaign depends on the content andexecution of the message. Characteristics of the target audience should be consideredin encouraging effectiveness of the message. However, there are several keyconsiderations for increasing the effectiveness of an information program.
The effectiveness of the information program. The most effective way to obtainthe desired response from the target audience is to insure that they pay attention toand think about the message. Several factors influence whether an individual willelaborate on information provided in a message (Bright and Manfredo 1993).
< Make sure the language used in the message is consistent with the knowledge andeducation level of the audience. Technical jargon should be avoided unless it is animportant part of the message and is adequately explained.
< Where possible, combine visual or audio (nonverbal) elements of an informationcampaign with the written or spoken word (verbal). This increases the ability ofthe target audience to comprehend and retain information.
< Repeating a message affects comprehension and persuasiveness. This is done bypresenting the same message several times, repeating the message in differentformats, or using several sources to present the message.
< It is important to make sure that the information provided is relevant to theexperience the target audience desires.
< The message should be geared toward the knowledge and experience level of theaudience for which it is intended.
< If the target audience perceives the agency has expertise or knowledge related tothe issue and is also trustworthy in providing information, they are more likely toconsider the information and accept it.
Phase 5. Select the media strategy and implement the campaign
This phase addresses the questions: How and when will the information be provided? Although we describe selection of the media strategy as a phase followingdevelopment of the message, it is likely that these two phases will be addressed at the
44 Communication Campaigns for Wildlife Management
same time. The media planner should also consider what media would be best topresent those messages. Selection of the media involves determining the major mediacategory, selecting the specific media vehicle, and deciding media timing.
Step 1. Determine the major media category. There are many categories ofmedia for an information campaign, each with advantages and disadvantages based oncost and ability to reach the target audience. The main considerations in determiningmedia type are (1) the media habits of the target audience, (2) the nature of the“product” and its suitability to the media type, (3) the timing and complexity of themessage, and (4) the cost.
Step 2. Select the specific media vehicle. The next step to selecting the mediastrategy is to decide which specific vehicle should be used. Factors such as circulationdata for specific media vehicles as well as cost data for different advertisement sizes,color options (if applicable), advertisement positions (e.g., within a newspaper ormagazine), and quantities of insertions (e.g., for brochures) should be considered. Inaddition, qualitative characteristics like credibility, prestige, geographic editioning(different editions of the same magazine or newspaper), reproduction quality, andpsychological impact are important.
Step 3. Decide media timing. The third step in selecting the media strategy is todecide the timing of the campaign. The first option is seasonal timing. Most wildlife-based recreation experiences, such as viewing migratory birds or hunting elk, takeplace during a particular time of year. Information campaigns about specific wildlife-related recreation experiences should coincide with these times to help targetaudiences plan for trips.
A second option is short-run timing, distributed during a short period. A burstpattern concentrates all exposures in a short space of time, such as one day. Forexample, information about elk viewing opportunities during the fall might be includedas a supplement to the Sunday newspaper. This can create both attention and interest. A continuous pattern distributes information evenly throughout the period. Anexample is daily public service announcements, describing opportunities to view elk,aired on the radio throughout the week as well as on weekends. A third way is anintermittent pattern, where small bursts of information are provided in succession withnone occurring between bursts.
Phase 6. Evaluate the information campaign
This phase addresses the question: How will you measure achievement of yourcommunication objectives? Unfortunately, evaluation of the communication programor message delivery is typically overlooked. However, unless an evaluation isconducted, the organization will not be able to determine whether their efforts weresuccessful, especially in terms of meeting objectives.

Communication Campaigns for Wildlife Management 45
Summative or impact evaluation. The most common type of program evaluation issummative or impact evaluation. It is conducted once the media messages have beendeveloped and the plan implemented. The purpose of this type of evaluation is todetermine whether the information campaign was effective in achieving its goals andobjectives. There are three reasons that summative evaluation of an informationcampaign is conducted. The first reason is accountability. For example, governmentorganizations such as a wildlife management agency are naturally interested injustifying the public money spent on an information campaign by answering thequestion: “Did it work?” Second is replication and generalizability; that is, theextent to which the information campaign can be repeated or revised, and whether itcan be used in other situations. Third is an assessment of organization objectives. Summative evaluation can determine whether the agency is meeting its overall goalsand objectives and/or the need to establish new objectives.
Three evaluation models describe an impact evaluation. The advertising approachsurveys a random sample of the target audience. The survey is designed to learnwhether the target audience (a) recalls and recognizes the message, (b) likes thecampaign materials, and (c) intends to act on their new knowledge and attitudes. Theimpact-monitoring approach tracks the impacts that occur as a result of theinformation campaign. This includes monitoring the number of requests forinformation about a particular wildlife viewing opportunity or actual visitation to thesite at periodic intervals following the campaign. The experimental approachsystematically compares groups exposed to the information campaign to those notexposed to the information. This approach helps identify whether exposure to thecampaign is the cause of behavior.
Future research
Future research should focus primarily on the following areas:
< Identification of different segments of wildlife management stakeholders. Wildlifemanagement is important to different segments for very different reasons. Thesedifferences will affect the types of information that these groups should receive aswell as the media used to reach these groups.
< Determination of the types of messages that are most effective. Basic research insocial psychology is going on to determine the types of messages that are mosteffective at educating the public as well as influencing public behavior. Researchers in the field of natural resource and wildlife management shouldcontribute applied research to determine the most effective types of messages fortheir audiences.
46 Communication Campaigns for Wildlife Management
< Underlying the above two research suggestions is the need for improved methodsof evaluating information programs. The final step of developing a communicationcampaign, evaluation, is often done poorly if at all. However, evaluation is a keyactivity that insures that the goals and objectives of an information campaign aremet and that future campaigns are done effectively.
Literature cited
Bright, A. D., and M. J. Manfredo. 1993. An overview of recent advancements inpersuasion theory and their relevance to natural resource management. In Culture,Conflict, and Communication in the Wildland-Urban Interface, eds., A. W.Ewert, D. J. Chavez, and A. W. Magill, 135-146. Boulder, CO: Westview Press.
Fine S. H. 1991. Social marketing: Promoting the causes of public and nonprofitagencies. Boston: Allyn and Bacon.
McNamara, E., T. Kurth, and D. Hansen. 1981. Communication efforts to preventwildfires. In Public Communication Campaigns, eds., R. E. Rice and W. J.Paisley, 143-160. Beverly Hills, CA: Sage Publications.
Pierce, C. L., and M. J. Manfredo. 1997. A profile of North American wildlifeagencies' viewing programs. Human Dimensions of Wildlife 2(3):27-41.
Rice, R. E., and C. Atkin. 1994. Principles of successful public communicationcampaigns. In Media Effects: Advances in Theory and Research, eds., J. Bryantand D. Zillmann, 365-387. Hillsdale, NJ: Lawrence Erlbaum Associates, Inc.
Stout, R. J., and B. A. Knuth. 1993. Using a communication strategy to enhancecommunity support for management. In Urban Deer: A Manageable Resource?,ed., J. B. McAninch. Proceedings of a Symposium held at the 55th Midwest Fishand Wildlife Conference, St. Louis, MO, December 12-14, 1993.

10Davis, J. B. 2000. Estimating visitor use. In Human Dimensions of Natural ResourceManagement: Emerging Issues and Practical Applications, eds. Fulton, D. C, K. C. Nelson, D. H. Anderson,and D. W. Lime. St. Paul, MN: Cooperative Park Studies Program, University of Minnesota, Department ofForest Resources.
11Chair, Division of Science and Technology, and Environmental Studies Program Coordinator,Southern Vermont College, 982 Mansion Drive, Bennington, VT 05201.
Estimating Visitor Use10
John B. Davis11
Background information
Need for this study
In Fulfilling the Promise, Recommendation P2 (Update the National Public UseRequirements), the U.S. Fish and Wildlife Service has promised to make public usereporting consistent and accurate (U.S. Fish and Wildlife Service 1999). Each yearmore people are visiting parks, natural areas, and outdoor recreation sites of all types,including National Wildlife Refuges. Public use figures collected between 1995 and1999 by refuges and reported in the Refuge Management Information System (RMIS)database show an increase from 27.6 million to 31.4 million visitors.
However, the actual process by which data is collected is haphazard, with each refugeusing its own methods with varying degrees of accuracy and reliability. Obstacles toimproving public use estimation include a lack of information about how to measurethe number of visitors using refuges and waterfowl production areas, budget and staffconstraints, and the cumbersome process to receive public survey approval. Staffcharged with reporting public use figures continue to experience frustration with thegap between the reports and the reality.
In Fulfilling the Promise, at least three specific needs are identified requiring accuratedata about the number of visitors, namely, to
1. evaluate existing levels of service to the public,2. document results of public use programs, and3. demonstrate accomplishments to the Congress and the American people.
To meet these needs, the U.S. Fish and Wildlife Service has promised to develop asystem-wide visitor counting handbook and train refuge staff to report visitor useaccurately and consistently and evaluate the quality of visitor experience. This paper isessentially a summary of the first draft version of the handbook. The techniques arebased on those developed in the 1970s by Mischon and Wyatt (1979) for the U.S.Army Corps of Engineers, with modifications appropriate to the conditions found in

48 Estimating Visitor Use
National Wildlife Refuges and Wetland Management Districts. A series of site-specificfield tests of the sampling methods is currently being conducted in cooperation withthe staff of nine refuges. From the results of the field tests, the applicability of themethods to the typical conditions within the Refuge System will be assessed, and aplan prepared for the application of the methods to all units within the system.
Important terminology
For the purposes of this paper and the subsequent handbook, four terms must bedefined: visit, project, area, and site.
Visit. A visit is entry of one person into a public area to engage in one or moreactivities. This is a headcount only, and does not indicate the duration of the activityor the length of the stay. In many instances, the term visit and visitor are notsynonymous. A single visitor may enter a public use area more than once in a singleday, but many counting techniques are designed to record each visit.
Project, Area, and Site. Hierarchical terms—project, area, and site—thatdistinguish between different levels of physical layout or organization of a facility. Aproject is generally a single management entity, and is usually composed of severalpublic-use areas, and each area may have one or more sites. As an example, aNational Wildlife Refuge is a project within the meaning of this paper because it is arecognized management entity responsible for tracking and reporting public use. Within a particular refuge, one area may be designated for hunting of upland gamebirds during appropriate seasons. For access to the hunting area, refuge managementmay designate a parking lot, a site, where hunters obtain a self-registration permitbefore entering the area.
Resource settings
National Wildlife Refuges, perhaps more than any other outdoor recreation resource,are not uniform in their setting. The setting of a resource is determined by the level ofmanagerial control over access to the resource and by the degree of dispersion of therecreation opportunities within the resource. Based on these variables, there are threeimportant types of resource setting that include many National Wildlife Refuges.
Controlled access, primarily by vehicles through a gated or monitoredentrance, to recreation opportunities concentrated along roadways. These areresource settings that are representative of many, but by no means a majority ofrefuges. Examples of this type would include refuges with entrance fee stations orthose with a single primary entrance road. Even if access is not currently controlled,the fact that there is a single entrance makes it possible to count all visitors.

Estimating Visitor Use 49
Multiple access through open or unregulated roads or trails to recreationopportunities concentrated along roadways or at developed sites. In manyinstances access will be by vehicle, possibly along state or county roads or throughopen refuge roads. However, for refuges in populated locations, access by foot orbicycle from adjacent property, especially over trails, may be important. Likewise,significant use may occur during the hours between the closing of refuge offices andthe onset of darkness when most refuges are closed to public access.
Multiple access through open or unregulated roads, trails, or waterways todispersed recreation opportunities that are not concentrated along roadwaysor are very numerous or widely separated. Examples of this setting includerefuges where access is gained to rivers, lakes or impoundments within the refuge,either by land from refuge boat launches or from open waterways. Even in caseswhere the launch points are all controlled by the refuge, counting may be problematicif the launch areas are widely distributed or accessed from non-refuge roads. WetlandManagement Districts also fit within this category because of the widely dispersednature of the areas within the project.
This paper will focus on the first two resource settings, which are typical of a majorityof National Wildlife Refuges. Future studies will examine methods for estimatingvisitor use in dispersed areas.
Simplified model of visitor estimation
For the manager of a refuge, the task of counting visitors can be viewed in relativelysimple terms. Because of the requirements of the RMIS framework, the manager mustreport both the total number of visits annually to the project for all purposes, and thevisits for specifically identified activities such as driving a wildlife auto-tour orfreshwater fishing. In addition, a manager may wish information regarding the use inspecific areas of the project, in order to develop or revise maintenance plans or staffingallocations. Figure 1 is a schematic representation of a project containing three publicuse areas. In principle, the total number of visits to the project can be expressed as asimple formula:
Total Visits = Raw Count × Weight (1)
The manager’s task is to obtain a raw count of some attribute directly related to thenumber of visits, as well as any proportional multipliers, or weights needed to convertthe raw count to actual visits. For example, many refuges collect raw counts of thenumber of vehicles that enter the project, but to calculate the number of visits, the rawcount must be multiplied by the number of persons per vehicle. The average numberof persons per vehicle is a weight.

50 Estimating Visitor Use
Project Boundary
Area AActivities 2 & 3
Area B
Activity 1
Activity 2
Area C
Total
Visits
Figure 1. Simplified model of visitor use in an outdoor recreation resource. Asingle project, defined by managerial or administrative boundaries, may becomposed of several recreation areas, each of which may provide sites forparticipation in specific recreation activities. Management is concerned withestimating the total number of visits as well as the number of activity days. Thevisitor may engage in one or more activities at different sites. Therefore, thenumber of activity days is generally greater than the total number of visits forthe same period.
As shown schematically in Figure 1, once the visitors have entered the projectboundary they may disperse to one or more wildlife-related activities. A basicprinciple of counting visitors is that the total number of visits does not equal the sumof all visitor activities, because a single visitor may engage in combinations of activitiesand because a single recreation area within the project may include more than oneactivity. The proportion of actual visits devoted to a particular activity is referred toas the load or load factor for that activity, and represented by the following equation:
Activity Visit = Total Visits × Activity Load Factor (2)
The load factor is simply the percentage of total visits devoted to the activity. If allvisitors engaged in every activity, then all load factors would be one (1.0). In practice,they are always less than one. In order to report activity visits, the manager musteither have a reliable estimate of the total number of visits and the load factor for theactivity, or directly determine the number of visitors who engage in the activity.

Estimating Visitor Use 51
Techniques of visitor estimation
Both weights and load factors may be estimated using a variety of techniques. Regardless of the technique chosen, weights and load factors should be determined bya reliable, planned, documented methodology. Mischon and Wyatt (1979) identifiedfive techniques of collecting data about the number of visitors: self-registration,entrance fees and use permits, direct observations, indirect estimation, and surveys. Each of these techniques is being used successfully today in the National WildlifeRefuges, although no single technique is appropriate to every situation.
Self-registration
This category includes guest books at Visitor Centers, trail registers, and non-quotahunter or angler permits. In many cases the respondent is asked to indicate thenumber of persons in the party, the types of activities engaged in, and the length oftheir stay. Information about the types of activities engaged in is particularly helpfulbecause it can be used to estimate load factors. Although self-registration tools areinexpensive and may be the only feasible methods at remote trail-heads or parkingareas, accuracy of the counts is always limited by uncertainty about the degree ofcompliance. Many visitors clearly do not bother registering. Repeat visitors are highlyunlikely to register each time they visit.
Entrance fee stations and use permits
Entrance fees may be collected at a staffed entrance station, a self-pay station such asan “iron ranger,” or at a visitor center. Examples of use permits, both with andwithout fees, include campground registration, day use permits for river access orquota permits for hunters and anglers. Although entrance fees are a valuable source ofdata regarding trends in the number of visitors, they do not provide completeinformation about the number of visitors unless there is a staffed fee booth where allvisitors must stop before entering the refuge. For a refuge that requires a self-payentrance fee but does not require holders of annual passes, Duck Stamps or GoldenEagle permits to register upon entering, the entrance fees will represent only a fractionof total visits. In contrast, use permits are much more accurate sources of informationfor particular activities, such as boating or quota hunts, especially if it is known thatthe refuge devotes significant time to permit checks and enforcement.
Direct observation
Direct observation includes any method where an individual visitor is monitoredvisually or by video camera. Obviously, direct observation can provide highly accuratecounts, but is extremely time-intensive and capital-intensive. One very commonmethod of direct observation is to have a receptionist, volunteer or staff member “click

52 Estimating Visitor Use
in” each visitor who enters the visitor center or contact station, on a hand-held tallycounter. Direct observation also includes situations where a volunteer or staff memberconducts a tour, workshop or class for a group of visitors, and the number ofparticipants is determined by direct count. Direct observation in the field is mostvaluable if it is incorporated as a periodic supplement to other counting methods toobtain estimates of weights or load factors, and if it can be conducted by volunteers,interns, or Y.C.C. workers under the supervision of a regular staff member.
Indirect estimation
Indirect estimation includes some of the most frequently used methods of estimatingvisitor use, such as traffic meters and door counters, the number of brochuresdispensed at kiosks, or the number of automobiles parked at a particular area. Allthese are considered indirect because the visitors themselves are not observed. Whatis observed is some sign or evidence of their visit. For example, a traffic counter mayrecord the number of vehicles passing a road, but it does not record the number ofpersons in the vehicle. In spite of this uncertainty, in many cases indirect estimationtechniques represent the most cost-effective methods of acquiring large amounts ofdata without tying up staff hours.
Surveys
In the category of surveys are such tools as mail-back questionnaires placed onwindshields, traffic-stop surveys conducted by volunteers, contractors or staff,contracted telephone or mail surveys, and hunter reports at check-in stations. Ifconducted properly, surveys are extremely accurate. They can provide a wealth ofinformation about weights and load factors such as the number of persons per vehicle,the type of activity each party participates in, and even marketing information such asdemographics and user preferences. However, surveys are expensive. One additionalcomplication is that surveys used on federal lands must be approved through a formalOffice of Management and Business (OMB) procedure requiring significant advancenotice.
Case studies
As an illustration of the general concepts of estimating visitor use, and the applicationof some specific techniques, two case studies are presented that are typical ofconditions in the National Wildlife Refuges. Although neither case study represents aspecific refuge, all details are based on observation of actual techniques.

Estimating Visitor Use 53
Case study 1: Example of estimating total visits to an area
This case study involves a single recreation area rather than an entire project. Thefocus of the area is a boat ramp giving access to a project lake where fishing isallowed. The area includes a parking lot, several picnic tables, an interpretive kioskdescribing the lake and birds that may be observed in the vicinity, and a comfortstation. The kiosk also dispenses Refuge brochures, including a bird list. There isonly one road into the area. Hours are from daylight to dusk. Use is highly seasonal,with the majority of visitors using the area from mid-May to mid-September.
The goal in this case study is to determine the total number of visits to the area. Recallfrom the simplified model of estimating visitor use that the total number of visits to aproject or a specific area is found from equation (1). In this example, a traffic counteris placed on the outbound lane of the entrance road to the area so the raw count is thenumber of vehicles leaving the area that cross the counter in a specified period. However, the traffic counter cannot distinguish between visitors and staff. The rawcount will always be too large and must be adjusted by subtracting administrative use,as follows:
Net (Adjusted) Count = Gross (Raw) Count - Administrative Use (3)
Once the net count has been determined, it is multiplied by one or more weights toobtain the actual number of visits. Figure 2 shows the steps in the process ofcalculating the number of visits per month using a traffic counter.
Case study 2: Example of using load factors
The second case study deals with an entire project, a National Wildlife Refugeincluding a Visitor Center staffed 8:00 a.m. to 4:00 p.m., and a one-way auto tourwith brochures dispensed at an interpretive kiosk. A county road passes through therefuge, and access to a refuge fishing area is obtained from the county road. Therefuge is within 15 miles of a town of 5,000, and receives a significant amount of useby local citizens, particularly in the evening. The fishing area is especially popular withlocal youths, but appears to receive little use from other refuge visitors. There is an“electric eye” counter on the Visitor Center door, and a self-registration guest bookwith columns for the visitor to indicate which public uses they will be engaged in. There is one traffic counter available, which uses a buried, pressure-sensitivetransducer. The counter’s electronics can be set with a delay in order to count onlyone axle per vehicle.
In this case, there is no direct measure of the total number of visitors because of themultiple entries and through-roads. However, the total number of visitors is related tothe three activities, symbolically represented by the load factors L1 (visitor center), L2

54 Estimating Visitor Use
1. Raw Count = Traffic Meter Count for a one-month period. Ni = 4000 (counter reading on the last day of the current month)Ni-1 = 2800 (counter reading on the last day of the previous month)
Counts / Month = Ni - Ni-1 = 1200
2. The meter counts once per axle. Because the primary focus of the area is the boatramp, most vehicles will be drawing a trailer. Therefore the first weight, or multiplier W1 isapproximately 1/3 or 0.33. If many vehicles with only two axles use the road, the weightwill have to be adjusted by periodic direct observation of a sample of all vehicles.
Total Vehicles = (Counts / Month) × W1
= 400
3. Administrative uses account for an average of 10 trips per week, or 40 per month.Visitor Vehicles = Total Vehicles – Administrative Trips
= 360
4. The second weight or multiplier, W2 represents the average number of persons pervehicle. The value of W2 must be determined by direct observation of a sample of visitorvehicles. In this example, W2 is equal to 3.0
Number of Visitors = Net Visitor Vehicles × W2 = 360 vehicles × 3.0 visitors/vehicle = 1080 visitors in this month
Figure 2. Example calculation of the number of visitors per month to the recreation area in Case Study 1. Atraffic meter, which is classified as an indirect estimation tool, is the source of raw data for the estimation ofvisitor use. The road leading into the area is a dead-end at the boat ramp. The traffic meter is set up on theoutbound lane of the area road, so it counts only vehicles leaving the area.
(wildlife loop) and L3 (fishing pond). From the guest register in the Visitor Center,estimates can be obtained of the Load Factors. For example,
L2 = (Number of “T” in Auto Tour Column / Total Registered Visitors) (4)
For example, the visitor center register reveals that 60 percent of registered visitorsindicate they intend to drive the auto tour, and 5 percent say they intend to stop at thefishing pond. Since all persons who registered stopped at the visitor center, the 60percent who will drive the auto tour are all double-counts who will do both activities. From best-professional-judgement, it is also known that many people drive the autotour after the visitor center is closed. Therefore, the wildlife loop visits account forthe majority of the total visits, with the addition of a fraction of the visitor center visitsand a fraction of the fishing visits. The number of visitors who drive the wildlife loopserves as a “base figure,” and the total estimated visitation can be found from that basefigure. In Figure 3, this approach is used to develop a formula can that combinesknown numbers and estimated load factors:

Estimating Visitor Use 55
1. The following weighted formulae are used to calculate actual counts from raw counts onthe traffic meter “M” and the Visitor Center door counter:
Estimated Visitor Center Visits = Door Counts × W1
Estimated Wildlife Loop Visits = Net Counts from “M” × W2
with the following weights used:
W1 = 0.5 visitors/count on door counter (each person counted going in and going out)
W2 = 3.0 visitors/vehicle (from direct observation of a sample of visitor vehicles)
2. The number of persons who fish at the pond is determined by periodic sampling of the number of cars in the parking lot at the pond,
Estimated Fishing Visits = (Average vehicles/day) × (30 days/month) × W2
3. In this example, suppose
Estimated Visitor Center Visits = 20,000Estimated Wildlife Loop Visits = 60,000Estimated Fishing Visits = 3,000
From the load factor for wildlife visits, 60% of visitor center visits are also wildlife visits, so acorrection for double counts is applied:
Double Counts for Auto Tour = Estimated Visitor Center Counts x 0.60 = 12,000
The correction for the number of people who stop at the visitor center and also go fishingwill be
Double Counts for Pond = Estimated Visitor Center Counts x 0.05 = 400
4. The total estimated visitation to this project is,
Total Estimated Visits = 60,000 + (20,000 - 12,000) + (3,000 - 400) = 70,600
Figure 3. Example of the estimation of total visits and specific activity visits. The base figure for calculationsis the number of persons who drive the wildlife auto tour, determined from a weighted count of the number ofvehicles that activate a traffic counter.

56 Estimating Visitor Use
Total Estimated Visitors = -Wildlife Loop Visits + (Visitor Center Visits - Double Counts) + (Fishing Visits - Double Counts)
However, because not all visitors will stop and sign the register, there is a possibilityof sampling bias if a particular type of visitor, like a bird watcher, is more likely to signin than a group of local youths who head straight for the fishing pond. As a check ofthe accuracy of the load factors, it is necessary to conduct periodic direct observationsamples to evaluate the number of vehicles involved in each activity. At this station,the vehicle count is already conducted at the fishing pond. A sampling schedule couldbe designed to do the same thing periodically for the auto tour and the visitor centerparking lot. This method will also establish how many vehicles are engaging inmultiple activities.
Future directions for research and discussion
At present, the requirements of the RMIS reporting framework will continue to dictatewhat type of information about visitor use will be collected on National WildlifeRefuges. However, many refuge managers and outdoor recreation planners haveraised important questions about the circumstances under which people are consideredvisitors to a refuge, and the relative importance of specific categories of visitors to thetotal annual count. The answers to some of these would require policy statements ona national level by the Refuge System and the Fish and Wildlife Service. The issuesare listed here as a question for future discussion, “Whom should we be using time,money and energy to count?”
< Only those visitors engaged in the “big six” priority public uses: hunting, fishing,wildlife observation, photography, interpretation, and environmental education?
< Only those who actually know they are on a refuge?
< Persons who are driving through the refuge, especially if they are on a local, stateor federal highway but do not actually stop at any refuge facilities?
< Persons who are hunting or fishing for subsistence but not recreation?
< Local visitors who use a refuge much like a convenient public park, especially afternormal business hours, or visitors who come specifically to the refuge from agreater distance?
< Visitors engaged in recreational activities such as power-boating, swimming,snowmobiling or picnicking?

Estimating Visitor Use 57
A related question is, “Does it really matter how many people visit a refuge, or is itmore important to know what impact they are having?” The answer to this questionis important for future decisions about the allocation of scarce management resourcesto visitor studies. If the answer is that impacts are more important, then the emphasiswould shift away from simply estimating numbers to questions of visitor satisfaction,crowding, and social carrying capacity.
Regarding the future direction of research in the methods of estimating visitor use inthe National Wildlife Refuge System, the development of a system-wide handbook isonly the first step. Although the differences between refuge settings sometimes appearto outweigh their similarities, it would be helpful if the RMIS reporting frameworkincluded an electronic clearinghouse for the results of studies of visitor use. Thiswould possibly reduce the amount of duplication of effort in estimating visitor use. One clear example is in the area of estimating the number of persons per vehicle. Many refuges use traffic counters to detect vehicles, but there is often a great mysterysurrounding the multiplier for persons per vehicle. An electronic clearinghouse orbulletin board would be a place that refuges could post the results of studies theyconducted about the number of persons per vehicle. It is unlikely that a nationalaverage value could be adopted, but managers would benefit by comparing theirsituations to those at other, similar stations.
Literature cited
Mischon, R. R., and C. R. Wyat. 1979. A Handbook for Conducting RecreationSurveys and Calculating Attendance at Corps of Engineers Projects. Springfield,VA: National Technical Information Service.
U.S. Fish and Wildlife Service. 1999. Fulfilling the Promise. Washington, D.C.:U.S. Government Printing Office.

12Lime, D. W., D. H. Anderson, and T. L. Wang. 2000. A decision process to maintain the quality ofrecreation resources and visitor experiences. In Human Dimensions of Natural Resource Management: EmergingIssues and Practical Applications, eds. Fulton, D. C., K. C. Nelson, D. H. Anderson, and D. W. Lime. St. Paul,MN: Cooperative Park Studies Program, University of Minnesota, Department of Forest Resources.
13Senior Research Associate and Professor, respectively, Department of Forest Resources, University ofMinnesota, Cooperative Park Studies Program, 115 Green Hall, 1530 Cleveland Avenue North, St. Paul, MN 55108; and Assistant Professor, Division of Forestry, P.O. Box 6125, West Virginia University, Morgantown, WV 26506.
A Decision Process to Maintain the Quality ofRecreation Resources and Visitor Experiences12
David W. Lime, Dorothy H. Anderson, and Theresa L. Wang13
A large Midwestern wildlife refuge managed by the U.S. Fish and WildlifeService had witnessed rapidly-growing visitor use during the previousdecade. The refuge was about 85 miles from a large metropolitan areathat had experienced significant in-migration in recent years. The refugealso was 20 miles from a community of about 25,000 people where thepopulation had remained relatively stable over the past three decades.
Much of the growth in visitation at the refuge, particularly on weekends,was attributed to an apparent surge in demand for camping in the refuge’sthree relatively small vehicle-access campgrounds. Each campgroundwas adjacent to a water body (lake or stream), rustic in nature, containedabout 25 sites well spaced from one another, provided well water fordrinking and pit toilets, and was reached by at least 12 miles of gravelroad from paved main highways.
A readily apparent impact of the increased demand for campingon the refuge was that designated sites in all three of thecampgrounds were full by 5:00 p.m. on most Friday nights. BySaturday midmorning, overflow camping had spread tonondesignated locations both between existing sites and intonumerous “open” and nonforested areas in and near thecampground. At times the number of individual groups occupyinga campground reached nearly 50—twice the number of designatedsites!
Anecdotal data collected by managers suggested that much of theincreased demand for camping was coming from the growing metropolitanarea 85 miles away and that demand for camping

Maintaining Recreation Resource/Visitor Experience Quality 59
opportunities would continue. Discussions among affected staffsought to develop a plan to address the growing need for morecamping spaces.
It was decided that the “simplest” solution to growing demand was toincrease the size of all three existing campgrounds. Each campgroundwas expanded to about 70 individual sites. The campground internalroads were altered and more sites were added. One new site wasadded between each original site. Because of the enlarged facility, aseptic system was provided. Flush toilets and showers became areality, and electricity was brought into the campground toaccommodate an anticipated demand for growing electronic creaturecomforts. Access roads for two of the campgrounds remained gravelsurfaces but were upgraded for increased traffic and higher speeds. The access road for the third campground was paved to accommodateanticipated traffic and easier access to a convenience store and a baitshop between the campground and the main trunk highway.
The campground “restoration” was completed during the off-season,and campers were exposed to the new facilities the following spring. The management employed at the three campgrounds had immediateand significant effects on the character of the areas and the kinds ofcamping and benefit opportunities provided. The drastic, as well asseemingly subtle changes in the design and types of facilities offeredaltered the character of the campgrounds to the point that they nolonger appealed and were unsatisfactory to many previous visitors. Atransition occurred in which the relatively small, informalcampgrounds evolved into large, modern, intensively developedfacilities. The resulting process of “creeping campgrounddevelopment” forced out those campers who sought solitude, a feelingof smallness, and more direct contact with nature.
In the above scenario, a management strategy was followed that resulted in perhaps moreproblems than it resolved. Campgrounds remained popular and were often filled tocapacity or beyond on most summer weekends. Some overflow camping occurred, butnot to the extent as before the restoration. A different clientele frequented thecampgrounds, and new problems emerged including more littering, noise from dirt bikes,noise from loud radios played after dark, barking pets and pet droppings, and vandalism torestroom facilities.
Only one alternative (increasing the size of each campground) had been considered toaddress the growing demand for camping opportunities. This “off-the-shelf” solution

60 Maintaining Recreation Resource/Visitor Experience Quality
had been used in other refuges within the system, and conventional wisdom suggested “itworked.” Campgrounds remained popular destinations and complaints were few.
Alternative management strategies probably should have been considered and their effectsevaluated. In particular, the displacing of campers attracted to the original campgroundsshould have been evaluated—especially because these campers primarily resided in thesmall community next to the refuge. Not only would these people have difficulty findingalternative camping opportunities to meet their desires and expectations, there is a goodchance their support would wane for refuge programs in general at these and other areas.
A variety of management tactics and actions exist that could have been considered. Theoriginal small, informal campgrounds might have remained with aggressive surveillanceand enforcement put in place to curtail overflow camping in nondesignated areas. Campers not accommodated would have to go elsewhere. Protecting the integrity of theoriginal campground opportunities also could have been sustained by effectively informinginterested visitors of other camping opportunities in the immediate area of therefuge—public as well as private. Furthermore, perhaps more attention should have beengiven to developing new campgrounds to cater to the expanding metropolitan campersincreasingly seeking the refuge for outdoor recreation pursuits. Nearby privatecampgrounds also could be encouraged to help meet growing needs.
This hypothetical story is meant to illustrate how public resource managers canmisdiagnose or underestimate problems and make decisions to resolve problems that cancause new and arguably greater biophysical and social impacts as measured by crowding,congestion, loss of visitor enjoyment, vegetation trampling, wildlife harassment, andrelated variables. Without thoughtful understanding of the nature and magnitude ofrecreation and visitor-caused problems, managers frequently employ strategies that aremarginally successful or create as many problems as they solve. Such solutions are insearch of a problem!
Introduction
Public land management professionals are increasingly challenged to meet a dual andseemingly conflicting mission—to protect and sustain natural and cultural resources forfuture generations as well as to provide high quality and enjoyable experiences for people. Many resource areas, both public and private, are threatened by many visitor-causedimpacts. For some managers the situation is reaching crisis proportions. The biophysicalenvironment is being damaged beyond acceptable limits and the people visiting these areasare no longer attaining the quality experiences and benefits they seek.
Managers, planners, and researchers have long wrestled with ways to addressunacceptable visitor-caused resource impacts effectively, including crowding andcongestion, visitor conflicts, trail and campsite deterioration, vegetation, wildlife, andwater quality impacts, and noncompliant visitor behavior. Such impacts and dialogue
Maintaining Recreation Resource/Visitor Experience Quality 61
among resource professionals have led to a large body of information to support decisionsto eliminate or reduce unacceptable visitor-caused resource impacts. Resource managersalso possess a wealth of first-hand experience related to solving problems on the ground. But, the information is not always available. Managers do not always know what othermanagers have tried on the ground, and managers also do not always know howsuccessful other managers have been in resolving visitor-caused resource impacts.
In the late 1990s, planners with the National Park Service’s (NPS) Denver Service Centerasked the authors to: (1) identify a decision process that managers could use to addressunacceptable visitor-caused resource impacts, and (2) develop resources to supportmanagers in that process. The process also should complement the NPS’s efforts inimplementing the Visitor Experience and Resource Protection (VERP) framework. VERPwas developed to address issues of carrying capacity related to visitor-caused resourceimpacts and impacts to the quality of visitor experiences (Hof and Lime 1997; USDI, NPS1997a, b). Although the handbook can be used by managers who have implementedVERP or other planning frameworks, such as Limits of Acceptable Change (LAC) andVisitor Impact Management (VIM), it also can be used by managers where suchframeworks have not been applied or used to address visitor-caused problems.
The product of this cooperative venture with the Denver Service Center is a step-by-step,easy-to-use handbook for public land managers who have identified unacceptable impactsto resources and visitor experiences and want to act to eliminate them. Although thehandbook was developed for use by NPS managers, it can be used effectively by anyfederal, state, county or local public land manager responsible for managing recreation useand resources.
The purpose of this article is twofold—to describe the decision process developed toaddress unacceptable visitor-caused resource impacts and to inform resource managersand planners of the availability of the handbook.
Understanding the decision process
The decision process for managing social and biophysical impacts of recreation useconsists of five major stages: (1) problem awareness, (2) problem specification, (3)strategy and tactic selection, (4) plan implementation, and (5) monitoring (figure 1). Eachstage is outlined briefly below.
Problem awareness
Problem awareness means managers recognize that a condition exists that has resulted inunacceptable impacts to the resource and/or visitor experience. It also means thatmanagers realize these unacceptable impacts must be addressed. They may discover theseimpacts through their daily management routines, through interacting with the public, in

62 Maintaining Recreation Resource/Visitor Experience Quality
developing general or site management plans, or through ongoing efforts to monitor recreationaluse and use impacts.
Stage 1 Problem awareness • Recognize that unacceptable impacts exist andmust be addressed
Stage 2 Problem specification • Identify impact(s)• Describe acceptable impact levels• Describe existing impact levels• Determine if existing impact is unacceptable• Identify root cause of impact
Stage 3 Strategy and tactic selection • Select appropriate strategy• Identify potential tactics• Evaluate and select appropriate tactics
Stage 4 Plan implementation • Develop implementation plan for selectedmanagement tactics
• Identify specific management actions• Identify person(s) responsible for carrying out
management actions• Implement actions
Stage 5 Monitoring • Monitor effectiveness of actions• If problem arises, return to problem
specification stage
Figure 1. Stages in the decision process for maintaining the quality of resources and visitorexperiences.
Problem specification
The problem specification stage of the decision process consists of identifying specificresource and visitor experience impacts, describing acceptable levels for each impact,describing the existing level of impact, determining whether the existing impact isacceptable, unacceptable or approaching unacceptable levels, and describing the rootcause of the impact. In the recent handbook by Anderson et al. (1998), a worksheet isused to document the problem, its impacts, whether the impacts are acceptable, and thecause of the impact.
The initial activity in the problem specification stage is to identify resource or visitorexperience impacts. Identifying impacts can be done in a variety of ways. Managers canask visitors through formal surveys or public meetings to identify impacts they seeoccurring. Or, if managers have established indicators and standards of quality for

Maintaining Recreation Resource/Visitor Experience Quality 63
resource and visitor experience impacts (e.g., using the VERP, LAC or some otherframework), they can monitor standards over time to check the impact that visitor use hason the resource or the visitor experience.
Some more common impacts to the resource are trail deterioration, campsitedeterioration, water pollution, wildlife and fishery impacts, and soil compaction (Table 1). Some more common visitor experience impacts are crowding, visitor conflicts, andnoncompliant behavior.
Once impacts have been identified, the manager determines what an acceptable level is foreach impact. If indicators and standards have been prescribed for an impact, then theacceptable level is the prescribed standard. If indicators and standards of quality do notexist, the manager needs to decide what is acceptable or how much impact can betolerated before management intervention is required. These acceptable levels of impactcan take the form of a “best educated guess.” Managers may be helped in their decisionprocess by involving visitors and other relevant stakeholders in discussions of acceptablelevels of resource and visitor experience impacts. Past experience that managers may havehad with a specific impact also may be useful in determining an acceptable level of impact.
After the acceptable level for an impact has been determined, the manager needs todescribe the existing level of the impact. Where indicators and standards exist, theexisting impact can be measured and recorded. Where they do not exist, the managershould describe in detail where and when the impact occurs, how much of it occurs, andwho or what is impacted.
Determining whether an impact is acceptable or not can be done by monitoring standards,where standards have been implemented, and comparing values obtained throughmonitoring with previously established standards to determine if the existing level ofimpact is acceptable, unacceptable, or approaching unacceptable levels. Impacts outsideestablished standards are unacceptable and should be addressed through appropriatemanagement actions. Impacts that meet or are approaching the standard, although stillacceptable, might signify deteriorating conditions. If so, managers should act accordinglyto stop the deteriorating condition before it exceeds the standard. Impacts well withinprescribed standards are acceptable and signify that no change in management is needed atthis time.
When standards have not been established, determining what level of impact is acceptableis still possible. However, it can be a time-consuming and controversial task. Managerscan ask visitors through formal surveys or public meetings if a specific impact isacceptable or not. Managers also can consult with resource experts to determine whethera particular impact is acceptable. For example, an expert panel of individuals could visit asite to offer their informed and collective ideas about a problem (Hof and Lime 1997). Such an interdisciplinary team could spend three to four days at a location exploring thesite’s purpose and significance, existing resources and existing conditions, and so forth. A

64 Maintaining Recreation Resource/Visitor Experience Quality
Table 1. Examples of resource and visitor experience impacts.
Resource Impacts
Trail deterioration, trail erosion, excessive trail muddiness, excessive trail width, excessive trail depth/development of tread ruts or grooves; development of social trails.
Campsite deterioration, excessive campsite size, loss of vegetation, erosion of campsite soils, proliferation oftent sites, depletion of dead and downed wood for campfires, proliferation of fire rings; proliferation ofcampsites.
Cultural resource deterioration, defacement of cultural resources, theft of cultural resources.
Improper disposal of human body waste, unacceptable amounts of human body waste at site.
Water pollution, contamination of water body with fecal material, soap residue, chemical substances, or foodand animal remains.
Unacceptable levels or types of litter, improper disposal of garbage, unacceptable evidence of humans (e.g.,trail markers, cairns).
Trampling of vegetation, loss of herbaceous vegetation or seedlings, change in species composition,introduction of exotic species, improper collection of specimens, deterioration of grazing areas, trampling oftree roots, nails in trees, peeling of bark, carving initials/words into bark, felling of live trees.
Soil compaction, erosion of organic litter and soil, excessive muddiness, disturbance of cryptobiotic crust.
Wildlife and fishery impacts, destruction or loss of habitat, change in species composition, introduction ofexotic fauna, harassment or disturbance of wildlife, competition for food sources, attraction of wildlife, illegalhunting or fishing.
Visitor Experience Impacts
Unacceptable levels of crowding at attraction sites; unacceptable number of encounters at trailheads, in visitorcenters, on trails, or at campsites; congestion, unacceptable traffic conditions on park roads, lack of availableparking spaces.
Visitor conflicts due to incompatible uses, encounters with large groups or parties dissimilar to one=s own,rowdiness by itself or in combination with excessive consumption of alcohol, visitor displacement (spatial,temporal, or total).
Noncompliant behavior, vandalism, resource destructive behavior.
Inadequate or inappropriate levels of access to facilities, natural areas, or cultural resources; facility designthat fails to accommodate the needs of the broadest possible spectrum of people, including persons withdisabilities.
Threats to visitor safety, behavior that jeopardizes the safety of the individual or of other visitors, failure to maintain a safe environment through facility design, maintenance, or other means.

Maintaining Recreation Resource/Visitor Experience Quality 65
final interactive meeting with area staff could conclude with written recommendationsconcerning what might be appropriate indicators and standards for the site.
Once a resource or visitor experience impact has been identified as unacceptable, the nextactivity in the problem specification stage is to identify the cause of the unacceptableimpact. After the cause is known, then appropriate strategies and tactics are selected toaddress the cause (i.e., stage three in figure 1).
Strategy and tactic selection
The strategy and tactic selection stage consists of thinking in broad terms—thinkingstrategically—about how to address a problem, and then narrowing the thinking to selectspecific tactics to resolve unacceptable impacts caused by the problem. Managementstrategies are general ways in which managers address unacceptable impacts to resourcesand visitor experiences. Management tactics are the means by which a strategy isimplemented. In the handbook by Anderson et al. (1998), a worksheet provides a spacefor managers to note the strategies and tactics they think might work. The worksheetshould be used to help guide the discussion and keep track of specific comments groupmembers have about specific tactics. The handbook also is meant to serve as a guide forfinal tactic selection.
Over the past 30 years, researchers have identified and analyzed many strategies foraddressing unacceptable impacts to resources and visitor experiences. Five primarystrategies have resulted:
1. Modify the character of visitor use by controlling where use occurs, when useoccurs, what type of use occurs, and how visitors behave.
2. Modify the resource base by increasing resource durability or maintaining/rehabilitating the resource.
3. Increase the supply of recreation opportunities.
4. Reduce use in the entire area, or in problem areas only.
5. Modify visitor attitudes and expectations.
These five strategies are appropriate for a variety of resource settings, including bothfrontcountry and backcountry conditions. Managers are encouraged to consider all of thestrategies before selecting one or more to address specific unacceptable impacts. Using acombination of strategies to solve many unacceptable impacts to the resource and visitorexperiences provides managers with flexibility to address the multiple dimensions andcauses of unacceptable impacts.

66 Maintaining Recreation Resource/Visitor Experience Quality
Once a strategy or combination of strategies has been selected, potential tactics areselected that might be used to resolve an unacceptable impact (table 2). For ease ofdiscussion, the 25 potential tactics are grouped into five broad categories: (1) sitemanagement, (2) rationing and allocation, (3) regulations, (4) deterrence and enforcement,and (5) visitor education. Each category represents a distinct approach to resolvingunacceptable impacts to the resource and visitor experience.
Some categories are more appropriate for impacts related to the resource and others aremore appropriate for impacts related to visitor experiences. For example, sitemanagement tactics are directly related to manipulating the biophysical resource in someway. Tactics outlined in the other categories are more related to management of thevisitor or visitor behavior. Before choosing a tactic or set of tactics, the manager shouldreview as many tactics as possible and note which one(s) might apply to resolving theproblem.
The last step in the strategy and tactic selection stage is to evaluate and select tactics. Theevaluation and selection of final tactics are probably best accomplished by managers andtheir staff through group discussion.
Plan implementation
The fourth stage in the decision process is plan implementation (figure 1). In thehandbook by Anderson et al. (1998), a worksheet provides a suggested framework for theimplementation plan. In this stage managers develop an implementation plan for themanagement tactics they selected in stage three of the process. Without a tacticimplementation plan, unacceptable impacts likely will remain. Tactics by themselves arenot management actions. They suggest a particular course of action but do not specify theactions managers must take to resolve unacceptable impacts. Each tactic selected in stagethree of the process may have one or more specific management actions attached to it.
Monitoring
Management actions must often be viewed as experiments. The ability of managers topredict the consequences of actions is limited because there is much uncertainty abouthow people interact with natural and cultural resources. Monitoring is an ongoing, long-term undertaking, which, when properly conducted, improves manager awareness ofresource and visitor experience impacts. Monitoring provides feedback to managers aboutthe consequences of implementing specific management actions. This feedback mayinform managers that their actions are successful at solving the problem and should becontinued. On the other hand, monitoring data may tell managers that their actions arenot correcting the problem or are causing new problems. In this case, the decision processfor managing social and ecological impacts of recreation use should be revisited.

Maintaining Recreation Resource/Visitor Experience Quality 67
Table 2. Tactic categories and tactics associated with them.
Tactic Category Tactics
Site Management • provide facilities and structures• use vegetation• use physical barriers• increase (decrease), improve (not improve) or eliminate facilities• strengthen/harden sites• remove litter and other problems• close areas or facilities
Rationing and Allocation • limit access using reservations• limit access using a first-come first-serve (queuing) system• limit access using lotteries• limit access using merit/eligibility system• charge fees
Regulations • restrict access to specific locations (zoning)• restrict use/behavior at facilities• restrict/prohibit activities• restrict/prohibit equipment• restrict/prohibit modes of travel• limit length of stay• limit group size/stock/pets• restrict/prohibit use to protect environmental conditions
Deterrence and Enforcement • provide signs• sanction visitors who engage in noncompliant behavior• provide personnel and law enforcement
Visitor Education • educate visitors about appropriate behaviors• educate visitors to alter use patterns

68 Maintaining Recreation Resource/Visitor Experience Quality
Conclusion
The handbook developed from this project is available from the University of Minnesota,Cooperative Park Studies Program (115 Green Hall, 1530 Cleveland Avenue North, St.Paul, MN 55108).
The decision process and worksheets described in this article and the handbook can beused in a group setting in which many individuals brainstorm and discuss problems. Or,individuals can use the worksheets themselves to plan problem-solving activities. Forexample, several staff members with varying expertise would probably be appropriate toaddress apparent visitor conflicts and resource impacts on several trails throughout a largewildlife refuge. Possible solutions could vary spatially across the resource, and more thanone functional area of responsibility could be involved. On the other hand, a groupprocess may not be necessary for “simpler” problems, such as dealing with litter in vehicle-access campgrounds and day-use picnic areas or depletion of dead and downed wood forcampfires. Here, an individual responsible for the management of the affected sites coulduse the handbook to select an appropriate strategy and tactic to resolve the problem.
This handbook builds on previous research and management experience during the pastseveral decades to identify and describe alternative management techniques to addressvisitor-caused impacts. For example, our effort has built on the publications by Cole et al.(1987) and Cole (1989). While our work has expanded the management topic beyondwilderness to include all types of recreation settings and areas, we think our majorcontribution may be providing a simple to use process in which analysts use worksheets tospecify their most critical problems and identify alternative management tactics to addressthe problems. The worksheets give users a visual process for evaluating and prioritizingamong those tactics selected during dialogue. The worksheets also give managers a“paper trail” to refer to over time when questions arise about why a certain decision wasmade and the justification for the decision.
This handbook and associated literature concerning how to deal with visitor-causedimpacts and conflicts is no panacea for resource managers. There is no magic formula fordeciding an appropriate course of action. For some decisions there may be fewalternatives. In other cases, information necessary to decide may be limited or conflicting. Political, administrative, legal, budgetary, and resource constraints also may influencewhat to do. Nevertheless, the handbook provides a compilation of the current thinkingconcerning how to address visitor-caused impacts, and it can help reduce the range ofuncertainty associated with a particular decision. It does not eliminate the uncertainty! Ultimately, the manager is left with the responsibility to decide how much and what kindsof use are acceptable for a given area, and how and where such uses are to be managedand sustained.

Maintaining Recreation Resource/Visitor Experience Quality 69
Literature cited
Anderson, D. H., D. W. Lime, and T. L. Wang. 1998. Maintaining the quality of parkresources and visitor experiences: A handbook for managers. TC-777. St. Paul,MN: University of Minnesota Extension Service Tourism Center.
Cole, D. N. 1989. Low-impact recreational practices for wilderness and backcountry. OGTR INT-265. Ogden, UT: USDA Forest Service Intermountain Research Station.
Cole, D. N., M. E. Petersen, and R. C. Lucas. 1987. Managing wilderness recreationuse: Common problems and potential solutions. GTR INT-259. Ogden, UT: USDAForest Service Intermountain Research Station.
Hof, M., and D. W. Lime. 1997. Visitor Experience and Resource Protection frameworkin the National Park System: Rationale, current status, and future direction. InProceedings, Limits of Acceptable Change and related planning processes: Progressand future directions, comps., McCool, S. F., and D. N. Cole, 29-36. Missoula, MT,May 1997. Gen Tech. Rep. Ogden, UT: USDA Forest Service, IntermountainResearch Station.
USDI, National Park Service. 1997a. VERP—the visitor experience and resourceprotection (VERP) framework: A handbook for planners and managers. Lakewood,CO: National Park Service, Denver Service Center.
USDI, National Park Service. 1997b. VERP—a summary of the visitor experience andresource protection framework. Lakewood, CO: National Park Service, DenverService Center.

14Fulton, D. C. 2000. Applying outcomes-based management to fish- and wildlife-based recreation. In Human Dimensions of Natural Resource Management: Emerging Issues and Practical Applications, eds.Fulton, D. C., N. C. Nelson, D. H. Anderson, and D. W. Lime. St. Paul, MN: Cooperative Park StudiesProgram, University of Minnesota, Department of Forest Resources.
15Assistant Professor and Assistant Leader, Wildlife, USGS Biological Resources Division, MNCooperative Fisheries and Wildlife Research Unit, University of Minnesota, Department of Fisheries andWildlife, 200 Hodson Hall, 1980 Folwell Avenue, St. Paul, MN 55108.
Applying Outcomes-based Management to Fish- and Wildlife-based Recreation14
David C. Fulton15
Introduction
The National Wildlife Refuge System provides important habitats for migratory birdsas well as residential wildlife. In addition, refuges provide opportunities for outdoorrecreation and environmental education. Planning and managing for these recreationand environmental education opportunities is essential to achieving the RefugeSystem’s mission as well as maintaining public support for the Refuge System. Although the primary mission of our national refuges is the protection of wildlife andfisheries resources and their habitats, providing quality recreational experiencesoriented toward wildlife is one of four goals within the National Wildlife RefugeSystem.
The general purpose of this paper is to describe an approach for planning wildlife-dependent recreation opportunities that are compatible with the habitat and wildlifeprotection goals of national wildlife refuges. This approach is outcomes-basedmanagement and focuses equally on protecting the resources of the refuge andproviding service to the interested public.
The specific objectives of this paper are to:
1. Define Outcomes-based Management2. Outline a planning process for implementing Outcomes-based Management for
hunting, angling, and watchable wildlife programs3. Identify and define the major elements of the planning process4. Describe how elements of the planning process are implemented
Outcomes-based management
Outcomes, or benefits, based management of recreational and amenity resourcesfocuses on producing psychological, social, economic and environmental benefits

Applying Outcomes-based Management 71
through satisfying recreational experiences (Driver and Bruns 1999). In this volume,Roggenbuck provides a review of both experience-outcome and benefits approachesto recreation. These approaches taken together provide the foundation for outcomes-based management of recreation. The key aspect of this approach is that recreation ismore than activity, but rather an experience that provides satisfying psychologicaloutcomes to those participating in the experience such as relief from mental andphysical stress or feelings of achievement or solitude (see Driver et al. 1991 for athorough list and discussion of psychological outcomes from recreation experiences). From the benefits perspective, such experiences not only produce direct psychologicalbenefits for the individual who is engaging in recreation, but such experiences lead tosecondary benefits for that individual and for the family, community, society, andenvironment in which that individual lives (Driver and Bruns 1999).
How do we manage for such benefits or outcomes? The key to doing so from theoutcomes-based perspective is to focus on the opportunities that can be provided orproduced through management of the specific activities and settings on which desiredrecreational experiences are dependent (Driver 1985; Driver et al. 1991). Definingand providing a specific recreational opportunity requires understanding what specificactivities are desired and can be provided, what specific recreational settings for theactivity are desired and exist, and what specific psychological experiences are desiredand can be produced.
Understanding the nature of recreational settings is of principal importance to theprocess of outcomes-based management. Recreational settings vary along threedimensions that work together to provide the context for any recreational experiences. These setting dimensions include:
< Resource or biophysical. This setting includes the biophysical and environmentalcharacteristics and conditions of a place and set a baseline for what types ofactivities or experiences are possible or appropriate. For example, fishing is not apossible activity without water and a fish resource. Likewise, hiking throughnesting habitat of a rare bird species is an inappropriate springtime recreationactivity if the goal is to sustain the resource.
< Social. This setting includes the range of social interactions and conditions thatan individual or group is likely to experience in a particular area or location. Thesocial setting may be influenced by such things as the types of visitors, theirnumbers and density, the proximity and behaviors of visitors, the types ofequipment they bring along, the types of activities engaged in by visitors, and thedegree to which visitors may conflict with one another concerning behavioralnorms, values, and lifestyles.

72 Applying Outcomes-based Management
< Managerial. The managerial setting is determined by the type of managementactions taken in a location (e.g., trail development) and the rules and regulations(e.g., no overnight camping) enforced at a location.
Specific biophysical, social, and managerial settings facilitate the production of specificand diverse recreational opportunities that lead to different recreational experience-outcomes and benefits. These recreational opportunities can be grouped togetherbased on their shared dependence on specific activities or settings and based onexperiences desired from these opportunities. Such groupings form recreationalopportunity classes that define sets of recreational opportunities that lead to similaroutcomes and benefits. The theory and research necessary for developing such classeshas been thoroughly discussed and reviewed elsewhere (Driver et al. 1991). Thepurpose of this paper is to outline a planning process for incorporating the ideas ofexperience-outcomes and benefits management decisions.
A planning framework for outcomes-based management
What is planning?
At its simplest, planning involves developing a scheme to achieve a particular objective(Loomis 1993). Crowe (1983:1) defined planning as “an integrated system ofmanagement that includes all activities leading to the development and implementationof goals, program objectives, operational strategies, and progress evaluation.” Fourbasic questions must be addressed when making planning decisions concerning therecreational management of fisheries and wildlife resources (Crowe 1983). Thesequestions include: What are the desired goals and objectives in managing the resource? Where are management programs in relationship to these goals and objectives? Whatactions need to be taken to achieve the goals and objectives? And, how do we know ifand when we achieved the desired goals and objectives?
Ideally, objective, science-based information is used to address each of these questionsin a continuous, cyclical process, and management actions that provide the greatestbenefits with the least costs are implemented to achieve desired goals and objectives. Planning and problem-solving using such a rational process sounds pretty simple andstraightforward. But, experienced fisheries and wildlife managers know that planningand management almost never goes so smoothly.
Planning and management is more complex and difficult for two primary reasons. First, planning occurs in the context of social and political conflict that makes thedefinition of specific management goals and objectives tenuous. Such conflict isunavoidable and is the context for much of social interaction. Our conflicts overdesired goals and objectives for fisheries and wildlife resources, like any social conflict,are at best managed through a process of reasonable argument. Information used inthis process may include appeals and statements of personal values as well as factual

Applying Outcomes-based Management 73
information concerning the social and biophysical environment. Usually, the greaterthe degree of agreement concerning the factual information the easier conflicts are toresolve. A lack of objective information, however, is the second complexity ofplanning and management. Objective information is often scarce or there is littleagreement concerning the facts. The process of science is a self-corrective one inwhich agreement may not be reached for years or decades and the facts are subject tochange with new information. Furthermore, science-based information can be difficult,time-consuming and expensive to gather.
Because of the inherent conflict surrounding social decision-making about fisheriesand wildlife resources and the challenge of gathering and utilizing science-basedinformation, effective planning relies on both science-based research and analysis andcollaboration among the many stakeholders with an interest in the resources. Planninginvolves information from three arenas. A “scientific” or fact-based arena, the arena ofstakeholder who have a vested interest in the planning decision, and the public beingserved by the agency. The “scientific” arena focuses on science-based informationfrom the biophysical and social sciences to provide explanatory and descriptiveinformation concerning facts about the resource and resource users. Decisionsconcerning how these resources “should” be managed are also influenced by normativeinformation involving vested stakeholders (agencies, sports and conservation groups,politicians) and the general public. Thus, fisheries and wildlife resource planning andmanagement decisions represent an integration of both rational, science-based, “is”information and normative, “ought” information.
Frameworks for planning recreation management
Several planning frameworks have been developed for use in managing naturalresource-based recreation (Driver et al.1987; Graefe et al. 1990; National Park Service1997; Stankey et al. 1985; Shelby and Heberlein, 1986). While there are bothimportant and subtle differences between the various frameworks developed bydifferent researchers or different agencies, most of these frameworks favor: (1)collaborative processes that include substantial and meaningful involvement ofstakeholders throughout the planning process; (2) approaches focused on definingclear outcomes for management via goals and objectives; (3) science-based approachesfor collecting and analyzing information important to decision-making.
The planning framework presented in this paper, focuses on integrating andimplementing the ideas of experience-based and benefits-based management (seeRoggenbuck this volume; Fulton et al. 2000). Information from Fulton et al. (2000) isused extensively here to describe the planning framework. This planning approachattempts to integrate goal-directed, science-based planning with meaningful,collaborative involvement of stakeholders. It also views the production of recreationexperiences, and subsequent benefits, as an interaction of inputs and outputs among

74 Applying Outcomes-based Management
physical, social, and managerial systems and encourages a more holistic approach towildlife recreation planning that considers and integrates social and biophysicalparameters (Fulton et al. 2000).
Because it is focused on managing for the experiences of the visitor as well as thecondition of biophysical resources, outcomes-based management emphasizescollaboration among management agencies, users and affected communities. Thisincludes collaboration in developing the scientifically valid information necessary forassessing opportunity demand, resource capability and supply, and evaluating potentialalternatives. Such collaboration requires face-to-face social dialogue with a range ofinterests from affected communities, but also includes community- and user-focusedsocial science research directed at describing, in a reliable and valid fashion, thebroader concerns and desires of the affected public. Collaboration ensures that a fullrange of diverse values and interests are represented when deciding what futureconditions are desired and when deciding which means are preferred for obtainingthese conditions. Collaboration may also include formal stakeholder decisionprocesses in which representatives from the broad range of interests meet face-to-faceto develop decisions that are acceptable to all.
Planning process for outcomes-based management
Outcomes-based planning follows a generic planning process which involves:
1. Visioning and Goal-setting2. Defining Objectives3. Developing, Assessing, and Selecting Action Alternatives4. Implementing Planning Decisions5. Monitoring and Evaluation (Potential revision of steps 1-4)
The stages or steps suggest that planning is a serial process (Figure 1). Planning,however, is typically an iterative process, and planners often have to revisit their goalsand objectives as actions and alternatives are debated or new information is developedconcerning the link between actions and indicator variables. Inclusion of monitoringand evaluation as a final step in the planning process highlights the fact that planning isa cyclical process.
Visioning and goal setting. The fundamental action in outcomes-based planning isidentifying and developing a partnership among the stakeholders who have an interestin the resources that are the subject of the planning action. Stakeholders include, forexample, the visitors to a refuge, representatives from local communities, and otherswho may be impacted by decision regarding management of the refuge, as well as themanagement agency responsible for the refuge (i.e., USFWS). A partnership amongthese entities is essential to developing a shared vision of recreation opportunities andresource conditions that are desirable for the future. Such a vision provides direction

PlanningStage
Planning Activities Planning Product
Vision andGoal Setting
• Creation of Stakeholder PlanningCommittee representing agencies, localgovernment, and varied local interests
• Creation of a technical advisorycommittee to serve the needs of thestakeholder planning committee
• Community Visioning Sessions withcitizens
• Public forums and dialogues focused onthe planning issues
• Community surveys
Goals (Vision): Long-range visioning with agencies and stakeholders affected orinterested in the agency’s future management direction. Open dialogue to reach aconsensus vision for the future. Social science research would include developingwildlife viewing experience typology through focus groups and surveys of the users.
DefiningObjectives
• Broad-based user surveys and focusgroups
• Stakeholder Planning Committeefacilitated group sessions
• Interactive public workshops
Objectives, standards, and indicators: Goals reviewed in conjunction with scientific andtechnical knowledge and described in a measurable way consistent with resources on theground and demand for experiences. Scientific research integrated with consensus-seeking process. Research directed at understanding social and biophysical factorsaffecting production of experiences and demand for experiences.
Developing,Assessing,and SelectingActionAlternatives
• Stakeholder Planning Committeefacilitated group sessions
• Interactive public workshops
Developing, assessing, and selecting alternatives: Range of technically viable choicesrepresent key preferences of stakeholders and reflect technical assessment of demandand supply of experiences and resources needed to produce experience opportunities. Scientific research integrated with consensus-seeking process to ensure adequate rangeof alternatives. Preferred alternative selected based on best available scientific andtechnical information and consideration of allocation preferences. Consensus onpreferred choice instrumental to long-term political viability of plan. Social scienceresearch and stakeholder processes used to help determine social preferences.
ImplementingPlanningDecisions
• Management agency actions Implementing planning decisions: Successful application of outcomes-based managementdepends on specific objectives and descriptions of recreation opportunity classes that aredeveloped and agreed to by researchers and stakeholders.
MonitoringandEvaluation
• Creation of volunteer citizen monitoringgroups
• Community events focused on collectingmonitoring information
• Community surveys• Stakeholder Planning Committee
facilitated group sessions• Interactive public workshops
Monitoring and evaluation: Long-term assessment of resource conditions and usersexperiences to determine if management actions achieve desired consequences. Monitoring framework is based on indicators and standards using science-basedmethods for implementation.
Figure 1. Stages in the planning process to develop products that produce results.
76 Applying Outcomes-based Management
for defining a desirable range of goals representing the desired outcomes fromrecreation management. These goals are the restatement of societal, community andpersonal values that exist among the public being served by the management agenciesand for whom the resource is being managed to produce benefits (Davidoff and Reiner1962).
For this reason, meaningful goals cannot simply be developed by agency personnel andapplied to management. Management goals must reflect the values of the public. Toassure that they do the public needs to directly define these goals through face-to-faceinteraction with the agency and other stakeholders and through public surveys andother research techniques that can help determine the range and intensity of values(goals) among different segments of the public. Direct interaction of agency plannerswith local communities and other stakeholders not only engenders trust and a fairdecision-process among stakeholders, but it also affords the opportunity for more in-depth, detailed discussion about stakeholder interests than can be obtained throughmethods such as mail surveys.
It is at this goal-setting stage that agencies should be initially considering whatwildlife-related experiences and benefits will be produced (Driver 1985). Development of recreation opportunity classes related to wildlife and other resourceson the land is essential to ensuring that experience-outcomes information is effectivelyincorporated into subsequent planning and management activities. Recreationopportunity classes represent a description of the specific experiences, settings, andactivities people desire and provide a tool for specifying the types of wildlife-relatedexperiences that are possible given the mix of biophysical, social, and managerialattributes in an area. It is at the goal-setting stage that the range of compatible andincompatible activities and experiences can be identified and defined within arecreation opportunity class.
Defining appropriate recreation opportunity classes involves collecting informationfrom users via focus groups, surveys, and through other social science researchmethods. However, it also requires the validation of the defined opportunity classeswith the stakeholders themselves. While these classes may be initially defined viastatistical analysis of survey data, recreationists and other stakeholders must accept thedefinitions if the classes are going to be useful as a management tool. Opportunityclasses that are accepted only by the researchers and managers who generated themwill be of no value if the public does not accept them as meaningful classifications.
Defining objectives. Objectives are more concrete statements that specify theintentions of goals in clear terms. To assure clarity in providing future direction,objectives should be (Manning 1999; Schomaker 1984): (1) quantifiable in discreteterms (e.g., not simply more or less of this, but 25 percent more or 30 percent less),(2) bounded in space and time (i.e., should clearly specify when and where thequantifiable objective is to be reached), (3) realistic (i.e., objectives must be plausibly
Applying Outcomes-based Management 77
attainable based on known information and technology, but they must also besomewhat challenging to obtain), and (4) outcome oriented (i.e., objectives shouldfocus on what is being produced through management and not what resources areused in the management process).
Objectives serve two primary functions. First, they form the basis for a system ofquantitative indicators and standards that define the desired conditions of the resourcesbeing managed and quality of the experiences being produced from these resources forspecific recreation opportunities. Second, they provide guidance regarding theallocation of resources (usually geographically, but temporal, financial, oradministrative allocations are also possible) among the different types of opportunities.
Specification of different recreation opportunity classes provides a basis for definingan array of objectives that are each compatible with and reflect the goals and missionof the agency or organization. Objectives should be defined with appropriaterecreation opportunity classes in mind, and they must also be developed with the directinvolvement of stakeholders. Objectives are not developed as simply guidelines forresource managers, rather they represent in concrete terms an agreement amongstakeholders (including managers) about what social outcomes (experiences andbenefits) are desirable.
As highlighted by Manning in this volume, to be meaningful, planning objectives mustbe communicated in terms that are readily observable or measurable. Doing soinvolves choosing measurable variables to define and give meaning to the objectives,and is at the center of every major recreation planning system in use today (Driver etal. 1987; Graefe et al. 1990; National Park Service 1997; Stankey et al. 1985; Shelbyand Heberlein 1986). Briefly, indicators are measurable social or biophysical variablesthat are closely linked to a recreation opportunity. Standards on an indicator define arange of conditions under which a particular wildlife viewing opportunity is produced. (see Manning in this volume for additional information).
Developing, assessing, and selecting action alternatives. Potential managementalternatives for recreational opportunities are developed using knowledge aboutdesirable outcomes for recreation experiences and resource conditions. Thesealternatives are not pre-existing and must be created by the resource managers incollaboration with interested stakeholders. Such alternatives also represent decisionsabout how resources will be allocated for various uses. The basis of this kind ofallocation decision, and one principal task of the planner, involves two key activities(1) assessing the demand for specific experience opportunities and the supply ofresources and settings that produce such opportunities, and (2) comparing the level ofdemand and supply of such opportunities.
Because the allocation decision is all about how the decision will impact the variousstakeholders, the public must be involved in defining different allocation alternatives

78 Applying Outcomes-based Management
and in the process of assessing demand and supply of the resources. How that decisionis made can be just as important as what the decision is in determining whether or notit will be viewed as a just, or fair, decision (Lind and Tyler 1988; Thibaut and Walker1975; Tyler et al. 1997). Exclusion of interested and impacted stakeholders from theprocess will likely cause it to be seen as unfair and lead to lack of support for theallocation decision.
The potential impacts of each management alternative must be assessed, and finally,the planning process comes down to choosing among the alternatives (each with theirassociated objectives, indicators, and standards). To guide selection of an alternative,each is described according to the likely consequences it will produce. Final selectioncomes from several sources, but in keeping with the collaborative notion, the selectiondecision should arise from negotiated positions of stakeholders and information fromusers as well as legal mandates and scientific information. Collaborative involvementof stakeholders is important, because, although based on scientific information, theactual selection decision is intrinsically a political decision, or a decision about what isa just, or fair, allocation of resources as well as a cost-effective allocation.
Implementing planning decisions. Regardless of the specific allocation decision,the alternative selected must be a readable plan that provides a clear blueprint stating explicitly what experiences or benefits will be produced, where and when they will beproduced, the quality and quantity that will be produced. This plan must also specifythe means of production, or what actions will be specifically taken to achieve theobjectives defined by the indicators and standards. Successful application ofoutcomes-based management depends on the degree to which plans adhere to andincorporate (1) the specific objectives and (2) the descriptions of recreationopportunity classes. The objectives and recreation opportunity classes developed byresearch and agreed to by the involved stakeholders are the key to assuring plans thatachieve the desired outcomes of the public.
Monitoring and evaluation. In order to determine whether planning actions weresuccessful, monitoring and evaluating consequences of the plan must followimplementation. Monitoring and evaluation are the key to identifying and correctingproblems with management action and adapting decisions to what has actuallyoccurred on the ground. Through monitoring and evaluation, planning actions becomelearning opportunities. Monitoring and evaluation is directed by the specificallydefined management objectives that describe the specific quantitative outcomesdesired through management and the specific actions that will be taken to achievethose outcomes. These desired outcomes are quantified through the use of indicatorsand standards, and it is these specific, quantitatively expressed standards that are usedas the basis for monitoring and evaluation. At a minimum, evaluation should addressthe following questions:

Applying Outcomes-based Management 79
To what extent were desired opportunities for recreation opportunities? How did visitors evaluate the quality of these opportunities?Did resource conditions stay within the bounds of standards that were established?
To answer these questions, an array of evaluative systems must be developed andimplemented throughout a visitor use season. This might include actions such asvisitor registration, observation of use or wildlife movements, regular inspection of sitefacilities, and post-visit evaluations of users. Stakeholders are also a central part ofmonitoring and evaluation efforts. Use of volunteers from stakeholder groups to helpdesign and implement monitoring projects is an invaluable way to retain the interestand energy of the community of stakeholders. Evaluation of the plan also includes allparties who helped develop the plan and continue to have a stake in management anddecision-making. Through such efforts, evaluation becomes the foundation for arecurring cycle of “fine-tuning” action plans and for periodic revision of allocationplanning involving all stakeholders.
Summary
This manuscript provides a description of a framework for incorporating experience-outcome and benefits-based recreation information into planning decisions concerningrecreational opportunities on refuges and other public lands. More informationconcerning these approaches can be found in the literature cited in this paper.
Literature cited
Crowe, D. M. 1983. Comprehensive planning for wildlife resources. WyomingGame and Fish Department.
Davidoff, P., and T. A. Reiner. 1962. A choice theory of planning. Journal of theAmerican Institute of Planning 28:103-115.
Driver, B. L. 1985. Specifying what is produced by management of wildlife by publicagencies. Leisure Sciences 7(3):281-295.
Driver, B. L., P. J. Brown, T. Gregoire, and G. H. Stankey. 1987. The ROS planningsystem: Evolution and basic concepts. Leisure Sciences 9:203-214.
Driver, B. L., and D. Bruns. 1999. Concepts and uses of the benefits approach toleisure. In Leisure Studies: Prospects for the Twenty-First Century, eds. Burton,T., and E. Jackson. State College, PA: Venture Publishing, Inc.
Driver, B. L., H. E. A. Tinsley, and M. J. Manfredo. 1991. The paragraphs aboutleisure and recreation experience preference scales: Results from two inventoriesdesigned to assess the breadth of the perceived psychological benefits of leisure. In The benefits of leisure, eds. Driver, B. L., P. Brown, and G. Peterson, 263-286. State College, PA: Venture Publishing, Inc.

80 Applying Outcomes-based Management
Fulton, D. C., D. Whittaker, and M. J. Manfredo. 2000. Planning and experience-based management. In Wildlife Viewing in North America: A ManagementPlanning Handbook. Champaign, IL: Sagamore.
Graefe, A., Kuss, and J. J. Vaske. 1990. Visitor impact management: The PlanningFramework. Washington, D.C.: National Parks and Conservation Association.
Lind, E. A., and T. R. Tyler. 1988. The social psychology of procedural justice. NewYork: Plenum Press.
Loomis, J. B. 1993. Integrated Public Lands Management: Principles andApplications to National Forests, Parks, Wildlife Refuges, and BLM Lands. NewYork: Columbia University Press, 474pp.
Manning, R. E. 1999. Studies in Outdoor Recreation: Search and Research forSatisfaction. 2d ed. Corvallis, OR: Oregon State University Press.
National Park Service. 1997. VERP: The Visitor Experience and ResourceProtection Framework—A Handbook for Planners and Managers. Denver, CO: Denver Service Center.
Schomaker, J. 1984. Writing quantifiable river recreation management objectives. InProceedings of the 1984 National River Recreation Symposium, 249, 253.
Shelby, B., and T. A. Heberlein. 1986. Social Carrying Capacity in RecreationSettings. Corvallis, OR: Oregon State University Press.
Stankey, G. H., D. N. Cole, R. C. Lucas, M. E. Petersen, and S. S. Frissell. 1985. The limits of acceptable change (LAC) system for wilderness planning. ReportINT-176. Ogden, UT: USDA Forest Service. 36 pp.
Thibaut, J., and L. Walker. 1975. Procedural Justice: A Psychological Analysis. Hillsdale, NJ: Lawrence Erlbaum.
Tyler, T. R., R. J. Boeckmann, H. J. Smith, and Y. J. Huo. 1997. Social justice in adiverse society. Boulder, CO: Westview Press.

81
Human Dimensionsof
Community Issues

82
16Flora, C. B. 2000. Measuring the social dimensions of managing natural resources. In HumanDimensions of Natural Resources Management: Emerging Issues and Practical Applications, eds. Fulton, D.C., K. C. Nelson, D. H. Anderson, and D. W. Lime. St. Paul, MN: Cooperative Park Studies Program,University of Minnesota, Department of Forest Resources.
17Professor of Sociology. Director, North Central Regional Center for Rural Development, 107Curtiss Hall, Iowa State University, Ames, IA 50011-1050.
Measuring the Social Dimensions of Managing Natural Resources16
Cornelia Butler Flora17
Two sister social sciences can aid in the establishment and management of wildliferefuges. One is sociology and the other is social psychology. Professionals in thesedisciplines are often scattered around the campus in professional schools, as well as intheir home departments. Both psychology and sociology claim social psychology,whereas sociology is firmly rooted in departments of sociology and rural sociology.
Sociology focuses on communities and institutions such as bureaucracies and countycommissions, while social psychology focuses on the individual. Sociology looks atthe context at which managing the resource takes place. Social psychology looks atindividual experience with a resource. Where sociology is interested in the outcomesof communities of interest and place, social psychology is interested in the outcomesof individual satisfaction and individual growth. Sociology is more likely to look atsocial movements and public policy, while social psychology is more apt to look atindividual attitudes.
Sociology looks at three important pieces of refuge management in the larger contextof natural resource management. The first is the context. What are the policies inwhich a wildlife refuge is embedded? What are the rules of each institution that is apartner in that management? Do those rules conflict or compliment each other? Arethere barriers or facilitators in terms of public policy, affecting the behavior ofmanagers and communities of interest and communities of place? Context includes thedominant religious groups and their beliefs, the dominant political groups and splinterparties, and the organized communities of interest such as the Audubon Society, theSierra Club, Ducks Forever, and the Farm Bureau. This also includes the socialcharacteristics of communities of place, such as the age, education, and occupationaldistribution of the population.
Sociology also looks at process. It is interested in the process creating a new refuge. What are the interactions among groups in the refuge and what is the interaction ofmanagement with groups? What are different ways that those processes work insidethe refuge?
84 Measuring the Social Dimensions of Managing Natural Resources
Sociology sees that what happens on a refuge may be most impacted by people whocare a great deal about the place but who never set a foot in the refuge. Sociology isvery interested in the process that links various groups to such institutions as theDepartment of Natural Resources or the U.S. Department of Fish and Wildlife that aresetting up refuges. Who are the major institutional actors? What are ways ofinteracting that generate conflict? What are ways of interacting that generatecooperation?
Finally, sociology looks at impacts. What are the impacts on various user groups? Sociologists are more interested in how behavior changes than in how attitudeschange as a result of the use of a resource. Does activity in a reserve encourage anindividual to write their Representative in support of the refuge program? Are usergroups so outraged at what they see as the degradation of a resource that they writetheir Representative to demand that firmer and stricter rules be put into place? Doinner-city youth groups who participate in a wildlife refuge experience go back to theirhome neighborhood and start a butterfly garden? What are these changes that occurwithin user groups?
Sociology is also interested in the impacts on stakeholder groups. Stakeholder groupshave different desires and outcomes so the refuge can make a difference. They alsohave fears about the kinds of things refuges can alter. Sociologists are less interestedin those fears than in whether what goes on in the refuge contributes to the statedgoals and purposes of various stakeholder groups.
Communities and resources
Sociologists always like to define their terms. My definition of a community comesfrom my interactions with biologists. I define it as “interactions among individuals andgroups for mutual support.” A number of other sociologists define community in thisway. Thus, communities are not based on their particular functions or particularactivities but on the fact that they are based on mutual support.
Where biological communities are based on interactions among organisms and groupsof organisms, human communities are different in that humans have choice and aremore mobile. To differing degrees we can decide with whom we will interact andwhen. Thus, human communities are particularly important in affecting changes bothclose to where they live and far away, either purposely or accidently.
Two kinds of communities make up these interactions of individuals for mutualsupport. One is the community of interest—the birders, the hunters, the fishers, andthe photographers. They will often have their own journals, their own clubs, and theirown newsletters. Then there are communities of place that revolve around the countyor geographic area. It is important to note that within the communities of place thereare often very different communities of interest and those are often linked to outside

Measuring the Social Dimensions of Managing Natural Resources 85
communities of interest. Thus, sociologists talk about advocacy coalitions that arecoalitions or partnerships among both communities of interest and communities ofplace to achieve mutually agreed-upon goals. Determining what these agreed-upongoals are can be critical for establishing and managing wildlife refuges in a way viewedas positive by both of these very important communities.
Communities of place and of interest have resources. I will deal particularly with theresources of the community of place, and more specifically with that of refuges. Resources can be consumed. That is to say, they can be used up and gone. Whenwetlands are drained and filled, there is immediate high fertility because of the highorganic matter and nutrients in the soil. But when this is gone, the ability of the landto absorb water and to fill water is also gone and restoration is extremely difficult. Another example is when an important fishery is fished constantly all year around atthe highest possible out-take rate. Soon all the fish are gone.
Resources can also be stored. They can be locked up with a wire put around them sono one is allowed to go in and nature will presumably take its course. I found this tobe true to a greater or lesser degree in such areas as northern Missouri and inbioreserves around the globe.
Or, resources can be invested. We invest in resources when we rebuild wetlands, forexample. Although remediation that has worked for hundreds of years is never aseffective as the one taken out in a couple of days, it is still an important way ofinvesting in resources. We are investing our resources when we make sure thatgrasses are available for nesting or when we help construct protected areas forfingerlings.
Capital: Human, social, natural, and financial
Resources invested to create new resources are called capital. We often think ofcapital only in terms of financial capital or money. Many sociologists and communitydevelopers have found it useful to think of other forms of capital: human capital,social capital, natural capital, and financial and built capital. These capitals cometogether to create healthy ecosystems, vital economies, or social equity. butpriviledging one form of capital over the others can destroy the ecosystem, create adependent, fragile economy, and increase social inequity.
Human capital
Human capital is fairly mobile. Each person carries it around with them. Wildliferefuges are both dependent on human capital and contribute to it. For example,environmental education is one of the activities mandated by Congress for wildliferefuges. Refuges help develop such skills as hunting, fishing, and photography.
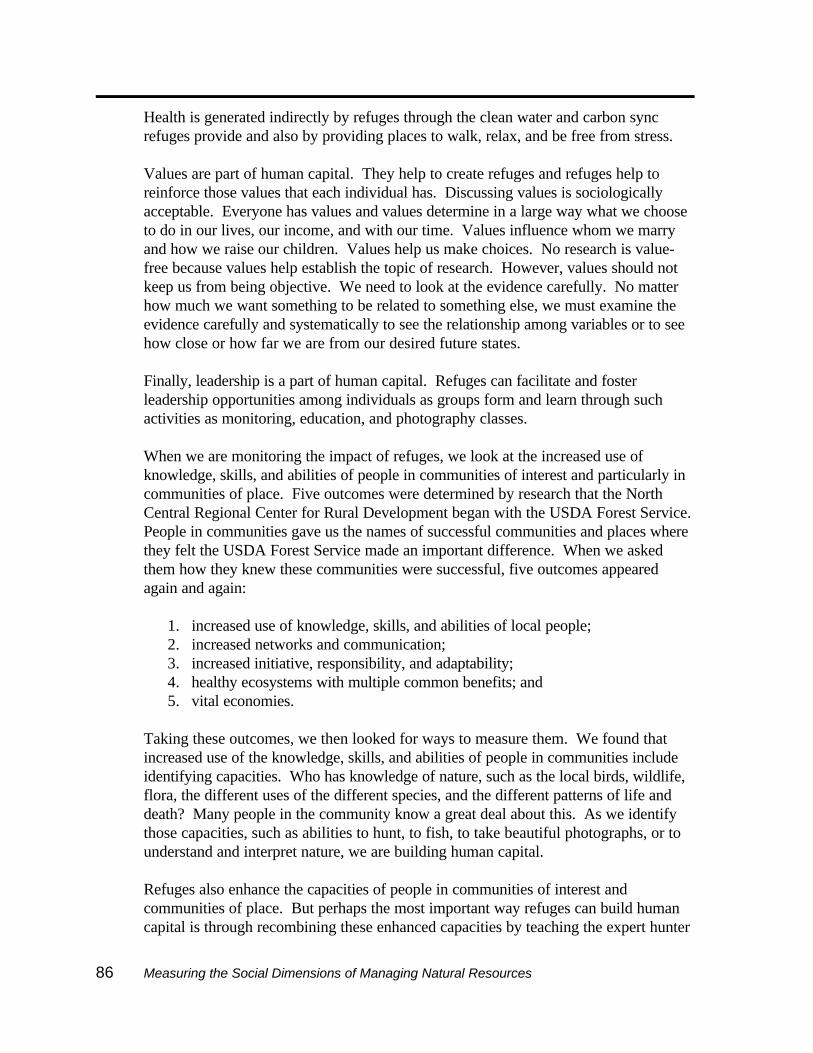
86 Measuring the Social Dimensions of Managing Natural Resources
Health is generated indirectly by refuges through the clean water and carbon syncrefuges provide and also by providing places to walk, relax, and be free from stress.
Values are part of human capital. They help to create refuges and refuges help toreinforce those values that each individual has. Discussing values is sociologicallyacceptable. Everyone has values and values determine in a large way what we chooseto do in our lives, our income, and with our time. Values influence whom we marryand how we raise our children. Values help us make choices. No research is value-free because values help establish the topic of research. However, values should notkeep us from being objective. We need to look at the evidence carefully. No matterhow much we want something to be related to something else, we must examine theevidence carefully and systematically to see the relationship among variables or to seehow close or how far we are from our desired future states.
Finally, leadership is a part of human capital. Refuges can facilitate and fosterleadership opportunities among individuals as groups form and learn through suchactivities as monitoring, education, and photography classes.
When we are monitoring the impact of refuges, we look at the increased use ofknowledge, skills, and abilities of people in communities of interest and particularly incommunities of place. Five outcomes were determined by research that the NorthCentral Regional Center for Rural Development began with the USDA Forest Service. People in communities gave us the names of successful communities and places wherethey felt the USDA Forest Service made an important difference. When we askedthem how they knew these communities were successful, five outcomes appearedagain and again:
1. increased use of knowledge, skills, and abilities of local people;2. increased networks and communication;3. increased initiative, responsibility, and adaptability;4. healthy ecosystems with multiple common benefits; and5. vital economies.
Taking these outcomes, we then looked for ways to measure them. We found thatincreased use of the knowledge, skills, and abilities of people in communities includeidentifying capacities. Who has knowledge of nature, such as the local birds, wildlife,flora, the different uses of the different species, and the different patterns of life anddeath? Many people in the community know a great deal about this. As we identifythose capacities, such as abilities to hunt, to fish, to take beautiful photographs, or tounderstand and interpret nature, we are building human capital.
Refuges also enhance the capacities of people in communities of interest andcommunities of place. But perhaps the most important way refuges can build humancapital is through recombining these enhanced capacities by teaching the expert hunter

Measuring the Social Dimensions of Managing Natural Resources 87
how an animal's life cycle depends on different aspects of the wetlands and borderareas.
We see that human capital is also important for managers and staff at the refuge. Theprimary aim in first establishing refuges was to increase wildlife populations. Gettingthe animals into the refuge and counting them were critical skills for the wildlife refugemanager at that time. We gradually learned that habitat protection and habitatenhancement are necessary for increasing wildlife populations and that this skill is veryimportant for the person involved in wildlife management. Then we moved toecosystem management, understanding the interaction between wildlife and habitat andthe important ecosystem functions performed by refuges. Finally, and more and moreimportantly, as we have moved into a policy context of evolution or decentralizationand participation, relational skills are extremely critical to those involved in refugeestablishment and management. If relational skills are missing, the output fails. Relational skills without the knowledge and skills to do ecosystem management doesnot get us very far either.
Social capital
Those relationship skills are an important piece of building the second kind ofcapital—social capital. Social capital involves mutual trust where people know theycan count on someone, which brings in reciprocity. Mutual trust is established whendifferent institutions and individuals can both give and receive. Thus, meetings are setup inviting people because we know enough about them to know which particularskills and points of view they can share.
Mutual trust and reciprocity tend to occur when people work together. In workingtogether, we show the degree upon which we can be counted. One way of buildingtrust is to start with small projects that have immediate visible results everyone canmeasure and contribute to. Groups are a very important part of social capital. Thesegroups provide the context for working together to build reciprocity and trust.
When mutual trust, reciprocity, and working in groups occur, a collective identity canemerge and that collective identity can be embedded in a refuge as a symbol of whowe are. We know this is important for communities of interest, such as the AudubonSociety and Ducks Forever. It is also important for the people who live in thecounties around the wildlife refuge. This collective identity, in turn, can lead to asense of a shared future and the understanding that what happens to the resource andwhat happens to the people is highly interconnected and not a zero sum game.
We measure increased social capital that can result from a refuge by looking atstrengthened relationships and communication. First, we look for increasedinteractions among unlikely groups within the community. A refuge can be a placewhere seminarians come together with bikers, both interested in a particular resource.

88 Measuring the Social Dimensions of Managing Natural Resources
They can focus on points of agreement as they come together, often to contribute tothe refuge through helping construct a wetland, planting riparian buffers, doing birdcounts, and measuring water quality.
Secondly, we measure social capital by increased interactions among unlikely groupsoutside the community. These are those nested, advocacy coalitions. An example iswhen a west Texas rancher, who is part of the Texas Cattleman's Association, realizesthat the birds that fly over the ranch are dependent upon the refuge in the NorthernGreat Plains and is concerned, like the Isaac Watson League, for the water fowl thatmigrate across both of their areas and are united through the refuge.
The third measure of strengthened relationships and communication is increasedavailability of information and knowledge. Increased availability of information andknowledge is seen in doing things such as putting the schedule of stocking streams upon the web. Another part of the availability of information is having people who havelearned from the refuge take that knowledge into schools, civic organizations such as aRotary Club, Sunday School classes, and even the local prisons. In turn, how thosedifferent groups view that knowledge and use it is an important input into the refuge.
A second area of sociological research, which we view as an outcome of and an inputto the establishment and maintenance of wildlife refuges, is improved communityinitiative, responsibility, and adaptability. We see this in terms of the presence of ashared vision. Do communities of interest within a geographical area, as well ascommunities of place, agree on at least a piece of a desired future that they can worktogether for? Improved community initiative, responsibility, and adaptability alsomean building first on internal resources. It is far too easy to say, “If only we had themoney. If only someone would build us a road. If only someone would build afactory here. If only prices would go up.” Rather, it means knowing what the localresources are and then figuring out new and better ways for using these resourcesmore effectively to move toward that shared vision.
Third, it involves working for alternative ways to respond to constant change. Therefuge is not a stagnant place, where we just somehow get the balance of nature right. Nature is a series of constant ebbs and flows. One year is wet; another is dry. Oneyear the rain comes at a certain time of the year; another year it comes at a differenttime. A healthy ecosystem is constantly changing and constantly adapting.
The same is true for human communities. OPEC gets together and creates an artificialshortage of oil and then oil prices increase as a result. An increase in world wheatproduction decreases wheat prices. A labor shortage in an area increases the numberof new migrants, often from different countries with different values about theenvironment and different languages for expressing their values. These are notdeviations but realities. Communities that are responsible and adaptable are alwayslooking for alternative ways to reach their goals, different ways of combining the

Measuring the Social Dimensions of Managing Natural Resources 89
resources that are there. They look for ways of viewing new migrants as an asset tothe community, not as a burden.
Natural capital
Natural capital is one of the major things that comes from the establishment andmanagement of refuges. Air quality and the reduction of greenhouse gases are acritical part of the natural capital and carbon sync provided by refuges. Waterquantity, in terms of reduced flooding, and water quality, in terms of water filtration,are critical provisions embedded in most of our refuges. Both holding soil andincreasing the quality of soil through added organic matter are important ways inwhich refuges contribute to natural capital. Biodiversity, of course, is one of the majorreasons for refuges in order to increase wildlife, not only the number of given speciesbut also the number of different species. That biodiversity ranges from the micros inthe soil to the birds of the air and the various flora and fauna on which both of thosedepend. Finally, it provides landscape. It provides an uncontrolled changing view thatcan provide inspiration and rest. While not everyone views a more natural landscapeas superior to a nicely cultivated one, particularly one that has many row crops such ascorn or soybeans, we are finding that landscape diversity becomes a critical piece of anassumed community of place, one that tends to attract residents who will in turncontribute to the social and financial capital of many rural communities.
We measure natural capital’s impact on communities of interest and place throughsustainable, healthy ecosystems with multiple community benefits. We have threeareas that we measure for this outcome:
1. Human communities plan and act in concert with natural systems. Thus, localplans from various government entities and in various civic groups include aconcern for and ways of interacting with natural systems.
2. Ecosystems are used for multiple community benefits. There is an understandingthat what happens on one piece of land, public or private, highly impacts thatwhich happens on other pieces of land and that both private and public landstogether make ecosystems. Serving just one end in a community, even if that endis absolutely maximized, is less sustainable than providing multiple communitybenefits.
3. Those alternative uses of the ecosystem seek common ground. This becomes amajor challenge for refuges, which is often an alternative use to the traditionalmanagement systems in place. It is very important to understand, particularly inthe north-central region—the states from Minnesota, the Dakotas, Wisconsin, andMichigan through Nebraska, Kansas, Iowa, Illinois, Ohio, Missouri, andIndiana—that the current uses in terms of monoculture may be rapidly changing.

90 Measuring the Social Dimensions of Managing Natural Resources
Providing alternatives that deal with multiple functions of the landscape can helprural people and rural communities at this critical moment of decision.
Financial capital
Another form of capital is financial capital. This includes debt capital, investmentcapital, tax revenue, savings, tax abatements, and grants. Refuges depend on theseforms of capital. Often the investment capital comes from nongovernmentalorganizations (NGOs) such as land trusts, which will invest in land or use rights inorder to provide buffers around refuges.
Financial capital is often viewed as a potential threat to a refuge, with the notion thattax revenue will decrease and investment capital will flow elsewhere. Research wasneeded to show under what circumstances tax revenue does decline and under whatcircumstances investment capital is attracted or attacked by refuges. Once we knowthese things, we can begin to act to try to make this less a threat. We find thatfinancial capital is often the first argument used against refuges. Refuges cost money.People look at them as land out of production and as a public investment in land andmanagement only.
Financial capital is important because it can be used to purchase built capital. In arefuge it means visitor centers, sewer systems, water systems, trucks, tools,computers, and roads. For those communities of place it means schools, new houses,broadband Internet access—key things that require money and contribute to the othercapitals within a community.
We measure appropriately diverse and healthy economies by four different sets ofindicators. One indicator relates to reduced poverty. How does a refuge reducepoverty? It provides a quality of access to an important resource so that, were it notpublic, it would be much more difficult for people who are financially disadvantaged toaccess. Second, a refuge can help create jobs with a variety of skill levels. It alsoprovides training for those jobs that can help the working poor.
Increased business efficiency is another measure of appropriately diverse and healthyeconomies. In the case of refuges, this means that a variety of businesses may linktogether around a refuge so tourists will have many destinations from which tochoose. This helps to focus advertising and also helps to multiply word-of-mouthadvertising.
Another measured outcome is increased business diversity. Tourism is one of thefastest growing industries in this area. More varied businesses in tourism can lead tothe fourth outcome which is increased community residence assets.

Measuring the Social Dimensions of Managing Natural Resources 91
Since it is sometimes believed that refuges will increase poverty, decrease businessefficiency, decrease business diversity, and decrease community resident assets,conducting research to monitor these impacts and outcomes is very important.
Indicators for accountability
One of the important pieces of applied sociological research is that it can be used toincrease our accountability. We use it for planning. We use it for progress. We use itfor performance results measurements, and we use it to reach our potential and for continuous improvement. Some people refer to these as the four “p”s ofaccountability.
Accountability includes baseline measures and performance results and goals. Youneed to know where it is you want to go and from where you started. Then you needto measure regularly how close you are to getting there. If you do not take all thesethings into account in your measurement, you are simply describing. You are notbeing accountable.
Descriptive work is important in understanding and defining the context. But, if youare going to show impact, you need to know what it is you want to have happen, whatit is that you fear might happen, how to measure where you started, and how you areprogressing to or from that goal.
Accountability facilitates continuous improvement. Constantly monitoring makes datafar less threatening than one big evaluation and you can basically learn from mistakes. You can even take the holistic management approach that you will always be makingmistakes, but you are constantly getting better and better.
Accountability helps create learning communities. A very important piece ofaccountability and getting that data is in getting together and reflecting on it. Thatmeans that in research each piece of data should be reflected upon and considered interms of what it tells you about where you are going and how you are getting there. Ifyou are too busy to reflect on the data, you are certainly too busy to change your datagathering methods.
Further, accountability builds strong partnerships. Refuges cannot be established andmaintained without partnerships. Partnerships require transparency and transparencyrequires accountability. Good measurement based on sound research principles iscritical in this aspect of partnerships.
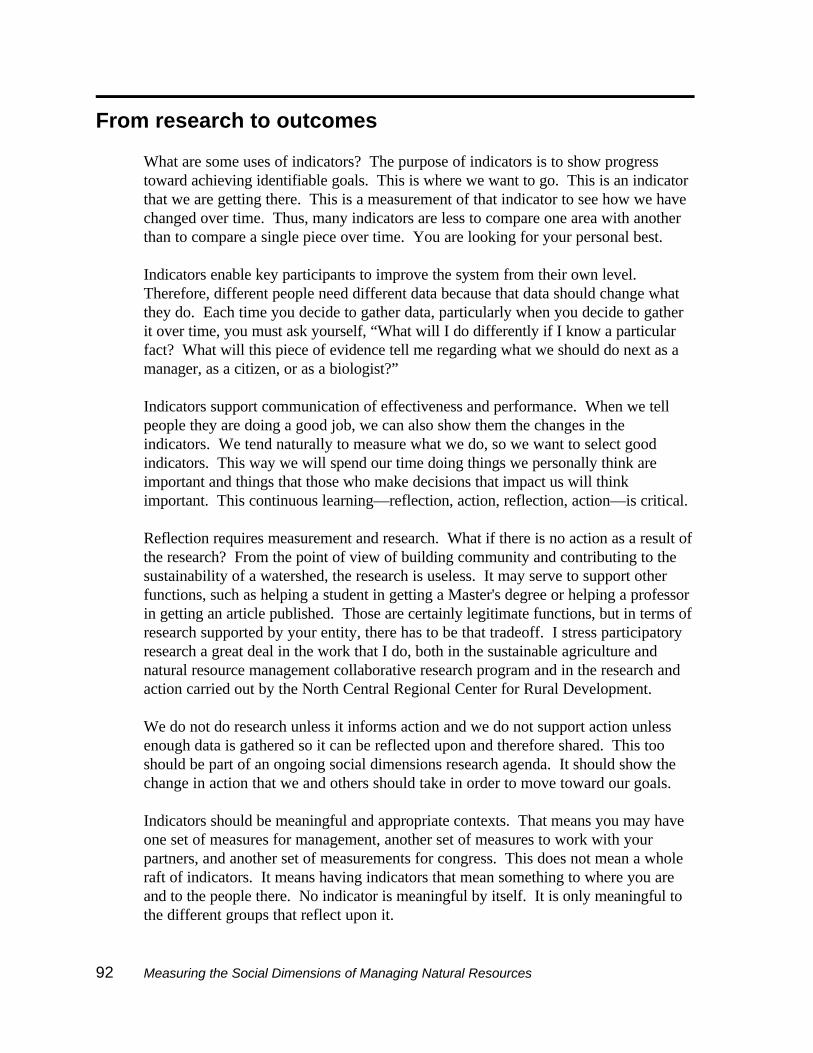
92 Measuring the Social Dimensions of Managing Natural Resources
From research to outcomes
What are some uses of indicators? The purpose of indicators is to show progresstoward achieving identifiable goals. This is where we want to go. This is an indicatorthat we are getting there. This is a measurement of that indicator to see how we havechanged over time. Thus, many indicators are less to compare one area with anotherthan to compare a single piece over time. You are looking for your personal best.
Indicators enable key participants to improve the system from their own level. Therefore, different people need different data because that data should change whatthey do. Each time you decide to gather data, particularly when you decide to gatherit over time, you must ask yourself, “What will I do differently if I know a particularfact? What will this piece of evidence tell me regarding what we should do next as amanager, as a citizen, or as a biologist?”
Indicators support communication of effectiveness and performance. When we tellpeople they are doing a good job, we can also show them the changes in theindicators. We tend naturally to measure what we do, so we want to select goodindicators. This way we will spend our time doing things we personally think areimportant and things that those who make decisions that impact us will thinkimportant. This continuous learning—reflection, action, reflection, action—is critical.
Reflection requires measurement and research. What if there is no action as a result ofthe research? From the point of view of building community and contributing to thesustainability of a watershed, the research is useless. It may serve to support otherfunctions, such as helping a student in getting a Master's degree or helping a professorin getting an article published. Those are certainly legitimate functions, but in terms ofresearch supported by your entity, there has to be that tradeoff. I stress participatoryresearch a great deal in the work that I do, both in the sustainable agriculture andnatural resource management collaborative research program and in the research andaction carried out by the North Central Regional Center for Rural Development.
We do not do research unless it informs action and we do not support action unlessenough data is gathered so it can be reflected upon and therefore shared. This tooshould be part of an ongoing social dimensions research agenda. It should show thechange in action that we and others should take in order to move toward our goals.
Indicators should be meaningful and appropriate contexts. That means you may haveone set of measures for management, another set of measures to work with yourpartners, and another set of measurements for congress. This does not mean a wholeraft of indicators. It means having indicators that mean something to where you areand to the people there. No indicator is meaningful by itself. It is only meaningful tothe different groups that reflect upon it.

Measuring the Social Dimensions of Managing Natural Resources 93
Indicators should be specific. It should be very clear what you are measuring. Indicators should be reliable. The same person measures the same object at the sametime or different people measure the same object at the same time and get the sameresult. Reliability is very important. Indicators are very objective. For sociologists,that means we tend to rely more on behavior than we do on attitudes. We may lookmore at what people write or put together collectively than at a particular attitudesurvey at one point in time.
Indicators should be efficient in terms of the cost in gathering them and they should bereal time, so they can have immediate use. The problem, of course, with census data isthey do not come out until they are about two to three years old and by that time theyare actually ten years old. Thus, they tell us a lot about the past but not very muchabout the present and precious little about the future.
There are some common pitfalls in selecting indicators. One pitfall is an unclearrelationship between outcomes and process activities. Can we draw a logicalrelationship between what we do and those outcomes that we seek? This unclearrelationship often comes because we default to readily available information, such asthe census data or the count of cars over the road. Because it exits, that is what weuse rather than figuring out what it is we really want to measure and what the bestapproximations are for what we want to measure. An exact measure of somethingthat is meaningless is much worse than an inexact measure of something that reallymatters. So inexact indicators that can still be fairly specific and are logically defensiveand hopefully empirically proven to be associated with that larger outcome in othersituations is what you need to go for.
Selecting unmeasurables as indicators is another pitfall. An example is having a goalso wonderful that we are simply unable to measure it. Indicators need to be relativelyconcrete. The concept can be very abstract but the indicator must be concrete.
Another pitfall is that the indicator is irrelevant to the goals or activities. We oftenmeasure activities as if they were goals without seeing that activities should lead tosomething and that something should then lead to something else. What we should belooking for are steps toward an outcome, not something to measure just to bemeasuring it.
Demanding that an indicator be comprehensive and able to measure the whole, ratherthan a piece of the whole, is another pitfall in indicator selection. Indicators do exactlythat—they indicate something. They are not the same as the outcome you are workingtoward. They are a little piece of reality that shows you are moving in a direction.
When you are looking at the intersection of context, process, and outcomes, you havea conundrum of causality. Prime order asks, “Does activity precede the outcome?” Covariation asks, “Does a change in the activity then result in a change in the

94 Measuring the Social Dimensions of Managing Natural Resources
outcome?” And then there is the elimination of rival causal factors. Of course, we cannever eliminate rival causal factors. That is why in our statistics classes we always hadto prove the null-hypothesis, that there was no relation because you can never prove arelationship.
One way that we can put measurement into practice is by mapping outcomes. In orderto do this we must ask the following questions:
< What outcomes are to be achieved?
< Who are the partners interested in reaching those outcomes?
< What are the shared goals and outcomes?
< What are the inputs of each partner? Not just how many dollars will each bring tothe table but what expertise, what amount of time, what kind of space can eachoffer? Can someone lend machinery? Can someone give secretarial support? Cansomeone set up a list serve? All these may be critical inputs to the activitiesinvolved in moving toward the specific output that will eventually lead to theoutcomes that will be measured.
One of the principles used when we think about partnerships is the efficiency ratio. What are the proportions of the sources we leverage in achieving our outcomes? Thatmeans we do not have to be “Lone Rangers.” No entity these days has enough moneyto accomplish much by themselves anyway. We are more efficient if we bring morefolks with a variety of resources to the table. This also means that we value resourcesother money.
In measuring our outcomes we have to agree on what is the unit of analysis. What dowe mean by the community? What are the communities of place and what are thecommunities of interest? What is the level of aggregation? Are we talking aboutindividuals? Are we talking about classes? What are we talking about? What is theevidence that we will use? I like to think of this in terms of evidence, rather than data,because when we are talking about making decisions that change the way we behaveor how we allocate resources, we are, like juries, weighing evidence. What is the mostuseful kind of evidence that we can gather and how do we gather that evidence?
Our criteria for measure should include:
< Something is likely to change because of what we do.
< It is responsive to what we do, even with those random changes that are alwaysoccurring. In other words, having a wet year or having a dry year will not maketoo much difference in the outcome.

Measuring the Social Dimensions of Managing Natural Resources 95
< Measuring it at different points in time is easy.
If we have a great measure that is very expensive, we may only do it once. That kindof expense with a measure is worth it in our analysis of context but it is problematic ifwe are doing the type of continual monitoring that builds social capital and helps uswork toward our goals.
The outcome is a larger goal, what we expect to happen as a result of our activity. Again, we cannot totally control it due to those random changes that are alwaysoccurring. The output is the immediate product of our activities and those of ourpartners. It is something we can control and therefore claim. However, sometimes wefocus more on things we can control rather than on things that are important.
Activities include meetings, putting in signage, education programs, wetlandremediation, breeding fish, stocking streams, and reducing parking lot sides. These areactivities that can take place related to a refuge and can contribute to the output that inturn contributes to the outcome. Only then can we look at the inputs.
Inputs help determine what activities can be done and a variety of activities should belisted. Inputs are also a way to bring in partners, not because they have this inputresource but because they share the outcome. Inputs include dollars, people, time, andparticularly knowledge. It involves space, technology, and machinery. All these arecritical inputs that often come from a variety of sources in terms of the communities ofinterest and communities of place, which share the multiple outcomes provided by therefuge. Remember the five activities: hunting, fishing, nature observation,environmental education, and photography. It is important that all those activities takeplace, but it is even more important that those activities contribute to the variety ofoutcomes, not only for refuge users but for the whole variety of stakeholders forwhom the other outcomes matter greatly.
A map is drawn by separating the outcomes, seeing what you start with, seeing whatoutputs lead to those outcomes, listing the alternative activities, and then seeing theinputs needed to carry out those activities. If you do not have all the input you needfor a particular activity, then you should look for a different activity that contributestoward the outputs. You also look for activities that can contribute to multipleoutcomes. For example, if you are interested in an output for repairing buffers in arefuge, you could simply accomplish this by telling someone to come in and do itquickly. That would be one output of riparian buffers. It would also increase thefinancial income of one member of the community, perhaps, but that would be aboutit. In this scenario, we could say there are two outcomes, one related to ecosystemhealth and another related to the economic vitality of the community.
If you take that same amount of money, or perhaps just part of it, to have a series offield days for training and educating a variety of people in how to and why to do

96 Measuring the Social Dimensions of Managing Natural Resources
riparian buffers, you would also be contributing to human capital and social capital. There would also be a wider disbursement of financial capital when you paid foodproviders and transporters for their services. In this case, the output would be thesame, but the outcomes would be very different.
In order to carry out the last scenario where a variety of groups are involved, you needpartners. What are the advantages of working with other groups? You can optimizeyour outcomes and contribute to more than one at a time. Second, you can cutduplication. By cutting duplication you can also show the unique role of what you doon the refuge, as well as the importance of each partner. Working with other groupsallows you collectively to bring diverse resources to address a specific issue. Peoplewant to collaborate more on specifics that lead toward an agreed-upon outcome. Thiscan be done in a very general way by saying, “What can we do if we pool our money?” And finally, it helps to address a variety of issues better in a systematic way. Workingwith other groups increases buy-in in communities of interest and place and increasespolitical clout. People who participate are more willing to support a program longterm.
There are some disadvantages to working with groups, as well. There can be hightransaction costs involved. Determining who the partners are, negotiating the terms ofthe contract with each partner and with all of the partners together, and simply keepinginformation flowing so that everyone is involved takes a lot of time and requirestransaction costs. Nothing makes a person angrier in a partnership than if they feeltheir name is being used in vain. That means you must constantly check back with thepartners, which requires a lot of time on the telephone, a lot of time of e-mail, andprobably a lot of time chatting. It is important to keep people tied together, but it canalso become an end in itself, rather than a means toward an end. We can be so busykeeping a group together that we forget why we are a partnership in the first place.
The outcomes in refuge management are not just to help the ecosystem and to focuson fauna biodiversity. They also include a vital economy and social equity. Refugemanagement can increase human capital, social capital, natural capital, and financialand built capital. Only by increasing all these capitals can the refuge become strongerand more dynamic. This then yields some potential research questions. What dodifferent communities want from the refuge? What are the desired future states ofdifferent communities of place and of interest? What are the different communities ofinterest within communities of place? How do different communities know what theywant and how far they are from getting what they want? What are their evidence orindicators? How do different communities think they will get to where they want togo? These are the mental causal models of what leads to what. For example, peoplemay agree on a desired future state but have some wildly different views about how toget there. One may think that severe government regulation is needed while othersmay think that more local participation is needed. Looking into effecting these mental

Measuring the Social Dimensions of Managing Natural Resources 97
causal models allows us to communicate better with people, especially with peoplewhose mental causal models differ from our own.
Another critical research question is in what context do which processes work toachieve which outcomes? We know some general principles of participation in buy-in,for example, but it can vary a lot. What you do in southern Alabama will be verydifferent from what you do in suburban areas of Minnesota. Understanding thatcontext and systematically linking context to process to outcomes is a very importantpiece of social research that can help in refuge establishment, management, as well asin building healthy communities of place.
Appropriate methodologies include content analysis of group and institutionalpublications. In fact, we recommend doing this first. Before starting any kind ofintrusive data gathering, we recommend you work through written records,newspapers, and key informants first to determine who are the critical institutionalactors in an area. These should relate to the issue of land management, environmentalquality, and other aspects of the outcomes you believe your refuge contributes to orwill contribute to. Documents should be analyzed in terms of the desired future statesand can include community plans, newsletters, and, again, newspapers. Newspapersshould be read carefully, looking at the phrases used and the words used. Do theyappear to use words the same way you do? If a sociologist does this research for you,you will then need to spend time discussing the findings.
Focus groups can be a next phase after document analysis. A good focus groupstrategy in this case is to bring together representatives of institutions, formal andinformal. You could include someone from the coffee shop on the corner, as well asrepresentatives from the county level Farm Bureau or the Farmers’ Union. Thesefocus groups should include those who agree in their written statements about theirdesired future state. Conveners of the focus group can point out that there is evidencebased on the written statements that everyone agrees on a certain issue or issues andthen can raise broad questions concerning how to get there.
You can also use data collected for other administrative purposes. Data collectionguidelines can be found in the interactive workbook, Measuring Community Successand Sustainability, which is available on the web page of the North Central RegionalCenter for Rural Development (http://www.ncrcrd.iastate.edu) or for sale in hardcopy. This Center web page also contains an annotated bibliography of socialindicators that could be of use to researchers.
We have a method of measurement once we have determined the meaningfuloutcomes. We generally work with the five outcomes because, in the case of refuges,it is very arguable that the refuge contributes to all four forms of capital and the fiveoutcomes that communities feel are important. For each outcome we will ask thegroup that is going to do the measurement the following questions: What is the most
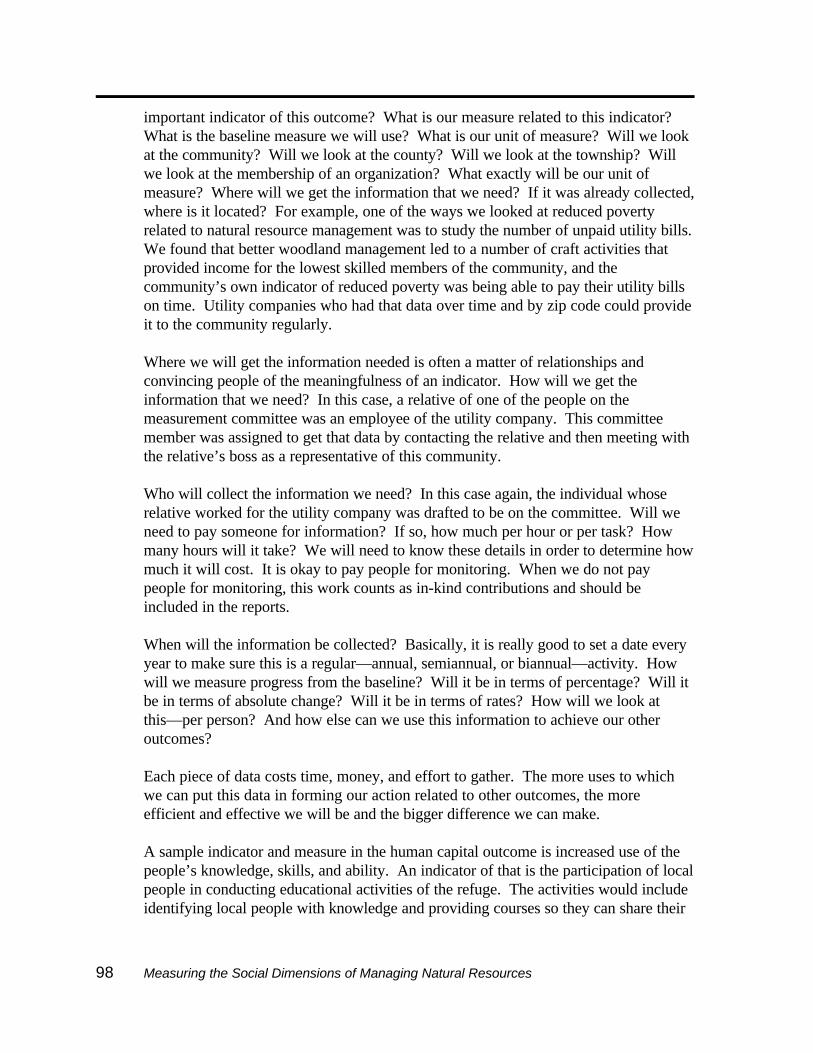
98 Measuring the Social Dimensions of Managing Natural Resources
important indicator of this outcome? What is our measure related to this indicator? What is the baseline measure we will use? What is our unit of measure? Will we lookat the community? Will we look at the county? Will we look at the township? Willwe look at the membership of an organization? What exactly will be our unit ofmeasure? Where will we get the information that we need? If it was already collected,where is it located? For example, one of the ways we looked at reduced povertyrelated to natural resource management was to study the number of unpaid utility bills. We found that better woodland management led to a number of craft activities thatprovided income for the lowest skilled members of the community, and thecommunity’s own indicator of reduced poverty was being able to pay their utility billson time. Utility companies who had that data over time and by zip code could provideit to the community regularly.
Where we will get the information needed is often a matter of relationships andconvincing people of the meaningfulness of an indicator. How will we get theinformation that we need? In this case, a relative of one of the people on themeasurement committee was an employee of the utility company. This committeemember was assigned to get that data by contacting the relative and then meeting withthe relative’s boss as a representative of this community.
Who will collect the information we need? In this case again, the individual whoserelative worked for the utility company was drafted to be on the committee. Will weneed to pay someone for information? If so, how much per hour or per task? Howmany hours will it take? We will need to know these details in order to determine howmuch it will cost. It is okay to pay people for monitoring. When we do not paypeople for monitoring, this work counts as in-kind contributions and should beincluded in the reports.
When will the information be collected? Basically, it is really good to set a date everyyear to make sure this is a regular—annual, semiannual, or biannual—activity. Howwill we measure progress from the baseline? Will it be in terms of percentage? Will itbe in terms of absolute change? Will it be in terms of rates? How will we look atthis—per person? And how else can we use this information to achieve our otheroutcomes?
Each piece of data costs time, money, and effort to gather. The more uses to whichwe can put this data in forming our action related to other outcomes, the moreefficient and effective we will be and the bigger difference we can make.
A sample indicator and measure in the human capital outcome is increased use of thepeople’s knowledge, skills, and ability. An indicator of that is the participation of localpeople in conducting educational activities of the refuge. The activities would includeidentifying local people with knowledge and providing courses so they can share their

Measuring the Social Dimensions of Managing Natural Resources 99
knowledge and learn more about the resource. The measure would be the number oflocal people acting as docents in the refuge.
Some sociological research, particularly in applied sociological research, addresses thecontext, the process, and the outcome. How do we measure it and how do we effectit? All research takes time and money. We need to be judicious in our choices ofwhat we measure based on knowing how we are going to use it. Too often wemeasure things simply because we have always measured them. With each piece ofdata gathered, with each measure of community success, with each measure ofoutcome that you will monitor over a period, you need to ask yourself, “What will I dodifferently if I know this fact?” If it is not clear to you, talk it over with a sociologist. The North Central Regional Center for Rural Development, which serves this region,will be happy to put you in contact with a social scientist in your region or state or inother states if it seems more appropriate.
We are convinced that social research has an important role to play in making your jobeasier and making what you do even better. Combined with research on the humandimensions, a social/psychological research, we can know more, act more wisely, andserve more people as we share our knowledge. One of the saddest things about thesocial aspects of refuge management is that by not recognizing it to be a researchtopic, we do not create opportunities to compare and examine our experiencessystematically. The importance of comparative case studies is critical in this work. Each resource and each refuge can participate in this in a variety of ways.

18West, P. C. 2000. Research on minorities, social justice, and natural resource management: An agendaand three examples. In Human Dimensions of Natural Resource Management: Emerging Issues and PracticalApplications, eds. Fulton, D. C., K. C. Nelson, D. H. Anderson, and D. W. Lime. St. Paul, MN: Cooperative ParkStudies Program, University of Minnesota, Department of Forest Resources.
19Associate Professor Emeritus, School of Natural Resources and Environment, University of Michigan,Dana Building, Ann Arbor, MI 48109.
Research on Minorities, Social Justice, and Natural Resource Management: An Agenda and Three Examples18
Patrick C. West19
In this paper three areas of research on minorities and natural resource management areexplored based on my research in these areas. Other issues related to minorities could beaddressed, but due to space limitations I will confine my discussion to these three issues.The first two issues relate to fisheries resources and the third relates to recreational use ofpublic lands including federal wildlife refuges. The specific topics considered here are:
1. Toxic fish and environmental justice2. Indian fishing rights conflicts, and3. African American minorities and the recreational use of public lands
Toxic fish and environmental justice
Point source discharge in public waters is usually considered the jurisdiction of the statesand the US Environmental Protection Agency (USEPA). However, as these issues affectthe viability of fisheries resources, the US Fish and Wildlife Service (USFWS) should alsobe playing a role in research and policy making. Because low income minorities are thehighest consumers of fish in many regions, this should encourage the USFWS to engagein research on environmental justice. Environmental justice has usually been conceived asthe differential impact of toxic pollutants on minority populations. Most attention hasbeen paid to the differential siting of hazardous waste facilities near low income minorityneighborhoods. But the very high consumption of toxic fish by low income minorities isalso receiving increasing attention. In our studies in Michigan (West et al. 1995), lowincome minorities are consuming fish well above the average sport angler. For many years,it was assumed that the average consumption for all anglers was 6.5 grams/person/day(GPD). This was then factored into a complex formula involving many variables in settingpoint discharge regulations for specific toxic chemicals. The formula is complex but therelevant understanding here is that, other factors being equal, the greater the assumed fishconsumption rate, the more restricted is the permitted discharge of toxic chemicals.

Research on Minorities, Social Justice, and Natural Resource Management 101
Recently the USEPA, drawing on a variety of research studies, established and mandatedthat the average fish consumption assumption in point discharge standards in the GreatLakes states should be 15 GPD, or a little more than twice the existing standard. Ourresearch in Michigan (West et al. 1995), indicates that low income (less than $25,000)minorities (primarily African American and Native American) consume fish at a rate of43.1 GPD, while other subgroups consume fish at closer to the 15 GPD mean (11 GPDto 18 GPD). Note that this is a statistical interaction effect between race and class(statistical interaction—F = 21.65, p < .001). Most studies on fish consumption have nottested for this interaction effect. (For other comparisons of our methodology with themethodologies of other fish consumption studies see USEPA 1997.) The high 43.1 GPDfor low income minorities is troubling but is also in need of further replication researchbefore these data can be effectively used in reformulating point discharge policynationwide.
Because the USFWS is the primary fishery agency of the federal government, it isrecommended that the USFWS and the USEPA collaborate to conduct replication studies. If replication studies continue to find such high rates of consumption for low incomeminorities, the implications for federal point source standard setting are clear. Relying on“fish consumption advisories” to lower consumption by this group of anglers would fail tounderstand the important protein subsistence role that lies behind this high rate ofconsumption.
Indian fishing rights conflicts
This highly charged policy and management issue is relevant to USFWS research andpolicy agendas in two important ways. First, as in the case of toxic fish, the USFWS is thesole federal agency concerned primarily with fisheries policy. Second, because Indianfishing rights claims stem directly from federal treaties, the federal government, and notthe states, has a sole responsibility in relating to tribes and tribal rights based on federaltreaties. Both law and precedent established in litigation clearly supports this role forfederalism.
There are many areas of social science research that would be relevant avenues forresearch. For instance, my early research focused on the political sociology of powerrelations among the contending parties and the coalition power between state DNR’s,white anglers, and tourism stakeholders (West 1986). However, more recently I havebegun to view these power struggles as they are nested in law and questions related to thesociology of law.
There are two lines of research that come together to form one meaningful and pragmaticline of research. The first aspect of this research is the sociology of legal institutionsthemselves, especially matters of Native American law that have developed based ontreaty law and court precedents. The second line of research is public reaction to the

102 Research on Minorities, Social Justice, and Natural Resource Management
special “substantive” rights granted to Native American tribes by law. Are these reactionsracist, or are they based on different perceptions of “justice” in American culture?
The legal history of Native American law clearly establishes “special legal rights”especially where these claimed rights are based on treaties with the federal government. Treaties that are still in existence in modern legal institutions of the federal courts translatetraditional law of the past into a continuity of legal rights now encased in “rational legallaw” of our modern legal system. They have the force of legitimate law. While theCongress has the right to abrogate treaty rights, they have been reluctant to do so in themodern period, and the federal courts have been respectful in translating treaty rights intorational legal “substantive justice rights,” i.e., special rights for particular groups of peoplewhose claim of special rights is granted legal sanction and legitimacy by specific rules oflaw. Indian fishing rights ensured by treaties is one such “substantive justice” right.
Two other closely related principles of Indian rights law reinforce these substantive justicerights. The first of these we might call the “emic interpretation of treaty law.” Theconcept of “emic” in anthropology means the interpretation of reality as native peoplesperceive it to be (not, for instance, as a social scientist might interpret things). In relationto Indian fishing rights, this principle of Indian law ensures that treaties be interpreted inthe way(s) that the native peoples understood them to be at the time of their agreement totreaty creation. Thus, for instance, the right to fish at “accustomed places” might have abroader territorial meaning according to the emic interpretation of fishing rights. Thesecond principle is the doctrine of “reserved rights.” In the signing of original treatiesnative fishing rights were not granted by white society, but rather were reserved rights thatnative people retained in giving up land rights. This principle adds legal legitimacy to thesubstantive justice of special Indian fishing right claims. Legal research on these and otherprinciples of treaty law can help in the formulation of rational legal agency policy. It canalso be used to conduct research on white society's reactions to substantive rights. Manywhite fishers will frame their arguments against special Indian fishing rights according toanother major principle of justice in American culture—the doctrine of “equality beforethe law.” According to this principle of justice a white fisher might say, “I have nothingagainst Indians, but they should have to follow the same fishing rules and regulations that Ido.” Thus, white objection to Indians’ special rights under federal law protecting NativeAmerican fishing rights may not always be based in racism but rather on two conflictingprinciples of “social justice” within American culture and legal institutions. To the extentthat racism is not present, these conflicting principles of legitimate principles of justice(substantive justice vs. equality before the law) research aimed at conflict managementmay have a different approach than the assumption of racism. To the extent thatindependent racism may be present, research may establish that these conflicting principlesof American justice may pour more oil on the fire of overt racism. Distinguishing the greyareas between these two extremes would be a theoretical and methodological challengefor any such research in this arena, but the conceptual distinction between these two polarextremes would be essential in any research on the public’s reactions to seeminglyconflicting legal claims. In fact, however, is it not true that the principle of different

Research on Minorities, Social Justice, and Natural Resource Management 103
income levels paying different taxes is both a matter of substantive justice and equalitybefore the law? Is this not true in the case of special substantive rights for NativeAmerican fishing rights?
Recreational use of wildlife refuges by minorities
The issue of underrepresented recreational use of public lands by minorities is a challengefor many federal, state, regional, and local public land management agencies including theUSFWS. Research by the USFWS on this issue and the barriers to increasing minorityparticipation has lagged behind the research by other agencies, especially the researchcarried out by the USDA Forest Service (e.g., Ewert et al. 1993).
However, the issues and challenges are much the same. Prior research on this topic hasfocused primarily on two theoretical explanations for minority underrepresentation in therecreational use of public lands; the “marginality” and “cultural” hypotheses (see especiallyWashburne (1978), whose research set the tone for the emphasis on these twohypotheses). The marginality hypothesis states that there is lower participation because,on average, minorities do not have the economic means available to white families. Thecultural hypothesis postulates that minority culture does not place a positive value on suchparticipation. While there is evidence for both hypotheses, a third hypothesis has receivedless attention—the role of discrimination, or fear of discrimination, that tends to keepminority groups away. In our research in the Detroit metropolitan area, the use of “depthprobe” measures was able to detect interracial relations factors better than structuredquestionnaire measurements. Indicators fell into three categories: racial/antiblack, raceproblem, and unwelcome/uneasy. Using these indicators our research found that 37percent of black respondents (compared to 16.7 percent of white respondents)experienced interracial relations factors with respect to types of negative reactions theyhad experienced from others in regional pubic parks (West 1989). Further qualitativeevidence suggests that traveling to distant recreation areas is perceived as hostile terrain inaddition to experiences in public lands themselves (West 1993). Thus, future research onbarriers to minority participation on public lands in general and federal wildlife refuges inparticular that may be sponsored by the USFWS should investigate interracial relations inaddition to marginality and cultural explanations.
While the recreational use of public lands, including federal wildlife refuges, may seem tobe less important than other civil rights issues, we might recall that the act of Rosa Parkssitting in the front of a bus on that historical day, had very little to do with masstransportation, and very much to do with human dignity. While the issues raised here mayseem more controversial than those raised in other papers in this volume, I would urge theUSFWS to consider these and other research agendas involving minority social justiceissues. These are neither liberal nor conservative issues—they are human issues, issues ofour common humanity. There is a marvelous book called by some “the good book,” thatsays somewhere “love thy neighbor as thy self.” I do not believe there was a footnote, or

104 Research on Minorities, Social Justice, and Natural Resource Management
intention to read between the lines, any qualifier that says “unless thy neighbor is notwhite.”
Literature cited
Ewert, A., D. Chavez, and A. Magill, eds. 1993. Culture, Conflict, and Communicationin the Wildland-Urban Interface. Boulder, CO: Westview Press.
Washburne, R. 1978. Black under-participation in wildland resources: Alternativeexplanations. Leisure Sciences 1:175-89.
West, P. C. 1986. Fisheries and social equity: Provisional perspectives for a political sociology of the Indian fishing rights conflict in the Michigan Great Lakes. InProceedings: Workshop on Fisheries Sociology, eds., Bailey, C., and C. Harris, 85-97. Woods Hole, MA: Woods Hole Oceanographic Institution. Technical ReportWHO1-88-34.
West, P. C. 1989. Urban region parks and Black minorities: Sub-culture, marginality andinterracial relations in park use in the Detroit metropolitan area. Leisure Sciences11:11-28.
West, P. C. 1993. The tyranny of metaphor: Interracial relations, minority recreation,and the urban/wildland interface. In Culture, Conflict, and Communication in theWildland/Urban Interface, eds. Ewert, A., et al., 109-18. Boulder, CO: WestviewPress.
West, P. C., M. Fly, R. Marans, F. Larkin, and D. Rosenblatt. 1995. Minorities and toxicfish consumption: Implications for point discharge policy in Michigan. InEnvironmental Justice: Issues, Policies, and Solutions, ed., Bryant, B., 124-37. Washington, D.C.: Island Press.
US Environmental Protection Agency. 1997. Guidance for conducting fish and wildlifeconsumption surveys. (Draft) Washington. D.C.: US Environmental ProtectionAgency, Office of Science and Technology.

20Field, D. R., R. Hammer, T. Kuczenski, P. Voss, and A. Hagen. Applied demography and naturalresource management: A perspective on social change along the Upper Mississippi Flyway. In HumanDimensions of Natural Resource Management: Emerging Issues and Practical Applications, eds. Fulton, D.C., K. C. Nelson, D. H. Anderson, and D. W. Lime. St. Paul, MN: Cooperative Park Studies Program,University of Minnesota, Department of Forest Resources.
21Respectively, Professor, Department of Forest Ecology and Management and Applied PopulationLaboratory, and Acting Director, Applied Population Laboratory, 350 Agricultural Hall, University ofWisconsin, Madison, WI 53706; Attorney, Michael Best and Friedrich, Madison, WI 53706; Department ofRural Sociology and Applied Population Laboratory, and Cartographer, Applied Population Laboratory, 350Agricultural Hall, University of Wisconsin, Madison, WI 53706.
Applied Demography and Natural ResourceManagement: A Perspective on Social Changealong the Upper Mississippi Flyway20
Donald R. Field, Roger Hammer, Tracy Kuczenski, Paul Voss, and AliceHagen21
Maps discussed in paper available at: http://www.ssc.wisc.edu/poplab/mississippi
Introduction
The demographic study of human population and natural resource management at alandscape scale is perhaps new to refuge managers. On the one hand, most socialscience research on people and social behavior applied to refuges has been derivedfrom social surveys of recreation users on site or state, regional, and national surveysof public attitudes toward wildlife. Such work has provided perspective on thecharacteristics of refuge users (who are the recreation users), frequency of use (howoften do people visit refuges), nature of the use (hunting fishing or wildlife viewing),and the changing values various segments of the population have toward fisheries andwildlife in American society. This work, however, has not addressed refuge concernsabout land use patterns adjacent to refuges, habitat fragmentation, soil erosion onthese lands and the implications for water quality, species reproduction, distribution,and composition on refuges as well as the ecological integrity of the refugesthemselves. The demographic study of people and land use, on the other hand, whilewell developed elsewhere has been largely absent as an information tool for refugemanagers.
The purpose of this paper is to introduce refuge managers to applied demography andits use in refuge management. We proceed in the following fashion. First, we describeapplied demography and the demographic study of people and the environment. Second, we draw a parallel between demographic analysis and landscape ecology. Third, we introduce three demographic variables, housing, income, and traditionalextractive occupations, that provide perspective on social change along the Upper
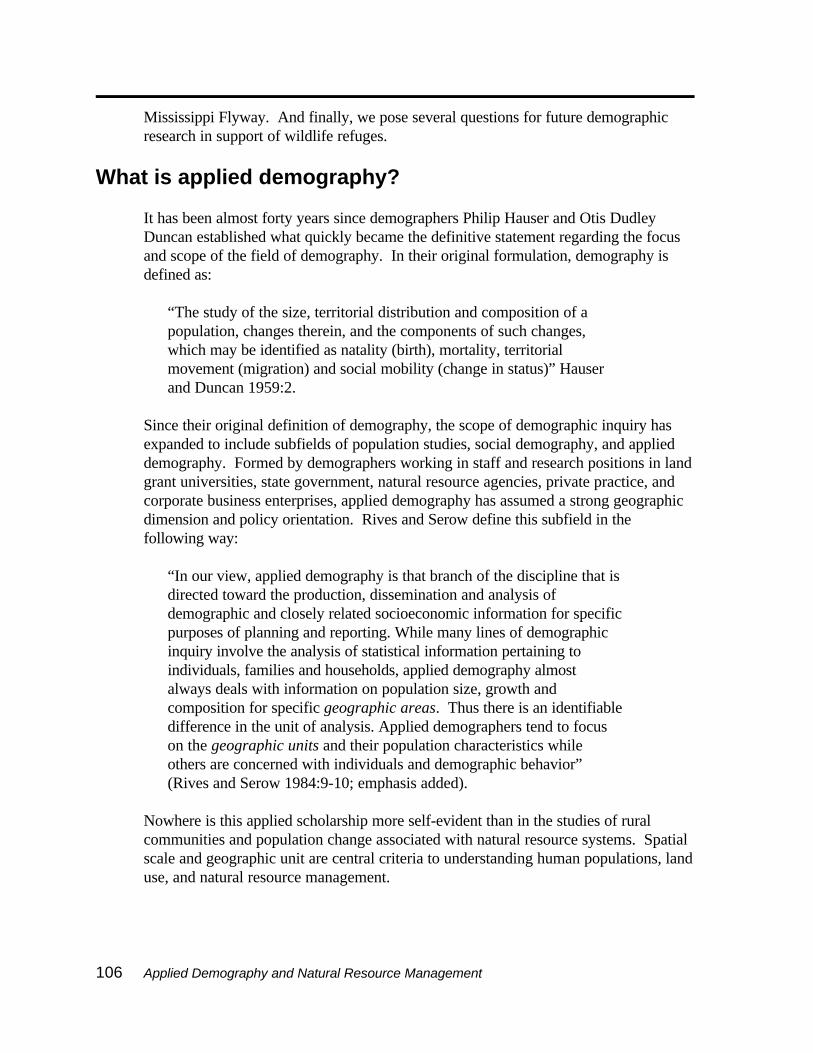
106 Applied Demography and Natural Resource Management
Mississippi Flyway. And finally, we pose several questions for future demographicresearch in support of wildlife refuges.
What is applied demography?
It has been almost forty years since demographers Philip Hauser and Otis DudleyDuncan established what quickly became the definitive statement regarding the focusand scope of the field of demography. In their original formulation, demography isdefined as:
“The study of the size, territorial distribution and composition of apopulation, changes therein, and the components of such changes,which may be identified as natality (birth), mortality, territorialmovement (migration) and social mobility (change in status)” Hauserand Duncan 1959:2.
Since their original definition of demography, the scope of demographic inquiry hasexpanded to include subfields of population studies, social demography, and applieddemography. Formed by demographers working in staff and research positions in landgrant universities, state government, natural resource agencies, private practice, andcorporate business enterprises, applied demography has assumed a strong geographicdimension and policy orientation. Rives and Serow define this subfield in thefollowing way:
“In our view, applied demography is that branch of the discipline that isdirected toward the production, dissemination and analysis ofdemographic and closely related socioeconomic information for specificpurposes of planning and reporting. While many lines of demographicinquiry involve the analysis of statistical information pertaining toindividuals, families and households, applied demography almostalways deals with information on population size, growth andcomposition for specific geographic areas. Thus there is an identifiabledifference in the unit of analysis. Applied demographers tend to focuson the geographic units and their population characteristics whileothers are concerned with individuals and demographic behavior”(Rives and Serow 1984:9-10; emphasis added).
Nowhere is this applied scholarship more self-evident than in the studies of ruralcommunities and population change associated with natural resource systems. Spatialscale and geographic unit are central criteria to understanding human populations, landuse, and natural resource management.
Applied Demography and Natural Resource Management 107
Demographic analysis and natural resource management
In her presidential address to the American Population Association, Anne R. Pebley(1998) outlined the progression of demographic studies associated with theenvironment. Pebley draws heavily upon Vernon Ruttan (1993), who outlined threewaves of social concern regarding the environment. Initially Ruttan suggestsdemographic attention to the environment focused upon whether natural resourcessuch as land, water, and energy supplies could sustain economic growth in associationwith population growth (Ruttan 1993). This emphasis prevailed in the 1940s and1950s. The next wave expanded upon the base of natural resources and examined thebyproducts of technological development, i.e., the ability of the environment to absorbair and water pollution, asbestos, pesticide, radioactive waste, and household waste. Such emphasis emerged in the 1960s and 1970s. According to Ruttan (1993), thethird wave, 1980 through the 1990s, added acid rain, global warming, and ozonedepletion to the population natural resource equation. Pebley follows with theemergence of an additional focus in the third wave of demographic research on therelationship of population growth and land use upon loss of wilderness and theextinction of plant and animal species. She notes, however, that in most cases theemphasis is on the consequences of environmental change on human welfare.
With the emerging emphasis on ecosystem management, we would add a fourth wavein demographic research, namely the application of demographic analysis (applieddemography) to resource management on public lands. There is a problem-solvingand policy element to this analysis. There is, likewise, an added focus on integratingdemographic measures with specific characteristics of the biophysical environment in acommon theoretical and methodological paradigm. Recent trends in research andpractice in natural resource management place human behavior and social systems asimportant dimensions of ecosystem management in parks, forests, and refuges. Inother words, people and communities are a natural component of ecosystems alongwith plants, animals, minerals and chemicals, air, and soils and must be examinedtogether. This, likewise, expands demographic analysis from its traditional partnershipwith other social sciences such as sociology, geography, anthropology, and economicsto the fields of forestry, wildlife and plant ecology, soil science, and agronomy. Wesuggest landscape ecology affords one opportunity to link applied demographicanalysis with its emphasis on geographic units to biophysical characteristics of theenvironment.
Applied demography and landscape ecology
Landscape ecology is an emerging but rapidly burgeoning field of study that involves ascale-conscious investigation of the patterns and ecological processes of landscapes. Risser noted that:

108 Applied Demography and Natural Resource Management
“As a field of scientific inquiry, it considers the development andmaintenance of spatial heterogeneity, interactions and exchanges acrossheterogeneous landscapes, the influence of heterogeneity on biotic andabiotic processes, and the management of that heterogeneity . . .Landscape ecology considers managed, as well as natural, ecosystems,and many fundamental questions in ecology and resource managementrequire understanding the ecology of a landscape” (Risser 1987).
It integrates scientific rigor and theory into case studies designed to understandecological relationships and seeks to resolve conflicts between human activities andecological systems. The rapid growth of the discipline can be attributed to a numberof trends, including the ready availability of powerful imaging, remote sensing, anddata storage tools. The ongoing debate over land use and resource allocation andpreservation, made more salient by growing human populations; broad-scaleenvironmental questions, and land management problems require the accumulation ofempirical evidence about a wide range of ecological systems consistent with landscapeanalysis. Further, the focus on landscapes and regions is evident in the ready adoptionof concepts applied in landscape ecology borrowed from such applied fields aslandscape architecture, urban and regional planning, conservation biology, andgeography.
As Risser (1987:3) notes, landscape ecology is “the synthetic intersection of manyrelated disciplines that focus on the spatial and temporal patterns of the landscape.” Applied demography is a parallel discipline and a similar synthesis. Applieddemography operates at both scale and geographic unit compatible with landscapeecology while the demographic variables employed match landscape ecologicalmeasures in kind. We note here that the field of landscape ecology accommodates thediscussion of human landscapes and, more importantly, the organization of humansociety within natural and human constructed landscapes. Significantly, landscapeecology as a field of study considers humans as actors in and therefore as part of thelandscape (see Risser 1984:7; Naveh and Lieberman 1984:9). Landscapes can becharacterized by three fundamental concepts: structure, function, and change (Risser1987:5).
For the applied demographer at a landscape level population size, composition,concentration, and distribution provide structure to a social system. Social systemfunctions consist of relationships and interactions between and among populationmembers and institutions. The interactions between social structure and function andthe structural and functional attributes of the biophysical landscape foster distinctivesocial-cultural systems and shape the manner in which environmental dimensions areincorporated into these systems. All systems undergo changes in their structure andfunction. Such changes invariably affect the relationship of a social system with the

Applied Demography and Natural Resource Management 109
biophysical environment. For our purposes here, we focus on social system structureand the change therein to illustrate the application of applied demography to resourcemanagement.
The Upper Mississippi region
This paper focuses on a 31-county region along the Mississippi River in Minnesota andWisconsin. The region includes 16 counties in Minnesota and 15 in Wisconsinbeginning with Pool 8 of the Mississippi in the south at Vernon County, Wisconsin,and Houston County, Minnesota, and stretching north along the Mississippi toHennepin and Ramsey counties in the Minneapolis-St. Paul metropolitan area. Theregion also extends north along the St. Croix River, encompassing Chisago andWashington counties in Minnesota and Polk and St. Croix counties in Wisconsin. Theregion includes both counties on the Mississippi River and their immediate neighbors. Along with Minneapolis-St. Paul, the region encompasses the Eau Claire and LaCrosse, Wisconsin, and Rochester, Minnesota, metropolitan areas and the smallercities of Menomonee, Maiden Rock, Pepin, Alma, Fountain City, Arcadia, andTrempealeau, Wisconsin, and Red Wing, Lake City, Wabasha, and Winona,Minnesota.
Housing density 1940 to 1990
Population density and housing density are two different but related measures ofpopulation structure and social organization of communities and the countryside. People are counted by the census at their primary residence. Thus, population densityis a reflection of the permanent population residing in a given geographical area. Seasonal residents, in other words, are not reflected in population counts for areassubject to both growth of permanent residents and temporary residents. Housingdensity may be more useful for assessing changes in land use along the Mississippiriverway because of relative permanency of housing stock whether owned bypermanent or temporary residents. Elsewhere we have outlined the benefits ofexamining housing density associated with forest cover and change in natural regionswhere seasonal housing is flourishing (Radeloff et al. 2000). While the MississippiRiver corridor is not experiencing the rapid growth in seasonal land ownership as thenorthwoods of Minnesota and Wisconsin, it is nevertheless an opportunity in onemeasure to capture both types of residential ownership. In 1940, the region wasoverwhelmingly very low density with fewer than five housing units per square mile. Moreover, nearly all the cities and villages were compact, high-density areas (with 40or more housing units per square mile) and only a few of them were surrounded bymedium density peripheries of between five and 20 housing units per square mile. Even the Minneapolis-St. Paul area was nearly confined to Hennepin and Ramseycounties. The riparian corridor of the Mississippi displayed a markedly higherpopulation density than the surrounding areas. During the next three decades, up to

110 Applied Demography and Natural Resource Management
1970, this compact development pattern slowly yielded to a more dispersed, medium-density pattern. During the 1970s this change accelerated with noticeable differencesbetween 1970 and 1980. In particular, the large area with very low housing density inSt. Croix County, Wisconsin, virtually disappeared. Along the Mississippi, higherhousing density areas expanded, consolidated, and merged. Although residentialdevelopment patterns continued to grow more disperse during the 1980s, it was not atthe pace of the earlier decade. Overall the structure of human settlement changedsignificantly during the 50-year period with population density increasing along theriver and dispersing over a larger portion of the region.
Projected housing density 2000 and 2010
We projected the number and density of housing units for the year 2000 and 2010using two different methods. In the first set of projections we used the averagehousing growth rate from the preceding five decades from 1940 to 1990, calling it the“Historical Trends” and in the second we used only the high growth rate from the1970, calling it the “Rural Renaissance.” In the historical trends projection, by 2010,the only substantial areas with fewer than five housing units per square mile remainingin the region will be in Buffalo and Jackson counties in Wisconsin, and Dodge,Fillmore, Houston, and Wabasha counties in Minnesota. The only one of theseremaining low-density areas along the Mississippi will be near Wabasha, Minnesota. In the rural renaissance projection, the portion of this very low-density area near theMississippi disappears with only a fragment remaining in central Buffalo County,Wisconsin. A major portion of the very low-density area in Dodge County,Minnesota, also yields to housing development in the rural renaissance projection.
Seasonal housing
Within the region, the Mississippi River itself does not appear to be a magnet forseasonal housing except along Lake Pepin, Pool 5, and Pool 4, near Pepin and Alma,Wisconsin, and Lake City and Wabasha, Minnesota. Although these Mississippi Riverareas have high proportions of seasonal housing, they are embedded within countieswith relatively low housing densities. The major centers of seasonal housing in theregion lie in the lake area of Polk County, Wisconsin, and near the Wisconsin River inJuneau County, Wisconsin. The sizeable pocket of seasonal housing in south centralJackson County, Wisconsin, lies along the Black River south of the Black River FallsState Forest. The other concentration of seasonal housing in northeastern JacksonCounty may be more oriented toward hunting given its proximity to state wildlifeareas.

Applied Demography and Natural Resource Management 111
Household income
The geographic pattern of household income in the region reflects the generaldifferences in income patterns among urban, suburban, and rural areas. The broadband of Minneapolis-St. Paul suburbs have the highest income levels as do Rochester,Minnesota, and La Crosse, Wisconsin. The central city areas of Minneapolis and St.Paul, along with the most rural areas in the region, have the lowest median householdincomes at less than $25,000 per year. The low median income in the lake area innortheastern Polk County is somewhat surprising and may indicate income differencesamong year-long residents and the high proportion of seasonal residents who reporttheir income at their primary residences. In terms of income, the Mississippi Rivercommunities are not noticeably differentiated from surrounding areas, except as afunction of their place in the urban hierarchy.
Farming, forestry, and fishing occupations
The percent of employed persons in farming, forestry, and fishing occupationsprovides some indication of the traditional nature of some local economies. If weexamine the history of settlement along the river, towns grew on the back of theseextractive activities including river commerce. Overtime this dependence on extractiveemployment declined. Communities who were able to diversify their occupationalstructure experienced growth while those communities who did not declined ordisappeared altogether. Today, counties with high percentages of employment inthese extractive occupations do not tend to be immediately near the Mississippi River. River towns in counties bordering the river have diversified their occupationalstructure adding more service sector, manufacturing, and information age technologyjobs than counties once removed from the river.
Recommendations for demographic research in support of wildlife refuges
Demography is historically linked to human ecology. Demographic attributes oftencomprise human ecological analysis. Our recommendations will span the two fields ofsocial inquiry in no particular manner. Here we have introduced only a few of thedemographic dimensions of social change along the Mississippi corridor. The nextstep is to integrate the social structure with land use change along the corridor. Theforest/vegetation descriptions along the river on both the Minnesota and Wisconsinside are available to do so. We will be able to examine forest cover change inassociation with settlement and development patterns. Pebley (1998), in herpresidential address, has suggested land use and deforestation is a fundamentalconcern for demographers in their future inquiry of population structure and theenvironment. For example, the attraction of the river to new immigrants has resultedin the loss of farmland and forests along the borders of the river. This uneven

112 Applied Demography and Natural Resource Management
dispersed development is accelerating the fragmentation of forests, perhaps limitingthe remaining areas of minimum habitat requirements for certain species of animalpopulations. At the same time certain preferred locations (growth hot spots) along theriver for new development may not be near wildlife refuges and thus are not a problemfor refuge management.
Working with the Upper Mississippi Research Center (USGS Biological ResourcesDivision), river, fisheries, and wildlife characteristics can also be integrated into a database allowing assessment of changes in aquatic characteristics, species reproduction,composition, and distribution associated with human expansion along the riverway. Further water quality assessments at hot spots where development on bluffs andshorelines are expanding contributing to agricultural runoff, pesticide contamination,and soil erosion can be documented.
Refuges are also attractions to river users. As income rises and residents along theriver reflect the new economy, recreation use can be expected to increase. Riverrecreation by and large attracts boaters and anglers from the immediate region. Increased population inhabitation, at human development hot spots (growthcommunities) along the corridor can contribute to increased recreation boating andhunting given the information on household recreation patterns. Projections can bemade on future recreation use of the river and in areas around refuges.
Demographic information spatial displayed can provide refuge managers with a usefultool to participate in the policy process associated with gateway communities andprotected area landscape scale management. Ecosystem management applied torefuges can likewise now include the human species and their institutional structure aspart of these models and in the various planning process looking into the future stateof refuges.
Conclusion
In this article we have briefly outlined the field of applied demography as it is beingemployed in the study of natural resource management and drew a parallel withlandscape ecology. This new integrated database will allow managers to assess humanpopulation change with a variety of environmental factors on the river and along itscourse. Future issues facing refuge managers will mostly like emerge from humandevelopment outside the refuges on the Mississippi and along the shorelines andcorridor bluffs. Our goal is to provide a profile of population growth projectionsallowing managers to anticipate rather than react to human pressures on theseprotected lands.

Applied Demography and Natural Resource Management 113
Literature cited
Hauser, P. M., and O. D. Duncan. 1959. Overview and conclusions. In SociologicalHuman Ecology, eds., Hauser, P. M., and O. D. Duncan, 1-26. Chicago:University of Chicago Press.
Naveh, Z., and A. Lieberman. 1984. Landscape Ecology: Theory and Practice. NewYork: Springer and Verlag.
Pebley, A. R. 1998. Demography and the environment. Demography 35(4):377-389.Radeloff, V. C., A. Hagen, P. R. Voss, D. R. Field, and D. J. Mladenoff. 2000.
Exploring the spatial relationship betrween census and land cover data. Societyand Natural Resources, forthcoming.
Risser, P. G. 1987. Landscape ecology: State of the art. In LandscapeHeterogeneity and Disturbance, ed., Turner, M. G. New York: Springer-Verlag.
Risser, P. G., J. R. Karr, and R. T. T. Forman. 1984. Landscape Ecology: Directions and Approaches. Special Publication no. 2. Champaign, IL: IllinoisNatural History Survey.
Rives, N. W., Jr., and W. J. Serow. 1984. Introduction to Applied Demography:Data Sources and Estimation Techniques. Sage University Paper no.39. BeverlyHills: Sage Publications
Ruttan, V. W. 1993. Population growth, environmental change and innovation: Implications for sustainable growth in agriculture. In Population and Land Use inDeveloping Countries, eds., Jolly, C. L., and B. B. Torrey, 124-156. Washington,DC: National Academy Press.

22Nelson, K. C., and B. W. Steiglitz. 2000. Community relations, conflict management, andcollaborative partnerships. In Human Dimensions of Natural Resource Management: Emerging Issues andPractical Applications, eds. Fulton, D. C., K. C. Nelson, D. H. Anderson, and D. W. Lime. St. Paul, MN: Cooperative Park Studies Program, University of Minnesota, Department of Forest Resources.
23Assistant Professor, Department of Forest Resources, University of Minnesota, 115 Green Hall, 1530Cleveland Avenue North, St. Paul, MN 55108; and Chief, Branch of Planning and Policy, National WildlifeRefuge System, Washington, D.C.
Community Relations, Conflict Management, and Collaborative Partnerships22
Kristen C. Nelson and Barry W. Stieglitz23
Introduction
Collaboration, co-management, community outreach, or conflict management, what will itbe? Increasingly US Fish and Wildlife Service (FWS) managers are finding they mustunderstand and work with multiple stakeholders in the contested terrain of naturalresource management.
Refuge planners and managers may feel conflict most keenly when they establish a newrefuge but conflict and disputes can be a part of any FWS initiative at the local, state, ornational level. We can benefit from a substantial amount of literature and experiencedealing with natural resource mediations, negotiations, and policy dialogues in manycontexts. Some federal agencies are more involved in institutionalizing conflictmanagement but all agency managers can benefit from understanding the concepts behindconflict management, collaborative partnerships and the possibilities for their use inachieving the FWS mission.
Collaborative partnerships are the contemporary version of multiple stakeholders workingtogether to achieve common interests. To date, there is tremendous variation in the typesof partnerships that exist, the issues covered, and the processes that work best. But whatis the state of the art today? For example, FWS biologists have often been part ofwatershed partnerships and increasingly, will be asked to join with other jurisdictions andstakeholders to manage ecosystems.
This paper highlights topics in conflict management, collaborative partnerships, andcommunity outreach that are germane to FWS managers. As a case study, Barry Stieglitzpresents how he has used human dimensions research to support his staff’s work in theFlorida Keys. Finally, we summarize the relevant research issues identified by participantsin the Human Dimensions of Natural Resource Management Workshop (Feb. 2000).

Community Relations, Conflict Management, and Collaborative Partnerships 115
History of human dimensions research by the FWS
Interest in human dimensions research has ebbed and flowed within the FWS since the1950s hunting and fishing surveys. With the emergence of the environmental movement,the passage of the Endangered Species Act and the National Environmental Policy Act(NEPA), the FWS Division of Program Plans within the Office of Planning and Budgetestablished a core staff of social scientists. But in the mid-1980s, the human dimensionsstaff vanished as the agency reorganized by line management. Interest in humandimensions has only gradually reemerged in the 1990s (Lwellynn et al. 1998).
Llewellyn et al. (1998) point to only two studies that had any lasting influence over theFWS. First was Kellert’s 1977 study of American Attitudes, Knowledge, and BehaviorToward Wildlife and Natural Habitats. Kellert conducted 3,100 in-depth interviews overthree years. The study was funded by each FWS program with a proportional cost overthe three-year study period (Kellert 1979). This study influenced an agency shift fromgame species to inclusion of nongame species. It highlighted an FWS constituency shiftfrom wildlife users to the public. And it recommended a “sophistication of peoplemanagement” by the agency. As a result of this study there was some impact on animaldamage control. In 1981, 14 social scientists from FWS and other agencies got togetherat the Minnesota Valley National Wildlife Refuge to form the Human Dimensions WildlifeStudy Group.
The second research program recognized by Llewellyn et al. (1998) is the National Surveyof Fishing, Hunting, and Wildlife-associated Recreation. It evaluates demand and need forrecreation in these areas. In 1980 the findings from this study supported passage of thefederal Non-game Bill. It has also resulted in funding options for nonconsumptive use andmany economic assessments.
In the 1990s, human dimensions research has slowly reemerged as a critical element inFWS work establishing new refuges and evaluating user experiences.
Guidance from the FWS Mission Statement
In public meetings and agency documents, the FWS leadership increasingly emphasizes theimportance of social science research and working with local communities as a means toachieving the agency mission. This spring, in Missoula, Montana, Jaime Rappaport Clarkcalled for human dimensions research as an integral part of problem solving by the FWS. She challenged the participants at the Society for Conservation Biology meeting toevaluate how successful they have been in incorporating a sound understanding of humansystems along with their work on natural systems.

116 Community Relations, Conflict Management, and Collaborative Partnerships
For those that wonder if human dimensions research is really appropriate for an agencydedicated to protecting fish and wildlife, they need only to look at the FWS MissionStatement for guidance.
“The System’s foundation rests on . . . an ecosystem approach to landmanagement and to the stewardship of its fish, wildlife, and plants. Insimple terms, this philosophy looks at the health and biological integrity ofthe land (ecology), takes a view beyond boundaries (landscapes), worksshoulder-to-shoulder with the brothers and sisters of the entire Servicefamily (cross-program), views people and society as part of thelandscape and resources by working with and through others(partnerships)” (Clark 1999) (emphasis added).
Fulfilling the Promise (U.S. Fish and Wildlife Service 1999) goes even further to makerecommendations for how to go about working with people, communities, and othergovernment agencies. For example:
“Recommendation P7: Forge new and non-traditional alliances to broadensupport for the System by establishing citizen and community partnershipson all staffed refuges.
Recommendation P8: Strengthen partnerships with states, Tribes,nonprofit organizations, and academia. Develop new policies andauthorities for establishing formal relationships with the businesscommunity.”
In all these cases, social science research and applied problem solving can help agencypersonnel successfully implement recommendations and meet their objectives. It can assistagency staff in building strong community relations, understanding the dynamics ofemerging conflicts, and maintaining successful partnerships.
Community relations: A Florida Keys case study (from Barry Stieglitz)
There are four National Wildlife Refuges in the Florida Keys: two created as birdreserves, which now include designated wilderness, and two created solely for therecovery of endangered species: the Key deer and American crocodile. In 1957, when theNational Key Deer Refuge was established through the collaborative efforts of the Booneand Crockett Club and the Wilderness Club of Philadelphia, there were approximately 100people and 26 Key deer living on 6,000-acre Big Pine Key, the heart of the Key deerrange. In the early 1970s, the human population had risen to nearly 1,000, while the Keydeer herd, through very intensive and aggressive protection efforts, rose to nearly 400animals. Then came air-conditioning and mosquito control, and a surge of human
Community Relations, Conflict Management, and Collaborative Partnerships 117
development and population growth. The experience in the Florida Keys as a public landmanager is all-too-common: endangered species/human conflicts, the throes of a typicalgateway community, and user conflicts. This combination of typical conflicts made forone big atypical mess.
The Keys are like much of the rest of south Florida, with a tourism-based economy whichdepends largely upon the quality of the environment for its appeal and continuation. TheKeys are a “gateway community,” a term which describes towns bordering public lands,known for their scenic vistas and high quality of life. It is a place at odds with itself,where a demand for economic growth vies with quality of life and community characterissues and the sustainability of its environment. Much of the economic growth degradesor destroys that which made the Keys the Keys—“gin-clear” waters, pristine coral reefs,isolated mangrove islands overflowing with bird colonies, remarkable sunsets, and acombination of North American fauna and Caribbean flora found no where else in theworld. First marketed as paradise, the tourism tax dollars generated from its millions ofannual visitors were reinvested in marketing, until a huge incestuous and cannibalistic gyrefed upon itself and grew at its own expense.
The waters which were once compared to the clarity of gin resemble split pea soup inplaces. Beaches are closed due to high fecal coliform bacteria counts created byinadequate and insufficient sewage treatment methodology and facilities. The once-thriving coral reefs have become but a shadow of themselves, algae-encrusted and dying,the causes myriad and in dispute. The buzz of personal watercraft flushes birds from theirnests, allowing the unshielded nestlings to roast in the hot south Florida sun. And what ofthe unique blend of flora and fauna? More than 120 listed as endangered, threatened orotherwise imperiled by the federal, state, and county governments. Only the sunsetsremain untainted. If the Keys are not yet Paradise Lost, they are certainly Paradise Dying.
In 1990 a meager staff of eight, which did not include any communication professionals,tried to manage the four Florida Keys National Wildlife Refuges. The tourism marketingboom was on the rise, and the Keys became not only a desirable retirement community,but a huge destination for vacationers. The demand for recreation opportunities,especially “thrill” recreational experiences such as parasailing and personal watercraftoperation, grew as more and more vacationers came to the Keys. User conflicts becameincreasingly common. The resident community became extremely polarized, creating hightensions, fistfights at public meetings, spawning antigovernment newspapers, andheadlines which pitted endangered species against residents and the needs of children.
In the early 1980s, there was a single large catamaran offering tours of the refuges’backcountry waters. Only ten years later nearly two dozen boats were offering tours ofthe same areas. Some illegally accessed refuge islands, placing up to 50 peoplesimultaneously on a designated wilderness beach only 10 feet wide and approximately 900feet long. Personal watercraft rentals, parasailing, and “party” boat tours becamecommonplace in and around the wilderness islands.
118 Community Relations, Conflict Management, and Collaborative Partnerships
So, what was done to reduce these conflicts?
First, the refuge staff became alarmed at what they saw happening in the backcountry. They worked with the state of Florida to obtain management authority over those stateemergent, tidal, and submerged lands in the backcountry. They proposed a range ofalternatives, including modest wildlife management zones to exclude inappropriate anddisruptive public use from critical wildlife areas either year-round or seasonally. Somemembers of the community wanted to go further. They lobbied for and achieved the mostrestrictive alternative, which included not only 19 wildlife management zones, but acomplete prohibition on amphibious aircraft landings, hovercraft, water-skiing, airboats,and the much-detested personal watercraft (PWC). An important note is that thestrongest support for the bans came not only from the environmental community, but fromother backcountry users, especially fishing guides, whose businesses suffered as a result ofirresponsible PWC use. Sometimes you can get help from unexpected quarters, but youwill not know unless you look. This support was due in part to extensive outreach atnearly 20 public meetings on the state management agreement.
When I arrived at this duty station in 1995, I became the single point of contact for allmedia inquiries. This was not a control issue, it was to ensure quality and consistency inall of our public communications. This paid big dividends later. It turned “thegovernment” into a single face and name. A person who could develop personalrelationships and trust with media representatives.
I talked with any group who would have me: Chamber of Commerce, Rotary Club, livelocal access television, radio call-in shows, Big Pine Key Civic Association, and the KeyDeer Protection Alliance. These speaking engagements helped greatly, because peoplehad access to something they always felt deprived of before: information. Some peoplethink information only has value if it is withheld: I say it only has value if everyone has it.
I also listened. Communication is, by definition, two-way. The speaking schedule openeddoors to communication and collaboration that had never been opened before. We built atrail to a fallen local environmentalist with the Key Deer Protection Alliance, we workedwith the Chamber of Commerce on extremely contentious road improvement issues, andwe started a Key deer Habitat Conservation Plan with the county and Florida Departmentof Transportation to address long-term divisive development and traffic conflicts.
We also developed better communication skills among the staff. I spent my first week inmy new job at a course entitled “Building Community Support.” Other staff trainingincluded simple writing and grammar, interpersonal skills, conflict resolution, andfacilitation. I saw some gradual improvement over time in the staff’s abilities and, perhapsmost importantly, confidence in communicating with the public and media.
We formed a refuge support group in the local community, to increase grassroots supportand develop community members as ambassadors for the FWS.
Community Relations, Conflict Management, and Collaborative Partnerships 119
We joined the Chamber of Commerce, which provided access to some of our moststaunch detractors. It also helped to put a face on “the government.” Thereafter, ifsomeone had a gripe, they could not say the government is doing this, they said “Barry” isdoing this, and they would call me about it.
In 1997, I received a boon. Someone from our Washington office called and said theywanted to help, and offered $15,000 and a consultant to complete a community relationsstudy, if I wanted it. I did not bother to say “yes,” I just asked the consultant to get on theplane!
It worked like this. I provided the consultant with everything I could, including myassessment of the situation, newspaper clippings, names of contacts (both supporters anddetractors), and a copy of an older report containing recommendations to improvecommunity relations. The consultant then interviewed staff and the contacts, and came tosome fairly concise conclusions which had national application for the FWS(recommendations in italics, Gilliam 1997).
National Implications from Keys Community Relations Study
1. Resource and habitat protection through government regulations are an essentialingredient in protecting wildlife habitat, but will never in and of themselves besufficient to achieve the mission of the agency Public understanding and support thatlead to community-based partnerships are ultimately the means by which the work ofthe Fish and Wildlife Service to conserve, enhance and protect fish, wildlife andhabitats will be achieved.
I can add nothing to this statement: we all learned in school that the most difficult portionof wildlife management is the human element. Holistic approaches often work best.
2. Science needs to be sound, current, accessible, understandable and most of all,
communicated to the public. The translation of scientific research to publicunderstanding and the communication to the public is as important as the scientificstudy itself.
3. The best scientist is not necessarily the best communicator. Make sure that we havepeople who can effectively explain our message to the public assigned to that task. Bewilling to hire professional communicators when it is clearly indicated.
Regarding these two points, communication with the public and outreach, are everyone’sjob! I made the mistake of allowing people to say—I am not trained in that, or I do notfeel comfortable doing that. It is the contact by the maintenance man at the hardwarestore, or the biologist doing a turtle survey, that can often be the most successfulcommunication with the public. Never miss an opportunity. Give your people thetraining, and most importantly, the support to try, and fail if necessary, to talk to the

120 Community Relations, Conflict Management, and Collaborative Partnerships
public. You cannot collaborate with folks with whom you do not communicate. Thatsaid, I also recognize that while everyone wears the hat of “outreach,” there is alsonothing to substitute for the full time focus of a trained, professional communicator. While everyone should conduct outreach, it should also be a professional someone’s full-time job. And in case there is any question in your mind, a trained environmental educatoris not necessarily a trained communication professional. The skills and abilities, while theyoverlap to some degree, are generally not interchangeable.
4. The image of the Fish and Wildlife Service is formed by individuals. An image that isappropriate for law enforcement may be counterproductive in proving that the Fishand Wildlife Service wants to be a good community partner. Traditional rules—suchas when uniforms are necessary—may need to be reinterpreted.
This is true. For instance, in the Keys we heard that many members of the public resentedour “military-looking” uniforms and law enforcement officers wearing firearms in public. So I switched the entire, nonlaw enforcement staff to the kinder, gentler knit polo-styleuniform shirts, and received positive feedback about it. This may not work everywhere, orbe appropriate, but might help our agency image, and certainly demonstrated ourresponsiveness to community concerns.
5. Cultivating public support is a full-time, long-term undertaking. A plan for achievingthe goal of public support should be passed from one project leader to another tomaintain continuity. It should not be personality-dependent, any more than achievingany other management goal for a field station is left to managerial discretion.
We now have Comprehensive Conservation Plans, Fire Management Plans, and LawEnforcement Plans. Why not some long-term vision and direction for communityrelations? I am not suggesting a formal, written process with public input, but certainly asharing of vision between generations of managers and their primary communicationsstaff. The turnover of managers in the Keys was a concern not only for the staff but thecommunity. The lack of management direction and consistency between managers was acommon complaint.
6. All staff should be trained to work with the public, assigned to appropriate publiccontact responsibilities, and rewarded for achievements in this area.
Again, outreach is everyone’s job: this is often a hard sell to biologists, especially whenthey see it as counterproductive to protection efforts.
As a side note, become familiar with the Bleiker concept of “informed consent.” From apractical standpoint, this is what we should strive for. Focus your most intensive outreachefforts not on those who already agree with your direction, program, or project, nor on those who will never agree, but those in the middle. And your goal for these folks is notto get them to say “yes,” but rather to make sure they will not say “no.” Think about it.

Community Relations, Conflict Management, and Collaborative Partnerships 121
In 1999, I presented a paper on outreach at the International Wildlife ManagementCongress in Hungary, and was amazed to hear the common element in almost everypresentation of the human dimension aspect of their work. We are talking questionnaires,studies, and focus groups, and other social sciences incorporated right into research fromthe start. For instance, there is a large carnivore restoration project in Europe. And this isnot some US-style project where we send out questionnaires through the mail to hunterswith prepaid return envelopes. We are talking about biological researchers walking upinto the mountains in the middle of nowhere to ask shepherds what they think aboutwolves in their hills. We, too, need to make social research and communications a part ofeverything we do, until it becomes second nature, to reduce conflict which is derived frominformation gaps or miscommunication.
Successful communication can lead to collaboration which can eliminate or reduceconflict. And that is why I stress the importance of communications: I see it as a way toavoid significantly these problems which so effectively consume our time and prevent usfrom doing other resource work. Talk with your publics, and, as importantly, listen tothem. Be consistent and frequent with your messages. Find support where you expectednone. Do not preach to the choir, find the people outside the church and get them inside. Always remember that outreach is everyone’s job, and make them accountable for doing itevery day, but provide training and recognition when they succeed and support when theyfail (and they will fail sometime). Invest in communications professionals. Last, do not beafraid to take risks. Folks will respond positively to your attempt to reach out to them.
I know someone will ask the question, so I will answer it in advance. The answer is youmust recognize the importance of effective, consistent communication and prioritize itappropriately. The question, of course, is how do I fund a professional communicator andcommunication training for my staff?
Continuum of conflict management options
Despite the best community relations efforts FWS managers will be confronted withconflict. The conflict may be policy based as in a disagreement between stakeholdersabout delisting an endangered species. It may be site specific such as the deermanagement plan in the Minnesota Valley Refuge. Certainly most conflicts include adifference in value orientation among the various stakeholders. Some constituents valuethe economic contribution of fisheries, while others value the ecological contribution ofaquatic biodiversity. FWS managers need to know what these values are in order toaddress them in a conflict management situation. Finally, many environmental conflictsrevolve around resource distribution. Who has what right to a given resource be it water,a wildlife population, or a landscape level vista?
In many of these environmental conflicts there is often no “right” answer. Even the FWSstaff may disagree about the right way to manage a wetlands system depending on whetherthey are managing for an endangered species, for a harvestable species, or at the

122 Community Relations, Conflict Management, and Collaborative Partnerships
ecosystem level. With this level of disagreement within the FWS, one can only begin toimagine the issues local community stakeholders would be concerned about whendeveloping the “best management plan.”
Another factor that often emerges in environmental conflicts is the public’s lack of trust inresource and environmental institutions. Stakeholders in a variety of organizations cometo a conflict with a history of interaction. They often believe the government agencyresponsible for managing a particular resource has not dealt with them fairly in the pastand they have very little trust in a productive relationship for the future. In some cases,groups will believe all government agencies are alike, transferring their frustration anddistrust from one agency to the next agency they encounter in a dispute. Agencypersonnel also come with a history of conflicts with stakeholders that will influence theirparticipation in any attempt to manage a conflict. People come to conflicts over FWSpolicy and management with a personal, group, and societal experience of conflict thatmust be understood to negotiate a possible solution successfully.
In the dispute resolution process of conflict management there is a continuum of optionsavailable to the stakeholders and FWS managers. Briefly they range from consensual toadjudicative processes that incorporate informal to formal procedures. Negotiation is themost flexible process involving all the stakeholders working together without a facilitatorto find common ground. Most successful negotiations feed their agreements back into thetraditional decision-making process as recommendations. Facilitation is equally flexible inthe process but is often used by stakeholders when the service of a third party would helpguide the parties to find a common agreement. These settlements are often presented asadvice within the traditional decision making process. Mediation is a more formal processoften designed by a third party for stakeholders in an escalated conflict. Some agencieshave an institutionalized mediation process but in many cases mediations are situationspecific. Whether the mediation process is institutionalized or not will influence how anysettlements feed into the traditional decision making process.
Arbitration and the courts are the adjudicative dispute resolution processes with activethird party involvement, rigorous procedures, and often mandatory participation. Similarto labor arbitration, environmental conflicts under arbitration require stakeholders topresent evidence to a neutral third party. In many states this third party has the ability tohold the parties to a decision. Finally, many conflicts will end up in the court system withthe traditional system of litigation and decision making by the judicial system. Somestakeholders prefer this well tested means for “settling” conflicts for a variety of reasonsrelated to the balance of power, organizational resources, and existing laws. The FWScertainly expends a tremendous amount of its budget in this final dispute resolutiontechnique. Some folks are interested in using negotiation and mediation to reduce costs,reach “better decisions,” and build a social context for future partnerships.
Despite twenty years of environmental conflict management literature there is still a greatdeal of work to be done, especially in relation to FWS. For example, community relations

Community Relations, Conflict Management, and Collaborative Partnerships 123
studies done by FWS managers or consultants would certainly help improvecommunication and reduce the number of future conflicts. An understanding of thesociopolitical context, stakeholders, and resource issues would help managers participatein productive conflict management. Or it would be beneficial to understand how FWSmanagers can facilitate constructive exchange and learning even during the most heatedconflicts. If you are interested in the abundant literature on negotiation and mediation,you can start with Susskind et al. 1999, 2000; Backburn and Bruce 1995; Goldberg et al.1995; Crowfoot and Wondolleck 1990; and Carpenter and Kennedy 1988.
Collaborative partnerships
In the 1990s, collaboration became the buzzword of regional environmental management. Citizen groups and government agencies were frustrated with the stalemate caused by theraging environmental conflicts of the 1980s. Agency budgets had been cut to the pointthat they could no longer “go it alone,” they needed to combine resources with otherstakeholders. And new thinking about landscape ecology, watershed management, andecosystem management meant that citizen groups, businesses, and multiple governmententities had to work together to achieve shared management goals.
Collaborations and collaborative partnerships come in all shapes and sizes: from theUpper Mississippi River and Great Lakes Region Joint Venture for the North AmericanWaterfowl Management Plan to local watershed councils. Certainly the western UnitedStates has the greatest number of attempted collaborations with watershed councils,Bureau of Land Management (BLM) Resource Recovery Councils, Habitat ConservationPlanning Processes (HCPs), and various forestry roundtables. The USDA Forest Service,EPA and BLM have taken the initiative across the nation in the attempt to institutionalizecollaborative processes.
Supporters of the collaborative processes note many of the benefits found during conflictmanagement negotiations. They find that collaboration is necessary for complex problemsolving, successful implementation, and trust building, among other benefits. Critics findcollaborative processes tend to co-opt local community interests, ignore importantconflicting values, and result in “watered down” agreements, among other problems.
Much of the current research on collaboration and collaborative partnerships is based onsingle case studies or findings summarized from a few case studies. There is a real needfor more comparative work across different collaborations, evaluation of the institutionalimpacts of collaboration, investigation into “burnout” in partnership participants, and ananalysis of how collaborations evolve overtime. (For emerging literature on these issuesrefer to Wondolleck and Yaffee 2000; Frentz et al. 1999; Williams and Ellefson 1997; andMcCloskey 1996.)

124 Community Relations, Conflict Management, and Collaborative Partnerships
Identified research needs in this area
In the full group session of the Human Dimensions Workshop, all the participantsidentified many researchable issues related to community relations, conflict management,and collaboration. When asked, “What problems could be helped by knowing more aboutvisitors?”, a dominant theme was conflict between use groups. Everyone thought moreresearch needed to been done to reduce conflict between user groups but they also wantedsome investigation into the disjunction between the visitors’ perceptions of appropriateuse and the manager’s desires for resource management.
The second question, “What information do we need to enhance FWS work withcommunities?” is directly applicable. There were many suggestions but a few included:learning more about communities around FWS lands, identifying opinion leaders,understanding community goals/values/attitudes/behaviors, identifying sharedcommunity/FWS goals, measuring trends in demographics, etc., measuring social capitalbenefits/costs of FWS lands, and training in collaborative processes. Certainly the demandfor informative social science research to address FWS work with communities willcontinue. The tough change will be to move from our intellectual understanding thatwork with communities is the only way to fulfill the FWS mission to each of us providingpractical support for human dimensions research and programs in our planning andbudgetary decisions.
Literature cited
Blackburn, W., and W. Bruce, eds. 1995. Mediating Environmental Conflict: Theoryand Practice. Westport, CT: Quorum Books.
Carpenter, S., and W. Kennedy. 1988. Managing Public Disputes: A Practical Guide toHandling Conflict and Reaching Agreements. San Francisco, CA: Jossey-BassPublishers.
Clark, J. R. 1999. Forward. In Fulfilling the Promise: The National Wildlife RefugeSystem, Visions for Wildlife, Habitat, People, and Leadership, 13. US Fish andWildlife Service.
Crowfoot, J., and J. Wondelleck. 1990. Environmental Disputes: CommunityInvolvement in Conflict Resolution. Washington, D.C.: Island Press.
Frentz, I., S. Burns, D. Voth, and C. Sperry. 1999. Rural Development and Community-based Forest Planning and Management: A New, Collaborative Paradigm-ExecutiveSummary. Office of Community Services, Fort Lewis College, September, 16 pp.
Gilliam, K. 1997. The United States Fish and Wildlife Service in the Florida Keys:Recommendations for Improving Community Relations, report to the Florida KeysRefuge System.
Goldberg, S., F. Sander, and N. Rogers. 1995. Dispute Resolution: Negotiation,Mediation, and Other Processes. Aspen Law and Business Series, Aspen Publishers,Inc.

Community Relations, Conflict Management, and Collaborative Partnerships 125
Kellert, S. 1979. Public attitudes toward critical wildlife and natural habitat issues. PhaseI report. Washington, D.C.: US Fish and Wildlife Service.
Llewellyn, L, W. Mangun, and J. Mangun. 1998. Human dimensions in USFWS decisionmaking, integrating human dimensions into management: Partnerships and progress. Reprinted from Transactions of the 63rd North American Wildlife and NaturalResources Conference, 227-238. Washington, D.C.: Wildlife Management Institute.
McCloskey, M. 1996. The limits of collaboration. Harper’s Magazine 32-36.Susskind, L., P. Levy, and J. Thomas-Larmer. 2000. Negotiating Environmental
Agreements: How to Avoid Escalating Confrontation, Needless Costs, andUnnecessary Litigation. Washington, D.C.: Island Press.
Susskind, L., S. McKearnan, and J. Thomas-Larmer, eds. 1999. The Consensus BuildingHandbook: A Comprehensive Guide to Reaching Agreement. Thousand Oaks: SagePublications.
US Fish and Wildlife Service. 1999. Fulfilling the Promise: The National WildlifeRefuge System, Visions for Wildlife, Habitat, People, and Leadership. Washington,D.C.: US Fish and Wildlife Service.
Williams, E., and P. V. Ellefson. 1997. Going into partnership to manage a landscape. Journal of Forestry (May):29-33.
Wondolleck, J., and S. Yaffee. 2000. Making Collaboration Work: Lessons fromInnovation in Natural Resource Management. Washington, D.C.: Island Press.

24Bengston, D. N. 2000. Environmental values related to fish and wildlife lands. In HumanDimensions of Natural Resource Management: Emerging Issues and Practical Applications, eds. Fulton, D.C., K. C. Nelson, D. H. Anderson, and D. W. Lime. St. Paul, MN: Cooperative Park Studies Program,University of Minnesota, Department of Forest Resources.
25Research Social Scientist, USDA Forest Service, North Central Research Station, 1992 FolwellAvenue, St. Paul, MN 55108-6148.
Environmental Values Related to Fish and Wildlife Lands24
David N. Bengston25
Introduction
Rapid change in the social, political, economic, and scientific environments in whichpublic land management takes place has characterized recent decades. Managingpublic lands in ways that are responsive to the changing social environment is one ofthe biggest challenges facing public land managers today. One of the most significantchanges in the social environment in which natural resource managers operate is theevolving values of the public and other stakeholders. Social scientists who studyvalues have found a slow but steady reorientation of environmental values in the U.S.in recent decades (e.g., Bengston et al. 1999; Deason 1996-97; Hays 1987; Kemptonet al. 1995; Ladd and Bowman 1995; Manning et al. 1999; Xu and Bengston 1997).Wildlands are increasingly valued as amenities to enhance quality of life besides beingvalued as a source for material commodities. Increasing tension between traditional(economic and commodity-related values) and emerging (recreational, aesthetic,moral/spiritual, and ecological values) values is apparent, and points to the need forplanning and decision making processes that are better able to negotiate andincorporate diverse values. Public land managers need to understand the nature ofenvironmental values better if they are to work collaboratively with diversestakeholder groups.
The purpose of this paper is to provide an overview of key concepts related toenvironmental values and their importance for public land managers. The followingsection defines environmental values and discusses their relationship to environmentalattitudes and beliefs. This is followed by presentation of a broad system for classifyingenvironmental values and understanding the distinct ways in which people valuenature. A final section discusses some recommendations for future research related toenvironmental values.

Environmental Values Related to Fish and Wildlife Lands 127
What are environmental values? How do values relate to attitudes and beliefs?
Values have been defined in many ways by social scientists in different disciplines,including economics, political science, anthropology, psychology, and sociology. Eachof these disciplines—and others as well—approach the topic from a somewhatdifferent perspective and each perspective sheds some light on the nature of humanvalues (Bengston 1994). From a practical standpoint, values can be defined simply asrelatively enduring concepts of what is good or desirable. Value in this sense issometimes referred to as an ideal or held value. Environmental values are enduringconcepts of what is good or desirable about the environment and natural resources. Individual values refer to values held by an individual, and social values are shared bygroups of people.
Values are a key part of a system of attitudes, beliefs, and values through which peopleview and interpret the world around them. Figure 1 illustrates the relationshipbetween attitudes, beliefs, and values for the case of wolves. An attitude is a learnedpredisposition toward some object as either favorable or unfavorable (Fishbein andAjzen 1975). For example, a person might have a favorable attitude toward wolves. Beliefs reflect what people think is true about an object, and they are one reason forhaving a particular attitude toward the object. For example, someone with a favorableattitude toward wolves may hold many supportive beliefs, such as the belief thatwolves have a right to exist without interference from people, or wolves are a symbolof our natural heritage (Fig. 1). Both attitudes and beliefs are subject to change basedon new information, persuasion, life experiences, and other learning processes. Valuesare the most deep-rooted and central elements in a person’s system of attitudes andbeliefs (or a group’s shared system of attitudes and beliefs). Like attitudes and beliefs,individual and social values change over time, but they tend to be more stable andresistant to change. As shown in Figure 1, someone with a favorable attitude towardwolves may hold a variety of values that help explain why wolves are good ordesirable.
Attitudes Favorable attitude toward wolves: “I love wolves”
Beliefs
Wolves playan important
role inecosystems
Wolveshave a right
to exist
Wolvessymbolize our
dwindlingnatural heritage
Wolves arebeautifulcreatures
Wolves areimportant for
tourism &ecotourism
Values Ecological Moral/spiritual Aesthetic Economic
Figure 1. A simple system of attitudes, beliefs and values about wolves.

128 Environmental Values Related to Fish and Wildlife Lands
Systems of environmental attitudes, beliefs, and values (such as the simplified oneillustrated in figure 1) tend to be robust structures that are resistant to change. Newbeliefs that are added—through formal or informal education, life experiences,etc.—will generally be consistent with the overall system. For example, a personholding the views showed in Figure 1 would be highly unlikely to adopt the belief thatwolves are vicious, evil creatures. These systems are also resistant to change becausewhen an existing belief is discarded, the overall system will likely still stand. Forexample, if a person with a favorable attitude toward wolves holds the belief thatwolves never attack people and that belief is shown to be inaccurate and is thereforemodified or abandoned, the person’s overall attitude toward wolves and theirunderlying environmental values related to wolves are unlikely to change.
The robustness of systems of environmental attitudes, beliefs, and values is importantbecause it helps show why merely “educating the public” about wildlife management isunlikely to produce the desired results. Changing people’s beliefs about a particularmanagement practice (e.g., trapping or hunting wildlife to achieve a managementobjective) does not deal with their overall attitude toward the management practice orwildlife in general, sets of other beliefs they may hold, and deeply held environmentalvalues. Rather than educating the public, listening to the public and other stakeholdergroups and working collaboratively with them is much more likely to be effective.
A system for classifying environmental values
Figure 2 presents a broad framework for understanding the ways in which peoplevalue the environment, including the values they hold for public lands. Twofundamentally different types of environmental values are distinguished in Figure 2: instrumental and non-instrumental. When we value the environment instrumentally,we are concerned about its usefulness as a means to some desirable human end. Theinstrumental values of nature arise from the fact that “… nature benefits us. Nature isuseful: it serves a purpose, satisfies a preference, or meets a need” (Sagoff 1991:32). In contrast, when we value the environment non-instrumentally, we care about it as anend in itself, rather than a means to an end. Most people value public lands bothinstrumentally for the benefits they receive from these lands and non-instrumentally, inways that go beyond their contribution to self-interested goals.
There are two broad categories of instrumental value related to the environment(Figure 2). Like instrumental value in general, the economic (or more broadly,utilitarian) value of the environment stems from its utility for achieving human ends,where the ultimate end or goal is maximizing the satisfaction of individual preferences. The economic conception of the value of nature focuses on the usefulness of theenvironment as expressed in individual preferences or an aggregation of individualpreferences.

Environmental Values Related to Fish and Wildlife Lands 129
Economic/Utilitarian:
- Preferencesatisfaction
Life Support/Ecological:- Maintain
eco-services
InstrumentalValue:
- Usefulness- Means to an End
Aesthetic:- Beauty
Moral /Spiritual:
- Love, affection,reverence, respect
Non-instrumentalValue
- A good of its own- An end in itself
Environmental Value:A Conception of "The Good"
Figure 2. A classification system for environmental values.
Life support value is another broad concept of what is instrumentally good about theenvironment. For people who hold this value, life-supporting environmental functionsand services are good because human well being depends on them. Unlike economicvalue, life support value is not adequately measured by adding up people’s preferencesor willingness to pay for environmental functions and services. Many people areunaware of the life-supporting benefits that ecosystems provide, so aggregatingpreferences or willingness to pay for life-supporting environmental services does notproduce a meaningful measure of their importance. The benefits exist whether or notpeople are aware of them.
Figure 2 also shows two broad types of non-instrumental value. Aesthetic value is atype of non-instrumental value in which beauty is the concept of what is good. Sagoff(1991) notes that nature may be valued as an object of knowledge and perception, hisdefinition of aesthetic value. Aesthetic value has historically had and continues to haveprofound impacts on public land policy and management: “One of the main reasonsthat we have set aside certain natural areas as national, state, and county parks isbecause they are considered beautiful” (Callicott 1992:12).
Finally, moral/spiritual value is also a type of non-instrumental value. People value anobject morally when they regard it with love, affection, reverence, and respect (Sagoff1991). This is what Aldo Leopold (1966:261) had in mind when he wrote: “It isinconceivable to me that an ethical relation to land can exist without love, respect, andadmiration for land, and a high regard for its value. By value, I of course meansomething far broader than mere economic value.” Spiritual value is a type of moralvalue, as is attachment orientation to nature, sense of place, and heritage value (Xuand Bengston 1997).

130 Environmental Values Related to Fish and Wildlife Lands
Each of these four broad types of environmental value represents a distinct concept ofwhat is good about the environment or motivation for caring about nature. It isimportant to keep in mind, however, that public lands are always valued in multipleways simultaneously: A national forest may be valued economically for timberharvested and morally for sacred Native American sites it contains; a wildlife preservemay be valued aesthetically for its natural beauty and for the environmental servicesprovided by its wetlands.
The simple classification of environmental values shown in Figure 2 could be expandedto include much more detail and specific types of value that fall under the four maincategories. But the important point for natural resource managers is that most peoplevalue the environment and public lands both instrumentally and non-instrumentally. Inthe past, resource managers have sometimes emphasized the instrumentalvalues—especially economic/utilitarian values—to the neglect of non-instrumentalvalues. But the deeper, non-instrumental values help explain why many people care sopassionately about environmental issues and therefore why the intensity of conflictover resource management is often high. People are much more passionate aboutplaces of the heart than places valued only for instrumental reasons.
Future research recommendations
This final section discusses some recommendations for future research related toenvironmental values relevant to public land managers. First is the need for researchthat is place-specific. Much of the research on environmental values is general and notfocused on a particular area. This can help natural resource managers understand thebroad social context in which management takes place. But people’s environmentalvalues and concerns often vary from location to location. Specific information aboutthe values people hold for particular public lands would be most useful to managers. Research is needed to shed light on the values held by communities of place andcommunities of interest for particular public lands. Creative and cost-effective ways togather this information are needed.
Another need for future research is on differences in environmental values, preferencesfor recreation activities, acceptability of management actions, etc. among differentethnic and minority communities. The communities served by public natural resourcemanagement agencies are becoming more racially and ethnically diverse. A number ofstudies have shown that members of racial and ethnic groups may hold environmentalattitudes and values, have greater concern for certain environmental problems, andhave participation rates in wildland recreation and environmental activism that differ invarious ways from those of European-Americans (see Bengston 2000 and studies citedtherein). Responding to an increasingly diverse society in ways that ensure the viewsof all citizens are included in resource management and policy is an importantchallenge for natural resource management agencies.

Environmental Values Related to Fish and Wildlife Lands 131
Third, many communities near public lands have experienced an influx of urbanmigrants in recent decades, including seasonal homeowners, retirees, tele-commuters,and others. This trend is likely to continue in the coming decades. Urban migrantstypically have different value priorities and different orientations toward nature thanlong-time rural residents (Shannon 1988). The urban migrants often have less directcontact with nature than long-time residents, and they are often eager to be involved inplanning and decision-making on public lands. Research is needed to understandbetter the value differences between long-time residents and new residents—especiallyin communities that have experienced significant change in this respect—in order tominimize conflict, facilitate communication between these groups, and build bridges ofunderstanding.
Finally, research on collaborative planning and decision-making processes is needed. Collaborative approaches to planning and management are a key to getting diversevalues on the table and working them out. It is through discourse and deliberation thatpeople discover and express social values, which can then be incorporated intomanagement. It is important to create collaborative processes that encourage peopleto express freely the deeper, non-instrumental values and strike a balance betweenscientific information and these values. “Science is, of course, a very important andnecessary part of resource management. But when we emphasize a scientific andobjective attitude to the exclusion of all else, we create an environment in which it isdifficult for people to speak about intuitive and emotional experiences, and in which itis difficult for us to hear or understand them when they do” (Schroeder 1996:16-17).
Literature cited
Bengston, D. N. 1994. Changing forest values and ecosystem management. Societyand Natural Resources 7:515-533.
Bengston, D. N. 2000. Environmental attitudes and values among ethnic andminority communities: An exploratory analysis of the Ethnic NewsWatchdatabase. Paper presented at the 8th International Symposium on Society &Resource Management, Bellingham, WA, June 17-22, 2000. (Copies availablefrom the author: E-mail: [email protected]; Telephone: 651-649-5162).
Bengston, D. N., D. P Fan, and D. N. Celarier. 1999. A new approach to monitoringthe social environment for natural resource management and policy: The case ofUS national forest benefits and values. Journal of Environmental Management56:181-193.
Callicott, J. B. 1992. The land aesthetic. Renewable Resources Journal 10(4):12-17.Deason, J. P. 1996-97. Changing world attitudes on environmental values and
sustainability: Implications for educational institutions. Renewable ResourcesJournal 14:6-11.
Fishbein, M., and I. Ajzen. 1975. Belief, Attitude, Intention and Behavior: AnIntroduction to Theory and Research. Reading, MA: Addison-Wesley.

132 Environmental Values Related to Fish and Wildlife Lands
Hays, S. P. 1987. Beauty, Health, and Permanence: Environmental Politics in theUnited States, 1955-1985. New York: Cambridge University Press. 630 p.
Kempton, W., J. S. Boster, and J. A. Hartley. 1995. Environmental Values inAmerican Culture. Cambridge, MA: The MIT Press. 320 p.
Ladd, E. C., and K. H. Bowman. 1995. Attitudes Toward the Environment: Twenty-five Years after Earth Day. Washington, DC: AEI Press. 55 p.
Leopold, A. 1966. A Sand County Almanac. New York: Ballantine Books.Manning, R., W. Valliere, and B. Minteer. 1999. Values, ethics, and attitudes toward
national forest management: An empirical study. Society and Natural Resources12:421-436.
Sagoff, M. 1991. Zuckerman’s dilemma: A plea for environmental ethics. HastingsCenter Report 21(5):32-40.
Schroeder, H. W. 1996. Ecology of the heart: Understanding how people experiencenatural environments. In Natural Resource Management: The HumanDimension., ed., Ewert, A. W., 13-27. Boulder, CO: Westview Press. 263 p.
Shannon, M. A. 1988. Changing people, changing values, changing forests. InHealthy Forests, Healthy World, 337-341. Proceedings of the 1988 Society ofAmerican Foresters national Convention, Rochester, NY, 16-19 Oct. 1988. Bethesda, MD: Society of American Foresters.
Xu, Z., and D. N. Bengston. 1997. Trends in national forest values among forestryprofessionals, environmentalists, and the news media. Society and NaturalResources 10:43-59.
26Allen, S. D. 2000. Social impact assessment: How we assess the effects of our actions on visitors,neighbors, and other stakeholders. In Human Dimensions of Natural Resource Management: EmergingIssues and Practical Applications, eds. Fulton, D. C., K. C. Nelson, D. H. Anderson, and D. W. Lime. St.Paul, MN: Cooperative Park Studies Program, University of Minnesota, Department of Forest Resources.
27Social Scientist, US Fish and Wildlife Service Refuges, 1011 E. Tudor, Anchorage, AK 99503.
Social Impact Assessment: How We Assess the Effects of Our Actions on Visitors, Neighbors, and Other Stakeholders26
Stewart D. Allen27
Introduction
Across the country, the Fish and Wildlife Service is writing or revising comprehensiveconservation plans that guide management of the National Wildlife Refuges. Typically, these plans are presented to the public as environmental impactstatements—most of which pay short shrift to the human environment and howpeople, their values, and their institutions will be affected by the new refuge plans. Yet many yardsticks are available to measure the effects of our actions on the humandimensions of ecosystems. The yardsticks we choose or choose to ignore convey tosociety our understanding of human systems and our values associated with them.
This paper focuses on social impact assessment. There is a wealth of literature on thetopic (for example, Finsterbusch et al. 1983; Freudenberg 1986), and a wealth ofmodels—both good and bad—that demonstrate the range of possible approaches. This paper reviews some key guidelines and principles emerging from the social impactassessment literature, including what types of effects to consider measuring, whatpopulations merit special attention, how to apply information on visitor attitudes andexperiences (and other available data) to the impact assessment, techniques forincorporating expert opinions, panels, or roundtables into the assessment, and how toaddress issues such as environmental justice.
Definitions of social impact assessment
It is important to begin with a review of the diverse ways practitioners have definedsocial impact assessment. Perhaps the most relevant conclusion is that social impactassessment is an ongoing, iterative process—not just a chapter in a document. Another key point is that we must be prepared not just to quantify changes that mayoccur, but to discuss the meaning of those changes to people, communities, and

134 Social Impact Assessment
institutions, and how change may be interpreted differently based on people’s valuesand orientations.
< Social impact assessments estimate how proposed actions and their alternativeswill affect the quality of people’s lives (Bryan and Hendee n.d.).
< The main purpose of . . . social analysis in resource management is to answer thequestion “Who is affected by an agency action, and how are they affected?”(Richardson 1993).
< Efforts to assess or estimate, in advance, the social consequences that are likely tofollow from specific policy actions . . . and specific government actions . . .particularly in the context of the National Environmental Policy Act . . . By socialimpacts we mean the consequences to human populations . . . that alter the ways inwhich people live, work, play, relate to one another, organize to meet their needsand generally cope as members of society (Interorganizational Committee onGuidelines and Principles 1993).
< SIA is a systematic effort to identify, analyze and evaluate social impacts of aproposed project or policy change on the individuals and social groups within acommunity or on an entire community in advance of the decision making processin order that the information derived from the SIA can actually influence decisions(Burdge and Robertson 1990).
< Social impact management is a people-centered, ongoing decision-making processdesigned to identify, evaluate, respond to, and monitor the public issues arisingfrom industry and government activities (Preister and Kent 1981).
< An impact that disrupts or interferes with the usual patterns of interactions andmeanings attributed to individual and group activity (Impact Assessment, Inc.1990).
Principles of social impact assessment
When assessing the effects of management actions on human components of theecosystem, it is wise to keep several key principles in mind (InterorganizationalCommittee on Guidelines and Principles 1993). Following these principles leads toscientific, defensible, reasonable estimates of the social consequences of our publicland management actions.

Social Impact Assessment 135
Involve the diverse public
People’s perceptions of impacts can be easily incorporated into impact assessments. Some projects have used special panels to help gauge effects (Burchfield et al. 1997),while others have simply relied on the public involvement process as a source ofinformation. An even better approach is to involve affected publics in the impactassessment process (Burdge 1995).
Analyze impact equity
Nearly any project or plan will produce winners and losers because people andstakeholder groups are affected differentially. Identify how different groups will beaffected, and how they likely will cope with the changes. Environmental justice shouldbe addressed: “Each federal agency shall make achieving environmental justice part ofits mission by identifying and addressing, as appropriate, disproportionately high andadverse human health or environmental effects of its programs, policies, and activitieson minority populations and low income populations . . . “ (Executive Order12898;1994, amended 1995).
Focus the assessment
Identify the most significant social effects and focus on those. Just as biologists useindicators to assess and measure change, so can social scientists.
Identify methods and assumptions and define significancein advance
Methods can range from analysis of similar projects to expert opinion to collection ofprimary data regarding the effects. Often, assumptions will need to be coordinatedwith analyses on effects on other resource areas. For example, we need biologists’estimates of impacts to wildlife populations before we can assess effects on humans’use of those animals (Allen 1985a).
Provide feedback on social impacts to planners
This allows mitigation to be incorporated into management alternatives, or allows thealternatives to be modified in response to anticipated social effects.

136 Social Impact Assessment
Use SIA practitioners
If you do not hire one, your appellants will! This may seem obvious, but how manyrefuges or regional offices have a social scientist with extensive experience in socialimpact assessment available? At least have the preliminary assessment peer-reviewed.
Establish monitoring and mitigation programs
Impact assessments, after all, are only our best guesses about future events; we areoften incorrect, especially when people are involved. People can adapt, resist, deny,and deal with change through a variety of social and psychological mechanisms.
Identify data sources
Again, this may seem obvious, but nonsocial scientists may not know where to begin. Published literature, secondary sources (such as that available from the census, state,county, or community), and primary data (such as survey research, interviews, orfocus groups) should all be considered.
Plan for gaps in data
We seldom have the luxury of collecting primary data on social conditions and likelyeffects on those conditions. It is okay to say desirable data are not available. In suchcases, we must often make assumptions. That is fine, but they should be reasonableand explicit. If an effect cannot be quantified, it is still worth discussing in the bestterms you can use.
Dependent variables in social impact assessment
Who and what will be affected by our actions, and how? Another way to think of this: what are the key dependent variables in a social impact assessment? We need to knowthe range of possibilities before selecting the appropriate variables for each analysis.
Following are a number of lists of variables that social impact assessment practitionershave included in their analyses. They are provided to cue readers into the diverserange of types of social effects measured. Not all will apply to every project; one mustpick and choose among them (and others) based on the type of plan or project and thenature of the effects. Be aware that community (i.e., town or village) has become akey unit of analysis for many impact assessments (Pivo 1992).

Social Impact Assessment 137
Variables derived from a review of the literature (Interorganizational Committee1993):
< Population characteristics< Community and institutional structures< Political and social resources< Individual and family changes< Community resources
Variables used to explore the socioeconomic effects of implementing ecosystemmanagement on national forest lands (Jakes and Harms 1995):
< Impacts on the economy< Impacts on recreation and aesthetics< Social and cultural impacts< Impacts on forest product outputs< Impacts on management
Variables communities can use to assess change (Burdge 1995):
< Population impacts< Community and institutional arrangements< Conflicts between local residents and newcomers< Individual and family level impacts< Community infrastructure needs
Variables used to identify economic, social, and psychological impacts associated withthe Exxon Valdez oil spill (Impact Assessment, Inc. 1990):
< Fundamental disruptions of usual ways of living, including the experience ofpersonal health and well being
< Experience of the loss of personal and community control< Displacement of usual and expected actions, plans, and resources for
responding to the demands of the “proposed action”(Each of the above was discussed at the community, interpersonal, and
individual scales)
Variables used to identify broad-scale changes associated with adoption of anecosystem approach to managing public lands in the Interior Columbia River basin(Burchfield et al. 1997):
< Effects on predictability< Effects on access to decision making

138 Social Impact Assessment
< Effects on private lands< Effects on communities and quality of life< Effects on American Indian tribes
Techniques for measuring the effects of our actions on thechosen dependent variables
Many methods have been used to measure the magnitude and significance of socialimpacts. Typically, this will depend on the information available on the humancomponents of the ecosystem, and how those data were collected.
Measuring the amount of change is not the same as measuring the social impact; wemust also consider the meaning of that type and degree of change to different affectedpopulations. For example, we may start an analysis of effects on recreational use byusing a recreation opportunity spectrum framework to measure the types ofopportunities present currently and the types that would be available under variousplanning alternatives (Allen 1981). The outcome of this analysis may suggest that onealternative would increase the amount of land available for primitive opportunities anddecrease the amount available for roaded natural opportunities is certainly useful; thatis a quantifiable environmental impact. We could continue by projecting the visitordays expected.
The true social scientist (and decision maker), however, is interested in knowing themeaning of that change. Is it significant? To answer this, we can draw on regionalanalyses of available opportunities, regional analyses of projected demand for variousopportunities, statements made by individuals and organizations affected by thechange; analyses of effects from past plans, and surveys of recreational visitors thatasked how people feel about the affected area and others in the region. These types ofanalyses give meaning to the change. An important related consideration is how willpeople and institutions respond to the change? Recognize that these responses maywell have impacts of their own!
It should be clear that we need information not just on project setting and how it willchange, but on the social context and definition of that setting. For instance, if we areproposing to prohibit certain types of recreational activities, the social impactassessment needs to consider other opportunities in the project area or region wherethose activities and experiences are available, and the extent to which those settingsand the experiences they provide are substitutable (Allen 1982). Without this socialcontext, interpreting the significance of the impact is difficult. For instance, peoplecan become very attached to places; their reactions to change likely will differ frompeople only casually familiar with the same place, because there are no substitutes forthat emotional attachment and sense of place.

Social Impact Assessment 139
Another technique for measuring effects is to use panels of experts who are presentedwith information about the project and the alternatives, and are asked to estimate thetype and direction of effects on various affected populations and entities. They may beasked to develop the list of types of impacts and affected populations, or may bepresented with them; their charge can be narrow or broad. This can be useful, as longas the experts are the right ones (consider including people possessing localknowledge on the panel), the analysis is at the appropriate scale, and the results will beunderstandable. The technique can be useful when other resource areas also are usingpanels to help with the impact assessment.
Another strategy to consider is estimating the losses in economic value of nonmarketresources that would be affected, such as recreation settings, instream flows, orwildlands (Allen 1998, Allen 1985b). Although controversial, well-establishedprocedures exist for developing such estimates (Brown et al. 1994). Even if theprecise numbers developed are questionable, they can anchor the magnitude of aneffect using a unit of measure we all understand—the dollar.
Conclusion
Ultimately, the level and type of effort we expend on social impact assessment dependson many factors, including:
< the standard (institutional norm) regarding social impact assessment for this typeof project or plan;
< the scope of the proposed action and the degree of change that would result;
< the level and type of effort planned for the impact assessment as a whole;
< the public and decision maker interest in social effects compared to other effectsand what type of effects are most controversial or important to measure;
< the willingness of decision maker to incorporate social mitigation measures into thefinal plan;
< the internal and external market demand for science-based impact assessment;
< available information on the social affected environment;
< the funding and time available for primary and secondary research; and
< the availability of qualified social scientists to conduct the assessment.

140 Social Impact Assessment
Yet, even if the answer to these questions points in the direction of a minimum effortat social impact assessment, a credible job can be done by adhering to the basicprinciples, following established procedures, and making the social portion an integralcomponent of the overall assessment effort. Today’s publics are sophisticatedreviewers of plans (or can hire consultants who are); we should expect increasinglyintensive review of our social impact assessments, and do the best we can with theresources available. The result will be better plans, better management, and greaterpublic understanding of how what we do affects people, communities, and society.
Literature cited
Allen, S. D. 1998. Economic values of wild settings in the policy arena: The good,the bad, and the ugly. Invited presentation at Alaska Wilderness Recreation andTravel Association Annual Conference on Ecotourism, Anchorage, AK, Feb. 5.
Allen, S. D. 1985a. Predicting the impacts of a high-voltage transmission line on biggame hunting opportunities in western Montana. In Proceedings, Symposium onRecreation Choice Behavior, eds., G. H. Stankey and S. F. McCool. USDAForest Service General Technical Report INT-184. Ogden, UT: IntermountainResearch Station.
Allen, S. D. 1985b. Estimating the economic value of river recreation resources: Alegal and policy perspective. Paper presented at First North American RiparianConference, Tucson, AZ, April 17.
Allen, S. D. 1982. The impacts of resource development on recreation: A case study.In Proceedings, Intermountain Leisure Symposium. Brigham Young University,Provo, UT.
Allen, S. D. 1981. A model for recreation impact assessment. Paper presented atNational Recreation and Park Association Leisure Research Symposium,Minneapolis, MN, October.
Brown, T., J. Duffield, and S. D. Allen. 1994. Economic value of instream flow. Research Paper RM-317. Fort Collins, CO: USDA Forest Service RockyMountain Forest and Range Experiment Station.
Bryan, H., and J. C. Hendee. n.d. Social impact assessment in the United StatesForest Service and other resource management agencies. Paper for theInternational Union of Forest Research Organizations World Forestry Congress,Kyoto, Japan.
Burchfield, J., S. F. McCool, and S. D. Allen. 1997. An estimate of the socialconsequences of alternatives in the Eastside and Upper Columbia River Basinpreliminary draft environmental impact statements. In Evaluation of alternativesfor ecosystem management in the interior Columbia Basin, tech.eds., Quigley, T.,K. Lee, and S. Arbelbide. General Technical Report. Portland, OR: USDA ForestService, Pacific Northwest Research Station; USDI Bureau of Land Management.

Social Impact Assessment 141
Burdge, R. J. 1995. A community guide to social impact assessment. Middleton,WI: Social Ecology Press.
Burdge, R. J., and R. A. Robertson. 1990. Social impact assessment and the publicinvolvement process. Environmental Impact Assessment Review 10:81-90.
Finsterbusch, K., L. G. Llewellyn, and C. P. Wolf, eds. 1983. Social impactassessment methods. Beverly Hills, CA: Sage Pub. Co.
Freudenberg, W. R. 1986. Social impact assessment. Annual Review of Sociology12:451-478.
Impact Assessment, Inc. 1990. Economic, social, and psychological impactassessment of the Exxon Valdez oil spill. Report prepared for the Oiled MayorsSubcommittee, Alaska Conference of Mayors, by Impact Assessment, Inc., 911West 8th Avenue, Anchorage, AK 99501.
Interorganizational Committee on Guidelines and Principles. 1993. Guidelines andprinciples for social impact assessment. Belhaven, NC: International Associationfor Impact Assessment.
Jakes, P., and J. Harms. 1995. Report on the socioeconomic roundtable convened bythe Chequamegon and Nicolet National Forests. General Technical Report NC-177. St Paul, MN: USDA Forest Service North Central Forest ExperimentStation.
Pivo, G. 1992. How do you define community character: Adapting theenvironmental impact statement process to Snoqualmie, Washington. Small Town(November-December):4-17.
Preister, K., and J. Kent. 1981. The issue-centered approach to social impacts: fromassessment to management. Social Impact Assessment (November-December).
Richardson, C. W. 1993. An analysis of the socioeconomic effects of Bureau of LandManagement resource management plans in western Oregon. Report prepared forBLM Oregon State Office, Portland, OR, by Institute for Resources in Society,College of Forest Resources, University of Washington, Seattle.
U.S. Executive Office. 1994. Federal Actions to Address Environmental Justice inMinority Populations and Low Income Populations. Executive Order 12898(amended 1995). Washington, D.C.: U.S. Government Printing Office.

142 Social Impact Assessment

143
Workshop Participants

144

Workshop Participants
Stewart AllenUS Fish and Wildlife Service Refuges1011 E. TudorAnchorage, AK 99503phone: (907) [email protected]
David E. AndersenLeaderUSGS, Biological Resources DivisionMN Cooperative Fish & Wildlife Research UnitDepartment of Fisheries & WildlifeUniversity of Minnesota200 Hodson Hall 1980 Folwell Ave.St. Paul, MN 55108phone: 612-626-1222fax: 612-625-5299 [email protected]
Dorothy AndersonProfessor and LeaderCooperative Park Studies ProgramDepartment of Forest Resources University of Minnesota115 Green Hall 1530 Cleveland Ave NSt. Paul, MN 55108phone: 612-624-7271fax: [email protected]
Pat ArndtPlanning & MIS ManagerMN Department of Natural ResourcesDivision of Parks and Recreation500 Lafayette RoadSt. Paul, MN 55155phone: [email protected]
Ron BellRefuge ManagerSquaw Creek National Wildlife RefugeHwy 159 SouthMound City, MO 64470phone: [email protected]
David BengstonUSDA Forest ServiceNorth Central Research Station1992 Folwell AvSt. Paul, MN 55108-6148phone: 651-649-5162 fax: [email protected]
Charles R. BerryLeaderSD Cooperative Fish & Wildlife Research UnitDepartment of Wildlife & Fisheries SciencesSouth Dakota State UniversityBox 2140 B Room 138 BioStress LabBrookings, SD 57007-1696phone: 605-688-6121 fax: 605-688-4515 [email protected]
Charlie BlairRefuge ManagerSherburne National Wildlife Refuge17076 293rd AvenueZimmerman, MN 55398phone: [email protected]
John BlankenshipGeographic Area II Assistant Regional DirectorU.S. Fish & Wildlife ServiceBishop Henry Whipple Federal Building1 Federal DriveFort Snelling, MN 55111phone: [email protected]

146 Workshop Participants and Presenters
Tim Bodeen Park RangerNeal Smith National Wildlife Refuge9981 Pacific StreetPrairie City, IA [email protected]
Alan D. BrightAssociate ProfessorDepartment of Natural Resource Recreation and Tourism241 Forestry BuildingColorado State UniversityFort Collins, CO 80521-1480phone: (970) [email protected]
John ChristianGeographic Area I Assistant Regional DirectorU.S. Fish & Wildlife ServiceBishop Henry Whipple Federal Building1 Federal DriveFort Snelling, MN 55111phone: [email protected]
Steve CinnamonChief, Natural Resources ManagementNPS Midwest Region1709 Jackson St.Omaha, NE 68102phone: [email protected]
Ron Cole Refuge ManagerBig Stone National Wildlife RefugeRR 1, Box 25Odessa, MN [email protected]
Lucinda CorcoranFish & Wildlife BiologistU.S. Fish & Wildlife ServiceBishop Henry Whipple Federal Building1 Federal DriveFort Snelling, MN 55111phone: [email protected]
John DavisChair, Division of Science and Technology andEnvironmental Studies Program CoordinatorSouthern Vermont CollegeBennington, VT 05201phone: (802) 447-6365 [email protected]
Ed DeVries Refuge Operations SpecialistShiawassee National Wildlife Refuge6975 Mower RoadSaginaw, MI [email protected]
Susan DreibandARD External AffairsU.S. Fish & Wildlife ServiceBishop Henry Whipple Federal Building1 Federal DriveFort Snelling, MN 55111phone: [email protected]
Jan EldridgeWildlife BiologistU.S. Fish & Wildlife ServiceBishop Henry Whipple Federal Building1 Federal DriveFort Snelling, MN 55111phone: [email protected]

Workshop Participants and Presenters 147
Cornelia Butler Flora Professor of SociologyDirector, North Central Regional Center for Rural Development107 Curtiss HallIowa State UniversityAmes, IA 50011-1050phone: 515-294-1329fax: [email protected]
Rick FrietscheRefuge ManagerTrempealeau National Wildlife RefugeW82488 Refuge RoadTrempealeau, WI 54661phone: [email protected]
Nita Fuller Program Assistant Regional DirectorRefuges & WildlifeU.S. Fish & Wildlife ServiceBishop Henry Whipple Federal Building1 Federal DriveFort Snelling, MN 55111phone: [email protected]
David C. FultonAssistant Professor and Assistant Leader,
WildlifeUSGS Biological Resources DivisionMN Cooperative Fish & Wildlife Research UnitDepartment of Fisheries and WildlifeUniversity of Minnesota200 Hodson Hall 1980 Folwell AvenueSt. Paul, MN 55108phone: 612-625-5256fax:[email protected]
Nancy GilbertsonRefuge ManagerNeal Smith National Wildlife Refuge9981 Pacific StreetPrairie City, IA [email protected]
Jeff GosseFishery BiologistU.S. Fish & Wildlife Service Bishop Henry Whipple Federal Building1 Federal DriveFort Snelling, MN 55111phone: [email protected]
Joan GuilfoyleU.S. Fish & Wildlife ServiceBishop Henry Whipple Federal Building1 Federal DriveFort Snelling, MN 55111phone: [email protected]
Alice HagenCartographerApplied Population Laboratory350 Agricultural HallUniversity of WisconsinMadison, WI 53706
Roger HammerApplied Population Laboratory350 Agricultural HallUniversity of WisconsinMadison, WI 53706(608) [email protected]
William Hartwig Regional DirectorUSFWS, Region 3Henry Whipple Federal Building1 Federal DriveFort Snelling, MN 55111-4056phone: (612) 725-3563 [email protected]

148 Workshop Participants and Presenters
Nancy HaugenPark RangerSherburne National Wildlife Refuge17076 293rd AvenueZimmerman, MN 55398phone: [email protected]
Dave Hendrix Hatchery ManagerNeosho National Fish HatcheryEast Park StreetNeosho, MO 64850phone: [email protected]
Jeanne HollerWildlife BiologistSherburne National Wildlife Refuge17076 293rd AvenueZimmerman, MN 55398phone: [email protected]
Bradley Johnson Assistant Regional Director, Federal AidU.S. Fish & Wildlife ServiceBishop Henry Whipple Federal Building1 Federal DriveFort Snelling, MN 55111phone: [email protected]
Liz JonesRefuge ManagerCypress Creek National Wildlife Refuge0137 Rustic Campus DriveUllin, IL 62992phone: [email protected]
Rick JulianDistrict ManagerDetroit Lakes Wetl& Management District26624 N. Tower RoadDetroit Lakes, MN 56501-7959phone: [email protected]
Ron KirbyDirectorNorthern Prairie Wildlife Research Center8711 37th St SEJamestown, ND 58401-7317phone (701) 253-5515fax (701) [email protected]
Erwin KlaasLeader Iowa Cooperative Fish & Wildlife Research Unit11 Science Hall IIAnimal Ecology DepartmentIowa State UniversityAmes, IA 50011-3221phone: 515-294-3056 fax: 515-294-5468 [email protected]
Tracy KuczenskiAttorneyMichael Best and FriedrichMadison, WI 53706
James KurthChief, Division of RefugesUSFWS4401 N. Fairfax DriveArlington, VA 22203Phone: [email protected]
Workshop Participants and Presenters 149
Tom Larson Ascertainment ChiefU.S. Fish & Wildlife ServiceBishop Henry Whipple Federal Building1 Federal DriveFort Snelling, MN 55111phone: [email protected]
Jim LeachChief, North American Waterfowl ManagementU.S. Fish and Wildlife Service, Region 3Henry Whipple Federal Building1 Federal DriveFort Snelling, MN 55111-4056phone: [email protected]
Michelle LeBeau SCEP Student Marquette Biological Station1924 Industrial ParkwayMarquette, MI 49855-1699
Darrell E. LewisChief, Natural Resources Management Branch US Army Corps of EngineersHQUSACECECW-ONWashington DC 20314-1000phone [email protected]
David W. Lime Senior Research Associate Cooperative Park Studies ProgramDepartment of Forest Resources University of Minnesota115 Green Hall 1530 Cleveland Avenue NorthSt. Paul, MN 55108phone: 612-624-2250fax: [email protected]
Brian Lubinski
FRO Team LeaderU.S. Fish & Wildlife ServiceBishop Henry Whipple Federal Building1 Federal DriveFort Snelling, MN 55111phone: [email protected]
Tom MagnusonFish & Wildlife BiologistU.S. Fish & Wildlife ServiceBishop Henry Whipple Federal Building1 Federal DriveFort Snelling, MN 55111phone: [email protected]
Robert E. ManningProfessorSchool of Natural ResourcesRecreation Management ProgramGeorge D Aiken Center for Natural ResourcesBurlington, VT 05405-0088voice: 802-656-2684fax: [email protected]
Richard Marks Assistant Regional Director, Law EnforcementU.S. Fish & Wildlife ServiceBishop Henry Whipple Federal Building1 Federal DriveFort Snelling, MN 55111phone: [email protected]
Judy McClendonWildlife BiologistSouthern Missouri Ascertainment Office24385 State Highway 51Puxico, MO 63960phone: [email protected]

150 Workshop Participants and Presenters
Sue McDonald Park RangerMN Valley National Wildlife Refuge3815 E. 80th StreetBloomington, MN [email protected]
Julie MorinOutreach SpecialistU.S. Fish & Wildlife ServiceBishop Henry Whipple Federal Building1 Federal DriveFort Snelling, MN 55111phone: [email protected]
Gary Muehlenardt Wildlife BiologistU.S. Fish & Wildlife ServiceBishop Henry Whipple Federal Building1 Federal Drive Fort Snelling, MN 55111phone: [email protected]
Katherine MullettFishery BiologistMarquette Biological Station1924 Industrial ParkwayMarquette, MI 49855-1699phone: [email protected]
Kristen NelsonAssistant Professor Department of Forest Resources University of Minnesota115 Green Hall 1530 Cleveland Avenue NorthSt. Paul, MN 55108phone: 612-624-1277fax: [email protected]
Rick Nelson Project LeaderLa Crosse Fish Health Center555 Lester Ave.Onalaska, WI 54650phone: [email protected]
Grant PetersenSuperintendentPictured Rocks National LakeshorePO Box 40 S & Point RoadMunising, MI 49862-0040phone: [email protected]
Dan PetitWildlife BiologistU.S. Fish & Wildlife ServiceArlington Square, Room 6344401 N. Fairfax DriveArlington, VA [email protected]
Lee PfannmullerMN Department of Natural Resources500 Lafayette RoadSt. Paul, MN 55155phone: [email protected]
Noel PoeSuperintendentTheodore Roosevelt National ParkPO Box 7315 2nd AveMedora, ND 58645-0007phone: 701 623-4466fax: 701 [email protected]

Workshop Participants and Presenters 151
Phadrea PondsMidcontinent Ecological Science Center4512 McMurry Ave.Ft Collins, CO 80525phone: 970-226-9445fax: [email protected]
Christine RibicActing LeaderWisconsin Cooperative Wildlife Research UnitDepartment of Wildlife EcologyUniversity of WisconsinRoom 204 Russell Laboratories1630 Linden DriveMadison, WI 53706-1598phone: 608-263-4519 fax: 608-263-4519 [email protected]
Joe RoggenbuckProfessorVirginia Polytechnic Institute and State UniversityDepartment of ForestryCheatham HallBlacksburg, VA 24061-0324phone: [email protected]
Fabian RomeroFish & Wildlife BiologistU.S. Fish & Wildlife ServiceBishop Henry Whipple Federal Building1 Federal DriveFort Snelling, MN 55111phone: [email protected]
Jim SalyerU.S. Fish & Wildlife ServiceBishop Henry Whipple Federal Building1 Federal DriveFort Snelling, MN [email protected]
Bill SchenkRegional DirectorNPS Midwest Region1709 Jackson StreetOmaha, NE 68102Phone: [email protected]
John SchomakerU.S. Fish & Wildlife ServiceBishop Henry Whipple Federal Building1 Federal DriveFort Snelling, MN 55111phone: [email protected]
Rick SchuldtU.S. Fish & Wildlife ServiceBishop Henry Whipple Federal Building1 Federal DriveFort Snelling, MN 55111phone: [email protected]
Mary Stefanski Refuge Operations Specialist La Crosse District, Upper Mississippi Refuge555 Lester Ave.Onalaska, WI 54650phone: [email protected]
Barry StieglitzChief, Branch of Planning and PolicyNational Wildlife Refuge SystemWashington, [email protected]
Jill Torres Park RangerMN Valley National Wildlife Refuge3815 E. 80th StreetBloomington, MN [email protected]

Michael Vanderford Fish & Wildlife BiologistU.S. Fish & Wildlife ServiceBishop Henry Whipple Federal Building1 Federal DriveFort Snelling, MN 55111phone: [email protected]
Bruce VondracekAssistant Leader, FisheriesUSGS, Biological Resources DivisionMN Cooperative Fish & Wildlife Research UnitDepartment of Fisheries & WildlifeUniversity of Minnesota200 Hodson Hall 1980 Folwell Av St. Paul, MN 55108phone: 612-624-8748 fax: 612-625-5299 [email protected]
Paul VossDepartment of Rural Sociology and Applied Population Laboratory350 Agricultural HallUniversity of WisconsinMadison, WI 53706
Theresa WangAssistant ProfessorDivision of ForestryP.O. Box 6125West Virginia UniversityMorgantown, WV 26506phone: 304-293-2941, ext. 2416fax: 304-293-2441e-mail: [email protected]
Pat WestSchool of Natural Resources and EnvironmentUniversity of MichiganDana BuildingAnn Arbor, Michigan 48109phone: 734-764-7206 or 734-763-2200
Stephen WildsChief, Division of Migratory BirdsU.S. Fish & Wildlife ServiceBishop Henry Whipple Federal Building1 Federal DriveFort Snelling, MN 55111phone: [email protected]
Ken WilliamsChiefUSGS, BRDCooperative Research Units Program12201 Sunrise Valley Drive, MS303Reston, VA 20192703-648-4260 phone703-648-4269 [email protected]
P. Jack WingateFisheries Research ManagerMN Department of Natural Resources500 Lafayette Road, Box 12St. Paul, MN 55155-4012phone: 651-296-0793 fax: [email protected]
Charles WooleyProgram Assistant Regional DirectorEcological ServiceU.S. Fish & Wildlife ServiceBishop Henry Whipple Federal Building1 Federal DriveFort Snelling, MN 55111phone: [email protected]
Tom WorthingtonChief, Visitor & Information Management U.S. Fish & Wildlife ServiceBishop Henry Whipple Federal Building1 Federal DriveFort Snelling, MN 55111phone: [email protected]