Embed Size (px)
Citation preview

Human DevelopmentIndices and Indicators2018 Statistical Update
Hu
man
Develo
pm
ent In
dices an
d In
dicato
rs | 2018 Statistical Up
date

Copyright @ 2018 By the United Nations Development Programme 1 UN Plaza, New York, NY 10017 USA
All rights reserved. No part of this publication may be reproduced, stored in a retrieval system or transmitted, in any form or by means, electronic, mechanical, photocopying, recording or otherwise, without prior permission.
A catalogue record for this book is available from the British Library and Library of Congress
Editing and production: Communications Development Incorporated, Washington DC, USA Information design, cover and data visualization: Human Development Report Office
The cover reflects human development progress over 1990–2017 in terms of Human Development Index (HDI) values and the number of people in the four human development categories. In the figure each slice’s innermost band represents the population in that human development category, and the height of the slice reflects its HDI value. The cover reflects that even though the global population increased from 5 billion to 7.5 billion between 1990 and 2017, the number of people in low human development fell from 3 billion to 926 million—or from 60 percent of the global population to 12 percent—and that the number of people in high and very high human development more than tripled, from 1.2 billion to 3.8 billion—or from 24 percent of the global population to 51 percent.
Low human development Very high human development
High human devel
opm
ent
Medium
human development
0.504
0.645
0.757
Human Development Index value
0.894
1.439 bn people
2.733 bn
2.379
bn
926 m
2017HDI
0.504
0.645
0.757
Human Development Index value
0.894
1.439 bn people
2.733 bn
2.379
bn
926 m

Human Development Indices and Indicators
2018 Statistical Update
Empowered lives. Resilient nations.
Published for theUnited NationsDevelopmentProgramme(UNDP)

Human Development Indicators and Indices: 2018 Statistical Update Team
DirectorSelim Jahan
Deputy directorThangavel Palanivel
Research, writing and statisticsMilorad Kovacevic (Chief Statistician), Jacob Assa, Astra Bonini, Cecilia Calderon, Yu-Chieh Hsu, Christina Lengfelder, Tanni Mukhopadhyay, Shivani Nayyar, Carolina Rivera and Heriberto Tapia
Production, online and digitalAdmir Jahic and Dharshani Seneviratne
Communications and advocacyJon Hall, Anna Ortubia and Elodie Turchi
OperationsSarantuya Mend (Operations Manager), Botagoz Abdreyeva, Fe Juarez Shanahan, May Wint Than and Nu Nu Win
ii | HUMAN DEVELOPMENT INDICES AND INDICATORS

Foreword: the state of global human development in 2018We are living in a complex world. People, nations and economies are more connected than ever, and so are the global development issues we are facing. These issues span borders, straddle social, economic and environmental realms, and can be persisting or recurring.
From urbanization to the creation of jobs for millions of people, the world’s challenges will only be solved using approaches that take both complexity and local context into account. For almost thirty years, UNDP’s human develop-ment approach—with its emphasis on enlarging people’s freedoms and opportunities rather than economic growth—has inspired and informed solutions and policies across the world.
I am pleased to present Human Development Indices and Indicators: 2018 Statistical Update. With its comprehensive statistical annex, our data gives an overview of the state of development across the world, looking at long-term trends in human development in-dicators across multiple dimensions and for every nation.
Human development data, analysis and reporting have been at the heart of that para-digm. UNDP’s Human Development Index (HDI) has captured human progress, combin-ing information on people’s health, education and income in just one number. Over the years, the HDI has served as a comparative tool of excellence, and as a reliable platform for vigorous public debates on national priorities.
Yet the simplicity of the HDI’s story leaves much unsaid. Despite overall progress, large pockets of poverty and exclusion persist. Inequality and conflict are on the rise in many places. Climate change and other environmen-tal concerns are undercutting development now and for future generations. Because our planet seems to be getting more unequal, more unsta-ble and more unsustainable, offering detailed and reliable data has never been so important.
Consider inequality, which has become a defining issue of our time and in many places a cause of entrenched uncertainty and vulner-ability. Inequality decreases the global HDI
by one fifth. And it deals the hardest blow to countries in the low and medium development categories.
Gender inequality remains one of the great-est barriers to human development. The aver-age HDI for women is 6 percent lower than that of men, with countries in the low develop-ment category suffering the widest gaps. Given current rates of progress it could take over 200 years to close the economic gender gap across the planet.
Further, conflicts in many parts of the world remain the norm rather than the ex-ception. Violence not only threatens human security but also erodes development progress. Between 2012 and 2017, the conflicts in Syria, Libya and Yemen contributed to these countries’ slipping down the HDI, due to significant declines in their life expectancy or economic setbacks. It will take years, if not decades for them to return to pre-violence levels of development.
Finally, as our environmental indicators show, today’s progress is coming at the expense of our children. A changing climate, massive declines in biodiversity, and the depletion of land and freshwater resources pose serious threats to humankind. They require an imme-diate and ambitious change in production and consumption patterns.
While evidence remains the lifeblood of informed decisions, many policy-makers un-derstandably struggle to know where to turn to for reliable and readily understandable in-formation amidst the current avalanche of new indices, indicators and statistics. Collecting, integrating and filtering new data are needed to see the bigger picture and develop better solutions. This is an exciting period for human development reporting.
The Human Development Report will remain UNDP’s premier vehicle to advance development thinking. Our mission to capture the state of global human development and in-form development policy across the globe has never been more crucial.
2018 STATISTICAL UPDATE | iii
Still, the Sustainable Development Goals (SDGs) require new indicators for assessing the many faces of inequality, the impact of the global environmental crisis on people now and tomorrow, the importance of voice, and the ways in which communities rather than indi-viduals are progressing.
These and many other topics should be reexamined with a human development lens, resulting in a new generation of Human Development Reports. As we work to embrace new data, new ideas and new partners, we will
continue to ensure human progress is mon-itored continuously, analyzed regularly and presented globally.
Achim SteinerAdministratorUnited Nations Development Programme
iv | HUMAN DEVELOPMENT INDICES AND INDICATORS

AcknowledgementsHuman Development Indices and Indicators: 2018 Statistical Update is the product of the Human Development Report Office (HDRO) at the United Nations Development Programme (UNDP).
The composite indices, indicators and data of the Update are those of the HDRO alone and cannot be attributed to UNDP or to its Executive Board. The UN General Assembly has officially recognized the Human Development Report as “an independent intel-lectual exercise” that has become “an impor-tant tool for raising awareness about human development around the world.”
The Update’s composite indices and other statistical resources rely on the expertise of the leading international data providers in their specialized fields, and we express our gratitude for their continued collegial collaboration with the HDRO.
A group of talented young people con-tributed to the Update as interns and deserve recognition for their dedication and contributions: Grace Chen, Rashik
Alam Chowdhury, Drilona Emrullahu and Shangchao Liu.
We are grateful for the highly profes-sional work of our editors and layout artists at Communications Development Incorporated—led by Bruce Ross-Larson, with Joe Caponio, Nick Moschovakis, Christopher Trott and Elaine Wilson.
Most of all, on a personal note, I am pro-foundly grateful to UNDP Administrator Achim Steiner for his leadership and vision as well as his commitment to the cause of human development. My thanks also go to all my HDRO colleagues, particularly the statistical team, for their dedication in producing sta-tistical updates that strive to advance human development.
Selim JahanDirectorHuman Development Report Office
2018 STATISTICAL UPDATE | v

Contents
HUMAN DEVELOPMENT INDICES AND INDICATORS: 2018 STATISTICAL UPDATE
Trends in the Human Development Index and its key components— progress not linear, and still far to go 2
Inequalities in human development—a grave challenge to progress 4
Gender inequality—close the gaps to empower half the world’s people 5
Human deprivations high despite overall progress 7
Moving beyond quantity to the quality of human development 8
Environmental degradation puts human development gains at risk 11
Conclusion 12
Notes 13
References 13
STATISTICAL ANNEX
Readers guide 17
Statistical tablesHuman development composite indices
1. Human Development Index and its components 22
2. Human Development Index trends, 1990–2017 26
3. Inequality-adjusted Human Development Index 30
4. Gender Development Index 34
5. Gender Inequality Index 38
6. Multidimensional Poverty Index: developing countries —*
Human development indicators
7. Population trends 44
8. Health outcomes 48
9. Education achievements 52
10. National income and composition of resources 56
11. Work and employment 60
12. Human security 64
13. Human and capital mobility 68
14. Supplementary indicators: perceptions of well-being 72
15. Status of fundamental human rights treaties 76
Human development dashboards
1. Quality of human development 81
2. Life-course gender gap 86
3. Women’s empowerment 91
4. Environmental sustainability 96
5. Socioeconomic sustainability 101
Developing regions 106
Index to Sustainable Development Goal indicators 107
Statistical references 110
BOXES 1 Measuring human development 1
2 Income inequality within countries 4
3 The Multidimensional Poverty Index 9
FIGURES1 Evolution of human development composite indices 1
2 Human development dashboards 2
3 Human Development Index values, by country grouping, 1990–2017 3
4 Change in Human Development Index rank in conflict-affected countries, 2012–2017 3
5 Loss in Human Development Index value due to inequality, by human development group, 2017 5
6 Inequalities in human development outcomes around the world, 2017 5
7 Life expectancy at birth, by human development group, 2017 6
8 Human Development Index by gender, gender gap and Gender Development Index, by developing region, 2017 7
9 Gender Inequality Index, by developing region, 2017 8
10 Life-course gender gap, 2017 9
11 Healthy life expectancy and overall life expectancy, by human development group, 2017 10
12 Impressive progress in expected years of schooling and mean years of schooling, 1990–2017 11
13 Number of primary school pupils per teacher, by human development group, 2012–2017 11
14 Carbon dioxide emissions per capita, by human development group, 2014 (tonnes) 12
15 Change in forest area, by human development group, 1990–2015 12
* This table, based on a revised methodology developed jointly with the Oxford Poverty and Human Development Initiative, will be available in due course.
2018 STATISTICAL UPDATE | vii


Human development indices and indicators 2018 statistical update
Human development is about human freedoms. It is about building human capabilities—not just for a few, not even for most, but for everyone. In 1990 UNDP published the first Human Development Report (HDR). Since then, it has produced more than 800 global, regional, national and subnational HDRs and organized hundreds of workshops, conferences and other outreach initiatives to foster human development. These activities have extended the frontiers of analytical thinking about human progress beyond economic growth, firmly placing people and human well-being at the centre of development policies and strategies.
The greatest innovations of the HDRs have been new measurement tools—notably the Human Development Index (HDI), launched in the first HDR (box 1). The underlying prin-ciple of the HDI, considered pathbreaking in 1990, was elegantly simple: National develop-ment should be measured not only by income per capita, as had long been the practice, but also by health and education achievements. Ranking countries by their HDI value trans-formed the development discourse and de-throned income per capita as the sole indicator of development progress.
Over the years additional indices have been developed to capture other dimensions of human development to identify groups falling behind in human progress and to monitor the distribution of human development (figure 1). In 2010 three indices were launched to mon-itor poverty, inequality and gender empow-erment across multiple human development dimensions: the Multidimensional Poverty
Index (MPI), the Inequality-adjusted Human Development Index (IHDI) and the Gender Inequality Index (GII). In 2014 the Gender Development Index (GDI) was introduced.
It is 28 years since the launch of the first HDR, and new challenges to human develop-ment, especially inequality and sustainability, require concerted measurement and analyt-ical attention. Data availability is expanding with new opportunities for measurement innovation and disaggregation and possibil-ities for new partnerships growing out of the 2030 Agenda for Sustainable Development. Technologies are introducing new ways of communicating key report messages. These are all opportunities to strengthen the analysis, insights, relevance and reach of future HDRs.
Reflecting on the next generation of HDRs that give full consideration to new challenges and opportunities for analysis and innovation takes time. Human Development Indices and Indicators: 2018 Statistical Update is being
FIGURE 1
Evolution of human development composite indices
Human Development
Index(HDI)
Inequality-adjusted Human
Development Index(IHDI)
GenderInequality
Index(GII)
MultidimensionalPoverty Index
(MPI)
GenderDevelopment
Index(GDI)
1990
2010
2014
Source: Human Development Report Office.
BOX 1
Measuring human development
The Human Development Index (HDI) is a composite index focusing on three basic dimensions of human development: the ability to lead a long and healthy life, measured by life expectancy at birth; the ability to ac-quire knowledge, measured by mean years of school-ing and expected years of schooling; and the ability to achieve a decent standard of living, measured by gross national income per capita.
To measure human development more comprehen-sively, the Human Development Report presents four other composite indices. The Inequality-adjusted HDI dis-counts the HDI according to the extent of inequality. The Gender Development Index compares female and male HDI values. The Gender Inequality Index highlights wom-en’s empowerment. And the Multidimensional Poverty Index measures nonincome dimensions of poverty.
Source: Human Development Report Office.
2018 STATISTICAL UPDATE | 1

released to ensure consistency in reporting on key human development indices and statistics. It provides a brief overview of the state of human development—snapshots of current conditions as well as long-term trends in human develop-ment indicators. And it includes a full statistical annex of human development composite indices and indicators across their various dimensions.
This update includes the 2017 values for the HDI and other composite indices as well as current statistics in key areas of human develop-ment for use by policymakers, researchers and others in their analytical, planning and policy work. In addition to the standard HDR tables, statistical dashboards are included to draw attention to the relationship between human well-being and five topics: quality of human development, life-course gender gaps, women’s empowerment, environmental sustainability and socioeconomic sustainability (figure 2). Accompanying the statistical annex is an over-view of trends in human development, high-lighting the considerable progress, but also the persistent deprivations and disparities.
Trends in the Human Development Index and its key components—progress not linear, and still far to go
The 2018 Update presents HDI values for 189 countries and territories with the most recent data for 2017.1 Of these countries, 59 are in the very high human development group, 53 in the high, 39 in the medium and only 38 in the low. In 2010, 49 countries were in the low human development group.
The top five countries in the global HDI ranking are Norway (0.953), Switzerland (0.944), Australia (0.939), Ireland (0.938) and Germany (0.936) (see statistical table 1). The bottom five are Burundi (0.417), Chad (0.404), South Sudan (0.388), the Central African Republic (0.367) and Niger (0.354). The largest increases in HDI rank between 2012 and 2017 were for Ireland, which moved up 13 places, and for Botswana, the Dominican Republic and Turkey, which each moved up 8. The largest declines were for the Syrian Arab Republic (down 27), Libya (26) and Yemen (20).
Looking back over almost three decades, all regions and human development groups have made substantial progress. The global HDI value in 2017 was 0.728, up about 21.7 per-cent from 0.598 in 1990. Across the world, people are living longer, are more educated and have greater livelihood opportunities. The average lifespan is seven years longer than it was in 1990, and more than 130 countries have universal enrolment in primary education.
Although HDI values have been rising across all regions and human development groups, the rates vary significantly (see statistical table 2). South Asia was the fastest growing region over 1990–2017, at 45.3 percent, followed by East Asia and the Pacific at 41.8 percent and Sub-Saharan Africa at 34.9 percent (figure 3). The Organisation for Economic Co-operation and Development (OECD) countries, by contrast, grew 14.0 percent. The trends hold promise for reducing gaps in human development across regions.
But HDI growth has also slowed in all regions, particularly in the last decade. Part of the reason lies in the 2008–2009 global food, financial and economic crises. But part is simply that as human progress advances, slower HDI growth is inevitable, given the growth ceilings of different components of the HDI—as seen with OECD countries. There is a biological limit to life expectancy, and years of schooling and rates of enrolment cannot grow indefinitely. Income is the only compo-nent of the HDI that could continue to grow; but even income growth slows as economies mature.2 As more countries reach the upper limits of HDI dimensions, measures of the quality of human development become more central.
Progress since 1990 has not always been steady. Some countries suffered reversals due to conflicts, epidemics or economic crises. For example, many countries in Eastern Europe and Central Asia saw their HDI values fall in the 1990s due to the collapse of the Soviet Union and to military conflict, hyperinflation and a painful introduction (or expansion) of market mechanisms. Sub-Saharan Africa also had losses in the 1990s, when conflict and the HIV/AIDS epidemic caused life expectancy to drop dramatically. Despite these challenges,
FIGURE 2
Human development dashboards
Qualityof human
development
Life-coursegender gap
Women’sempowerment
Environmentalsustainability
Socioeconomicsustainability
Source: Human Development Report Office.
2 | HUMAN DEVELOPMENT INDICES AND INDICATORS

Progress on the HDI since 1990 has not always been steady. Some countries suffered reversals due to conflicts, epidemics or economic crises
countries in these regions recovered their losses on the HDI and grew over the last two decades. For example, Sub-Saharan Africa went from the second slowest growing region on the HDI in the 1990s to the fastest growing between 2000 and 2010.
In recent years other countries had setbacks as new challenges emerged and conflicts erupted. Between 2012 and 2017 Libya, the Syrian Arab Republic and Yemen had falling HDI values and ranks—the direct effect of violent conflict (figure 4). Although Lebanon is not directly involved in violent conflict, it has suffered spillovers from the conflict in the Syrian Arab Republic, hosting more than a million Syrian refugees.3 In 2012 the Syrian Arab Republic ranked 128 on the HDI, in the medium human development group. But after years of conflict it dropped to 155 in 2017, in the low human development group, due mainly to lower life expectancy.
In sum, there have been significant advances in human development over the past few dec-ades, especially in low human development
FIGURE 3
Human Development Index values, by country grouping, 1990–2017
Arab States
East Asia & the Pacific
Europe & Central AsiaLatin America & the Caribbean
South Asia
Sub-Saharan Africa
1990 2000 2010 2017
Human development classification(Human Development Index value)
Low (Less than 0.550)
Medium (0.550–0.699)
High (0.700–0.799)
Very high(0.800 or greater)
OECD
World
0.300
0.550
0.700
0.800
Source: Human Development Report Office.
FIGURE 4
Change in Human Development Index rank in conflict-affected countries, 2012–2017
Change in HDI rank
–20 Yemen (from 158 in 2012 to 178 in 2017)
–26 Libya(from 82 in 2012 to 108 in 2017)
–27 Syrian Arab Republic(from 128 in 2012 to 155 in 2017)
Source: Human Development Report Office.
2018 STATISTICAL UPDATE | 3
The average loss in the global HDI value
due to inequality is about 20 percent
countries, up 46.6 percent on the HDI since 1990. But some countries have suffered serious setbacks—sometimes erasing in a few years the gains of several decades. And the gaps in human development across countries, while narrowing, remain huge.
Inequalities in human development —a grave challenge to progress
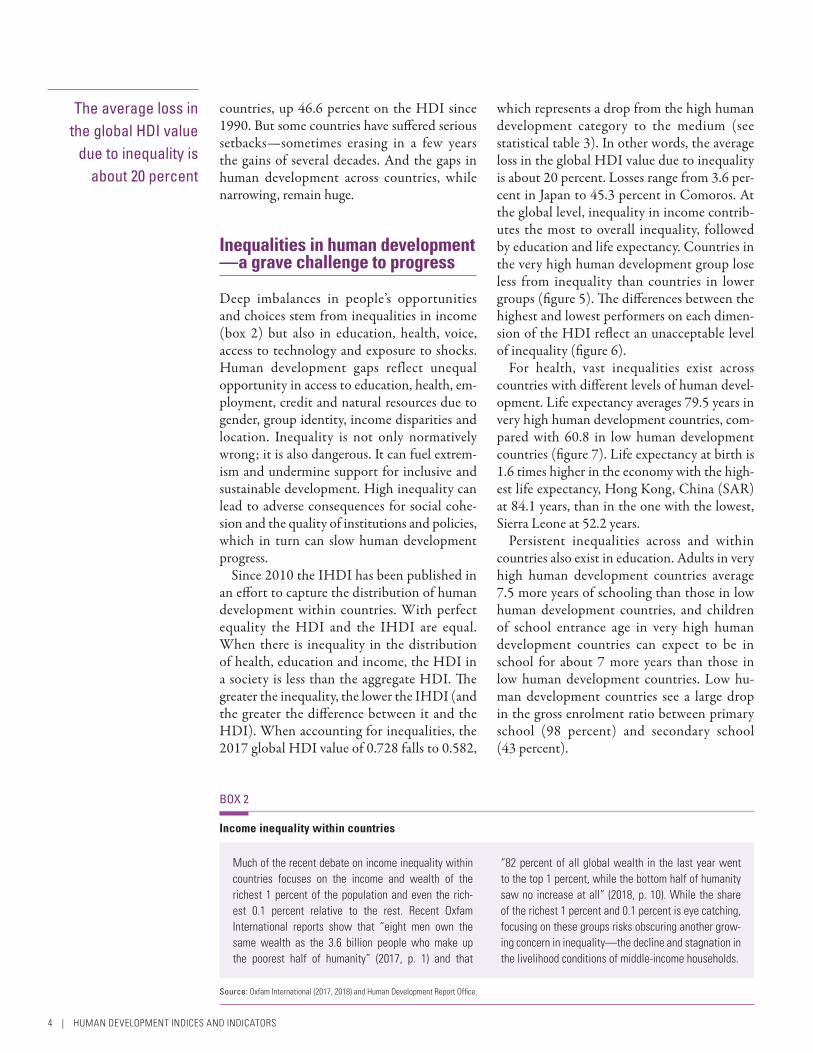
Deep imbalances in people’s opportunities and choices stem from inequalities in income (box 2) but also in education, health, voice, access to technology and exposure to shocks. Human development gaps reflect unequal opportunity in access to education, health, em-ployment, credit and natural resources due to gender, group identity, income disparities and location. Inequality is not only normatively wrong; it is also dangerous. It can fuel extrem-ism and undermine support for inclusive and sustainable development. High inequality can lead to adverse consequences for social cohe-sion and the quality of institutions and policies, which in turn can slow human development progress.
Since 2010 the IHDI has been published in an effort to capture the distribution of human development within countries. With perfect equality the HDI and the IHDI are equal. When there is inequality in the distribution of health, education and income, the HDI in a society is less than the aggregate HDI. The greater the inequality, the lower the IHDI (and the greater the difference between it and the HDI). When accounting for inequalities, the 2017 global HDI value of 0.728 falls to 0.582,
which represents a drop from the high human development category to the medium (see statistical table 3). In other words, the average loss in the global HDI value due to inequality is about 20 percent. Losses range from 3.6 per-cent in Japan to 45.3 percent in Comoros. At the global level, inequality in income contrib-utes the most to overall inequality, followed by education and life expectancy. Countries in the very high human development group lose less from inequality than countries in lower groups (figure 5). The differences between the highest and lowest performers on each dimen-sion of the HDI reflect an unacceptable level of inequality (figure 6).
For health, vast inequalities exist across countries with different levels of human devel-opment. Life expectancy averages 79.5 years in very high human development countries, com-pared with 60.8 in low human development countries (figure 7). Life expectancy at birth is 1.6 times higher in the economy with the high-est life expectancy, Hong Kong, China (SAR) at 84.1 years, than in the one with the lowest, Sierra Leone at 52.2 years.
Persistent inequalities across and within countries also exist in education. Adults in very high human development countries average 7.5 more years of schooling than those in low human development countries, and children of school entrance age in very high human development countries can expect to be in school for about 7 more years than those in low human development countries. Low hu-man development countries see a large drop in the gross enrolment ratio between primary school (98 percent) and secondary school (43 percent).
BOX 2
Income inequality within countries
Much of the recent debate on income inequality within countries focuses on the income and wealth of the richest 1 percent of the population and even the rich-est 0.1 percent relative to the rest. Recent Oxfam International reports show that “eight men own the same wealth as the 3.6 billion people who make up the poorest half of humanity” (2017, p. 1) and that
“82 percent of all global wealth in the last year went to the top 1 percent, while the bottom half of humanity saw no increase at all” (2018, p. 10). While the share of the richest 1 percent and 0.1 percent is eye catching, focusing on these groups risks obscuring another grow-ing concern in inequality—the decline and stagnation in the livelihood conditions of middle-income households.
Source: Oxfam International (2017, 2018) and Human Development Report Office.
4 | HUMAN DEVELOPMENT INDICES AND INDICATORS

Worldwide, the average HDI value for women (0.705) is 5.9 percent lower than that for men
Gender inequality—close the gaps to empower half the world’s people
The disadvantages facing women and girls are a major source of inequality and one of the greatest barriers to human development pro-gress. Two composite indices and two statisti-cal dashboards capture the disparities between men and women.
First is the GDI, which reports female and male achievements in the basic dimensions of human development. Worldwide, the average HDI value for women (0.705) is 5.9 percent lower than that for men (0.749) (see statistical table 4). Much of the gap is due to women’s lower income and educational attainment in many countries. The gender gap is widest in low human development countries, where
FIGURE 5
Loss in Human Development Index value due to inequality, by human development group, 2017
Very highhuman development
Low human development
Medium human development
High human development
HDI IHDI Loss
0.8940.799
0.636
0.757
0.483
0.645
0.504
10.7%
31.1%
16.0%
25.1%
0.347
Source: Human Development Report Office.
FIGURE 6
Inequalities in human development outcomes around the world, 2017
84.1 Hong Kong,China (SAR)
1.6x
SierraLeone
52.2
22.9Australia
4.7x
SouthSudan
4.9
Germany
9.4x
BurkinaFaso
14.1
1.5663
Qatar
176x
Central AfricanRepublic
116,818
Expected years of schooling (years)
Mean years of schooling (years)
Gross national income per capita (2011 PPP $)
Life expectancyat birth (years)
Source: Human Development Report Office.
2018 STATISTICAL UPDATE | 5

Among developing regions the gender gap is narrowest in
Latin America and the Caribbean (2.3 percent)
and widest in South Asia (16.3 percent)
and the Arab States (14.5 percent)
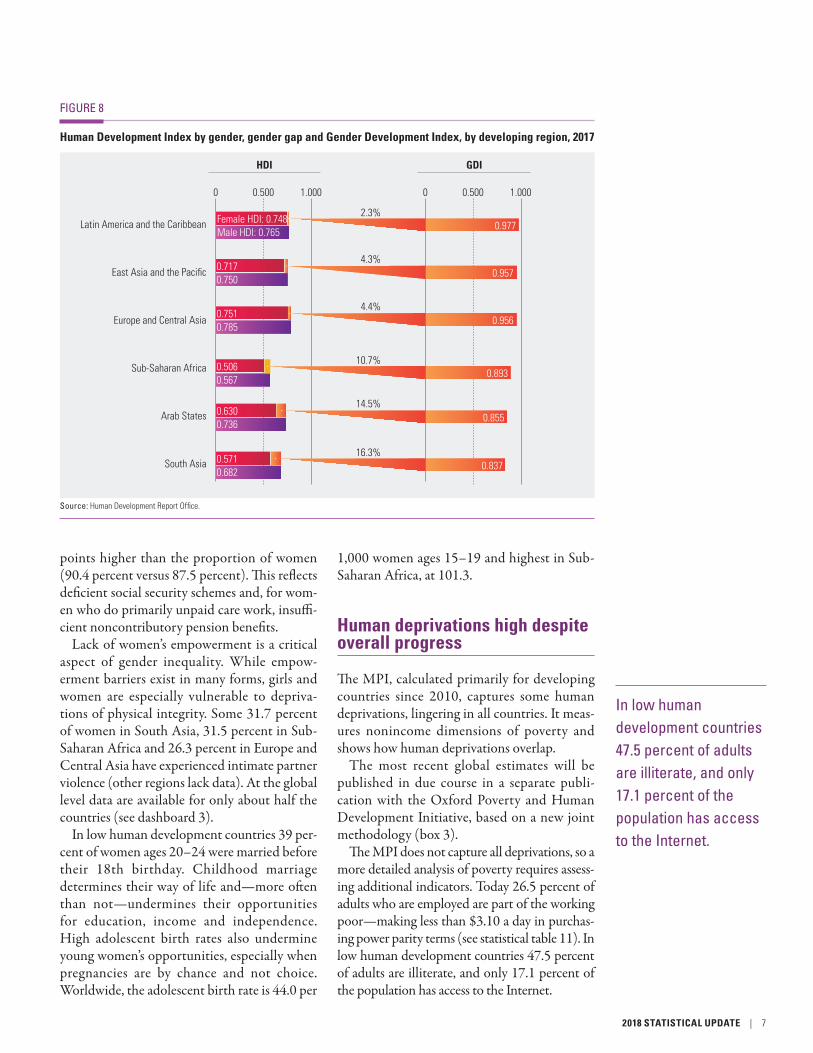
the average HDI value is 13.8 percent lower for women than for men. Among developing regions the gender gap is narrowest in Latin America and the Caribbean (2.3 percent) and widest in South Asia (16.3 percent) and the Arab States (14.5 percent) (figure 8).
The second composite index to measure gender inequalities is the GII, which captures the inequalities women face in reproductive health, education, political representation and the labour market. The higher the GII value, the greater the gender inequality—which oc-curs in all countries. The global GII value in 2017 was 0.441 (see statistical table 5). Among developing regions the GII value ranges from 0.270 for Europe and Central Asia to 0.531 for the Arab States to 0.569 in Sub-Saharan Africa (figure 9). The value for OECD countries is 0.186.
A lifecycle perspective that identifies when interventions are particularly important can help in understanding and addressing the disparities between men and women (see dashboard 2).
While primary and secondary education enrolment indicates that some gender gaps in the early formative years are closing, the gender gaps in adulthood remain high (figure 10). Women hold only 23.5 percent of seats in parliament, and among women unemployment rates are higher and labour force participation rates lower. Yet women provide most unpaid care work in the home—limiting their choices in paid work.
A wide gap between men and women is also seen in old age. Even though on average women live longer than men, the proportion of men receiving a pension is 2.9 percentage
FIGURE 7
Life expectancy at birth, by human development group, 2017
Low human developmentVery high human development
High human deve
lopm
ent
Medium
human development
60.8
69.1
76.0
Life expectancy
79.5 years
1.439 bn people
2.733 bn
2.379
bn
926 m
Source: Human Development Report Office.
6 | HUMAN DEVELOPMENT INDICES AND INDICATORS
In low human development countries 47.5 percent of adults are illiterate, and only 17.1 percent of the population has access to the Internet.
points higher than the proportion of women (90.4 percent versus 87.5 percent). This reflects deficient social security schemes and, for wom-en who do primarily unpaid care work, insuffi-cient noncontributory pension benefits.
Lack of women’s empowerment is a critical aspect of gender inequality. While empow-erment barriers exist in many forms, girls and women are especially vulnerable to depriva-tions of physical integrity. Some 31.7 percent of women in South Asia, 31.5 percent in Sub-Saharan Africa and 26.3 percent in Europe and Central Asia have experienced intimate partner violence (other regions lack data). At the global level data are available for only about half the countries (see dashboard 3).
In low human development countries 39 per-cent of women ages 20–24 were married before their 18th birthday. Childhood marriage determines their way of life and—more often than not—undermines their opportunities for education, income and independence. High adolescent birth rates also undermine young women’s opportunities, especially when pregnancies are by chance and not choice. Worldwide, the adolescent birth rate is 44.0 per
1,000 women ages 15–19 and highest in Sub-Saharan Africa, at 101.3.
Human deprivations high despite overall progress
The MPI, calculated primarily for developing countries since 2010, captures some human deprivations, lingering in all countries. It meas-ures nonincome dimensions of poverty and shows how human deprivations overlap.
The most recent global estimates will be published in due course in a separate publi-cation with the Oxford Poverty and Human Development Initiative, based on a new joint methodology (box 3).
The MPI does not capture all deprivations, so a more detailed analysis of poverty requires assess-ing additional indicators. Today 26.5 percent of adults who are employed are part of the working poor—making less than $3.10 a day in purchas-ing power parity terms (see statistical table 11). In low human development countries 47.5 percent of adults are illiterate, and only 17.1 percent of the population has access to the Internet.
FIGURE 8
Human Development Index by gender, gender gap and Gender Development Index, by developing region, 2017
Latin America and the Caribbean
East Asia and the Pacific
Europe and Central Asia
Sub-Saharan Africa
Arab States
South Asia
0 0.500 1.000
Female HDI: 0.748Male HDI: 0.765
HDI GDI
0 0.500 1.000
0.977
0.7170.750
0.957
0.7510.785
0.956
0.5060.567
0.893
0.6300.736
0.855
0.5710.682
0.837
2.3%
4.3%
4.4%
10.7%
14.5%
16.3%
Source: Human Development Report Office.
2018 STATISTICAL UPDATE | 7

From a human development
viewpoint, true progress can be
achieved only by ensuring quality—in
education, health and beyond
Moving beyond quantity to the quality of human development
Achievements in human development should be expressed not only in terms of quantity, such as life expectancy or years of schooling, but also in terms of quality. Were the years lived really enjoyable or plagued by illness? Have children merely attended school, or did they gain the skills and knowledge that will equip them to lead a meaningful life? Is work allowing people to thrive, or are most people toiling in insecure and unsafe work? Are people shaping things that influence their lives or excluded from participating? From a human development viewpoint, true progress can be achieved only by ensuring quality—in education, health and beyond.
Quality of health
Although life expectancy has increased sub-stantially in most countries over the past three decades, the measure does not reveal whether the years lived are healthy and enjoyable. Several proxies for the quality of health exist and can be divided into input and output indicators. Consider the differences in access to physicians and hospital beds, both input indicators. Europe and Central Asia has 24.7 physicians per 10,000 people, South Asia 7.8 and Sub-Saharan Africa 1.9 (see dashboard 1). The average number of hospital beds per 10,000 people is 58 in high human development countries, compared with 9 in medium human development countries and 13 in low human development countries.
Another way to assess the quality of health is to look at output indicators such as healthy life expectancy, which provides information on
FIGURE 9
Gender Inequality Index, by developing region, 2017
0.270
Sub-Sah
aran A
frica
Arab Stat
esSou
th Asia
Latin
America
and t
he Cari
bbea
n
East
Asia an
d the
Pacifi
c
Europ
e and
Centra
l Asia
0.312
0.386
0.515
0.531
0.569
Gender Inequality Index
Source: Human Development Report Office.
8 | HUMAN DEVELOPMENT INDICES AND INDICATORS

FIGURE 10
Life-course gender gap, 2017
(deviation from gender parity)
0.01
0.01
0.48
0.12
0.20
0.69
0.03
Gross primary enrolment ratio
Gross secondary enrolment ratio
Population withat least some
secondaryeducation
Total unemployment
rate
Share of seats in
parliament
Old-age pension
recipients
Child
hood
and
you
thAd
ulth
ood
Olde
r age
Women doing better
Gender equality
line
Men doing better
a. STEM includes science, mathematics, engineering, manufacturing and construction.
Share ofgraduates in
STEM at tertiary level
a
Source: Human Development Report Office.
BOX 3
The Multidimensional Poverty Index
The Multidimensional Poverty Index (MPI), developed by the Oxford Poverty and Human Development Initiative (OPHI) for HDRO, was added to the suite of compos-ite human development indices in 2010. This year, an MPI with a modified methodology, jointly developed by HDRO and OPHI, is being launched.
The modified MPI identifies overlapping depriva-tions at the household level across the same three
dimensions as the HDI (health, education and living standards). It shows the proportion of people who are multidimensionally poor and the average number of deprivations that each poor person experiences. It is calculated as a weighted average of 10 deprivation in-dicators, including school attainment and attendance, nutrition, child mortality, assets and access to some basic services.
Source: Human Development Report Office.
2018 STATISTICAL UPDATE | 9

Healthy life expectancy is 12 percent lower
than overall life expectancy
whether the years lived are expected to be in good health, and lost health expectancy, which is the relative difference between life expectan-cy and healthy life expectancy expressed as the percentage of life expectancy at birth.
Healthy life expectancy is 12.0 percent lower than overall life expectancy for all regions and human development groups. This means that, on average, people around the globe spend 88.0 per-cent of their life in fairly good health but face challenges in their last years. Disparities are large across countries and human development groups. Healthy life expectancy is 69.9 years in very high human development countries but 53.3 years in low human development countries (figure 11).
Quality of education
The quantity of schooling shows impressive progress. In 1990 mean years of schooling for
the global adult population was 5.8; by 2017 it had increased to 8.4 (figure 12). And today’s school-age children can expect to be in school for 3.4 more years than those in 1990.
But many countries still need to ensure that time in school translates into improved capa-bilities. There are three times more primary school pupils per teacher in low human de-velopment countries than in very high human development countries (41 versus 14) and 11 more pupils per teacher in medium human development countries than in high human development countries (figure 13).
The training that teachers receive can also significantly affect the quality of education. Most primary school teachers have had some form of training. In low and medium human development countries an average of 76 per-cent of teachers are trained to teach, but there are wide variations. In four countries fewer than
FIGURE 11
Healthy life expectancy and overall life expectancy, by human development group, 2017
Low human developmentVery high human development
High human deve
lopm
ent
Medium
human development
79.5
69.1
76.0
Life expectancy
60.8 years
1.439 bn people
2.733 bn
2.379
bn
926 m
60.0
67.7
11.8%
10.9%
13.0% Healthy life
expectancy
53.3 years
9.6
9.1
8.3
69.9
12.5%
7.5 years
Source: Human Development Report Office.
10 | HUMAN DEVELOPMENT INDICES AND INDICATORS

The degradation of the environment and atmosphere, coupled with significant declines in biodiversity, threatens the human development of current and future generations
30 percent of teachers are trained: Madagascar (15 percent), Kyrgyzstan (21 percent), Sao Tome and Principe (27 percent) and Vanuatu (28 percent). The availability of communica-tions technologies also has implications for the quality of education. But modernizing schools requires substantial investments, a challenge in most developing regions.
Environmental degradation puts human development gains at risk
The degradation of the environment and at-mosphere, coupled with significant declines in biodiversity, is linked to other development concerns ranging from declining food and water supplies to losses of livelihood and to losses of life from extreme weather events. This profoundly serious crisis threatens the human development of current and future generations.
Business-as-usual approaches must change, with countries at different levels of human development exposed to and contributing to environmental degradation in different ways (see dashboard 4). Very high human develop-ment countries are the biggest contributors to climate change, with average carbon dioxide emissions per capita of 10.7 tonnes, compared with 0.3 tonne in low human development countries (figure 14). These averages mask considerable variation: Qatar had the highest carbon dioxide emissions per capita in 2014, releasing more than 45 tonnes per person, while Uruguay, also a very high human devel-opment country, released only 2 tonnes per person. Countries with lower levels of human development, especially small island develop-ing states, generally have the lowest emissions but are often the most vulnerable to climate change.
FIGURE 12
Impressive progress in expected years of schooling and mean years of schooling, 1990–2017
5
10
15
1990 1995 2000 2005
Expected years of schooling
Mean years of schooling
(years)
20152010 2017
Source: Human Development Report Office.
FIGURE 13
Number of primary school pupils per teacher, by human development group, 2012–2017
Very highhuman
development
Lowhuman
development
Mediumhuman
development
Highhuman
development
14
18
29
41
Source: Human Development Report Office.
2018 STATISTICAL UPDATE | 11
Every human being counts, and every
human life is equally valuable. That
universalism is at the core of the human
development concept
Linked to climate change and biodiversity loss, deforestation also degrades land and reduces the quantity and quality of freshwater. The overall pace of forest loss has slowed in recent years, but the planet still lost 3.2 percent of its forests between 1990 and 2015. And low human de-velopment countries, many of them reservoirs of global biodiversity, lost 14.5 percent (figure 15).
Freshwater withdrawals stand at 7.2 percent of the global supply, with vast differences across countries and regions. In South Asia annual withdrawals stand at 23.8 percent of total renewable supplies. Unsustainable water with-drawals and inadequate treatment of waste con-taminate drinking water, with cascading impacts on health, employment and gender inequality.
Conclusion
This Update has shown a snapshot of con-ditions today as well as key trends in human development indices and indicators. Five key findings emerge from the analysis:• Most people today live longer, are more ed-
ucated and have more access to goods and services than ever before. Even in low human development countries people’s human devel-opment has improved significantly. But the quality of human development reveals large deficits. Living longer does not automatically
mean more years spent enjoying life. Being in school longer does not automatically trans-late into equivalent capabilities and skills. So shifting the focus towards the quality of human development will be important in monitoring future progress.
• Progress is not linear or guaranteed, and crises and challenges can reverse gains. Countries experiencing conflict show HDI losses, which can be felt for generations. Investment in human security to break cycles of vulnerability and conflict is essential to reduce vulnerabilities and sustain progress.
• Going beyond the average achievements, the IHDI and disaggregated assessments reveal large inequalities across human development dimensions. Persistently high inequality is a fundamental challenge to sustaining future progress in human development. When the HDI is adjusted for inequalities, the global HDI value falls 20 percent.
• Disparities between women and men in realizing their full potential stand as a great barrier to human development progress, holding back half the world’s population. Women have a lower HDI value than men across regions and face particular barriers to empowerment all through life.
• Progress in human development cannot be sustained without addressing environmental degradation and climate change, which the
FIGURE 14
Carbon dioxide emissions per capita, by human development group, 2014 (tonnes)
Very
high h
uman
devel
opmen
t
High hu
man de
velop
ment
Medium
human
devel
opmen
t
Low hu
man de
velop
ment
Global C02
emissions4.6 tonnes per capita
10.7
6.7
1.7
0.3
Source: Human Development Report Office.
FIGURE 15
Change in forest area, by human development group, 1990–2015
1.1
–14.5
–1.7
–9.7
Low hu
man de
velop
ment
Medium
human
devel
opmen
t
High hu
man de
velop
ment
Very
high h
uman
devel
opmen
t
Change in forest area (%)
Source: Human Development Report Office.
12 | HUMAN DEVELOPMENT INDICES AND INDICATORS
recent progress on the HDI has exacerbated. For human development to become truly sus-tainable, the world needs to break with busi-ness-as-usual approaches and adopt sustainable production and consumption patterns.
* * *
Every human being counts, and every human life is equally valuable. That universalism is at the core of the human development con-cept. With the 2030 Agenda for Sustainable Development, the Sustainable Development Goals and the promises to leave no one behind, this universal perspective is more critical than ever, particularly in a world that is increasingly unequal, unstable and unsustainable.
Notes
1 The Marshall Islands was added this year.
2 In calculating the HDI, income per capita is capped at $75,000.
3 http://www.unhcr.org/en-us/syria-emergency.html.
References
Oxfam International. 2017. “An Economy for the 99%.” Oxfam Briefing Paper. Oxford, UK.
———. 2018. “Reward Work, Not Wealth. Oxfam Briefing Paper. Oxford, UK.
2018 STATISTICAL UPDATE | 13


Statistical annex
Readers guide 17
Statistical tablesHuman development composite indices1 Human Development Index and its components 222 Human Development Index trends, 1990–2017 263 Inequality-adjusted Human Development Index 304 Gender Development Index 345 Gender Inequality Index 386 Multidimensional Poverty Index: developing countries —*
Human development indicators7 Population trends 448 Health outcomes 489 Education achievements 5210 National income and composition of resources 5611 Work and employment 6012 Human security 6413 Human and capital mobility 6814 Supplementary indicators: perceptions of well-being 7215 Status of fundamental human rights treaties 76
Human development dashboards1 Quality of human development 812 Life-course gender gap 863 Women’s empowerment 914 Environmental sustainability 965 Socioeconomic sustainability 101
Developing regions 106
Index to Sustainable Development Goal indicators 107
Statistical references 110
* This table, based on a revised methodology developed jointly with the Oxford Poverty and Human Development Initiative, will be available in due course.
Statistical annex | 15
HUMAN DEVELOPMENT INDICES AND INDICATORS: 2018 STATISTICAL UPDATE


Readers guideThe 20 statistical tables in this annex provide an overview of key aspects of human development. The first five tables contain the family of composite human development indices and their com-ponents estimated by the Human Development Report Office (HDRO). The sixth table is produced in partnership with the Oxford Poverty and Human Development Initiative (OPHI) and will be added in due course. Remaining tables present a broader set of indicators related to human development. The five dashboards use colour coding to visualize partial groupings of countries according to performance on each indicator.
Unless otherwise noted, tables use data available to the HDRO as of 15 July 2018. All indices and indicators, along with techni-cal notes on the calculation of composite indices and additional source information, are available at http://hdr.undp.org/en/data.
Countries and territories are ranked by 2017 Human Devel-opment Index (HDI) value. Robustness and reliability analysis has shown that for most countries differences in HDI are not statistically significant at the fourth decimal place. For this rea-son countries with the same HDI value at three decimal places are listed with tied ranks.
Sources and definitions
Unless otherwise noted, the HDRO uses data from interna-tional data agencies with the mandate, resources and expertise to collect national data on specific indicators.
Definitions of indicators and sources for original data com-ponents are given at the end of each table, with full source details in Statistical references.
Methodology updates
The 2018 Statistical Update retains all the composite indices from the family of human development indices—the HDI, the Inequality-adjusted Human Development Index (IHDI), the Gender Development Index (GDI), the Gender Inequality Index (GII) and the Multidimensional Poverty Index (MPI). The methodology used to compute the first four indices is the same as the one used in the 2016 Report. For details, see Technical notes 1–4 at http://hdr.undp.org/sites/default/files/hdr2018_technical_notes.pdf. The methodology used to com-pute the MPI has been revised jointly with OPHI. For details, see Technical note 5 at http://hdr.undp.org/sites/default/files/hdr2018_technical_notes.pdf.
The 2018 Statistical Update expands the number of colour- coded dashboards to five (quality of human development, life-course gender gap, women’s empowerment, environmental sustainability and socioeconomic sustainability). For details on the
methodology used to create them, see Technical note 6 at http://hdr.undp.org/sites/default/files/hdr2018_ technical_notes.pdf.
Comparisons over time and across editions
Because national and international agencies continually improve their data series, the data—including the HDI values and ranks—presented in this report are not comparable to those published in earlier editions. For HDI comparability across years and countries, see table 2, which presents trends using consistent data, or http://hdr.undp.org/en/data, which presents interpolated consistent data.
Discrepancies between national and international estimates
National and international data can differ because international agencies harmonize national data using a consistent methodol-ogy and occasionally produce estimates of missing data to allow comparability across countries. In other cases international agencies might not have access to the most recent national data. When HDRO becomes aware of discrepancies, it brings them to the attention of national and international data authorities.
Country groupings and aggregates
The tables present weighted aggregates for several country groupings. In general, an aggregate is shown only when data are available for at least half the countries and represent at least two-thirds of the population in that grouping. Aggregates for each grouping cover only the countries for which data are available.
Human development classification
HDI classifications are based on HDI fixed cutoff points, which are derived from the quartiles of distributions of the component indicators. The cutoff points are HDI of less than 0.550 for low human development, 0.550–0.699 for medium human development, 0.700–0.799 for high human develop-ment and 0.800 or greater for very high human development.
Regional groupings
Regional groupings are based on United Nations Development Programme regional classifications. Least Developed Countries and Small Island Developing States are defined according to UN classifications (see www.unohrlls.org).
Readers guide | 17
Developing countries
The developing countries aggregates include all countries that are included in a regional grouping.
Organisation for Economic Co-operation and Development
Of the 35 Organisation for Economic Co-operation and Development members, 32 are considered developed countries and 3 (Chile, Mexico and Turkey) are considered developing countries. Aggregates refer to all countries from the group for which data are available.
Country notes
Data for China do not include Hong Kong Special Administra-tive Region of China, Macao Special Administrative Region of China or Taiwan Province of China.
As of 2 May 2016, Czechia is the short name to be used for the Czech Republic.
As of 1 June 2018, the Kingdom of Eswatini is the name of the country formerly known as Swaziland.
Symbols
A dash between two years, as in 2011–2017, indicates that the data are from the most recent year available during the period specified. A slash between years, as in 2012/2017, indicates that the data are the average for the years shown. Growth rates are usually average annual rates of growth between the first and last years of the period shown.
The following symbols are used in the tables:.. Not available0 or 0.0 Nil or negligible— Not applicable
Statistical acknowledgements
The 2018 Statistical Update’s composite indices and other sta-tistical resources draw on a wide variety of the most respect-ed international data providers in their specialized fields. HDRO is particularly grateful to the Centre for Research on the Epidemiology of Disasters; Economic Commission for Latin America and the Caribbean; Eurostat; Food and Agriculture Organization; Gallup; ICF Macro; Institute for Criminal Policy Research; Internal Displacement Monitoring Centre; International Labour Organization; International Monetary Fund; International Telecommunication Union; Inter-Parliamentary Union; Luxembourg Income Study;
Office of the United Nations High Commissioner for Human Rights; Office of the United Nations High Commissioner for Refugees; Organisation for Economic Co-operation and Development; Socio-Economic Database for Latin America and the Caribbean; Syrian Center for Policy Research; Unit-ed Nations Children’s Fund; United Nations Conference on Trade and Development; United Nations Department of Economic and Social Affairs; United Nations Economic and Social Commission for West Asia; United Nations Edu-cational, Scientific and Cultural Organization Institute for Statistics; United Nations Entity for Gender Equality and the Empowerment of Women; United Nations Office on Drugs and Crime; United Nations World Tourism Organ-ization; World Bank; and World Health Organization. The international education database maintained by Robert Barro (Harvard University) and Jong-Wha Lee (Korea University) was another invaluable source for the calculation of the 2018 Statistical Update’s indices.
Statistical tables
The first six tables relate to the five composite human devel-opment indices and their components. Since the 2010 Human Development Report, four composite human development indices—the HDI, the IHDI, the GII and the MPI for devel-oping countries—have been calculated. The 2014 Report intro-duced the GDI, which compares the HDI calculated separately for women and men. A table with the MPI calculated based on a revised methodology developed jointly by OPHI and UNDP will be available in due course.
The remaining tables present a broader set of human develop-ment indicators and provide a more comprehensive picture of a country’s human development.
For indicators that are global Sustainable Development Goals indicators or can be used in monitoring progress towards specif-ic goals, the table headers include the relevant goals and targets.
Table 1, Human Development Index and its components, ranks countries by 2017 HDI value and details the values of the three HDI components: longevity, education (with two indicators) and income per capita. The table also presents the difference in rankings by HDI value and gross national income per capita, as well as the rank on the 2016 HDI, calculated using the most recently revised historical data available in 2018.
Table 2, Human Development Index trends, 1990–2017, provides a time series of HDI values allowing 2017 HDI values to be compared with those for previous years. The table uses the most recently revised historical data available in 2018 and the same methodology applied to compute 2017 HDI values. The table also includes the change in HDI rank over the last five years and the average annual HDI growth rate across four time intervals: 1990–2000, 2000–2010, 2010–2017 and 1990–2017.
18 | HUMAN DEVELOPMENT INDICES AND INDICATORS: 2018 STATISTICAL UPDATE

Table 3, Inequality-adjusted Human Development Index, contains two related measures of inequality—the IHDI and the loss in HDI due to inequality. The IHDI looks beyond the average achievements of a country in longevity, education and income to show how these achievements are distributed among its residents. The IHDI value can be interpreted as the level of human development when inequality is accounted for. The rel-ative difference between IHDI and HDI values is the loss due to inequality in distribution of the HDI within the country. The table presents the coefficient of human inequality, which is the unweighted average of inequalities in the three dimensions. In addition, the table shows each country’s difference in rank on the HDI and the IHDI. A negative value means that taking inequality into account lowers a country’s rank on the HDI. The table also presents three standard measures of income inequality: the ratio of the top and the bottom quintiles; the Palma ratio, which is the ratio of income of the top 10 percent and the bottom 40 percent; and the Gini coefficient.
Table 4, Gender Development Index, measures dispar-ities on the HDI by gender. The table contains HDI values estimated separately for women and men; the ratio of which is the GDI value. The closer the ratio is to 1, the smaller the gap between women and men. Values for the three HDI compo-nents—longevity, education (with two indicators) and income per capita—are also presented by gender. The table includes five country groupings by absolute deviation from gender parity in HDI values.
Table 5, Gender Inequality Index, presents a composite measure of gender inequality using three dimensions: repro-ductive health, empowerment and the labour market. The reproductive health indicators are the maternal mortality ratio and the adolescent birth rate. The empowerment indicators are the share of parliamentary seats held by women and the share of population with at least some secondary education by gender. The labour market indicator is participation in the labour force by gender. A low GII value indicates low inequality between women and men, and vice-versa.
Table 6, Multidimensional Poverty Index, captures the multiple overlapping deprivations that people in developing countries face in their health, education and standard of living. The MPI shows both the incidence of nonincome multidimensional poverty (a headcount of those in multidi-mensional poverty) and its intensity (the average deprivation score experienced by poor people). Based on deprivation score thresholds, people are classified as near multidimensional pov-erty, multidimensionally poor or in severe poverty. The table includes the contribution of deprivation in each dimension to overall multidimensional poverty. It also presents measures of income poverty—population living below the national poverty line and population living on less than $1.90 in purchasing power parity terms per day. MPI values are based on a revised methodology developed in partnership with OPHI. For details, see Technical note 5 at http://hdr.undp.org/sites/default/files/
hdr2018_technical_notes.pdf and OPHI’s website (http://ophi.org.uk/multidimensional-poverty-index/).
Table 7, Population trends, contains major population indicators, including total population, median age, dependency ratios and total fertility rates, which can help assess the burden of support that falls on the labour force in a country.
Table 8, Health outcomes, presents indicators of infant health (percentage of infants who are exclusively breastfed in the 24 hours prior to the survey, percentage of infants who lack immunization for DPT and measles and infant mortality rate) and of child health (percentage of children under age 5 who are stunted and under-five mortality rates). The table also contains indicators of adult health (adult mortality rates by gender, inci-dence of malaria and tuberculosis and HIV prevalence rates). Finally, it includes healthy life expectancy at birth and current health expenditure as a percentage of GDP.
Table 9, Education achievements, presents standard edu-cation indicators. The table provides indicators of educational attainment—adult and youth literacy rates and the share of the adult population with at least some secondary education. Gross enrolment ratios at each level of education are complemented by primary school dropout rate and survival rate to the last grade of lower secondary general education. The table also presents government expenditure on education as a percentage of GDP.
Table 10, National income and composition of resources, covers several macroeconomic indicators such as gross domes-tic product (GDP), gross fixed capital formation, and taxes on income, profit and capital gains as a percentage of total tax revenue. Gross fixed capital formation is a rough indicator of national income that is invested rather than consumed. In times of economic uncertainty or recession, gross fixed capital formation typically declines. General government final con-sumption expenditure (presented as a share of GDP and as average annual growth) is an indicator of public spending. In addition, the table presents two indicators of debt—domestic credit provided by the financial sector and total debt service, both measured as a percentage of GDP or GNI. The consumer price index, a measure of inflation, is also presented.
Table 11, Work and employment, contains indicators on four topics: employment, unemployment, work that is a risk to human development and employment-related social security. The employment indicators are the employment to popula-tion ratio, the labour force participation rate, employment in agriculture and employment in services. The unemployment indicators are total unemployment, youth unemployment and youth not in school or employment. The indicators on work that is a risk to human development are child labour and the working poor. And the indicator on employment-related social security is the percentage of the eligible population that receives an old-age pension.
Table 12, Human security, reflects the extent to which the population is secure. The table begins with the percentage of births that are registered, followed by the number of refugees
Readers guide | 19
HUMAN DEVELOPMENT INDICES AND INDICATORS: 2018 STATISTICAL UPDATE

by country of origin and the number of internally displaced people. It then shows the size of the homeless population due to natural disasters, the population of orphaned children and the prison population. It also provides homicide and suicide rates (by gender) and includes an indicator on justification of wife beating and an indicator on the depth of food deficit.
Table 13, Human and capital mobility, provides indica-tors of several aspects of globalization. International trade is captured by measuring exports and imports as a share of GDP. Financial flows are represented by net inflows of foreign direct investment and flows of private capital, net official develop-ment assistance and inflows of remittances. Human mobility is captured by the net migration rate, the stock of immigrants, the net number of tertiary students from abroad (expressed as a percentage of total tertiary enrolment in the country) and the number of international inbound tourists. International communication is represented by the percentages of the total and female populations that use the Internet, the number of mobile phone subscriptions per 100 people and the percentage change in mobile phone subscriptions between 2010 and 2016.
Table 14, Supplementary indicators: perceptions of well-being, includes indicators that reflect individuals’ per-ceptions of relevant dimensions of human development—edu-cation quality, health care quality, standard of living, personal safety, freedom of choice and overall life satisfaction. The table also presents indicators reflecting perceptions about communi-ty and government.
Table 15, Status of fundamental human rights treaties, shows when countries ratified key human rights conventions. The 11 selected conventions cover basic human rights and free-doms related to elimination of all forms of racial and gender discrimination and violence, protection of children’s rights, rights of migrant workers and persons with disabilities. They also cover torture and other cruel, inhuman and degrading treatment as well as protection from enforced disappearance.
Dashboard 1, Quality of human development, contains a selection of indicators associated with the quality of health, edu-cation and standard of living. The indicators on quality of health are lost health expectancy, number of physicians and number of hospital beds. The indicators on quality of education are pupil–teacher ratio in primary schools; primary school teachers trained to teach; proportion of schools with access to the Internet; and Programme for International Student Assessment (PISA) scores in mathematics, reading and science. The indicators on quality of standard of living are the proportion of employment that is in vulnerable employment, the proportion of rural population with access to electricity, the proportion of population using improved drinking-water sources and the proportion of popu-lation using improved sanitation facilities. A country in the top third of an indicator distribution has performed better than at
least two-thirds of countries. A country that is in the top third group on all indicators can be considered a country with the highest quality of human development. The dashboard shows that not all countries in the very high human development group have the highest quality of human development and that many countries in the low human development group are in the bottom third of all quality indicators in the table.
Dashboard 2, Life-course gender gap, contains a selection of indicators that indicate gender gaps in choices and opportu-nities over the life course—childhood and youth, adulthood and older age. The indicators refer to health, education, labour market and work, seats in parliament, time use and social protection. Most indicators are presented as a ratio of female to male values. Sex ratio at birth is an exception to grouping by tercile—countries are divided into two groups: the natural group (countries with a value of 1.04–1.07, inclusive) and the gender-biased group (all other countries). Deviations from the natural sex ratio at birth have implications for population replacement levels, suggest possible future social and economic problems and may indicate gender bias. Countries with values of a parity index concentrated around 1 form the group with the best achievements in that indicator. Deviations from parity are treated equally regardless of which gender is overachieving.
Dashboard 3, Women’s empowerment, contains a selec-tion of woman-specific empowerment indicators that allows empowerment to be compared across three dimensions: repro-ductive health and family planning, violence against girls and women and socioeconomic empowerment. Most countries have at least one indicator in each tercile, which implies that wom-en’s empowerment is unequal across indicators and countries.
Dashboard 4, Environmental sustainability, contains a selection of indicators that cover environmental sustainability and environmental threats. The environmental sustainability indicators present levels of or changes in energy consumption, carbon dioxide emissions, forest area and fresh water with-drawals. The environmental threats indicators are mortality rates attributed to household and ambient air pollution and to unsafe water, sanitation and hygiene services and the Inter-national Union for Conservation of Nature Red List Index value, which measures aggregate extinction risk across groups of species.
Dashboard 5, Socioeconomic sustainability, contains a selection of indicators that cover economic and social sustain-ability. The economic sustainability indicators are adjusted net savings, total debt service, gross capital formation, skilled labour force, diversity of exports and expenditure on research and development. The social sustainability indicators are the ratio of education and health expenditure to military expendi-ture, change in overall loss in HDI value due to inequality and changes in gender and income inequality.
20 | HUMAN DEVELOPMENT INDICES AND INDICATORS: 2018 STATISTICAL UPDATE

Human development composite indices

TABLE
1
SDG 3 SDG 4.3 SDG 4.6 SDG 8.5
Human Development Index (HDI)
Life expectancy at birth
Expected years of schooling
Mean years of schooling
Gross national income (GNI) per capita
GNI per capita rank minus HDI rank HDI rank
Value (years) (years) (years) (2011 PPP $)
HDI rank 2017 2017 2017a 2017a 2017 2017 2016
VERY HIGH HUMAN DEVELOPMENT1 Norway 0.953 82.3 17.9 12.6 68,012 5 12 Switzerland 0.944 83.5 16.2 13.4 57,625 8 23 Australia 0.939 83.1 22.9 b 12.9 43,560 18 34 Ireland 0.938 81.6 19.6 b 12.5 c 53,754 8 45 Germany 0.936 81.2 17.0 14.1 46,136 13 46 Iceland 0.935 82.9 19.3 b 12.4 c 45,810 13 67 Hong Kong, China (SAR) 0.933 84.1 16.3 12.0 58,420 2 87 Sweden 0.933 82.6 17.6 12.4 47,766 9 79 Singapore 0.932 83.2 16.2 d 11.5 82,503 e –6 8
10 Netherlands 0.931 82.0 18.0 12.2 47,900 5 1011 Denmark 0.929 80.9 19.1 b 12.6 f 47,918 3 1012 Canada 0.926 82.5 16.4 c 13.3 43,433 10 1213 United States 0.924 79.5 16.5 13.4 54,941 –2 1214 United Kingdom 0.922 81.7 17.4 12.9 f 39,116 13 1415 Finland 0.920 81.5 17.6 12.4 41,002 10 1516 New Zealand 0.917 82.0 18.9 b 12.5 33,970 18 1617 Belgium 0.916 81.3 19.8 b 11.8 42,156 6 1617 Liechtenstein 0.916 80.4 g 14.7 12.5 h 97,336 e,i –15 1619 Japan 0.909 83.9 15.2 12.8 j 38,986 9 1920 Austria 0.908 81.8 16.1 12.1 45,415 0 2021 Luxembourg 0.904 82.0 14.0 12.1 f 65,016 k –13 2622 Israel 0.903 82.7 15.9 13.0 32,711 13 2122 Korea (Republic of) 0.903 82.4 16.5 12.1 35,945 8 2224 France 0.901 82.7 16.4 11.5 39,254 2 2325 Slovenia 0.896 81.1 17.2 12.2 30,594 12 2426 Spain 0.891 83.3 17.9 9.8 34,258 7 2527 Czechia 0.888 78.9 16.9 12.7 30,588 11 2728 Italy 0.880 83.2 16.3 10.2 f 35,299 3 2829 Malta 0.878 81.0 15.9 11.3 34,396 3 2930 Estonia 0.871 77.7 16.1 12.7 28,993 10 3031 Greece 0.870 81.4 17.3 10.8 24,648 20 3032 Cyprus 0.869 80.7 14.6 12.1 31,568 4 3233 Poland 0.865 77.8 16.4 12.3 26,150 12 3434 United Arab Emirates 0.863 77.4 13.6 10.8 l 67,805 –27 3335 Andorra 0.858 81.7 g 13.5 d 10.2 47,574 m –18 3535 Lithuania 0.858 74.8 16.1 13.0 28,314 7 3637 Qatar 0.856 78.3 13.4 9.8 116,818 e –36 3638 Slovakia 0.855 77.0 15.0 12.5 29,467 1 3939 Brunei Darussalam 0.853 77.4 14.5 9.1 j 76,427 e –35 4039 Saudi Arabia 0.853 74.7 16.9 9.5 f 49,680 –26 3841 Latvia 0.847 74.7 15.8 12.8 f 25,002 8 4341 Portugal 0.847 81.4 16.3 9.2 27,315 2 4243 Bahrain 0.846 77.0 16.0 9.4 l 41,580 –19 4144 Chile 0.843 79.7 16.4 10.3 21,910 13 4445 Hungary 0.838 76.1 15.1 11.9 25,393 3 4546 Croatia 0.831 77.8 15.0 11.3 l 22,162 10 4647 Argentina 0.825 76.7 17.4 9.9 l 18,461 19 4748 Oman 0.821 77.3 13.9 9.5 36,290 –19 4749 Russian Federation 0.816 71.2 15.5 12.0 f 24,233 3 4950 Montenegro 0.814 77.3 14.9 11.3 f 16,779 19 5051 Bulgaria 0.813 74.9 14.8 11.8 18,740 13 5052 Romania 0.811 75.6 14.3 11.0 22,646 2 5253 Belarus 0.808 73.1 15.5 12.3 16,323 18 5454 Bahamas 0.807 75.8 12.8 n 11.1 f 26,681 –10 5355 Uruguay 0.804 77.6 15.9 8.7 19,930 5 5656 Kuwait 0.803 74.8 13.6 7.3 70,524 –51 5557 Malaysia 0.802 75.5 13.7 10.2 f 26,107 –11 5758 Barbados 0.800 76.1 15.3 10.6 o 15,843 k 14 5758 Kazakhstan 0.800 70.0 15.1 11.8 j 22,626 –3 60
Human Development Index and its componentsTAB
LE1
22 | HUMAN DEVELOPMENT INDICES AND INDICATORS: 2018 STATISTICAL UPDATE
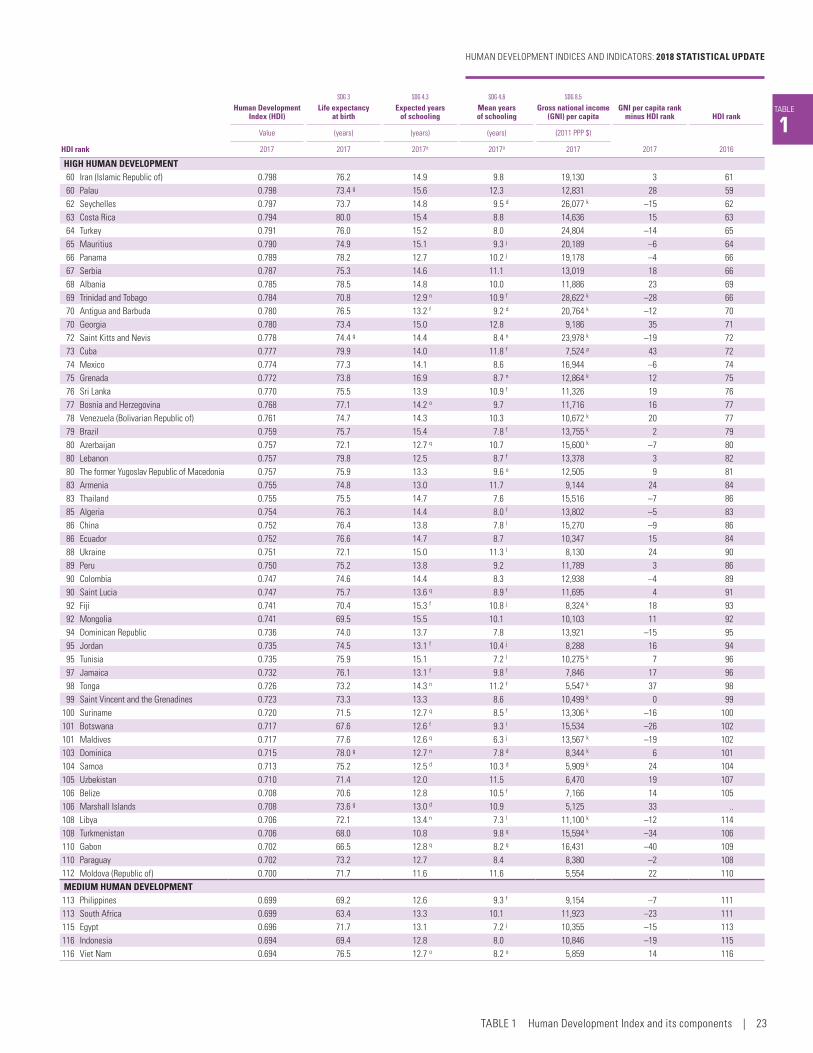
TABLE
1
SDG 3 SDG 4.3 SDG 4.6 SDG 8.5
Human Development Index (HDI)
Life expectancy at birth
Expected years of schooling
Mean years of schooling
Gross national income (GNI) per capita
GNI per capita rank minus HDI rank HDI rank
Value (years) (years) (years) (2011 PPP $)
HDI rank 2017 2017 2017a 2017a 2017 2017 2016
HIGH HUMAN DEVELOPMENT60 Iran (Islamic Republic of) 0.798 76.2 14.9 9.8 19,130 3 6160 Palau 0.798 73.4 g 15.6 12.3 12,831 28 5962 Seychelles 0.797 73.7 14.8 9.5 d 26,077 k –15 6263 Costa Rica 0.794 80.0 15.4 8.8 14,636 15 6364 Turkey 0.791 76.0 15.2 8.0 24,804 –14 6565 Mauritius 0.790 74.9 15.1 9.3 j 20,189 –6 6466 Panama 0.789 78.2 12.7 10.2 j 19,178 –4 6667 Serbia 0.787 75.3 14.6 11.1 13,019 18 6668 Albania 0.785 78.5 14.8 10.0 11,886 23 6969 Trinidad and Tobago 0.784 70.8 12.9 n 10.9 f 28,622 k –28 6670 Antigua and Barbuda 0.780 76.5 13.2 f 9.2 d 20,764 k –12 7070 Georgia 0.780 73.4 15.0 12.8 9,186 35 7172 Saint Kitts and Nevis 0.778 74.4 g 14.4 8.4 n 23,978 k –19 7273 Cuba 0.777 79.9 14.0 11.8 f 7,524 p 43 7274 Mexico 0.774 77.3 14.1 8.6 16,944 –6 7475 Grenada 0.772 73.8 16.9 8.7 n 12,864 k 12 7576 Sri Lanka 0.770 75.5 13.9 10.9 f 11,326 19 7677 Bosnia and Herzegovina 0.768 77.1 14.2 o 9.7 11,716 16 7778 Venezuela (Bolivarian Republic of) 0.761 74.7 14.3 10.3 10,672 k 20 7779 Brazil 0.759 75.7 15.4 7.8 f 13,755 k 2 7980 Azerbaijan 0.757 72.1 12.7 q 10.7 15,600 k –7 8080 Lebanon 0.757 79.8 12.5 8.7 f 13,378 3 8280 The former Yugoslav Republic of Macedonia 0.757 75.9 13.3 9.6 o 12,505 9 8183 Armenia 0.755 74.8 13.0 11.7 9,144 24 8483 Thailand 0.755 75.5 14.7 7.6 15,516 –7 8685 Algeria 0.754 76.3 14.4 8.0 f 13,802 –5 8386 China 0.752 76.4 13.8 7.8 l 15,270 –9 8686 Ecuador 0.752 76.6 14.7 8.7 10,347 15 8488 Ukraine 0.751 72.1 15.0 11.3 l 8,130 24 9089 Peru 0.750 75.2 13.8 9.2 11,789 3 8690 Colombia 0.747 74.6 14.4 8.3 12,938 –4 8990 Saint Lucia 0.747 75.7 13.6 q 8.9 f 11,695 4 9192 Fiji 0.741 70.4 15.3 f 10.8 j 8,324 k 18 9392 Mongolia 0.741 69.5 15.5 10.1 10,103 11 9294 Dominican Republic 0.736 74.0 13.7 7.8 13,921 –15 9595 Jordan 0.735 74.5 13.1 f 10.4 j 8,288 16 9495 Tunisia 0.735 75.9 15.1 7.2 l 10,275 k 7 9697 Jamaica 0.732 76.1 13.1 f 9.8 f 7,846 17 9698 Tonga 0.726 73.2 14.3 n 11.2 f 5,547 k 37 9899 Saint Vincent and the Grenadines 0.723 73.3 13.3 8.6 10,499 k 0 99
100 Suriname 0.720 71.5 12.7 q 8.5 f 13,306 k –16 100101 Botswana 0.717 67.6 12.6 f 9.3 l 15,534 –26 102101 Maldives 0.717 77.6 12.6 q 6.3 j 13,567 k –19 102103 Dominica 0.715 78.0 g 12.7 n 7.8 d 8,344 k 6 101104 Samoa 0.713 75.2 12.5 d 10.3 d 5,909 k 24 104105 Uzbekistan 0.710 71.4 12.0 11.5 6,470 19 107106 Belize 0.708 70.6 12.8 10.5 f 7,166 14 105106 Marshall Islands 0.708 73.6 g 13.0 d 10.9 5,125 33 ..108 Libya 0.706 72.1 13.4 n 7.3 l 11,100 k –12 114108 Turkmenistan 0.706 68.0 10.8 9.8 q 15,594 k –34 106110 Gabon 0.702 66.5 12.8 q 8.2 q 16,431 –40 109110 Paraguay 0.702 73.2 12.7 8.4 8,380 –2 108112 Moldova (Republic of) 0.700 71.7 11.6 11.6 5,554 22 110MEDIUM HUMAN DEVELOPMENT113 Philippines 0.699 69.2 12.6 9.3 f 9,154 –7 111113 South Africa 0.699 63.4 13.3 10.1 11,923 –23 111115 Egypt 0.696 71.7 13.1 7.2 j 10,355 –15 113116 Indonesia 0.694 69.4 12.8 8.0 10,846 –19 115116 Viet Nam 0.694 76.5 12.7 o 8.2 o 5,859 14 116
HUMAN DEVELOPMENT INDICES AND INDICATORS: 2018 STATISTICAL UPDATE
TABLE 1 Human Development Index and its components | 23
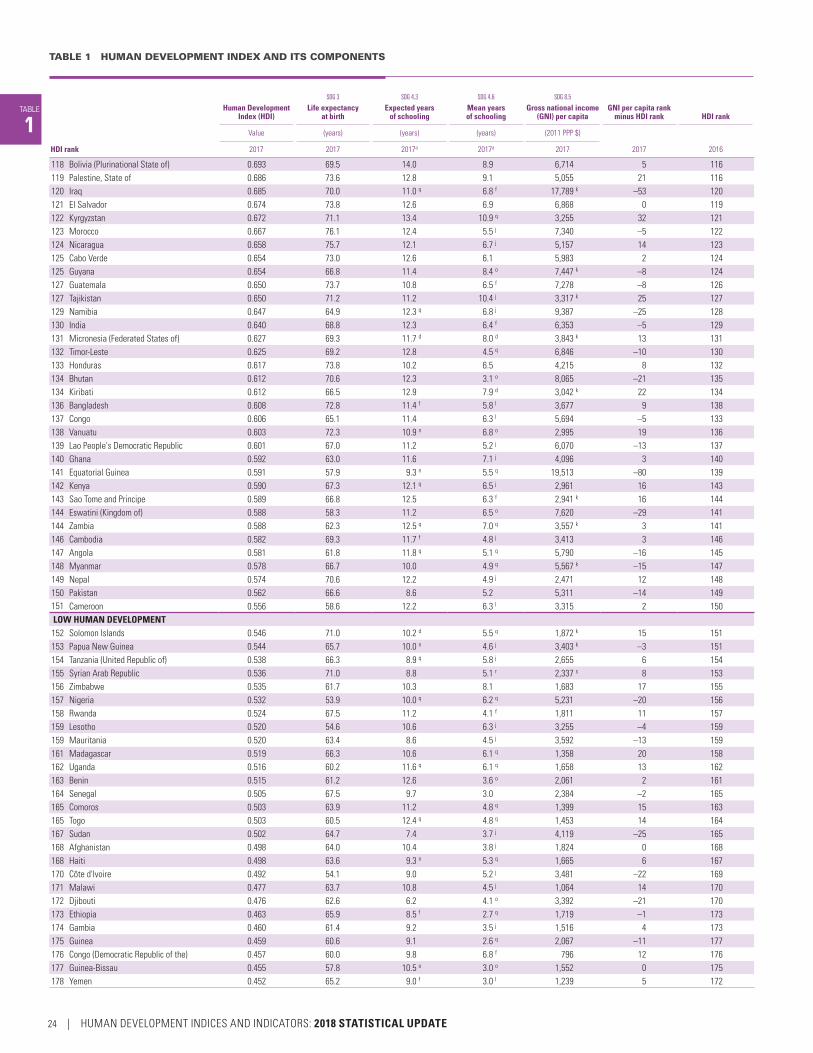
TABLE 1 HUMAN DEVELOPMENT INDEX AND ITS COMPONENTS
TABLE
1
SDG 3 SDG 4.3 SDG 4.6 SDG 8.5
Human Development Index (HDI)
Life expectancy at birth
Expected years of schooling
Mean years of schooling
Gross national income (GNI) per capita
GNI per capita rank minus HDI rank HDI rank
Value (years) (years) (years) (2011 PPP $)
HDI rank 2017 2017 2017a 2017a 2017 2017 2016
118 Bolivia (Plurinational State of) 0.693 69.5 14.0 8.9 6,714 5 116119 Palestine, State of 0.686 73.6 12.8 9.1 5,055 21 116120 Iraq 0.685 70.0 11.0 q 6.8 f 17,789 k –53 120121 El Salvador 0.674 73.8 12.6 6.9 6,868 0 119122 Kyrgyzstan 0.672 71.1 13.4 10.9 q 3,255 32 121123 Morocco 0.667 76.1 12.4 5.5 j 7,340 –5 122124 Nicaragua 0.658 75.7 12.1 6.7 j 5,157 14 123125 Cabo Verde 0.654 73.0 12.6 6.1 5,983 2 124125 Guyana 0.654 66.8 11.4 8.4 o 7,447 k –8 124127 Guatemala 0.650 73.7 10.8 6.5 f 7,278 –8 126127 Tajikistan 0.650 71.2 11.2 10.4 j 3,317 k 25 127129 Namibia 0.647 64.9 12.3 q 6.8 j 9,387 –25 128130 India 0.640 68.8 12.3 6.4 f 6,353 –5 129131 Micronesia (Federated States of) 0.627 69.3 11.7 d 8.0 d 3,843 k 13 131132 Timor-Leste 0.625 69.2 12.8 4.5 q 6,846 –10 130133 Honduras 0.617 73.8 10.2 6.5 4,215 8 132134 Bhutan 0.612 70.6 12.3 3.1 o 8,065 –21 135134 Kiribati 0.612 66.5 12.9 7.9 d 3,042 k 22 134136 Bangladesh 0.608 72.8 11.4 f 5.8 l 3,677 9 138137 Congo 0.606 65.1 11.4 6.3 l 5,694 –5 133138 Vanuatu 0.603 72.3 10.9 n 6.8 o 2,995 19 136139 Lao People's Democratic Republic 0.601 67.0 11.2 5.2 j 6,070 –13 137140 Ghana 0.592 63.0 11.6 7.1 j 4,096 3 140141 Equatorial Guinea 0.591 57.9 9.3 n 5.5 q 19,513 –80 139142 Kenya 0.590 67.3 12.1 q 6.5 j 2,961 16 143143 Sao Tome and Principe 0.589 66.8 12.5 6.3 f 2,941 k 16 144144 Eswatini (Kingdom of) 0.588 58.3 11.2 6.5 o 7,620 –29 141144 Zambia 0.588 62.3 12.5 q 7.0 q 3,557 k 3 141146 Cambodia 0.582 69.3 11.7 f 4.8 j 3,413 3 146147 Angola 0.581 61.8 11.8 q 5.1 q 5,790 –16 145148 Myanmar 0.578 66.7 10.0 4.9 q 5,567 k –15 147149 Nepal 0.574 70.6 12.2 4.9 j 2,471 12 148150 Pakistan 0.562 66.6 8.6 5.2 5,311 –14 149151 Cameroon 0.556 58.6 12.2 6.3 l 3,315 2 150LOW HUMAN DEVELOPMENT152 Solomon Islands 0.546 71.0 10.2 d 5.5 q 1,872 k 15 151153 Papua New Guinea 0.544 65.7 10.0 n 4.6 j 3,403 k –3 151154 Tanzania (United Republic of) 0.538 66.3 8.9 q 5.8 j 2,655 6 154155 Syrian Arab Republic 0.536 71.0 8.8 5.1 r 2,337 s 8 153156 Zimbabwe 0.535 61.7 10.3 8.1 1,683 17 155157 Nigeria 0.532 53.9 10.0 q 6.2 q 5,231 –20 156158 Rwanda 0.524 67.5 11.2 4.1 f 1,811 11 157159 Lesotho 0.520 54.6 10.6 6.3 j 3,255 –4 159159 Mauritania 0.520 63.4 8.6 4.5 j 3,592 –13 159161 Madagascar 0.519 66.3 10.6 6.1 q 1,358 20 158162 Uganda 0.516 60.2 11.6 q 6.1 q 1,658 13 162163 Benin 0.515 61.2 12.6 3.6 o 2,061 2 161164 Senegal 0.505 67.5 9.7 3.0 2,384 –2 165165 Comoros 0.503 63.9 11.2 4.8 q 1,399 15 163165 Togo 0.503 60.5 12.4 q 4.8 q 1,453 14 164167 Sudan 0.502 64.7 7.4 3.7 j 4,119 –25 165168 Afghanistan 0.498 64.0 10.4 3.8 j 1,824 0 168168 Haiti 0.498 63.6 9.3 n 5.3 q 1,665 6 167170 Côte d'Ivoire 0.492 54.1 9.0 5.2 j 3,481 –22 169171 Malawi 0.477 63.7 10.8 4.5 j 1,064 14 170172 Djibouti 0.476 62.6 6.2 4.1 o 3,392 –21 170173 Ethiopia 0.463 65.9 8.5 f 2.7 q 1,719 –1 173174 Gambia 0.460 61.4 9.2 3.5 j 1,516 4 173175 Guinea 0.459 60.6 9.1 2.6 q 2,067 –11 177176 Congo (Democratic Republic of the) 0.457 60.0 9.8 6.8 f 796 12 176177 Guinea-Bissau 0.455 57.8 10.5 o 3.0 o 1,552 0 175178 Yemen 0.452 65.2 9.0 f 3.0 l 1,239 5 172
24 | HUMAN DEVELOPMENT INDICES AND INDICATORS: 2018 STATISTICAL UPDATE

TABLE
1
SDG 3 SDG 4.3 SDG 4.6 SDG 8.5
Human Development Index (HDI)
Life expectancy at birth
Expected years of schooling
Mean years of schooling
Gross national income (GNI) per capita
GNI per capita rank minus HDI rank HDI rank
Value (years) (years) (years) (2011 PPP $)
HDI rank 2017 2017 2017a 2017a 2017 2017 2016
179 Eritrea 0.440 65.5 5.4 4.0 n 1,750 k –9 178180 Mozambique 0.437 58.9 9.7 3.5 f 1,093 4 179181 Liberia 0.435 63.0 10.0 q 4.7 j 667 9 180182 Mali 0.427 58.5 7.7 2.3 f 1,953 –16 181183 Burkina Faso 0.423 60.8 8.5 1.5 q 1,650 –7 182184 Sierra Leone 0.419 52.2 9.8 q 3.5 j 1,240 –2 184185 Burundi 0.417 57.9 11.7 3.0 q 702 4 183186 Chad 0.404 53.2 8.0 2.3 q 1,750 –15 185187 South Sudan 0.388 57.3 4.9 q 4.8 963 k –1 186188 Central African Republic 0.367 52.9 7.2 f 4.3 j 663 3 187189 Niger 0.354 60.4 5.4 2.0 j 906 –2 188OTHER COUNTRIES OR TERRITORIES
.. Korea (Democratic People's Rep. of) .. 71.9 12.0 .. .. .. ..
.. Monaco .. .. .. .. .. .. ..
.. Nauru .. .. 10.3 .. 18,573 k .. ..
.. San Marino .. .. 15.1 .. .. .. ..
.. Somalia .. 56.7 .. .. .. .. ..
.. Tuvalu .. .. .. .. 5,888 k .. ..Human development groups
Very high human development 0.894 79.5 16.4 12.2 40,041 — —High human development 0.757 76.0 14.1 8.2 14,999 — —Medium human development 0.645 69.1 12.0 6.7 6,849 — —Low human development 0.504 60.8 9.4 4.7 2,521 — —
Developing countries 0.681 70.7 12.2 7.3 10,055 — —Regions
Arab States 0.699 71.5 11.9 7.0 15,837 — —East Asia and the Pacific 0.733 74.7 13.3 7.9 13,688 — —Europe and Central Asia 0.771 73.4 14.1 10.3 15,331 — —Latin America and the Caribbean 0.758 75.7 14.4 8.5 13,671 — —South Asia 0.638 69.3 11.9 6.4 6,473 — —Sub-Saharan Africa 0.537 60.7 10.1 5.6 3,399 — —
Least developed countries 0.524 64.8 9.8 4.7 2,506 — —Small island developing states 0.676 71.0 11.8 8.2 7,721 — —Organisation for Economic Co‑operation and Development 0.895 80.6 16.2 12.0 39,595 — —World 0.728 72.2 12.7 8.4 15,295 — —
NOTES
a Data refer to 2017 or the most recent year available.
b In calculating the HDI value, expected years of schooling is capped at 18 years.
c Based on data from OECD (2017a).
d Based on data from the national statistical office.
e In calculating the HDI value, GNI per capita is capped at $75,000.
f Updated by HDRO based on data from UNESCO Institute for Statistics (2018).
g Value from UNDESA (2011).
h Imputed mean years of schooling for Austria.
i Estimated using the purchasing power parity (PPP) rate and projected growth rate of Switzerland.
j Based on Barro and Lee (2016).
k HDRO estimate based on data from World Bank (2018b) and United Nations Statistics Division (2018b).
l Updated by HDRO using Barro and Lee (2016) estimates.
m Estimated using the PPP rate and projected growth rate of Spain.
n Based on cross-country regression.
o Updated by HDRO based on data from United Nations Children’s Fund (UNICEF) Multiple Indicator Cluster Surveys for 2006–2017.
p Based on a cross-country regression and the projected growth rate from UNECLAC (2018).
q Updated by HDRO based on data from ICF Macro Demographic and Health Surveys for 2006–2017.
r Updated by HDRO based on Syrian Center for Policy Research (2017).
s HDRO estimate based on data from World Bank (2018b), United Nations Statistics Division (2018b) and projected growth rates from UNESCWA (2018).
DEFINITIONS
Human Development Index (HDI): A composite index measuring average achievement in three basic dimensions of human development — a long and healthy life, knowledge and a decent standard of living. See Technical note 1 at http://hdr.undp.org/sites/default/files/hdr2018_technical_notes.pdf for details on how the HDI is calculated.
Life expectancy at birth: Number of years a newborn infant could expect to live if prevailing
patterns of age-specific mortality rates at the time of birth stay the same throughout the infant’s life.
Expected years of schooling: Number of years of schooling that a child of school entrance age can expect to receive if prevailing patterns of age-specific enrolment rates persist throughout the child’s life.
Mean years of schooling: Average number of years of education received by people ages 25 and older, converted from education attainment levels using official durations of each level.
Gross national income (GNI) per capita: Aggregate income of an economy generated by its production and its ownership of factors of production, less the incomes paid for the use of factors of production owned by the rest of the world, converted to international dollars using PPP rates, divided by midyear population.
GNI per capita rank minus HDI rank: Difference in ranking by GNI per capita and by HDI value. A negative value means that the country is better ranked by GNI than by HDI value.
HDI rank for 2016: Ranking by HDI value for 2016, which was calculated using the same most recently
revised data available in 2018 that were used to calculate HDI values for 2017.
MAIN DATA SOURCES
Columns 1 and 7: HDRO calculations based on data from UNDESA (2017a), UNESCO Institute for Statistics (2018), United Nations Statistics Division (2018b), World Bank (2018b), Barro and Lee (2016) and IMF (2018).
Column 2: UNDESA (2017a).
Column 3: UNESCO Institute for Statistics (2018), ICF Macro Demographic and Health Surveys, UNICEF Multiple Indicator Cluster Surveys and OECD (2017a).
Column 4: UNESCO Institute for Statistics (2018), Barro and Lee (2016), ICF Macro Demographic and Health Surveys, UNICEF Multiple Indicator Cluster Surveys and OECD (2017a).
Column 5: World Bank (2018b), IMF (2018) and United Nations Statistics Division (2018b).
Column 6: Calculated based on data in columns 1 and 5.
HUMAN DEVELOPMENT INDICES AND INDICATORS: 2018 STATISTICAL UPDATE
TABLE 1 Human Development Index and its components | 25

TABLE
2
Human Development Index (HDI)Change in HDI rank Average annual HDI growth
Value (%)
HDI rank 1990 2000 2010 2012 2014 2015 2016 2017 2012–2017a 1990–2000 2000–2010 2010–2017 1990–2017
VERY HIGH HUMAN DEVELOPMENT1 Norway 0.850 0.917 0.942 0.942 0.946 0.948 0.951 0.953 0 0.76 0.27 0.17 0.422 Switzerland 0.832 0.889 0.932 0.935 0.939 0.942 0.943 0.944 0 0.67 0.47 0.18 0.473 Australia 0.866 0.898 0.923 0.929 0.933 0.936 0.938 0.939 0 0.36 0.27 0.24 0.304 Ireland 0.763 0.857 0.909 0.902 0.921 0.929 0.934 0.938 13 1.16 0.60 0.45 0.775 Germany 0.801 0.868 0.921 0.928 0.930 0.933 0.934 0.936 –1 0.81 0.59 0.24 0.586 Iceland 0.802 0.860 0.891 0.909 0.925 0.927 0.933 0.935 5 0.71 0.36 0.68 0.577 Hong Kong, China (SAR) 0.781 0.827 0.901 0.911 0.923 0.927 0.930 0.933 3 0.58 0.87 0.49 0.667 Sweden 0.816 0.897 0.905 0.908 0.920 0.929 0.932 0.933 5 0.96 0.09 0.43 0.509 Singapore 0.718 0.819 0.909 0.920 0.928 0.929 0.930 0.932 –2 1.33 1.05 0.36 0.97
10 Netherlands 0.829 0.876 0.910 0.921 0.924 0.926 0.928 0.931 –4 0.55 0.39 0.32 0.4311 Denmark 0.799 0.863 0.910 0.924 0.928 0.926 0.928 0.929 –6 0.77 0.53 0.30 0.5612 Canada 0.849 0.867 0.902 0.908 0.918 0.920 0.922 0.926 0 0.21 0.39 0.38 0.3213 United States 0.860 0.885 0.914 0.918 0.918 0.920 0.922 0.924 –5 0.28 0.32 0.16 0.2714 United Kingdom 0.775 0.867 0.905 0.898 0.919 0.918 0.920 0.922 5 1.13 0.43 0.25 0.6415 Finland 0.784 0.858 0.903 0.908 0.914 0.915 0.918 0.920 –3 0.90 0.52 0.25 0.5916 New Zealand 0.818 0.869 0.899 0.905 0.910 0.914 0.915 0.917 –1 0.61 0.35 0.28 0.4217 Belgium 0.806 0.873 0.903 0.905 0.909 0.913 0.915 0.916 –2 0.80 0.33 0.21 0.4717 Liechtenstein .. 0.862 0.904 0.913 0.911 0.912 0.915 0.916 –8 .. 0.48 0.19 ..19 Japan 0.816 0.855 0.885 0.895 0.903 0.905 0.907 0.909 1 0.48 0.34 0.39 0.4020 Austria 0.795 0.838 0.895 0.899 0.901 0.903 0.906 0.908 –2 0.53 0.66 0.20 0.4921 Luxembourg 0.782 0.855 0.889 0.892 0.895 0.899 0.903 0.904 1 0.89 0.39 0.24 0.5422 Israel 0.792 0.853 0.887 0.893 0.899 0.901 0.902 0.903 –1 0.75 0.39 0.26 0.4922 Korea (Republic of) 0.728 0.817 0.884 0.890 0.896 0.898 0.900 0.903 1 1.17 0.79 0.30 0.8024 France 0.779 0.849 0.882 0.886 0.894 0.898 0.899 0.901 0 0.86 0.38 0.31 0.5425 Slovenia 0.767 0.825 0.882 0.877 0.887 0.889 0.894 0.896 0 0.73 0.68 0.23 0.5826 Spain 0.754 0.825 0.865 0.873 0.880 0.885 0.889 0.891 1 0.90 0.47 0.43 0.6227 Czechia 0.730 0.796 0.862 0.865 0.879 0.882 0.885 0.888 1 0.86 0.80 0.42 0.7228 Italy 0.769 0.830 0.870 0.874 0.874 0.876 0.878 0.880 –2 0.76 0.48 0.15 0.5029 Malta 0.740 0.783 0.843 0.849 0.862 0.871 0.875 0.878 4 0.56 0.74 0.59 0.6430 Estonia 0.733 0.780 0.845 0.859 0.864 0.866 0.868 0.871 –1 0.63 0.79 0.44 0.6431 Greece 0.753 0.796 0.856 0.854 0.864 0.866 0.868 0.870 –1 0.56 0.72 0.24 0.5432 Cyprus 0.732 0.802 0.850 0.852 0.856 0.860 0.867 0.869 –1 0.91 0.59 0.31 0.6433 Poland 0.712 0.785 0.835 0.836 0.842 0.855 0.860 0.865 5 0.98 0.62 0.50 0.7234 United Arab Emirates 0.727 0.798 0.836 0.846 0.855 0.860 0.862 0.863 1 0.94 0.47 0.45 0.6435 Andorra .. 0.759 0.828 0.849 0.853 0.854 0.856 0.858 –2 .. 0.88 0.51 ..35 Lithuania 0.732 0.756 0.824 0.831 0.851 0.852 0.855 0.858 5 0.33 0.87 0.58 0.5937 Qatar 0.754 0.810 0.825 0.844 0.853 0.854 0.855 0.856 –1 0.72 0.19 0.52 0.4738 Slovakia 0.739 0.764 0.829 0.842 0.845 0.851 0.853 0.855 –1 0.33 0.83 0.44 0.5439 Brunei Darussalam 0.782 0.819 0.842 0.852 0.853 0.852 0.852 0.853 –8 0.46 0.28 0.19 0.3239 Saudi Arabia 0.697 0.743 0.808 0.835 0.852 0.854 0.854 0.853 0 0.64 0.84 0.78 0.7541 Latvia 0.704 0.728 0.816 0.824 0.838 0.841 0.844 0.847 2 0.33 1.15 0.53 0.6941 Portugal 0.711 0.785 0.822 0.829 0.839 0.842 0.845 0.847 1 0.98 0.46 0.44 0.6543 Bahrain 0.746 0.792 0.796 0.800 0.810 0.832 0.846 0.846 7 0.60 0.06 0.87 0.4744 Chile 0.701 0.759 0.808 0.819 0.833 0.840 0.842 0.843 0 0.80 0.62 0.61 0.6845 Hungary 0.704 0.769 0.823 0.830 0.833 0.834 0.835 0.838 –4 0.89 0.68 0.26 0.6546 Croatia 0.670 0.750 0.808 0.816 0.824 0.827 0.828 0.831 0 1.14 0.75 0.40 0.8047 Argentina 0.704 0.771 0.813 0.818 0.820 0.822 0.822 0.825 –2 0.91 0.54 0.20 0.5948 Oman .. 0.704 0.793 0.804 0.815 0.822 0.822 0.821 0 .. 1.19 0.50 ..49 Russian Federation 0.734 0.720 0.780 0.798 0.807 0.813 0.815 0.816 3 –0.18 0.80 0.66 0.4050 Montenegro .. .. 0.793 0.800 0.805 0.809 0.810 0.814 0 .. .. 0.36 ..51 Bulgaria 0.694 0.712 0.779 0.786 0.797 0.807 0.810 0.813 6 0.26 0.90 0.61 0.5952 Romania 0.701 0.709 0.797 0.795 0.802 0.805 0.807 0.811 2 0.11 1.18 0.25 0.5453 Belarus .. 0.683 0.792 0.803 0.807 0.805 0.805 0.808 –4 .. 1.49 0.29 ..54 Bahamas .. 0.776 0.789 0.807 0.807 0.807 0.806 0.807 –7 .. 0.17 0.32 ..55 Uruguay 0.692 0.742 0.773 0.790 0.801 0.800 0.802 0.804 1 0.70 0.40 0.57 0.5656 Kuwait 0.713 0.786 0.792 0.796 0.799 0.802 0.804 0.803 –3 0.99 0.07 0.20 0.4457 Malaysia 0.643 0.725 0.772 0.781 0.790 0.795 0.799 0.802 1 1.20 0.63 0.54 0.8258 Barbados 0.716 0.752 0.782 0.795 0.796 0.797 0.799 0.800 –4 0.49 0.39 0.34 0.4158 Kazakhstan 0.690 0.685 0.765 0.781 0.793 0.797 0.797 0.800 0 –0.07 1.12 0.64 0.55
Human Development Index trends, 1990–2017TAB
LE2
26 | HUMAN DEVELOPMENT INDICES AND INDICATORS: 2018 STATISTICAL UPDATE
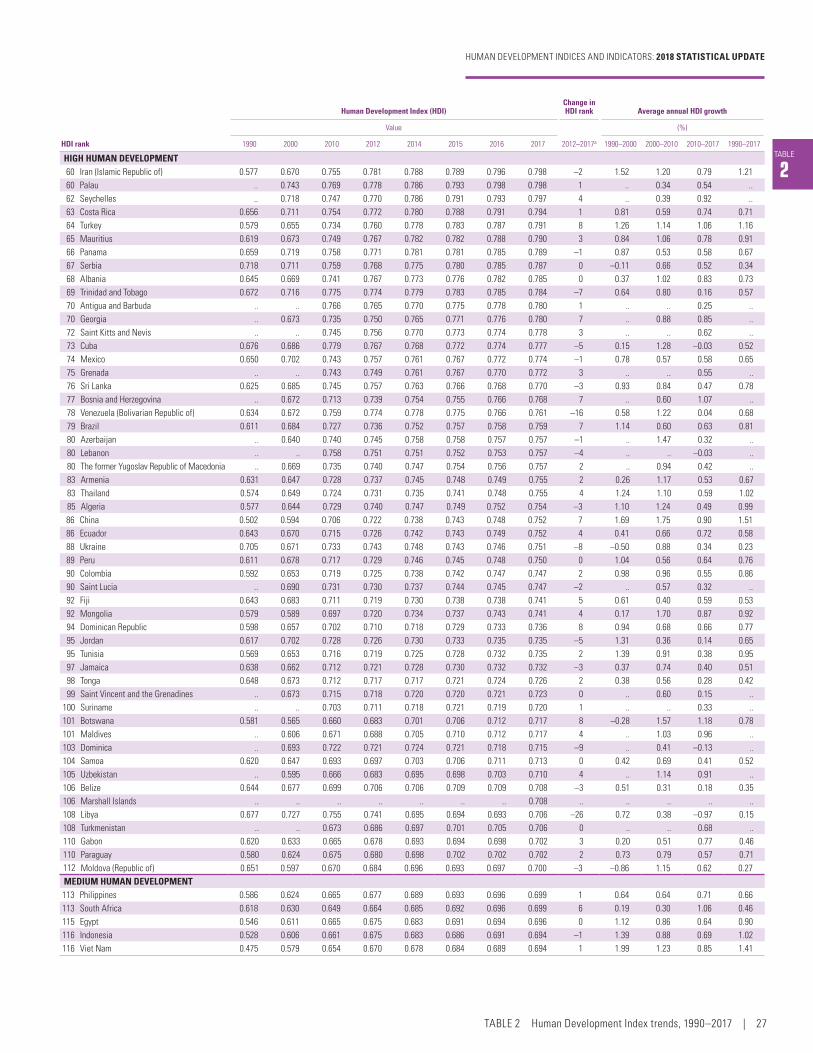
TABLE
2
Human Development Index (HDI)Change in HDI rank Average annual HDI growth
Value (%)
HDI rank 1990 2000 2010 2012 2014 2015 2016 2017 2012–2017a 1990–2000 2000–2010 2010–2017 1990–2017
HIGH HUMAN DEVELOPMENT60 Iran (Islamic Republic of) 0.577 0.670 0.755 0.781 0.788 0.789 0.796 0.798 –2 1.52 1.20 0.79 1.2160 Palau .. 0.743 0.769 0.778 0.786 0.793 0.798 0.798 1 .. 0.34 0.54 ..62 Seychelles .. 0.718 0.747 0.770 0.786 0.791 0.793 0.797 4 .. 0.39 0.92 ..63 Costa Rica 0.656 0.711 0.754 0.772 0.780 0.788 0.791 0.794 1 0.81 0.59 0.74 0.7164 Turkey 0.579 0.655 0.734 0.760 0.778 0.783 0.787 0.791 8 1.26 1.14 1.06 1.1665 Mauritius 0.619 0.673 0.749 0.767 0.782 0.782 0.788 0.790 3 0.84 1.06 0.78 0.9166 Panama 0.659 0.719 0.758 0.771 0.781 0.781 0.785 0.789 –1 0.87 0.53 0.58 0.6767 Serbia 0.718 0.711 0.759 0.768 0.775 0.780 0.785 0.787 0 –0.11 0.66 0.52 0.3468 Albania 0.645 0.669 0.741 0.767 0.773 0.776 0.782 0.785 0 0.37 1.02 0.83 0.7369 Trinidad and Tobago 0.672 0.716 0.775 0.774 0.779 0.783 0.785 0.784 –7 0.64 0.80 0.16 0.5770 Antigua and Barbuda .. .. 0.766 0.765 0.770 0.775 0.778 0.780 1 .. .. 0.25 ..70 Georgia .. 0.673 0.735 0.750 0.765 0.771 0.776 0.780 7 .. 0.88 0.85 ..72 Saint Kitts and Nevis .. .. 0.745 0.756 0.770 0.773 0.774 0.778 3 .. .. 0.62 ..73 Cuba 0.676 0.686 0.779 0.767 0.768 0.772 0.774 0.777 –5 0.15 1.28 –0.03 0.5274 Mexico 0.650 0.702 0.743 0.757 0.761 0.767 0.772 0.774 –1 0.78 0.57 0.58 0.6575 Grenada .. .. 0.743 0.749 0.761 0.767 0.770 0.772 3 .. .. 0.55 ..76 Sri Lanka 0.625 0.685 0.745 0.757 0.763 0.766 0.768 0.770 –3 0.93 0.84 0.47 0.7877 Bosnia and Herzegovina .. 0.672 0.713 0.739 0.754 0.755 0.766 0.768 7 .. 0.60 1.07 ..78 Venezuela (Bolivarian Republic of) 0.634 0.672 0.759 0.774 0.778 0.775 0.766 0.761 –16 0.58 1.22 0.04 0.6879 Brazil 0.611 0.684 0.727 0.736 0.752 0.757 0.758 0.759 7 1.14 0.60 0.63 0.8180 Azerbaijan .. 0.640 0.740 0.745 0.758 0.758 0.757 0.757 –1 .. 1.47 0.32 ..80 Lebanon .. .. 0.758 0.751 0.751 0.752 0.753 0.757 –4 .. .. –0.03 ..80 The former Yugoslav Republic of Macedonia .. 0.669 0.735 0.740 0.747 0.754 0.756 0.757 2 .. 0.94 0.42 ..83 Armenia 0.631 0.647 0.728 0.737 0.745 0.748 0.749 0.755 2 0.26 1.17 0.53 0.6783 Thailand 0.574 0.649 0.724 0.731 0.735 0.741 0.748 0.755 4 1.24 1.10 0.59 1.0285 Algeria 0.577 0.644 0.729 0.740 0.747 0.749 0.752 0.754 –3 1.10 1.24 0.49 0.9986 China 0.502 0.594 0.706 0.722 0.738 0.743 0.748 0.752 7 1.69 1.75 0.90 1.5186 Ecuador 0.643 0.670 0.715 0.726 0.742 0.743 0.749 0.752 4 0.41 0.66 0.72 0.5888 Ukraine 0.705 0.671 0.733 0.743 0.748 0.743 0.746 0.751 –8 –0.50 0.88 0.34 0.2389 Peru 0.611 0.678 0.717 0.729 0.746 0.745 0.748 0.750 0 1.04 0.56 0.64 0.7690 Colombia 0.592 0.653 0.719 0.725 0.738 0.742 0.747 0.747 2 0.98 0.96 0.55 0.8690 Saint Lucia .. 0.690 0.731 0.730 0.737 0.744 0.745 0.747 –2 .. 0.57 0.32 ..92 Fiji 0.643 0.683 0.711 0.719 0.730 0.738 0.738 0.741 5 0.61 0.40 0.59 0.5392 Mongolia 0.579 0.589 0.697 0.720 0.734 0.737 0.743 0.741 4 0.17 1.70 0.87 0.9294 Dominican Republic 0.598 0.657 0.702 0.710 0.718 0.729 0.733 0.736 8 0.94 0.68 0.66 0.7795 Jordan 0.617 0.702 0.728 0.726 0.730 0.733 0.735 0.735 –5 1.31 0.36 0.14 0.6595 Tunisia 0.569 0.653 0.716 0.719 0.725 0.728 0.732 0.735 2 1.39 0.91 0.38 0.9597 Jamaica 0.638 0.662 0.712 0.721 0.728 0.730 0.732 0.732 –3 0.37 0.74 0.40 0.5198 Tonga 0.648 0.673 0.712 0.717 0.717 0.721 0.724 0.726 2 0.38 0.56 0.28 0.4299 Saint Vincent and the Grenadines .. 0.673 0.715 0.718 0.720 0.720 0.721 0.723 0 .. 0.60 0.15 ..
100 Suriname .. .. 0.703 0.711 0.718 0.721 0.719 0.720 1 .. .. 0.33 ..101 Botswana 0.581 0.565 0.660 0.683 0.701 0.706 0.712 0.717 8 –0.28 1.57 1.18 0.78101 Maldives .. 0.606 0.671 0.688 0.705 0.710 0.712 0.717 4 .. 1.03 0.96 ..103 Dominica .. 0.693 0.722 0.721 0.724 0.721 0.718 0.715 –9 .. 0.41 –0.13 ..104 Samoa 0.620 0.647 0.693 0.697 0.703 0.706 0.711 0.713 0 0.42 0.69 0.41 0.52105 Uzbekistan .. 0.595 0.666 0.683 0.695 0.698 0.703 0.710 4 .. 1.14 0.91 ..106 Belize 0.644 0.677 0.699 0.706 0.706 0.709 0.709 0.708 –3 0.51 0.31 0.18 0.35106 Marshall Islands .. .. .. .. .. .. .. 0.708 .. .. .. .. ..108 Libya 0.677 0.727 0.755 0.741 0.695 0.694 0.693 0.706 –26 0.72 0.38 –0.97 0.15108 Turkmenistan .. .. 0.673 0.686 0.697 0.701 0.705 0.706 0 .. .. 0.68 ..110 Gabon 0.620 0.633 0.665 0.678 0.693 0.694 0.698 0.702 3 0.20 0.51 0.77 0.46110 Paraguay 0.580 0.624 0.675 0.680 0.698 0.702 0.702 0.702 2 0.73 0.79 0.57 0.71112 Moldova (Republic of) 0.651 0.597 0.670 0.684 0.696 0.693 0.697 0.700 –3 –0.86 1.15 0.62 0.27MEDIUM HUMAN DEVELOPMENT113 Philippines 0.586 0.624 0.665 0.677 0.689 0.693 0.696 0.699 1 0.64 0.64 0.71 0.66113 South Africa 0.618 0.630 0.649 0.664 0.685 0.692 0.696 0.699 6 0.19 0.30 1.06 0.46115 Egypt 0.546 0.611 0.665 0.675 0.683 0.691 0.694 0.696 0 1.12 0.86 0.64 0.90116 Indonesia 0.528 0.606 0.661 0.675 0.683 0.686 0.691 0.694 –1 1.39 0.88 0.69 1.02116 Viet Nam 0.475 0.579 0.654 0.670 0.678 0.684 0.689 0.694 1 1.99 1.23 0.85 1.41
HUMAN DEVELOPMENT INDICES AND INDICATORS: 2018 STATISTICAL UPDATE
TABLE 2 Human Development Index trends, 1990–2017 | 27

TABLE
2
TABLE 2 HUMAN DEVELOPMENT INDEX TRENDS, 1990–2017
Human Development Index (HDI)Change in HDI rank Average annual HDI growth
Value (%)
HDI rank 1990 2000 2010 2012 2014 2015 2016 2017 2012–2017a 1990–2000 2000–2010 2010–2017 1990–2017
118 Bolivia (Plurinational State of) 0.536 0.608 0.649 0.662 0.675 0.681 0.689 0.693 2 1.27 0.66 0.94 0.96119 Palestine, State of .. .. 0.672 0.687 0.679 0.687 0.689 0.686 –12 .. .. 0.30 ..120 Iraq 0.572 0.607 0.649 0.659 0.666 0.668 0.672 0.685 1 0.60 0.67 0.77 0.67121 El Salvador 0.529 0.615 0.671 0.670 0.670 0.674 0.679 0.674 –4 1.52 0.88 0.07 0.90122 Kyrgyzstan 0.618 0.594 0.636 0.649 0.663 0.666 0.669 0.672 0 –0.39 0.69 0.79 0.31123 Morocco 0.458 0.530 0.616 0.635 0.650 0.655 0.662 0.667 3 1.47 1.51 1.13 1.40124 Nicaragua 0.489 0.570 0.621 0.633 0.649 0.652 0.657 0.658 3 1.54 0.87 0.82 1.10125 Cabo Verde .. 0.570 0.629 0.636 0.644 0.647 0.652 0.654 0 .. 0.99 0.56 ..125 Guyana 0.538 0.604 0.630 0.642 0.648 0.651 0.652 0.654 –2 1.18 0.42 0.52 0.73127 Guatemala 0.478 0.546 0.611 0.613 0.643 0.645 0.649 0.650 4 1.35 1.13 0.89 1.15127 Tajikistan 0.623 0.550 0.634 0.642 0.645 0.645 0.647 0.650 –4 –1.23 1.43 0.36 0.16129 Namibia 0.579 0.558 0.594 0.617 0.636 0.642 0.645 0.647 0 –0.37 0.63 1.21 0.41130 India 0.427 0.493 0.581 0.600 0.618 0.627 0.636 0.640 2 1.45 1.64 1.40 1.51131 Micronesia (Federated States of) .. 0.552 0.608 0.616 0.618 0.627 0.627 0.627 –1 .. 0.98 0.44 ..132 Timor-Leste .. 0.507 0.619 0.599 0.610 0.630 0.631 0.625 1 .. 2.02 0.13 ..133 Honduras 0.506 0.554 0.596 0.597 0.603 0.609 0.614 0.617 2 0.92 0.72 0.50 0.74134 Bhutan .. .. 0.566 0.585 0.599 0.603 0.609 0.612 4 .. .. 1.14 ..134 Kiribati .. 0.552 0.590 0.598 0.616 0.621 0.610 0.612 0 .. 0.67 0.53 ..136 Bangladesh 0.387 0.468 0.545 0.566 0.583 0.592 0.597 0.608 7 1.93 1.54 1.57 1.69137 Congo 0.536 0.490 0.557 0.573 0.595 0.613 0.612 0.606 2 –0.91 1.30 1.21 0.46138 Vanuatu .. .. 0.591 0.592 0.598 0.599 0.600 0.603 –2 .. .. 0.28 ..139 Lao People's Democratic Republic 0.400 0.466 0.546 0.569 0.586 0.593 0.598 0.601 2 1.53 1.59 1.39 1.52140 Ghana 0.455 0.484 0.554 0.570 0.576 0.585 0.588 0.592 0 0.62 1.36 0.94 0.98141 Equatorial Guinea .. 0.516 0.581 0.589 0.590 0.593 0.592 0.591 –4 .. 1.19 0.23 ..142 Kenya 0.468 0.451 0.543 0.559 0.572 0.578 0.585 0.590 3 –0.38 1.88 1.18 0.86143 Sao Tome and Principe 0.452 0.490 0.542 0.551 0.567 0.580 0.584 0.589 4 0.80 1.01 1.21 0.98144 Eswatini (Kingdom of) 0.536 0.471 0.538 0.561 0.580 0.584 0.586 0.588 0 –1.28 1.34 1.28 0.35144 Zambia 0.401 0.432 0.544 0.569 0.580 0.583 0.586 0.588 –3 0.76 2.34 1.11 1.43146 Cambodia 0.364 0.420 0.537 0.553 0.566 0.571 0.576 0.582 0 1.44 2.49 1.15 1.75147 Angola .. 0.387 0.520 0.543 0.564 0.572 0.577 0.581 3 .. 3.00 1.59 ..148 Myanmar 0.358 0.431 0.530 0.549 0.564 0.569 0.574 0.578 0 1.86 2.09 1.25 1.79149 Nepal 0.378 0.446 0.529 0.548 0.560 0.566 0.569 0.574 0 1.66 1.72 1.19 1.56150 Pakistan 0.404 0.450 0.526 0.535 0.548 0.551 0.560 0.562 1 1.08 1.57 0.95 1.23151 Cameroon 0.440 0.431 0.506 0.526 0.543 0.548 0.553 0.556 3 –0.21 1.61 1.35 0.87LOW HUMAN DEVELOPMENT152 Solomon Islands .. 0.450 0.507 0.529 0.539 0.546 0.543 0.546 1 .. 1.19 1.07 ..153 Papua New Guinea 0.380 0.449 0.520 0.530 0.536 0.542 0.543 0.544 –1 1.70 1.48 0.64 1.34154 Tanzania (United Republic of) 0.370 0.395 0.493 0.506 0.515 0.528 0.533 0.538 3 0.65 2.24 1.25 1.39155 Syrian Arab Republic .. 0.590 0.644 0.631 0.550 0.538 0.536 0.536 –27 .. 0.88 –2.60 ..156 Zimbabwe 0.491 0.440 0.467 0.505 0.525 0.529 0.532 0.535 2 –1.07 0.59 1.95 0.32157 Nigeria .. .. 0.484 0.512 0.524 0.527 0.530 0.532 –2 .. .. 1.36 ..158 Rwanda 0.250 0.335 0.485 0.500 0.509 0.510 0.520 0.524 3 2.98 3.77 1.11 2.78159 Lesotho 0.499 0.467 0.493 0.505 0.509 0.511 0.516 0.520 –1 –0.66 0.54 0.77 0.15159 Mauritania 0.374 0.442 0.486 0.499 0.514 0.514 0.516 0.520 3 1.69 0.96 0.95 1.22161 Madagascar .. 0.456 0.504 0.507 0.512 0.514 0.517 0.519 –5 .. 1.01 0.43 ..162 Uganda 0.311 0.398 0.486 0.492 0.500 0.505 0.508 0.516 2 2.51 2.02 0.86 1.90163 Benin 0.348 0.398 0.473 0.489 0.505 0.508 0.512 0.515 2 1.36 1.74 1.22 1.46164 Senegal 0.367 0.380 0.456 0.476 0.486 0.492 0.499 0.505 5 0.36 1.84 1.47 1.20165 Comoros .. .. 0.482 0.493 0.501 0.502 0.502 0.503 –2 .. .. 0.63 ..165 Togo 0.405 0.425 0.456 0.466 0.481 0.495 0.500 0.503 5 0.50 0.71 1.41 0.81167 Sudan 0.331 0.402 0.470 0.485 0.492 0.497 0.499 0.502 –1 1.96 1.58 0.95 1.56168 Afghanistan .. .. 0.463 0.482 0.491 0.493 0.494 0.498 –1 .. .. 1.05 ..168 Haiti 0.409 0.442 0.470 0.481 0.490 0.493 0.496 0.498 0 0.78 0.61 0.83 0.73170 Côte d'Ivoire 0.388 0.394 0.442 0.454 0.465 0.478 0.486 0.492 3 0.16 1.16 1.55 0.89171 Malawi 0.340 0.399 0.441 0.455 0.468 0.470 0.474 0.477 1 1.62 1.01 1.11 1.26172 Djibouti .. 0.363 0.449 0.459 0.467 0.470 0.474 0.476 –1 .. 2.15 0.82 ..173 Ethiopia .. 0.283 0.412 0.430 0.445 0.451 0.457 0.463 3 .. 3.82 1.67 ..174 Gambia 0.333 0.385 0.441 0.445 0.454 0.457 0.457 0.460 0 1.47 1.36 0.61 1.20175 Guinea 0.276 0.329 0.404 0.428 0.440 0.443 0.449 0.459 2 1.75 2.09 1.83 1.90176 Congo (Democratic Republic of the) 0.356 0.333 0.407 0.420 0.436 0.444 0.452 0.457 3 –0.68 2.02 1.70 0.93177 Guinea-Bissau .. .. 0.426 0.437 0.445 0.449 0.453 0.455 –2 .. .. 0.95 ..178 Yemen 0.399 0.443 0.498 0.505 0.505 0.483 0.462 0.452 –20 1.03 1.18 –1.37 0.46179 Eritrea .. .. 0.416 0.422 0.428 0.433 0.436 0.440 –1 .. .. 0.79 ..
28 | HUMAN DEVELOPMENT INDICES AND INDICATORS: 2018 STATISTICAL UPDATE

TABLE
2
Human Development Index (HDI)Change in HDI rank Average annual HDI growth
Value (%)
HDI rank 1990 2000 2010 2012 2014 2015 2016 2017 2012–2017a 1990–2000 2000–2010 2010–2017 1990–2017
180 Mozambique 0.209 0.298 0.403 0.412 0.427 0.432 0.435 0.437 1 3.61 3.09 1.13 2.77181 Liberia .. 0.387 0.407 0.420 0.431 0.432 0.432 0.435 –2 .. 0.50 0.97 ..182 Mali 0.231 0.308 0.403 0.408 0.414 0.418 0.421 0.427 0 2.92 2.72 0.81 2.30183 Burkina Faso .. 0.286 0.375 0.394 0.405 0.412 0.420 0.423 2 .. 2.74 1.76 ..184 Sierra Leone 0.275 0.284 0.385 0.407 0.423 0.413 0.413 0.419 0 0.32 3.10 1.20 1.57185 Burundi 0.297 0.303 0.395 0.408 0.421 0.418 0.418 0.417 –3 0.23 2.68 0.77 1.27186 Chad .. 0.299 0.371 0.391 0.403 0.407 0.405 0.404 0 .. 2.20 1.22 ..187 South Sudan .. .. 0.413 0.388 0.397 0.399 0.394 0.388 0 .. .. –0.91 ..188 Central African Republic 0.317 0.309 0.351 0.365 0.349 0.357 0.362 0.367 0 –0.26 1.27 0.64 0.54189 Niger 0.210 0.252 0.318 0.336 0.345 0.347 0.351 0.354 0 1.82 2.35 1.54 1.95OTHER COUNTRIES OR TERRITORIES
.. Korea (Democratic People's Rep. of) .. .. .. .. .. .. .. .. .. .. .. .. ..
.. Monaco .. .. .. .. .. .. .. .. .. .. .. .. ..
.. Nauru .. .. .. .. .. .. .. .. .. .. .. .. ..
.. San Marino .. .. .. .. .. .. .. .. .. .. .. .. ..
.. Somalia .. .. .. .. .. .. .. .. .. .. .. .. ..
.. Tuvalu .. .. .. .. .. .. .. .. .. .. .. .. ..Human development groups
Very high human development 0.787 0.831 0.873 0.880 0.887 0.890 0.892 0.894 — 0.55 0.50 0.34 0.48High human development 0.571 0.635 0.718 0.732 0.745 0.750 0.754 0.757 — 1.06 1.24 0.76 1.05Medium human development 0.462 0.523 0.596 0.613 0.627 0.634 0.641 0.645 — 1.25 1.32 1.13 1.24Low human development 0.351 0.387 0.472 0.486 0.495 0.498 0.501 0.504 — 1.00 1.99 0.93 1.35
Developing countries 0.515 0.570 0.642 0.657 0.669 0.673 0.678 0.681 — 1.03 1.20 0.84 1.04Regions
Arab States 0.557 0.613 0.675 0.686 0.690 0.694 0.697 0.699 — 0.95 0.96 0.51 0.84East Asia and the Pacific 0.517 0.597 0.692 0.707 0.720 0.725 0.730 0.733 — 1.45 1.48 0.83 1.30Europe and Central Asia 0.653 0.668 0.733 0.749 0.761 0.764 0.767 0.771 — 0.23 0.94 0.71 0.62Latin America and the Caribbean 0.626 0.686 0.731 0.740 0.751 0.754 0.757 0.758 — 0.92 0.65 0.51 0.71South Asia 0.439 0.503 0.584 0.602 0.618 0.625 0.634 0.638 — 1.38 1.51 1.26 1.39Sub-Saharan Africa 0.398 0.421 0.498 0.514 0.526 0.531 0.534 0.537 — 0.57 1.70 1.09 1.12
Least developed countries 0.346 0.400 0.484 0.499 0.511 0.515 0.519 0.524 — 1.47 1.93 1.14 1.55Small island developing states 0.572 0.606 0.659 0.661 0.667 0.673 0.674 0.676 — 0.58 0.84 0.38 0.62Organisation for Economic Co‑operation and Development 0.785 0.835 0.874 0.880 0.886 0.890 0.893 0.895 — 0.62 0.45 0.33 0.49World 0.598 0.642 0.698 0.709 0.718 0.722 0.726 0.728 — 0.72 0.84 0.60 0.73
NOTES
For HDI values that are comparable across years and countries, use this table or the interpolated data at http://hdr.undp.org/en/data, which present trends using consistent data.
a A positive value indicates an improvement in rank.
DEFINITIONS
Human Development Index (HDI): A composite index measuring average achievement in three basic dimensions of human development — a long and healthy life, knowledge and a decent standard of living. See Technical note 1 at http://hdr.undp.org/sites/default/files/hdr2018_technical_notes.pdf for details on how the HDI is calculated.
Average annual HDI growth: A smoothed annualized growth of the HDI in a given period, calculated as the annual compound growth rate.
MAIN DATA SOURCES
Columns 1–8: HDRO calculations based on data from UNDESA (2017a), UNESCO Institute for Statistics (2018), United Nations Statistics Division
(2018b), World Bank (2018b), Barro and Lee (2016) and IMF (2018).
Column 9: Calculated based on data in columns 4 and 8.
Columns 10–13: Calculated based on data in columns 1, 2, 3 and 8.
HUMAN DEVELOPMENT INDICES AND INDICATORS: 2018 STATISTICAL UPDATE
TABLE 2 Human Development Index trends, 1990–2017 | 29
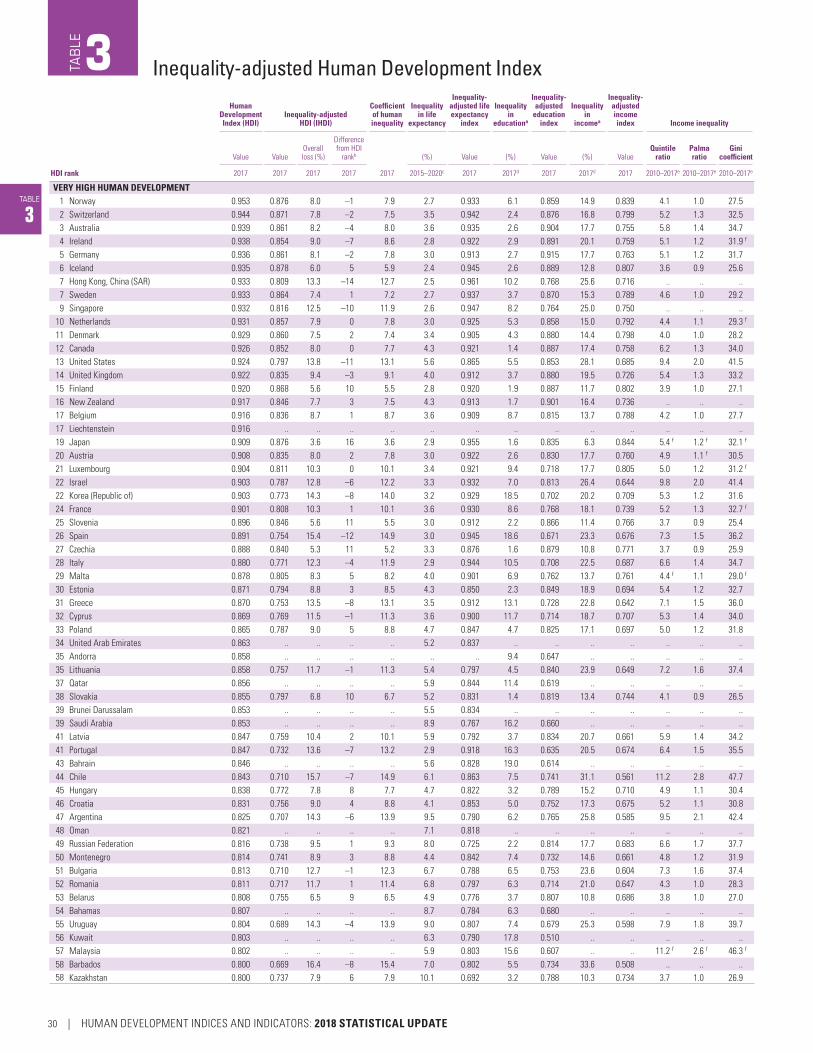
TABLE
3
Human Development Index (HDI)
Inequality‑adjusted HDI (IHDI)
Coefficient of human inequality
Inequality in life
expectancy
Inequality‑adjusted life expectancy
index
Inequality in
educationa
Inequality‑adjusted
education index
Inequality in
incomea
Inequality‑adjusted income index Income inequality
Value ValueOverall loss (%)
Difference from HDI
rankb (%) Value (%) Value (%) ValueQuintile
ratioPalma ratio
Gini coefficient
HDI rank 2017 2017 2017 2017 2017 2015–2020c 2017 2017d 2017 2017d 2017 2010–2017e 2010–2017e 2010–2017e
VERY HIGH HUMAN DEVELOPMENT1 Norway 0.953 0.876 8.0 –1 7.9 2.7 0.933 6.1 0.859 14.9 0.839 4.1 1.0 27.52 Switzerland 0.944 0.871 7.8 –2 7.5 3.5 0.942 2.4 0.876 16.8 0.799 5.2 1.3 32.53 Australia 0.939 0.861 8.2 –4 8.0 3.6 0.935 2.6 0.904 17.7 0.755 5.8 1.4 34.74 Ireland 0.938 0.854 9.0 –7 8.6 2.8 0.922 2.9 0.891 20.1 0.759 5.1 1.2 31.9 f
5 Germany 0.936 0.861 8.1 –2 7.8 3.0 0.913 2.7 0.915 17.7 0.763 5.1 1.2 31.76 Iceland 0.935 0.878 6.0 5 5.9 2.4 0.945 2.6 0.889 12.8 0.807 3.6 0.9 25.67 Hong Kong, China (SAR) 0.933 0.809 13.3 –14 12.7 2.5 0.961 10.2 0.768 25.6 0.716 .. .. ..7 Sweden 0.933 0.864 7.4 1 7.2 2.7 0.937 3.7 0.870 15.3 0.789 4.6 1.0 29.29 Singapore 0.932 0.816 12.5 –10 11.9 2.6 0.947 8.2 0.764 25.0 0.750 .. .. ..
10 Netherlands 0.931 0.857 7.9 0 7.8 3.0 0.925 5.3 0.858 15.0 0.792 4.4 1.1 29.3 f
11 Denmark 0.929 0.860 7.5 2 7.4 3.4 0.905 4.3 0.880 14.4 0.798 4.0 1.0 28.212 Canada 0.926 0.852 8.0 0 7.7 4.3 0.921 1.4 0.887 17.4 0.758 6.2 1.3 34.013 United States 0.924 0.797 13.8 –11 13.1 5.6 0.865 5.5 0.853 28.1 0.685 9.4 2.0 41.514 United Kingdom 0.922 0.835 9.4 –3 9.1 4.0 0.912 3.7 0.880 19.5 0.726 5.4 1.3 33.215 Finland 0.920 0.868 5.6 10 5.5 2.8 0.920 1.9 0.887 11.7 0.802 3.9 1.0 27.116 New Zealand 0.917 0.846 7.7 3 7.5 4.3 0.913 1.7 0.901 16.4 0.736 .. .. ..17 Belgium 0.916 0.836 8.7 1 8.7 3.6 0.909 8.7 0.815 13.7 0.788 4.2 1.0 27.717 Liechtenstein 0.916 .. .. .. .. .. .. .. .. .. .. .. .. ..19 Japan 0.909 0.876 3.6 16 3.6 2.9 0.955 1.6 0.835 6.3 0.844 5.4 f 1.2 f 32.1 f
20 Austria 0.908 0.835 8.0 2 7.8 3.0 0.922 2.6 0.830 17.7 0.760 4.9 1.1 f 30.521 Luxembourg 0.904 0.811 10.3 0 10.1 3.4 0.921 9.4 0.718 17.7 0.805 5.0 1.2 31.2 f
22 Israel 0.903 0.787 12.8 –6 12.2 3.3 0.932 7.0 0.813 26.4 0.644 9.8 2.0 41.422 Korea (Republic of) 0.903 0.773 14.3 –8 14.0 3.2 0.929 18.5 0.702 20.2 0.709 5.3 1.2 31.624 France 0.901 0.808 10.3 1 10.1 3.6 0.930 8.6 0.768 18.1 0.739 5.2 1.3 32.7 f
25 Slovenia 0.896 0.846 5.6 11 5.5 3.0 0.912 2.2 0.866 11.4 0.766 3.7 0.9 25.426 Spain 0.891 0.754 15.4 –12 14.9 3.0 0.945 18.6 0.671 23.3 0.676 7.3 1.5 36.227 Czechia 0.888 0.840 5.3 11 5.2 3.3 0.876 1.6 0.879 10.8 0.771 3.7 0.9 25.928 Italy 0.880 0.771 12.3 –4 11.9 2.9 0.944 10.5 0.708 22.5 0.687 6.6 1.4 34.729 Malta 0.878 0.805 8.3 5 8.2 4.0 0.901 6.9 0.762 13.7 0.761 4.4 f 1.1 29.0 f
30 Estonia 0.871 0.794 8.8 3 8.5 4.3 0.850 2.3 0.849 18.9 0.694 5.4 1.2 32.731 Greece 0.870 0.753 13.5 –8 13.1 3.5 0.912 13.1 0.728 22.8 0.642 7.1 1.5 36.032 Cyprus 0.869 0.769 11.5 –1 11.3 3.6 0.900 11.7 0.714 18.7 0.707 5.3 1.4 34.033 Poland 0.865 0.787 9.0 5 8.8 4.7 0.847 4.7 0.825 17.1 0.697 5.0 1.2 31.834 United Arab Emirates 0.863 .. .. .. .. 5.2 0.837 .. .. .. .. .. .. ..35 Andorra 0.858 .. .. .. .. .. .. 9.4 0.647 .. .. .. .. ..35 Lithuania 0.858 0.757 11.7 –1 11.3 5.4 0.797 4.5 0.840 23.9 0.649 7.2 1.6 37.437 Qatar 0.856 .. .. .. .. 5.9 0.844 11.4 0.619 .. .. .. .. ..38 Slovakia 0.855 0.797 6.8 10 6.7 5.2 0.831 1.4 0.819 13.4 0.744 4.1 0.9 26.539 Brunei Darussalam 0.853 .. .. .. .. 5.5 0.834 .. .. .. .. .. .. ..39 Saudi Arabia 0.853 .. .. .. .. 8.9 0.767 16.2 0.660 .. .. .. .. ..41 Latvia 0.847 0.759 10.4 2 10.1 5.9 0.792 3.7 0.834 20.7 0.661 5.9 1.4 34.241 Portugal 0.847 0.732 13.6 –7 13.2 2.9 0.918 16.3 0.635 20.5 0.674 6.4 1.5 35.543 Bahrain 0.846 .. .. .. .. 5.6 0.828 19.0 0.614 .. .. .. .. ..44 Chile 0.843 0.710 15.7 –7 14.9 6.1 0.863 7.5 0.741 31.1 0.561 11.2 2.8 47.745 Hungary 0.838 0.772 7.8 8 7.7 4.7 0.822 3.2 0.789 15.2 0.710 4.9 1.1 30.446 Croatia 0.831 0.756 9.0 4 8.8 4.1 0.853 5.0 0.752 17.3 0.675 5.2 1.1 30.847 Argentina 0.825 0.707 14.3 –6 13.9 9.5 0.790 6.2 0.765 25.8 0.585 9.5 2.1 42.448 Oman 0.821 .. .. .. .. 7.1 0.818 .. .. .. .. .. .. ..49 Russian Federation 0.816 0.738 9.5 1 9.3 8.0 0.725 2.2 0.814 17.7 0.683 6.6 1.7 37.750 Montenegro 0.814 0.741 8.9 3 8.8 4.4 0.842 7.4 0.732 14.6 0.661 4.8 1.2 31.951 Bulgaria 0.813 0.710 12.7 –1 12.3 6.7 0.788 6.5 0.753 23.6 0.604 7.3 1.6 37.452 Romania 0.811 0.717 11.7 1 11.4 6.8 0.797 6.3 0.714 21.0 0.647 4.3 1.0 28.353 Belarus 0.808 0.755 6.5 9 6.5 4.9 0.776 3.7 0.807 10.8 0.686 3.8 1.0 27.054 Bahamas 0.807 .. .. .. .. 8.7 0.784 6.3 0.680 .. .. .. .. ..55 Uruguay 0.804 0.689 14.3 –4 13.9 9.0 0.807 7.4 0.679 25.3 0.598 7.9 1.8 39.756 Kuwait 0.803 .. .. .. .. 6.3 0.790 17.8 0.510 .. .. .. .. ..57 Malaysia 0.802 .. .. .. .. 5.9 0.803 15.6 0.607 .. .. 11.2 f 2.6 f 46.3 f
58 Barbados 0.800 0.669 16.4 –8 15.4 7.0 0.802 5.5 0.734 33.6 0.508 .. .. ..58 Kazakhstan 0.800 0.737 7.9 6 7.9 10.1 0.692 3.2 0.788 10.3 0.734 3.7 1.0 26.9
Inequality-adjusted Human Development IndexTAB
LE3
30 | HUMAN DEVELOPMENT INDICES AND INDICATORS: 2018 STATISTICAL UPDATE

TABLE
3
Human Development Index (HDI)
Inequality‑adjusted HDI (IHDI)
Coefficient of human inequality
Inequality in life
expectancy
Inequality‑adjusted life expectancy
index
Inequality in
educationa
Inequality‑adjusted
education index
Inequality in
incomea
Inequality‑adjusted income index Income inequality
Value ValueOverall loss (%)
Difference from HDI
rankb (%) Value (%) Value (%) ValueQuintile
ratioPalma ratio
Gini coefficient
HDI rank 2017 2017 2017 2017 2017 2015–2020c 2017 2017d 2017 2017d 2017 2010–2017e 2010–2017e 2010–2017e
HIGH HUMAN DEVELOPMENT60 Iran (Islamic Republic of) 0.798 0.707 11.4 3 11.2 9.0 0.786 4.9 0.705 19.7 0.637 7.2 1.7 38.860 Palau 0.798 .. .. .. .. .. .. 1.9 0.828 .. .. .. .. ..62 Seychelles 0.797 .. .. .. .. 7.7 0.763 .. .. 29.3 0.594 9.8 2.6 46.863 Costa Rica 0.794 0.651 18.0 –10 17.3 7.5 0.854 11.9 0.634 32.4 0.509 12.9 3.0 48.7 f
64 Turkey 0.791 0.669 15.4 –4 15.3 9.6 0.779 13.5 0.595 22.6 0.644 8.5 2.1 41.965 Mauritius 0.790 0.683 13.5 1 13.4 8.9 0.769 13.2 0.633 18.2 0.656 5.9 1.5 35.866 Panama 0.789 0.623 21.1 –14 20.2 11.5 0.792 12.5 0.605 36.5 0.504 16.6 3.4 50.467 Serbia 0.787 0.667 15.2 –3 14.6 7.1 0.791 8.1 0.714 28.7 0.525 4.2 1.0 28.568 Albania 0.785 0.706 10.0 7 10.0 9.2 0.817 8.5 0.681 12.2 0.633 4.3 1.0 29.069 Trinidad and Tobago 0.784 .. .. .. .. 15.6 0.659 .. .. 21.9 0.667 .. .. ..70 Antigua and Barbuda 0.780 .. .. .. .. 7.5 0.804 .. .. .. .. .. .. ..70 Georgia 0.780 0.682 12.6 4 12.0 8.1 0.756 2.2 0.826 25.7 0.508 6.5 1.5 36.572 Saint Kitts and Nevis 0.778 .. .. .. .. .. .. .. .. .. .. .. .. ..73 Cuba 0.777 .. .. .. .. 5.3 0.873 10.9 0.695 .. .. .. .. ..74 Mexico 0.774 0.609 21.3 –13 20.8 12.3 0.773 17.1 0.562 32.8 0.521 8.8 2.3 43.475 Grenada 0.772 .. .. .. .. 8.0 0.761 .. .. .. .. .. .. ..76 Sri Lanka 0.770 0.664 13.8 0 13.6 7.1 0.793 12.8 0.653 21.0 0.564 6.8 1.9 39.877 Bosnia and Herzegovina 0.768 0.649 15.5 –2 15.3 5.9 0.826 19.8 0.576 20.2 0.574 5.3 1.3 32.778 Venezuela (Bolivarian Republic of) 0.761 0.636 16.5 –4 16.2 10.5 0.754 12.9 0.645 25.2 0.528 15.8 f 2.8 f 46.9 f
79 Brazil 0.759 0.578 23.9 –17 23.2 10.8 0.765 22.0 0.535 36.7 0.471 15.6 3.5 51.380 Azerbaijan 0.757 0.681 10.0 9 9.9 17.0 0.666 3.8 0.682 8.9 0.695 2.3 f 0.6 f 16.6 f
80 Lebanon 0.757 .. .. .. .. 6.7 0.858 6.2 0.598 .. .. 5.1 1.2 31.880 The former Yugoslav Republic of Macedonia 0.757 0.661 12.6 3 12.4 6.5 0.803 10.5 0.618 20.3 0.582 7.3 1.4 35.683 Armenia 0.755 0.680 10.0 10 9.8 9.0 0.767 2.9 0.727 17.4 0.563 5.1 1.3 32.583 Thailand 0.755 0.636 15.7 0 15.5 9.3 0.774 13.3 0.573 23.8 0.581 6.5 1.7 37.885 Algeria 0.754 0.598 20.7 –9 20.1 15.1 0.735 33.7 0.441 11.4 0.660 4.0 1.0 27.686 China 0.752 0.643 14.5 5 14.2 7.9 0.799 11.5 0.571 23.3 0.582 9.2 2.1 42.286 Ecuador 0.752 0.603 19.8 –7 19.4 13.9 0.749 13.8 0.601 30.5 0.487 10.7 2.4 45.088 Ukraine 0.751 0.701 6.6 20 6.5 7.5 0.742 3.6 0.766 8.5 0.608 3.5 0.9 25.089 Peru 0.750 0.606 19.2 –2 18.9 13.2 0.737 15.3 0.583 28.3 0.517 10.6 2.3 43.890 Colombia 0.747 0.571 23.6 –12 22.9 13.2 0.729 19.4 0.545 36.2 0.468 14.3 3.4 50.890 Saint Lucia 0.747 0.622 16.7 3 16.3 9.0 0.780 12.6 0.591 27.4 0.522 .. .. ..92 Fiji 0.741 .. .. .. .. 10.9 0.691 .. .. .. .. 5.8 1.6 36.492 Mongolia 0.741 0.639 13.7 10 13.7 13.4 0.659 11.9 0.675 15.7 0.588 5.1 1.3 32.394 Dominican Republic 0.736 0.581 21.0 –3 20.8 15.4 0.703 19.1 0.520 28.1 0.536 10.4 2.5 45.395 Jordan 0.735 0.617 16.1 6 16.0 10.7 0.748 16.9 0.591 20.5 0.531 5.2 1.4 33.795 Tunisia 0.735 0.573 22.0 –7 21.4 10.7 0.769 34.6 0.431 18.9 0.568 6.4 1.5 35.897 Jamaica 0.732 0.608 17.0 6 16.2 11.0 0.768 5.6 0.652 32.0 0.448 .. .. ..98 Tonga 0.726 .. .. .. .. 13.0 0.712 4.5 0.736 .. .. 6.7 f 1.6 f 37.5 f
99 Saint Vincent and the Grenadines 0.723 .. .. .. .. 11.9 0.722 .. .. .. .. .. .. ..100 Suriname 0.720 0.557 22.6 –8 21.8 12.4 0.694 15.6 0.537 37.3 0.463 .. .. ..101 Botswana 0.717 .. .. .. .. 18.6 0.596 .. .. .. .. 23.2 f 5.8 f 60.5 f
101 Maldives 0.717 0.549 23.4 –9 22.0 5.7 0.836 40.0 0.336 20.5 0.590 7.0 f 1.7 f 38.4 f
103 Dominica 0.715 .. .. .. .. .. .. .. .. .. .. .. .. ..104 Samoa 0.713 .. .. .. .. 11.4 0.753 4.9 0.658 .. .. 7.7 f 2.1 f 42.0 f
105 Uzbekistan 0.710 .. .. .. .. 17.0 0.657 0.8 0.712 .. .. .. .. ..106 Belize 0.708 0.550 22.3 –7 21.3 10.1 0.700 15.9 0.593 37.9 0.401 .. .. ..106 Marshall Islands 0.708 .. .. .. .. .. .. .. .. .. .. .. .. ..108 Libya 0.706 .. .. .. .. 14.1 0.689 .. .. .. .. .. .. ..108 Turkmenistan 0.706 0.575 18.5 2 17.9 23.4 0.565 3.6 0.604 26.8 0.558 .. .. ..110 Gabon 0.702 0.545 22.3 –8 22.3 23.1 0.550 23.5 0.481 20.4 0.613 8.4 f 2.1 f 42.2 f
110 Paraguay 0.702 0.522 25.5 –11 24.8 18.0 0.671 16.7 0.525 39.5 0.404 11.8 2.9 47.9112 Moldova (Republic of) 0.700 0.627 10.4 18 10.3 9.6 0.719 7.3 0.658 14.0 0.522 3.7 0.9 26.3MEDIUM HUMAN DEVELOPMENT113 Philippines 0.699 0.574 17.9 5 17.6 14.4 0.648 11.6 0.584 26.8 0.500 7.2 1.9 40.1113 South Africa 0.699 0.467 33.2 –17 30.3 20.3 0.532 14.3 0.607 56.4 0.315 28.4 7.0 63.0 f
115 Egypt 0.696 0.493 29.2 –10 28.3 11.6 0.703 36.9 0.381 36.3 0.446 4.6 1.3 31.8116 Indonesia 0.694 0.563 18.8 4 18.7 14.8 0.647 16.5 0.520 24.9 0.532 6.6 1.8 39.5116 Viet Nam 0.694 0.574 17.3 8 17.3 12.7 0.758 17.6 0.515 21.4 0.483 5.9 1.4 34.8
HUMAN DEVELOPMENT INDICES AND INDICATORS: 2018 STATISTICAL UPDATE
TABLE 3 Inequality-adjusted Human Development Index | 31
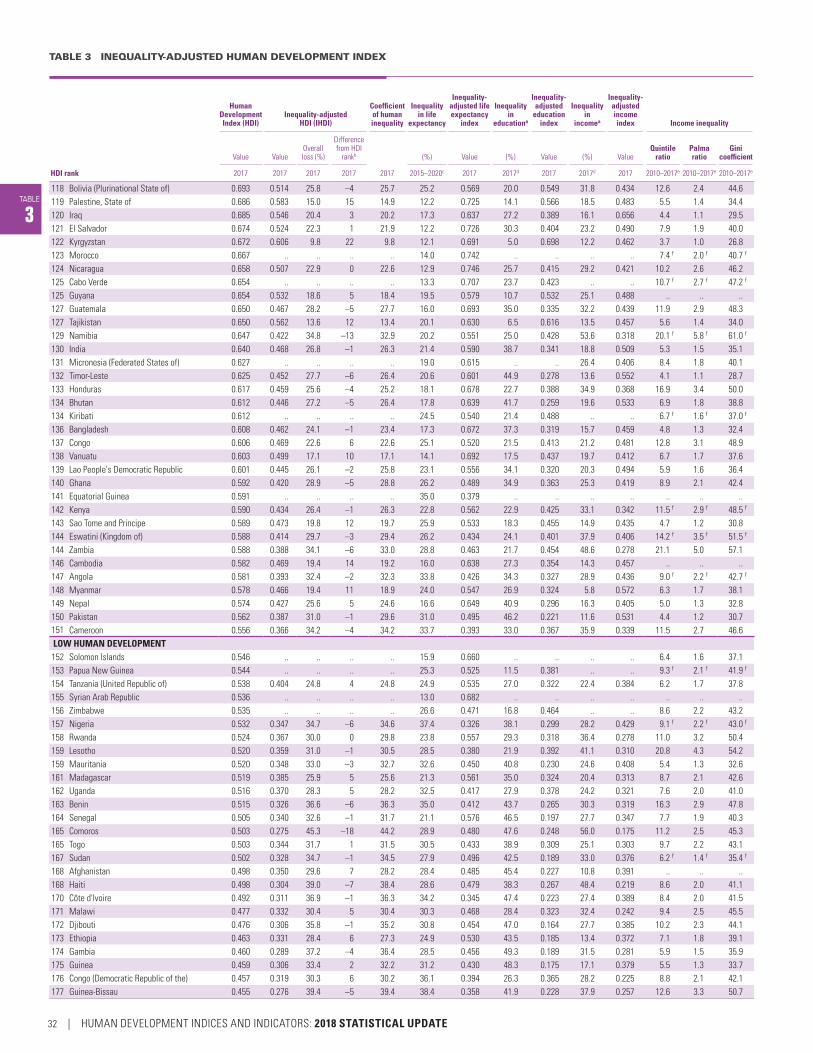
TABLE 3 INEQUALITY-ADJUSTED HUMAN DEVELOPMENT INDEX
TABLE
3
Human Development Index (HDI)
Inequality‑adjusted HDI (IHDI)
Coefficient of human inequality
Inequality in life
expectancy
Inequality‑adjusted life expectancy
index
Inequality in
educationa
Inequality‑adjusted
education index
Inequality in
incomea
Inequality‑adjusted income index Income inequality
Value ValueOverall loss (%)
Difference from HDI
rankb (%) Value (%) Value (%) ValueQuintile
ratioPalma ratio
Gini coefficient
HDI rank 2017 2017 2017 2017 2017 2015–2020c 2017 2017d 2017 2017d 2017 2010–2017e 2010–2017e 2010–2017e
118 Bolivia (Plurinational State of) 0.693 0.514 25.8 –4 25.7 25.2 0.569 20.0 0.549 31.8 0.434 12.6 2.4 44.6119 Palestine, State of 0.686 0.583 15.0 15 14.9 12.2 0.725 14.1 0.566 18.5 0.483 5.5 1.4 34.4120 Iraq 0.685 0.546 20.4 3 20.2 17.3 0.637 27.2 0.389 16.1 0.656 4.4 1.1 29.5121 El Salvador 0.674 0.524 22.3 1 21.9 12.2 0.726 30.3 0.404 23.2 0.490 7.9 1.9 40.0122 Kyrgyzstan 0.672 0.606 9.8 22 9.8 12.1 0.691 5.0 0.698 12.2 0.462 3.7 1.0 26.8123 Morocco 0.667 .. .. .. .. 14.0 0.742 .. .. .. .. 7.4 f 2.0 f 40.7 f
124 Nicaragua 0.658 0.507 22.9 0 22.6 12.9 0.746 25.7 0.415 29.2 0.421 10.2 2.6 46.2125 Cabo Verde 0.654 .. .. .. .. 13.3 0.707 23.7 0.423 .. .. 10.7 f 2.7 f 47.2 f
125 Guyana 0.654 0.532 18.6 5 18.4 19.5 0.579 10.7 0.532 25.1 0.488 .. .. ..127 Guatemala 0.650 0.467 28.2 –5 27.7 16.0 0.693 35.0 0.335 32.2 0.439 11.9 2.9 48.3127 Tajikistan 0.650 0.562 13.6 12 13.4 20.1 0.630 6.5 0.616 13.5 0.457 5.6 1.4 34.0129 Namibia 0.647 0.422 34.8 –13 32.9 20.2 0.551 25.0 0.428 53.6 0.318 20.1 f 5.8 f 61.0 f
130 India 0.640 0.468 26.8 –1 26.3 21.4 0.590 38.7 0.341 18.8 0.509 5.3 1.5 35.1131 Micronesia (Federated States of) 0.627 .. .. .. .. 19.0 0.615 .. .. 26.4 0.406 8.4 1.8 40.1132 Timor-Leste 0.625 0.452 27.7 –6 26.4 20.6 0.601 44.9 0.278 13.6 0.552 4.1 1.1 28.7133 Honduras 0.617 0.459 25.6 –4 25.2 18.1 0.678 22.7 0.388 34.9 0.368 16.9 3.4 50.0134 Bhutan 0.612 0.446 27.2 –5 26.4 17.8 0.639 41.7 0.259 19.6 0.533 6.9 1.8 38.8134 Kiribati 0.612 .. .. .. .. 24.5 0.540 21.4 0.488 .. .. 6.7 f 1.6 f 37.0 f
136 Bangladesh 0.608 0.462 24.1 –1 23.4 17.3 0.672 37.3 0.319 15.7 0.459 4.8 1.3 32.4137 Congo 0.606 0.469 22.6 6 22.6 25.1 0.520 21.5 0.413 21.2 0.481 12.8 3.1 48.9138 Vanuatu 0.603 0.499 17.1 10 17.1 14.1 0.692 17.5 0.437 19.7 0.412 6.7 1.7 37.6139 Lao People's Democratic Republic 0.601 0.445 26.1 –2 25.8 23.1 0.556 34.1 0.320 20.3 0.494 5.9 1.6 36.4140 Ghana 0.592 0.420 28.9 –5 28.8 26.2 0.489 34.9 0.363 25.3 0.419 8.9 2.1 42.4141 Equatorial Guinea 0.591 .. .. .. .. 35.0 0.379 .. .. .. .. .. .. ..142 Kenya 0.590 0.434 26.4 –1 26.3 22.8 0.562 22.9 0.425 33.1 0.342 11.5 f 2.9 f 48.5 f
143 Sao Tome and Principe 0.589 0.473 19.8 12 19.7 25.9 0.533 18.3 0.455 14.9 0.435 4.7 1.2 30.8144 Eswatini (Kingdom of) 0.588 0.414 29.7 –3 29.4 26.2 0.434 24.1 0.401 37.9 0.406 14.2 f 3.5 f 51.5 f
144 Zambia 0.588 0.388 34.1 –6 33.0 28.8 0.463 21.7 0.454 48.6 0.278 21.1 5.0 57.1146 Cambodia 0.582 0.469 19.4 14 19.2 16.0 0.638 27.3 0.354 14.3 0.457 .. .. ..147 Angola 0.581 0.393 32.4 –2 32.3 33.8 0.426 34.3 0.327 28.9 0.436 9.0 f 2.2 f 42.7 f
148 Myanmar 0.578 0.466 19.4 11 18.9 24.0 0.547 26.9 0.324 5.8 0.572 6.3 1.7 38.1149 Nepal 0.574 0.427 25.6 5 24.6 16.6 0.649 40.9 0.296 16.3 0.405 5.0 1.3 32.8150 Pakistan 0.562 0.387 31.0 –1 29.6 31.0 0.495 46.2 0.221 11.6 0.531 4.4 1.2 30.7151 Cameroon 0.556 0.366 34.2 –4 34.2 33.7 0.393 33.0 0.367 35.9 0.339 11.5 2.7 46.6LOW HUMAN DEVELOPMENT152 Solomon Islands 0.546 .. .. .. .. 15.9 0.660 .. .. .. .. 6.4 1.6 37.1153 Papua New Guinea 0.544 .. .. .. .. 25.3 0.525 11.5 0.381 .. .. 9.3 f 2.1 f 41.9 f
154 Tanzania (United Republic of) 0.538 0.404 24.8 4 24.8 24.9 0.535 27.0 0.322 22.4 0.384 6.2 1.7 37.8155 Syrian Arab Republic 0.536 .. .. .. .. 13.0 0.682 .. .. .. .. .. .. ..156 Zimbabwe 0.535 .. .. .. .. 26.6 0.471 16.8 0.464 .. .. 8.6 2.2 43.2157 Nigeria 0.532 0.347 34.7 –6 34.6 37.4 0.326 38.1 0.299 28.2 0.429 9.1 f 2.2 f 43.0 f
158 Rwanda 0.524 0.367 30.0 0 29.8 23.8 0.557 29.3 0.318 36.4 0.278 11.0 3.2 50.4159 Lesotho 0.520 0.359 31.0 –1 30.5 28.5 0.380 21.9 0.392 41.1 0.310 20.8 4.3 54.2159 Mauritania 0.520 0.348 33.0 –3 32.7 32.6 0.450 40.8 0.230 24.6 0.408 5.4 1.3 32.6161 Madagascar 0.519 0.385 25.9 5 25.6 21.3 0.561 35.0 0.324 20.4 0.313 8.7 2.1 42.6162 Uganda 0.516 0.370 28.3 5 28.2 32.5 0.417 27.9 0.378 24.2 0.321 7.6 2.0 41.0163 Benin 0.515 0.326 36.6 –6 36.3 35.0 0.412 43.7 0.265 30.3 0.319 16.3 2.9 47.8164 Senegal 0.505 0.340 32.6 –1 31.7 21.1 0.576 46.5 0.197 27.7 0.347 7.7 1.9 40.3165 Comoros 0.503 0.275 45.3 –18 44.2 28.9 0.480 47.6 0.248 56.0 0.175 11.2 2.5 45.3165 Togo 0.503 0.344 31.7 1 31.5 30.5 0.433 38.9 0.309 25.1 0.303 9.7 2.2 43.1167 Sudan 0.502 0.328 34.7 –1 34.5 27.9 0.496 42.5 0.189 33.0 0.376 6.2 f 1.4 f 35.4 f
168 Afghanistan 0.498 0.350 29.6 7 28.2 28.4 0.485 45.4 0.227 10.8 0.391 .. .. ..168 Haiti 0.498 0.304 39.0 –7 38.4 28.6 0.479 38.3 0.267 48.4 0.219 8.6 2.0 41.1170 Côte d'Ivoire 0.492 0.311 36.9 –1 36.3 34.2 0.345 47.4 0.223 27.4 0.389 8.4 2.0 41.5171 Malawi 0.477 0.332 30.4 5 30.4 30.3 0.468 28.4 0.323 32.4 0.242 9.4 2.5 45.5172 Djibouti 0.476 0.306 35.8 –1 35.2 30.8 0.454 47.0 0.164 27.7 0.385 10.2 2.3 44.1173 Ethiopia 0.463 0.331 28.4 6 27.3 24.9 0.530 43.5 0.185 13.4 0.372 7.1 1.8 39.1174 Gambia 0.460 0.289 37.2 –4 36.4 28.5 0.456 49.3 0.189 31.5 0.281 5.9 1.5 35.9175 Guinea 0.459 0.306 33.4 2 32.2 31.2 0.430 48.3 0.175 17.1 0.379 5.5 1.3 33.7176 Congo (Democratic Republic of the) 0.457 0.319 30.3 6 30.2 36.1 0.394 26.3 0.365 28.2 0.225 8.8 2.1 42.1177 Guinea-Bissau 0.455 0.276 39.4 –5 39.4 38.4 0.358 41.9 0.228 37.9 0.257 12.6 3.3 50.7
32 | HUMAN DEVELOPMENT INDICES AND INDICATORS: 2018 STATISTICAL UPDATE

TABLE
3
Human Development Index (HDI)
Inequality‑adjusted HDI (IHDI)
Coefficient of human inequality
Inequality in life
expectancy
Inequality‑adjusted life expectancy
index
Inequality in
educationa
Inequality‑adjusted
education index
Inequality in
incomea
Inequality‑adjusted income index Income inequality
Value ValueOverall loss (%)
Difference from HDI
rankb (%) Value (%) Value (%) ValueQuintile
ratioPalma ratio
Gini coefficient
HDI rank 2017 2017 2017 2017 2017 2015–2020c 2017 2017d 2017 2017d 2017 2010–2017e 2010–2017e 2010–2017e
178 Yemen 0.452 0.308 31.9 6 30.9 24.9 0.522 46.1 0.188 21.8 0.297 6.1 1.6 36.7179 Eritrea 0.440 .. .. .. .. 21.4 0.551 .. .. .. .. .. .. ..180 Mozambique 0.437 0.294 32.7 2 32.6 35.6 0.385 33.8 0.255 28.4 0.259 14.2 3.9 54.0181 Liberia 0.435 0.298 31.6 4 31.0 27.5 0.480 42.9 0.248 22.7 0.221 5.4 1.3 33.2182 Mali 0.427 0.282 34.0 1 32.8 36.8 0.374 46.2 0.158 15.4 0.380 5.2 f 1.3 f 33.0 f
183 Burkina Faso 0.423 0.288 32.1 3 31.8 32.0 0.427 39.2 0.174 24.2 0.321 5.3 1.5 35.3184 Sierra Leone 0.419 0.266 36.5 –1 35.4 39.8 0.298 47.3 0.206 19.2 0.307 5.4 1.4 34.0185 Burundi 0.417 0.278 33.3 3 32.8 38.1 0.361 39.5 0.256 20.9 0.233 6.7 1.7 38.6186 Chad 0.404 0.249 38.3 –1 37.9 42.4 0.294 43.0 0.170 28.4 0.310 10.0 2.2 43.3187 South Sudan 0.388 0.247 36.3 –1 36.3 37.0 0.361 39.6 0.180 32.3 0.232 13.0 f 2.7 f 46.3 f
188 Central African Republic 0.367 0.212 42.1 –1 41.8 41.7 0.295 34.5 0.223 49.2 0.145 18.5 f 4.5 f 56.2 f
189 Niger 0.354 0.250 29.3 3 28.8 34.9 0.405 35.0 0.139 16.4 0.278 5.4 1.4 34.3OTHER COUNTRIES OR TERRITORIES
.. Korea (Democratic People's Rep. of) .. .. .. .. .. 11.6 0.706 .. .. .. .. .. .. ..
.. Monaco .. .. .. .. .. .. .. .. .. .. .. .. .. ..
.. Nauru .. .. .. .. .. .. .. .. .. .. .. .. .. ..
.. San Marino .. .. .. .. .. .. .. .. .. .. .. .. .. ..
.. Somalia .. .. .. .. .. 38.9 0.345 .. .. .. .. .. .. ..
.. Tuvalu .. .. .. .. .. .. .. 10.5 .. 23.4 0.472 7.0 1.8 39.1Human development groups
Very high human development 0.894 0.799 10.7 — 10.4 5.0 0.870 6.3 0.810 20.1 0.723 — — —High human development 0.757 0.636 16.0 — 15.7 9.2 0.782 13.1 0.579 24.8 0.569 — — —Medium human development 0.645 0.483 25.1 — 24.9 20.3 0.602 33.1 0.372 21.2 0.503 — — —Low human development 0.504 0.347 31.1 — 30.9 31.2 0.431 37.0 0.263 24.6 0.368 — — —
Developing countries 0.681 0.531 22.0 — 21.9 17.4 0.644 25.3 0.435 23.1 0.535 — — —Regions
Arab States 0.699 0.523 25.1 — 24.8 15.7 0.668 32.6 0.381 26.1 0.564 — — —East Asia and the Pacific 0.733 0.619 15.6 — 15.4 10.0 0.757 13.1 0.548 23.1 0.572 — — —Europe and Central Asia 0.771 0.681 11.7 — 11.6 10.9 0.732 7.2 0.680 16.7 0.633 — — —Latin America and the Caribbean 0.758 0.593 21.8 — 21.2 12.1 0.753 18.4 0.558 33.2 0.496 — — —South Asia 0.638 0.471 26.1 — 25.6 21.4 0.596 37.7 0.338 17.6 0.519 — — —Sub-Saharan Africa 0.537 0.372 30.8 — 30.7 30.8 0.434 33.7 0.308 27.7 0.385 — — —
Least developed countries 0.524 0.375 28.5 — 28.2 27.1 0.502 36.2 0.274 21.4 0.382 — — —Small island developing states 0.676 0.508 24.9 — 24.5 17.8 0.646 20.9 0.475 34.9 0.427 — — —Organisation for Economic Co‑operation and Development 0.895 0.788 11.9 — 11.6 5.3 0.883 7.7 0.785 21.7 0.708 — — —World 0.728 0.582 20.0 — 19.9 15.2 0.681 22.0 0.493 22.6 0.588 — — —
NOTES
a See http://hdr.undp.org/en/composite/IHDI for the list of surveys used to estimate inequalities.
b Based on countries for which an Inequality-adjusted Human Development Index value is calculated.
c Calculated by HDRO from the 2015–2020 period life tables from UNDESA (2017a).
d Data refer to 2017 or the most recent year available.
e Data refer to the most recent year available during the period specified.
f Data refer to a year earlier than 2010.
DEFINITIONS
Human Development Index (HDI): A composite index measuring average achievement in three basic dimensions of human development — a long and healthy life, knowledge and a decent standard of living. See Technical note 1 at http://hdr.undp.org/sites/default/files/hdr2018_technical_notes.pdf for details on how the HDI is calculated.
Inequality‑adjusted HDI (IHDI): HDI value adjusted for inequalities in the three basic dimensions of human development. See Technical note 2 at http://hdr.undp.org/sites/default/files/hdr2018_technical_notes.pdf for details on how the IHDI is calculated.
Overall loss: Percentage difference between the IHDI value and the HDI value.
Difference from HDI rank: Difference in ranks on the IHDI and the HDI, calculated only for countries for which an IHDI value is calculated.
Coefficient of human inequality: Average inequality in three basic dimensions of human development.
Inequality in life expectancy: Inequality in distribution of expected length of life based on data from life tables estimated using the Atkinson inequality index.
Inequality‑adjusted life expectancy index: HDI life expectancy index value adjusted for inequality in distribution of expected length of life based on data from life tables listed in Main data sources.
Inequality in education: Inequality in distribution of years of schooling based on data from household surveys estimated using the Atkinson inequality index.
Inequality‑adjusted education index: HDI education index value adjusted for inequality in distribution of years of schooling based on data from household surveys listed in Main data sources.
Inequality in income: Inequality in income distribution based on data from household surveys estimated using the Atkinson inequality index.
Inequality‑adjusted income index: HDI income index value adjusted for inequality in income distribution based on data from household surveys listed in Main data sources.
Quintile ratio: Ratio of the average income of the richest 20 percent of the population to the average income of the poorest 20 percent of the population.
Palma ratio: Ratio of the richest 10 percent of the population’s share of gross national income (GNI) divided by the poorest 40 percent’s share. It is based on the work of Palma (2011).
Gini coefficient: Measure of the deviation of the distribution of income among individuals or households within a country from a perfectly equal distribution. A value of 0 represents absolute equality, a value of 100 absolute inequality.
MAIN DATA SOURCES
Column 1: HDRO calculations based on data from UNDESA (2017a), UNESCO Institute for Statistics (2018), United Nations Statistics Division (2018b), World Bank (2018b), Barro and Lee (2016) and IMF (2018).
Column 2: Calculated as the geometric mean of the values in inequality-adjusted life expectancy index, inequality-adjusted education index and inequality-adjusted income index using the methodology in Technical note 2 (available at http://hdr.undp.org/sites/default/files/hdr2018_technical_notes.pdf).
Column 3: Calculated based on data in columns 1 and 2.
Column 4: Calculated based on IHDI values and recalculated HDI ranks for countries for which an IHDI value is calculated.
Column 5: Calculated as the arithmetic mean of the values in inequality in life expectancy, inequality in education and inequality in income using the methodology in Technical note 2 (available at http://hdr.undp.org/sites/default/files/hdr2018_technical_notes.pdf).
Column 6: Calculated based on abridged life tables from UNDESA (2017a).
Column 7: Calculated based on inequality in life expectancy and the HDI life expectancy index.
Columns 8 and 10: Calculated based on data from the Luxembourg Income Study database, Eurostat’s European Union Statistics on Income and Living Conditions, the World Bank’s International Income Distribution Database, the Center for Distributive, Labor and Social Studies and the World Bank’s Socio-Economic Database for Latin America and the Caribbean, ICF Macro Demographic and Health Surveys and United Nations Children’s Fund Multiple Indicator Cluster Surveys using the methodology in Technical note 2 (available at http://hdr.undp.org/sites/default/files/hdr2018_technical_notes.pdf).
Column 9: Calculated based on inequality in education and the HDI education index.
Column 11: Calculated based on inequality in income and the HDI income index.
Columns 12 and 13: HDRO calculations based on data from World Bank (2018a).
Column 14: World Bank (2018a).
HUMAN DEVELOPMENT INDICES AND INDICATORS: 2018 STATISTICAL UPDATE
TABLE 3 Inequality-adjusted Human Development Index | 33

TABLE
4
SDG 3 SDG 4.3 SDG 4.6 SDG 8.5
Gender Development Index
Human Development Index (HDI)
Life expectancy at birth
Expected years of schooling
Mean years of schooling
Estimated gross national income per capitaa
Value Groupb
Value (years) (years) (years) (2011 PPP $)
Female Male Female Male Female Male Female Male Female Male
HDI rank 2017 2017 2017 2017 2017 2017 2017c 2017c 2017c 2017c 2017 2017
VERY HIGH HUMAN DEVELOPMEN71 Norway 0.991 1 0.945 0.953 84.2 80.5 18.6 d 17.2 12.6 12.5 60,153 75,731 e
2 Switzerland 0.987 1 0.937 0.949 85.3 81.5 16.1 16.3 13.9 12.9 47,938 67,4903 Australia 0.975 2 0.926 0.950 85.0 81.2 23.3 d 22.5 d 12.9 12.8 35,323 51,8574 Ireland 0.979 1 0.926 0.946 83.6 79.7 19.7 d 19.5 d 12.7 f 12.1 f 42,771 64,9165 Germany 0.967 2 0.919 0.951 83.5 78.9 16.9 17.0 13.6 14.5 37,689 54,8436 Iceland 0.966 2 0.920 0.952 84.4 81.5 20.5 d 18.2 d 12.3 f 12.7 f 38,004 53,5627 Hong Kong, China (SAR) 0.965 2 0.916 0.949 87.1 81.2 16.3 16.4 11.6 12.5 43,813 75,577 e
7 Sweden 0.992 1 0.927 0.934 84.3 80.9 18.4 d 16.9 12.5 12.3 41,743 53,7779 Singapore 0.982 1 0.922 0.939 85.2 81.1 16.4 g 16.0 g 11.0 12.1 69,508 95,809 e
10 Netherlands 0.966 2 0.913 0.944 83.7 80.3 18.3 d 17.8 11.9 12.5 38,767 57,12311 Denmark 0.980 1 0.919 0.938 82.8 79.0 19.8 d 18.4 d 12.7 h 12.4 h 40,293 55,62412 Canada 0.986 1 0.916 0.930 84.4 80.7 16.9 f 16.0 f 13.3 12.9 34,928 52,07013 United States 0.992 1 0.919 0.926 81.8 77.3 17.2 15.7 13.4 13.3 43,899 66,20814 United Kingdom 0.960 2 0.903 0.941 83.4 79.9 17.9 17.0 12.8 h 13.5 h 28,043 50,48515 Finland 1.000 1 0.917 0.917 84.3 78.7 18.4 d 16.9 12.6 12.3 34,504 47,69116 New Zealand 0.966 2 0.900 0.932 83.7 80.4 19.7 d 18.0 12.7 12.5 25,872 42,33917 Belgium 0.971 2 0.901 0.928 83.6 78.9 20.8 d 18.8 d 11.6 11.9 33,260 51,30217 Liechtenstein .. .. .. .. .. .. 13.4 16.1 .. .. .. ..19 Japan 0.975 1 0.894 0.917 87.1 80.7 15.2 15.3 12.9 i 12.5 i 27,209 51,32620 Austria 0.971 2 0.893 0.920 84.1 79.4 16.4 15.8 11.8 12.6 35,626 55,59121 Luxembourg 0.969 2 0.888 0.916 84.1 79.8 14.1 13.9 11.7 h 12.4 h 51,154 78,737 e
22 Israel 0.975 2 0.890 0.913 84.3 80.9 16.5 15.3 13.0 13.0 24,620 40,91022 Korea (Republic of) 0.932 3 0.866 0.929 85.3 79.2 15.9 17.1 11.4 12.9 22,572 49,29724 France 0.987 1 0.894 0.906 85.6 79.8 16.8 16.0 11.3 11.8 32,518 46,21825 Slovenia 1.003 1 0.898 0.895 83.9 78.3 18.0 16.5 12.2 12.3 26,898 34,34126 Spain 0.979 1 0.879 0.898 86.0 80.5 18.2 d 17.5 9.7 10.0 26,954 41,85027 Czechia 0.986 1 0.881 0.894 81.7 76.0 17.6 16.1 12.6 13.1 23,224 38,20628 Italy 0.967 2 0.863 0.893 85.3 80.9 16.6 15.9 10.0 h 10.4 h 25,767 45,32629 Malta 0.960 2 0.858 0.893 82.6 79.4 16.4 15.4 11.0 11.6 24,255 44,44630 Estonia 1.019 1 0.876 0.860 82.0 73.0 16.9 15.3 13.0 12.2 21,896 37,04331 Greece 0.964 2 0.853 0.885 83.9 78.9 17.0 17.5 10.5 11.0 19,658 29,79632 Cyprus 0.984 1 0.861 0.875 82.8 78.5 15.0 14.2 12.0 12.2 26,580 36,54333 Poland 1.006 1 0.866 0.861 81.6 73.9 17.3 15.6 12.3 12.3 20,367 32,34334 United Arab Emirates 0.968 2 0.832 0.859 78.9 76.7 14.3 13.4 11.9 j 9.7 j 24,973 84,130 e
35 Andorra .. .. .. .. .. .. .. .. 10.1 10.2 .. ..35 Lithuania 1.026 2 0.868 0.846 80.0 69.4 16.6 15.7 13.0 13.0 24,366 32,93437 Qatar 1.031 2 0.870 0.843 80.0 77.6 14.8 12.0 10.8 9.5 59,164 135,961 e
38 Slovakia 0.991 1 0.850 0.858 80.4 73.4 15.5 14.4 12.3 12.6 22,600 36,72639 Brunei Darussalam 0.990 1 0.846 0.854 79.1 75.8 14.8 14.1 9.0 i 9.1 i 63,939 88,204 e
39 Saudi Arabia 0.877 5 0.782 0.892 76.5 73.4 16.0 17.8 8.8 h 9.9 h 17,422 73,94541 Latvia 1.030 2 0.858 0.834 79.4 69.7 16.5 15.1 13.2 h 12.5 h 20,822 29,92441 Portugal 0.983 1 0.839 0.853 84.2 78.4 16.2 16.4 9.2 9.2 23,095 32,01343 Bahrain 0.931 3 0.805 0.865 78.1 76.2 16.6 15.6 9.3 j 9.5 j 18,774 55,13044 Chile 0.961 2 0.823 0.856 82.1 77.2 16.7 16.2 10.2 10.5 15,137 28,80945 Hungary 0.985 1 0.830 0.843 79.4 72.5 15.4 14.8 11.7 12.1 19,931 31,41346 Croatia 0.991 1 0.828 0.835 81.0 74.5 15.7 14.3 11.2 j 11.7 j 17,507 27,16447 Argentina 0.997 1 0.816 0.819 80.4 73.0 18.7 16.2 10.1 j 9.7 j 12,395 24,78948 Oman 0.942 3 0.781 0.829 79.7 75.6 14.7 13.4 10.4 9.2 11,246 49,28249 Russian Federation 1.019 1 0.823 0.808 76.8 65.6 15.9 15.2 12.0 h 12.1 h 19,510 29,67150 Montenegro 0.956 2 0.794 0.831 79.6 74.9 15.2 14.7 10.7 h 12.0 h 12,967 20,69251 Bulgaria 0.990 1 0.808 0.816 78.4 71.5 15.0 14.6 11.9 11.8 14,777 22,93052 Romania 0.985 1 0.804 0.817 79.0 72.1 14.6 13.9 10.6 11.3 18,217 27,35853 Belarus 1.020 1 0.814 0.799 78.5 67.5 15.9 15.1 12.2 12.4 13,479 19,59254 Bahamas .. .. .. .. 78.8 72.7 .. .. 11.5 h 10.5 h 22,156 31,39755 Uruguay 1.014 1 0.807 0.796 81.0 74.0 16.9 15.0 9.0 8.4 15,282 24,90556 Kuwait 0.990 1 0.791 0.799 76.1 73.9 14.3 12.9 8.0 6.9 39,570 93,476 e
57 Malaysia 0.976 1 0.791 0.810 77.9 73.3 14.1 13.3 10.0 h 10.3 h 20,004 31,82658 Barbados 1.015 1 0.805 0.792 78.4 73.6 16.7 13.9 10.6 k 10.4 k 13,509 18,38458 Kazakhstan 1.007 1 0.801 0.795 74.8 65.3 15.5 14.8 11.8 i 11.7 i 16,814 28,815
Gender Development IndexTAB
LE4
34 | HUMAN DEVELOPMENT INDICES AND INDICATORS: 2018 STATISTICAL UPDATE

TABLE
4
SDG 3 SDG 4.3 SDG 4.6 SDG 8.5
Gender Development Index
Human Development Index (HDI)
Life expectancy at birth
Expected years of schooling
Mean years of schooling
Estimated gross national income per capitaa
Value Groupb
Value (years) (years) (years) (2011 PPP $)
Female Male Female Male Female Male Female Male Female Male
HDI rank 2017 2017 2017 2017 2017 2017 2017c 2017c 2017c 2017c 2017 2017
HIGH HUMAN DEVELOPMENT60 Iran (Islamic Republic of) 0.871 5 0.726 0.834 77.3 75.1 14.6 15.1 9.7 i 9.9 i 6,094 32,01760 Palau .. .. .. .. .. .. 17.8 16.5 .. .. .. ..62 Seychelles .. .. .. .. 78.6 69.5 15.3 14.3 .. .. .. ..63 Costa Rica 0.974 2 0.779 0.800 82.4 77.7 15.8 14.9 8.8 8.5 10,419 18,85164 Turkey 0.922 4 0.755 0.819 79.2 72.8 14.7 15.7 7.1 8.8 15,576 34,31365 Mauritius 0.968 2 0.773 0.799 78.4 71.4 15.5 14.6 9.1 i 9.5 i 12,558 27,98666 Panama 0.988 1 0.782 0.791 81.3 75.3 13.3 12.1 10.4 i 9.9 i 13,229 25,10267 Serbia 0.976 1 0.777 0.796 78.2 72.5 15.1 14.2 10.7 11.6 10,672 15,47468 Albania 0.970 2 0.772 0.796 80.6 76.5 15.0 14.4 9.8 10.2 9,702 14,02869 Trinidad and Tobago 1.013 1 0.794 0.784 74.4 67.4 14.4 l 12.5 l 11.0 h 10.8 h 22,008 35,43570 Antigua and Barbuda .. .. .. .. 78.9 74.0 13.9 h 12.6 h .. .. .. ..70 Georgia 0.975 1 0.766 0.786 77.6 69.2 15.3 14.8 12.8 12.8 6,177 12,48172 Saint Kitts and Nevis .. .. .. .. .. .. 14.6 14.3 .. .. .. ..73 Cuba 0.942 3 0.751 0.797 81.9 78.0 14.3 13.7 11.6 h 12.1 h 5,001 10,04574 Mexico 0.954 2 0.752 0.789 79.7 74.9 14.4 13.8 8.4 8.8 11,065 22,87375 Grenada .. .. .. .. 76.3 71.4 17.4 16.3 .. .. .. ..76 Sri Lanka 0.935 3 0.738 0.789 78.8 72.1 14.1 13.6 10.3 h 11.4 h 6,462 16,58177 Bosnia and Herzegovina 0.924 4 0.739 0.800 79.6 74.6 14.9 k 14.5 k 8.6 10.9 7,723 15,85678 Venezuela (Bolivarian Republic of) 1.011 1 0.762 0.754 78.9 70.8 15.4 13.2 10.7 10.0 7,401 13,97679 Brazil 0.992 1 0.755 0.761 79.3 72.1 15.9 14.9 8.0 h 7.7 h 10,073 17,56680 Azerbaijan 0.949 3 0.734 0.773 75.2 69.1 12.6 m 12.7 m 10.5 11.0 10,089 21,15280 Lebanon 0.889 5 0.701 0.788 81.6 78.2 12.4 12.7 8.5 h 8.9 h 5,523 21,18280 The former Yugoslav Republic of Macedonia 0.946 3 0.731 0.773 77.9 73.9 13.5 13.2 8.9 k 9.9 k 9,114 15,89783 Armenia 0.969 2 0.740 0.764 77.8 71.4 13.4 12.6 11.7 11.7 6,358 12,28183 Thailand 0.996 1 0.753 0.756 79.3 71.8 14.8 14.5 7.4 h 7.8 h 13,793 17,32785 Algeria 0.861 5 0.680 0.791 77.6 75.1 14.6 14.1 7.6 h 8.6 h 4,232 23,18186 China 0.955 2 0.735 0.769 78.0 74.9 14.0 13.6 7.6 j 8.3 j 12,053 18,29586 Ecuador 0.978 1 0.741 0.757 79.3 73.9 15.4 13.9 8.6 8.8 7,388 13,30788 Ukraine 0.993 1 0.746 0.751 76.9 67.1 15.2 14.8 11.3 j 11.3 j 6,082 10,51389 Peru 0.950 3 0.728 0.766 77.9 72.6 13.9 13.6 8.7 9.7 8,446 15,14090 Colombia 0.997 1 0.747 0.749 78.2 71.0 14.9 14.3 8.5 8.1 10,271 15,69290 Saint Lucia 0.993 1 0.744 0.749 78.4 73.0 13.9 m 13.3 m 9.4 h 8.7 h 9,388 14,10192 Fiji .. .. .. .. 73.6 67.5 .. .. 10.9 i 10.7 i 5,604 10,96392 Mongolia 1.023 1 0.750 0.733 73.7 65.4 15.9 15.0 10.6 9.8 8,482 11,75994 Dominican Republic 0.989 1 0.728 0.736 77.3 71.0 14.5 13.0 8.1 7.5 8,909 18,97595 Jordan 0.857 5 0.658 0.767 76.3 72.8 13.4 h 12.9 h 10.1 i 10.6 i 2,459 13,97195 Tunisia 0.897 5 0.684 0.762 78.0 73.9 15.8 14.4 6.4 j 7.9 j 4,537 16,15297 Jamaica 0.988 1 0.731 0.739 78.5 73.7 14.4 h 12.8 h 10.0 h 9.5 h 5,898 9,81298 Tonga 0.960 2 0.707 0.736 76.2 70.2 14.6 l 14.0 l 11.2 h 11.1 h 3,769 7,31499 Saint Vincent and the Grenadines .. .. .. .. 75.6 71.2 13.4 13.1 .. .. 7,643 13,306
100 Suriname 0.975 2 0.705 0.723 74.9 68.4 13.0 m 12.0 m 8.3 h 8.6 h 9,132 17,449101 Botswana 0.976 1 0.707 0.725 70.2 64.9 12.8 h 12.5 h 9.2 j 9.5 j 12,613 18,521101 Maldives 0.919 4 0.679 0.739 78.8 76.7 12.7 m 12.6 m 6.2 i 6.4 i 7,064 18,501103 Dominica .. .. .. .. .. .. .. .. .. .. .. ..104 Samoa .. .. .. .. 78.5 72.3 12.9 g 12.1 g .. .. 3,778 7,909105 Uzbekistan 0.945 3 0.687 0.726 74.2 68.6 11.8 12.2 11.2 11.8 4,687 8,264106 Belize 0.979 1 0.699 0.714 73.6 67.9 13.0 12.7 10.5 h 10.4 h 5,689 8,655106 Marshall Islands .. .. .. .. .. .. .. .. 10.7 11.1 .. ..108 Libya 0.929 3 0.668 0.719 75.1 69.3 13.6 l 13.2 l 7.7 j 7.0 j 4,623 17,472108 Turkmenistan .. .. .. .. 71.4 64.5 10.5 11.1 .. .. 11,240 20,083110 Gabon 0.911 4 0.670 0.735 68.2 64.9 12.5 m 13.4 m 7.4 m 9.1 m 11,789 20,825110 Paraguay 0.972 2 0.690 0.710 75.5 71.1 13.2 12.2 8.4 8.3 6,212 10,486112 Moldova (Republic of) 1.005 1 0.701 0.698 76.0 67.4 11.9 11.4 11.5 11.7 4,849 6,318MEDIUM HUMAN DEVELOPMENT113 Philippines 1.000 1 0.699 0.698 72.8 65.9 12.9 12.3 9.5 h 9.2 h 7,582 10,705113 South Africa 0.984 1 0.692 0.704 67.0 59.9 13.7 13.1 9.9 10.4 9,060 14,894115 Egypt 0.872 5 0.636 0.729 74.0 69.5 13.1 13.1 6.5 i 7.9 i 4,081 16,489116 Indonesia 0.932 3 0.666 0.715 71.6 67.3 12.8 12.8 7.5 8.4 7,259 14,385116 Viet Nam 1.005 1 0.696 0.692 81.0 71.8 12.9 k 12.5 k 7.9 k 8.5 k 5,345 6,383
HUMAN DEVELOPMENT INDICES AND INDICATORS: 2018 STATISTICAL UPDATE
TABLE 4 Gender Development Index | 35

TABLE 4 GENDER DEVELOPMENT INDEX
TABLE
4
SDG 3 SDG 4.3 SDG 4.6 SDG 8.5
Gender Development Index
Human Development Index (HDI)
Life expectancy at birth
Expected years of schooling
Mean years of schooling
Estimated gross national income per capitaa
Value Groupb
Value (years) (years) (years) (2011 PPP $)
Female Male Female Male Female Male Female Male Female Male
HDI rank 2017 2017 2017 2017 2017 2017 2017c 2017c 2017c 2017c 2017 2017
118 Bolivia (Plurinational State of) 0.929 3 0.665 0.716 72.1 67.0 14.0 14.0 8.2 9.7 4,686 8,737119 Palestine, State of 0.877 5 0.623 0.710 75.6 71.8 13.7 12.0 8.9 9.3 1,802 8,216120 Iraq 0.823 5 0.603 0.733 72.3 67.8 10.1 m 12.0 m 5.4 h 7.8 h 6,039 29,250121 El Salvador 0.969 2 0.663 0.684 78.1 69.1 12.5 12.8 6.7 7.3 5,226 8,722122 Kyrgyzstan 0.960 2 0.654 0.681 75.1 67.1 13.7 13.2 10.9 m 10.8 m 2,159 4,369123 Morocco 0.838 5 0.598 0.713 77.2 74.9 12.0 12.8 4.5 i 6.5 i 3,197 11,561124 Nicaragua 0.966 2 0.642 0.665 78.6 72.6 12.3 11.8 6.9 i 6.4 i 3,434 6,930125 Cabo Verde 0.949 3 0.632 0.666 74.9 70.9 12.8 12.1 5.9 6.4 4,295 7,683125 Guyana 0.948 3 0.631 0.666 69.2 64.5 11.7 11.0 8.5 k 8.4 k 4,543 10,295127 Guatemala 0.948 3 0.630 0.665 76.8 70.4 10.7 10.9 6.4 h 6.5 h 4,768 9,869127 Tajikistan 0.933 3 0.624 0.669 74.4 68.4 10.5 11.9 10.7 i 10.2 i 2,233 4,392129 Namibia 1.014 1 0.651 0.642 67.7 61.8 12.4 m 12.2 m 7.2 i 6.6 i 8,895 9,907130 India 0.841 5 0.575 0.683 70.4 67.3 12.9 11.9 4.8 h 8.2 h 2,722 9,729131 Micronesia (Federated States of) .. .. .. .. 70.5 68.1 .. .. .. .. .. ..132 Timor-Leste 0.855 5 0.567 0.663 71.1 67.4 12.3 13.2 3.6 m 5.3 m 3,301 10,282133 Honduras 0.978 1 0.608 0.622 76.3 71.2 10.7 9.8 6.6 6.5 3,277 5,159134 Bhutan 0.893 5 0.576 0.645 70.9 70.3 12.4 12.2 2.1 k 4.2 k 6,002 9,889134 Kiribati .. .. .. .. 69.8 63.2 13.4 12.6 .. .. .. ..136 Bangladesh 0.881 5 0.567 0.644 74.6 71.2 11.7 h 11.3 h 5.2 j 6.7 j 2,041 5,285137 Congo 0.934 3 0.583 0.624 66.7 63.5 11.2 11.5 5.5 j 6.7 j 4,905 6,483138 Vanuatu .. .. .. .. 74.7 70.2 10.4 l 11.1 l .. .. 2,340 3,635139 Lao People's Democratic Republic 0.934 3 0.579 0.621 68.6 65.4 10.9 11.5 4.6 i 5.7 i 5,354 6,789140 Ghana 0.910 4 0.563 0.619 64.1 62.0 11.5 11.8 6.3 i 7.9 i 3,349 4,849141 Equatorial Guinea .. .. .. .. 59.4 56.7 .. .. 4.0 m 7.3 m 14,869 23,258142 Kenya 0.931 3 0.568 0.610 69.7 64.9 11.7 m 12.5 m 5.7 i 7.1 i 2,529 3,398143 Sao Tome and Principe 0.892 5 0.550 0.617 68.9 64.6 12.6 12.4 5.6 h 7.1 h 1,780 4,112144 Eswatini (Kingdom of) 0.943 3 0.568 0.603 61.3 54.9 10.8 11.6 6.1 k 6.9 k 5,722 9,641144 Zambia 0.941 3 0.569 0.605 65.0 59.6 12.0 m 13.0 m 6.5 m 7.4 m 2,986 4,138146 Cambodia 0.914 4 0.553 0.605 71.3 67.1 11.2 h 12.2 h 3.8 i 5.6 i 2,970 3,878147 Angola .. .. .. .. 64.7 59.0 11.0 m 12.7 m .. .. 5,063 6,546148 Myanmar 0.959 2 0.563 0.586 69.1 64.4 10.3 9.8 4.9 m 4.8 m 3,860 7,355149 Nepal 0.925 4 0.552 0.598 72.2 69.0 12.6 11.8 3.6 i 6.4 i 2,219 2,738150 Pakistan 0.750 5 0.465 0.620 67.7 65.6 7.8 9.3 3.8 6.5 1,642 8,786151 Cameroon 0.866 5 0.513 0.593 59.7 57.5 11.3 13.0 4.7 j 7.6 j 2,751 3,878LOW HUMAN DEVELOPMENT152 Solomon Islands .. .. .. .. 72.6 69.5 9.7 g 10.7 g .. .. 1,450 2,281153 Papua New Guinea .. .. .. .. 68.3 63.3 .. .. 3.8 i 5.3 i 3,002 3,789154 Tanzania (United Republic of) 0.928 3 0.517 0.557 68.1 64.6 8.6 m 9.3 m 5.4 i 6.2 i 2,282 3,037155 Syrian Arab Republic 0.788 5 0.443 0.563 77.4 65.4 8.7 8.8 4.6 n 5.6 n 561 4,077156 Zimbabwe 0.924 4 0.513 0.555 63.5 59.8 10.2 10.5 7.5 8.9 1,431 1,948157 Nigeria 0.868 5 0.494 0.569 54.7 53.1 9.2 m 10.8 m 5.0 m 7.3 m 4,433 6,008158 Rwanda 0.941 3 0.508 0.540 69.6 65.3 11.2 11.2 3.7 h 4.7 h 1,568 2,064159 Lesotho 1.004 1 0.519 0.516 56.7 52.2 11.0 10.2 7.0 i 5.5 i 2,608 3,940159 Mauritania 0.845 5 0.470 0.556 64.9 61.9 8.5 8.6 3.5 i 5.5 i 1,936 5,221161 Madagascar 0.962 2 0.511 0.531 67.9 64.7 10.5 10.6 6.7 m 6.1 m 1,173 1,544162 Uganda 0.865 5 0.475 0.550 62.4 58.0 11.0 m 12.2 m 4.7 m 7.2 m 1,212 2,109163 Benin 0.875 5 0.479 0.547 62.7 59.6 11.1 14.0 3.0 k 4.3 k 1,795 2,329164 Senegal 0.911 4 0.481 0.528 69.4 65.4 10.0 9.3 2.4 3.8 1,691 3,101165 Comoros 0.876 5 0.465 0.531 65.7 62.2 11.1 11.4 3.7 m 5.6 m 1,027 1,764165 Togo 0.822 5 0.446 0.542 61.3 59.6 10.0 m 13.2 m 3.3 m 6.5 m 1,265 1,643167 Sudan 0.831 5 0.446 0.537 66.3 63.1 7.2 7.7 3.1 i 4.1 i 1,785 6,455168 Afghanistan 0.625 5 0.364 0.583 65.4 62.8 8.0 12.7 1.9 i 6.0 i 541 3,030168 Haiti .. .. .. .. 65.8 61.4 .. .. 4.3 m 6.6 m 1,400 1,937170 Côte d'Ivoire 0.841 5 0.446 0.531 55.7 52.7 8.1 10.0 4.0 i 6.2 i 2,529 4,409171 Malawi 0.936 3 0.460 0.492 66.2 61.0 10.9 10.8 4.0 i 5.1 i 897 1,235172 Djibouti .. .. .. .. 64.4 61.0 5.8 6.7 .. .. 2,491 4,286173 Ethiopia 0.846 5 0.424 0.501 67.8 64.0 8.2 h 9.1 h 1.6 m 3.8 m 1,304 2,136174 Gambia 0.890 5 0.434 0.487 62.8 60.1 9.3 9.2 2.9 i 4.3 i 1,168 1,870175 Guinea 0.810 5 0.411 0.507 61.2 60.1 7.8 10.4 1.5 m 3.9 m 1,804 2,328176 Congo (Democratic Republic of the) 0.852 5 0.420 0.493 61.5 58.5 8.7 10.6 5.3 h 8.4 h 703 889177 Guinea-Bissau .. .. .. .. 59.5 56.0 .. .. .. .. 1,269 1,843
36 | HUMAN DEVELOPMENT INDICES AND INDICATORS: 2018 STATISTICAL UPDATE
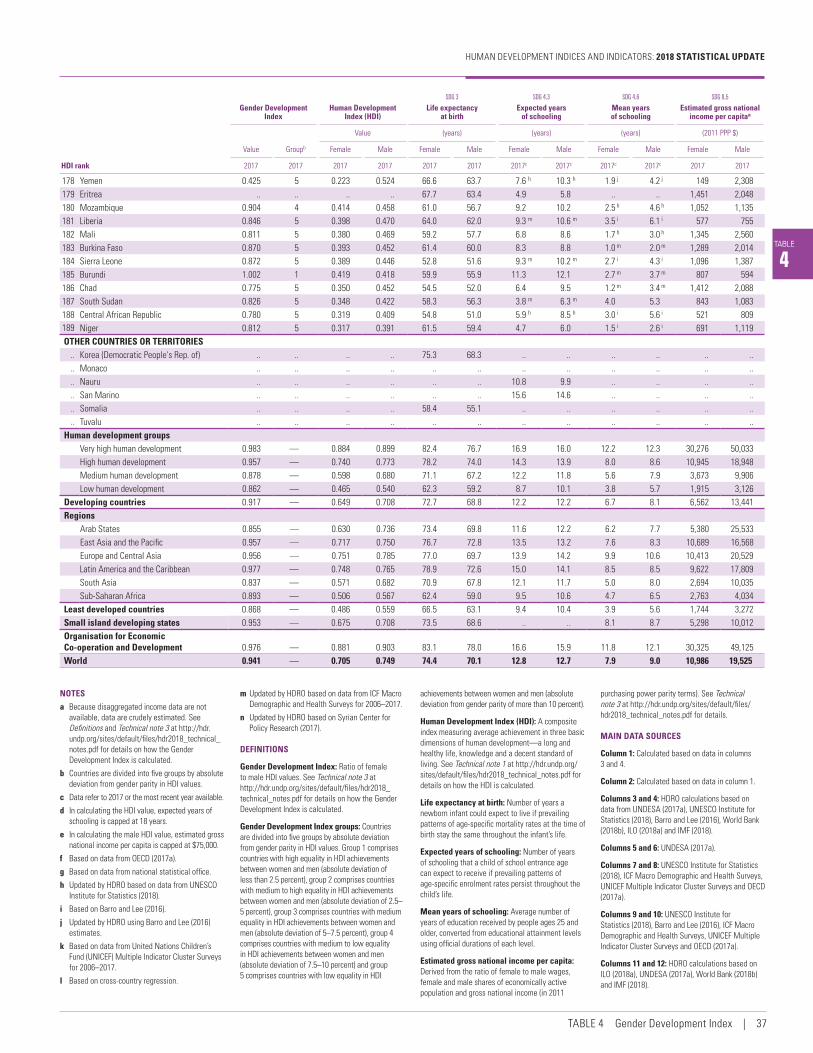
TABLE
4
SDG 3 SDG 4.3 SDG 4.6 SDG 8.5
Gender Development Index
Human Development Index (HDI)
Life expectancy at birth
Expected years of schooling
Mean years of schooling
Estimated gross national income per capitaa
Value Groupb
Value (years) (years) (years) (2011 PPP $)
Female Male Female Male Female Male Female Male Female Male
HDI rank 2017 2017 2017 2017 2017 2017 2017c 2017c 2017c 2017c 2017 2017
178 Yemen 0.425 5 0.223 0.524 66.6 63.7 7.6 h 10.3 h 1.9 j 4.2 j 149 2,308179 Eritrea .. .. .. .. 67.7 63.4 4.9 5.8 .. .. 1,451 2,048180 Mozambique 0.904 4 0.414 0.458 61.0 56.7 9.2 10.2 2.5 h 4.6 h 1,052 1,135181 Liberia 0.846 5 0.398 0.470 64.0 62.0 9.3 m 10.6 m 3.5 i 6.1 i 577 755182 Mali 0.811 5 0.380 0.469 59.2 57.7 6.8 8.6 1.7 h 3.0 h 1,345 2,560183 Burkina Faso 0.870 5 0.393 0.452 61.4 60.0 8.3 8.8 1.0 m 2.0 m 1,289 2,014184 Sierra Leone 0.872 5 0.389 0.446 52.8 51.6 9.3 m 10.2 m 2.7 i 4.3 i 1,096 1,387185 Burundi 1.002 1 0.419 0.418 59.9 55.9 11.3 12.1 2.7 m 3.7 m 807 594186 Chad 0.775 5 0.350 0.452 54.5 52.0 6.4 9.5 1.2 m 3.4 m 1,412 2,088187 South Sudan 0.826 5 0.348 0.422 58.3 56.3 3.8 m 6.3 m 4.0 5.3 843 1,083188 Central African Republic 0.780 5 0.319 0.409 54.8 51.0 5.9 h 8.5 h 3.0 i 5.6 i 521 809189 Niger 0.812 5 0.317 0.391 61.5 59.4 4.7 6.0 1.5 i 2.6 i 691 1,119OTHER COUNTRIES OR TERRITORIES
.. Korea (Democratic People's Rep. of) .. .. .. .. 75.3 68.3 .. .. .. .. .. ..
.. Monaco .. .. .. .. .. .. .. .. .. .. .. ..
.. Nauru .. .. .. .. .. .. 10.8 9.9 .. .. .. ..
.. San Marino .. .. .. .. .. .. 15.6 14.6 .. .. .. ..
.. Somalia .. .. .. .. 58.4 55.1 .. .. .. .. .. ..
.. Tuvalu .. .. .. .. .. .. .. .. .. .. .. ..Human development groups
Very high human development 0.983 — 0.884 0.899 82.4 76.7 16.9 16.0 12.2 12.3 30,276 50,033High human development 0.957 — 0.740 0.773 78.2 74.0 14.3 13.9 8.0 8.6 10,945 18,948Medium human development 0.878 — 0.598 0.680 71.1 67.2 12.2 11.8 5.6 7.9 3,673 9,906Low human development 0.862 — 0.465 0.540 62.3 59.2 8.7 10.1 3.8 5.7 1,915 3,126
Developing countries 0.917 — 0.649 0.708 72.7 68.8 12.2 12.2 6.7 8.1 6,562 13,441Regions
Arab States 0.855 — 0.630 0.736 73.4 69.8 11.6 12.2 6.2 7.7 5,380 25,533East Asia and the Pacific 0.957 — 0.717 0.750 76.7 72.8 13.5 13.2 7.6 8.3 10,689 16,568Europe and Central Asia 0.956 — 0.751 0.785 77.0 69.7 13.9 14.2 9.9 10.6 10,413 20,529Latin America and the Caribbean 0.977 — 0.748 0.765 78.9 72.6 15.0 14.1 8.5 8.5 9,622 17,809South Asia 0.837 — 0.571 0.682 70.9 67.8 12.1 11.7 5.0 8.0 2,694 10,035Sub-Saharan Africa 0.893 — 0.506 0.567 62.4 59.0 9.5 10.6 4.7 6.5 2,763 4,034
Least developed countries 0.868 — 0.486 0.559 66.5 63.1 9.4 10.4 3.9 5.6 1,744 3,272Small island developing states 0.953 — 0.675 0.708 73.5 68.6 .. .. 8.1 8.7 5,298 10,012Organisation for Economic Co‑operation and Development 0.976 — 0.881 0.903 83.1 78.0 16.6 15.9 11.8 12.1 30,325 49,125World 0.941 — 0.705 0.749 74.4 70.1 12.8 12.7 7.9 9.0 10,986 19,525
NOTES
a Because disaggregated income data are not available, data are crudely estimated. See Definitions and Technical note 3 at http://hdr.undp.org/sites/default/files/hdr2018_technical_notes.pdf for details on how the Gender Development Index is calculated.
b Countries are divided into five groups by absolute deviation from gender parity in HDI values.
c Data refer to 2017 or the most recent year available.
d In calculating the HDI value, expected years of schooling is capped at 18 years.
e In calculating the male HDI value, estimated gross national income per capita is capped at $75,000.
f Based on data from OECD (2017a).
g Based on data from national statistical office.
h Updated by HDRO based on data from UNESCO Institute for Statistics (2018).
i Based on Barro and Lee (2016).
j Updated by HDRO using Barro and Lee (2016) estimates.
k Based on data from United Nations Children’s Fund (UNICEF) Multiple Indicator Cluster Surveys for 2006–2017.
l Based on cross-country regression.
m Updated by HDRO based on data from ICF Macro Demographic and Health Surveys for 2006–2017.
n Updated by HDRO based on Syrian Center for Policy Research (2017).
DEFINITIONS
Gender Development Index: Ratio of female to male HDI values. See Technical note 3 at http://hdr.undp.org/sites/default/files/hdr2018_technical_notes.pdf for details on how the Gender Development Index is calculated.
Gender Development Index groups: Countries are divided into five groups by absolute deviation from gender parity in HDI values. Group 1 comprises countries with high equality in HDI achievements between women and men (absolute deviation of less than 2.5 percent), group 2 comprises countries with medium to high equality in HDI achievements between women and men (absolute deviation of 2.5–5 percent), group 3 comprises countries with medium equality in HDI achievements between women and men (absolute deviation of 5–7.5 percent), group 4 comprises countries with medium to low equality in HDI achievements between women and men (absolute deviation of 7.5–10 percent) and group 5 comprises countries with low equality in HDI
achievements between women and men (absolute deviation from gender parity of more than 10 percent).
Human Development Index (HDI): A composite index measuring average achievement in three basic dimensions of human development — a long and healthy life, knowledge and a decent standard of living. See Technical note 1 at http://hdr.undp.org/sites/default/files/hdr2018_technical_notes.pdf for details on how the HDI is calculated.
Life expectancy at birth: Number of years a newborn infant could expect to live if prevailing patterns of age-specific mortality rates at the time of birth stay the same throughout the infant’s life.
Expected years of schooling: Number of years of schooling that a child of school entrance age can expect to receive if prevailing patterns of age-specific enrolment rates persist throughout the child’s life.
Mean years of schooling: Average number of years of education received by people ages 25 and older, converted from educational attainment levels using official durations of each level.
Estimated gross national income per capita: Derived from the ratio of female to male wages, female and male shares of economically active population and gross national income (in 2011
purchasing power parity terms). See Technical note 3 at http://hdr.undp.org/sites/default/files/hdr2018_technical_notes.pdf for details.
MAIN DATA SOURCES
Column 1: Calculated based on data in columns 3 and 4.
Column 2: Calculated based on data in column 1.
Columns 3 and 4: HDRO calculations based on data from UNDESA (2017a), UNESCO Institute for Statistics (2018), Barro and Lee (2016), World Bank (2018b), ILO (2018a) and IMF (2018).
Columns 5 and 6: UNDESA (2017a).
Columns 7 and 8: UNESCO Institute for Statistics (2018), ICF Macro Demographic and Health Surveys, UNICEF Multiple Indicator Cluster Surveys and OECD (2017a).
Columns 9 and 10: UNESCO Institute for Statistics (2018), Barro and Lee (2016), ICF Macro Demographic and Health Surveys, UNICEF Multiple Indicator Cluster Surveys and OECD (2017a).
Columns 11 and 12: HDRO calculations based on ILO (2018a), UNDESA (2017a), World Bank (2018b) and IMF (2018).
HUMAN DEVELOPMENT INDICES AND INDICATORS: 2018 STATISTICAL UPDATE
TABLE 4 Gender Development Index | 37
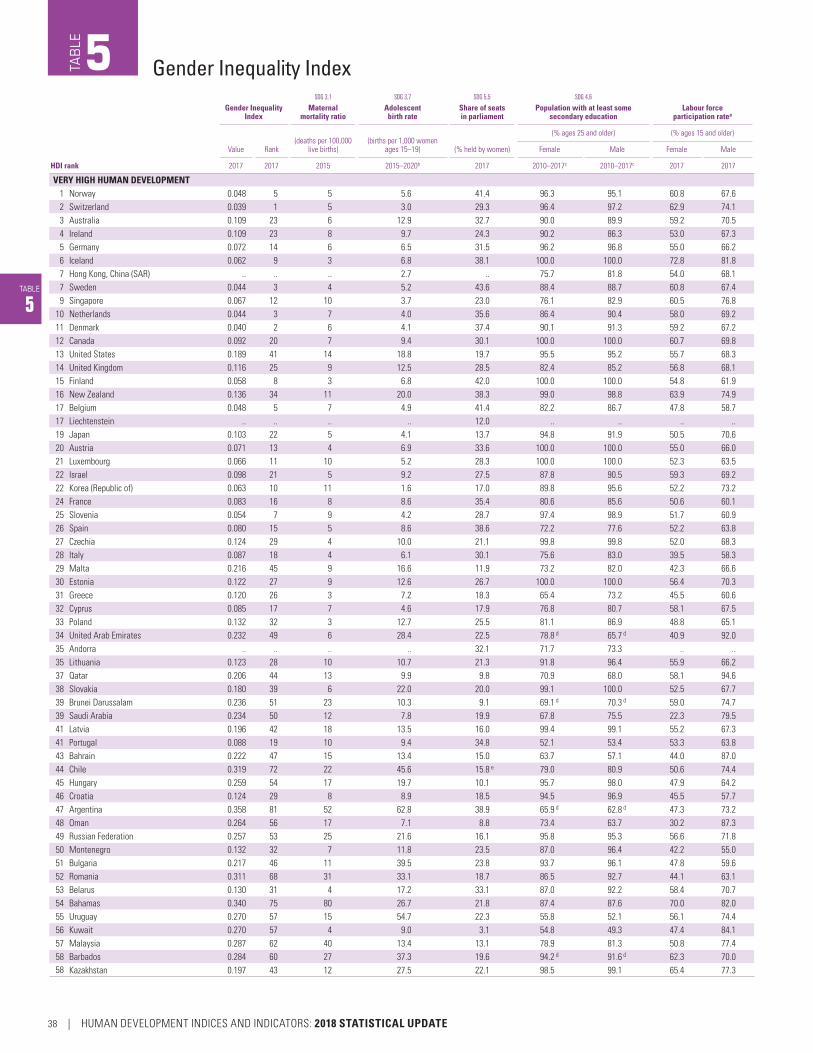
TABLE
5
SDG 3.1 SDG 3.7 SDG 5.5 SDG 4.6
Gender Inequality Index
Maternal mortality ratio
Adolescent birth rate
Share of seats in parliament
Population with at least some secondary education
Labour force participation ratea
Value Rank(deaths per 100,000
live births)(births per 1,000 women
ages 15–19) (% held by women)
(% ages 25 and older) (% ages 15 and older)
Female Male Female Male
HDI rank 2017 2017 2015 2015–2020b 2017 2010–2017c 2010–2017c 2017 2017
VERY HIGH HUMAN DEVELOPMENT1 Norway 0.048 5 5 5.6 41.4 96.3 95.1 60.8 67.62 Switzerland 0.039 1 5 3.0 29.3 96.4 97.2 62.9 74.13 Australia 0.109 23 6 12.9 32.7 90.0 89.9 59.2 70.54 Ireland 0.109 23 8 9.7 24.3 90.2 86.3 53.0 67.35 Germany 0.072 14 6 6.5 31.5 96.2 96.8 55.0 66.26 Iceland 0.062 9 3 6.8 38.1 100.0 100.0 72.8 81.87 Hong Kong, China (SAR) .. .. .. 2.7 .. 75.7 81.8 54.0 68.17 Sweden 0.044 3 4 5.2 43.6 88.4 88.7 60.8 67.49 Singapore 0.067 12 10 3.7 23.0 76.1 82.9 60.5 76.8
10 Netherlands 0.044 3 7 4.0 35.6 86.4 90.4 58.0 69.211 Denmark 0.040 2 6 4.1 37.4 90.1 91.3 59.2 67.212 Canada 0.092 20 7 9.4 30.1 100.0 100.0 60.7 69.813 United States 0.189 41 14 18.8 19.7 95.5 95.2 55.7 68.314 United Kingdom 0.116 25 9 12.5 28.5 82.4 85.2 56.8 68.115 Finland 0.058 8 3 6.8 42.0 100.0 100.0 54.8 61.916 New Zealand 0.136 34 11 20.0 38.3 99.0 98.8 63.9 74.917 Belgium 0.048 5 7 4.9 41.4 82.2 86.7 47.8 58.717 Liechtenstein .. .. .. .. 12.0 .. .. .. ..19 Japan 0.103 22 5 4.1 13.7 94.8 91.9 50.5 70.620 Austria 0.071 13 4 6.9 33.6 100.0 100.0 55.0 66.021 Luxembourg 0.066 11 10 5.2 28.3 100.0 100.0 52.3 63.522 Israel 0.098 21 5 9.2 27.5 87.8 90.5 59.3 69.222 Korea (Republic of) 0.063 10 11 1.6 17.0 89.8 95.6 52.2 73.224 France 0.083 16 8 8.6 35.4 80.6 85.6 50.6 60.125 Slovenia 0.054 7 9 4.2 28.7 97.4 98.9 51.7 60.926 Spain 0.080 15 5 8.6 38.6 72.2 77.6 52.2 63.827 Czechia 0.124 29 4 10.0 21.1 99.8 99.8 52.0 68.328 Italy 0.087 18 4 6.1 30.1 75.6 83.0 39.5 58.329 Malta 0.216 45 9 16.6 11.9 73.2 82.0 42.3 66.630 Estonia 0.122 27 9 12.6 26.7 100.0 100.0 56.4 70.331 Greece 0.120 26 3 7.2 18.3 65.4 73.2 45.5 60.632 Cyprus 0.085 17 7 4.6 17.9 76.8 80.7 58.1 67.533 Poland 0.132 32 3 12.7 25.5 81.1 86.9 48.8 65.134 United Arab Emirates 0.232 49 6 28.4 22.5 78.8 d 65.7 d 40.9 92.035 Andorra .. .. .. .. 32.1 71.7 73.3 .. ..35 Lithuania 0.123 28 10 10.7 21.3 91.8 96.4 55.9 66.237 Qatar 0.206 44 13 9.9 9.8 70.9 68.0 58.1 94.638 Slovakia 0.180 39 6 22.0 20.0 99.1 100.0 52.5 67.739 Brunei Darussalam 0.236 51 23 10.3 9.1 69.1 d 70.3 d 59.0 74.739 Saudi Arabia 0.234 50 12 7.8 19.9 67.8 75.5 22.3 79.541 Latvia 0.196 42 18 13.5 16.0 99.4 99.1 55.2 67.341 Portugal 0.088 19 10 9.4 34.8 52.1 53.4 53.3 63.843 Bahrain 0.222 47 15 13.4 15.0 63.7 57.1 44.0 87.044 Chile 0.319 72 22 45.6 15.8 e 79.0 80.9 50.6 74.445 Hungary 0.259 54 17 19.7 10.1 95.7 98.0 47.9 64.246 Croatia 0.124 29 8 8.9 18.5 94.5 96.9 45.5 57.747 Argentina 0.358 81 52 62.8 38.9 65.9 d 62.8 d 47.3 73.248 Oman 0.264 56 17 7.1 8.8 73.4 63.7 30.2 87.349 Russian Federation 0.257 53 25 21.6 16.1 95.8 95.3 56.6 71.850 Montenegro 0.132 32 7 11.8 23.5 87.0 96.4 42.2 55.051 Bulgaria 0.217 46 11 39.5 23.8 93.7 96.1 47.8 59.652 Romania 0.311 68 31 33.1 18.7 86.5 92.7 44.1 63.153 Belarus 0.130 31 4 17.2 33.1 87.0 92.2 58.4 70.754 Bahamas 0.340 75 80 26.7 21.8 87.4 87.6 70.0 82.055 Uruguay 0.270 57 15 54.7 22.3 55.8 52.1 56.1 74.456 Kuwait 0.270 57 4 9.0 3.1 54.8 49.3 47.4 84.157 Malaysia 0.287 62 40 13.4 13.1 78.9 81.3 50.8 77.458 Barbados 0.284 60 27 37.3 19.6 94.2 d 91.6 d 62.3 70.058 Kazakhstan 0.197 43 12 27.5 22.1 98.5 99.1 65.4 77.3
Gender Inequality IndexTAB
LE5
38 | HUMAN DEVELOPMENT INDICES AND INDICATORS: 2018 STATISTICAL UPDATE

TABLE
5
SDG 3.1 SDG 3.7 SDG 5.5 SDG 4.6
Gender Inequality Index
Maternal mortality ratio
Adolescent birth rate
Share of seats in parliament
Population with at least some secondary education
Labour force participation ratea
Value Rank(deaths per 100,000
live births)(births per 1,000 women
ages 15–19) (% held by women)
(% ages 25 and older) (% ages 15 and older)
Female Male Female Male
HDI rank 2017 2017 2015 2015–2020b 2017 2010–2017c 2010–2017c 2017 2017
HIGH HUMAN DEVELOPMENT60 Iran (Islamic Republic of) 0.461 109 25 25.0 5.9 65.8 70.9 16.8 71.460 Palau .. .. .. .. 13.8 96.9 97.3 .. ..62 Seychelles .. .. .. 56.9 21.2 .. .. .. ..63 Costa Rica 0.300 64 25 53.5 35.1 53.8 51.9 45.3 73.964 Turkey 0.317 69 16 25.8 14.6 44.9 66.0 32.4 71.965 Mauritius 0.373 84 53 26.6 11.6 64.3 67.3 45.1 72.766 Panama 0.461 109 94 81.8 18.3 72.7 68.4 52.8 81.267 Serbia 0.181 40 17 18.9 34.4 84.6 93.0 45.9 61.768 Albania 0.238 52 29 20.7 27.9 93.1 92.8 47.2 64.969 Trinidad and Tobago 0.324 73 63 30.1 30.1 74.4 69.1 51.0 73.770 Antigua and Barbuda .. .. .. 43.5 20.0 .. .. .. ..70 Georgia 0.350 78 36 45.9 16.0 95.1 96.0 57.9 78.872 Saint Kitts and Nevis .. .. .. .. 13.3 .. .. .. ..73 Cuba 0.301 65 39 43.6 48.9 86.7 88.9 41.5 67.374 Mexico 0.343 76 38 60.3 41.4 57.8 61.0 44.1 79.075 Grenada .. .. 27 29.2 25.0 .. .. .. ..76 Sri Lanka 0.354 80 30 14.1 5.8 82.6 83.1 35.1 74.177 Bosnia and Herzegovina 0.166 37 11 10.0 19.3 71.7 88.7 35.2 58.778 Venezuela (Bolivarian Republic of) 0.454 105 95 85.3 22.2 71.7 66.6 50.2 77.479 Brazil 0.407 94 44 61.6 11.3 61.0 57.7 53.2 74.780 Azerbaijan 0.318 71 25 53.5 16.8 93.8 97.5 62.9 69.580 Lebanon 0.381 85 15 11.8 3.1 53.0 55.4 23.2 71.180 The former Yugoslav Republic of Macedonia 0.149 35 8 16.2 37.5 40.5 56.0 42.5 67.683 Armenia 0.262 55 25 23.2 18.1 96.9 97.6 51.4 70.683 Thailand 0.393 93 20 51.9 4.8 42.4 47.5 60.5 77.385 Algeria 0.442 100 140 10.1 21.3 37.5 d 37.9 d 15.2 67.386 China 0.152 36 27 6.4 24.2 74.0 82.0 61.5 76.186 Ecuador 0.385 88 64 73.9 38.0 52.1 52.2 55.4 81.388 Ukraine 0.285 61 24 23.8 12.3 94.5 d 95.6 d 46.9 63.089 Peru 0.368 83 68 47.5 27.7 57.1 67.5 69.0 84.590 Colombia 0.383 87 64 47.5 19.8 51.1 49.2 58.8 82.690 Saint Lucia 0.333 74 48 40.5 20.7 48.2 42.0 61.2 75.992 Fiji 0.352 79 30 43.9 16.0 77.3 d 68.3 d 40.8 75.492 Mongolia 0.301 65 44 23.6 17.1 91.2 86.3 52.7 66.294 Dominican Republic 0.451 103 92 95.0 24.3 58.6 54.4 54.4 79.595 Jordan 0.460 108 58 22.4 15.4 81.4 85.8 14.0 63.795 Tunisia 0.298 63 62 7.7 31.3 41.2 52.7 24.3 70.697 Jamaica 0.412 95 89 52.8 19.0 69.9 62.4 57.3 77.498 Tonga 0.416 96 124 14.7 7.7 92.7 92.3 45.2 74.299 Saint Vincent and the Grenadines .. .. 45 49.0 13.0 .. .. 58.6 80.3
100 Suriname 0.441 99 155 46.0 25.5 58.7 57.8 41.8 65.3101 Botswana 0.434 98 129 30.0 9.5 88.8 d 89.6 d 65.6 78.4101 Maldives 0.343 76 68 5.8 5.9 44.9 d 49.3 d 42.9 82.1103 Dominica .. .. .. .. 25.0 .. .. .. ..104 Samoa 0.365 82 51 23.9 10.0 79.1 71.6 23.7 38.9105 Uzbekistan 0.274 59 36 16.5 16.4 99.9 99.9 53.8 77.9106 Belize 0.386 89 28 63.5 11.1 78.9 78.4 53.2 81.3106 Marshall Islands .. .. .. .. 9.1 91.6 92.5 .. ..108 Libya 0.170 38 9 5.7 16.0 69.4 d 45.0 d 25.8 79.0108 Turkmenistan .. .. 42 24.4 25.8 .. .. 53.4 78.2110 Gabon 0.534 128 291 95.3 17.4 65.6 d 49.8 d 42.9 59.4110 Paraguay 0.467 113 132 55.7 16.0 47.0 49.2 56.6 83.9112 Moldova (Republic of) 0.226 48 23 22.0 22.8 95.5 97.4 39.5 45.8MEDIUM HUMAN DEVELOPMENT113 Philippines 0.427 97 114 60.5 29.1 76.6 72.4 49.6 75.1113 South Africa 0.389 90 138 42.8 41.0 f 74.2 77.4 47.9 62.0115 Egypt 0.449 101 33 50.0 14.9 58.2 d 70.7 d 22.2 73.7116 Indonesia 0.453 104 126 47.4 19.8 44.5 53.2 50.7 81.8116 Viet Nam 0.304 67 54 27.3 26.7 66.2 77.7 73.2 83.5
HUMAN DEVELOPMENT INDICES AND INDICATORS: 2018 STATISTICAL UPDATE
TABLE 5 Gender Inequality Index | 39

TABLE 5 GENDER INEQUALITY INDEX
TABLE
5
SDG 3.1 SDG 3.7 SDG 5.5 SDG 4.6
Gender Inequality Index
Maternal mortality ratio
Adolescent birth rate
Share of seats in parliament
Population with at least some secondary education
Labour force participation ratea
Value Rank(deaths per 100,000
live births)(births per 1,000 women
ages 15–19) (% held by women)
(% ages 25 and older) (% ages 15 and older)
Female Male Female Male
HDI rank 2017 2017 2015 2015–2020b 2017 2010–2017c 2010–2017c 2017 2017
118 Bolivia (Plurinational State of) 0.450 102 206 68.1 51.8 50.5 59.5 55.2 79.9119 Palestine, State of .. .. 45 56.2 .. 58.5 62.3 19.5 71.8120 Iraq 0.506 123 50 80.1 25.3 38.7 56.7 18.7 74.1121 El Salvador 0.392 91 54 69.5 32.1 42.2 47.9 47.0 78.8122 Kyrgyzstan 0.392 91 76 38.1 19.2 98.6 98.3 48.2 75.7123 Morocco 0.482 119 121 31.1 18.4 28.0 d 34.8 d 25.0 74.1124 Nicaragua 0.456 106 150 85.4 45.7 48.3 d 46.6 d 50.3 84.0125 Cabo Verde .. .. 42 73.8 20.8 g .. .. 49.6 71.5125 Guyana 0.504 122 229 85.8 31.9 70.9 d 55.5 d 40.7 74.6127 Guatemala 0.493 120 88 70.9 12.7 38.4 37.2 40.6 85.0127 Tajikistan 0.317 69 32 36.4 20.0 98.9 d 87.0 d 45.5 73.3129 Namibia 0.472 115 265 73.8 36.3 39.9 d 41.0 d 58.5 65.2130 India 0.524 127 174 23.1 11.6 39.0 63.5 27.2 78.8131 Micronesia (Federated States of) .. .. 100 13.9 0.0 h .. .. .. ..132 Timor-Leste .. .. 215 44.0 32.3 .. .. 24.9 52.3133 Honduras 0.461 109 129 70.8 25.8 e 36.8 33.5 50.9 85.8134 Bhutan 0.476 117 148 20.3 8.3 6.0 13.7 58.0 74.3134 Kiribati .. .. 90 16.2 6.5 .. .. .. ..136 Bangladesh 0.542 134 176 83.5 20.3 44.0 d 48.2 d 33.0 79.8137 Congo 0.578 143 442 111.8 14.0 46.7 d 51.0 d 67.4 72.0138 Vanuatu .. .. 78 41.9 0.0 h .. .. 61.5 79.6139 Lao People's Democratic Republic 0.461 109 197 62.6 27.5 33.6 d 45.2 d 76.9 79.7140 Ghana 0.538 131 319 66.6 12.7 54.6 70.4 74.8 79.2141 Equatorial Guinea .. .. 342 155.6 19.7 e .. .. 55.7 61.8142 Kenya 0.549 137 510 80.5 23.3 29.2 36.6 62.4 68.5143 Sao Tome and Principe 0.538 131 156 94.8 18.2 31.1 45.2 41.3 75.4144 Eswatini (Kingdom of) 0.569 141 389 77.0 14.7 30.0 d 32.7 d 42.7 67.2144 Zambia 0.517 125 224 82.8 18.0 39.2 d 52.4 d 70.1 79.7146 Cambodia 0.473 116 161 50.2 18.5 15.1 28.1 80.9 88.7147 Angola .. .. 477 151.6 30.5 .. .. 75.3 80.1148 Myanmar 0.456 106 178 28.7 10.2 28.7 d 22.3 51.3 79.9149 Nepal 0.480 118 258 60.5 29.6 27.3 43.1 82.7 85.9150 Pakistan 0.541 133 178 36.9 20.0 27.0 47.3 24.9 82.7151 Cameroon 0.569 141 596 105.8 27.1 32.5 39.2 71.2 81.2LOW HUMAN DEVELOPMENT152 Solomon Islands .. .. 114 46.4 2.0 .. .. 62.5 80.3153 Papua New Guinea 0.741 159 215 52.7 0.0 h 9.5 d 15.0 d 69.0 70.8154 Tanzania (United Republic of) 0.537 130 398 115.1 37.2 11.9 16.9 79.5 87.4155 Syrian Arab Republic 0.547 136 68 38.6 13.2 37.1 42.6 11.9 70.2156 Zimbabwe 0.534 128 443 104.1 36.2 55.9 66.3 78.5 89.1157 Nigeria .. .. 814 107.3 5.8 .. .. 50.4 59.8158 Rwanda 0.381 85 290 25.7 55.7 12.6 17.0 86.0 86.3159 Lesotho 0.544 135 487 89.5 22.7 31.8 d 24.2 d 59.3 74.4159 Mauritania 0.617 147 602 79.2 25.2 12.2 d 24.5 d 31.0 67.7161 Madagascar .. .. 353 109.6 19.6 .. .. 83.6 89.4162 Uganda 0.523 126 343 106.5 34.3 26.7 32.4 66.6 74.9163 Benin 0.611 146 405 86.1 7.2 18.2 d 32.7 d 68.7 73.1164 Senegal 0.515 124 315 72.7 41.8 11.1 20.1 45.5 69.9165 Comoros .. .. 335 65.4 6.1 .. .. 36.0 50.2165 Togo 0.567 140 368 89.1 17.6 26.3 52.5 75.8 79.4167 Sudan 0.564 139 311 64.0 31.0 14.7 d 19.3 d 23.6 69.9168 Afghanistan 0.653 153 396 64.5 27.4 11.4 d 36.9 d 19.5 86.7168 Haiti 0.601 144 359 37.5 2.7 26.9 d 39.9 d 63.8 72.6170 Côte d'Ivoire 0.663 155 645 132.7 9.2 i 17.8 34.1 48.1 66.2171 Malawi 0.619 148 634 140.2 16.7 16.7 d 25.4 d 72.3 81.9172 Djibouti .. .. 229 18.8 10.8 .. .. 49.5 68.5173 Ethiopia 0.502 121 353 62.5 37.3 11.2 21.4 77.2 87.8174 Gambia 0.623 149 706 79.2 10.3 29.0 d 42.3 d 51.2 67.7175 Guinea .. .. 679 135.3 21.9 .. .. 63.0 65.4
40 | HUMAN DEVELOPMENT INDICES AND INDICATORS: 2018 STATISTICAL UPDATE
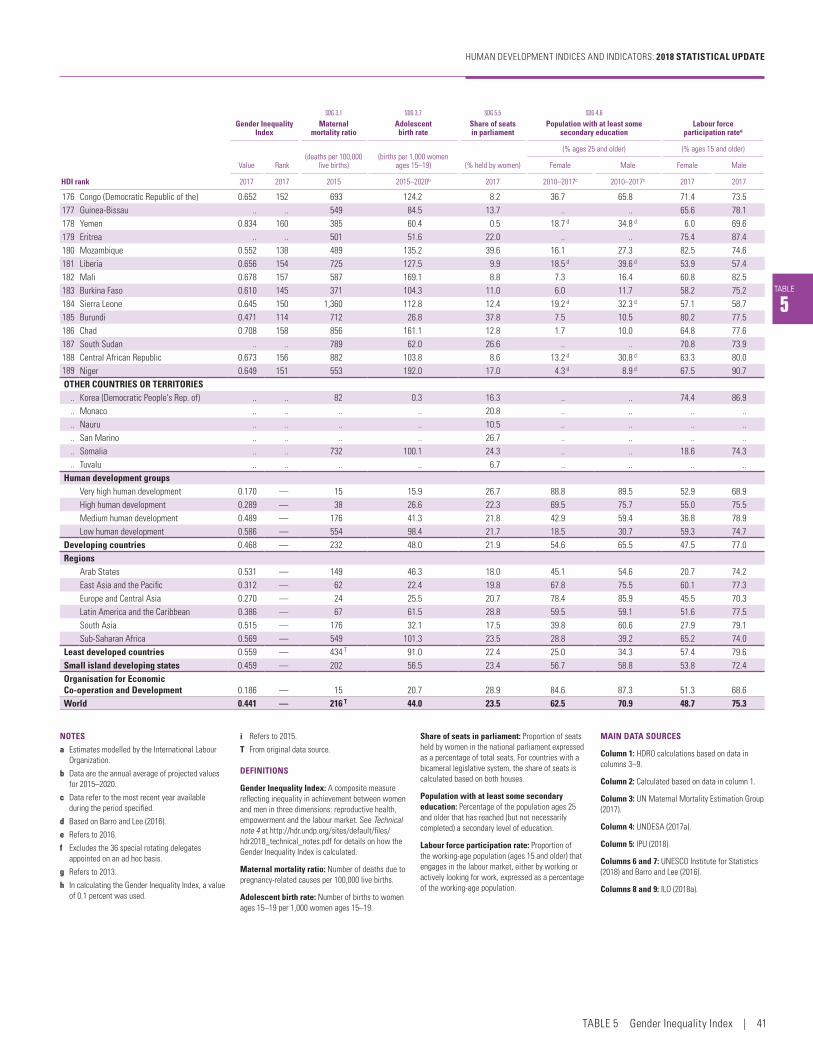
TABLE
5
SDG 3.1 SDG 3.7 SDG 5.5 SDG 4.6
Gender Inequality Index
Maternal mortality ratio
Adolescent birth rate
Share of seats in parliament
Population with at least some secondary education
Labour force participation ratea
Value Rank(deaths per 100,000
live births)(births per 1,000 women
ages 15–19) (% held by women)
(% ages 25 and older) (% ages 15 and older)
Female Male Female Male
HDI rank 2017 2017 2015 2015–2020b 2017 2010–2017c 2010–2017c 2017 2017
176 Congo (Democratic Republic of the) 0.652 152 693 124.2 8.2 36.7 65.8 71.4 73.5177 Guinea-Bissau .. .. 549 84.5 13.7 .. .. 65.6 78.1178 Yemen 0.834 160 385 60.4 0.5 18.7 d 34.8 d 6.0 69.6179 Eritrea .. .. 501 51.6 22.0 .. .. 75.4 87.4180 Mozambique 0.552 138 489 135.2 39.6 16.1 27.3 82.5 74.6181 Liberia 0.656 154 725 127.5 9.9 18.5 d 39.6 d 53.9 57.4182 Mali 0.678 157 587 169.1 8.8 7.3 16.4 60.8 82.5183 Burkina Faso 0.610 145 371 104.3 11.0 6.0 11.7 58.2 75.2184 Sierra Leone 0.645 150 1,360 112.8 12.4 19.2 d 32.3 d 57.1 58.7185 Burundi 0.471 114 712 26.8 37.8 7.5 10.5 80.2 77.5186 Chad 0.708 158 856 161.1 12.8 1.7 10.0 64.8 77.6187 South Sudan .. .. 789 62.0 26.6 .. .. 70.8 73.9188 Central African Republic 0.673 156 882 103.8 8.6 13.2 d 30.8 d 63.3 80.0189 Niger 0.649 151 553 192.0 17.0 4.3 d 8.9 d 67.5 90.7OTHER COUNTRIES OR TERRITORIES
.. Korea (Democratic People's Rep. of) .. .. 82 0.3 16.3 .. .. 74.4 86.9
.. Monaco .. .. .. .. 20.8 .. .. .. ..
.. Nauru .. .. .. .. 10.5 .. .. .. ..
.. San Marino .. .. .. .. 26.7 .. .. .. ..
.. Somalia .. .. 732 100.1 24.3 .. .. 18.6 74.3
.. Tuvalu .. .. .. .. 6.7 .. .. .. ..Human development groups
Very high human development 0.170 — 15 15.9 26.7 88.8 89.5 52.9 68.9High human development 0.289 — 38 26.6 22.3 69.5 75.7 55.0 75.5Medium human development 0.489 — 176 41.3 21.8 42.9 59.4 36.8 78.9Low human development 0.586 — 554 98.4 21.7 18.5 30.7 59.3 74.7
Developing countries 0.468 — 232 48.0 21.9 54.6 65.5 47.5 77.0Regions
Arab States 0.531 — 149 46.3 18.0 45.1 54.6 20.7 74.2East Asia and the Pacific 0.312 — 62 22.4 19.8 67.8 75.5 60.1 77.3Europe and Central Asia 0.270 — 24 25.5 20.7 78.4 85.9 45.5 70.3Latin America and the Caribbean 0.386 — 67 61.5 28.8 59.5 59.1 51.6 77.5South Asia 0.515 — 176 32.1 17.5 39.8 60.6 27.9 79.1Sub-Saharan Africa 0.569 — 549 101.3 23.5 28.8 39.2 65.2 74.0
Least developed countries 0.559 — 434 T 91.0 22.4 25.0 34.3 57.4 79.6Small island developing states 0.459 — 202 56.5 23.4 56.7 58.8 53.8 72.4Organisation for Economic Co‑operation and Development 0.186 — 15 20.7 28.9 84.6 87.3 51.3 68.6World 0.441 — 216 T 44.0 23.5 62.5 70.9 48.7 75.3
NOTES
a Estimates modelled by the International Labour Organization.
b Data are the annual average of projected values for 2015–2020.
c Data refer to the most recent year available during the period specified.
d Based on Barro and Lee (2016).
e Refers to 2016.
f Excludes the 36 special rotating delegates appointed on an ad hoc basis.
g Refers to 2013.
h In calculating the Gender Inequality Index, a value of 0.1 percent was used.
i Refers to 2015.
T From original data source.
DEFINITIONS
Gender Inequality Index: A composite measure reflecting inequality in achievement between women and men in three dimensions: reproductive health, empowerment and the labour market. See Technical note 4 at http://hdr.undp.org/sites/default/files/hdr2018_technical_notes.pdf for details on how the Gender Inequality Index is calculated.
Maternal mortality ratio: Number of deaths due to pregnancy-related causes per 100,000 live births.
Adolescent birth rate: Number of births to women ages 15–19 per 1,000 women ages 15–19.
Share of seats in parliament: Proportion of seats held by women in the national parliament expressed as a percentage of total seats. For countries with a bicameral legislative system, the share of seats is calculated based on both houses.
Population with at least some secondary education: Percentage of the population ages 25 and older that has reached (but not necessarily completed) a secondary level of education.
Labour force participation rate: Proportion of the working-age population (ages 15 and older) that engages in the labour market, either by working or actively looking for work, expressed as a percentage of the working-age population.
MAIN DATA SOURCES
Column 1: HDRO calculations based on data in columns 3–9.
Column 2: Calculated based on data in column 1.
Column 3: UN Maternal Mortality Estimation Group (2017).
Column 4: UNDESA (2017a).
Column 5: IPU (2018).
Columns 6 and 7: UNESCO Institute for Statistics (2018) and Barro and Lee (2016).
Columns 8 and 9: ILO (2018a).
HUMAN DEVELOPMENT INDICES AND INDICATORS: 2018 STATISTICAL UPDATE
TABLE 5 Gender Inequality Index | 41


Human development indicators
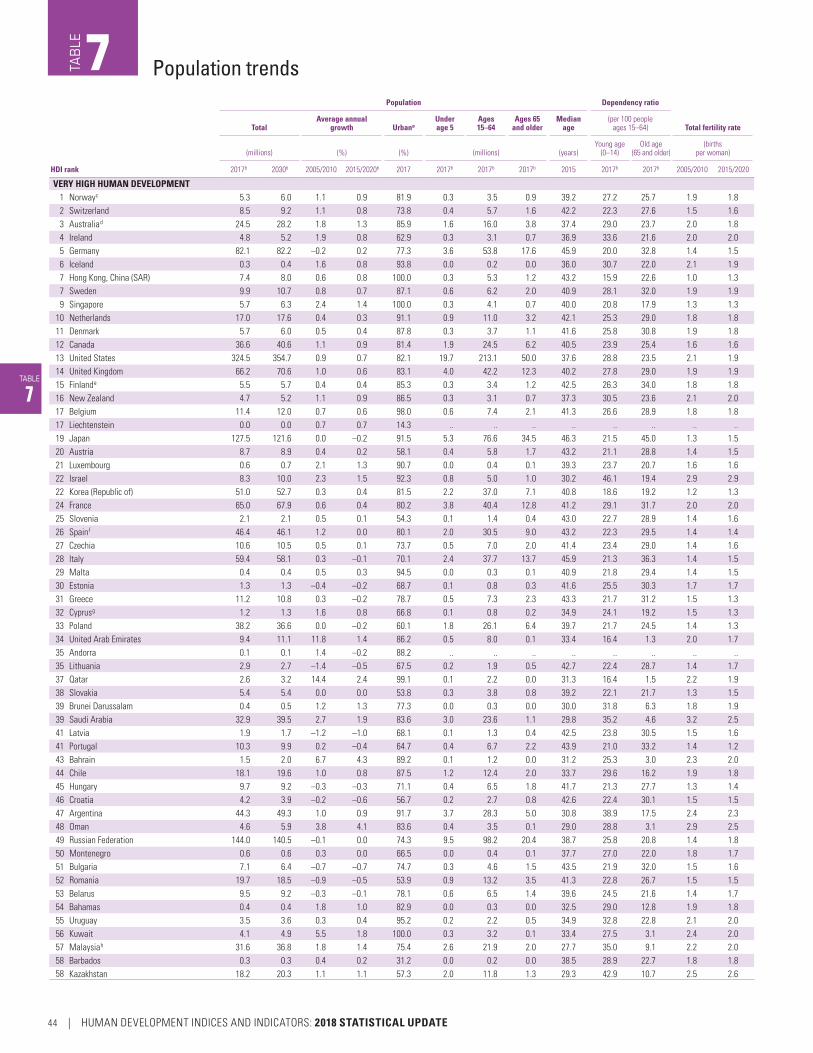
TABLE
7
Population Dependency ratio
TotalAverage annual
growth UrbanaUnder age 5
Ages 15–64
Ages 65 and older
Median age
(per 100 people ages 15–64) Total fertility rate
(millions) (%) (%) (millions) (years)Young age
(0–14)Old age
(65 and older)(births
per woman)
HDI rank 2017b 2030b 2005/2010 2015/2020b 2017 2017b 2017b 2017b 2015 2017b 2017b 2005/2010 2015/2020
VERY HIGH HUMAN DEVELOPMENT1 Norway c 5.3 6.0 1.1 0.9 81.9 0.3 3.5 0.9 39.2 27.2 25.7 1.9 1.82 Switzerland 8.5 9.2 1.1 0.8 73.8 0.4 5.7 1.6 42.2 22.3 27.6 1.5 1.63 Australia d 24.5 28.2 1.8 1.3 85.9 1.6 16.0 3.8 37.4 29.0 23.7 2.0 1.84 Ireland 4.8 5.2 1.9 0.8 62.9 0.3 3.1 0.7 36.9 33.6 21.6 2.0 2.05 Germany 82.1 82.2 –0.2 0.2 77.3 3.6 53.8 17.6 45.9 20.0 32.8 1.4 1.56 Iceland 0.3 0.4 1.6 0.8 93.8 0.0 0.2 0.0 36.0 30.7 22.0 2.1 1.97 Hong Kong, China (SAR) 7.4 8.0 0.6 0.8 100.0 0.3 5.3 1.2 43.2 15.9 22.6 1.0 1.37 Sweden 9.9 10.7 0.8 0.7 87.1 0.6 6.2 2.0 40.9 28.1 32.0 1.9 1.99 Singapore 5.7 6.3 2.4 1.4 100.0 0.3 4.1 0.7 40.0 20.8 17.9 1.3 1.3
10 Netherlands 17.0 17.6 0.4 0.3 91.1 0.9 11.0 3.2 42.1 25.3 29.0 1.8 1.811 Denmark 5.7 6.0 0.5 0.4 87.8 0.3 3.7 1.1 41.6 25.8 30.8 1.9 1.812 Canada 36.6 40.6 1.1 0.9 81.4 1.9 24.5 6.2 40.5 23.9 25.4 1.6 1.613 United States 324.5 354.7 0.9 0.7 82.1 19.7 213.1 50.0 37.6 28.8 23.5 2.1 1.914 United Kingdom 66.2 70.6 1.0 0.6 83.1 4.0 42.2 12.3 40.2 27.8 29.0 1.9 1.915 Finland e 5.5 5.7 0.4 0.4 85.3 0.3 3.4 1.2 42.5 26.3 34.0 1.8 1.816 New Zealand 4.7 5.2 1.1 0.9 86.5 0.3 3.1 0.7 37.3 30.5 23.6 2.1 2.017 Belgium 11.4 12.0 0.7 0.6 98.0 0.6 7.4 2.1 41.3 26.6 28.9 1.8 1.817 Liechtenstein 0.0 0.0 0.7 0.7 14.3 .. .. .. .. .. .. .. ..19 Japan 127.5 121.6 0.0 –0.2 91.5 5.3 76.6 34.5 46.3 21.5 45.0 1.3 1.520 Austria 8.7 8.9 0.4 0.2 58.1 0.4 5.8 1.7 43.2 21.1 28.8 1.4 1.521 Luxembourg 0.6 0.7 2.1 1.3 90.7 0.0 0.4 0.1 39.3 23.7 20.7 1.6 1.622 Israel 8.3 10.0 2.3 1.5 92.3 0.8 5.0 1.0 30.2 46.1 19.4 2.9 2.922 Korea (Republic of) 51.0 52.7 0.3 0.4 81.5 2.2 37.0 7.1 40.8 18.6 19.2 1.2 1.324 France 65.0 67.9 0.6 0.4 80.2 3.8 40.4 12.8 41.2 29.1 31.7 2.0 2.025 Slovenia 2.1 2.1 0.5 0.1 54.3 0.1 1.4 0.4 43.0 22.7 28.9 1.4 1.626 Spain f 46.4 46.1 1.2 0.0 80.1 2.0 30.5 9.0 43.2 22.3 29.5 1.4 1.427 Czechia 10.6 10.5 0.5 0.1 73.7 0.5 7.0 2.0 41.4 23.4 29.0 1.4 1.628 Italy 59.4 58.1 0.3 –0.1 70.1 2.4 37.7 13.7 45.9 21.3 36.3 1.4 1.529 Malta 0.4 0.4 0.5 0.3 94.5 0.0 0.3 0.1 40.9 21.8 29.4 1.4 1.530 Estonia 1.3 1.3 –0.4 –0.2 68.7 0.1 0.8 0.3 41.6 25.5 30.3 1.7 1.731 Greece 11.2 10.8 0.3 –0.2 78.7 0.5 7.3 2.3 43.3 21.7 31.2 1.5 1.332 Cyprus g 1.2 1.3 1.6 0.8 66.8 0.1 0.8 0.2 34.9 24.1 19.2 1.5 1.333 Poland 38.2 36.6 0.0 –0.2 60.1 1.8 26.1 6.4 39.7 21.7 24.5 1.4 1.334 United Arab Emirates 9.4 11.1 11.8 1.4 86.2 0.5 8.0 0.1 33.4 16.4 1.3 2.0 1.735 Andorra 0.1 0.1 1.4 –0.2 88.2 .. .. .. .. .. .. .. ..35 Lithuania 2.9 2.7 –1.4 –0.5 67.5 0.2 1.9 0.5 42.7 22.4 28.7 1.4 1.737 Qatar 2.6 3.2 14.4 2.4 99.1 0.1 2.2 0.0 31.3 16.4 1.5 2.2 1.938 Slovakia 5.4 5.4 0.0 0.0 53.8 0.3 3.8 0.8 39.2 22.1 21.7 1.3 1.539 Brunei Darussalam 0.4 0.5 1.2 1.3 77.3 0.0 0.3 0.0 30.0 31.8 6.3 1.8 1.939 Saudi Arabia 32.9 39.5 2.7 1.9 83.6 3.0 23.6 1.1 29.8 35.2 4.6 3.2 2.541 Latvia 1.9 1.7 –1.2 –1.0 68.1 0.1 1.3 0.4 42.5 23.8 30.5 1.5 1.641 Portugal 10.3 9.9 0.2 –0.4 64.7 0.4 6.7 2.2 43.9 21.0 33.2 1.4 1.243 Bahrain 1.5 2.0 6.7 4.3 89.2 0.1 1.2 0.0 31.2 25.3 3.0 2.3 2.044 Chile 18.1 19.6 1.0 0.8 87.5 1.2 12.4 2.0 33.7 29.6 16.2 1.9 1.845 Hungary 9.7 9.2 –0.3 –0.3 71.1 0.4 6.5 1.8 41.7 21.3 27.7 1.3 1.446 Croatia 4.2 3.9 –0.2 –0.6 56.7 0.2 2.7 0.8 42.6 22.4 30.1 1.5 1.547 Argentina 44.3 49.3 1.0 0.9 91.7 3.7 28.3 5.0 30.8 38.9 17.5 2.4 2.348 Oman 4.6 5.9 3.8 4.1 83.6 0.4 3.5 0.1 29.0 28.8 3.1 2.9 2.549 Russian Federation 144.0 140.5 –0.1 0.0 74.3 9.5 98.2 20.4 38.7 25.8 20.8 1.4 1.850 Montenegro 0.6 0.6 0.3 0.0 66.5 0.0 0.4 0.1 37.7 27.0 22.0 1.8 1.751 Bulgaria 7.1 6.4 –0.7 –0.7 74.7 0.3 4.6 1.5 43.5 21.9 32.0 1.5 1.652 Romania 19.7 18.5 –0.9 –0.5 53.9 0.9 13.2 3.5 41.3 22.8 26.7 1.5 1.553 Belarus 9.5 9.2 –0.3 –0.1 78.1 0.6 6.5 1.4 39.6 24.5 21.6 1.4 1.754 Bahamas 0.4 0.4 1.8 1.0 82.9 0.0 0.3 0.0 32.5 29.0 12.8 1.9 1.855 Uruguay 3.5 3.6 0.3 0.4 95.2 0.2 2.2 0.5 34.9 32.8 22.8 2.1 2.056 Kuwait 4.1 4.9 5.5 1.8 100.0 0.3 3.2 0.1 33.4 27.5 3.1 2.4 2.057 Malaysia h 31.6 36.8 1.8 1.4 75.4 2.6 21.9 2.0 27.7 35.0 9.1 2.2 2.058 Barbados 0.3 0.3 0.4 0.2 31.2 0.0 0.2 0.0 38.5 28.9 22.7 1.8 1.858 Kazakhstan 18.2 20.3 1.1 1.1 57.3 2.0 11.8 1.3 29.3 42.9 10.7 2.5 2.6
Population trendsTAB
LE7
44 | HUMAN DEVELOPMENT INDICES AND INDICATORS: 2018 STATISTICAL UPDATE

TABLE
7
Population Dependency ratio
TotalAverage annual
growth UrbanaUnder age 5
Ages 15–64
Ages 65 and older
Median age
(per 100 people ages 15–64) Total fertility rate
(millions) (%) (%) (millions) (years)Young age
(0–14)Old age
(65 and older)(births
per woman)
HDI rank 2017b 2030b 2005/2010 2015/2020b 2017 2017b 2017b 2017b 2015 2017b 2017b 2005/2010 2015/2020
HIGH HUMAN DEVELOPMENT60 Iran (Islamic Republic of) 81.2 88.9 1.1 1.0 74.4 6.7 57.5 4.4 29.5 33.4 7.7 1.8 1.660 Palau 0.0 0.0 0.6 1.1 79.4 .. .. .. .. .. .. .. ..62 Seychelles 0.1 0.1 0.6 0.5 56.3 0.0 0.1 0.0 34.6 32.2 12.4 2.3 2.363 Costa Rica 4.9 5.4 1.4 1.0 78.6 0.3 3.4 0.5 31.4 31.4 13.7 2.0 1.864 Turkey 80.7 88.4 1.3 1.4 74.6 6.7 54.0 6.6 29.9 37.3 12.2 2.2 2.065 Mauritius i 1.3 1.3 0.4 0.2 40.8 0.1 0.9 0.1 35.6 26.0 15.5 1.7 1.466 Panama 4.1 4.9 1.8 1.6 67.4 0.4 2.7 0.3 28.4 42.3 12.2 2.6 2.567 Serbia j 8.8 8.4 –0.4 –0.3 55.9 0.5 5.8 1.5 40.0 24.9 26.2 1.6 1.668 Albania 2.9 2.9 –0.9 0.1 59.4 0.2 2.0 0.4 36.2 25.1 19.0 1.6 1.769 Trinidad and Tobago 1.4 1.4 0.5 0.3 53.2 0.1 0.9 0.1 33.9 29.8 14.4 1.8 1.770 Antigua and Barbuda 0.1 0.1 1.2 1.0 24.7 0.0 0.1 0.0 30.7 34.5 10.0 2.2 2.070 Georgia k 3.9 3.7 –1.2 –0.3 58.2 0.3 2.6 0.6 38.0 29.1 22.5 1.8 2.072 Saint Kitts and Nevis 0.1 0.1 1.1 0.9 30.8 .. .. .. .. .. .. .. ..73 Cuba 11.5 11.5 0.1 0.1 77.0 0.6 8.0 1.7 41.1 23.2 21.3 1.6 1.774 Mexico 129.2 147.5 1.6 1.2 79.9 11.5 85.9 8.9 27.5 40.1 10.3 2.4 2.175 Grenada 0.1 0.1 0.3 0.5 36.2 0.0 0.1 0.0 27.2 39.7 11.0 2.3 2.176 Sri Lanka 20.9 21.5 0.7 0.4 18.4 1.6 13.8 2.1 32.3 36.4 15.3 2.3 2.077 Bosnia and Herzegovina 3.5 3.4 –0.3 –0.2 47.9 0.2 2.4 0.6 41.0 20.4 23.9 1.3 1.478 Venezuela (Bolivarian Republic of) 32.0 36.7 1.6 1.3 88.2 3.0 21.0 2.1 27.4 41.9 10.1 2.6 2.379 Brazil 209.3 225.5 1.0 0.8 86.3 14.8 145.9 17.9 31.3 31.2 12.3 1.9 1.780 Azerbaijan l 9.8 10.7 1.1 1.0 55.3 0.9 6.9 0.6 30.3 32.9 8.5 1.8 2.080 Lebanon 6.1 5.4 1.7 0.6 88.4 0.5 4.2 0.5 28.5 33.8 12.4 1.6 1.780 The former Yugoslav Republic of Macedonia 2.1 2.1 0.1 0.1 57.7 0.1 1.5 0.3 37.4 23.8 18.9 1.5 1.683 Armenia 2.9 2.9 –0.7 0.1 63.1 0.2 2.0 0.3 33.9 29.1 16.3 1.7 1.683 Thailand 69.0 69.6 0.5 0.2 49.2 3.7 49.2 7.9 37.8 24.3 15.9 1.6 1.585 Algeria 41.3 48.8 1.6 1.7 72.1 4.7 26.7 2.6 27.5 45.4 9.6 2.7 2.786 China 1,409.5 1,441.2 0.6 0.4 58.0 85.1 1,010.4 150.0 37.0 24.7 14.8 1.6 1.686 Ecuador 16.6 19.6 1.7 1.4 63.7 1.6 10.7 1.2 26.6 44.1 11.0 2.7 2.488 Ukraine m 44.2 41.2 –0.5 –0.5 69.2 2.3 30.1 7.3 40.3 22.8 24.2 1.4 1.689 Peru 32.2 36.8 1.2 1.2 77.7 3.0 21.1 2.3 27.5 41.8 10.9 2.6 2.490 Colombia 49.1 53.1 1.2 0.8 80.4 3.7 33.8 3.8 30.1 34.1 11.1 2.1 1.890 Saint Lucia 0.2 0.2 1.1 0.4 18.6 0.0 0.1 0.0 32.6 26.4 13.6 1.6 1.492 Fiji 0.9 1.0 0.9 0.7 55.7 0.1 0.6 0.1 27.6 43.6 9.5 2.8 2.592 Mongolia 3.1 3.6 1.4 1.5 68.4 0.4 2.0 0.1 27.1 44.7 6.1 2.4 2.794 Dominican Republic 10.8 12.1 1.4 1.1 80.3 1.1 6.9 0.8 26.1 46.0 11.0 2.7 2.495 Jordan 9.7 11.1 4.6 2.2 90.7 1.2 5.9 0.4 22.1 58.5 6.3 3.7 3.395 Tunisia 11.5 12.8 1.0 1.1 68.6 1.1 7.8 0.9 31.1 35.3 11.8 2.0 2.297 Jamaica 2.9 2.9 0.5 0.3 55.4 0.2 2.0 0.3 29.4 33.6 14.3 2.3 2.098 Tonga 0.1 0.1 0.6 0.9 23.2 0.0 0.1 0.0 21.3 61.4 10.0 4.0 3.699 Saint Vincent and the Grenadines 0.1 0.1 0.1 0.2 51.8 0.0 0.1 0.0 29.8 34.7 11.3 2.1 1.9
100 Suriname 0.6 0.6 1.1 0.9 66.0 0.1 0.4 0.0 28.4 39.7 10.4 2.6 2.3101 Botswana 2.3 2.8 1.6 1.8 68.7 0.3 1.5 0.1 24.4 48.6 6.1 2.9 2.7101 Maldives 0.4 0.5 2.7 1.8 39.4 0.0 0.3 0.0 27.9 32.3 5.7 2.3 2.0103 Dominica 0.1 0.1 0.2 0.5 70.2 .. .. .. .. .. .. .. ..104 Samoa 0.2 0.2 0.7 0.6 18.5 0.0 0.1 0.0 21.2 63.3 9.7 4.5 3.9105 Uzbekistan 31.9 36.7 1.5 1.4 50.6 3.2 21.6 1.4 26.3 41.4 6.6 2.5 2.2106 Belize 0.4 0.5 2.5 2.0 45.6 0.0 0.2 0.0 23.5 48.5 6.0 2.8 2.5106 Marshall Islands 0.1 0.1 0.1 0.1 76.6 .. .. .. .. .. .. .. ..108 Libya 6.4 7.3 1.3 1.3 79.8 0.6 4.3 0.3 27.2 41.8 6.6 2.4 2.2108 Turkmenistan 5.8 6.8 1.4 1.6 51.2 0.7 3.7 0.2 25.6 47.7 6.6 2.7 2.8110 Gabon 2.0 2.6 3.1 2.2 89.0 0.3 1.2 0.1 22.6 60.2 7.5 4.2 3.7110 Paraguay 6.8 7.8 1.4 1.2 61.3 0.7 4.4 0.4 24.9 45.8 9.9 2.9 2.5112 Moldova (Republic of) n 4.1 3.8 –0.4 –0.2 42.6 0.2 3.0 0.4 35.6 21.4 14.8 1.3 1.2MEDIUM HUMAN DEVELOPMENT113 Philippines 104.9 125.4 1.7 1.5 46.7 11.6 66.6 5.0 24.1 50.0 7.6 3.3 2.9113 South Africa 56.7 64.5 1.1 1.2 65.8 5.7 37.2 3.0 26.1 44.1 8.1 2.6 2.4115 Egypt 97.6 119.7 1.8 1.9 42.7 12.9 59.9 5.0 24.7 54.5 8.4 3.0 3.2116 Indonesia 264.0 295.6 1.3 1.1 54.7 24.7 177.7 14.0 28.0 40.6 7.9 2.5 2.3116 Viet Nam 95.5 106.3 1.0 1.0 35.2 7.7 66.7 6.8 30.4 33.0 10.2 1.9 2.0
HUMAN DEVELOPMENT INDICES AND INDICATORS: 2018 STATISTICAL UPDATE
TABLE 7 Population trends | 45

TABLE 7 POPULATION TRENDS
TABLE
7
Population Dependency ratio
TotalAverage annual
growth UrbanaUnder age 5
Ages 15–64
Ages 65 and older
Median age
(per 100 people ages 15–64) Total fertility rate
(millions) (%) (%) (millions) (years)Young age
(0–14)Old age
(65 and older)(births
per woman)
HDI rank 2017b 2030b 2005/2010 2015/2020b 2017 2017b 2017b 2017b 2015 2017b 2017b 2005/2010 2015/2020
118 Bolivia (Plurinational State of) 11.1 13.2 1.7 1.5 69.1 1.2 6.8 0.7 24.1 51.3 10.9 3.4 2.8119 Palestine, State of o 4.9 6.7 2.6 2.6 75.9 0.7 2.8 0.1 19.3 69.0 5.3 4.6 3.9120 Iraq 38.3 53.3 2.6 2.8 70.3 5.8 21.6 1.2 19.4 71.6 5.6 4.6 4.3121 El Salvador 6.4 6.8 0.4 0.5 71.3 0.6 4.1 0.5 25.8 42.5 12.9 2.4 2.1122 Kyrgyzstan 6.0 7.0 1.3 1.4 36.1 0.8 3.8 0.3 25.3 50.0 7.1 2.8 2.9123 Morocco 35.7 40.9 1.2 1.3 61.9 3.5 23.5 2.4 27.9 41.6 10.3 2.6 2.4124 Nicaragua 6.2 7.0 1.3 1.1 58.3 0.6 4.1 0.3 25.2 44.3 8.3 2.6 2.2125 Cabo Verde 0.5 0.6 1.1 1.3 65.3 0.1 0.4 0.0 23.8 46.2 6.8 2.9 2.3125 Guyana 0.8 0.8 –0.1 0.6 26.5 0.1 0.5 0.0 24.6 44.1 8.1 2.7 2.5127 Guatemala 16.9 21.2 2.2 1.9 50.7 2.0 10.2 0.8 21.3 58.2 7.8 3.6 2.9127 Tajikistan 8.9 11.2 2.2 2.1 27.0 1.2 5.5 0.3 22.4 57.5 5.7 3.5 3.3129 Namibia 2.5 3.2 1.3 2.1 49.0 0.3 1.5 0.1 21.0 61.4 5.9 3.6 3.3130 India 1,339.2 1,513.0 1.5 1.1 33.6 119.8 886.9 80.2 26.7 42.0 9.0 2.8 2.3131 Micronesia (Federated States of) 0.1 0.1 –0.5 0.6 22.6 0.0 0.1 0.0 21.5 53.4 7.7 3.6 3.1132 Timor-Leste 1.3 1.7 1.6 2.1 30.2 0.2 0.7 0.0 17.4 82.5 6.7 6.5 5.3133 Honduras 9.3 11.1 2.1 1.6 56.5 1.0 5.9 0.4 23.0 49.7 7.3 3.2 2.4134 Bhutan 0.8 0.9 2.1 1.2 40.2 0.1 0.6 0.0 26.3 38.7 7.1 2.6 2.0134 Kiribati 0.1 0.1 2.1 1.7 53.3 0.0 0.1 0.0 22.4 57.3 6.4 3.9 3.6136 Bangladesh 164.7 185.6 1.2 1.0 35.9 15.2 109.6 8.4 25.6 42.6 7.7 2.5 2.1137 Congo 5.3 7.3 3.3 2.6 66.5 0.8 2.9 0.2 18.9 77.8 6.3 5.0 4.6138 Vanuatu 0.3 0.4 2.4 2.1 25.2 0.0 0.2 0.0 22.2 60.1 7.4 3.6 3.2139 Lao People's Democratic Republic 6.9 8.0 1.6 1.4 34.4 0.8 4.3 0.3 22.7 52.1 6.4 3.4 2.6140 Ghana 28.8 37.3 2.6 2.2 55.4 4.1 16.8 1.0 20.4 66.3 5.8 4.4 3.9141 Equatorial Guinea 1.3 1.9 4.6 3.6 71.6 0.2 0.8 0.0 22.2 62.0 4.7 5.4 4.6142 Kenya 49.7 67.0 2.7 2.5 26.6 7.1 28.3 1.3 19.0 71.2 4.7 4.7 3.8143 Sao Tome and Principe 0.2 0.3 2.3 2.2 72.0 0.0 0.1 0.0 18.1 78.9 5.3 4.9 4.4144 Eswatini (Kingdom of) 1.4 1.7 1.7 1.7 23.6 0.2 0.8 0.0 20.4 62.3 5.3 3.8 3.0144 Zambia 17.1 24.9 2.8 3.0 43.0 2.9 9.0 0.4 17.1 84.9 4.7 5.6 4.9146 Cambodia 16.0 18.8 1.5 1.5 23.0 1.8 10.3 0.7 24.0 48.6 6.9 3.1 2.5147 Angola 29.8 44.7 3.6 3.3 64.8 5.4 15.1 0.7 16.4 92.2 4.7 6.4 5.6148 Myanmar 53.4 58.9 0.7 0.9 30.3 4.5 36.0 3.1 27.7 39.8 8.5 2.6 2.2149 Nepal 29.3 33.2 1.1 1.1 19.3 2.7 18.5 1.7 23.2 48.8 9.2 3.0 2.1150 Pakistan 197.0 244.2 2.1 1.9 36.4 25.1 119.6 8.9 22.5 57.3 7.4 4.0 3.4151 Cameroon 24.1 33.0 2.7 2.6 55.8 3.9 13.0 0.8 18.3 79.0 5.8 5.3 4.6LOW HUMAN DEVELOPMENT152 Solomon Islands 0.6 0.8 2.3 1.9 23.3 0.1 0.4 0.0 19.9 67.4 6.1 4.4 3.8153 Papua New Guinea 8.3 10.5 2.4 2.0 13.1 1.0 5.0 0.3 21.7 59.6 6.3 4.1 3.6154 Tanzania (United Republic of) p 57.3 83.7 3.1 3.1 33.1 9.9 29.8 1.8 17.3 86.4 6.0 5.6 4.9155 Syrian Arab Republic 18.3 26.6 2.8 0.2 53.5 2.0 10.8 0.8 20.2 61.9 7.4 3.4 2.8156 Zimbabwe 16.5 21.5 1.7 2.3 32.2 2.5 9.3 0.5 19.0 73.6 5.0 4.0 3.6157 Nigeria 190.9 264.1 2.6 2.6 49.5 32.4 101.7 5.3 17.9 82.6 5.2 5.9 5.4158 Rwanda 12.2 16.0 2.6 2.4 17.1 1.7 6.9 0.4 19.4 70.6 5.2 4.9 3.8159 Lesotho 2.2 2.6 0.9 1.3 27.7 0.3 1.3 0.1 21.3 58.9 7.5 3.4 3.0159 Mauritania 4.4 6.1 2.8 2.7 52.8 0.7 2.5 0.1 19.7 70.1 5.5 5.1 4.6161 Madagascar 25.6 35.6 2.9 2.7 36.5 3.8 14.3 0.7 18.7 73.0 5.2 4.8 4.1162 Uganda 42.9 63.8 3.4 3.2 23.2 7.9 21.5 0.9 15.8 95.2 4.3 6.4 5.5163 Benin 11.2 15.6 2.8 2.7 46.8 1.8 6.0 0.4 18.2 78.9 6.0 5.5 4.9164 Senegal 15.9 22.1 2.8 2.8 46.7 2.6 8.6 0.5 18.3 79.2 5.6 5.1 4.7165 Comoros 0.8 1.1 2.4 2.2 28.8 0.1 0.5 0.0 19.7 69.5 5.2 4.9 4.2165 Togo 7.8 10.5 2.7 2.5 41.2 1.2 4.3 0.2 18.9 74.8 5.1 5.0 4.4167 Sudan 40.5 54.8 2.1 2.4 34.4 6.0 22.5 1.4 18.9 73.4 6.4 5.0 4.4168 Afghanistan 35.5 46.7 2.8 2.4 25.2 5.3 19.2 0.9 17.3 79.8 4.8 6.4 4.4168 Haiti 11.0 12.5 1.5 1.2 54.3 1.2 6.8 0.5 23.0 53.0 7.7 3.6 2.9170 Côte d'Ivoire 24.3 33.3 2.1 2.5 50.3 3.9 13.3 0.7 18.3 77.7 5.4 5.4 4.8171 Malawi 18.6 26.6 3.0 2.9 16.7 3.0 9.9 0.6 17.4 82.9 5.6 5.7 4.5172 Djibouti 1.0 1.1 1.7 1.5 77.6 0.1 0.6 0.0 23.7 48.0 6.5 3.6 2.8173 Ethiopia 105.0 139.6 2.7 2.4 20.3 15.4 58.7 3.7 18.6 72.5 6.3 5.3 4.0174 Gambia 2.1 3.0 3.2 3.0 60.6 0.4 1.1 0.0 17.0 86.6 4.5 5.8 5.3175 Guinea 12.7 17.6 2.2 2.6 35.8 2.0 6.9 0.4 18.4 77.4 5.7 5.5 4.7176 Congo (Democratic Republic of the) 81.3 120.4 3.3 3.2 43.9 14.8 41.2 2.5 16.8 91.3 6.0 6.6 6.0177 Guinea-Bissau 1.9 2.5 2.4 2.4 42.9 0.3 1.0 0.1 18.9 74.8 5.4 5.2 4.5
46 | HUMAN DEVELOPMENT INDICES AND INDICATORS: 2018 STATISTICAL UPDATE

TABLE
7
Population Dependency ratio
TotalAverage annual
growth UrbanaUnder age 5
Ages 15–64
Ages 65 and older
Median age
(per 100 people ages 15–64) Total fertility rate
(millions) (%) (%) (millions) (years)Young age
(0–14)Old age
(65 and older)(births
per woman)
HDI rank 2017b 2030b 2005/2010 2015/2020b 2017 2017b 2017b 2017b 2015 2017b 2017b 2005/2010 2015/2020
178 Yemen 28.3 36.8 2.7 2.3 36.0 4.1 16.1 0.8 19.2 69.8 5.1 5.0 3.8179 Eritrea 5.1 6.7 2.0 2.3 39.5 0.7 2.8 0.2 18.9 76.5 6.6 4.8 4.0180 Mozambique 29.7 42.4 2.9 2.9 35.5 5.0 15.4 0.9 17.2 86.1 6.1 5.7 5.1181 Liberia 4.7 6.5 3.8 2.5 50.7 0.7 2.6 0.1 18.6 75.8 5.5 5.2 4.5182 Mali 18.5 27.1 3.3 3.0 41.6 3.4 9.2 0.5 16.0 95.8 5.1 6.7 5.9183 Burkina Faso 19.2 27.4 3.0 2.9 28.7 3.3 10.1 0.5 17.0 86.2 4.6 6.1 5.2184 Sierra Leone 7.6 9.7 2.6 2.1 41.6 1.1 4.2 0.2 18.3 76.0 4.6 5.6 4.3185 Burundi 10.9 15.8 3.3 3.2 12.7 2.0 5.7 0.3 17.6 85.8 4.9 6.5 5.6186 Chad 14.9 21.5 3.3 3.0 22.9 2.7 7.5 0.4 16.1 93.6 4.9 6.9 5.8187 South Sudan 12.6 17.3 4.3 2.7 19.3 2.0 6.9 0.4 18.6 75.9 6.3 5.6 4.7188 Central African Republic 4.7 6.1 1.5 1.6 41.0 0.7 2.5 0.2 17.8 81.3 6.9 5.3 4.8189 Niger 21.5 35.0 3.7 3.8 16.4 4.4 10.1 0.5 14.9 106.2 5.4 7.6 7.2OTHER COUNTRIES OR TERRITORIES
.. Korea (Democratic People's Rep. of) 25.5 26.7 0.6 0.5 61.7 1.7 17.8 2.4 34.0 29.5 13.6 2.0 1.9
.. Monaco 0.0 0.0 1.9 0.5 100.0 .. .. .. .. .. .. .. ..
.. Nauru 0.0 0.0 –0.2 –0.1 100.0 .. .. .. .. .. .. .. ..
.. San Marino 0.0 0.0 1.2 0.5 97.1 .. .. .. .. .. .. .. ..
.. Somalia 14.7 21.5 2.9 2.9 44.4 2.7 7.5 0.4 16.5 91.3 5.4 7.1 6.1
.. Tuvalu 0.0 0.0 1.0 0.9 61.5 .. .. .. .. .. .. .. ..Human development groups
Very high human development 1,439.3 1,503.3 0.7 0.4 80.1 82.9 948.3 242.5 39.7 26.2 25.6 1.7 1.8High human development 2,378.9 2,497.0 0.8 0.6 64.3 162.9 1,669.6 230.1 34.4 28.7 13.8 1.8 1.8Medium human development 2,732.9 3,177.5 1.5 1.3 39.5 275.4 1,772.4 149.1 25.7 45.8 8.4 3.0 2.6Low human development 926.2 1,291.2 2.8 2.6 35.9 150.7 497.5 27.9 17.9 80.6 5.6 5.6 4.9
Developing countries 6,259.9 7,220.8 1.4 1.3 49.7 608.2 4,090.4 423.7 28.1 42.7 10.4 2.8 2.6Regions
Arab States 409.5 513.6 2.5 1.9 58.6 50.4 255.9 18.4 24.3 52.8 7.2 3.5 3.2East Asia and the Pacific 2,091.4 2,205.9 0.8 0.6 54.7 146.2 1,470.1 192.8 34.3 29.1 13.1 1.8 1.9Europe and Central Asia 243.9 259.3 0.7 0.8 63.0 19.9 163.7 23.6 32.2 34.6 14.4 2.0 2.0Latin America and the Caribbean 640.2 713.1 1.3 1.0 80.3 53.1 429.2 51.2 29.2 37.2 11.9 2.3 2.0South Asia 1,869.0 2,134.4 1.5 1.2 35.3 176.5 1,226.1 106.6 26.1 43.7 8.7 2.9 2.4Sub-Saharan Africa 1,005.8 1,394.4 2.8 2.7 39.7 162.2 545.4 30.9 18.3 78.7 5.7 5.4 4.7
Least developed countries 1,002.5 1,334.2 2.4 2.3 33.0 145.1 569.4 36.1 19.9 69.7 6.3 4.7 4.1Small island developing states 57.4 64.8 1.2 1.1 55.3 5.6 36.6 4.3 27.9 44.4 11.8 2.9 2.7
Organisation for Economic Co‑operation and Development 1,292.6 1,363.4 0.7 0.5 80.4 75.7 843.4 217.2 39.0 27.5 25.8 1.8 1.8
World 7,550.3 T 8,551.2 T 1.2 T 1.1 T 54.8 T 677.9 T 4,936.6 T 656.8 T 29.6 T 39.6 T 13.3 T 2.6 T 2.5 T
NOTES
a Because data are based on national definitions of what constitutes a city or metropolitan area, cross-country comparison should be made with caution.
b Projections based on medium-fertility variant.
c Includes Svalbard and Jan Mayen Islands.
d Includes Christmas Island, Cocos (Keeling) Islands and Norfolk Island.
e Includes Åland Islands.
f Includes Canary Islands, Ceuta and Melilla.
g Includes Northern Cyprus.
h Includes Sabah and Sarawak.
i Includes Agalega, Rodrigues and Saint Brandon.
j Includes Kosovo.
k Includes Abkhazia and South Ossetia.
l Includes Nagorno-Karabakh.
m Includes Crimea.
n Includes Transnistria.
o Includes East Jerusalem.
p Includes Zanzibar.
T From original data source.
DEFINITIONS
Total population: De facto population in a country, area or region as of 1 July.
Population average annual growth: Average annual exponential growth rate for the period specified.
Urban population: De facto population living in areas classified as urban according to the criteria used by each country or area as of 1 July.
Population under age 5: De facto population in a country, area or region under age 5 as of 1 July.
Population ages 15–64: De facto population in a country, area or region ages 15–64 as of 1 July.
Population ages 65 and older: De facto population in a country, area or region ages 65 and older as of 1 July.
Median age: Age that divides the population distribution into two equal parts — that is, 50 percent of the population is above that age and 50 percent is below it.
Young age dependency ratio: Ratio of the population ages 0–14 to the population ages 15–64, expressed as the number of dependants per 100 people of working age (ages 15–64).
Old‑age dependency ratio: Ratio of the population ages 65 and older to the population ages 15–64, expressed as the number of dependants per 100 people of working age (ages 15–64).
Total fertility rate: Number of children who would be born to a woman if she were to live to the end of her child-bearing years and bear children at each age in accordance with prevailing age-specific fertility rates.
MAIN DATA SOURCES
Columns 1–4 and 6–13: UNDESA (2017a).
Column 5: UNDESA (2018a).
HUMAN DEVELOPMENT INDICES AND INDICATORS: 2018 STATISTICAL UPDATE
TABLE 7 Population trends | 47
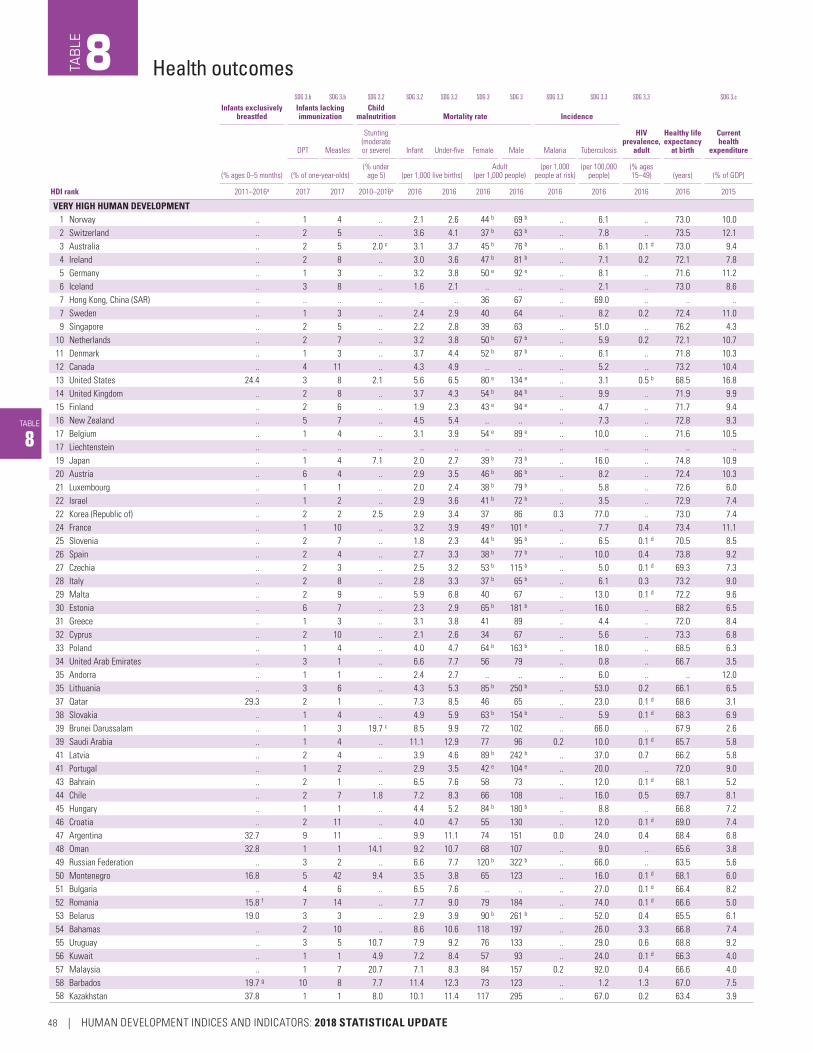
TABLE
8
SDG 3.b SDG 3.b SDG 2.2 SDG 3.2 SDG 3.2 SDG 3 SDG 3 SDG 3.3 SDG 3.3 SDG 3.3 SDG 3.c
Infants exclusively breastfed
Infants lacking immunization
Child malnutrition Mortality rate Incidence
HIV prevalence,
adult
Healthy life expectancy
at birth
Current health
expenditure
(% ages 0–5 months)
DPT Measles
Stunting (moderate or severe) Infant Under-five Female Male Malaria Tuberculosis
(% of one-year-olds)(% under
age 5) (per 1,000 live births)Adult
(per 1,000 people)(per 1,000
people at risk)(per 100,000
people)(% ages 15–49) (years) (% of GDP)
HDI rank 2011–2016a 2017 2017 2010–2016a 2016 2016 2016 2016 2016 2016 2016 2016 2015
VERY HIGH HUMAN DEVELOPMENT1 Norway .. 1 4 .. 2.1 2.6 44 b 69 b .. 6.1 .. 73.0 10.02 Switzerland .. 2 5 .. 3.6 4.1 37 b 63 b .. 7.8 .. 73.5 12.13 Australia .. 2 5 2.0 c 3.1 3.7 45 b 76 b .. 6.1 0.1 d 73.0 9.44 Ireland .. 2 8 .. 3.0 3.6 47 b 81 b .. 7.1 0.2 72.1 7.85 Germany .. 1 3 .. 3.2 3.8 50 e 92 e .. 8.1 .. 71.6 11.26 Iceland .. 3 8 .. 1.6 2.1 .. .. .. 2.1 .. 73.0 8.67 Hong Kong, China (SAR) .. .. .. .. .. .. 36 67 .. 69.0 .. .. ..7 Sweden .. 1 3 .. 2.4 2.9 40 64 .. 8.2 0.2 72.4 11.09 Singapore .. 2 5 .. 2.2 2.8 39 63 .. 51.0 .. 76.2 4.3
10 Netherlands .. 2 7 .. 3.2 3.8 50 b 67 b .. 5.9 0.2 72.1 10.711 Denmark .. 1 3 .. 3.7 4.4 52 b 87 b .. 6.1 .. 71.8 10.312 Canada .. 4 11 .. 4.3 4.9 .. .. .. 5.2 .. 73.2 10.413 United States 24.4 3 8 2.1 5.6 6.5 80 e 134 e .. 3.1 0.5 b 68.5 16.814 United Kingdom .. 2 8 .. 3.7 4.3 54 b 84 b .. 9.9 .. 71.9 9.915 Finland .. 2 6 .. 1.9 2.3 43 e 94 e .. 4.7 .. 71.7 9.416 New Zealand .. 5 7 .. 4.5 5.4 .. .. .. 7.3 .. 72.8 9.317 Belgium .. 1 4 .. 3.1 3.9 54 e 89 e .. 10.0 .. 71.6 10.517 Liechtenstein .. .. .. .. .. .. .. .. .. .. .. .. ..19 Japan .. 1 4 7.1 2.0 2.7 39 b 73 b .. 16.0 .. 74.8 10.920 Austria .. 6 4 .. 2.9 3.5 46 b 86 b .. 8.2 .. 72.4 10.321 Luxembourg .. 1 1 .. 2.0 2.4 38 b 79 b .. 5.8 .. 72.6 6.022 Israel .. 1 2 .. 2.9 3.6 41 b 72 b .. 3.5 .. 72.9 7.422 Korea (Republic of) .. 2 2 2.5 2.9 3.4 37 86 0.3 77.0 .. 73.0 7.424 France .. 1 10 .. 3.2 3.9 49 e 101 e .. 7.7 0.4 73.4 11.125 Slovenia .. 2 7 .. 1.8 2.3 44 b 95 b .. 6.5 0.1 d 70.5 8.526 Spain .. 2 4 .. 2.7 3.3 38 b 77 b .. 10.0 0.4 73.8 9.227 Czechia .. 2 3 .. 2.5 3.2 53 b 115 b .. 5.0 0.1 d 69.3 7.328 Italy .. 2 8 .. 2.8 3.3 37 b 65 b .. 6.1 0.3 73.2 9.029 Malta .. 2 9 .. 5.9 6.8 40 67 .. 13.0 0.1 d 72.2 9.630 Estonia .. 6 7 .. 2.3 2.9 65 b 181 b .. 16.0 .. 68.2 6.531 Greece .. 1 3 .. 3.1 3.8 41 89 .. 4.4 .. 72.0 8.432 Cyprus .. 2 10 .. 2.1 2.6 34 67 .. 5.6 .. 73.3 6.833 Poland .. 1 4 .. 4.0 4.7 64 b 163 b .. 18.0 .. 68.5 6.334 United Arab Emirates .. 3 1 .. 6.6 7.7 56 79 .. 0.8 .. 66.7 3.535 Andorra .. 1 1 .. 2.4 2.7 .. .. .. 6.0 .. .. 12.035 Lithuania .. 3 6 .. 4.3 5.3 85 b 250 b .. 53.0 0.2 66.1 6.537 Qatar 29.3 2 1 .. 7.3 8.5 46 65 .. 23.0 0.1 d 68.6 3.138 Slovakia .. 1 4 .. 4.9 5.9 63 b 154 b .. 5.9 0.1 d 68.3 6.939 Brunei Darussalam .. 1 3 19.7 c 8.5 9.9 72 102 .. 66.0 .. 67.9 2.639 Saudi Arabia .. 1 4 .. 11.1 12.9 77 96 0.2 10.0 0.1 d 65.7 5.841 Latvia .. 2 4 .. 3.9 4.6 89 b 242 b .. 37.0 0.7 66.2 5.841 Portugal .. 1 2 .. 2.9 3.5 42 e 104 e .. 20.0 .. 72.0 9.043 Bahrain .. 2 1 .. 6.5 7.6 58 73 .. 12.0 0.1 d 68.1 5.244 Chile .. 2 7 1.8 7.2 8.3 66 108 .. 16.0 0.5 69.7 8.145 Hungary .. 1 1 .. 4.4 5.2 84 b 180 b .. 8.8 .. 66.8 7.246 Croatia .. 2 11 .. 4.0 4.7 55 130 .. 12.0 0.1 d 69.0 7.447 Argentina 32.7 9 11 .. 9.9 11.1 74 151 0.0 24.0 0.4 68.4 6.848 Oman 32.8 1 1 14.1 9.2 10.7 68 107 .. 9.0 .. 65.6 3.849 Russian Federation .. 3 2 .. 6.6 7.7 120 b 322 b .. 66.0 .. 63.5 5.650 Montenegro 16.8 5 42 9.4 3.5 3.8 65 123 .. 16.0 0.1 d 68.1 6.051 Bulgaria .. 4 6 .. 6.5 7.6 .. .. .. 27.0 0.1 d 66.4 8.252 Romania 15.8 f 7 14 .. 7.7 9.0 79 184 .. 74.0 0.1 d 66.6 5.053 Belarus 19.0 3 3 .. 2.9 3.9 90 b 261 b .. 52.0 0.4 65.5 6.154 Bahamas .. 2 10 .. 8.6 10.6 118 197 .. 26.0 3.3 66.8 7.455 Uruguay .. 3 5 10.7 7.9 9.2 76 133 .. 29.0 0.6 68.8 9.256 Kuwait .. 1 1 4.9 7.2 8.4 57 93 .. 24.0 0.1 d 66.3 4.057 Malaysia .. 1 7 20.7 7.1 8.3 84 157 0.2 92.0 0.4 66.6 4.058 Barbados 19.7 g 10 8 7.7 11.4 12.3 73 123 .. 1.2 1.3 67.0 7.558 Kazakhstan 37.8 1 1 8.0 10.1 11.4 117 295 .. 67.0 0.2 63.4 3.9
Health outcomesTAB
LE8
48 | HUMAN DEVELOPMENT INDICES AND INDICATORS: 2018 STATISTICAL UPDATE
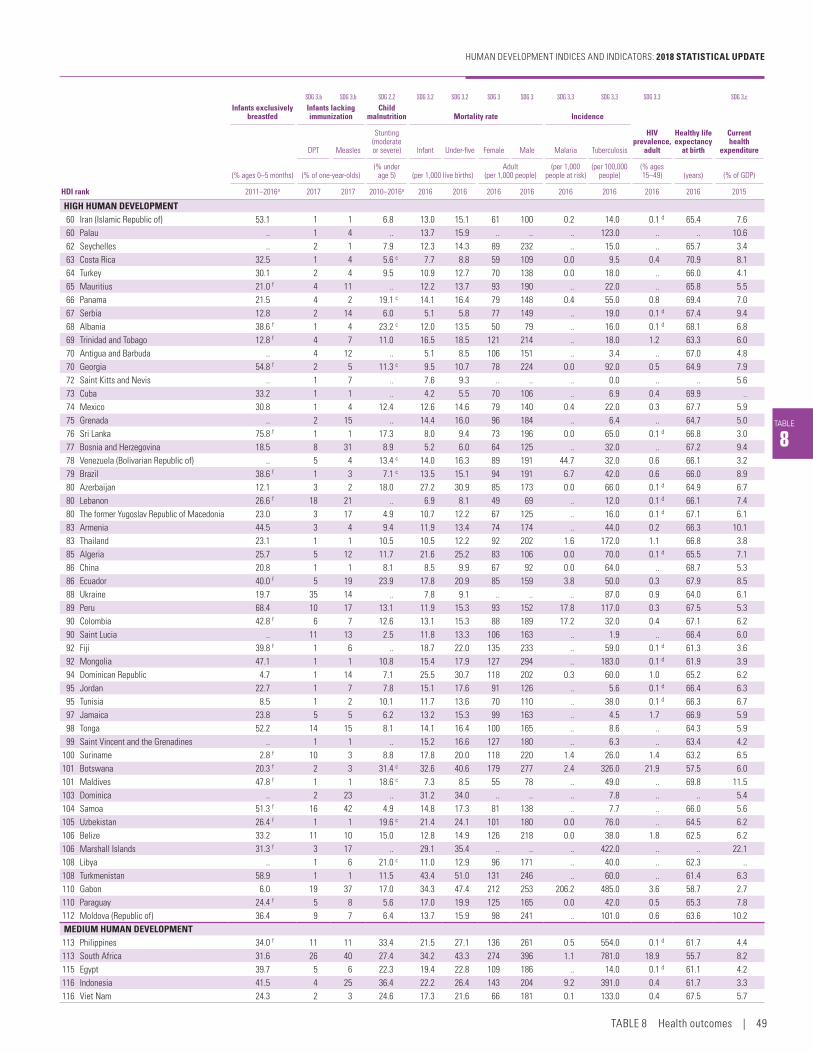
TABLE
8
SDG 3.b SDG 3.b SDG 2.2 SDG 3.2 SDG 3.2 SDG 3 SDG 3 SDG 3.3 SDG 3.3 SDG 3.3 SDG 3.c
Infants exclusively breastfed
Infants lacking immunization
Child malnutrition Mortality rate Incidence
HIV prevalence,
adult
Healthy life expectancy
at birth
Current health
expenditure
(% ages 0–5 months)
DPT Measles
Stunting (moderate or severe) Infant Under-five Female Male Malaria Tuberculosis
(% of one-year-olds)(% under
age 5) (per 1,000 live births)Adult
(per 1,000 people)(per 1,000
people at risk)(per 100,000
people)(% ages 15–49) (years) (% of GDP)
HDI rank 2011–2016a 2017 2017 2010–2016a 2016 2016 2016 2016 2016 2016 2016 2016 2015
HIGH HUMAN DEVELOPMENT60 Iran (Islamic Republic of) 53.1 1 1 6.8 13.0 15.1 61 100 0.2 14.0 0.1 d 65.4 7.660 Palau .. 1 4 .. 13.7 15.9 .. .. .. 123.0 .. .. 10.662 Seychelles .. 2 1 7.9 12.3 14.3 89 232 .. 15.0 .. 65.7 3.463 Costa Rica 32.5 1 4 5.6 c 7.7 8.8 59 109 0.0 9.5 0.4 70.9 8.164 Turkey 30.1 2 4 9.5 10.9 12.7 70 138 0.0 18.0 .. 66.0 4.165 Mauritius 21.0 f 4 11 .. 12.2 13.7 93 190 .. 22.0 .. 65.8 5.566 Panama 21.5 4 2 19.1 c 14.1 16.4 79 148 0.4 55.0 0.8 69.4 7.067 Serbia 12.8 2 14 6.0 5.1 5.8 77 149 .. 19.0 0.1 d 67.4 9.468 Albania 38.6 f 1 4 23.2 c 12.0 13.5 50 79 .. 16.0 0.1 d 68.1 6.869 Trinidad and Tobago 12.8 f 4 7 11.0 16.5 18.5 121 214 .. 18.0 1.2 63.3 6.070 Antigua and Barbuda .. 4 12 .. 5.1 8.5 106 151 .. 3.4 .. 67.0 4.870 Georgia 54.8 f 2 5 11.3 c 9.5 10.7 78 224 0.0 92.0 0.5 64.9 7.972 Saint Kitts and Nevis .. 1 7 .. 7.6 9.3 .. .. .. 0.0 .. .. 5.673 Cuba 33.2 1 1 .. 4.2 5.5 70 106 .. 6.9 0.4 69.9 ..74 Mexico 30.8 1 4 12.4 12.6 14.6 79 140 0.4 22.0 0.3 67.7 5.975 Grenada .. 2 15 .. 14.4 16.0 96 184 .. 6.4 .. 64.7 5.076 Sri Lanka 75.8 f 1 1 17.3 8.0 9.4 73 196 0.0 65.0 0.1 d 66.8 3.077 Bosnia and Herzegovina 18.5 8 31 8.9 5.2 6.0 64 125 .. 32.0 .. 67.2 9.478 Venezuela (Bolivarian Republic of) .. 5 4 13.4 c 14.0 16.3 89 191 44.7 32.0 0.6 66.1 3.279 Brazil 38.6 f 1 3 7.1 c 13.5 15.1 94 191 6.7 42.0 0.6 66.0 8.980 Azerbaijan 12.1 3 2 18.0 27.2 30.9 85 173 0.0 66.0 0.1 d 64.9 6.780 Lebanon 26.6 f 18 21 .. 6.9 8.1 49 69 .. 12.0 0.1 d 66.1 7.480 The former Yugoslav Republic of Macedonia 23.0 3 17 4.9 10.7 12.2 67 125 .. 16.0 0.1 d 67.1 6.183 Armenia 44.5 3 4 9.4 11.9 13.4 74 174 .. 44.0 0.2 66.3 10.183 Thailand 23.1 1 1 10.5 10.5 12.2 92 202 1.6 172.0 1.1 66.8 3.885 Algeria 25.7 5 12 11.7 21.6 25.2 83 106 0.0 70.0 0.1 d 65.5 7.186 China 20.8 1 1 8.1 8.5 9.9 67 92 0.0 64.0 .. 68.7 5.386 Ecuador 40.0 f 5 19 23.9 17.8 20.9 85 159 3.8 50.0 0.3 67.9 8.588 Ukraine 19.7 35 14 .. 7.8 9.1 .. .. .. 87.0 0.9 64.0 6.189 Peru 68.4 10 17 13.1 11.9 15.3 93 152 17.8 117.0 0.3 67.5 5.390 Colombia 42.8 f 6 7 12.6 13.1 15.3 88 189 17.2 32.0 0.4 67.1 6.290 Saint Lucia .. 11 13 2.5 11.8 13.3 106 163 .. 1.9 .. 66.4 6.092 Fiji 39.8 f 1 6 .. 18.7 22.0 135 233 .. 59.0 0.1 d 61.3 3.692 Mongolia 47.1 1 1 10.8 15.4 17.9 127 294 .. 183.0 0.1 d 61.9 3.994 Dominican Republic 4.7 1 14 7.1 25.5 30.7 118 202 0.3 60.0 1.0 65.2 6.295 Jordan 22.7 1 7 7.8 15.1 17.6 91 126 .. 5.6 0.1 d 66.4 6.395 Tunisia 8.5 1 2 10.1 11.7 13.6 70 110 .. 38.0 0.1 d 66.3 6.797 Jamaica 23.8 5 5 6.2 13.2 15.3 99 163 .. 4.5 1.7 66.9 5.998 Tonga 52.2 14 15 8.1 14.1 16.4 100 165 .. 8.6 .. 64.3 5.999 Saint Vincent and the Grenadines .. 1 1 .. 15.2 16.6 127 180 .. 6.3 .. 63.4 4.2
100 Suriname 2.8 f 10 3 8.8 17.8 20.0 118 220 1.4 26.0 1.4 63.2 6.5101 Botswana 20.3 f 2 3 31.4 c 32.6 40.6 179 277 2.4 326.0 21.9 57.5 6.0101 Maldives 47.8 f 1 1 18.6 c 7.3 8.5 55 78 .. 49.0 .. 69.8 11.5103 Dominica .. 2 23 .. 31.2 34.0 .. .. .. 7.8 .. .. 5.4104 Samoa 51.3 f 16 42 4.9 14.8 17.3 81 138 .. 7.7 .. 66.0 5.6105 Uzbekistan 26.4 f 1 1 19.6 c 21.4 24.1 101 180 0.0 76.0 .. 64.5 6.2106 Belize 33.2 11 10 15.0 12.8 14.9 126 218 0.0 38.0 1.8 62.5 6.2106 Marshall Islands 31.3 f 3 17 .. 29.1 35.4 .. .. .. 422.0 .. .. 22.1108 Libya .. 1 6 21.0 c 11.0 12.9 96 171 .. 40.0 .. 62.3 ..108 Turkmenistan 58.9 1 1 11.5 43.4 51.0 131 246 .. 60.0 .. 61.4 6.3110 Gabon 6.0 19 37 17.0 34.3 47.4 212 253 206.2 485.0 3.6 58.7 2.7110 Paraguay 24.4 f 5 8 5.6 17.0 19.9 125 165 0.0 42.0 0.5 65.3 7.8112 Moldova (Republic of) 36.4 9 7 6.4 13.7 15.9 98 241 .. 101.0 0.6 63.6 10.2MEDIUM HUMAN DEVELOPMENT113 Philippines 34.0 f 11 11 33.4 21.5 27.1 136 261 0.5 554.0 0.1 d 61.7 4.4113 South Africa 31.6 26 40 27.4 34.2 43.3 274 396 1.1 781.0 18.9 55.7 8.2115 Egypt 39.7 5 6 22.3 19.4 22.8 109 186 .. 14.0 0.1 d 61.1 4.2116 Indonesia 41.5 4 25 36.4 22.2 26.4 143 204 9.2 391.0 0.4 61.7 3.3116 Viet Nam 24.3 2 3 24.6 17.3 21.6 66 181 0.1 133.0 0.4 67.5 5.7
HUMAN DEVELOPMENT INDICES AND INDICATORS: 2018 STATISTICAL UPDATE
TABLE 8 Health outcomes | 49

TABLE 8 HEALTH OUTCOMES
TABLE
8
SDG 3.b SDG 3.b SDG 2.2 SDG 3.2 SDG 3.2 SDG 3 SDG 3 SDG 3.3 SDG 3.3 SDG 3.3 SDG 3.c
Infants exclusively breastfed
Infants lacking immunization
Child malnutrition Mortality rate Incidence
HIV prevalence,
adult
Healthy life expectancy
at birth
Current health
expenditure
(% ages 0–5 months)
DPT Measles
Stunting (moderate or severe) Infant Under-five Female Male Malaria Tuberculosis
(% of one-year-olds)(% under
age 5) (per 1,000 live births)Adult
(per 1,000 people)(per 1,000
people at risk)(per 100,000
people)(% ages 15–49) (years) (% of GDP)
HDI rank 2011–2016a 2017 2017 2010–2016a 2016 2016 2016 2016 2016 2016 2016 2016 2015
118 Bolivia (Plurinational State of) 64.3 9 17 16.1 29.5 36.9 149 214 2.7 114.0 0.3 63.0 6.4119 Palestine, State of 38.6 1 1 7.4 16.6 19.4 94 135 .. 1.0 .. .. ..120 Iraq 19.6 27 29 22.1 25.9 31.2 128 195 0.0 43.0 .. 59.0 3.4121 El Salvador 47.0 5 15 13.6 12.9 15.0 101 258 0.0 60.0 0.6 65.5 6.9122 Kyrgyzstan 41.1 6 5 12.9 18.8 21.1 108 247 0.0 145.0 0.2 63.5 8.2123 Morocco 27.8 1 1 14.9 23.3 27.1 65 75 .. 103.0 0.1 d 65.3 5.5124 Nicaragua 31.7 1 1 17.3 16.8 19.7 103 190 7.8 48.0 0.2 66.9 7.8125 Cabo Verde 59.6 f 3 4 .. 18.2 21.4 100 146 0.7 137.0 0.8 64.5 4.8125 Guyana 23.3 3 1 11.3 26.9 32.4 169 247 77.7 93.0 1.6 58.3 4.5127 Guatemala 53.2 12 14 46.7 23.9 28.5 112 212 0.8 24.0 0.5 64.2 5.7127 Tajikistan 34.3 2 2 26.8 37.1 43.1 103 164 0.0 85.0 0.3 63.5 6.9129 Namibia 48.5 6 20 22.7 32.3 45.2 256 349 29.3 446.0 13.8 55.9 8.9130 India 54.9 9 12 37.9 34.6 43.0 139 212 18.8 211.0 0.3 59.3 3.9131 Micronesia (Federated States of) .. 3 24 .. 27.5 33.3 147 180 .. 177.0 .. 61.1 13.1132 Timor-Leste 62.3 20 30 50.2 42.4 49.7 122 172 0.9 498.0 .. 59.2 3.1133 Honduras 31.2 1 3 22.6 16.0 18.7 119 172 1.7 40.0 0.4 66.8 7.6134 Bhutan 51.4 1 3 33.5 26.8 32.4 204 204 0.0 178.0 .. 60.7 3.5134 Kiribati 69.0 f 4 19 .. 42.4 54.3 155 238 .. 566.0 .. 57.8 7.6136 Bangladesh 55.3 1 6 36.2 28.2 34.2 107 148 0.6 221.0 0.1 d 63.3 2.6137 Congo 32.9 25 30 21.2 38.5 54.1 237 273 204.7 378.0 3.1 56.7 3.4138 Vanuatu 72.6 9 20 28.5 23.1 27.6 103 154 14.7 56.0 .. 62.7 3.5139 Lao People's Democratic Republic 40.4 11 18 44.2 48.9 63.9 170 214 7.8 175.0 0.3 57.9 2.8140 Ghana 52.3 1 5 18.8 41.2 58.8 221 261 285.6 156.0 1.6 56.4 5.9141 Equatorial Guinea 7.4 56 70 26.2 66.2 90.9 311 349 238.8 181.0 6.2 53.8 2.7142 Kenya 61.4 7 11 26.2 35.6 49.2 179 258 85.3 348.0 5.4 58.9 5.2143 Sao Tome and Principe 73.8 4 10 17.2 26.2 33.8 162 218 11.2 99.0 .. 60.7 9.8144 Eswatini (Kingdom of) 63.8 4 11 25.5 52.4 70.4 356 497 1.9 398.0 27.2 50.2 7.0144 Zambia 72.5 5 4 40.0 43.8 63.4 246 346 189.8 376.0 12.4 54.3 5.4146 Cambodia 65.2 6 16 32.4 26.3 30.6 139 205 8.9 345.0 0.6 60.8 6.0147 Angola 37.5 39 58 37.6 54.6 82.5 203 277 120.3 370.0 1.9 55.8 2.9148 Myanmar 51.2 6 17 29.4 40.1 50.8 163 225 7.2 361.0 0.8 58.4 4.9149 Nepal 66.1 5 10 36.0 28.4 34.5 130 171 0.9 154.0 0.2 61.3 6.1150 Pakistan 37.7 17 24 45.0 64.2 78.8 140 178 10.6 268.0 0.1 d 57.7 2.7151 Cameroon 28.2 7 23 31.7 52.8 79.7 321 348 271.3 203.0 3.8 51.1 5.1LOW HUMAN DEVELOPMENT152 Solomon Islands 73.7 f 1 16 31.6 21.8 25.8 125 164 144.8 84.0 .. 61.9 8.0153 Papua New Guinea 56.1 f 31 38 49.5 42.4 54.3 191 256 179.4 432.0 0.9 58.0 3.8154 Tanzania (United Republic of) 59.2 1 1 34.5 40.3 56.7 199 249 144.2 287.0 4.7 56.5 6.1155 Syrian Arab Republic 42.6 f 37 33 27.5 c 14.2 17.5 79 270 .. 21.0 .. 55.8 ..156 Zimbabwe 47.8 6 10 27.1 40.0 56.4 320 380 77.9 208.0 13.5 54.4 10.3157 Nigeria 17.4 51 58 43.6 66.9 104.3 333 371 349.6 219.0 2.9 48.9 3.6158 Rwanda 87.3 1 5 36.7 29.2 38.5 171 225 392.7 50.0 3.1 59.9 7.9159 Lesotho 66.9 2 10 33.4 72.4 93.5 463 555 .. 724.0 25.0 46.6 8.4159 Mauritania 41.4 11 22 27.9 54.4 81.4 179 225 88.5 102.0 0.5 56.4 4.6161 Madagascar 41.9 20 42 49.2 c 34.0 46.4 189 239 64.4 237.0 0.2 58.3 5.2162 Uganda 65.5 5 20 28.9 37.7 53.0 268 346 187.2 201.0 6.5 54.9 7.3163 Benin 41.4 14 26 34.0 63.1 97.6 217 264 297.3 59.0 1.0 53.5 4.0164 Senegal 33.3 3 10 17.1 33.6 47.1 151 222 49.0 140.0 0.4 58.8 4.0165 Comoros 12.1 4 10 31.1 55.0 73.3 199 250 1.8 35.0 0.1 d 56.6 8.0165 Togo 57.5 8 9 27.6 50.7 75.7 252 285 360.4 46.0 2.1 53.9 6.6167 Sudan 55.4 2 10 38.2 44.8 65.1 192 249 35.3 82.0 0.2 55.7 6.3168 Afghanistan 43.3 27 38 40.9 53.2 70.4 202 245 30.8 189.0 0.1 d 53.0 10.3168 Haiti 39.7 21 47 22.0 50.9 67.0 210 272 13.9 188.0 2.1 55.3 6.9170 Côte d'Ivoire 12.1 1 22 21.6 66.0 91.8 371 411 223.2 153.0 2.7 48.3 5.4171 Malawi 61.2 7 17 37.4 38.9 55.1 228 341 249.1 159.0 9.2 56.2 9.3172 Djibouti 1.3 f 26 25 33.5 53.5 64.2 226 273 9.6 335.0 1.3 56.6 4.4173 Ethiopia 57.5 15 35 38.4 41.0 58.4 194 245 53.1 177.0 1.1 57.5 4.0174 Gambia 46.8 7 10 24.6 42.2 65.3 231 287 129.6 174.0 1.7 54.4 6.7175 Guinea 20.5 37 52 32.4 58.3 89.0 243 270 386.5 176.0 1.5 52.2 4.5
50 | HUMAN DEVELOPMENT INDICES AND INDICATORS: 2018 STATISTICAL UPDATE
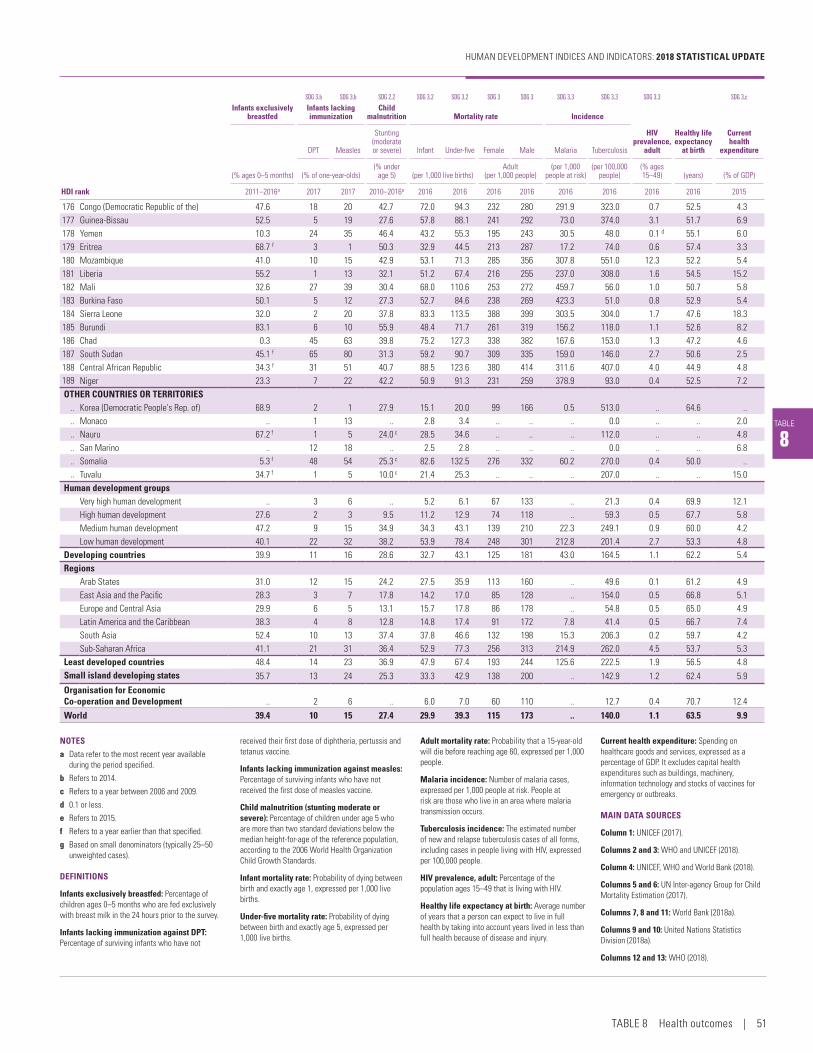
TABLE
8
SDG 3.b SDG 3.b SDG 2.2 SDG 3.2 SDG 3.2 SDG 3 SDG 3 SDG 3.3 SDG 3.3 SDG 3.3 SDG 3.c
Infants exclusively breastfed
Infants lacking immunization
Child malnutrition Mortality rate Incidence
HIV prevalence,
adult
Healthy life expectancy
at birth
Current health
expenditure
(% ages 0–5 months)
DPT Measles
Stunting (moderate or severe) Infant Under-five Female Male Malaria Tuberculosis
(% of one-year-olds)(% under
age 5) (per 1,000 live births)Adult
(per 1,000 people)(per 1,000
people at risk)(per 100,000
people)(% ages 15–49) (years) (% of GDP)
HDI rank 2011–2016a 2017 2017 2010–2016a 2016 2016 2016 2016 2016 2016 2016 2016 2015
176 Congo (Democratic Republic of the) 47.6 18 20 42.7 72.0 94.3 232 280 291.9 323.0 0.7 52.5 4.3177 Guinea-Bissau 52.5 5 19 27.6 57.8 88.1 241 292 73.0 374.0 3.1 51.7 6.9178 Yemen 10.3 24 35 46.4 43.2 55.3 195 243 30.5 48.0 0.1 d 55.1 6.0179 Eritrea 68.7 f 3 1 50.3 32.9 44.5 213 287 17.2 74.0 0.6 57.4 3.3180 Mozambique 41.0 10 15 42.9 53.1 71.3 285 356 307.8 551.0 12.3 52.2 5.4181 Liberia 55.2 1 13 32.1 51.2 67.4 216 255 237.0 308.0 1.6 54.5 15.2182 Mali 32.6 27 39 30.4 68.0 110.6 253 272 459.7 56.0 1.0 50.7 5.8183 Burkina Faso 50.1 5 12 27.3 52.7 84.6 238 269 423.3 51.0 0.8 52.9 5.4184 Sierra Leone 32.0 2 20 37.8 83.3 113.5 388 399 303.5 304.0 1.7 47.6 18.3185 Burundi 83.1 6 10 55.9 48.4 71.7 261 319 156.2 118.0 1.1 52.6 8.2186 Chad 0.3 45 63 39.8 75.2 127.3 338 382 167.6 153.0 1.3 47.2 4.6187 South Sudan 45.1 f 65 80 31.3 59.2 90.7 309 335 159.0 146.0 2.7 50.6 2.5188 Central African Republic 34.3 f 31 51 40.7 88.5 123.6 380 414 311.6 407.0 4.0 44.9 4.8189 Niger 23.3 7 22 42.2 50.9 91.3 231 259 378.9 93.0 0.4 52.5 7.2OTHER COUNTRIES OR TERRITORIES
.. Korea (Democratic People's Rep. of) 68.9 2 1 27.9 15.1 20.0 99 166 0.5 513.0 .. 64.6 ..
.. Monaco .. 1 13 .. 2.8 3.4 .. .. .. 0.0 .. .. 2.0
.. Nauru 67.2 f 1 5 24.0 c 28.5 34.6 .. .. .. 112.0 .. .. 4.8
.. San Marino .. 12 18 .. 2.5 2.8 .. .. .. 0.0 .. .. 6.8
.. Somalia 5.3 f 48 54 25.3 c 82.6 132.5 276 332 60.2 270.0 0.4 50.0 ..
.. Tuvalu 34.7 f 1 5 10.0 c 21.4 25.3 .. .. .. 207.0 .. .. 15.0Human development groups
Very high human development .. 3 6 .. 5.2 6.1 67 133 .. 21.3 0.4 69.9 12.1High human development 27.6 2 3 9.5 11.2 12.9 74 118 .. 59.3 0.5 67.7 5.8Medium human development 47.2 9 15 34.9 34.3 43.1 139 210 22.3 249.1 0.9 60.0 4.2Low human development 40.1 22 32 38.2 53.9 78.4 248 301 212.8 201.4 2.7 53.3 4.8
Developing countries 39.9 11 16 28.6 32.7 43.1 125 181 43.0 164.5 1.1 62.2 5.4Regions
Arab States 31.0 12 15 24.2 27.5 35.9 113 160 .. 49.6 0.1 61.2 4.9East Asia and the Pacific 28.3 3 7 17.8 14.2 17.0 85 128 .. 154.0 0.5 66.8 5.1Europe and Central Asia 29.9 6 5 13.1 15.7 17.8 86 178 .. 54.8 0.5 65.0 4.9Latin America and the Caribbean 38.3 4 8 12.8 14.8 17.4 91 172 7.8 41.4 0.5 66.7 7.4South Asia 52.4 10 13 37.4 37.8 46.6 132 198 15.3 206.3 0.2 59.7 4.2Sub-Saharan Africa 41.1 21 31 36.4 52.9 77.3 256 313 214.9 262.0 4.5 53.7 5.3
Least developed countries 48.4 14 23 36.9 47.9 67.4 193 244 125.6 222.5 1.9 56.5 4.8Small island developing states 35.7 13 24 25.3 33.3 42.9 138 200 .. 142.9 1.2 62.4 5.9
Organisation for Economic Co‑operation and Development .. 2 6 .. 6.0 7.0 60 110 .. 12.7 0.4 70.7 12.4
World 39.4 10 15 27.4 29.9 39.3 115 173 .. 140.0 1.1 63.5 9.9
NOTES
a Data refer to the most recent year available during the period specified.
b Refers to 2014.
c Refers to a year between 2006 and 2009.
d 0.1 or less.
e Refers to 2015.
f Refers to a year earlier than that specified.
g Based on small denominators (typically 25–50 unweighted cases).
DEFINITIONS
Infants exclusively breastfed: Percentage of children ages 0–5 months who are fed exclusively with breast milk in the 24 hours prior to the survey.
Infants lacking immunization against DPT: Percentage of surviving infants who have not
received their first dose of diphtheria, pertussis and tetanus vaccine.
Infants lacking immunization against measles: Percentage of surviving infants who have not received the first dose of measles vaccine.
Child malnutrition (stunting moderate or severe): Percentage of children under age 5 who are more than two standard deviations below the median height-for-age of the reference population, according to the 2006 World Health Organization Child Growth Standards.
Infant mortality rate: Probability of dying between birth and exactly age 1, expressed per 1,000 live births.
Under‑five mortality rate: Probability of dying between birth and exactly age 5, expressed per 1,000 live births.
Adult mortality rate: Probability that a 15-year-old will die before reaching age 60, expressed per 1,000 people.
Malaria incidence: Number of malaria cases, expressed per 1,000 people at risk. People at risk are those who live in an area where malaria transmission occurs.
Tuberculosis incidence: The estimated number of new and relapse tuberculosis cases of all forms, including cases in people living with HIV, expressed per 100,000 people.
HIV prevalence, adult: Percentage of the population ages 15–49 that is living with HIV.
Healthy life expectancy at birth: Average number of years that a person can expect to live in full health by taking into account years lived in less than full health because of disease and injury.
Current health expenditure: Spending on healthcare goods and services, expressed as a percentage of GDP. It excludes capital health expenditures such as buildings, machinery, information technology and stocks of vaccines for emergency or outbreaks.
MAIN DATA SOURCES
Column 1: UNICEF (2017).
Columns 2 and 3: WHO and UNICEF (2018).
Column 4: UNICEF, WHO and World Bank (2018).
Columns 5 and 6: UN Inter-agency Group for Child Mortality Estimation (2017).
Columns 7, 8 and 11: World Bank (2018a).
Columns 9 and 10: United Nations Statistics Division (2018a).
Columns 12 and 13: WHO (2018).
HUMAN DEVELOPMENT INDICES AND INDICATORS: 2018 STATISTICAL UPDATE
TABLE 8 Health outcomes | 51

TABLE
9
SDG 4.6 SDG 4.6 SDG 4.6 SDG 4.2 SDG 4.1 SDG 4.1 SDG 4.3 SDG 1.aLiteracy rate
Population with at least some
secondary education
Gross enrolment ratio
Primary school
dropout rate
Survival rate to the last grade of lower secondary
general education
Government expenditure on education
Adult (% ages 15 and older)
Youth (% ages 15–24) Pre-primary Primary Secondary Tertiary
Female Male(% ages 25 and older)
(% of preschool-age
children)
(% of primary school–age population)
(% of secondary school–age population)
(% of tertiary school–age population)
(% of primary school cohort) (%) (% of GDP)
HDI rank 2006–2016a 2006–2016a 2006–2016a 2006–2017a 2012–2017a 2012–2017a 2012–2017a 2012–2017a 2007–2016a 2006–2016a 2012–2017a
VERY HIGH HUMAN DEVELOPMENT1 Norway .. .. .. 95.7 96 100 114 81 0.4 100 7.72 Switzerland .. .. .. 96.8 105 104 102 58 0.6 99 5.13 Australia .. .. .. 90.0 169 101 154 122 .. .. 5.24 Ireland .. .. .. 88.3 113 101 126 84 .. 99 4.95 Germany .. .. .. 96.5 107 102 101 66 3.5 54 4.96 Iceland .. .. .. 100.0 97 99 119 76 2.1 99 7.87 Hong Kong, China (SAR) .. .. .. 78.4 108 107 103 72 1.8 98 3.37 Sweden .. .. .. 88.5 94 123 140 62 0.4 99 7.79 Singapore 97.0 99.9 99.9 79.4 .. 101 108 .. 1.3 100 2.9
10 Netherlands .. .. .. 88.3 95 103 133 80 .. .. 5.511 Denmark .. .. .. 90.7 96 102 129 81 0.2 100 7.612 Canada .. .. .. 100.0 .. 101 113 .. .. .. ..13 United States .. .. .. 95.3 69 99 97 .. .. .. 5.014 United Kingdom .. .. .. 82.9 96 102 125 57 .. .. 5.615 Finland .. .. .. 100.0 83 100 152 87 0.2 100 7.216 New Zealand .. .. .. 98.9 92 99 114 82 .. .. 6.317 Belgium .. .. .. 84.4 117 103 164 75 .. 96 6.617 Liechtenstein .. .. .. .. 103 105 116 35 2.7 85 ..19 Japan .. .. .. 93.3 86 99 102 63 0.2 .. 3.620 Austria .. .. .. 100.0 104 102 101 83 0.4 100 5.421 Luxembourg .. .. .. 100.0 93 99 102 20 17.1 99 4.022 Israel .. .. .. 89.1 111 104 104 64 0.8 98 5.722 Korea (Republic of) .. .. .. 95.6 95 98 100 93 0.5 99 5.124 France .. .. .. 83.2 109 107 111 65 .. 99 5.525 Slovenia .. .. .. 98.1 92 99 110 80 1.4 99 5.326 Spain 98.3 99.6 99.6 74.8 95 104 128 91 0.7 92 4.327 Czechia .. .. .. 99.8 105 99 105 64 0.5 92 4.028 Italy 98.8 99.9 99.9 79.6 99 101 103 63 0.8 99 4.129 Malta 93.3 99.4 98.4 77.6 112 105 96 49 3.4 99 7.230 Estonia 99.9 100.0 99.9 100.0 88 97 111 72 2.0 100 5.531 Greece 97.1 98.8 98.6 69.2 47 95 99 117 8.3 99 ..32 Cyprus 98.7 99.8 99.8 78.6 80 99 100 60 2.4 100 6.133 Poland .. .. .. 86.2 70 110 107 67 2.0 98 4.934 United Arab Emirates .. .. .. 69.0 b 82 111 96 37 8.0 97 ..35 Andorra 100.0 100.0 100.0 72.5 .. .. .. .. 28.8 93 3.335 Lithuania 99.8 99.9 99.8 93.8 90 101 103 66 1.8 97 4.537 Qatar 97.7 99.6 98.4 68.4 60 104 93 15 1.5 98 3.638 Slovakia .. .. .. 99.3 93 99 91 53 1.0 88 4.639 Brunei Darussalam 96.1 99.5 99.2 69.7 b 70 107 93 31 3.6 100 4.439 Saudi Arabia 94.4 99.1 99.3 72.8 25 116 117 67 25.8 86 ..41 Latvia 99.9 99.9 99.8 99.3 87 98 112 68 4.8 96 5.341 Portugal 94.5 99.5 99.4 52.7 93 105 118 63 .. .. 5.143 Bahrain 94.6 97.6 98.6 59.2 55 101 104 47 1.4 99 2.744 Chile 96.3 99.1 99.0 80.6 85 100 100 90 0.6 99 4.945 Hungary .. .. .. 96.8 82 102 102 48 1.6 96 4.646 Croatia 99.1 99.7 99.7 95.7 63 95 98 67 2.6 99 4.647 Argentina 98.1 99.5 99.1 64.8 b 74 110 107 86 4.7 85 5.948 Oman 93.0 99.0 98.5 66.4 57 109 107 45 0.9 98 6.249 Russian Federation 99.7 99.8 99.7 95.6 89 102 105 82 0.7 98 3.850 Montenegro 98.4 99.1 99.4 89.4 56 96 91 57 6.8 95 ..51 Bulgaria 98.4 97.7 98.1 94.8 81 95 100 71 6.5 46 4.152 Romania 98.6 99.0 99.0 89.5 87 89 89 48 6.0 93 3.153 Belarus 99.6 99.8 99.8 91.9 99 102 104 87 1.2 99 5.054 Bahamas .. .. .. 87.5 32 95 90 .. 10.5 97 ..55 Uruguay 98.5 99.2 98.6 54.1 90 107 112 56 1.2 84 ..56 Kuwait 95.7 99.4 99.2 51.2 68 101 98 33 3.9 97 ..57 Malaysia 93.1 98.5 98.4 80.0 94 103 85 44 8.0 93 4.858 Barbados .. .. .. 92.9 b 80 93 107 .. 6.6 96 5.158 Kazakhstan 99.8 99.9 99.9 98.8 54 108 113 50 1.7 99 3.0
Education achievements9TABLE
52 | HUMAN DEVELOPMENT INDICES AND INDICATORS: 2018 STATISTICAL UPDATE
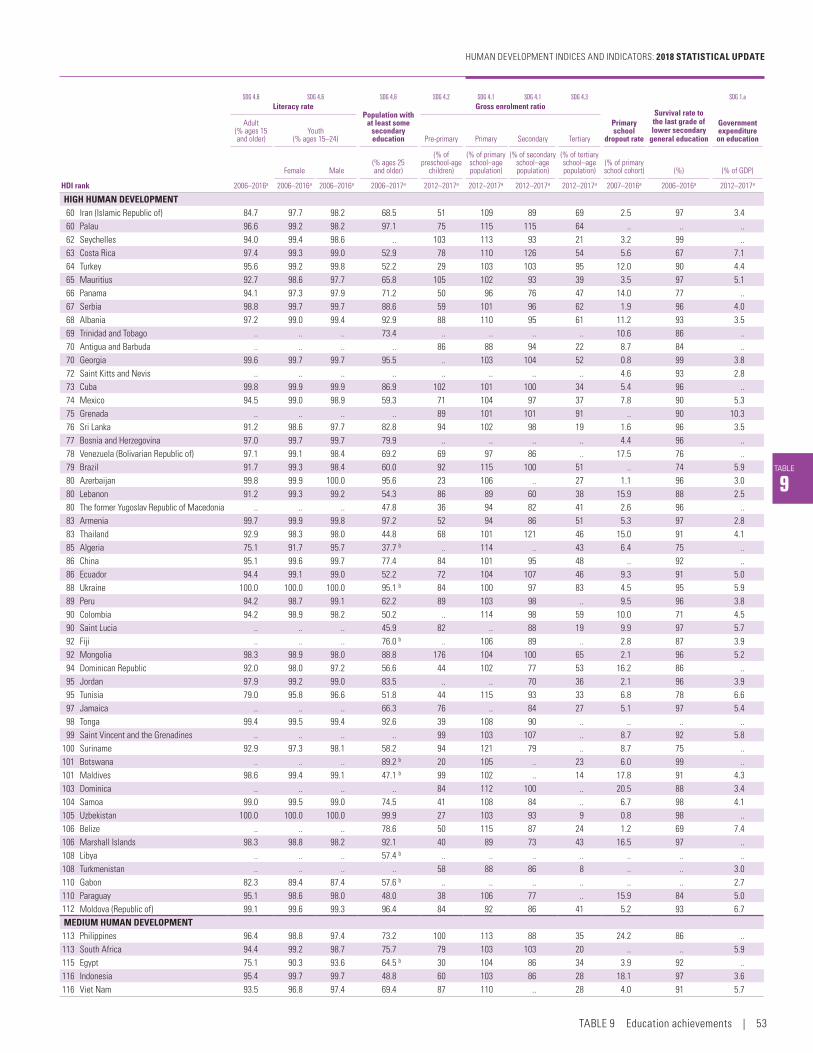
TABLE
9
SDG 4.6 SDG 4.6 SDG 4.6 SDG 4.2 SDG 4.1 SDG 4.1 SDG 4.3 SDG 1.aLiteracy rate
Population with at least some
secondary education
Gross enrolment ratio
Primary school
dropout rate
Survival rate to the last grade of lower secondary
general education
Government expenditure on education
Adult (% ages 15 and older)
Youth (% ages 15–24) Pre-primary Primary Secondary Tertiary
Female Male(% ages 25 and older)
(% of preschool-age
children)
(% of primary school–age population)
(% of secondary school–age population)
(% of tertiary school–age population)
(% of primary school cohort) (%) (% of GDP)
HDI rank 2006–2016a 2006–2016a 2006–2016a 2006–2017a 2012–2017a 2012–2017a 2012–2017a 2012–2017a 2007–2016a 2006–2016a 2012–2017a
HIGH HUMAN DEVELOPMENT60 Iran (Islamic Republic of) 84.7 97.7 98.2 68.5 51 109 89 69 2.5 97 3.460 Palau 96.6 99.2 98.2 97.1 75 115 115 64 .. .. ..62 Seychelles 94.0 99.4 98.6 .. 103 113 93 21 3.2 99 ..63 Costa Rica 97.4 99.3 99.0 52.9 78 110 126 54 5.6 67 7.164 Turkey 95.6 99.2 99.8 52.2 29 103 103 95 12.0 90 4.465 Mauritius 92.7 98.6 97.7 65.8 105 102 93 39 3.5 97 5.166 Panama 94.1 97.3 97.9 71.2 50 96 76 47 14.0 77 ..67 Serbia 98.8 99.7 99.7 88.6 59 101 96 62 1.9 96 4.068 Albania 97.2 99.0 99.4 92.9 88 110 95 61 11.2 93 3.569 Trinidad and Tobago .. .. .. 73.4 .. .. .. .. 10.6 86 ..70 Antigua and Barbuda .. .. .. .. 86 88 94 22 8.7 84 ..70 Georgia 99.6 99.7 99.7 95.5 .. 103 104 52 0.8 99 3.872 Saint Kitts and Nevis .. .. .. .. .. .. .. .. 4.6 93 2.873 Cuba 99.8 99.9 99.9 86.9 102 101 100 34 5.4 96 ..74 Mexico 94.5 99.0 98.9 59.3 71 104 97 37 7.8 90 5.375 Grenada .. .. .. .. 89 101 101 91 .. 90 10.376 Sri Lanka 91.2 98.6 97.7 82.8 94 102 98 19 1.6 96 3.577 Bosnia and Herzegovina 97.0 99.7 99.7 79.9 .. .. .. .. 4.4 96 ..78 Venezuela (Bolivarian Republic of) 97.1 99.1 98.4 69.2 69 97 86 .. 17.5 76 ..79 Brazil 91.7 99.3 98.4 60.0 92 115 100 51 .. 74 5.980 Azerbaijan 99.8 99.9 100.0 95.6 23 106 .. 27 1.1 96 3.080 Lebanon 91.2 99.3 99.2 54.3 86 89 60 38 15.9 88 2.580 The former Yugoslav Republic of Macedonia .. .. .. 47.8 36 94 82 41 2.6 96 ..83 Armenia 99.7 99.9 99.8 97.2 52 94 86 51 5.3 97 2.883 Thailand 92.9 98.3 98.0 44.8 68 101 121 46 15.0 91 4.185 Algeria 75.1 91.7 95.7 37.7 b .. 114 .. 43 6.4 75 ..86 China 95.1 99.6 99.7 77.4 84 101 95 48 .. 92 ..86 Ecuador 94.4 99.1 99.0 52.2 72 104 107 46 9.3 91 5.088 Ukraine 100.0 100.0 100.0 95.1 b 84 100 97 83 4.5 95 5.989 Peru 94.2 98.7 99.1 62.2 89 103 98 .. 9.5 96 3.890 Colombia 94.2 98.9 98.2 50.2 .. 114 98 59 10.0 71 4.590 Saint Lucia .. .. .. 45.9 82 .. 88 19 9.9 97 5.792 Fiji .. .. .. 76.0 b .. 106 89 .. 2.8 87 3.992 Mongolia 98.3 98.9 98.0 88.8 176 104 100 65 2.1 96 5.294 Dominican Republic 92.0 98.0 97.2 56.6 44 102 77 53 16.2 86 ..95 Jordan 97.9 99.2 99.0 83.5 .. .. 70 36 2.1 96 3.995 Tunisia 79.0 95.8 96.6 51.8 44 115 93 33 6.8 78 6.697 Jamaica .. .. .. 66.3 76 .. 84 27 5.1 97 5.498 Tonga 99.4 99.5 99.4 92.6 39 108 90 .. .. .. ..99 Saint Vincent and the Grenadines .. .. .. .. 99 103 107 .. 8.7 92 5.8
100 Suriname 92.9 97.3 98.1 58.2 94 121 79 .. 8.7 75 ..101 Botswana .. .. .. 89.2 b 20 105 .. 23 6.0 99 ..101 Maldives 98.6 99.4 99.1 47.1 b 99 102 .. 14 17.8 91 4.3103 Dominica .. .. .. .. 84 112 100 .. 20.5 88 3.4104 Samoa 99.0 99.5 99.0 74.5 41 108 84 .. 6.7 98 4.1105 Uzbekistan 100.0 100.0 100.0 99.9 27 103 93 9 0.8 98 ..106 Belize .. .. .. 78.6 50 115 87 24 1.2 69 7.4106 Marshall Islands 98.3 98.8 98.2 92.1 40 89 73 43 16.5 97 ..108 Libya .. .. .. 57.4 b .. .. .. .. .. .. ..108 Turkmenistan .. .. .. .. 58 88 86 8 .. .. 3.0110 Gabon 82.3 89.4 87.4 57.6 b .. .. .. .. .. .. 2.7110 Paraguay 95.1 98.6 98.0 48.0 38 106 77 .. 15.9 84 5.0112 Moldova (Republic of) 99.1 99.6 99.3 96.4 84 92 86 41 5.2 93 6.7MEDIUM HUMAN DEVELOPMENT113 Philippines 96.4 98.8 97.4 73.2 100 113 88 35 24.2 86 ..113 South Africa 94.4 99.2 98.7 75.7 79 103 103 20 .. .. 5.9115 Egypt 75.1 90.3 93.6 64.5 b 30 104 86 34 3.9 92 ..116 Indonesia 95.4 99.7 99.7 48.8 60 103 86 28 18.1 97 3.6116 Viet Nam 93.5 96.8 97.4 69.4 87 110 .. 28 4.0 91 5.7
HUMAN DEVELOPMENT INDICES AND INDICATORS: 2018 STATISTICAL UPDATE
TABLE 9 Education achievements | 53

TABLE 9 EDUCATION ACHIEVEMENTS
TABLE
9
SDG 4.6 SDG 4.6 SDG 4.6 SDG 4.2 SDG 4.1 SDG 4.1 SDG 4.3 SDG 1.aLiteracy rate
Population with at least some
secondary education
Gross enrolment ratio
Primary school
dropout rate
Survival rate to the last grade of lower secondary
general education
Government expenditure on education
Adult (% ages 15 and older)
Youth (% ages 15–24) Pre-primary Primary Secondary Tertiary
Female Male(% ages 25 and older)
(% of preschool-age
children)
(% of primary school–age population)
(% of secondary school–age population)
(% of tertiary school–age population)
(% of primary school cohort) (%) (% of GDP)
HDI rank 2006–2016a 2006–2016a 2006–2016a 2006–2017a 2012–2017a 2012–2017a 2012–2017a 2012–2017a 2007–2016a 2006–2016a 2012–2017a
118 Bolivia (Plurinational State of) 92.5 99.4 99.4 58.2 74 98 86 .. 4.1 96 7.3119 Palestine, State of 96.9 99.3 99.5 60.4 54 94 84 43 1.7 85 5.7120 Iraq 43.7 48.6 57.0 47.7 .. .. .. .. .. .. ..121 El Salvador 88.0 98.4 97.5 43.3 66 100 74 28 22.0 77 3.5122 Kyrgyzstan 99.2 99.8 99.7 98.4 31 106 98 46 1.7 97 6.0123 Morocco 69.4 87.8 94.6 31.3 b 50 110 70 32 7.4 84 ..124 Nicaragua .. .. .. 47.5 b .. .. .. .. 51.6 64 ..125 Cabo Verde 86.8 98.7 97.6 29.4 72 97 85 22 9.9 80 5.4125 Guyana 85.6 97.0 96.3 63.3 b 92 96 99 12 7.8 88 3.2127 Guatemala 81.3 93.3 95.5 37.8 45 101 64 21 25.2 95 2.8127 Tajikistan .. .. .. 93.1 b 10 99 87 31 1.0 97 5.2129 Namibia 88.3 95.3 93.5 40.4 b 22 111 .. .. 9.4 78 ..130 India 69.3 81.8 90.0 51.6 13 115 75 27 9.8 97 3.8131 Micronesia (Federated States of) .. .. .. .. 33 96 .. .. .. .. 12.5132 Timor-Leste 58.3 78.6 80.5 .. 16 109 74 .. 19.5 96 ..133 Honduras 89.0 97.2 94.9 35.5 41 96 65 20 17.4 85 5.9134 Bhutan 57.0 84.5 90.4 9.6 25 95 84 11 21.1 83 7.4134 Kiribati .. .. .. .. .. 105 .. .. .. 94 ..136 Bangladesh 72.8 93.5 90.9 45.5 b 34 119 69 17 33.8 87 2.5137 Congo 79.3 76.9 85.7 48.4 b 13 104 52 9 29.7 81 ..138 Vanuatu .. .. .. .. 102 120 55 .. 28.5 71 5.5139 Lao People's Democratic Republic 58.3 67.1 77.3 39.2 b 40 110 67 17 20.4 77 2.9140 Ghana 71.5 83.2 88.3 62.1 117 105 60 16 15.0 79 6.2141 Equatorial Guinea .. .. .. .. 43 62 .. .. 27.9 84 ..142 Kenya 78.7 86.1 86.9 34.6 77 105 .. .. 7.0 81 5.3143 Sao Tome and Principe 90.1 96.4 97.1 38.9 51 110 90 13 7.3 81 3.7144 Eswatini (Kingdom of) 83.1 94.7 92.2 31.3 b .. 108 67 5 20.9 64 7.1144 Zambia 83.0 86.5 91.2 44.3 b .. 102 .. 4 44.5 89 ..146 Cambodia 73.9 85.9 88.4 21.3 19 110 .. 13 26.5 67 1.9147 Angola 66.0 70.6 84.9 .. .. .. .. 9 68.1 .. ..148 Myanmar 75.6 84.4 85.1 25.8 b 24 112 61 16 25.2 69 2.2149 Nepal 59.6 80.2 89.9 34.6 86 134 71 12 26.5 95 3.7150 Pakistan 57.0 65.5 79.8 37.3 72 98 46 10 22.7 94 2.8151 Cameroon 71.3 76.4 85.4 36.2 40 119 62 17 42.9 89 2.8LOW HUMAN DEVELOPMENT152 Solomon Islands .. .. .. .. 99 115 48 .. 36.6 85 ..153 Papua New Guinea .. .. .. 12.2 b .. 112 40 .. .. .. ..154 Tanzania (United Republic of) 77.9 84.6 87.0 14.3 32 81 32 4 33.3 58 3.5155 Syrian Arab Republic .. .. .. 41.0 6 76 49 39 6.8 10 ..156 Zimbabwe 88.7 93.2 87.6 58.7 42 99 47 8 23.1 94 7.5157 Nigeria 51.1 58.0 75.6 .. .. 94 56 .. 35.6 .. ..158 Rwanda 68.3 83.5 81.1 15.8 18 137 37 8 41.9 78 3.5159 Lesotho 76.6 94.0 79.6 29.0 b 33 104 52 9 30.7 67 ..159 Mauritania 45.5 47.7 66.4 18.4 b 10 94 32 5 62.9 71 2.6161 Madagascar 71.6 75.3 78.4 .. 29 144 38 5 64.9 68 2.1162 Uganda 70.2 81.7 85.8 31.7 13 100 .. 5 65.0 82 2.3163 Benin 32.9 40.9 63.9 25.4 b 24 132 59 13 42.7 76 4.4164 Senegal 42.8 51.0 61.1 17.1 16 83 48 11 37.6 68 7.1165 Comoros 49.2 69.6 73.8 .. 21 105 61 9 29.1 67 4.3165 Togo 63.7 78.4 89.7 39.1 17 124 .. 12 45.9 13 5.1167 Sudan 53.5 62.7 68.7 17.0 b 48 74 46 17 20.6 97 ..168 Afghanistan 31.7 32.1 61.9 25.1 b .. 105 55 8 .. .. 3.2168 Haiti 48.7 70.5 74.4 33.2 b .. .. .. .. .. .. ..170 Côte d'Ivoire 43.9 47.0 59.1 26.1 8 97 46 9 18.0 85 4.8171 Malawi 62.1 73.4 72.5 21.1 b 81 139 37 .. 45.9 31 4.7172 Djibouti .. .. .. .. 7 64 44 .. 15.6 93 ..173 Ethiopia 39.0 47.0 63.0 15.8 30 102 35 8 61.8 68 4.5174 Gambia 42.0 56.1 66.0 35.3 b 39 97 .. 3 24.9 96 2.8175 Guinea 32.0 37.2 57.0 11.7 .. 94 40 11 34.1 76 2.4176 Congo (Democratic Republic of the) 77.0 79.7 91.0 50.7 4 108 46 7 54.7 90 2.3
54 | HUMAN DEVELOPMENT INDICES AND INDICATORS: 2018 STATISTICAL UPDATE

TABLE
9
SDG 4.6 SDG 4.6 SDG 4.6 SDG 4.2 SDG 4.1 SDG 4.1 SDG 4.3 SDG 1.aLiteracy rate
Population with at least some
secondary education
Gross enrolment ratio
Primary school
dropout rate
Survival rate to the last grade of lower secondary
general education
Government expenditure on education
Adult (% ages 15 and older)
Youth (% ages 15–24) Pre-primary Primary Secondary Tertiary
Female Male(% ages 25 and older)
(% of preschool-age
children)
(% of primary school–age population)
(% of secondary school–age population)
(% of tertiary school–age population)
(% of primary school cohort) (%) (% of GDP)
HDI rank 2006–2016a 2006–2016a 2006–2016a 2006–2017a 2012–2017a 2012–2017a 2012–2017a 2012–2017a 2007–2016a 2006–2016a 2012–2017a
177 Guinea-Bissau 45.6 49.8 71.3 .. .. .. .. .. .. .. 2.1178 Yemen .. .. .. 27.1 b 2 92 51 .. 30.5 85 ..179 Eritrea 64.7 82.6 91.3 .. 14 54 33 2 26.9 80 ..180 Mozambique 50.6 56.5 79.8 19.3 .. 106 33 7 66.8 75 6.5181 Liberia 42.9 37.2 63.5 29.0 b 156 94 37 12 32.2 92 2.8182 Mali 33.1 39.2 60.5 13.1 4 77 43 5 38.4 66 3.8183 Burkina Faso 34.6 44.0 57.0 8.5 3 91 36 6 31.2 72 4.2184 Sierra Leone 32.4 50.9 64.5 25.6 b 12 115 40 .. 48.9 80 2.9185 Burundi 61.6 75.0 85.3 9.3 14 131 48 5 55.7 72 5.4186 Chad 22.3 22.4 40.7 .. 1 88 23 3 49.0 84 2.9187 South Sudan 26.8 29.6 44.1 33.2 10 67 10 .. .. .. 1.8188 Central African Republic 36.8 27.0 48.9 21.8 b .. 106 15 3 53.4 40 ..189 Niger 15.5 15.1 34.5 6.6 b 8 74 24 2 35.6 57 6.0OTHER COUNTRIES OR TERRITORIES
.. Korea (Democratic People's Rep. of) 100.0 100.0 100.0 .. 50 .. 93 28 .. .. ..
.. Monaco .. .. .. .. .. .. .. .. .. 97 1.4
.. Nauru .. .. .. .. 69 107 78 .. .. .. ..
.. San Marino .. .. .. .. 107 93 95 60 3.8 98 ..
.. Somalia .. .. .. .. .. .. .. .. .. .. ..
.. Tuvalu .. .. .. .. 117 119 96 .. 9.0 .. ..Human development groups
Very high human development .. .. .. 89.3 83 102 106 71 .. .. 4.9High human development 94.2 99.1 99.2 72.1 76 103 96 50 .. 88 ..Medium human development 74.3 84.7 90.4 51.1 33 110 73 24 16.3 93 3.9Low human development 52.5 59.1 72.1 24.8 20 98 43 9 43.1 69 ..
Developing countries 81.1 85.1 90.4 59.8 45 105 75 32 22.8 89 ..Regions
Arab States 73.4 82.4 86.7 50.4 30 98 74 36 12.3 82 ..East Asia and the Pacific 94.4 98.4 98.6 71.0 78 103 92 41 .. 91 ..Europe and Central Asia 98.2 99.6 99.9 81.2 41 102 99 62 5.9 94 4.3Latin America and the Caribbean 92.8 98.3 98.0 59.6 75 107 96 49 .. 81 5.5South Asia 68.7 80.7 88.7 50.4 23 112 71 25 13.5 96 3.6Sub-Saharan Africa 59.9 65.6 76.5 34.0 29 100 46 9 43.0 74 4.9
Least developed countries 59.6 68.0 76.9 29.6 24 103 48 10 45.2 77 3.1Small island developing states .. .. .. 57.3 .. 106 73 .. .. .. ..
Organisation for Economic Co‑operation and Development .. .. .. 86.0 79 102 105 68 .. .. 5.0
World 82.1 85.5 90.7 66.5 50 105 79 36 21.4 89 4.8
NOTES
a Data refer to the most recent year available during the period specified.
b Based on Barro and Lee (2016).
DEFINITIONS
Adult literacy rate: Percentage of the population ages 15 and older that can, with understanding, both read and write a short simple statement on everyday life.
Youth literacy rate: Percentage of the population ages 15–24 that can, with understanding, both read and write a short simple statement on everyday life.
Population with at least some secondary education: Percentage of the population ages 25 and older that has reached (but not necessarily completed) a secondary level of education.
Gross enrolment ratio: Total enrolment in a given level of education (pre-primary, primary, secondary or tertiary), regardless of age, expressed as a percentage of the official school-age population for the same level of education.
Primary school dropout rate: Percentage of students from a given cohort who have enrolled in primary school but who drop out before reaching the last grade of primary education. It is calculated as 100 minus the survival rate to the last grade of primary education and assumes that observed flow rates remain unchanged throughout the cohort life and that dropouts do not re-enter school.
Survival rate to the last grade of lower secondary general education: Percentage of a cohort of students enrolled in the first grade of a lower secondary general education in a given school
year who are expected to reach the last grade, regardless of repetition.
Government expenditure on education: Current, capital and transfer spending on education, expressed as a percentage of GDP.
MAIN DATA SOURCES
Columns 1–3 and 5–10: UNESCO Institute for Statistics (2018).
Column 4: UNESCO Institute for Statistics (2018) and Barro and Lee (2016).
Column 11: World Bank (2018a).
HUMAN DEVELOPMENT INDICES AND INDICATORS: 2018 STATISTICAL UPDATE
TABLE 9 Education achievements | 55

TABLE
10
SDG 8.1 SDG 17.4
Gross domestic product (GDP)
Gross fixed capital
formation
General government final consumption
expenditureTotal tax revenue
Taxes on income,
profits and capital gains
Debts Prices
Total Per capita
Domestic credit provided by
financial sectorTotal debt
serviceConsumer
price index
(2011 PPP $ billions) (2011 PPP $)
Annual growth (%) (% of GDP)
Total (% of GDP)
Average annual growth (%) (% of GDP)
(% of total tax revenue) (% of GDP) (% of GNI) (2010=100)
HDI rank 2017 2017 2017 2012–2017a 2012–2017a 2012–2017a 2007–2017a 2007–2017a 2012–2017a 2016 2017
VERY HIGH HUMAN DEVELOPMENT1 Norway 342.3 64,800 1.0 24.1 24.0 2.2 22.0 21.1 150.3 .. 1152 Switzerland 486.0 57,410 0.0 24.5 12.0 1.0 9.8 22.8 179.7 .. 983 Australia 1,098.3 44,649 0.3 24.0 18.5 4.1 22.3 64.2 177.1 .. 1164 Ireland 324.1 67,335 6.5 23.4 12.0 1.8 18.8 40.4 84.2 .. 1055 Germany 3,740.2 45,229 1.8 20.3 19.5 1.5 11.2 17.4 127.3 .. 1096 Iceland 15.9 46,483 1.9 22.1 23.3 2.6 38.5 21.0 100.2 .. 1227 Hong Kong, China (SAR) 414.3 56,055 3.0 21.8 9.9 3.4 .. .. 210.6 .. 126 b
7 Sweden 472.7 46,949 0.8 24.9 26.0 0.4 27.7 16.0 165.1 .. 1069 Singapore 480.0 85,535 3.5 24.8 10.9 4.1 13.7 32.4 140.8 .. 113
10 Netherlands 830.5 48,473 2.5 20.3 24.3 1.2 22.2 26.9 191.9 .. 11111 Denmark 269.3 46,683 1.5 20.4 25.0 1.2 33.7 44.4 200.7 .. 10912 Canada 1,615.8 44,018 1.8 23.0 20.8 2.3 12.2 54.2 .. .. 11213 United States 17,662.3 54,225 1.5 19.5 14.3 1.0 10.9 53.7 241.9 .. 11214 United Kingdom 2,624.6 39,753 1.1 16.9 18.4 0.1 25.6 33.7 167.5 .. 11615 Finland 223.7 40,586 2.3 22.6 23.1 1.3 21.0 15.4 120.8 .. 11016 New Zealand 173.0 36,086 0.9 24.0 18.0 2.0 27.2 51.8 .. .. 11117 Belgium 485.1 42,659 1.4 23.3 23.4 1.3 23.1 32.7 135.7 .. 11317 Liechtenstein .. .. .. .. .. .. .. .. .. .. ..19 Japan 4,944.9 39,002 1.9 23.5 19.8 1.3 11.1 46.5 345.1 .. 10420 Austria 400.3 45,437 2.2 23.5 19.5 0.9 25.7 26.4 126.7 .. 11421 Luxembourg 56.5 94,278 –0.7 17.0 16.4 1.8 25.7 30.5 193.5 .. 11122 Israel 288.7 33,132 1.4 20.3 22.3 3.9 23.4 30.1 81.1 .. 10622 Korea (Republic of) 1,849.6 35,938 2.6 31.1 15.3 3.4 14.8 27.2 170.1 .. 11324 France 2,591.2 38,606 1.4 22.5 23.6 1.5 23.1 25.4 157.7 .. 10725 Slovenia 64.9 31,401 4.9 18.5 18.3 2.3 18.6 10.9 68.1 .. 10726 Spain 1,596.1 34,272 2.9 20.6 18.5 1.6 13.8 33.6 178.6 .. 10827 Czechia 345.3 32,606 4.0 25.2 19.1 1.6 14.7 14.8 62.1 .. 11128 Italy 2,132.6 35,220 1.6 17.5 18.6 0.1 23.7 31.2 166.2 .. 10929 Malta 17.0 36,513 4.1 23.2 16.5 –1.8 26.2 34.5 117.3 .. 11030 Estonia 38.8 29,481 4.9 23.7 20.3 0.8 1.4 20.4 4.8 .. 11531 Greece 264.4 24,574 1.5 12.6 20.0 –1.1 26.7 18.7 116.7 .. 10132 Cyprus 27.8 32,415 2.6 b 21.1 14.9 2.7 24.3 23.8 241.3 .. 10133 Poland 1,033.6 27,216 4.5 18.0 17.5 2.7 16.2 12.3 73.7 .. 11034 United Arab Emirates 632.6 67,293 –0.6 23.0 12.3 3.4 0.0 .. 100.8 .. 11335 Andorra .. .. 2.3 .. .. .. .. .. .. .. ..35 Lithuania 83.5 29,524 5.3 18.8 16.5 1.2 4.9 17.0 13.4 .. 11337 Qatar 308.6 116,936 –1.1 .. 23.1 1.1 14.7 40.2 147.2 .. 115 b
38 Slovakia 164.0 30,155 3.2 21.2 19.2 0.2 17.4 18.8 79.2 .. 11039 Brunei Darussalam 30.8 71,809 0.0 34.6 26.5 7.4 .. .. 28.6 .. 9939 Saudi Arabia 1,615.5 49,045 –2.7 22.7 24.9 0.8 .. .. 39.1 .. 12241 Latvia 48.6 25,064 5.6 19.9 18.1 4.1 23.9 10.3 76.3 .. 11141 Portugal 287.6 27,937 3.0 16.2 17.6 –0.2 22.5 24.1 154.1 .. 10943 Bahrain 64.6 43,291 –0.8 25.9 17.1 0.3 1.1 0.5 90.9 .. 11544 Chile 411.1 22,767 0.7 21.6 14.0 4.0 17.4 33.9 128.0 .. 12545 Hungary 261.9 26,778 4.3 21.5 20.1 0.3 23.4 17.3 58.4 .. 11446 Croatia 93.5 22,670 4.0 19.9 19.7 2.0 19.1 6.0 77.0 .. 10747 Argentina 838.2 18,934 1.9 14.8 18.1 2.0 12.2 12.4 39.2 4.8 ..48 Oman 176.0 37,961 –4.8 34.3 27.8 0.8 2.5 2.6 69.5 .. 11249 Russian Federation 3,636.7 24,766 –0.4 b 21.7 18.0 0.4 9.1 –1.3 52.8 5.7 16850 Montenegro 10.2 16,409 4.3 25.2 18.7 1.3 .. .. 60.4 11.2 11351 Bulgaria 131.4 18,563 4.3 19.2 16.0 3.2 20.0 16.1 55.3 15.3 10852 Romania 456.6 23,313 7.6 22.6 15.1 0.7 16.8 20.9 32.9 10.3 11453 Belarus 163.2 17,168 2.4 25.0 14.6 –1.3 13.8 2.4 41.9 13.0 ..54 Bahamas 11.0 27,718 0.4 26.3 13.0 9.6 14.2 .. 72.4 .. 11155 Uruguay 71.0 20,551 2.3 16.7 14.3 –1.3 23.7 31.0 35.3 .. 17556 Kuwait 271.1 65,531 –4.8 .. 25.9 2.9 1.4 0.6 92.2 .. 12557 Malaysia 847.8 26,808 4.4 25.3 12.2 5.4 13.8 46.9 145.3 3.6 12058 Barbados 4.9 16,978 1.4 17.6 13.1 .. 26.1 29.7 .. .. 12458 Kazakhstan 433.9 24,056 2.6 22.7 11.6 2.3 9.9 29.1 41.9 16.3 169
National income and composition of resources10TAB
LE
56 | HUMAN DEVELOPMENT INDICES AND INDICATORS: 2018 STATISTICAL UPDATE

TABLE
10
SDG 8.1 SDG 17.4
Gross domestic product (GDP)
Gross fixed capital
formation
General government final consumption
expenditureTotal tax revenue
Taxes on income,
profits and capital gains
Debts Prices
Total Per capita
Domestic credit provided by
financial sectorTotal debt
serviceConsumer
price index
(2011 PPP $ billions) (2011 PPP $)
Annual growth (%) (% of GDP)
Total (% of GDP)
Average annual growth (%) (% of GDP)
(% of total tax revenue) (% of GDP) (% of GNI) (2010=100)
HDI rank 2017 2017 2017 2012–2017a 2012–2017a 2012–2017a 2007–2017a 2007–2017a 2012–2017a 2016 2017
HIGH HUMAN DEVELOPMENT60 Iran (Islamic Republic of) 1,548.8 19,083 3.2 20.5 13.2 3.7 7.4 19.3 77.6 0.5 34060 Palau 0.3 13,240 –4.7 23.3 27.9 0.8 19.7 8.0 .. .. 11862 Seychelles 2.5 26,382 2.9 35.3 27.5 .. 31.7 29.4 44.5 .. 12363 Costa Rica 76.2 15,525 2.2 17.2 17.3 2.9 14.0 15.8 82.8 5.2 12364 Turkey 2,029.1 25,129 5.8 29.8 14.5 5.0 18.3 16.3 77.9 8.9 17565 Mauritius 25.7 20,293 3.7 17.3 15.1 2.4 18.1 19.2 124.9 17.3 12566 Panama 91.3 22,267 3.7 40.6 10.6 8.4 .. .. 83.3 12.6 12267 Serbia 98.7 14,049 2.4 18.5 15.9 1.0 19.7 7.6 54.2 16.5 13968 Albania 33.9 11,803 3.9 25.2 11.5 2.5 17.6 11.5 63.3 4.6 11569 Trinidad and Tobago 39.4 28,763 –2.6 .. .. .. 27.1 48.5 47.7 .. 14070 Antigua and Barbuda 2.2 21,491 2.3 .. .. .. 16.5 10.7 59.4 .. 11270 Georgia 36.2 9,745 5.0 29.5 17.1 –2.1 23.5 35.4 61.6 19.7 12472 Saint Kitts and Nevis 1.4 24,654 0.8 .. .. .. 20.4 24.9 76.3 .. 10673 Cuba .. .. 4.2 c 8.6 32.2 0.0 .. .. .. .. ..74 Mexico 2,239.2 17,336 0.8 22.3 11.8 0.1 13.6 35.7 55.2 7.6 13075 Grenada 1.5 13,594 3.2 .. .. .. 19.4 14.9 49.2 3.4 10776 Sri Lanka 250.2 11,669 2.0 26.4 8.5 –5.2 12.3 15.3 71.9 4.0 14777 Bosnia and Herzegovina 41.1 11,714 3.3 16.8 19.8 1.6 20.0 7.5 56.8 15.8 10478 Venezuela (Bolivarian Republic of) 514.7 d 16,745 d –5.2 d 21.6 14.6 0.6 .. .. 61.9 5.0 d 2,740 b
79 Brazil 2,951.7 14,103 0.2 15.6 20.0 –0.6 12.9 21.8 111.3 6.7 15680 Azerbaijan 156.3 15,847 –1.0 23.6 11.5 2.2 15.6 17.3 29.5 4.2 14980 Lebanon 81.3 13,368 0.8 21.8 13.3 –4.8 13.9 21.3 209.6 9.0 11980 The former Yugoslav Republic of Macedonia 27.3 13,111 –0.1 23.3 15.6 –1.5 16.8 15.6 59.8 8.4 11183 Armenia 25.8 8,788 7.3 17.3 14.2 13.1 21.3 39.8 58.2 13.8 12483 Thailand 1,123.8 16,278 3.6 24.0 16.9 1.7 15.5 30.7 164.7 3.6 11185 Algeria 574.9 13,914 –0.1 29.9 17.3 1.3 37.2 60.2 66.8 0.2 14286 China 21,223.9 15,309 6.3 41.9 14.3 .. 9.4 20.6 215.2 1.1 11986 Ecuador 175.9 10,582 1.5 24.3 14.4 3.8 .. .. 38.1 5.5 12488 Ukraine 335.4 7,894 2.7 b 16.0 20.4 3.3 19.6 15.2 58.7 16.0 23589 Peru 393.6 12,237 1.3 20.6 13.4 4.4 13.8 31.5 .. 3.6 12590 Colombia 650.4 13,255 0.9 22.9 19.1 4.0 13.3 17.5 53.7 4.8 13290 Saint Lucia 2.3 12,952 2.2 .. .. .. 20.4 22.8 74.0 2.7 10892 Fiji 7.9 8,703 3.0 16.4 24.1 .. 25.5 22.5 120.9 2.9 12592 Mongolia 36.4 11,841 4.2 23.8 12.3 –3.2 11.3 9.6 65.3 15.5 17294 Dominican Republic 157.2 14,601 3.4 21.9 12.2 6.5 13.5 25.3 57.8 5.7 12995 Jordan 80.9 8,337 –0.6 20.0 19.8 2.4 15.3 10.8 108.3 6.4 11995 Tunisia 125.1 10,849 0.8 19.6 20.0 10.3 21.1 26.7 96.9 4.6 13897 Jamaica 23.7 8,194 0.2 21.7 13.7 0.7 26.1 31.9 53.7 14.2 15198 Tonga 0.6 5,426 1.8 33.0 18.9 .. .. .. 32.6 3.7 113 b
99 Saint Vincent and the Grenadines 1.2 10,727 1.4 .. .. .. 23.9 24.9 56.1 4.2 107100 Suriname 7.8 13,767 –0.8 56.5 11.7 .. 19.5 31.9 48.2 .. 264101 Botswana 36.2 15,807 0.5 31.1 18.1 0.5 20.8 29.3 17.1 1.1 141101 Maldives 6.6 15,184 6.7 .. .. .. 19.5 20.4 68.5 3.2 136103 Dominica 0.7 9,673 –4.7 .. .. .. 22.1 13.7 32.4 4.7 103104 Samoa 1.2 6,022 1.8 .. .. .. 24.3 19.0 78.7 3.0 112105 Uzbekistan 202.5 6,253 3.5 24.9 15.1 .. 17.3 19.9 .. 2.0 ..106 Belize 2.9 7,824 –1.2 18.6 16.7 2.0 23.4 28.9 71.9 5.8 106106 Marshall Islands 0.2 3,819 2.4 16.2 53.9 3.5 17.8 11.3 .. .. ..108 Libya 114.0 17,882 25.1 .. .. .. .. .. 40.3 .. 126 e
108 Turkmenistan 94.4 16,389 4.7 47.2 8.9 .. .. .. .. 0.1 ..110 Gabon 33.5 16,562 –1.2 27.9 14.6 –4.3 .. .. 18.7 2.6 111 b
110 Paraguay 60.1 8,827 –0.5 19.1 11.8 1.5 13.2 12.8 44.0 5.1 135112 Moldova (Republic of) 18.4 5,190 4.6 21.9 19.0 0.0 19.3 11.1 24.3 6.0 154MEDIUM HUMAN DEVELOPMENT113 Philippines 797.3 7,599 5.1 25.2 11.3 7.3 13.7 42.0 66.3 2.9 120113 South Africa 697.3 12,295 0.1 18.7 20.9 0.6 27.1 49.3 78.7 4.4 146115 Egypt 1,029.2 10,550 2.2 14.8 10.1 2.5 12.5 24.1 99.0 2.0 231116 Indonesia 2,953.7 11,189 3.9 32.2 9.1 2.1 10.3 42.8 47.0 7.5 142116 Viet Nam 589.7 6,172 5.7 23.1 6.5 7.3 19.1 35.5 141.8 3.7 156
HUMAN DEVELOPMENT INDICES AND INDICATORS: 2018 STATISTICAL UPDATE
TABLE 10 National income and composition of resources | 57

TABLE 10 NATIONAL INCOME AND COMPOSITION OF RESOURCES
TABLE
10
SDG 8.1 SDG 17.4
Gross domestic product (GDP)
Gross fixed capital
formation
General government final consumption
expenditureTotal tax revenue
Taxes on income,
profits and capital gains
Debts Prices
Total Per capita
Domestic credit provided by
financial sectorTotal debt
serviceConsumer
price index
(2011 PPP $ billions) (2011 PPP $)
Annual growth (%) (% of GDP)
Total (% of GDP)
Average annual growth (%) (% of GDP)
(% of total tax revenue) (% of GDP) (% of GNI) (2010=100)
HDI rank 2017 2017 2017 2012–2017a 2012–2017a 2012–2017a 2007–2017a 2007–2017a 2012–2017a 2016 2017
118 Bolivia (Plurinational State of) 76.1 6,886 2.7 21.3 17.0 4.9 17.0 9.6 68.3 2.3 142119 Palestine, State of 20.8 4,450 –6.1 22.4 26.3 0.9 5.6 3.3 .. .. 111 b
120 Iraq 599.5 15,664 –3.6 17.4 20.7 .. 2.0 4.8 8.7 .. 119121 El Salvador 46.5 7,292 1.8 15.5 15.8 0.8 17.6 28.3 89.3 5.3 110122 Kyrgyzstan 21.0 3,393 2.5 30.3 17.4 1.5 16.9 10.8 20.5 6.9 152123 Morocco 271.6 7,485 –0.2 b 30.5 19.3 0.8 23.3 25.4 109.4 3.7 109124 Nicaragua 33.1 5,321 3.7 28.1 15.3 3.5 16.3 34.6 51.4 6.3 147125 Cabo Verde 3.4 6,223 2.6 34.5 19.1 2.0 17.9 24.1 86.7 2.8 108125 Guyana 5.8 7,435 2.3 30.1 19.0 .. .. .. 60.2 2.3 110 b
127 Guatemala 125.6 7,424 0.7 12.3 9.7 1.5 10.4 35.8 40.5 4.6 133127 Tajikistan 25.8 2,897 4.9 30.7 14.1 1.1 .. .. 15.8 7.8 149 b
129 Namibia 24.2 9,542 –2.9 16.0 24.5 1.9 28.5 40.4 78.9 .. 146130 India 8,606.5 6,427 5.4 28.5 11.4 10.9 11.0 46.6 75.0 3.4 160131 Micronesia (Federated States of) 0.3 3,299 1.4 .. .. .. 6.0 8.0 –41.2 .. 113 c
132 Timor-Leste 8.5 6,570 –10.0 25.2 36.3 –0.2 9.8 17.0 –7.2 .. 142133 Honduras 42.1 4,542 3.1 23.1 13.8 1.9 17.3 23.4 58.4 5.1 138134 Bhutan 7.0 8,709 5.5 47.2 16.8 6.0 13.2 24.4 53.5 3.8 158134 Kiribati 0.2 1,981 1.3 .. .. .. 24.5 7.5 .. .. 100 c
136 Bangladesh 580.3 3,524 6.2 30.5 6.0 7.8 8.8 25.2 63.7 0.8 161137 Congo 25.7 4,881 –7.0 26.3 11.6 46.3 9.4 8.1 38.9 2.0 119 c
138 Vanuatu 0.8 2,922 2.3 25.9 14.9 –1.1 16.6 0.0 58.0 0.9 108 b
139 Lao People's Democratic Republic 43.9 6,397 5.3 29.0 12.9 –1.3 12.9 16.0 .. 3.7 129140 Ghana 121.9 4,228 6.1 15.3 9.8 81.4 13.7 23.8 30.6 4.4 232141 Equatorial Guinea 28.7 22,605 –6.7 12.0 23.5 1.5 11.5 36.9 21.1 .. 121142 Kenya 148.8 2,993 2.3 18.9 14.3 8.4 15.8 37.4 42.6 1.6 172143 Sao Tome and Principe 0.6 3,053 1.6 .. .. .. 14.6 12.8 23.1 0.8 172144 Eswatini (Kingdom of) 10.6 7,739 0.2 12.4 22.3 7.0 28.6 18.6 24.1 1.0 155144 Zambia 63.1 3,689 1.0 36.4 16.1 .. 14.9 36.9 21.8 3.1 181146 Cambodia 58.3 3,645 5.2 21.9 5.1 6.5 15.3 18.3 74.4 4.2 125147 Angola 173.3 5,819 –2.6 7.8 13.4 20.0 10.3 42.4 29.5 8.4 281148 Myanmar 298.4 5,592 5.4 34.7 19.0 .. 5.8 12.9 41.1 0.2 145149 Nepal 71.6 2,443 6.3 33.8 11.7 12.2 21.3 22.5 87.1 1.1 171150 Pakistan 991.9 5,035 3.7 14.5 11.3 5.3 9.2 27.4 53.9 1.4 157151 Cameroon 80.9 3,365 0.5 21.6 11.5 –0.9 .. .. 16.6 2.6 115LOW HUMAN DEVELOPMENT152 Solomon Islands 1.3 2,206 1.2 .. .. .. 26.7 23.1 28.5 2.0 127153 Papua New Guinea 31.5 3,823 0.1 .. .. .. 13.5 50.4 44.3 20.0 136 b
154 Tanzania (United Republic of) 149.3 2,683 3.7 b 33.7 14.0 12.3 11.9 .. 20.2 1.1 175155 Syrian Arab Republic .. .. .. .. .. .. 14.2 30.2 .. 0.0 f 143 g
156 Zimbabwe 31.4 1,900 1.1 16.8 27.5 28.2 21.4 32.1 .. 7.5 106157 Nigeria 1,019.0 5,338 –1.8 14.7 5.4 –15.1 1.5 26.9 23.3 0.6 214158 Rwanda 22.6 1,854 3.6 22.9 15.2 10.7 14.8 22.4 19.0 1.6 147159 Lesotho 6.4 2,851 4.2 24.0 34.9 2.9 36.4 22.8 15.5 2.2 143159 Mauritania 15.9 3,598 0.7 58.5 21.7 8.7 .. .. 29.6 4.9 128161 Madagascar 36.2 1,416 1.4 15.2 10.7 2.4 11.4 9.0 19.0 1.3 161162 Uganda 72.8 1,698 0.6 23.5 8.0 –10.9 13.5 30.0 23.2 3.6 166163 Benin 23.1 2,064 2.7 28.6 15.1 2.0 15.4 16.7 25.9 1.1 109164 Senegal 39.2 2,471 3.8 25.1 15.2 3.5 20.5 22.0 43.9 2.9 107165 Comoros 1.2 1,414 0.2 212.0 16.1 1.4 .. .. 30.2 1.0 104 e
165 Togo 11.1 1,430 3.0 26.6 14.0 2.0 21.9 11.4 43.8 2.0 110167 Sudan 181.0 4,467 2.2 b 18.3 5.8 15.5 .. .. 22.5 0.3 350 c
168 Afghanistan 64.1 1,804 0.1 17.7 12.3 0.3 7.6 6.0 –2.4 0.2 138 b
168 Haiti 18.2 1,653 –0.1 43.4 3.6 3.6 .. .. 31.6 1.1 181170 Côte d'Ivoire 87.5 3,601 5.1 20.9 12.0 10.9 15.2 10.8 33.8 4.4 112171 Malawi 20.4 1,095 1.0 13.4 80.1 8.3 17.3 38.6 19.6 1.4 342172 Djibouti .. .. 2.5 24.9 32.4 4.9 .. .. 35.0 3.4 116173 Ethiopia 181.6 1,730 7.6 39.0 12.3 13.8 8.8 17.5 .. 1.7 249174 Gambia 3.3 1,562 0.4 19.2 12.0 3.4 15.1 18.0 55.9 4.0 140 b
175 Guinea 26.5 2,081 9.9 75.1 14.3 8.8 .. .. 22.9 0.7 219176 Congo (Democratic Republic of the) 65.7 808 0.4 20.6 5.5 –32.8 8.4 11.9 11.6 1.3 134 b
58 | HUMAN DEVELOPMENT INDICES AND INDICATORS: 2018 STATISTICAL UPDATE

TABLE
10
SDG 8.1 SDG 17.4
Gross domestic product (GDP)
Gross fixed capital
formation
General government final consumption
expenditureTotal tax revenue
Taxes on income,
profits and capital gains
Debts Prices
Total Per capita
Domestic credit provided by
financial sectorTotal debt
serviceConsumer
price index
(2011 PPP $ billions) (2011 PPP $)
Annual growth (%) (% of GDP)
Total (% of GDP)
Average annual growth (%) (% of GDP)
(% of total tax revenue) (% of GDP) (% of GNI) (2010=100)
HDI rank 2017 2017 2017 2012–2017a 2012–2017a 2012–2017a 2007–2017a 2007–2017a 2012–2017a 2016 2017
177 Guinea-Bissau 2.9 1,549 3.3 10.4 9.3 4.9 .. .. 14.1 0.4 112178 Yemen 40.8 b 1,479 b –35.9 b 1.7 16.8 –23.0 .. .. 30.1 0.5 158 d
179 Eritrea .. .. .. .. .. .. .. .. .. 0.9 h ..180 Mozambique 33.7 1,136 0.8 21.7 27.2 4.8 20.1 35.2 32.6 4.5 171181 Liberia 3.6 753 –0.1 20.1 15.9 –10.2 20.3 31.2 36.6 0.6 181182 Mali 37.3 2,014 2.2 19.3 17.4 17.3 15.4 22.4 27.3 0.9 110183 Burkina Faso 32.7 1,703 3.7 24.6 23.9 10.4 15.8 20.3 31.6 1.1 108184 Sierra Leone 10.5 1,390 1.9 18.9 12.4 17.9 8.6 28.1 21.9 1.1 176185 Burundi 7.6 702 –2.6 16.9 21.5 2.0 12.2 14.5 32.8 2.0 189186 Chad 26.3 1,768 –5.9 20.6 4.3 8.3 .. .. 25.2 0.4 116 c
187 South Sudan 19.2 b 1,570 b –16.3 b 17.3 19.0 .. .. .. 13.4 .. 4,584188 Central African Republic 3.1 661 2.9 17.7 8.0 0.0 9.3 7.8 30.5 1.4 187 c
189 Niger 19.9 926 1.0 33.7 15.0 2.7 .. .. 19.1 1.3 109OTHER COUNTRIES OR TERRITORIES
.. Korea (Democratic People's Rep. of) .. .. .. .. .. .. .. .. .. .. ..
.. Monaco .. .. .. .. .. .. .. .. .. .. ..
.. Nauru 0.2 12,896 –0.4 .. .. .. .. .. .. .. ..
.. San Marino 1.9 56,861 0.6 .. .. .. 15.4 15.4 .. .. 111
.. Somalia .. .. .. 9.5 5.4 .. .. .. .. 0.0 ..
.. Tuvalu – 3,575 2.4 .. .. .. .. .. .. .. ..Human development groups
Very high human development 57,964.1 40,078 — 21.0 17.4 1.3 14.6 37.9 196.4 .. —High human development 35,766.3 15,280 — 34.3 15.0 .. 11.2 23.4 168.6 3.0 —Medium human development 18,684.2 6,836 — 25.8 11.9 7.9 12.2 39.8 67.2 3.9 —Low human development 2,346.9 2,609 — 21.2 9.9 –2.1 7.5 24.2 23.9 1.7 —
Developing countries 62,657.3 10,199 — 30.9 14.5 3.7 11.3 27.4 133.2 3.3 —Regions
Arab States 6,187.6 16,472 — 22.2 18.9 2.2 10.6 38.7 72.9 2.4 —East Asia and the Pacific 28,026.4 13,737 — 39.6 13.8 .. 10.0 24.6 194.7 1.8 —Europe and Central Asia 3,753.3 15,563 — 27.2 14.6 3.9 17.3 16.7 66.5 10.1 —Latin America and the Caribbean 9,076.7 14,469 — 18.8 16.7 1.0 13.6 25.8 78.4 6.2 —South Asia 12,127.1 6,485 — 26.5 11.2 9.0 10.4 39.2 72.4 2.7 —Sub-Saharan Africa 3,486.3 3,489 — 19.9 13.8 2.8 13.8 38.4 40.3 3.0 —
Least developed countries 2,483.6 2,536 — 25.9 11.4 7.9 10.9 25.1 38.4 2.0 —Small island developing states 371.1 8,078 — 18.9 20.5 .. .. .. 59.5 8.6 —
Organisation for Economic Co‑operation and Development 51,412.2 39,590 — 21.1 17.3 1.3 15.0 38.5 204.3 .. —
World 114,763.7 15,439 — 24.6 16.3 1.9 13.5 35.1 177.1 3.5 —
NOTES
a Data refer to the most recent year available during the period specified.
b Refers to 2016.
c Refers to 2015.
d Refers to 2014.
e Refers to 2013.
f Refers to 2007.
g Refers to 2012.
h Refers to 2011.
DEFINITIONS
Gross domestic product (GDP): Sum of gross value added by all resident producers in the economy plus any product taxes and minus any subsidies not included in the value of the products,
expressed in 2011 international dollars using purchasing power parity (PPP) rates.
GDP per capita: GDP in a particular period divided by the total population in the same period.
GDP per capita, annual growth: Annual percentage growth rate of GDP per capita based on constant local currency.
Gross fixed capital formation: Value of acquisitions of new or existing fixed assets by the business sector, governments and households (excluding their unincorporated enterprises) less disposals of fixed assets, expressed as a percentage of GDP. No adjustment is made for depreciation of fixed assets.
General government final consumption expenditure: All government current expenditures
for purchases of goods and services (including compensation of employees and most expenditures on national defence and security but excluding government military expenditures that are part of government capital formation), expressed as a percentage of GDP.
Total tax revenue: Compulsory transfers to the central government for public purposes, expressed as a percentage of GDP.
Taxes on income, profits and capital gains: Taxes levied on the actual or presumptive net income of individuals, on the profits of corporations and enterprises and on capital gains, whether realized or not, on land, securities and other assets.
Domestic credit provided by financial sector: Credit to various sectors on a gross basis (except
credit to the central government, which is net), expressed as a percentage of GDP.
Total debt service: Sum of principal repayments and interest actually paid in foreign currency, goods or services on long-term debt; interest paid on short-term debt; and repayments (repurchases and charges) to the International Monetary Fund, expressed as a percentage of gross national income (GNI).
Consumer price index: Index that reflects changes in the cost to the average consumer of acquiring a basket of goods and services that may be fixed or changed at specified intervals, such as yearly.
MAIN DATA SOURCES
Columns 1–11: World Bank (2018a).
HUMAN DEVELOPMENT INDICES AND INDICATORS: 2018 STATISTICAL UPDATE
TABLE 10 National income and composition of resources | 59
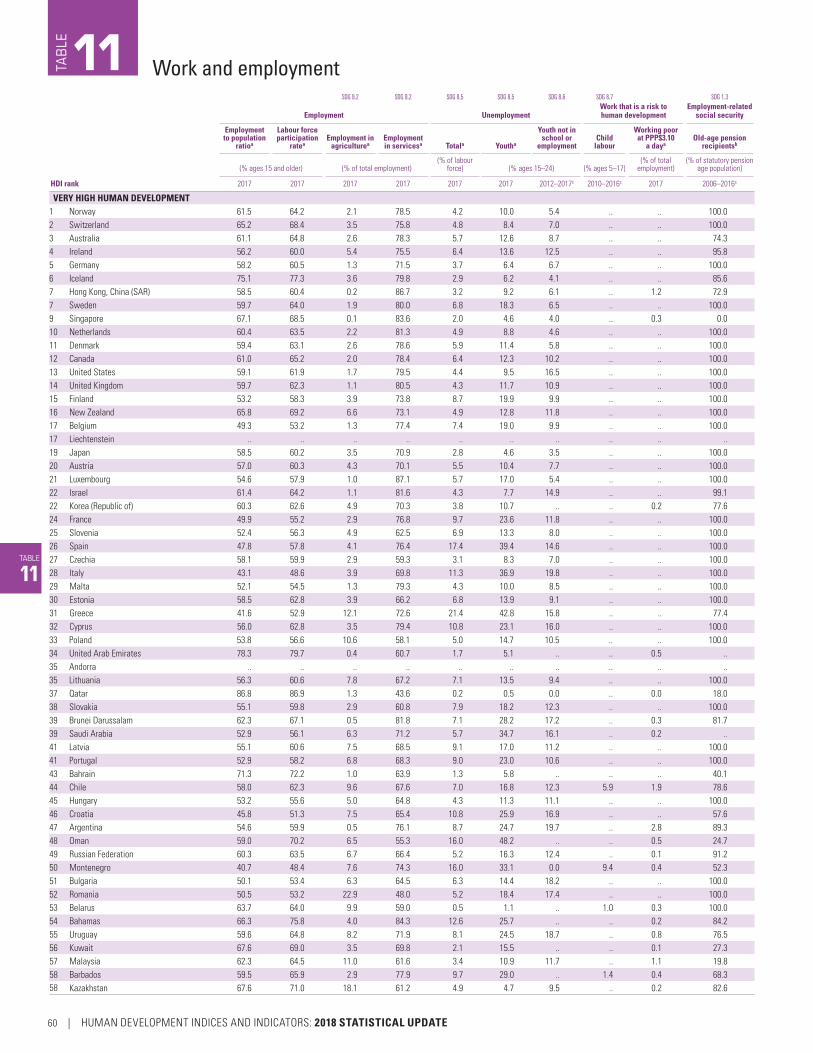
TABLE
11
SDG 9.2 SDG 9.2 SDG 8.5 SDG 8.5 SDG 8.6 SDG 8.7 SDG 1.3
Employment UnemploymentWork that is a risk to human development
Employment‑related social security
Employment to population
ratioa
Labour force participation
rateaEmployment in
agricultureaEmployment in servicesa Totala Youtha
Youth not in school or
employmentChild
labour
Working poor at PPP$3.10
a dayaOld‑age pension
recipientsb
(% ages 15 and older) (% of total employment)(% of labour
force) (% ages 15–24) (% ages 5–17)(% of total
employment)(% of statutory pension
age population)
HDI rank 2017 2017 2017 2017 2017 2017 2012–2017c 2010–2016c 2017 2006–2016c
VERY HIGH HUMAN DEVELOPMENT1 Norway 61.5 64.2 2.1 78.5 4.2 10.0 5.4 .. .. 100.02 Switzerland 65.2 68.4 3.5 75.8 4.8 8.4 7.0 .. .. 100.03 Australia 61.1 64.8 2.6 78.3 5.7 12.6 8.7 .. .. 74.34 Ireland 56.2 60.0 5.4 75.5 6.4 13.6 12.5 .. .. 95.85 Germany 58.2 60.5 1.3 71.5 3.7 6.4 6.7 .. .. 100.06 Iceland 75.1 77.3 3.6 79.8 2.9 6.2 4.1 .. .. 85.67 Hong Kong, China (SAR) 58.5 60.4 0.2 86.7 3.2 9.2 6.1 .. 1.2 72.97 Sweden 59.7 64.0 1.9 80.0 6.8 18.3 6.5 .. .. 100.09 Singapore 67.1 68.5 0.1 83.6 2.0 4.6 4.0 .. 0.3 0.010 Netherlands 60.4 63.5 2.2 81.3 4.9 8.8 4.6 .. .. 100.011 Denmark 59.4 63.1 2.6 78.6 5.9 11.4 5.8 .. .. 100.012 Canada 61.0 65.2 2.0 78.4 6.4 12.3 10.2 .. .. 100.013 United States 59.1 61.9 1.7 79.5 4.4 9.5 16.5 .. .. 100.014 United Kingdom 59.7 62.3 1.1 80.5 4.3 11.7 10.9 .. .. 100.015 Finland 53.2 58.3 3.9 73.8 8.7 19.9 9.9 .. .. 100.016 New Zealand 65.8 69.2 6.6 73.1 4.9 12.8 11.8 .. .. 100.017 Belgium 49.3 53.2 1.3 77.4 7.4 19.0 9.9 .. .. 100.017 Liechtenstein .. .. .. .. .. .. .. .. .. ..19 Japan 58.5 60.2 3.5 70.9 2.8 4.6 3.5 .. .. 100.020 Austria 57.0 60.3 4.3 70.1 5.5 10.4 7.7 .. .. 100.021 Luxembourg 54.6 57.9 1.0 87.1 5.7 17.0 5.4 .. .. 100.022 Israel 61.4 64.2 1.1 81.6 4.3 7.7 14.9 .. .. 99.122 Korea (Republic of) 60.3 62.6 4.9 70.3 3.8 10.7 .. .. 0.2 77.624 France 49.9 55.2 2.9 76.8 9.7 23.6 11.8 .. .. 100.025 Slovenia 52.4 56.3 4.9 62.5 6.9 13.3 8.0 .. .. 100.026 Spain 47.8 57.8 4.1 76.4 17.4 39.4 14.6 .. .. 100.027 Czechia 58.1 59.9 2.9 59.3 3.1 8.3 7.0 .. .. 100.028 Italy 43.1 48.6 3.9 69.8 11.3 36.9 19.8 .. .. 100.029 Malta 52.1 54.5 1.3 79.3 4.3 10.0 8.5 .. .. 100.030 Estonia 58.5 62.8 3.9 66.2 6.8 13.9 9.1 .. .. 100.031 Greece 41.6 52.9 12.1 72.6 21.4 42.8 15.8 .. .. 77.432 Cyprus 56.0 62.8 3.5 79.4 10.8 23.1 16.0 .. .. 100.033 Poland 53.8 56.6 10.6 58.1 5.0 14.7 10.5 .. .. 100.034 United Arab Emirates 78.3 79.7 0.4 60.7 1.7 5.1 .. .. 0.5 ..35 Andorra .. .. .. .. .. .. .. .. .. ..35 Lithuania 56.3 60.6 7.8 67.2 7.1 13.5 9.4 .. .. 100.037 Qatar 86.8 86.9 1.3 43.6 0.2 0.5 0.0 .. 0.0 18.038 Slovakia 55.1 59.8 2.9 60.8 7.9 18.2 12.3 .. .. 100.039 Brunei Darussalam 62.3 67.1 0.5 81.8 7.1 28.2 17.2 .. 0.3 81.739 Saudi Arabia 52.9 56.1 6.3 71.2 5.7 34.7 16.1 .. 0.2 ..41 Latvia 55.1 60.6 7.5 68.5 9.1 17.0 11.2 .. .. 100.041 Portugal 52.9 58.2 6.8 68.3 9.0 23.0 10.6 .. .. 100.043 Bahrain 71.3 72.2 1.0 63.9 1.3 5.8 .. .. .. 40.144 Chile 58.0 62.3 9.6 67.6 7.0 16.8 12.3 5.9 1.9 78.645 Hungary 53.2 55.6 5.0 64.8 4.3 11.3 11.1 .. .. 100.046 Croatia 45.8 51.3 7.5 65.4 10.8 25.9 16.9 .. .. 57.647 Argentina 54.6 59.9 0.5 76.1 8.7 24.7 19.7 .. 2.8 89.348 Oman 59.0 70.2 6.5 55.3 16.0 48.2 .. .. 0.5 24.749 Russian Federation 60.3 63.5 6.7 66.4 5.2 16.3 12.4 .. 0.1 91.250 Montenegro 40.7 48.4 7.6 74.3 16.0 33.1 0.0 9.4 0.4 52.351 Bulgaria 50.1 53.4 6.3 64.5 6.3 14.4 18.2 .. .. 100.052 Romania 50.5 53.2 22.9 48.0 5.2 18.4 17.4 .. .. 100.053 Belarus 63.7 64.0 9.9 59.0 0.5 1.1 .. 1.0 0.3 100.054 Bahamas 66.3 75.8 4.0 84.3 12.6 25.7 .. .. 0.2 84.255 Uruguay 59.6 64.8 8.2 71.9 8.1 24.5 18.7 .. 0.8 76.556 Kuwait 67.6 69.0 3.5 69.8 2.1 15.5 .. .. 0.1 27.357 Malaysia 62.3 64.5 11.0 61.6 3.4 10.9 11.7 .. 1.1 19.858 Barbados 59.5 65.9 2.9 77.9 9.7 29.0 .. 1.4 0.4 68.358 Kazakhstan 67.6 71.0 18.1 61.2 4.9 4.7 9.5 .. 0.2 82.6
Work and employment11TAB
LE
60 | HUMAN DEVELOPMENT INDICES AND INDICATORS: 2018 STATISTICAL UPDATE

TABLE
11
SDG 9.2 SDG 9.2 SDG 8.5 SDG 8.5 SDG 8.6 SDG 8.7 SDG 1.3
Employment UnemploymentWork that is a risk to human development
Employment‑related social security
Employment to population
ratioa
Labour force participation
rateaEmployment in
agricultureaEmployment in servicesa Totala Youtha
Youth not in school or
employmentChild
labour
Working poor at PPP$3.10
a dayaOld‑age pension
recipientsb
(% ages 15 and older) (% of total employment)(% of labour
force) (% ages 15–24) (% ages 5–17)(% of total
employment)(% of statutory pension
age population)
HDI rank 2017 2017 2017 2017 2017 2017 2012–2017c 2010–2016c 2017 2006–2016c
HIGH HUMAN DEVELOPMENT60 Iran (Islamic Republic of) 38.4 44.2 17.1 50.5 13.1 30.3 .. .. 1.1 26.460 Palau .. .. .. .. .. .. .. .. .. 48.062 Seychelles .. .. .. .. .. .. .. .. .. 100.063 Costa Rica 54.5 59.5 12.0 69.5 8.5 22.7 20.1 5.3 1.5 68.864 Turkey 45.8 51.6 19.4 53.8 11.3 20.3 24.0 .. 1.1 20.065 Mauritius 54.5 58.7 7.3 66.7 7.2 23.3 .. .. 1.9 100.066 Panama 63.2 66.9 15.1 66.7 5.6 14.2 26.3 2.6 4.3 37.367 Serbia 46.0 53.5 19.0 56.6 14.1 32.8 17.6 7.0 0.5 46.168 Albania 48.3 56.1 40.3 41.1 13.9 30.0 32.8 3.3 1.5 77.069 Trinidad and Tobago 59.1 62.1 3.7 69.7 4.8 11.4 52.1 .. 0.9 98.470 Antigua and Barbuda .. .. .. .. .. .. .. .. .. 83.570 Georgia 59.8 67.6 40.9 46.6 11.6 29.3 .. 1.6 16.8 91.972 Saint Kitts and Nevis .. .. .. .. .. .. .. .. .. 44.773 Cuba 53.0 54.3 18.6 64.9 2.6 5.5 .. .. 2.7 ..74 Mexico 59.2 61.3 13.1 61.1 3.5 6.9 18.7 4.9 11.3 25.275 Grenada .. .. .. .. .. .. .. .. .. 34.076 Sri Lanka 51.4 53.5 26.7 47.7 4.1 20.7 27.7 .. 10.1 25.277 Bosnia and Herzegovina 34.7 46.6 19.1 48.7 25.6 55.4 26.4 .. 0.2 29.678 Venezuela (Bolivarian Republic of) 58.5 63.6 10.2 66.5 8.1 17.6 .. .. 15.9 59.479 Brazil 55.5 63.7 10.3 68.8 12.9 30.5 24.8 5.4 6.4 78.380 Azerbaijan 62.8 66.1 37.4 48.5 5.0 13.7 .. .. 1.5 81.180 Lebanon 44.2 47.2 3.2 76.5 6.3 16.5 .. .. 0.4 0.080 The former Yugoslav Republic of Macedonia 42.4 55.0 16.4 53.8 23.0 46.9 24.3 7.6 4.9 71.483 Armenia 49.2 60.1 34.4 49.7 18.2 39.0 36.6 4.1 10.1 68.583 Thailand 67.8 68.6 32.8 44.7 1.1 5.9 15.0 .. 0.6 83.085 Algeria 37.3 41.4 12.8 40.2 10.0 23.9 21.2 4.3 9.7 63.686 China 65.7 68.9 17.5 55.9 4.7 10.8 .. .. 9.7 100.086 Ecuador 64.9 68.3 26.9 54.5 4.9 10.9 17.6 .. 10.8 52.088 Ukraine 49.1 54.2 14.9 59.8 9.5 23.3 18.3 3.2 0.3 91.989 Peru 73.8 76.7 28.4 55.7 3.7 9.0 16.9 14.5 8.8 19.390 Colombia 64.1 70.4 16.1 64.5 9.0 18.4 21.9 3.6 8.4 51.790 Saint Lucia 54.0 68.3 15.3 67.4 21.0 45.0 .. 3.3 .. 26.592 Fiji 54.6 58.3 39.5 47.2 6.3 18.8 20.1 .. 11.2 10.692 Mongolia 55.2 59.3 30.4 50.6 7.0 18.9 20.5 16.6 2.1 100.094 Dominican Republic 63.1 66.8 12.4 70.2 5.5 12.4 25.4 7.0 3.8 11.195 Jordan 33.3 39.1 3.7 69.5 14.9 39.8 .. 1.7 12.0 42.295 Tunisia 39.8 46.9 13.7 43.7 15.2 35.8 .. 2.3 5.3 33.897 Jamaica 58.9 67.2 18.6 66.0 12.5 29.7 .. 2.9 5.8 30.398 Tonga 58.8 59.5 31.7 36.8 1.2 2.8 .. .. .. 1.099 Saint Vincent and the Grenadines 56.8 69.6 6.2 81.0 18.3 39.6 .. .. .. 76.6100 Suriname 49.1 53.4 2.7 73.2 8.1 15.9 .. 3.8 12.7 ..101 Botswana 58.9 71.9 26.2 60.3 18.1 35.7 .. .. 21.2 100.0101 Maldives 62.6 65.8 7.5 67.7 5.0 13.8 20.5 .. 9.6 99.7103 Dominica .. .. .. .. .. .. .. .. .. 38.5104 Samoa 28.9 31.5 5.8 79.3 8.2 18.0 37.9 .. .. 49.5105 Uzbekistan 60.9 65.7 21.9 40.4 7.2 14.6 .. .. 14.9 98.1106 Belize 62.0 67.1 15.4 69.5 7.6 16.6 22.4 3.3 10.4 64.6106 Marshall Islands .. .. .. .. .. .. .. .. .. 64.2108 Libya 43.2 52.5 12.4 60.9 17.7 46.0 .. .. 10.4 43.3108 Turkmenistan 63.2 65.5 8.2 46.8 3.4 6.5 .. 0.3 2.5 ..110 Gabon 41.3 51.4 41.9 45.6 19.6 36.5 .. 19.6 15.2 38.8110 Paraguay 66.3 70.4 21.2 59.3 5.8 12.8 37.7 17.9 4.4 22.2112 Moldova (Republic of) 40.6 42.5 33.3 49.6 4.5 12.8 27.8 .. 0.9 75.2MEDIUM HUMAN DEVELOPMENT
113 Philippines 60.6 62.3 26.0 56.3 2.8 7.9 22.2 .. 18.2 39.8113 South Africa 39.6 54.7 5.6 71.1 27.7 57.4 31.2 .. 16.4 92.6115 Egypt 42.2 48.0 24.8 49.6 12.1 34.4 27.6 4.8 42.7 37.5116 Indonesia 63.4 66.3 31.2 47.1 4.3 15.6 21.5 .. 27.6 14.0116 Viet Nam 76.6 78.2 40.9 34.1 2.1 7.0 0.6 13.1 7.8 39.9
HUMAN DEVELOPMENT INDICES AND INDICATORS: 2018 STATISTICAL UPDATE
TABLE 11 Work and employment | 61

TABLE 11 WORK AND EMPLOYMENT
TABLE
11
SDG 9.2 SDG 9.2 SDG 8.5 SDG 8.5 SDG 8.6 SDG 8.7 SDG 1.3
Employment UnemploymentWork that is a risk to human development
Employment‑related social security
Employment to population
ratioa
Labour force participation
rateaEmployment in
agricultureaEmployment in servicesa Totala Youtha
Youth not in school or
employmentChild
labour
Working poor at PPP$3.10
a dayaOld‑age pension
recipientsb
(% ages 15 and older) (% of total employment)(% of labour
force) (% ages 15–24) (% ages 5–17)(% of total
employment)(% of statutory pension
age population)
HDI rank 2017 2017 2017 2017 2017 2017 2012–2017c 2010–2016c 2017 2006–2016c
118 Bolivia (Plurinational State of) 65.3 67.4 27.0 50.6 3.1 6.6 10.9 .. 9.7 100.0119 Palestine, State of 33.1 45.9 9.6 61.1 27.9 44.5 32.3 9.4 2.9 8.0120 Iraq 42.7 46.5 18.7 61.6 8.2 18.0 40.6 5.6 31.6 56.0121 El Salvador 58.6 61.4 18.8 60.0 4.5 9.9 29.9 10.0 6.3 18.1122 Kyrgyzstan 57.2 61.6 26.7 51.1 7.3 15.7 20.4 16.2 16.7 100.0123 Morocco 44.4 49.0 37.5 43.0 9.3 18.0 .. .. 8.2 39.8124 Nicaragua 63.7 66.6 29.4 53.0 4.4 8.5 1.4 .. 8.8 23.7125 Cabo Verde 54.2 60.4 67.7 25.4 10.3 17.8 .. .. 37.2 85.8125 Guyana 50.9 57.7 13.4 60.1 11.8 26.3 35.2 10.8 6.4 100.0127 Guatemala 60.3 62.0 29.4 49.6 2.7 5.8 27.3 .. 13.4 8.3127 Tajikistan 53.2 59.3 51.6 32.0 10.3 18.9 .. .. 16.9 92.8129 Namibia 47.3 61.7 20.2 60.2 23.3 45.5 33.4 .. 26.4 98.4130 India 51.9 53.8 42.7 33.5 3.5 10.5 27.5 .. 42.9 24.1131 Micronesia (Federated States of) .. .. .. .. .. .. .. .. .. ..132 Timor-Leste 37.5 38.8 25.0 59.8 3.4 11.6 24.3 .. 23.1 89.7133 Honduras 65.1 68.1 28.5 50.3 4.5 8.2 27.8 .. 21.9 56.9134 Bhutan 65.2 66.8 56.8 33.5 2.4 10.2 .. 3.5 9.6 3.2134 Kiribati .. .. .. .. .. .. .. .. .. ..136 Bangladesh 54.0 56.5 39.1 39.9 4.4 11.4 28.9 .. 67.3 33.4137 Congo 62.1 69.7 37.2 36.9 11.0 22.5 .. 23.3 52.5 22.1138 Vanuatu 66.8 70.5 64.9 29.2 5.2 10.6 .. .. .. 3.5139 Lao People's Democratic Republic 77.8 78.3 61.3 29.0 0.7 1.7 .. 12.3 77.2 5.6140 Ghana 75.1 76.9 40.7 45.2 2.4 4.9 25.5 19.9 25.7 33.3141 Equatorial Guinea 55.1 59.2 59.5 34.1 6.9 14.2 .. .. 13.0 ..142 Kenya 57.9 65.4 38.0 47.8 11.5 26.2 .. .. 26.8 24.8143 Sao Tome and Principe 50.3 58.1 17.1 68.8 13.4 27.1 .. 18.2 .. 52.5144 Eswatini (Kingdom of) 40.0 54.3 69.1 18.5 26.4 54.8 .. 7.8 34.4 86.0144 Zambia 69.0 74.8 53.3 34.8 7.8 15.4 .. .. 67.0 8.8146 Cambodia 84.5 84.6 26.7 46.3 0.2 0.4 12.7 12.6 46.4 3.2147 Angola 71.3 77.6 50.6 40.8 8.2 19.1 .. 18.7 59.0 14.5148 Myanmar 64.6 65.1 49.9 33.5 0.8 1.7 18.6 .. 41.9 ..149 Nepal 81.9 84.2 71.7 20.2 2.7 4.3 .. 21.7 32.6 62.5150 Pakistan 52.2 54.4 42.0 34.3 4.0 7.7 30.4 .. 31.2 2.3151 Cameroon 73.0 76.2 62.0 28.7 4.3 8.9 .. 38.9 38.3 13.0LOW HUMAN DEVELOPMENT
152 Solomon Islands 70.0 71.5 69.6 20.6 2.1 4.4 .. 17.9 43.5 13.1153 Papua New Guinea 68.1 69.9 20.6 71.8 2.7 5.0 .. .. 46.8 0.9154 Tanzania (United Republic of) 81.5 83.3 66.7 27.3 2.2 3.9 14.9 24.3 68.3 3.2155 Syrian Arab Republic 34.8 41.1 22.9 44.4 15.2 34.9 .. .. 62.5 16.7156 Zimbabwe 79.3 83.6 68.5 24.1 5.2 11.4 .. .. 74.8 6.2157 Nigeria 51.3 55.2 36.6 51.8 7.0 13.4 20.4 31.5 71.7 7.8158 Rwanda 85.0 86.2 66.5 25.4 1.3 2.1 4.7 19.0 70.8 4.7 d
159 Lesotho 48.4 66.5 10.4 49.1 27.3 38.5 .. .. 55.3 94.0159 Mauritania 44.4 49.4 75.9 16.9 10.2 18.6 39.5 17.4 15.9 9.3 e
161 Madagascar 84.9 86.5 74.4 16.4 1.8 3.0 3.8 .. 86.4 4.6162 Uganda 69.2 70.7 69.0 24.1 2.1 2.9 5.9 20.6 52.4 6.6163 Benin 69.1 70.9 43.2 38.3 2.5 5.2 20.0 41.3 73.5 9.7164 Senegal 54.4 57.2 53.4 26.5 4.9 5.5 36.2 22.8 63.2 23.5165 Comoros 41.2 43.1 54.9 29.8 4.3 10.0 .. 28.5 28.1 ..165 Togo 76.1 77.6 37.8 44.9 1.8 2.8 .. 22.6 61.4 10.9167 Sudan 40.5 46.5 53.3 27.5 12.8 28.4 .. 18.1 23.2 4.6168 Afghanistan 49.5 54.2 62.2 31.1 8.8 17.7 .. 21.4 98.2 10.7168 Haiti 58.6 68.1 41.3 46.5 14.0 36.0 .. 35.5 50.7 1.0 f
170 Côte d'Ivoire 55.8 57.3 48.3 45.3 2.6 3.7 36.0 29.1 48.5 7.7171 Malawi 72.3 77.0 84.7 6.9 6.0 8.0 .. 19.4 82.6 2.3172 Djibouti 55.6 59.0 29.8 40.5 5.8 11.7 .. .. .. 12.0 e
173 Ethiopia 78.2 82.5 68.2 22.4 5.2 7.4 10.5 48.6 51.5 15.3174 Gambia 53.7 59.3 27.1 57.6 9.5 12.9 34.0 .. 62.3 17.0175 Guinea 61.3 64.2 68.2 25.9 4.5 5.5 .. 32.8 69.4 8.8176 Congo (Democratic Republic of the) 69.8 72.4 81.9 7.0 3.7 7.3 21.4 26.7 90.5 15.0
62 | HUMAN DEVELOPMENT INDICES AND INDICATORS: 2018 STATISTICAL UPDATE
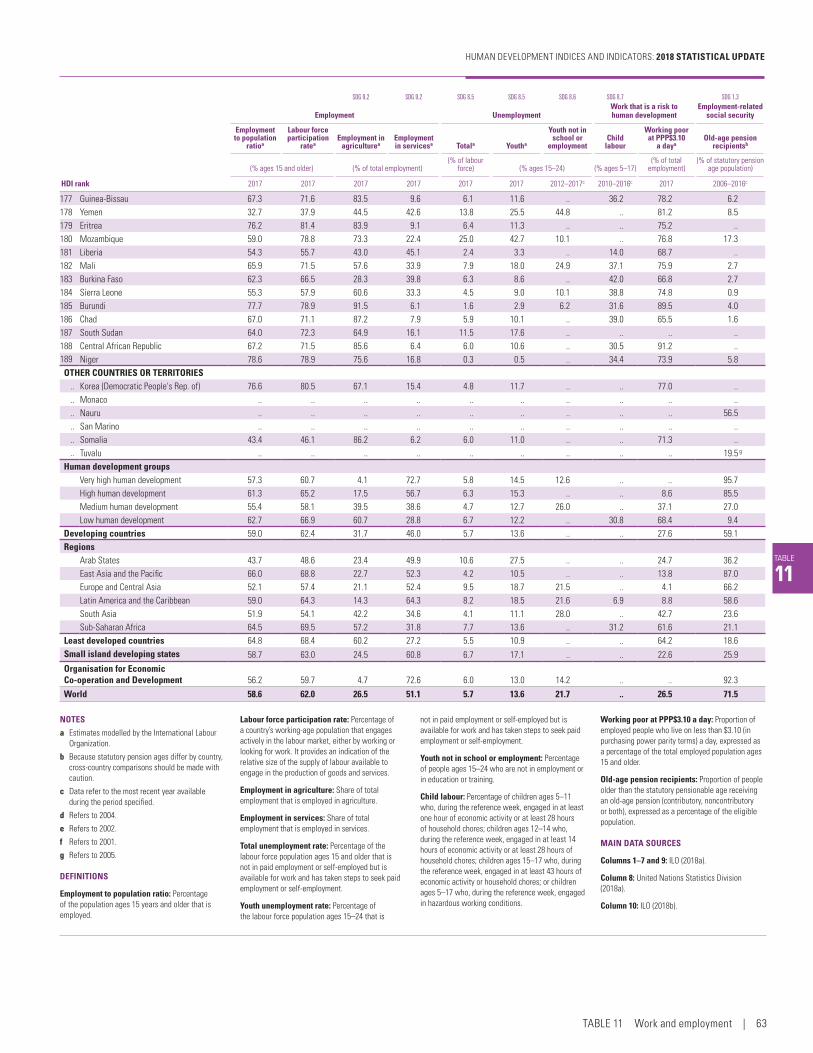
TABLE
11
SDG 9.2 SDG 9.2 SDG 8.5 SDG 8.5 SDG 8.6 SDG 8.7 SDG 1.3
Employment UnemploymentWork that is a risk to human development
Employment‑related social security
Employment to population
ratioa
Labour force participation
rateaEmployment in
agricultureaEmployment in servicesa Totala Youtha
Youth not in school or
employmentChild
labour
Working poor at PPP$3.10
a dayaOld‑age pension
recipientsb
(% ages 15 and older) (% of total employment)(% of labour
force) (% ages 15–24) (% ages 5–17)(% of total
employment)(% of statutory pension
age population)
HDI rank 2017 2017 2017 2017 2017 2017 2012–2017c 2010–2016c 2017 2006–2016c
177 Guinea-Bissau 67.3 71.6 83.5 9.6 6.1 11.6 .. 36.2 78.2 6.2178 Yemen 32.7 37.9 44.5 42.6 13.8 25.5 44.8 .. 81.2 8.5179 Eritrea 76.2 81.4 83.9 9.1 6.4 11.3 .. .. 75.2 ..180 Mozambique 59.0 78.8 73.3 22.4 25.0 42.7 10.1 .. 76.8 17.3181 Liberia 54.3 55.7 43.0 45.1 2.4 3.3 .. 14.0 68.7 ..182 Mali 65.9 71.5 57.6 33.9 7.9 18.0 24.9 37.1 75.9 2.7183 Burkina Faso 62.3 66.5 28.3 39.8 6.3 8.6 .. 42.0 66.8 2.7184 Sierra Leone 55.3 57.9 60.6 33.3 4.5 9.0 10.1 38.8 74.8 0.9185 Burundi 77.7 78.9 91.5 6.1 1.6 2.9 6.2 31.6 89.5 4.0186 Chad 67.0 71.1 87.2 7.9 5.9 10.1 .. 39.0 65.5 1.6187 South Sudan 64.0 72.3 64.9 16.1 11.5 17.6 .. .. .. ..188 Central African Republic 67.2 71.5 85.6 6.4 6.0 10.6 .. 30.5 91.2 ..189 Niger 78.6 78.9 75.6 16.8 0.3 0.5 .. 34.4 73.9 5.8OTHER COUNTRIES OR TERRITORIES
.. Korea (Democratic People's Rep. of) 76.6 80.5 67.1 15.4 4.8 11.7 .. .. 77.0 ..
.. Monaco .. .. .. .. .. .. .. .. .. ..
.. Nauru .. .. .. .. .. .. .. .. .. 56.5
.. San Marino .. .. .. .. .. .. .. .. .. ..
.. Somalia 43.4 46.1 86.2 6.2 6.0 11.0 .. .. 71.3 ..
.. Tuvalu .. .. .. .. .. .. .. .. .. 19.5 g
Human development groupsVery high human development 57.3 60.7 4.1 72.7 5.8 14.5 12.6 .. .. 95.7High human development 61.3 65.2 17.5 56.7 6.3 15.3 .. .. 8.6 85.5Medium human development 55.4 58.1 39.5 38.6 4.7 12.7 26.0 .. 37.1 27.0Low human development 62.7 66.9 60.7 28.8 6.7 12.2 .. 30.8 68.4 9.4
Developing countries 59.0 62.4 31.7 46.0 5.7 13.6 .. .. 27.6 59.1Regions
Arab States 43.7 48.6 23.4 49.9 10.6 27.5 .. .. 24.7 36.2East Asia and the Pacific 66.0 68.8 22.7 52.3 4.2 10.5 .. .. 13.8 87.0Europe and Central Asia 52.1 57.4 21.1 52.4 9.5 18.7 21.5 .. 4.1 66.2Latin America and the Caribbean 59.0 64.3 14.3 64.3 8.2 18.5 21.6 6.9 8.8 58.6South Asia 51.9 54.1 42.2 34.6 4.1 11.1 28.0 .. 42.7 23.6Sub-Saharan Africa 64.5 69.5 57.2 31.8 7.7 13.6 .. 31.2 61.6 21.1
Least developed countries 64.8 68.4 60.2 27.2 5.5 10.9 .. .. 64.2 18.6Small island developing states 58.7 63.0 24.5 60.8 6.7 17.1 .. .. 22.6 25.9
Organisation for Economic Co‑operation and Development 56.2 59.7 4.7 72.6 6.0 13.0 14.2 .. .. 92.3
World 58.6 62.0 26.5 51.1 5.7 13.6 21.7 .. 26.5 71.5
NOTES
a Estimates modelled by the International Labour Organization.
b Because statutory pension ages differ by country, cross-country comparisons should be made with caution.
c Data refer to the most recent year available during the period specified.
d Refers to 2004.
e Refers to 2002.
f Refers to 2001.
g Refers to 2005.
DEFINITIONS
Employment to population ratio: Percentage of the population ages 15 years and older that is employed.
Labour force participation rate: Percentage of a country’s working-age population that engages actively in the labour market, either by working or looking for work. It provides an indication of the relative size of the supply of labour available to engage in the production of goods and services.
Employment in agriculture: Share of total employment that is employed in agriculture.
Employment in services: Share of total employment that is employed in services.
Total unemployment rate: Percentage of the labour force population ages 15 and older that is not in paid employment or self-employed but is available for work and has taken steps to seek paid employment or self-employment.
Youth unemployment rate: Percentage of the labour force population ages 15–24 that is
not in paid employment or self-employed but is available for work and has taken steps to seek paid employment or self-employment.
Youth not in school or employment: Percentage of people ages 15–24 who are not in employment or in education or training.
Child labour: Percentage of children ages 5–11 who, during the reference week, engaged in at least one hour of economic activity or at least 28 hours of household chores; children ages 12–14 who, during the reference week, engaged in at least 14 hours of economic activity or at least 28 hours of household chores; children ages 15–17 who, during the reference week, engaged in at least 43 hours of economic activity or household chores; or children ages 5–17 who, during the reference week, engaged in hazardous working conditions.
Working poor at PPP$3.10 a day: Proportion of employed people who live on less than $3.10 (in purchasing power parity terms) a day, expressed as a percentage of the total employed population ages 15 and older.
Old‑age pension recipients: Proportion of people older than the statutory pensionable age receiving an old-age pension (contributory, noncontributory or both), expressed as a percentage of the eligible population.
MAIN DATA SOURCES
Columns 1–7 and 9: ILO (2018a).
Column 8: United Nations Statistics Division (2018a).
Column 10: ILO (2018b).
HUMAN DEVELOPMENT INDICES AND INDICATORS: 2018 STATISTICAL UPDATE
TABLE 11 Work and employment | 63
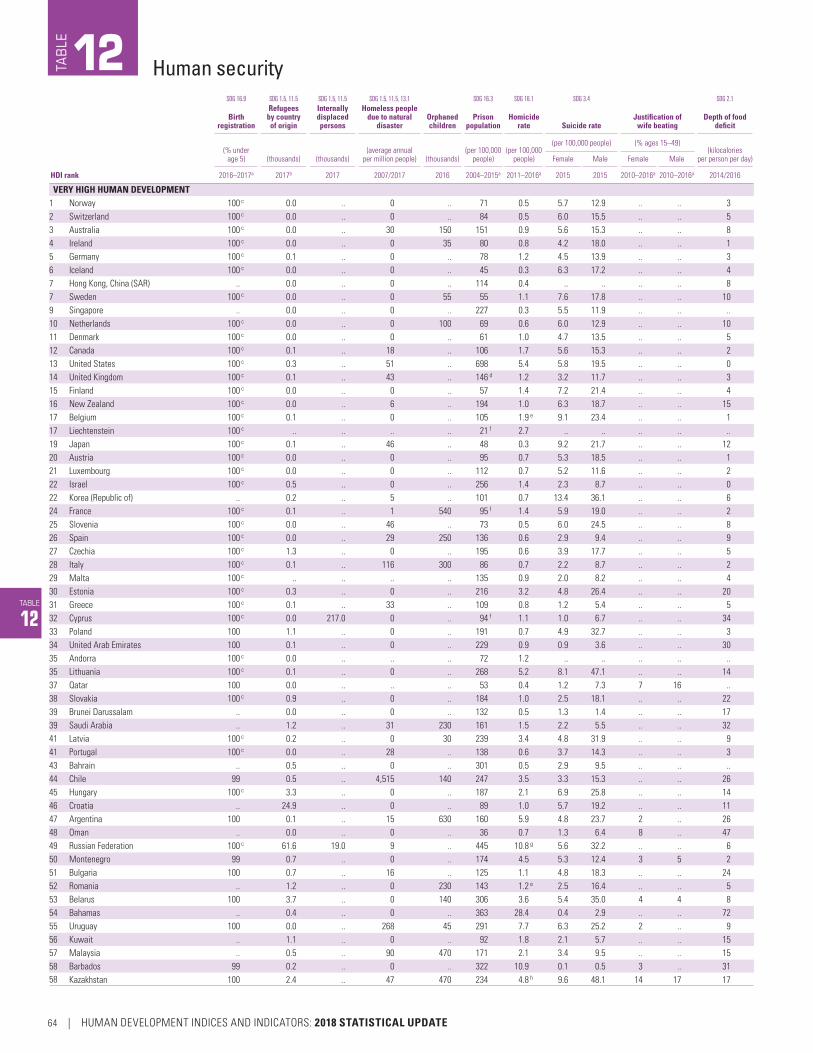
TABLE
12
SDG 16.9 SDG 1.5, 11.5 SDG 1.5, 11.5 SDG 1.5, 11.5, 13.1 SDG 16.3 SDG 16.1 SDG 3.4 SDG 2.1
Birth registration
Refugees by country of origin
Internally displaced persons
Homeless people due to natural
disasterOrphaned children
Prison population
Homicide rate Suicide rate
Justification of wife beating
Depth of food deficit
(% under age 5) (thousands) (thousands)
(average annual per million people) (thousands)
(per 100,000 people)
(per 100,000 people)
(per 100,000 people) (% ages 15–49)(kilocalories
per person per day)Female Male Female Male
HDI rank 2016–2017a 2017b 2017 2007/2017 2016 2004–2015a 2011–2016a 2015 2015 2010–2016a 2010–2016a 2014/2016
VERY HIGH HUMAN DEVELOPMENT1 Norway 100 c 0.0 .. 0 .. 71 0.5 5.7 12.9 .. .. 32 Switzerland 100 c 0.0 .. 0 .. 84 0.5 6.0 15.5 .. .. 53 Australia 100 c 0.0 .. 30 150 151 0.9 5.6 15.3 .. .. 84 Ireland 100 c 0.0 .. 0 35 80 0.8 4.2 18.0 .. .. 15 Germany 100 c 0.1 .. 0 .. 78 1.2 4.5 13.9 .. .. 36 Iceland 100 c 0.0 .. 0 .. 45 0.3 6.3 17.2 .. .. 47 Hong Kong, China (SAR) .. 0.0 .. 0 .. 114 0.4 .. .. .. .. 87 Sweden 100 c 0.0 .. 0 55 55 1.1 7.6 17.8 .. .. 109 Singapore .. 0.0 .. 0 .. 227 0.3 5.5 11.9 .. .. ..10 Netherlands 100 c 0.0 .. 0 100 69 0.6 6.0 12.9 .. .. 1011 Denmark 100 c 0.0 .. 0 .. 61 1.0 4.7 13.5 .. .. 512 Canada 100 c 0.1 .. 18 .. 106 1.7 5.6 15.3 .. .. 213 United States 100 c 0.3 .. 51 .. 698 5.4 5.8 19.5 .. .. 014 United Kingdom 100 c 0.1 .. 43 .. 146 d 1.2 3.2 11.7 .. .. 315 Finland 100 c 0.0 .. 0 .. 57 1.4 7.2 21.4 .. .. 416 New Zealand 100 c 0.0 .. 6 .. 194 1.0 6.3 18.7 .. .. 1517 Belgium 100 c 0.1 .. 0 .. 105 1.9 e 9.1 23.4 .. .. 117 Liechtenstein 100 c .. .. .. .. 21 f 2.7 .. .. .. .. ..19 Japan 100 c 0.1 .. 46 .. 48 0.3 9.2 21.7 .. .. 1220 Austria 100 c 0.0 .. 0 .. 95 0.7 5.3 18.5 .. .. 121 Luxembourg 100 c 0.0 .. 0 .. 112 0.7 5.2 11.6 .. .. 222 Israel 100 c 0.5 .. 0 .. 256 1.4 2.3 8.7 .. .. 022 Korea (Republic of) .. 0.2 .. 5 .. 101 0.7 13.4 36.1 .. .. 624 France 100 c 0.1 .. 1 540 95 f 1.4 5.9 19.0 .. .. 225 Slovenia 100 c 0.0 .. 46 .. 73 0.5 6.0 24.5 .. .. 826 Spain 100 c 0.0 .. 29 250 136 0.6 2.9 9.4 .. .. 927 Czechia 100 c 1.3 .. 0 .. 195 0.6 3.9 17.7 .. .. 528 Italy 100 c 0.1 .. 116 300 86 0.7 2.2 8.7 .. .. 229 Malta 100 c .. .. .. .. 135 0.9 2.0 8.2 .. .. 430 Estonia 100 c 0.3 .. 0 .. 216 3.2 4.8 26.4 .. .. 2031 Greece 100 c 0.1 .. 33 .. 109 0.8 1.2 5.4 .. .. 532 Cyprus 100 c 0.0 217.0 0 .. 94 f 1.1 1.0 6.7 .. .. 3433 Poland 100 1.1 .. 0 .. 191 0.7 4.9 32.7 .. .. 334 United Arab Emirates 100 0.1 .. 0 .. 229 0.9 0.9 3.6 .. .. 3035 Andorra 100 c 0.0 .. .. .. 72 1.2 .. .. .. .. ..35 Lithuania 100 c 0.1 .. 0 .. 268 5.2 8.1 47.1 .. .. 1437 Qatar 100 0.0 .. .. .. 53 0.4 1.2 7.3 7 16 ..38 Slovakia 100 c 0.9 .. 0 .. 184 1.0 2.5 18.1 .. .. 2239 Brunei Darussalam .. 0.0 .. 0 .. 132 0.5 1.3 1.4 .. .. 1739 Saudi Arabia .. 1.2 .. 31 230 161 1.5 2.2 5.5 .. .. 3241 Latvia 100 c 0.2 .. 0 30 239 3.4 4.8 31.9 .. .. 941 Portugal 100 c 0.0 .. 28 .. 138 0.6 3.7 14.3 .. .. 343 Bahrain .. 0.5 .. 0 .. 301 0.5 2.9 9.5 .. .. ..44 Chile 99 0.5 .. 4,515 140 247 3.5 3.3 15.3 .. .. 2645 Hungary 100 c 3.3 .. 0 .. 187 2.1 6.9 25.8 .. .. 1446 Croatia .. 24.9 .. 0 .. 89 1.0 5.7 19.2 .. .. 1147 Argentina 100 0.1 .. 15 630 160 5.9 4.8 23.7 2 .. 2648 Oman .. 0.0 .. 0 .. 36 0.7 1.3 6.4 8 .. 4749 Russian Federation 100 c 61.6 19.0 9 .. 445 10.8 g 5.6 32.2 .. .. 650 Montenegro 99 0.7 .. 0 .. 174 4.5 5.3 12.4 3 5 251 Bulgaria 100 0.7 .. 16 .. 125 1.1 4.8 18.3 .. .. 2452 Romania .. 1.2 .. 0 230 143 1.2 e 2.5 16.4 .. .. 553 Belarus 100 3.7 .. 0 140 306 3.6 5.4 35.0 4 4 854 Bahamas .. 0.4 .. 0 .. 363 28.4 0.4 2.9 .. .. 7255 Uruguay 100 0.0 .. 268 45 291 7.7 6.3 25.2 2 .. 956 Kuwait .. 1.1 .. 0 .. 92 1.8 2.1 5.7 .. .. 1557 Malaysia .. 0.5 .. 90 470 171 2.1 3.4 9.5 .. .. 1558 Barbados 99 0.2 .. 0 .. 322 10.9 0.1 0.5 3 .. 3158 Kazakhstan 100 2.4 .. 47 470 234 4.8 h 9.6 48.1 14 17 17
Human security12TAB
LE
64 | HUMAN DEVELOPMENT INDICES AND INDICATORS: 2018 STATISTICAL UPDATE

TABLE
12
SDG 16.9 SDG 1.5, 11.5 SDG 1.5, 11.5 SDG 1.5, 11.5, 13.1 SDG 16.3 SDG 16.1 SDG 3.4 SDG 2.1
Birth registration
Refugees by country of origin
Internally displaced persons
Homeless people due to natural
disasterOrphaned children
Prison population
Homicide rate Suicide rate
Justification of wife beating
Depth of food deficit
(% under age 5) (thousands) (thousands)
(average annual per million people) (thousands)
(per 100,000 people)
(per 100,000 people)
(per 100,000 people) (% ages 15–49)(kilocalories
per person per day)Female Male Female Male
HDI rank 2016–2017a 2017b 2017 2007/2017 2016 2004–2015a 2011–2016a 2015 2015 2010–2016a 2010–2016a 2014/2016
HIGH HUMAN DEVELOPMENT60 Iran (Islamic Republic of) 99 118.3 .. 27 740 287 2.5 2.9 4.2 .. .. 3960 Palau .. 0.0 .. 5,457 .. 343 3.1 .. .. .. .. ..62 Seychelles .. 0.0 .. 0 .. 799 12.7 1.9 15.7 .. .. ..63 Costa Rica 100 0.2 .. 0 44 352 11.9 2.0 12.6 4 .. 3964 Turkey 99 61.4 1,113.0 41 .. 220 4.3 4.7 12.6 13 .. 165 Mauritius .. 0.1 .. 0 .. 155 1.8 3.7 14.0 .. .. 3866 Panama 96 0.0 .. 0 .. 392 9.7 1.1 10.1 6 .. 6467 Serbia 99 35.0 .. 15 .. 148 1.4 5.5 19.5 4 7 i 4068 Albania 99 12.2 .. 7 .. 189 2.7 2.4 5.3 30 j 36 j 3869 Trinidad and Tobago 94 0.3 .. 0 25 258 30.9 4.5 22.4 8 j .. 3570 Antigua and Barbuda .. 0.1 .. 1,316 .. 373 10.3 0.0 0.0 .. .. 20970 Georgia 100 6.5 289.0 132 52 274 f 1.0 1.5 9.7 7 j .. 5272 Saint Kitts and Nevis .. 0.1 .. 0 .. 607 34.2 .. .. .. .. ..73 Cuba 100 5.3 .. 1,299 87 510 5.0 4.2 17.0 4 i 7 i 574 Mexico 95 11.7 345.0 60 1,600 212 19.3 2.1 8.1 5 .. 2975 Grenada .. 0.1 .. 0 .. 398 10.2 0.5 0.0 .. .. 20476 Sri Lanka 97 115.6 42.0 5,321 .. 92 2.5 h 13.3 58.8 53 i,j .. 19577 Bosnia and Herzegovina 100 17.7 99.0 0 .. 73 d 1.3 1.9 7.1 5 6 1478 Venezuela (Bolivarian Republic of) 81 9.3 .. 6 520 178 56.3 1.1 5.4 .. .. 8879 Brazil 96 0.9 .. 76 3,200 301 29.5 2.7 9.6 .. .. 1480 Azerbaijan 94 10.3 393.0 68 140 236 2.1 1.1 5.3 28 58 j 880 Lebanon 100 5.3 11.0 0 .. 120 4.0 2.0 4.0 10 i,j .. 3980 The former Yugoslav Republic of Macedonia 100 1.7 0.1 0 .. 147 1.6 3.1 9.9 15 .. 2883 Armenia 99 10.8 8.4 k 0 .. 130 3.0 1.8 8.0 10 23 3183 Thailand 100 0.2 41.0 24 830 461 3.2 7.7 18.2 9 9 6985 Algeria 100 4.0 2.5 k 6 470 162 1.4 1.3 5.0 59 i .. 3286 China .. 207.7 .. 150 .. 119 f 0.6 9.5 7.7 .. .. 7686 Ecuador 94 1.3 .. 86 260 162 5.9 3.7 11.5 .. .. 8088 Ukraine 100 139.3 800.0 7 820 195 f 6.3 6.2 28.7 3 9 1889 Peru 98 2.6 59.0 187 490 242 7.7 2.9 9.2 .. .. 5290 Colombia 97 76.7 6,509.0 31 760 244 25.5 2.1 10.1 .. .. 5090 Saint Lucia 92 1.0 .. 0 .. 349 19.3 1.6 12.0 7 .. 13192 Fiji .. 0.7 .. 0 .. 174 2.3 4.3 13.5 .. .. 3192 Mongolia 99 2.2 .. 0 .. 266 5.7 9.2 48.2 10 9 i 14194 Dominican Republic 88 0.4 .. 125 250 233 15.2 2.6 12.2 2 8 j 9695 Jordan 99 2.1 .. 0 .. 150 1.5 2.4 5.3 70 i .. 2895 Tunisia 99 1.8 .. 0 .. 212 3.0 4.1 6.7 30 .. 3797 Jamaica 100 2.2 .. 38 45 145 47.0 0.3 2.6 5 .. 6198 Tonga 93 0.0 .. 0 .. 166 1.0 3.3 5.1 29 21 ..99 Saint Vincent and the Grenadines .. 1.3 .. 499 .. 378 36.5 0.4 4.9 .. .. 43100 Suriname 99 0.0 .. 0 13 183 .. 12.6 41.6 13 .. 55101 Botswana 83 0.3 .. 0 110 188 .. 6.2 19.5 .. .. 192101 Maldives 93 0.1 .. 0 .. 341 0.8 8.9 13.1 31 i,j 14 i,j 58103 Dominica .. 0.0 .. 844 .. 300 8.4 .. .. .. .. 42104 Samoa 59 0.0 .. 0 .. 250 3.1 2.8 11.4 37 30 20105 Uzbekistan 100 3.4 .. 0 .. 150 .. 5.2 13.6 70 j 61 j 43106 Belize 96 0.1 .. 0 7 449 37.6 2.0 14.7 5 5 40106 Marshall Islands 96 0.0 .. 0 .. 66 .. .. .. 56 j 58 j ..108 Libya .. 11.2 197.0 0 .. 99 2.5 2.8 9.2 .. .. ..108 Turkmenistan 100 0.4 .. 0 .. 583 .. 5.2 15.8 26 .. 37110 Gabon 90 0.2 .. 41 74 210 8.0 7.0 18.1 50 40 47110 Paraguay 93 0.1 .. 28 120 158 9.3 6.1 13.7 .. .. 85112 Moldova (Republic of) 100 2.3 .. 0 68 215 f 3.2 3.9 22.3 11 13 62MEDIUM HUMAN DEVELOPMENT
113 Philippines 90 0.4 445.0 138 2,900 121 11.0 h 1.9 5.8 13 .. 96113 South Africa 85 0.5 .. 25 3,000 292 34.0 5.1 20.7 .. .. 32115 Egypt 99 22.1 82.0 1 1,700 76 2.5 1.8 4.5 36 i .. 32116 Indonesia 73 7.0 13.0 32 5,300 64 0.5 1.6 4.5 35 18 i 53116 Viet Nam 96 334.1 .. 480 1,300 154 1.5 3.4 11.3 28 .. 80
HUMAN DEVELOPMENT INDICES AND INDICATORS: 2018 STATISTICAL UPDATE
TABLE 12 Human security | 65
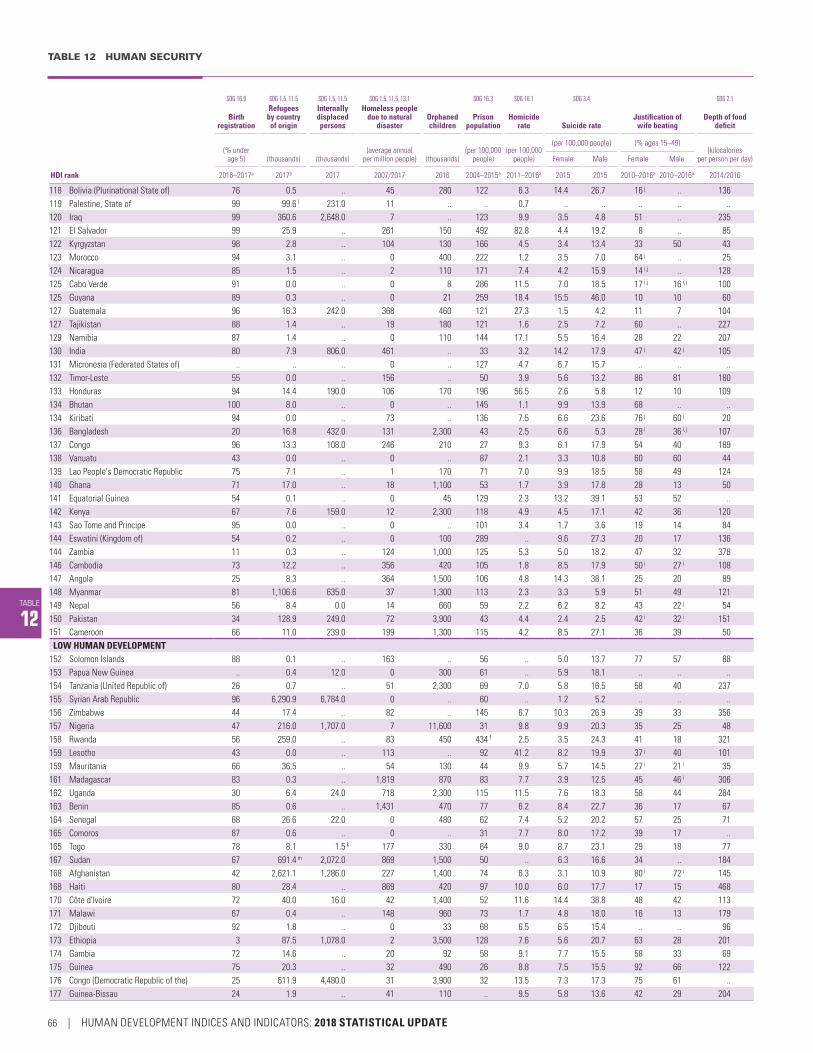
TABLE 12 HUMAN SECURITY
TABLE
12
SDG 16.9 SDG 1.5, 11.5 SDG 1.5, 11.5 SDG 1.5, 11.5, 13.1 SDG 16.3 SDG 16.1 SDG 3.4 SDG 2.1
Birth registration
Refugees by country of origin
Internally displaced persons
Homeless people due to natural
disasterOrphaned children
Prison population
Homicide rate Suicide rate
Justification of wife beating
Depth of food deficit
(% under age 5) (thousands) (thousands)
(average annual per million people) (thousands)
(per 100,000 people)
(per 100,000 people)
(per 100,000 people) (% ages 15–49)(kilocalories
per person per day)Female Male Female Male
HDI rank 2016–2017a 2017b 2017 2007/2017 2016 2004–2015a 2011–2016a 2015 2015 2010–2016a 2010–2016a 2014/2016
118 Bolivia (Plurinational State of) 76 0.5 .. 45 280 122 6.3 14.4 26.7 16 j .. 136119 Palestine, State of 99 99.6 l 231.0 11 .. .. 0.7 .. .. .. .. ..120 Iraq 99 360.6 2,648.0 7 .. 123 9.9 3.5 4.8 51 .. 235121 El Salvador 99 25.9 .. 261 150 492 82.8 4.4 19.2 8 .. 85122 Kyrgyzstan 98 2.8 .. 104 130 166 4.5 3.4 13.4 33 50 43123 Morocco 94 3.1 .. 0 400 222 1.2 3.5 7.0 64 j .. 25124 Nicaragua 85 1.5 .. 2 110 171 7.4 4.2 15.9 14 i,j .. 128125 Cabo Verde 91 0.0 .. 0 8 286 11.5 7.0 18.5 17 i,j 16 i,j 100125 Guyana 89 0.3 .. 0 21 259 18.4 15.5 46.0 10 10 60127 Guatemala 96 16.3 242.0 368 460 121 27.3 1.5 4.2 11 7 104127 Tajikistan 88 1.4 .. 19 180 121 1.6 2.5 7.2 60 .. 227129 Namibia 87 1.4 .. 0 110 144 17.1 5.5 16.4 28 22 207130 India 80 7.9 806.0 461 .. 33 3.2 14.2 17.9 47 j 42 j 105131 Micronesia (Federated States of) .. .. .. 0 .. 127 4.7 6.7 15.7 .. .. ..132 Timor-Leste 55 0.0 .. 156 .. 50 3.9 5.6 13.2 86 81 180133 Honduras 94 14.4 190.0 106 170 196 56.5 2.6 5.8 12 10 109134 Bhutan 100 8.0 .. 0 .. 145 1.1 9.9 13.9 68 .. ..134 Kiribati 94 0.0 .. 73 .. 136 7.5 6.6 23.6 76 j 60 j 20136 Bangladesh 20 16.8 432.0 131 2,300 43 2.5 6.6 5.3 28 i 36 i,j 107137 Congo 96 13.3 108.0 246 210 27 9.3 6.1 17.9 54 40 189138 Vanuatu 43 0.0 .. 0 .. 87 2.1 3.3 10.8 60 60 44139 Lao People's Democratic Republic 75 7.1 .. 1 170 71 7.0 9.9 18.5 58 49 124140 Ghana 71 17.0 .. 18 1,100 53 1.7 3.9 17.8 28 13 50141 Equatorial Guinea 54 0.1 .. 0 45 129 2.3 13.2 39.1 53 52 ..142 Kenya 67 7.6 159.0 12 2,300 118 4.9 4.5 17.1 42 36 120143 Sao Tome and Principe 95 0.0 .. 0 .. 101 3.4 1.7 3.6 19 14 84144 Eswatini (Kingdom of) 54 0.2 .. 0 100 289 .. 9.6 27.3 20 17 136144 Zambia 11 0.3 .. 124 1,000 125 5.3 5.0 18.2 47 32 378146 Cambodia 73 12.2 .. 356 420 105 1.8 8.5 17.9 50 i 27 i 108147 Angola 25 8.3 .. 364 1,500 106 4.8 14.3 38.1 25 20 89148 Myanmar 81 1,106.6 635.0 37 1,300 113 2.3 3.3 5.9 51 49 121149 Nepal 56 8.4 0.0 14 660 59 2.2 6.2 8.2 43 22 j 54150 Pakistan 34 128.9 249.0 72 3,900 43 4.4 2.4 2.5 42 i 32 i 151151 Cameroon 66 11.0 239.0 199 1,300 115 4.2 8.5 27.1 36 39 50LOW HUMAN DEVELOPMENT
152 Solomon Islands 88 0.1 .. 163 .. 56 .. 5.0 13.7 77 57 88153 Papua New Guinea .. 0.4 12.0 0 300 61 .. 5.9 18.1 .. .. ..154 Tanzania (United Republic of) 26 0.7 .. 51 2,300 69 7.0 5.8 16.5 58 40 237155 Syrian Arab Republic 96 6,290.9 6,784.0 0 .. 60 .. 1.2 5.2 .. .. ..156 Zimbabwe 44 17.4 .. 82 .. 145 6.7 10.3 26.9 39 33 356157 Nigeria 47 216.0 1,707.0 7 11,600 31 9.8 9.9 20.3 35 25 48158 Rwanda 56 259.0 .. 83 450 434 f 2.5 3.5 24.3 41 18 321159 Lesotho 43 0.0 .. 113 .. 92 41.2 8.2 19.9 37 j 40 101159 Mauritania 66 36.5 .. 54 130 44 9.9 5.7 14.5 27 i 21 i 35161 Madagascar 83 0.3 .. 1,819 870 83 7.7 3.9 12.5 45 46 i 306162 Uganda 30 6.4 24.0 718 2,300 115 11.5 7.6 18.3 58 44 284163 Benin 85 0.6 .. 1,431 470 77 6.2 8.4 22.7 36 17 67164 Senegal 68 26.6 22.0 0 480 62 7.4 5.2 20.2 57 25 71165 Comoros 87 0.6 .. 0 .. 31 7.7 8.0 17.2 39 17 ..165 Togo 78 8.1 1.5 k 177 330 64 9.0 8.7 23.1 29 18 77167 Sudan 67 691.4 m 2,072.0 869 1,500 50 .. 6.3 16.6 34 .. 184168 Afghanistan 42 2,621.1 1,286.0 227 1,400 74 6.3 3.1 10.9 80 i 72 i 145168 Haiti 80 28.4 .. 869 420 97 10.0 6.0 17.7 17 15 468170 Côte d'Ivoire 72 40.0 16.0 42 1,400 52 11.6 14.4 38.8 48 42 113171 Malawi 67 0.4 .. 148 960 73 1.7 4.8 18.0 16 13 179172 Djibouti 92 1.8 .. 0 33 68 6.5 6.5 15.4 .. .. 96173 Ethiopia 3 87.5 1,078.0 2 3,500 128 7.6 5.6 20.7 63 28 201174 Gambia 72 14.6 .. 20 92 58 9.1 7.7 15.5 58 33 69175 Guinea 75 20.3 .. 32 490 26 8.8 7.5 15.5 92 66 122176 Congo (Democratic Republic of the) 25 611.9 4,480.0 31 3,900 32 13.5 7.3 17.3 75 61 ..177 Guinea-Bissau 24 1.9 .. 41 110 .. 9.5 5.8 13.6 42 29 204
66 | HUMAN DEVELOPMENT INDICES AND INDICATORS: 2018 STATISTICAL UPDATE

TABLE
12
SDG 16.9 SDG 1.5, 11.5 SDG 1.5, 11.5 SDG 1.5, 11.5, 13.1 SDG 16.3 SDG 16.1 SDG 3.4 SDG 2.1
Birth registration
Refugees by country of origin
Internally displaced persons
Homeless people due to natural
disasterOrphaned children
Prison population
Homicide rate Suicide rate
Justification of wife beating
Depth of food deficit
(% under age 5) (thousands) (thousands)
(average annual per million people) (thousands)
(per 100,000 people)
(per 100,000 people)
(per 100,000 people) (% ages 15–49)(kilocalories
per person per day)Female Male Female Male
HDI rank 2016–2017a 2017b 2017 2007/2017 2016 2004–2015a 2011–2016a 2015 2015 2010–2016a 2010–2016a 2014/2016
178 Yemen 31 23.6 2,014.0 4 880 53 6.7 6.2 12.6 49 .. 201179 Eritrea .. 464.1 .. 0 150 .. 8.0 5.4 23.4 51 45 ..180 Mozambique 48 0.1 10.0 245 2,400 61 3.4 6.7 20.5 23 20 192181 Liberia 25 6.0 .. 84 210 39 3.2 4.9 16.1 43 24 366182 Mali 87 150.3 38.0 276 700 33 10.9 6.7 14.5 73 51 24183 Burkina Faso 77 2.7 4.9 330 660 34 0.4 10.1 25.1 44 34 159184 Sierra Leone 77 4.5 .. 30 310 55 1.7 14.7 29.7 63 34 228185 Burundi 75 439.3 57.0 396 610 93 6.0 6.3 20.3 73 44 ..186 Chad 12 16.3 158.0 87 810 39 9.0 7.9 20.9 74 51 246187 South Sudan 35 2,439.8 n 1,899.0 0 660 65 13.9 5.4 14.3 79 .. ..188 Central African Republic 61 545.5 689.0 433 320 16 19.8 9.3 30.3 80 75 490189 Niger 64 1.4 144.0 192 910 39 4.4 5.5 11.5 60 27 67OTHER COUNTRIES OR TERRITORIES
.. Korea (Democratic People's Rep. of) 100 1.2 .. 929 .. .. 4.4 o 14.3 17.3 .. .. 336
.. Monaco 100 c 0.0 .. .. .. 74 f .. .. .. .. .. ..
.. Nauru 83 .. .. .. .. 140 .. .. .. .. .. ..
.. San Marino 100 c 0.0 .. .. .. .. .. .. .. .. .. ..
.. Somalia 3 986.4 825.0 158 640 .. 4.3 4.8 12.7 76 i,j .. ..
.. Tuvalu 50 0.0 .. 0 .. 110 18.6 .. .. 70 j 73 j ..Human development groups
Very high human development 100 109.0 p 236.0 p 87 .. 284 3.2 5.6 19.5 .. .. 7High human development .. 884.7 p 9,909.0 p 160 .. 174 6.4 7.1 9.3 .. .. 61Medium human development 72 2,245.6 p 6,479.0 p 279 .. 66 4.5 8.8 13.2 41 37 100Low human development 45 15,076.7 p 22,496.4 p 208 3,987 68 8.5 7.2 18.8 51 36 163
Developing countries 68 19,206.1 p 39,709.4 p 232 .. 111 5.7 7.8 12.6 40 .. 92Regions
Arab States 83 8,507.1 p 14,866.5 p 97 .. 116 3.3 3.1 7.1 46 .. 83East Asia and the Pacific .. 1,680.4 p 1,146.0 p 151 .. 125 1.4 7.6 8.0 .. .. 78Europe and Central Asia 98 311.9 p 2,702.5 p 27 .. 209 4.2 5.1 18.8 22 .. 26Latin America and the Caribbean 94 202.1 p 7,345.0 p 237 1,497 244 23.1 3.0 11.1 .. .. 47South Asia 67 3,025.1 p 2,815.0 p 415 .. 48 3.3 11.4 14.8 45 41 108Sub-Saharan Africa 46 5,479.4 p 10,834.4 p 161 3,877 88 9.5 7.4 20.4 49 34 142
Least developed countries 40 10,665.9 p 15,869.4 p 234 1,835 75 6.3 6.4 15.3 49 38 169Small island developing states 82 44.0 p 12.0 p 465 .. 226 12.6 4.6 15.7 13 14 157
Organisation for Economic Co‑operation and Development 99 82.5 p 1,458.0 p 99 .. 273 4.1 5.4 17.0 .. .. 7
World 71 19,303.6 p 39,945.4 p 198 .. 143 5.3 7.4 13.8 .. .. 77
NOTESa Data refer to the most recent year available
during the period specified.b Data refer to people recognized as refugees under
the 1951 UN Convention, the 1967 UN Protocol and the 1969 Organization of African Unity Convention. In the absence of government figures, the Office of the UN High Commissioner for Refugees (UNHCR) has estimated the refugee population in many industrialized countries based on 10 years of individual asylum-seeker recognition.
c Estimates of 100 percent are assumed given the completeness of the civil registration system, which registers all vital events (including births).
d HDRO calculations based on data from ICPR (2016).e Refers to offences of intentional homicide.f For more detailed country notes, see www.
prisonstudies.org.g Data are from the Prosecutor-General of the
Russian Federation and include victims of attempted homicide.
h Changes in definitions and/or counting rules are reported by the Member State to indicate a break in the time series.
i Differs from standard definition or refers to only part of the country.
j Refers to years or periods other than those specified.
k Refers to 2016.l Refers to Palestinian refugees under the UNHCR
mandate only. Another 5,340,443 Palestinian refugees are under the responsibility of United Nations Relief and Works Agency for Palestinian Refugees in the Near East (UNRWA 2017).
m May include citizens of South Sudan.n An unknown number of refugees and asylum-
seekers from South Sudan may be included under data for Sudan.
o WHO estimate used because other data were unavailable. The Government of the Democratic People’s Republic of Korea does not agree with this estimate.
p Unweighted sum of national estimates.
DEFINITIONS
Birth registration: Percentage of children under age 5 who were registered at the moment of the survey. It includes children whose birth certificate was seen by the interviewer and children whose mother or caretaker says the birth has been registered.
Refugees by country of origin: Number of people who have fled their country of origin because of a well founded fear of persecution due to their race, religion, nationality, political opinion or membership in a particular social group and who cannot or do not want to return to their country of origin.
Internally displaced persons: Number of people who have been forced to leave their homes or places of habitual residence — in particular, as a result of or to avoid the effects of armed conflict, situations of generalized violence, violations of human rights or natural or human-made disasters — and who have not crossed an internationally recognized state border.
Homeless people due to natural disaster: Average annual number of people who lack a shelter for living quarters as a result of natural disasters, who carry their few possessions with them and who sleep in the streets, in doorways or on piers, or in any other space, on a more or less random basis, expressed per million people.
Orphaned children: Number of children (ages 0–17) who have lost one or both parents due to any cause.
Prison population: Number of adult and juvenile prisoners — including pretrial detainees, unless otherwise noted — expressed per 100,000 people.
Homicide rate: Number of unlawful deaths purposefully inflicted on a person by another person, expressed per 100,000 people.
Suicide rate: Number of deaths from purposely self-inflicted injuries, expressed per 100,000 people in the reference population.
Justification of wife beating: Percentage of women and men ages 15–49 who consider a husband to be justified in hitting or beating his wife for at least one of the following reasons: if his wife burns the food, argues with him, goes out without telling him, neglects the children or refuses sexual relations.
Depth of the food deficit: Number of kilocalories needed to lift the undernourished from their status, holding all other factors constant.
MAIN DATA SOURCES
Column 1: United Nations Statistics Division (2018a).
Column 2: UNHCR (2018).
Column 3: IDMC (2018).
Column 4: CRED EM-DAT (2018) and UNDESA (2017a).
Columns 5, 10 and 11: UNICEF (2018).
Column 6: ICPR (2016).
Column 7: UNODC (2018).
Columns 8 and 9: WHO (2018).
Column 12: FAO (2018a).
HUMAN DEVELOPMENT INDICES AND INDICATORS: 2018 STATISTICAL UPDATE
TABLE 12 Human security | 67

TABLE
13
SDG 17.3 SDG 17.2 SDG 17.3 SDG 8.9 SDG 17.6, 17.8 SDG 9.cTrade Financial flows Human mobility Communication
Exports and
imports
Foreign direct investment, net inflows
Private capital flows
Net official development
assistance receivedaRemittances,
inflows
Net migration
rateStock of
immigrants
International student mobility
International inbound tourists
Internet usersMobile phone subscriptionsTotal Female
(% of GDP) (% of GDP)(% of GDP) (% of GNI) (% of GDP)
(per 1,000 people)
(% of population)
(% of total tertiary
enrolment) (thousands)(% of
population)(% of female population)
(per 100 people) (% change)
HDI rank 2017b 2017b 2017b 2016c 2017b 2010/2015d 2017 2017b 2016c 2016 2017b 2016 2010–2016
VERY HIGH HUMAN DEVELOPMENT1 Norway 68.5 –1.2 6.5 .. 0.15 8.8 e 15.1 e –2.9 5,960 97.3 97.4 109.0 –4.92 Switzerland 118.9 5.6 –4.8 .. 0.37 9.8 29.6 13.2 9,205 89.1 86.1 133.8 8.73 Australia 41.9 3.7 –3.6 .. 0.15 8.0 f 28.8 f 16.8 8,263 88.2 84.9 110.1 8.24 Ireland 207.9 15.4 –30.5 .. 0.19 –6.0 16.9 1.2 10,100 85.0 86.0 103.2 1.55 Germany 86.9 2.1 7.5 .. 0.46 4.4 14.8 3.8 35,555 89.6 81.2 126.3 15.66 Iceland 89.8 –29.4 10.8 .. 0.88 –1.3 12.5 –6.3 1,792 98.2 98.0 120.8 13.47 Hong Kong, China (SAR) 375.1 35.8 –17.8 .. 0.13 2.1 39.1 –1.7 26,553 87.5 86.3 240.8 22.67 Sweden 86.4 5.4 0.4 .. 0.55 5.3 17.6 2.2 6,782 89.7 89.0 127.5 8.99 Singapore 322.4 19.6 –1.4 .. .. 12.7 46.0 10.2 12,914 81.0 83.6 150.5 3.4
10 Netherlands 161.2 38.1 5.7 .. 0.18 0.7 12.1 8.9 15,828 90.4 89.2 123.0 7.011 Denmark 103.4 –0.7 4.3 .. 0.42 3.8 11.5 9.2 10,781 97.0 97.5 122.3 5.812 Canada 64.1 1.7 –1.7 .. 0.08 6.5 21.5 .. 19,824 89.8 .. 84.7 12.113 United States 26.6 1.8 –0.9 .. 0.03 2.9 15.3 4.3 75,608 76.2 74.9 122.9 33.014 United Kingdom 62.5 1.8 –0.3 .. 0.17 3.1 13.4 17.1 35,814 94.8 94.8 120.0 –1.015 Finland 76.7 4.3 1.1 .. 0.35 3.0 g 6.2 g 4.6 2,789 87.7 86.6 133.9 –14.416 New Zealand 51.3 1.6 0.0 .. 0.23 4.0 22.7 17.9 3,370 88.5 .. 124.4 15.517 Belgium 169.4 –6.3 7.5 .. 2.13 4.7 11.1 8.5 7,481 86.5 85.4 110.5 –0.617 Liechtenstein .. .. .. .. .. .. 65.1 –42.5 60 98.1 .. 117.6 19.319 Japan 31.3 0.4 2.0 .. 0.09 0.6 1.8 2.6 24,040 93.2 91.8 130.6 36.220 Austria 104.7 3.3 5.6 .. 0.72 6.3 19.0 12.3 28,121 84.3 80.7 163.8 12.521 Luxembourg 424.0 45.8 –23.8 .. 2.78 18.1 45.3 –99.9 1,054 98.1 97.3 132.7 –7.322 Israel 58.4 5.4 –3.1 .. 0.28 0.5 23.6 –0.9 2,900 79.7 78.7 129.0 5.222 Korea (Republic of) 80.8 1.1 4.7 .. 0.41 0.7 2.3 –1.6 17,242 92.8 90.9 120.7 17.824 France 62.9 2.0 0.4 .. 0.97 1.1 12.2 6.3 82,570 85.6 85.5 104.4 13.925 Slovenia 154.8 2.1 5.8 .. 0.82 1.6 11.8 –0.4 3,032 75.5 74.1 114.8 10.726 Spain 65.5 0.3 3.5 .. 0.23 –2.4 h 12.8 h 0.9 75,315 80.6 78.6 111.2 1.227 Czechia 151.7 4.3 –7.2 .. 1.66 1.1 4.1 7.4 9,321 76.5 74.8 117.7 –4.228 Italy 59.5 1.0 5.0 .. 0.51 0.9 10.0 1.7 52,372 61.3 57.2 153.0 –2.429 Malta 261.5 27.8 –22.3 .. 1.88 4.5 10.6 –0.3 1,966 77.3 77.2 123.9 13.230 Estonia 151.6 3.3 8.0 .. 1.93 –1.6 14.7 –2.7 3,147 87.2 87.4 144.6 16.631 Greece 67.5 2.0 –13.7 .. 0.15 –2.9 10.9 –0.9 24,799 69.1 67.1 112.1 4.432 Cyprus 131.6 48.6 –23.0 .. 1.67 4.0 i 16.0 i –50.2 3,187 75.9 74.4 133.4 6.833 Poland 102.8 1.2 –1.3 .. 1.31 –0.4 1.7 1.9 17,471 73.3 72.8 138.7 13.234 United Arab Emirates 172.8 2.5 .. .. .. 11.0 88.4 41.5 .. 90.6 88.9 214.7 62.535 Andorra .. .. .. .. .. .. 53.3 –198.2 2,831 97.9 .. 92.0 18.735 Lithuania 160.6 2.3 2.2 .. 2.76 –9.7 4.3 –4.2 2,296 74.4 74.7 144.6 –7.737 Qatar 89.1 0.6 –5.1 .. 0.40 56.5 65.2 18.1 2,938 94.3 91.7 142.1 15.738 Slovakia 189.2 6.2 –2.9 .. 2.26 0.4 3.4 –10.6 2,027 80.5 79.3 128.4 17.139 Brunei Darussalam 85.2 –1.3 6.4 .. .. 1.0 25.3 –30.9 219 90.0 90.0 123.7 10.539 Saudi Arabia 61.7 1.2 –1.5 .. 0.04 10.8 37.0 –0.3 18,049 73.8 92.9 148.5 –21.041 Latvia 122.3 3.8 6.5 .. 4.18 –8.1 13.2 –0.6 1,793 79.8 78.9 134.5 23.641 Portugal 85.2 4.6 0.5 .. 0.21 –2.7 8.5 1.3 11,223 70.4 69.0 111.6 –2.743 Bahrain 139.6 1.5 9.9 .. .. 6.4 48.4 –1.6 10,158 98.0 99.0 210.1 66.444 Chile 55.7 2.3 1.0 0.1 0.02 0.9 2.7 –0.4 5,641 66.0 .. 130.1 11.445 Hungary 172.4 –10.7 1.2 .. 3.33 0.6 5.2 5.1 5,302 79.3 78.4 120.8 –0.246 Croatia 100.4 3.8 –2.1 0.2 4.53 –1.5 13.4 –5.1 13,809 72.7 68.7 104.8 –8.047 Argentina 25.0 1.9 –7.1 0.0 0.09 0.1 4.9 .. 5,559 71.0 70.1 145.3 5.048 Oman 76.8 2.5 –9.0 0.0 0.06 45.2 44.7 –8.8 2,292 69.9 67.4 155.2 2.549 Russian Federation 46.7 1.8 0.2 .. 0.51 1.4 8.1 3.0 24,571 73.1 72.6 159.2 –4.150 Montenegro 106.2 11.5 –11.9 1.9 9.09 –1.0 11.3 .. 1,662 69.9 65.9 165.6 –11.751 Bulgaria 131.1 2.9 4.0 .. 3.88 –0.7 2.2 –4.7 8,252 59.8 59.1 125.8 –8.752 Romania 85.0 2.3 –3.9 .. 2.03 –3.0 1.9 –1.4 10,223 59.5 56.9 115.8 –2.853 Belarus 133.6 2.3 –4.6 0.0 2.20 1.6 11.4 –2.1 9,424 71.1 70.9 120.7 10.654 Bahamas 75.5 0.6 –0.4 .. .. 5.2 15.6 .. 1,482 80.0 .. 92.1 –22.455 Uruguay 40.0 0.0 –3.3 0.0 0.18 –1.8 2.3 .. 3,037 66.4 64.2 148.6 13.056 Kuwait 94.7 0.1 26.9 .. 0.02 38.7 75.5 .. 307 78.4 .. 133.1 0.357 Malaysia 135.9 3.0 –0.4 0.0 0.52 5.3 j 8.5 j 4.5 26,757 78.8 76.7 140.8 16.958 Barbados 80.7 5.0 0.9 0.4 2.33 1.5 12.1 3.9 632 79.5 .. 116.6 –6.958 Kazakhstan 60.3 2.8 –5.8 0.0 0.22 1.9 20.0 –12.1 6,509 74.6 73.3 142.0 20.0
Human and capital mobility13TAB
LE
68 | HUMAN DEVELOPMENT INDICES AND INDICATORS: 2018 STATISTICAL UPDATE
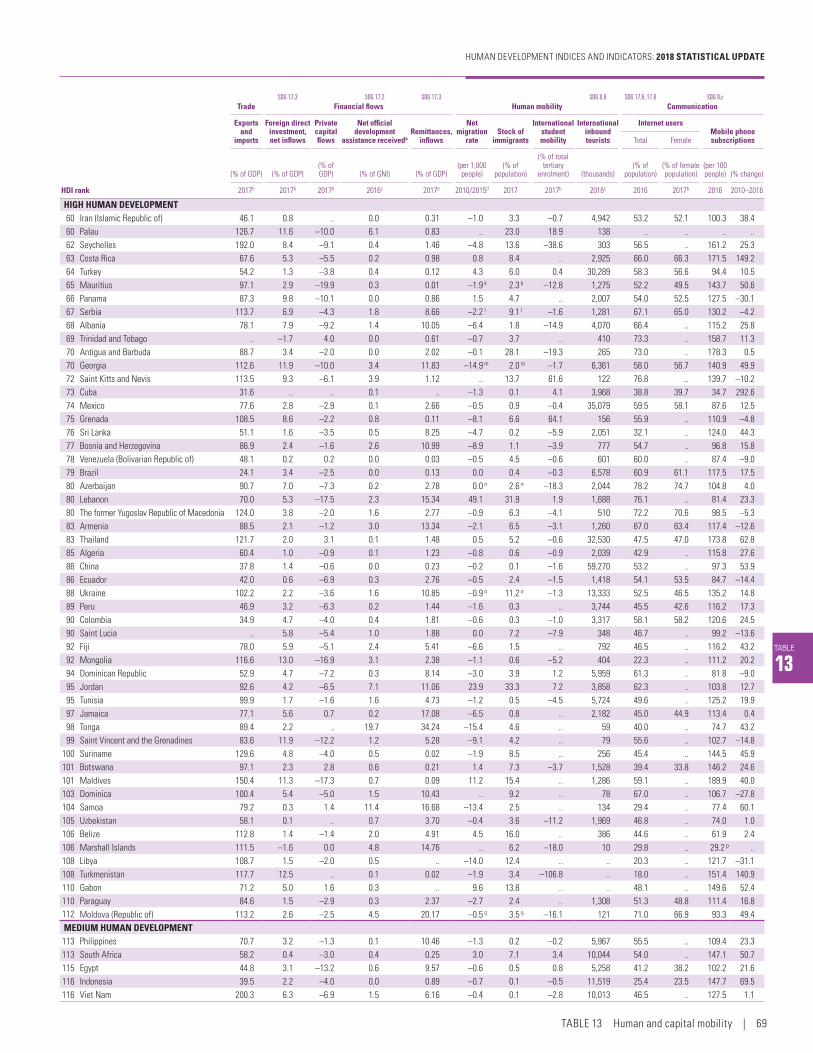
TABLE
13
SDG 17.3 SDG 17.2 SDG 17.3 SDG 8.9 SDG 17.6, 17.8 SDG 9.cTrade Financial flows Human mobility Communication
Exports and
imports
Foreign direct investment, net inflows
Private capital flows
Net official development
assistance receivedaRemittances,
inflows
Net migration
rateStock of
immigrants
International student mobility
International inbound tourists
Internet usersMobile phone subscriptionsTotal Female
(% of GDP) (% of GDP)(% of GDP) (% of GNI) (% of GDP)
(per 1,000 people)
(% of population)
(% of total tertiary
enrolment) (thousands)(% of
population)(% of female population)
(per 100 people) (% change)
HDI rank 2017b 2017b 2017b 2016c 2017b 2010/2015d 2017 2017b 2016c 2016 2017b 2016 2010–2016
HIGH HUMAN DEVELOPMENT60 Iran (Islamic Republic of) 46.1 0.8 .. 0.0 0.31 –1.0 3.3 –0.7 4,942 53.2 52.1 100.3 38.460 Palau 126.7 11.6 –10.0 6.1 0.83 .. 23.0 18.9 138 .. .. .. ..62 Seychelles 192.0 8.4 –9.1 0.4 1.46 –4.8 13.6 –38.6 303 56.5 .. 161.2 25.363 Costa Rica 67.6 5.3 –5.5 0.2 0.98 0.8 8.4 .. 2,925 66.0 66.3 171.5 149.264 Turkey 54.2 1.3 –3.8 0.4 0.12 4.3 6.0 0.4 30,289 58.3 56.6 94.4 10.565 Mauritius 97.1 2.9 –19.9 0.3 0.01 –1.9 k 2.3 k –12.8 1,275 52.2 49.5 143.7 50.666 Panama 87.3 9.8 –10.1 0.0 0.86 1.5 4.7 .. 2,007 54.0 52.5 127.5 –30.167 Serbia 113.7 6.9 –4.3 1.8 8.66 –2.2 l 9.1 l –1.6 1,281 67.1 65.0 130.2 –4.268 Albania 78.1 7.9 –9.2 1.4 10.05 –6.4 1.8 –14.9 4,070 66.4 .. 115.2 25.869 Trinidad and Tobago .. –1.7 4.0 0.0 0.61 –0.7 3.7 .. 410 73.3 .. 158.7 11.370 Antigua and Barbuda 88.7 3.4 –2.0 0.0 2.02 –0.1 28.1 –19.3 265 73.0 .. 178.3 0.570 Georgia 112.6 11.9 –10.0 3.4 11.83 –14.9 m 2.0 m –1.7 6,361 58.0 56.7 140.9 49.972 Saint Kitts and Nevis 113.5 9.3 –6.1 3.9 1.12 .. 13.7 61.6 122 76.8 .. 139.7 –10.273 Cuba 31.6 .. .. 0.1 .. –1.3 0.1 4.1 3,968 38.8 39.7 34.7 292.674 Mexico 77.6 2.8 –2.9 0.1 2.66 –0.5 0.9 –0.4 35,079 59.5 58.1 87.6 12.575 Grenada 108.5 8.6 –2.2 0.8 0.11 –8.1 6.6 64.1 156 55.9 .. 110.9 –4.876 Sri Lanka 51.1 1.6 –3.5 0.5 8.25 –4.7 0.2 –5.9 2,051 32.1 .. 124.0 44.377 Bosnia and Herzegovina 86.9 2.4 –1.6 2.6 10.99 –8.9 1.1 –3.9 777 54.7 .. 96.8 15.878 Venezuela (Bolivarian Republic of) 48.1 0.2 0.2 0.0 0.03 –0.5 4.5 –0.6 601 60.0 .. 87.4 –9.079 Brazil 24.1 3.4 –2.5 0.0 0.13 0.0 0.4 –0.3 6,578 60.9 61.1 117.5 17.580 Azerbaijan 90.7 7.0 –7.3 0.2 2.78 0.0 n 2.6 n –18.3 2,044 78.2 74.7 104.8 4.080 Lebanon 70.0 5.3 –17.5 2.3 15.34 49.1 31.9 1.9 1,688 76.1 .. 81.4 23.380 The former Yugoslav Republic of Macedonia 124.0 3.8 –2.0 1.6 2.77 –0.9 6.3 –4.1 510 72.2 70.6 98.5 –5.383 Armenia 88.5 2.1 –1.2 3.0 13.34 –2.1 6.5 –3.1 1,260 67.0 63.4 117.4 –12.683 Thailand 121.7 2.0 3.1 0.1 1.48 0.5 5.2 –0.6 32,530 47.5 47.0 173.8 62.885 Algeria 60.4 1.0 –0.9 0.1 1.23 –0.8 0.6 –0.9 2,039 42.9 .. 115.8 27.686 China 37.8 1.4 –0.6 0.0 0.23 –0.2 0.1 –1.6 59,270 53.2 .. 97.3 53.986 Ecuador 42.0 0.6 –6.9 0.3 2.76 –0.5 2.4 –1.5 1,418 54.1 53.5 84.7 –14.488 Ukraine 102.2 2.2 –3.6 1.6 10.85 –0.9 o 11.2 o –1.3 13,333 52.5 46.5 135.2 14.889 Peru 46.9 3.2 –6.3 0.2 1.44 –1.6 0.3 .. 3,744 45.5 42.6 116.2 17.390 Colombia 34.9 4.7 –4.0 0.4 1.81 –0.6 0.3 –1.0 3,317 58.1 58.2 120.6 24.590 Saint Lucia .. 5.8 –5.4 1.0 1.88 0.0 7.2 –7.9 348 46.7 .. 99.2 –13.692 Fiji 78.0 5.9 –5.1 2.4 5.41 –6.6 1.5 .. 792 46.5 .. 116.2 43.292 Mongolia 116.6 13.0 –16.9 3.1 2.38 –1.1 0.6 –5.2 404 22.3 .. 111.2 20.294 Dominican Republic 52.9 4.7 –7.2 0.3 8.14 –3.0 3.9 1.2 5,959 61.3 .. 81.8 –9.095 Jordan 92.6 4.2 –6.5 7.1 11.06 23.9 33.3 7.2 3,858 62.3 .. 103.8 12.795 Tunisia 99.9 1.7 –1.6 1.6 4.73 –1.2 0.5 –4.5 5,724 49.6 .. 125.2 19.997 Jamaica 77.1 5.6 0.7 0.2 17.08 –6.5 0.8 .. 2,182 45.0 44.9 113.4 0.498 Tonga 89.4 2.2 .. 19.7 34.24 –15.4 4.6 .. 59 40.0 .. 74.7 43.299 Saint Vincent and the Grenadines 83.6 11.9 –12.2 1.2 5.28 –9.1 4.2 .. 79 55.6 .. 102.7 –14.8
100 Suriname 129.6 4.8 –4.0 0.5 0.02 –1.9 8.5 .. 256 45.4 .. 144.5 45.9101 Botswana 97.1 2.3 2.8 0.6 0.21 1.4 7.3 –3.7 1,528 39.4 33.8 146.2 24.6101 Maldives 150.4 11.3 –17.3 0.7 0.09 11.2 15.4 .. 1,286 59.1 .. 189.9 40.0103 Dominica 100.4 5.4 –5.0 1.5 10.43 .. 9.2 .. 78 67.0 .. 106.7 –27.8104 Samoa 79.2 0.3 1.4 11.4 16.68 –13.4 2.5 .. 134 29.4 .. 77.4 60.1105 Uzbekistan 58.1 0.1 .. 0.7 3.70 –0.4 3.6 –11.2 1,969 46.8 .. 74.0 1.0106 Belize 112.8 1.4 –1.4 2.0 4.91 4.5 16.0 .. 386 44.6 .. 61.9 2.4106 Marshall Islands 111.5 –1.6 0.0 4.8 14.76 .. 6.2 –18.0 10 29.8 .. 29.2 p ..108 Libya 108.7 1.5 –2.0 0.5 .. –14.0 12.4 .. .. 20.3 .. 121.7 –31.1108 Turkmenistan 117.7 12.5 .. 0.1 0.02 –1.9 3.4 –106.8 .. 18.0 .. 151.4 140.9110 Gabon 71.2 5.0 1.6 0.3 .. 9.6 13.8 .. .. 48.1 .. 149.6 52.4110 Paraguay 84.6 1.5 –2.9 0.3 2.37 –2.7 2.4 .. 1,308 51.3 48.8 111.4 16.8112 Moldova (Republic of) 113.2 2.6 –2.5 4.5 20.17 –0.5 q 3.5 q –16.1 121 71.0 66.9 93.3 49.4MEDIUM HUMAN DEVELOPMENT113 Philippines 70.7 3.2 –1.3 0.1 10.46 –1.3 0.2 –0.2 5,967 55.5 .. 109.4 23.3113 South Africa 58.2 0.4 –3.0 0.4 0.25 3.0 7.1 3.4 10,044 54.0 .. 147.1 50.7115 Egypt 44.8 3.1 –13.2 0.6 9.57 –0.6 0.5 0.8 5,258 41.2 38.2 102.2 21.6116 Indonesia 39.5 2.2 –4.0 0.0 0.89 –0.7 0.1 –0.5 11,519 25.4 23.5 147.7 69.5116 Viet Nam 200.3 6.3 –6.9 1.5 6.16 –0.4 0.1 –2.8 10,013 46.5 .. 127.5 1.1
HUMAN DEVELOPMENT INDICES AND INDICATORS: 2018 STATISTICAL UPDATE
TABLE 13 Human and capital mobility | 69

TABLE 13 HUMAN AND CAPITAL MOBILITY
TABLE
13
SDG 17.3 SDG 17.2 SDG 17.3 SDG 8.9 SDG 17.6, 17.8 SDG 9.cTrade Financial flows Human mobility Communication
Exports and
imports
Foreign direct investment, net inflows
Private capital flows
Net official development
assistance receivedaRemittances,
inflows
Net migration
rateStock of
immigrants
International student mobility
International inbound tourists
Internet usersMobile phone subscriptionsTotal Female
(% of GDP) (% of GDP)(% of GDP) (% of GNI) (% of GDP)
(per 1,000 people)
(% of population)
(% of total tertiary
enrolment) (thousands)(% of
population)(% of female population)
(per 100 people) (% change)
HDI rank 2017b 2017b 2017b 2016c 2017b 2010/2015d 2017 2017b 2016c 2016 2017b 2016 2010–2016
118 Bolivia (Plurinational State of) 56.7 1.9 –5.4 2.1 3.48 –1.2 1.3 .. 959 39.7 32.2 92.8 28.2119 Palestine, State of 74.2 1.4 –2.0 15.7 14.78 –2.0 r 5.2 s –12.7 400 61.2 47.5 77.5 21.1120 Iraq 73.9 0.1 0.5 1.3 0.52 2.8 1.0 .. 892 21.2 .. 81.2 7.4121 El Salvador 72.5 1.3 –4.4 0.5 20.37 –7.7 0.7 –1.8 1,434 29.0 25.6 151.9 21.6122 Kyrgyzstan 102.2 1.2 –1.3 8.0 32.86 –4.9 3.3 1.5 2,930 34.5 .. 127.8 31.4123 Morocco 83.5 2.4 –1.4 2.0 6.27 –1.8 0.3 –3.0 10,332 58.3 53.5 117.7 19.3124 Nicaragua 96.7 6.5 –5.9 3.3 10.10 –4.6 0.7 .. 1,504 24.6 .. 125.9 82.4125 Cabo Verde 103.1 6.2 –3.1 7.2 11.99 –4.3 2.8 –25.8 598 50.3 49.8 111.6 50.7125 Guyana 100.8 0.9 1.2 2.0 7.49 –7.2 2.0 –16.6 235 35.7 .. 75.6 0.7127 Guatemala 45.7 1.4 –2.4 0.4 11.18 –0.6 0.5 .. 1,906 34.5 .. 110.1 –10.8127 Tajikistan 56.6 2.8 –9.8 4.1 31.56 –2.5 3.1 –6.9 414 20.5 .. 107.6 38.4129 Namibia 84.2 3.2 –1.8 1.5 0.31 –0.1 3.8 –33.7 1,469 31.0 .. 107.3 19.5130 India 40.6 1.5 –2.3 0.1 2.66 –0.4 0.4 –0.7 14,569 29.5 .. 85.2 39.4131 Micronesia (Federated States of) 99.0 0.3 –4.3 13.2 7.13 –15.8 2.6 .. 30 .. .. .. ..132 Timor-Leste 39.3 0.2 –11.7 10.0 2.95 –8.5 0.9 .. 66 25.2 .. 117.6 175.9133 Honduras 102.4 5.5 –7.8 2.0 18.81 –0.4 0.4 –1.4 880 30.0 .. 86.0 –25.9134 Bhutan 74.0 –0.4 0.4 2.5 1.72 2.6 6.5 –31.0 210 41.8 .. 87.5 61.5134 Kiribati 105.3 1.1 1.3 19.5 9.36 –4.0 2.6 .. 6 13.7 .. 45.5 340.4136 Bangladesh 35.3 0.9 –0.7 1.1 5.41 –3.2 0.9 –2.9 125 18.2 5.1 83.4 86.9137 Congo 138.6 25.6 –42.5 1.2 0.35 –2.6 7.6 –22.8 224 8.1 .. 105.8 24.8138 Vanuatu 97.9 4.2 –2.3 16.5 2.25 0.5 1.2 .. 95 24.0 .. 80.8 12.4139 Lao People's Democratic Republic 75.8 6.3 –9.0 2.6 0.74 –5.5 0.7 –4.6 3,315 21.9 .. 58.6 –8.6140 Ghana 90.6 6.9 –12.2 3.2 7.47 –0.4 1.4 0.9 897 34.7 .. 135.8 90.9141 Equatorial Guinea 94.4 0.5 .. 0.1 .. 16.9 17.5 .. .. 23.8 .. 47.1 12.3142 Kenya 39.4 0.9 0.5 3.1 2.62 –0.2 2.2 .. 1,268 26.0 .. 80.4 33.2143 Sao Tome and Principe .. 10.5 –10.3 13.2 4.65 –6.0 1.1 .. 29 28.0 .. 89.1 51.5144 Eswatini (Kingdom of) 102.2 0.7 –1.2 4.0 2.58 –1.0 2.4 –34.4 947 28.6 .. 74.1 22.8144 Zambia 71.6 3.4 –4.9 4.7 0.36 –0.5 0.9 .. 956 25.5 .. 72.4 84.2146 Cambodia 124.9 11.4 –9.8 3.9 1.74 –2.0 0.5 –2.9 5,012 32.4 32.4 126.3 121.8147 Angola 57.6 4.3 –1.1 0.2 0.00 0.7 2.1 .. 397 13.0 .. 45.1 12.1148 Myanmar 39.1 6.8 –6.7 2.5 3.70 –1.9 0.1 –1.1 2,907 25.1 .. 95.7 7,976.7149 Nepal 51.8 0.8 .. 5.0 28.31 –2.7 1.7 –7.7 753 19.7 .. 110.8 225.7150 Pakistan 25.8 0.9 –1.3 1.0 6.46 –1.3 1.7 .. 966 15.5 9.5 70.6 21.5151 Cameroon 36.9 2.1 –1.8 2.4 0.80 –0.3 2.2 –7.3 822 25.0 .. 79.9 84.6LOW HUMAN DEVELOPMENT152 Solomon Islands 98.4 2.8 –2.2 15.6 1.23 –4.3 0.4 .. 23 11.0 .. 69.5 217.6153 Papua New Guinea .. –0.2 0.5 2.8 0.01 0.0 0.4 .. 184 9.6 .. 46.8 74.2154 Tanzania (United Republic of) 42.3 2.9 –2.6 4.9 0.84 –0.8 t 0.9 t .. 1,233 13.0 .. 72.1 58.3155 Syrian Arab Republic .. .. .. .. .. –41.8 5.5 .. 5,070 31.9 .. 72.4 30.2156 Zimbabwe 61.5 2.1 –1.5 4.4 11.17 –3.3 2.4 –12.0 2,168 23.1 14.6 79.7 45.9157 Nigeria 20.7 0.9 –2.9 0.6 5.85 –0.4 0.6 .. 1,889 25.7 .. 83.0 50.7158 Rwanda 51.0 3.2 –1.9 13.9 2.36 –1.4 3.6 –6.1 932 20.0 .. 74.9 116.2159 Lesotho 125.4 1.6 –1.6 4.4 15.19 –2.4 0.3 –12.5 1,196 27.4 .. 103.6 114.1159 Mauritania 109.3 11.7 –11.7 6.3 1.54 2.1 3.8 –19.8 .. 18.0 .. 84.0 9.3161 Madagascar 74.5 5.4 –3.9 6.5 2.28 –0.1 0.1 –1.9 293 4.7 .. 32.1 –11.9162 Uganda 44.4 2.7 –0.9 7.4 4.79 –0.8 3.9 7.4 1,323 21.9 .. 55.0 45.5163 Benin 79.4 1.5 –1.2 5.7 2.87 –0.9 2.3 4.0 267 12.0 .. 81.8 6.3164 Senegal 69.8 2.7 –4.2 5.2 13.67 –1.4 1.7 –0.1 1,007 25.7 .. 98.5 52.5165 Comoros 619.0 1.3 –1.6 8.8 21.33 –2.7 1.5 –78.8 27 7.9 .. 57.1 138.3165 Togo 100.0 5.8 1.5 3.6 8.36 –0.3 3.6 –13.4 338 11.3 .. 72.4 80.9167 Sudan 21.5 0.9 –0.9 0.9 0.18 –3.2 1.8 .. 741 28.0 11.0 70.3 33.5168 Afghanistan 55.9 0.3 –0.4 20.6 1.82 2.9 0.4 –7.4 .. 10.6 .. 62.3 75.8168 Haiti 75.3 1.3 –1.2 13.3 29.25 –2.9 0.4 .. 516 12.2 .. 60.0 49.9170 Côte d'Ivoire 48.6 1.6 –2.8 1.9 0.94 0.6 9.0 –3.7 1,583 26.5 .. 115.8 51.5171 Malawi 65.3 4.4 –4.6 23.5 0.65 –0.4 1.3 –20.3 849 9.6 .. 39.7 93.0172 Djibouti 108.5 9.1 .. 10.4 3.37 1.4 12.1 –40.2 63 13.1 .. 36.6 88.3173 Ethiopia 31.5 5.5 –5.0 5.6 1.01 –0.1 1.2 .. 871 15.4 .. 50.0 540.1174 Gambia 60.8 –0.2 .. 9.8 21.25 –1.5 9.8 .. 161 18.5 .. 139.2 59.4175 Guinea 140.1 16.3 –14.4 6.4 0.53 –4.4 1.0 –6.1 35 9.8 .. 87.1 135.1
70 | HUMAN DEVELOPMENT INDICES AND INDICATORS: 2018 STATISTICAL UPDATE

TABLE
13
SDG 17.3 SDG 17.2 SDG 17.3 SDG 8.9 SDG 17.6, 17.8 SDG 9.cTrade Financial flows Human mobility Communication
Exports and
imports
Foreign direct investment, net inflows
Private capital flows
Net official development
assistance receivedaRemittances,
inflows
Net migration
rateStock of
immigrants
International student mobility
International inbound tourists
Internet usersMobile phone subscriptionsTotal Female
(% of GDP) (% of GDP)(% of GDP) (% of GNI) (% of GDP)
(per 1,000 people)
(% of population)
(% of total tertiary
enrolment) (thousands)(% of
population)(% of female population)
(per 100 people) (% change)
HDI rank 2017b 2017b 2017b 2016c 2017b 2010/2015d 2017 2017b 2016c 2016 2017b 2016 2010–2016
176 Congo (Democratic Republic of the) 75.0 3.4 –2.5 6.2 0.05 0.0 1.1 –0.2 191 6.2 .. 36.7 100.3177 Guinea-Bissau 59.0 1.2 0.3 16.5 7.69 –1.2 1.3 .. 44 3.8 .. 70.8 62.7178 Yemen 33.5 –3.1 –0.1 7.1 18.40 –0.6 1.4 –1.1 367 24.6 .. 59.6 26.9179 Eritrea 37.5 1.5 .. 5.2 .. –6.9 0.3 .. 142 1.2 .. 10.2 142.0180 Mozambique 108.9 18.8 –18.7 14.2 1.39 –0.2 0.8 –0.9 1,639 17.5 .. 52.1 74.7181 Liberia 121.7 21.6 –33.4 44.8 26.89 –0.9 2.1 .. .. 7.3 .. 67.6 69.7182 Mali 63.1 0.9 –1.0 8.9 6.80 –3.7 2.1 –9.1 173 11.1 .. 112.4 127.6183 Burkina Faso 62.8 3.4 0.5 9.2 3.45 –1.5 3.7 –2.9 152 14.0 .. 82.6 125.9184 Sierra Leone 79.4 3.9 –3.7 21.9 1.30 –0.6 1.3 .. 55 11.8 .. 84.9 174.2185 Burundi 38.2 0.0 –1.6 24.7 0.96 –1.5 2.8 –1.2 187 5.2 0.7 50.9 166.0186 Chad 73.5 5.9 .. 6.8 .. 1.5 3.3 –15.5 120 5.0 .. 43.1 78.2187 South Sudan 116.7 –0.6 .. 64.5 24.07 7.7 6.7 .. .. .. .. 22.1 48.2188 Central African Republic 44.3 1.8 .. 28.4 .. –17.6 1.9 4.0 121 4.0 .. 27.2 23.4189 Niger 49.6 4.0 –4.7 12.8 2.44 –0.3 1.4 –8.5 152 4.3 0.7 42.2 88.9OTHER COUNTRIES OR TERRITORIES
.. Korea (Democratic People's Rep. of) .. .. .. .. .. –0.2 0.2 –0.3 .. .. .. 14.2 709.3
.. Monaco .. .. .. .. .. .. 54.9 .. 336 95.2 .. 86.5 37.0
.. Nauru 150.6 0.0 .. 18.3 .. .. 32.7 .. .. .. .. 87.2 41.1
.. San Marino .. .. .. .. .. .. 15.7 .. 60 .. .. 110.1 12.0
.. Somalia 77.7 5.0 .. 17.4 .. –3.5 0.3 .. .. 1.9 .. 46.5 764.0
.. Tuvalu .. 0.6 1.9 60.7 10.83 .. 1.3 .. 3 46.0 .. 68.5 350.8Human development groups
Very high human development 59.8 2.7 0.3 .. 0.29 2.6 12.9 3.8 812,209 80.3 78.8 130.0 9.7High human development 44.4 1.9 –1.4 0.1 0.75 –0.1 1.4 –1.3 251,232 53.9 .. 102.9 26.1Medium human development 52.1 2.1 –3.2 0.6 3.71 –0.7 0.8 –0.9 100,347 29.8 .. 95.9 257.2Low human development 39.1 2.3 –2.9 4.3 4.28 –1.5 1.8 –3.5 24,111 17.1 .. 65.1 88.7
Developing countries 49.5 1.9 –1.8 0.4 1.46 –0.4 1.7 –1.1 470,139 38.5 .. 95.0 98.6Regions
Arab States 84.0 1.6 –1.7 1.6 2.62 0.8 9.3 0.2 70,176 42.9 .. 101.6 37.7East Asia and the Pacific 46.1 1.7 –0.9 0.1 0.66 –0.3 0.4 –1.3 159,233 48.4 .. 107.7 462.1Europe and Central Asia 69.1 2.4 –4.3 0.7 2.42 0.6 7.4 –2.4 82,954 56.2 58.3 109.6 24.2Latin America and the Caribbean 43.8 2.8 –3.2 0.1 1.39 –0.6 1.4 –0.4 94,971 56.7 .. 108.4 15.5South Asia 40.3 1.4 –2.1 0.4 3.16 –0.8 0.7 –1.0 24,902 27.6 .. 84.6 70.2Sub-Saharan Africa 51.3 2.5 –3.4 2.7 2.81 –0.3 2.2 –1.8 37,904 20.0 .. 73.4 70.5
Least developed countries 50.0 3.3 –2.8 4.5 3.87 –1.3 1.4 –3.0 27,090 15.7 .. 66.5 348.0Small island developing states 59.9 3.2 –4.6 1.5 6.76 –2.4 1.8 0.7 21,543 33.9 .. 70.4 47.1
Organisation for Economic Co‑operation and Development 54.9 2.4 0.5 .. 0.32 2.0 10.5 3.6 681,890 78.7 76.6 117.6 8.6
World 55.2 2.5 –0.4 0.4 0.73 0.0 3.4 0.0 1,188,297 45.7 .. 100.5 72.9
NOTESa A negative value refers to net official
development assistance disbursed by donor countries.
b Data refer to 2017 or the most recent year available.c Data refer to 2016 or the most recent year available.d Data are average annual estimates for 2010–2015.e Includes Svalbard and Jan Mayen Islands.f Includes Christmas Island, Cocos (Keeling) Islands
and Norfolk Island.g Includes Åland Islands.h Includes Canary Islands, Ceuta and Melilla.i Includes Northern Cyprus.j Includes Sabah and Sarawak.k Includes Agalega, Rodrigues and Saint Brandon.l Includes Kosovo.m Includes Abkhazia and South Ossetia.n Includes Nagorno-Karabakh.o Includes Crimea.p Refers to 2015.q Includes Transnistria.r Includes East Jerusalem.
s Includes East Jerusalem. Refugees are not part of the foreign-born migrant stock in the State of Palestine.
t Includes Zanzibar.
DEFINITIONS
Exports and imports: Sum of exports and imports of goods and services, expressed as a percentage of gross domestic product (GDP). It is a basic indicator of openness to foreign trade and economic integration and indicates the dependence of domestic producers on foreign demand (exports) and of domestic consumers and producers on foreign supply (imports), relative to the country’s economic size (GDP).
Foreign direct investment, net inflows: Sum of equity capital, reinvestment of earnings, other long-term capital and short-term capital, expressed as a percentage of GDP.
Private capital flows: Net foreign direct investment and portfolio investment, expressed as a percentage of GDP.
Net official development assistance received: Disbursements of loans made on concessional terms (net of repayments of principal) and grants by official agencies to promote economic development
and welfare in countries and territories on the Development Assistance Committee list of aid recipients, expressed as a percentage of the recipient country’s gross national income (GNI).
Remittances, inflows: Earnings and material resources transferred by international migrants or refugees to recipients in their country of origin or countries in which the migrant formerly resided.
Net migration rate: Ratio of the difference between the number of in-migrants and out-migrants from a country to the average population, expressed per 1,000 people.
Stock of immigrants: Ratio of the stock of immigrants into a country, expressed as a percentage of the country’s population. The definition of immigrant varies across countries but generally includes the stock of foreign-born people, the stock of foreign people (according to citizenship) or a combination of the two.
International student mobility: Total number of tertiary students from abroad (inbound students) studying in a given country minus the number of students at the same level of education from that country studying abroad (outbound students), expressed as a percentage of total tertiary enrolment in the country.
International inbound tourists: Arrivals of nonresident visitors (overnight visitors, tourists, same-day visitors and excursionists) at national borders.
Internet users: People with access to the worldwide network.
Mobile phone subscriptions: Number of subscriptions for the mobile phone service, expressed per 100 people.
MAIN DATA SOURCES
Columns 1, 2, 4, 5 and 9: World Bank (2018a).
Column 3: HDRO calculations based on data from World Bank (2018a).
Column 6: UNDESA (2017a).
Column 7: UNDESA (2017b).
Column 8: UNESCO Institute for Statistics (2018).
Columns 10–12: ITU (2018).
Column 13: HDRO calculations based on data from ITU (2018).
HUMAN DEVELOPMENT INDICES AND INDICATORS: 2018 STATISTICAL UPDATE
TABLE 13 Human and capital mobility | 71

TABLE
14
SDG 16.1Perceptions of individual well‑being Perceptions about community Perceptions about government
Education quality
Health care
qualityStandard of living
Feeling safe
Freedom of choice
Overall life satisfaction,
index
Local labour market
Volunteered time Community
Confidence in judicial
system
Actions to preserve the environment
Trust in national
government
(% satisfied)
(% satisfied)
(% satisfied)
(% answering yes) (% satisfied) (0, least satisfied,
to 10, most satisfied)
(% answering
good)
(% answering
yes)
(% answering
yes)
(% answering
yes) (% satisfied)
(% answering
yes)Female Male Female Male
HDI rank 2012–2017a 2012–2017a 2012–2017a 2012–2017a 2012–2017a 2012–2017a 2012–2017a 2012–2017a 2012–2017a 2012–2017a 2012–2017a 2012–2017a 2012–2017a 2012–2017a
VERY HIGH HUMAN DEVELOPMENT1 Norway 90 88 95 89 98 96 94 7.6 52 32 95 88 70 722 Switzerland 83 90 92 84 86 92 89 7.5 35 37 93 78 77 823 Australia 68 84 88 45 81 90 90 7.3 32 40 89 55 52 454 Ireland 84 63 81 71 81 89 91 7.1 49 40 91 74 69 605 Germany 68 85 83 67 72 83 82 7.1 59 26 92 68 61 626 Iceland 80 78 87 74 94 94 93 7.5 79 27 83 55 46 377 Hong Kong, China (SAR) 46 58 82 85 93 84 82 5.4 53 19 90 75 44 557 Sweden 68 77 92 62 87 95 92 7.3 63 13 93 69 68 569 Singapore 86 93 88 94 96 92 91 6.4 37 39 95 89 87 93
10 Netherlands 81 89 92 73 94 92 92 7.5 63 37 94 71 64 6711 Denmark 78 90 95 74 90 96 95 7.6 62 23 94 85 70 5712 Canada 77 77 87 75 93 96 93 7.4 58 33 92 67 65 6513 United States 67 77 84 60 85 88 86 7.0 65 39 82 61 47 3914 United Kingdom 70 75 80 78 82 87 75 7.1 47 33 87 68 63 4415 Finland 86 79 83 78 98 95 96 7.8 49 26 96 83 76 6016 New Zealand 72 82 88 53 83 94 94 7.3 52 40 89 63 61 6117 Belgium 79 90 82 57 84 86 85 6.9 41 27 87 60 56 4517 Liechtenstein .. .. .. .. .. .. .. .. .. .. .. .. .. ..19 Japan 60 71 70 67 82 75 80 5.9 47 23 81 67 54 4120 Austria 69 87 87 80 82 87 88 7.3 34 26 83 73 69 4421 Luxembourg 74 87 88 76 83 90 89 7.1 29 33 90 76 78 7422 Israel 65 77 73 67 85 75 76 7.3 42 23 82 55 47 3922 Korea (Republic of) 55 70 67 63 74 54 51 5.9 22 15 78 26 26 3624 France 69 77 78 68 77 83 82 6.6 17 31 88 59 54 3725 Slovenia 81 79 77 82 93 93 90 6.2 40 35 91 29 72 2426 Spain 56 66 71 80 84 76 73 6.2 24 17 80 42 40 2727 Czechia 71 73 79 61 85 78 79 6.8 57 19 91 50 66 3428 Italy 57 53 67 55 61 62 63 6.2 10 17 65 30 22 2329 Malta 81 87 88 67 88 93 91 6.7 80 25 87 51 58 7530 Estonia 63 58 61 59 83 78 84 5.9 32 16 88 55 58 4131 Greece 42 35 39 49 65 43 41 5.1 9 7 76 42 23 1432 Cyprus 56 54 73 66 90 76 80 6.1 44 26 89 42 53 3133 Poland 77 55 67 60 73 82 80 6.2 46 15 83 52 54 5034 United Arab Emirates 73 92 91 .. .. 95 96 7.0 50 23 94 .. 96 ..35 Andorra .. .. .. .. .. .. .. .. .. .. .. .. .. ..35 Lithuania 54 52 36 56 67 68 67 6.3 35 18 84 46 61 3237 Qatar 72 .. 86 87 96 89 91 6.4 66 19 92 .. 91 ..38 Slovakia 62 62 69 59 75 67 67 6.4 24 22 91 39 50 3439 Brunei Darussalam .. .. .. .. .. .. .. .. .. .. .. .. .. ..39 Saudi Arabia 72 80 85 .. .. 78 82 6.3 54 12 90 .. 71 ..41 Latvia 54 45 45 53 73 66 62 6.0 21 9 84 30 54 2641 Portugal 69 65 70 65 87 90 91 5.7 47 15 89 45 48 5043 Bahrain 73 80 82 .. .. 87 90 6.2 40 33 90 .. 73 ..44 Chile 49 33 77 40 52 73 83 6.3 30 15 78 21 33 2745 Hungary 58 56 68 57 72 63 65 6.1 44 12 81 50 46 3846 Croatia 64 60 55 63 76 71 70 5.3 28 11 75 48 51 2147 Argentina 55 51 63 34 47 81 83 6.0 17 15 75 25 42 3148 Oman .. .. .. .. .. .. .. .. .. .. .. .. .. ..49 Russian Federation 52 35 47 41 67 70 67 5.6 20 11 71 36 35 5650 Montenegro 54 41 48 67 75 57 65 5.6 22 9 65 35 28 3551 Bulgaria 45 45 48 54 64 66 66 5.1 26 5 80 22 32 3352 Romania 65 68 58 61 76 80 81 6.1 33 6 84 41 29 3053 Belarus 54 42 44 54 70 60 55 5.6 10 19 77 46 51 4554 Bahamas .. .. .. .. .. .. .. .. .. .. .. .. .. ..55 Uruguay 57 67 71 40 59 89 88 6.3 19 15 78 41 58 4156 Kuwait 55 79 90 .. .. 88 88 6.1 46 11 86 .. 75 ..57 Malaysia 75 78 75 35 54 62 71 6.3 54 33 78 55 62 4458 Barbados .. .. .. .. .. .. .. .. .. .. .. .. .. ..58 Kazakhstan 64 56 73 62 72 71 70 5.9 35 16 84 55 51 76
Supplementary indicators: perceptions of well-being14TAB
LE
72 | HUMAN DEVELOPMENT INDICES AND INDICATORS: 2018 STATISTICAL UPDATE

TABLE
14
SDG 16.1Perceptions of individual well‑being Perceptions about community Perceptions about government
Education quality
Health care
qualityStandard of living
Feeling safe
Freedom of choice
Overall life satisfaction,
index
Local labour market
Volunteered time Community
Confidence in judicial
system
Actions to preserve the environment
Trust in national
government
(% satisfied)
(% satisfied)
(% satisfied)
(% answering yes) (% satisfied) (0, least satisfied,
to 10, most satisfied)
(% answering
good)
(% answering
yes)
(% answering
yes)
(% answering
yes) (% satisfied)
(% answering
yes)Female Male Female Male
HDI rank 2012–2017a 2012–2017a 2012–2017a 2012–2017a 2012–2017a 2012–2017a 2012–2017a 2012–2017a 2012–2017a 2012–2017a 2012–2017a 2012–2017a 2012–2017a 2012–2017a
HIGH HUMAN DEVELOPMENT60 Iran (Islamic Republic of) 50 57 63 67 81 70 64 4.7 23 20 71 57 48 7160 Palau .. .. .. .. .. .. .. .. .. .. .. .. .. ..62 Seychelles .. .. .. .. .. .. .. .. .. .. .. .. .. ..63 Costa Rica 81 63 79 43 53 91 94 7.2 31 17 83 45 61 4164 Turkey 50 62 68 53 63 65 61 5.6 40 9 74 53 46 5965 Mauritius 76 78 81 58 75 91 91 6.2 43 38 90 67 76 6166 Panama 69 55 76 47 57 86 89 6.6 46 21 84 42 51 3967 Serbia 65 53 45 64 84 63 66 5.1 22 6 72 45 33 5168 Albania 61 50 43 52 69 71 77 4.6 20 7 67 29 43 4669 Trinidad and Tobago 62 52 51 43 61 85 83 6.2 32 31 80 29 24 2770 Antigua and Barbuda .. .. .. .. .. .. .. .. .. .. .. .. .. ..70 Georgia 55 53 31 74 83 73 78 4.5 9 17 72 33 30 3072 Saint Kitts and Nevis .. .. .. .. .. .. .. .. .. .. .. .. .. ..73 Cuba .. .. .. .. .. .. .. .. .. .. .. .. .. ..74 Mexico 61 55 76 33 47 86 84 6.4 45 14 73 32 43 2675 Grenada .. .. .. .. .. .. .. .. .. .. .. .. .. ..76 Sri Lanka 74 73 65 56 69 78 80 4.3 45 45 82 68 58 5277 Bosnia and Herzegovina 56 54 49 65 71 51 55 5.1 16 7 66 24 22 1378 Venezuela (Bolivarian Republic of) 48 26 33 15 19 63 63 5.1 19 15 66 22 34 2479 Brazil 51 36 66 23 40 76 76 6.3 18 13 65 38 33 1780 Azerbaijan 57 38 57 63 87 69 67 5.2 26 12 78 36 59 7780 Lebanon 66 49 59 46 58 61 60 5.2 21 12 78 30 15 2280 The former Yugoslav Republic of Macedonia 59 53 49 65 78 75 72 5.2 28 5 72 31 33 4483 Armenia 53 42 35 76 79 63 56 4.3 17 9 60 29 39 2583 Thailand 86 84 69 60 73 89 89 5.9 38 12 90 65 78 6185 Algeria 49 38 67 49 67 40 43 5.2 16 17 58 28 23 ..86 China 66 65 78 73 87 84 85 5.1 36 7 80 .. 68 ..86 Ecuador 78 59 75 47 61 87 88 5.8 32 18 82 49 72 6488 Ukraine 46 24 31 47 62 57 51 4.3 18 15 79 11 17 1189 Peru 54 38 70 40 51 80 80 5.7 42 20 71 21 47 2590 Colombia 51 40 75 36 48 82 85 6.2 33 17 81 25 44 2290 Saint Lucia .. .. .. .. .. .. .. .. .. .. .. .. .. ..92 Fiji .. .. .. .. .. .. .. .. .. .. .. .. .. ..92 Mongolia 44 36 66 43 56 64 66 5.3 5 36 74 36 27 2894 Dominican Republic 78 52 67 28 41 85 84 5.6 34 32 74 30 55 4695 Jordan 55 67 62 71 86 75 76 4.8 28 9 69 .. 53 ..95 Tunisia 36 26 46 55 70 46 46 4.1 18 8 55 46 20 2597 Jamaica 73 56 44 54 71 83 85 5.9 30 29 67 29 30 3598 Tonga .. .. .. .. .. .. .. .. .. .. .. .. .. ..99 Saint Vincent and the Grenadines .. .. .. .. .. .. .. .. .. .. .. .. .. ..
100 Suriname 82 78 64 57 63 85 88 6.3 34 22 90 71 65 72101 Botswana 54 64 29 30 38 83 78 3.5 31 16 59 78 82 77101 Maldives .. .. .. .. .. .. .. .. .. .. .. .. .. ..103 Dominica .. .. .. .. .. .. .. .. .. .. .. .. .. ..104 Samoa .. .. .. .. .. .. .. .. .. .. .. .. .. ..105 Uzbekistan 81 83 81 79 91 96 99 6.4 69 20 95 82 89 96106 Belize 62 50 66 44 57 88 84 6.0 40 26 74 37 62 38106 Marshall Islands .. .. .. .. .. .. .. .. .. .. .. .. .. ..108 Libya 51 42 70 42 58 75 79 5.6 44 24 75 .. 55 ..108 Turkmenistan .. .. 83 75 80 69 68 5.2 39 35 88 .. 61 ..110 Gabon 21 21 42 23 27 62 65 4.8 27 10 47 32 36 29110 Paraguay 69 52 81 47 52 87 89 5.9 42 22 89 29 39 31112 Moldova (Republic of) 56 36 56 35 50 55 50 5.3 6 13 71 20 18 13MEDIUM HUMAN DEVELOPMENT113 Philippines 86 82 75 56 65 93 92 5.6 69 28 89 72 88 84113 South Africa 67 57 42 23 41 80 76 4.5 28 34 53 52 42 42115 Egypt 34 36 62 71 81 57 55 3.9 15 6 78 65 31 62116 Indonesia 82 78 73 73 91 86 84 5.1 56 53 86 72 71 83116 Viet Nam 77 62 74 54 67 83 88 5.2 40 14 81 66 53 81
HUMAN DEVELOPMENT INDICES AND INDICATORS: 2018 STATISTICAL UPDATE
TABLE 14 Supplementary indicators: perceptions of well-being | 73

TABLE 14 SUPPLEMENTARY INDICATORS: PERCEPTIONS OF WELL-BEING
TABLE
14
SDG 16.1Perceptions of individual well‑being Perceptions about community Perceptions about government
Education quality
Health care
qualityStandard of living
Feeling safe
Freedom of choice
Overall life satisfaction,
index
Local labour market
Volunteered time Community
Confidence in judicial
system
Actions to preserve the environment
Trust in national
government
(% satisfied)
(% satisfied)
(% satisfied)
(% answering yes) (% satisfied) (0, least satisfied,
to 10, most satisfied)
(% answering
good)
(% answering
yes)
(% answering
yes)
(% answering
yes) (% satisfied)
(% answering
yes)Female Male Female Male
HDI rank 2012–2017a 2012–2017a 2012–2017a 2012–2017a 2012–2017a 2012–2017a 2012–2017a 2012–2017a 2012–2017a 2012–2017a 2012–2017a 2012–2017a 2012–2017a 2012–2017a
118 Bolivia (Plurinational State of) 67 44 74 38 50 86 86 5.7 36 21 78 22 61 43119 Palestine, State of 64 61 60 49 64 65 61 4.6 13 9 77 36 39 41120 Iraq 39 37 65 58 62 60 61 4.5 25 19 63 49 36 42121 El Salvador 66 47 75 43 49 73 77 6.3 33 15 83 27 40 27122 Kyrgyzstan 72 66 81 48 56 82 87 5.6 49 18 91 37 52 56123 Morocco 34 27 79 67 82 78 80 5.3 36 9 75 28 51 38124 Nicaragua 81 63 75 62 63 92 90 6.5 49 22 85 45 73 59125 Cabo Verde .. .. .. .. .. .. .. .. .. .. .. .. .. ..125 Guyana .. .. .. .. .. .. .. .. .. .. .. .. .. ..127 Guatemala 73 47 84 44 60 88 93 6.3 40 28 87 49 57 46127 Tajikistan 82 80 71 87 89 80 76 5.8 51 36 81 74 71 93129 Namibia 62 57 41 36 49 77 84 4.4 35 21 57 59 61 75130 India 79 65 76 69 77 83 89 4.0 44 15 85 83 77 84131 Micronesia (Federated States of) .. .. .. .. .. .. .. .. .. .. .. .. .. ..132 Timor-Leste .. .. .. .. .. .. .. .. .. .. .. .. .. ..133 Honduras 76 61 74 55 61 88 89 6.0 42 32 87 44 59 50134 Bhutan 93 86 89 59 67 83 79 5.1 51 39 93 97 99 95134 Kiribati .. .. .. .. .. .. .. .. .. .. .. .. .. ..136 Bangladesh 80 63 79 70 84 82 90 4.3 31 13 84 80 76 88137 Congo 55 37 54 44 51 66 74 4.9 29 14 64 39 48 47138 Vanuatu .. .. .. .. .. .. .. .. .. .. .. .. .. ..139 Lao People's Democratic Republic 81 71 79 63 75 77 84 4.6 57 4 92 72 80 84140 Ghana 55 52 52 63 70 78 76 5.5 32 36 60 59 51 67141 Equatorial Guinea .. .. .. .. .. .. .. .. .. .. .. .. .. ..142 Kenya 64 51 54 54 64 88 82 4.5 47 45 70 57 56 64143 Sao Tome and Principe .. .. .. .. .. .. .. .. .. .. .. .. .. ..144 Eswatini (Kingdom of) .. .. .. .. .. .. .. .. .. .. .. .. .. ..144 Zambia 66 58 43 43 53 82 79 3.9 48 34 62 63 63 72146 Cambodia 90 82 80 50 60 96 95 4.6 65 6 91 59 90 75147 Angola 46 29 35 39 53 30 37 3.8 43 17 50 44 37 57148 Myanmar 79 75 69 71 79 88 87 4.2 54 34 88 65 73 82149 Nepal 78 63 72 51 70 81 84 4.7 63 27 85 65 66 56150 Pakistan 63 46 70 56 62 70 70 5.8 33 13 78 57 49 56151 Cameroon 51 43 53 40 49 77 73 5.1 45 16 68 47 53 58LOW HUMAN DEVELOPMENT152 Solomon Islands .. .. .. .. .. .. .. .. .. .. .. .. .. ..153 Papua New Guinea .. .. .. .. .. .. .. .. .. .. .. .. .. ..154 Tanzania (United Republic of) 58 43 35 60 71 81 78 3.3 50 8 71 77 66 91155 Syrian Arab Republic 24 38 20 17 47 32 45 3.5 17 20 36 27 38 ..156 Zimbabwe 66 63 46 42 63 80 69 3.6 33 18 67 66 51 68157 Nigeria 60 57 53 52 65 81 83 5.3 39 37 67 53 56 56158 Rwanda 81 77 35 83 93 89 91 3.1 32 18 70 91 93 98159 Lesotho 48 36 34 37 49 74 73 3.8 44 20 55 71 45 70159 Mauritania 27 27 50 40 52 50 49 4.7 33 14 53 27 24 29161 Madagascar 56 39 30 38 47 56 57 4.1 40 31 77 46 40 54162 Uganda 45 39 45 54 65 74 77 4.0 43 26 64 51 55 66163 Benin 51 40 38 52 54 73 65 4.9 41 17 55 60 51 62164 Senegal 51 38 53 40 53 69 66 4.7 32 15 62 60 49 61165 Comoros 49 24 38 67 77 50 57 4.0 30 18 75 34 39 46165 Togo 48 37 42 49 58 68 70 4.4 43 14 52 43 55 48167 Sudan 28 22 52 64 78 25 29 4.1 18 23 50 .. 11 ..168 Afghanistan 51 32 19 15 24 37 44 2.7 11 11 63 24 39 26168 Haiti 25 15 22 48 46 52 44 3.8 23 31 45 37 32 44170 Côte d'Ivoire 45 35 36 49 50 71 71 5.0 51 7 59 42 44 52171 Malawi 58 57 38 42 47 85 84 3.4 63 26 73 59 82 62172 Djibouti .. .. .. .. .. .. .. .. .. .. .. .. .. ..173 Ethiopia 72 45 42 62 70 69 73 4.2 48 23 63 60 70 77174 Gambia 73 49 57 47 63 75 80 4.1 45 30 77 68 62 80175 Guinea 45 42 58 51 56 71 73 4.9 54 24 74 54 58 64
74 | HUMAN DEVELOPMENT INDICES AND INDICATORS: 2018 STATISTICAL UPDATE

TABLE
14
SDG 16.1Perceptions of individual well‑being Perceptions about community Perceptions about government
Education quality
Health care
qualityStandard of living
Feeling safe
Freedom of choice
Overall life satisfaction,
index
Local labour market
Volunteered time Community
Confidence in judicial
system
Actions to preserve the environment
Trust in national
government
(% satisfied)
(% satisfied)
(% satisfied)
(% answering yes) (% satisfied) (0, least satisfied,
to 10, most satisfied)
(% answering
good)
(% answering
yes)
(% answering
yes)
(% answering
yes) (% satisfied)
(% answering
yes)Female Male Female Male
HDI rank 2012–2017a 2012–2017a 2012–2017a 2012–2017a 2012–2017a 2012–2017a 2012–2017a 2012–2017a 2012–2017a 2012–2017a 2012–2017a 2012–2017a 2012–2017a 2012–2017a
176 Congo (Democratic Republic of the) 48 42 51 36 54 69 67 4.3 37 29 57 43 50 48177 Guinea-Bissau .. .. .. .. .. .. .. .. .. .. .. .. .. ..178 Yemen 43 22 38 37 70 52 60 3.3 6 6 74 24 10 25179 Eritrea .. .. .. .. .. .. .. .. .. .. .. .. .. ..180 Mozambique 70 56 59 49 54 79 82 4.3 54 27 78 67 66 76181 Liberia 42 37 41 34 47 69 76 4.4 48 47 57 53 48 55182 Mali 35 44 50 58 59 71 72 4.7 63 20 65 39 48 50183 Burkina Faso 51 40 38 51 60 59 56 4.6 50 19 63 48 44 54184 Sierra Leone 45 45 43 54 55 70 70 4.1 45 37 65 49 44 74185 Burundi 54 37 26 43 42 47 39 2.9 10 10 47 .. 41 ..186 Chad 53 44 58 50 50 61 58 4.6 34 16 71 44 55 47187 South Sudan 34 24 22 43 41 41 47 2.8 37 29 42 41 29 46188 Central African Republic 37 28 30 50 54 64 63 3.5 54 27 62 60 49 65189 Niger 44 43 52 64 69 67 62 4.6 36 20 68 65 57 60OTHER COUNTRIES OR TERRITORIES
.. Korea (Democratic People's Rep. of) .. .. .. .. .. .. .. .. .. .. .. .. .. ..
.. Monaco .. .. .. .. .. .. .. .. .. .. .. .. .. ..
.. Nauru .. .. .. .. .. .. .. .. .. .. .. .. .. ..
.. San Marino .. .. .. .. .. .. .. .. .. .. .. .. .. ..
.. Somalia 67 55 75 86 85 91 91 4.7 41 24 92 62 86 70
.. Tuvalu .. .. .. .. .. .. .. .. .. .. .. .. .. ..Human development groups
Very high human development 64 68 74 60 77 79 79 6.5 43 25 82 54 49 44High human development 63 59 73 61 75 80 81 5.3 34 10 77 .. 58 ..Medium human development 74 62 72 64 75 81 84 4.5 43 21 82 73 69 77Low human development 53 44 44 49 60 68 69 4.3 39 24 64 52 52 60
Developing countries 66 58 68 60 72 78 80 4.8 39 17 78 62 62 65Regions
Arab States 43 40 63 59 74 57 61 4.6 24 13 70 45 37 ..East Asia and the Pacific .. .. .. .. .. .. .. .. .. .. .. .. .. ..Europe and Central Asia 58 55 60 59 71 69 67 5.4 36 14 79 46 47 55Latin America and the Caribbean 56 43 68 32 45 80 80 6.1 29 16 72 33 41 27South Asia 76 62 74 66 75 80 85 4.2 40 15 83 77 72 79Sub-Saharan Africa 57 47 46 49 60 73 73 4.4 42 27 64 55 55 62
Least developed countries 60 48 52 54 65 69 71 4.1 40 21 70 59 58 67Small island developing states .. .. .. .. .. .. .. .. .. .. .. .. .. ..
Organisation for Economic Co‑operation and Development 64 71 77 61 76 81 79 6.6 46 26 82 55 49 42
World 66 60 69 61 74 79 80 5.1 40 19 78 60 60 61
NOTES
a Data refer to the most recent year available during the period specified.
DEFINITIONS
Satisfaction with education quality: Percentage of respondents answering “satisfied” to the Gallup World Poll question, “Are you satisfied or dissatisfied with the education system or the schools?”
Satisfaction with health care quality: Percentage of respondents answering “satisfied” to the Gallup World Poll question, “Are you satisfied or dissatisfied with the availability of quality healthcare?”
Satisfaction with standard of living: Percentage of respondents answering “satisfied” to the Gallup World Poll question, “Are you satisfied or
dissatisfied with your standard of living, all the things you can buy and do?”
Feeling safe: Percentage of respondents answering “yes” to the Gallup World Poll question, “Do you feel safe walking alone at night in the city or area where you live?”
Satisfaction with freedom of choice: Percentage of respondents answering “satisfied” to the Gallup World Poll question, “In this country, are you satisfied or dissatisfied with your freedom to choose what you do with your life?”
Overall life satisfaction, index: Average response to the Gallup World Poll question, “Please imagine a ladder, with steps numbered from zero at the bottom to ten at the top. Suppose we say that the top of the ladder represents the best possible life for you, and the bottom of the ladder represents the worst possible life for you. On which step of the ladder
would you say you personally feel you stand at this time, assuming that the higher the step the better you feel about your life, and the lower the step the worse you feel about it? Which step comes closest to the way you feel?”
Perception of local labour market: Percentage of respondents answering “good” to the Gallup World Poll question, “Thinking about the job situation in the city or area where you live today, would you say that it is now a good time or a bad time to find a job?”
Volunteered time: Percentage of respondents answering “yes” to the Gallup World Poll question, “In the past month have you volunteered your time to an organization?”
Satisfaction with community: Percentage of respondents answering “yes” to the Gallup World Poll question, “Are you satisfied or dissatisfied with the city or area where you live?”
Confidence in judicial system: Percentage of respondents answering “yes” to the Gallup World Poll question, “In this country, do you have confidence in the judicial system and courts?”
Satisfaction with actions to preserve the environment: Percentage of respondents answering “satisfied” to Gallup World Poll question, “In this country, are you satisfied or dissatisfied with the efforts to preserve the environment?”
Trust in national government: Percentage of respondents answering “yes” to the Gallup World Poll question, “In this country, do you have confidence in the national government?”
MAIN DATA SOURCES
Columns 1–14: Gallup (2018).
HUMAN DEVELOPMENT INDICES AND INDICATORS: 2018 STATISTICAL UPDATE
TABLE 14 Supplementary indicators: perceptions of well-being | 75
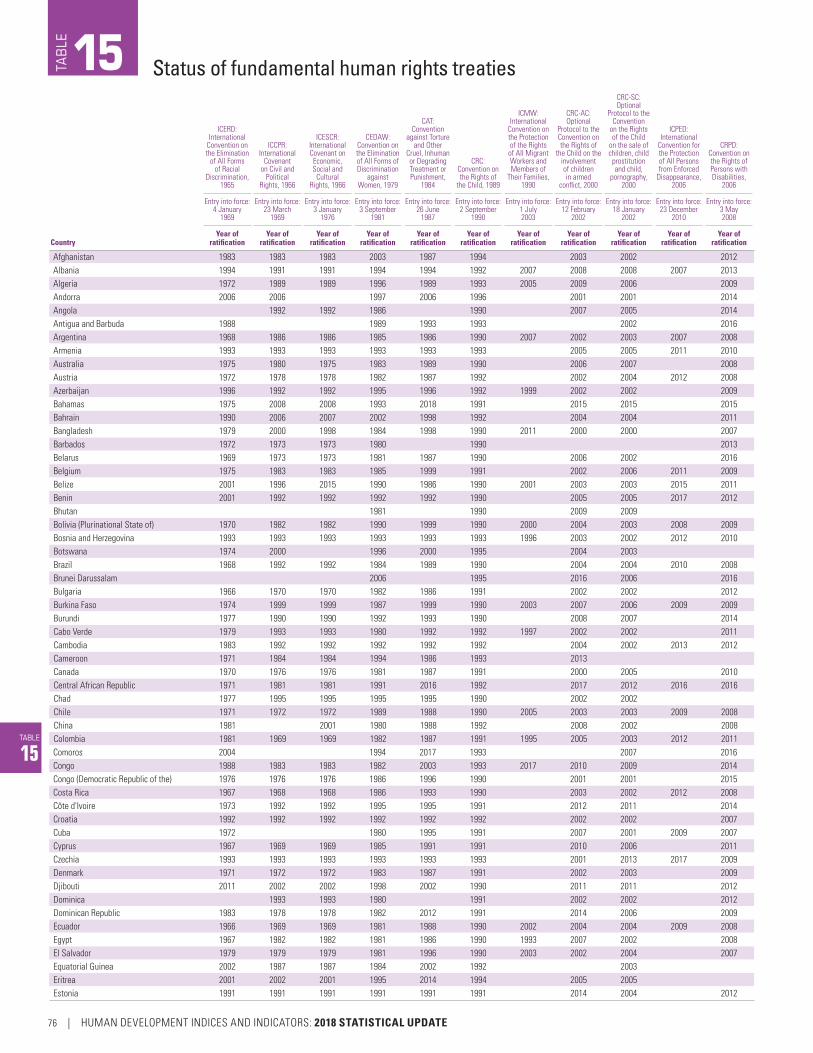
TABLE
15
ICERD: International
Convention on the Elimination
of All Forms of Racial
Discrimination, 1965
ICCPR: International
Covenant on Civil and
Political Rights, 1966
ICESCR: International Covenant on Economic, Social and
Cultural Rights, 1966
CEDAW: Convention on the Elimination of All Forms of Discrimination
against Women, 1979
CAT: Convention
against Torture and Other
Cruel, Inhuman or Degrading Treatment or Punishment,
1984
CRC: Convention on the Rights of
the Child, 1989
ICMW: International
Convention on the Protection of the Rights
of All Migrant Workers and Members of
Their Families, 1990
CRC-AC: Optional
Protocol to the Convention on the Rights of
the Child on the involvement of children in armed
conflict, 2000
CRC-SC: Optional
Protocol to the Convention
on the Rights of the Child
on the sale of children, child prostitution and child,
pornography, 2000
ICPED: International
Convention for the Protection of All Persons from Enforced
Disappearance, 2006
CRPD: Convention on the Rights of Persons with Disabilities,
2006
Entry into force: 4 January
1969
Entry into force: 23 March
1969
Entry into force: 3 January
1976
Entry into force: 3 September
1981
Entry into force: 26 June
1987
Entry into force: 2 September
1990
Entry into force: 1 July 2003
Entry into force: 12 February
2002
Entry into force: 18 January
2002
Entry into force: 23 December
2010
Entry into force: 3 May 2008
CountryYear of
ratificationYear of
ratificationYear of
ratificationYear of
ratificationYear of
ratificationYear of
ratificationYear of
ratificationYear of
ratificationYear of
ratificationYear of
ratificationYear of
ratification
Afghanistan 1983 1983 1983 2003 1987 1994 2003 2002 2012Albania 1994 1991 1991 1994 1994 1992 2007 2008 2008 2007 2013Algeria 1972 1989 1989 1996 1989 1993 2005 2009 2006 2009Andorra 2006 2006 1997 2006 1996 2001 2001 2014Angola 1992 1992 1986 1990 2007 2005 2014Antigua and Barbuda 1988 1989 1993 1993 2002 2016Argentina 1968 1986 1986 1985 1986 1990 2007 2002 2003 2007 2008Armenia 1993 1993 1993 1993 1993 1993 2005 2005 2011 2010Australia 1975 1980 1975 1983 1989 1990 2006 2007 2008Austria 1972 1978 1978 1982 1987 1992 2002 2004 2012 2008Azerbaijan 1996 1992 1992 1995 1996 1992 1999 2002 2002 2009Bahamas 1975 2008 2008 1993 2018 1991 2015 2015 2015Bahrain 1990 2006 2007 2002 1998 1992 2004 2004 2011Bangladesh 1979 2000 1998 1984 1998 1990 2011 2000 2000 2007Barbados 1972 1973 1973 1980 1990 2013Belarus 1969 1973 1973 1981 1987 1990 2006 2002 2016Belgium 1975 1983 1983 1985 1999 1991 2002 2006 2011 2009Belize 2001 1996 2015 1990 1986 1990 2001 2003 2003 2015 2011Benin 2001 1992 1992 1992 1992 1990 2005 2005 2017 2012Bhutan 1981 1990 2009 2009Bolivia (Plurinational State of) 1970 1982 1982 1990 1999 1990 2000 2004 2003 2008 2009Bosnia and Herzegovina 1993 1993 1993 1993 1993 1993 1996 2003 2002 2012 2010Botswana 1974 2000 1996 2000 1995 2004 2003Brazil 1968 1992 1992 1984 1989 1990 2004 2004 2010 2008Brunei Darussalam 2006 1995 2016 2006 2016Bulgaria 1966 1970 1970 1982 1986 1991 2002 2002 2012Burkina Faso 1974 1999 1999 1987 1999 1990 2003 2007 2006 2009 2009Burundi 1977 1990 1990 1992 1993 1990 2008 2007 2014Cabo Verde 1979 1993 1993 1980 1992 1992 1997 2002 2002 2011Cambodia 1983 1992 1992 1992 1992 1992 2004 2002 2013 2012Cameroon 1971 1984 1984 1994 1986 1993 2013Canada 1970 1976 1976 1981 1987 1991 2000 2005 2010Central African Republic 1971 1981 1981 1991 2016 1992 2017 2012 2016 2016Chad 1977 1995 1995 1995 1995 1990 2002 2002Chile 1971 1972 1972 1989 1988 1990 2005 2003 2003 2009 2008China 1981 2001 1980 1988 1992 2008 2002 2008Colombia 1981 1969 1969 1982 1987 1991 1995 2005 2003 2012 2011Comoros 2004 1994 2017 1993 2007 2016Congo 1988 1983 1983 1982 2003 1993 2017 2010 2009 2014Congo (Democratic Republic of the) 1976 1976 1976 1986 1996 1990 2001 2001 2015Costa Rica 1967 1968 1968 1986 1993 1990 2003 2002 2012 2008Côte d'Ivoire 1973 1992 1992 1995 1995 1991 2012 2011 2014Croatia 1992 1992 1992 1992 1992 1992 2002 2002 2007Cuba 1972 1980 1995 1991 2007 2001 2009 2007Cyprus 1967 1969 1969 1985 1991 1991 2010 2006 2011Czechia 1993 1993 1993 1993 1993 1993 2001 2013 2017 2009Denmark 1971 1972 1972 1983 1987 1991 2002 2003 2009Djibouti 2011 2002 2002 1998 2002 1990 2011 2011 2012Dominica 1993 1993 1980 1991 2002 2002 2012Dominican Republic 1983 1978 1978 1982 2012 1991 2014 2006 2009Ecuador 1966 1969 1969 1981 1988 1990 2002 2004 2004 2009 2008Egypt 1967 1982 1982 1981 1986 1990 1993 2007 2002 2008El Salvador 1979 1979 1979 1981 1996 1990 2003 2002 2004 2007Equatorial Guinea 2002 1987 1987 1984 2002 1992 2003Eritrea 2001 2002 2001 1995 2014 1994 2005 2005Estonia 1991 1991 1991 1991 1991 1991 2014 2004 2012
Status of fundamental human rights treaties15TAB
LE
76 | HUMAN DEVELOPMENT INDICES AND INDICATORS: 2018 STATISTICAL UPDATE
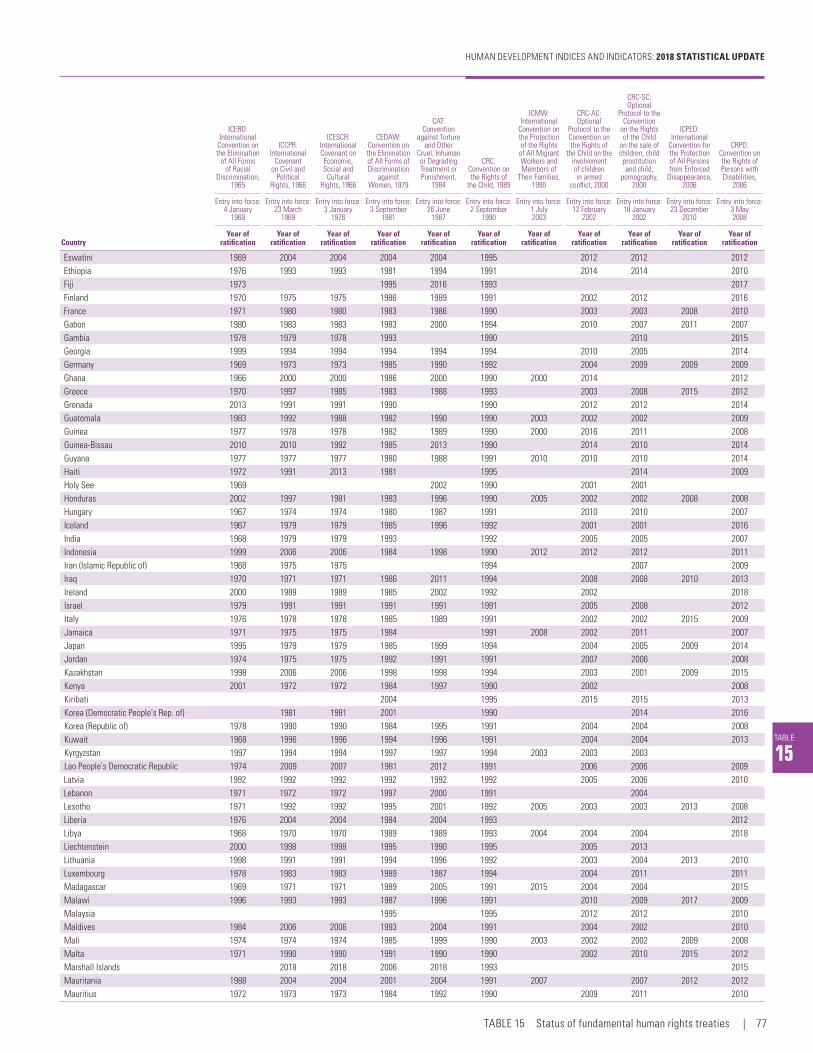
TABLE
15
ICERD: International
Convention on the Elimination
of All Forms of Racial
Discrimination, 1965
ICCPR: International
Covenant on Civil and
Political Rights, 1966
ICESCR: International Covenant on Economic, Social and
Cultural Rights, 1966
CEDAW: Convention on the Elimination of All Forms of Discrimination
against Women, 1979
CAT: Convention
against Torture and Other
Cruel, Inhuman or Degrading Treatment or Punishment,
1984
CRC: Convention on the Rights of
the Child, 1989
ICMW: International
Convention on the Protection of the Rights
of All Migrant Workers and Members of
Their Families, 1990
CRC-AC: Optional
Protocol to the Convention on the Rights of
the Child on the involvement of children in armed
conflict, 2000
CRC-SC: Optional
Protocol to the Convention
on the Rights of the Child
on the sale of children, child prostitution and child,
pornography, 2000
ICPED: International
Convention for the Protection of All Persons from Enforced
Disappearance, 2006
CRPD: Convention on the Rights of Persons with Disabilities,
2006
Entry into force: 4 January
1969
Entry into force: 23 March
1969
Entry into force: 3 January
1976
Entry into force: 3 September
1981
Entry into force: 26 June
1987
Entry into force: 2 September
1990
Entry into force: 1 July 2003
Entry into force: 12 February
2002
Entry into force: 18 January
2002
Entry into force: 23 December
2010
Entry into force: 3 May 2008
CountryYear of
ratificationYear of
ratificationYear of
ratificationYear of
ratificationYear of
ratificationYear of
ratificationYear of
ratificationYear of
ratificationYear of
ratificationYear of
ratificationYear of
ratification
Eswatini 1969 2004 2004 2004 2004 1995 2012 2012 2012Ethiopia 1976 1993 1993 1981 1994 1991 2014 2014 2010Fiji 1973 1995 2016 1993 2017Finland 1970 1975 1975 1986 1989 1991 2002 2012 2016France 1971 1980 1980 1983 1986 1990 2003 2003 2008 2010Gabon 1980 1983 1983 1983 2000 1994 2010 2007 2011 2007Gambia 1978 1979 1978 1993 1990 2010 2015Georgia 1999 1994 1994 1994 1994 1994 2010 2005 2014Germany 1969 1973 1973 1985 1990 1992 2004 2009 2009 2009Ghana 1966 2000 2000 1986 2000 1990 2000 2014 2012Greece 1970 1997 1985 1983 1988 1993 2003 2008 2015 2012Grenada 2013 1991 1991 1990 1990 2012 2012 2014Guatemala 1983 1992 1988 1982 1990 1990 2003 2002 2002 2009Guinea 1977 1978 1978 1982 1989 1990 2000 2016 2011 2008Guinea-Bissau 2010 2010 1992 1985 2013 1990 2014 2010 2014Guyana 1977 1977 1977 1980 1988 1991 2010 2010 2010 2014Haiti 1972 1991 2013 1981 1995 2014 2009Holy See 1969 2002 1990 2001 2001Honduras 2002 1997 1981 1983 1996 1990 2005 2002 2002 2008 2008Hungary 1967 1974 1974 1980 1987 1991 2010 2010 2007Iceland 1967 1979 1979 1985 1996 1992 2001 2001 2016India 1968 1979 1979 1993 1992 2005 2005 2007Indonesia 1999 2006 2006 1984 1998 1990 2012 2012 2012 2011Iran (Islamic Republic of) 1968 1975 1975 1994 2007 2009Iraq 1970 1971 1971 1986 2011 1994 2008 2008 2010 2013Ireland 2000 1989 1989 1985 2002 1992 2002 2018Israel 1979 1991 1991 1991 1991 1991 2005 2008 2012Italy 1976 1978 1978 1985 1989 1991 2002 2002 2015 2009Jamaica 1971 1975 1975 1984 1991 2008 2002 2011 2007Japan 1995 1979 1979 1985 1999 1994 2004 2005 2009 2014Jordan 1974 1975 1975 1992 1991 1991 2007 2006 2008Kazakhstan 1998 2006 2006 1998 1998 1994 2003 2001 2009 2015Kenya 2001 1972 1972 1984 1997 1990 2002 2008Kiribati 2004 1995 2015 2015 2013Korea (Democratic People's Rep. of) 1981 1981 2001 1990 2014 2016Korea (Republic of) 1978 1990 1990 1984 1995 1991 2004 2004 2008Kuwait 1968 1996 1996 1994 1996 1991 2004 2004 2013Kyrgyzstan 1997 1994 1994 1997 1997 1994 2003 2003 2003Lao People's Democratic Republic 1974 2009 2007 1981 2012 1991 2006 2006 2009Latvia 1992 1992 1992 1992 1992 1992 2005 2006 2010Lebanon 1971 1972 1972 1997 2000 1991 2004Lesotho 1971 1992 1992 1995 2001 1992 2005 2003 2003 2013 2008Liberia 1976 2004 2004 1984 2004 1993 2012Libya 1968 1970 1970 1989 1989 1993 2004 2004 2004 2018Liechtenstein 2000 1998 1998 1995 1990 1995 2005 2013Lithuania 1998 1991 1991 1994 1996 1992 2003 2004 2013 2010Luxembourg 1978 1983 1983 1989 1987 1994 2004 2011 2011Madagascar 1969 1971 1971 1989 2005 1991 2015 2004 2004 2015Malawi 1996 1993 1993 1987 1996 1991 2010 2009 2017 2009Malaysia 1995 1995 2012 2012 2010Maldives 1984 2006 2006 1993 2004 1991 2004 2002 2010Mali 1974 1974 1974 1985 1999 1990 2003 2002 2002 2009 2008Malta 1971 1990 1990 1991 1990 1990 2002 2010 2015 2012Marshall Islands 2018 2018 2006 2018 1993 2015Mauritania 1988 2004 2004 2001 2004 1991 2007 2007 2012 2012Mauritius 1972 1973 1973 1984 1992 1990 2009 2011 2010
HUMAN DEVELOPMENT INDICES AND INDICATORS: 2018 STATISTICAL UPDATE
TABLE 15 Status of fundamental human rights treaties | 77
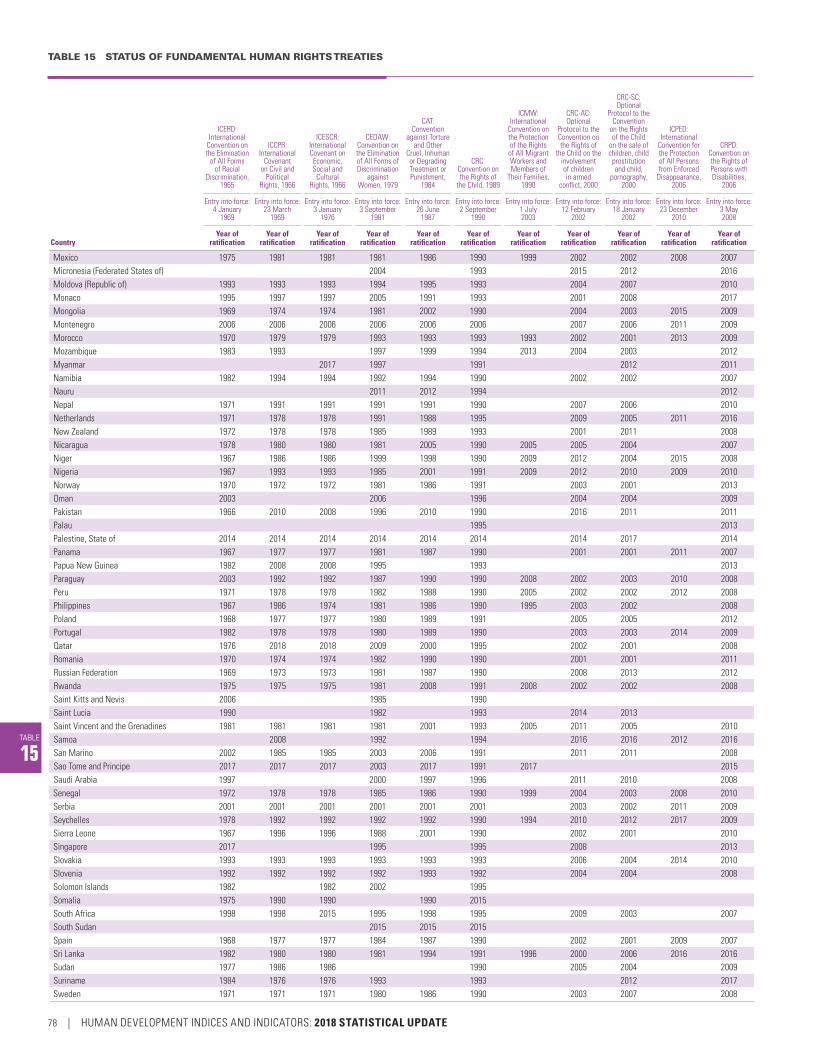
TABLE 15 STATUS OF FUNDAMENTAL HUMAN RIGHTS TREATIES
TABLE
15
ICERD: International
Convention on the Elimination
of All Forms of Racial
Discrimination, 1965
ICCPR: International
Covenant on Civil and
Political Rights, 1966
ICESCR: International Covenant on Economic, Social and
Cultural Rights, 1966
CEDAW: Convention on the Elimination of All Forms of Discrimination
against Women, 1979
CAT: Convention
against Torture and Other
Cruel, Inhuman or Degrading Treatment or Punishment,
1984
CRC: Convention on the Rights of
the Child, 1989
ICMW: International
Convention on the Protection of the Rights
of All Migrant Workers and Members of
Their Families, 1990
CRC-AC: Optional
Protocol to the Convention on the Rights of
the Child on the involvement of children in armed
conflict, 2000
CRC-SC: Optional
Protocol to the Convention
on the Rights of the Child
on the sale of children, child prostitution and child,
pornography, 2000
ICPED: International
Convention for the Protection of All Persons from Enforced
Disappearance, 2006
CRPD: Convention on the Rights of Persons with Disabilities,
2006
Entry into force: 4 January
1969
Entry into force: 23 March
1969
Entry into force: 3 January
1976
Entry into force: 3 September
1981
Entry into force: 26 June
1987
Entry into force: 2 September
1990
Entry into force: 1 July 2003
Entry into force: 12 February
2002
Entry into force: 18 January
2002
Entry into force: 23 December
2010
Entry into force: 3 May 2008
CountryYear of
ratificationYear of
ratificationYear of
ratificationYear of
ratificationYear of
ratificationYear of
ratificationYear of
ratificationYear of
ratificationYear of
ratificationYear of
ratificationYear of
ratification
Mexico 1975 1981 1981 1981 1986 1990 1999 2002 2002 2008 2007Micronesia (Federated States of) 2004 1993 2015 2012 2016Moldova (Republic of) 1993 1993 1993 1994 1995 1993 2004 2007 2010Monaco 1995 1997 1997 2005 1991 1993 2001 2008 2017Mongolia 1969 1974 1974 1981 2002 1990 2004 2003 2015 2009Montenegro 2006 2006 2006 2006 2006 2006 2007 2006 2011 2009Morocco 1970 1979 1979 1993 1993 1993 1993 2002 2001 2013 2009Mozambique 1983 1993 1997 1999 1994 2013 2004 2003 2012Myanmar 2017 1997 1991 2012 2011Namibia 1982 1994 1994 1992 1994 1990 2002 2002 2007Nauru 2011 2012 1994 2012Nepal 1971 1991 1991 1991 1991 1990 2007 2006 2010Netherlands 1971 1978 1978 1991 1988 1995 2009 2005 2011 2016New Zealand 1972 1978 1978 1985 1989 1993 2001 2011 2008Nicaragua 1978 1980 1980 1981 2005 1990 2005 2005 2004 2007Niger 1967 1986 1986 1999 1998 1990 2009 2012 2004 2015 2008Nigeria 1967 1993 1993 1985 2001 1991 2009 2012 2010 2009 2010Norway 1970 1972 1972 1981 1986 1991 2003 2001 2013Oman 2003 2006 1996 2004 2004 2009Pakistan 1966 2010 2008 1996 2010 1990 2016 2011 2011Palau 1995 2013Palestine, State of 2014 2014 2014 2014 2014 2014 2014 2017 2014Panama 1967 1977 1977 1981 1987 1990 2001 2001 2011 2007Papua New Guinea 1982 2008 2008 1995 1993 2013Paraguay 2003 1992 1992 1987 1990 1990 2008 2002 2003 2010 2008Peru 1971 1978 1978 1982 1988 1990 2005 2002 2002 2012 2008Philippines 1967 1986 1974 1981 1986 1990 1995 2003 2002 2008Poland 1968 1977 1977 1980 1989 1991 2005 2005 2012Portugal 1982 1978 1978 1980 1989 1990 2003 2003 2014 2009Qatar 1976 2018 2018 2009 2000 1995 2002 2001 2008Romania 1970 1974 1974 1982 1990 1990 2001 2001 2011Russian Federation 1969 1973 1973 1981 1987 1990 2008 2013 2012Rwanda 1975 1975 1975 1981 2008 1991 2008 2002 2002 2008Saint Kitts and Nevis 2006 1985 1990Saint Lucia 1990 1982 1993 2014 2013Saint Vincent and the Grenadines 1981 1981 1981 1981 2001 1993 2005 2011 2005 2010Samoa 2008 1992 1994 2016 2016 2012 2016San Marino 2002 1985 1985 2003 2006 1991 2011 2011 2008Sao Tome and Principe 2017 2017 2017 2003 2017 1991 2017 2015Saudi Arabia 1997 2000 1997 1996 2011 2010 2008Senegal 1972 1978 1978 1985 1986 1990 1999 2004 2003 2008 2010Serbia 2001 2001 2001 2001 2001 2001 2003 2002 2011 2009Seychelles 1978 1992 1992 1992 1992 1990 1994 2010 2012 2017 2009Sierra Leone 1967 1996 1996 1988 2001 1990 2002 2001 2010Singapore 2017 1995 1995 2008 2013Slovakia 1993 1993 1993 1993 1993 1993 2006 2004 2014 2010Slovenia 1992 1992 1992 1992 1993 1992 2004 2004 2008Solomon Islands 1982 1982 2002 1995Somalia 1975 1990 1990 1990 2015South Africa 1998 1998 2015 1995 1998 1995 2009 2003 2007South Sudan 2015 2015 2015Spain 1968 1977 1977 1984 1987 1990 2002 2001 2009 2007Sri Lanka 1982 1980 1980 1981 1994 1991 1996 2000 2006 2016 2016Sudan 1977 1986 1986 1990 2005 2004 2009Suriname 1984 1976 1976 1993 1993 2012 2017Sweden 1971 1971 1971 1980 1986 1990 2003 2007 2008
78 | HUMAN DEVELOPMENT INDICES AND INDICATORS: 2018 STATISTICAL UPDATE
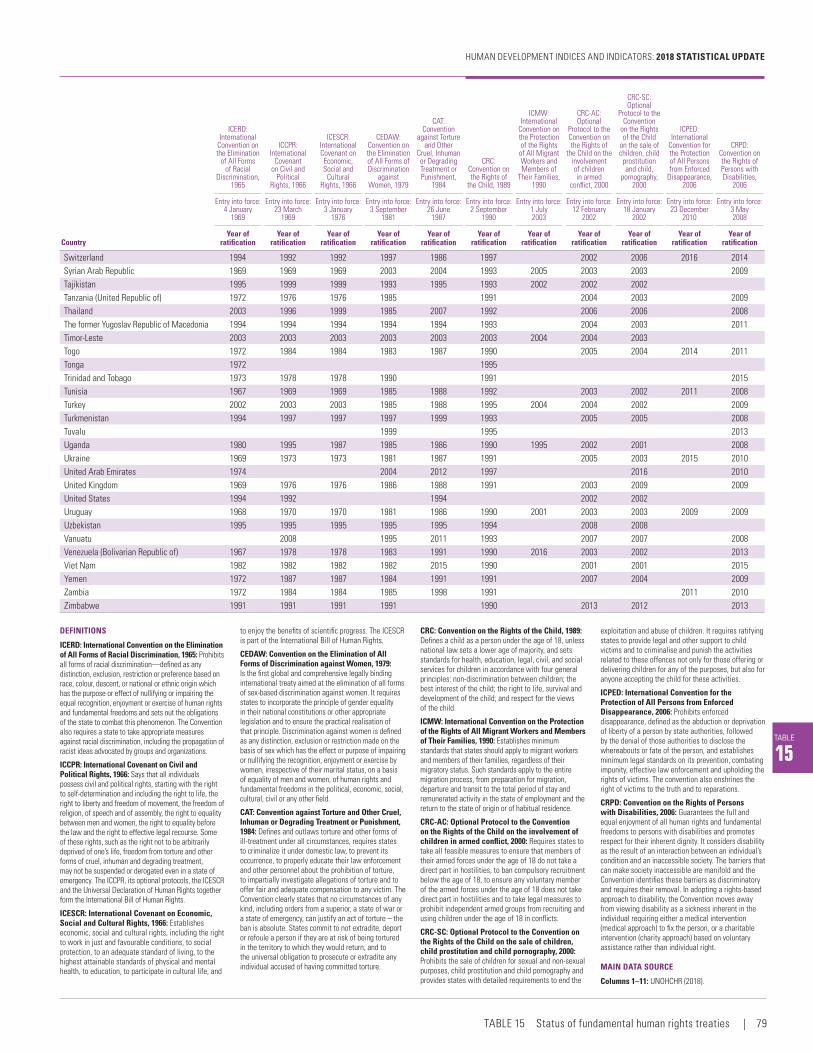
TABLE
15
ICERD: International
Convention on the Elimination
of All Forms of Racial
Discrimination, 1965
ICCPR: International
Covenant on Civil and
Political Rights, 1966
ICESCR: International Covenant on Economic, Social and
Cultural Rights, 1966
CEDAW: Convention on the Elimination of All Forms of Discrimination
against Women, 1979
CAT: Convention
against Torture and Other
Cruel, Inhuman or Degrading Treatment or Punishment,
1984
CRC: Convention on the Rights of
the Child, 1989
ICMW: International
Convention on the Protection of the Rights
of All Migrant Workers and Members of
Their Families, 1990
CRC-AC: Optional
Protocol to the Convention on the Rights of
the Child on the involvement of children in armed
conflict, 2000
CRC-SC: Optional
Protocol to the Convention
on the Rights of the Child
on the sale of children, child prostitution and child,
pornography, 2000
ICPED: International
Convention for the Protection of All Persons from Enforced
Disappearance, 2006
CRPD: Convention on the Rights of Persons with Disabilities,
2006
Entry into force: 4 January
1969
Entry into force: 23 March
1969
Entry into force: 3 January
1976
Entry into force: 3 September
1981
Entry into force: 26 June
1987
Entry into force: 2 September
1990
Entry into force: 1 July 2003
Entry into force: 12 February
2002
Entry into force: 18 January
2002
Entry into force: 23 December
2010
Entry into force: 3 May 2008
CountryYear of
ratificationYear of
ratificationYear of
ratificationYear of
ratificationYear of
ratificationYear of
ratificationYear of
ratificationYear of
ratificationYear of
ratificationYear of
ratificationYear of
ratification
Switzerland 1994 1992 1992 1997 1986 1997 2002 2006 2016 2014Syrian Arab Republic 1969 1969 1969 2003 2004 1993 2005 2003 2003 2009Tajikistan 1995 1999 1999 1993 1995 1993 2002 2002 2002Tanzania (United Republic of) 1972 1976 1976 1985 1991 2004 2003 2009Thailand 2003 1996 1999 1985 2007 1992 2006 2006 2008The former Yugoslav Republic of Macedonia 1994 1994 1994 1994 1994 1993 2004 2003 2011Timor-Leste 2003 2003 2003 2003 2003 2003 2004 2004 2003Togo 1972 1984 1984 1983 1987 1990 2005 2004 2014 2011Tonga 1972 1995Trinidad and Tobago 1973 1978 1978 1990 1991 2015Tunisia 1967 1969 1969 1985 1988 1992 2003 2002 2011 2008Turkey 2002 2003 2003 1985 1988 1995 2004 2004 2002 2009Turkmenistan 1994 1997 1997 1997 1999 1993 2005 2005 2008Tuvalu 1999 1995 2013Uganda 1980 1995 1987 1985 1986 1990 1995 2002 2001 2008Ukraine 1969 1973 1973 1981 1987 1991 2005 2003 2015 2010United Arab Emirates 1974 2004 2012 1997 2016 2010United Kingdom 1969 1976 1976 1986 1988 1991 2003 2009 2009United States 1994 1992 1994 2002 2002Uruguay 1968 1970 1970 1981 1986 1990 2001 2003 2003 2009 2009Uzbekistan 1995 1995 1995 1995 1995 1994 2008 2008Vanuatu 2008 1995 2011 1993 2007 2007 2008Venezuela (Bolivarian Republic of) 1967 1978 1978 1983 1991 1990 2016 2003 2002 2013Viet Nam 1982 1982 1982 1982 2015 1990 2001 2001 2015Yemen 1972 1987 1987 1984 1991 1991 2007 2004 2009Zambia 1972 1984 1984 1985 1998 1991 2011 2010Zimbabwe 1991 1991 1991 1991 1990 2013 2012 2013
DEFINITIONS
ICERD: International Convention on the Elimination of All Forms of Racial Discrimination, 1965: Prohibits all forms of racial discrimination—defined as any distinction, exclusion, restriction or preference based on race, colour, descent, or national or ethnic origin which has the purpose or effect of nullifying or impairing the equal recognition, enjoyment or exercise of human rights and fundamental freedoms and sets out the obligations of the state to combat this phenomenon. The Convention also requires a state to take appropriate measures against racial discrimination, including the propagation of racist ideas advocated by groups and organizations.
ICCPR: International Covenant on Civil and Political Rights, 1966: Says that all individuals possess civil and political rights, starting with the right to self-determination and including the right to life, the right to liberty and freedom of movement, the freedom of religion, of speech and of assembly, the right to equality between men and women, the right to equality before the law and the right to effective legal recourse. Some of these rights, such as the right not to be arbitrarily deprived of one’s life, freedom from torture and other forms of cruel, inhuman and degrading treatment, may not be suspended or derogated even in a state of emergency. The ICCPR, its optional protocols, the ICESCR and the Universal Declaration of Human Rights together form the International Bill of Human Rights.
ICESCR: International Covenant on Economic, Social and Cultural Rights, 1966: Establishes economic, social and cultural rights, including the right to work in just and favourable conditions, to social protection, to an adequate standard of living, to the highest attainable standards of physical and mental health, to education, to participate in cultural life, and
to enjoy the benefits of scientific progress. The ICESCR is part of the International Bill of Human Rights.
CEDAW: Convention on the Elimination of All Forms of Discrimination against Women, 1979: Is the first global and comprehensive legally binding international treaty aimed at the elimination of all forms of sex-based discrimination against women. It requires states to incorporate the principle of gender equality in their national constitutions or other appropriate legislation and to ensure the practical realisation of that principle. Discrimination against women is defined as any distinction, exclusion or restriction made on the basis of sex which has the effect or purpose of impairing or nullifying the recognition, enjoyment or exercise by women, irrespective of their marital status, on a basis of equality of men and women, of human rights and fundamental freedoms in the political, economic, social, cultural, civil or any other field.
CAT: Convention against Torture and Other Cruel, Inhuman or Degrading Treatment or Punishment, 1984: Defines and outlaws torture and other forms of ill-treatment under all circumstances, requires states to criminalize it under domestic law, to prevent its occurrence, to properly educate their law enforcement and other personnel about the prohibition of torture, to impartially investigate allegations of torture and to offer fair and adequate compensation to any victim. The Convention clearly states that no circumstances of any kind, including orders from a superior, a state of war or a state of emergency, can justify an act of torture – the ban is absolute. States commit to not extradite, deport or refoule a person if they are at risk of being tortured in the territory to which they would return, and to the universal obligation to prosecute or extradite any individual accused of having committed torture.
CRC: Convention on the Rights of the Child, 1989: Defines a child as a person under the age of 18, unless national law sets a lower age of majority, and sets standards for health, education, legal, civil, and social services for children in accordance with four general principles: non-discrimination between children; the best interest of the child; the right to life, survival and development of the child; and respect for the views of the child.
ICMW: International Convention on the Protection of the Rights of All Migrant Workers and Members of Their Families, 1990: Establishes minimum standards that states should apply to migrant workers and members of their families, regardless of their migratory status. Such standards apply to the entire migration process, from preparation for migration, departure and transit to the total period of stay and remunerated activity in the state of employment and the return to the state of origin or of habitual residence.
CRC‑AC: Optional Protocol to the Convention on the Rights of the Child on the involvement of children in armed conflict, 2000: Requires states to take all feasible measures to ensure that members of their armed forces under the age of 18 do not take a direct part in hostilities, to ban compulsory recruitment below the age of 18, to ensure any voluntary member of the armed forces under the age of 18 does not take direct part in hostilities and to take legal measures to prohibit independent armed groups from recruiting and using children under the age of 18 in conflicts.
CRC‑SC: Optional Protocol to the Convention on the Rights of the Child on the sale of children, child prostitution and child pornography, 2000: Prohibits the sale of children for sexual and non-sexual purposes, child prostitution and child pornography and provides states with detailed requirements to end the
exploitation and abuse of children. It requires ratifying states to provide legal and other support to child victims and to criminalise and punish the activities related to these offences not only for those offering or delivering children for any of the purposes, but also for anyone accepting the child for these activities.
ICPED: International Convention for the Protection of All Persons from Enforced Disappearance, 2006: Prohibits enforced disappearance, defined as the abduction or deprivation of liberty of a person by state authorities, followed by the denial of those authorities to disclose the whereabouts or fate of the person, and establishes minimum legal standards on its prevention, combating impunity, effective law enforcement and upholding the rights of victims. The convention also enshrines the right of victims to the truth and to reparations.
CRPD: Convention on the Rights of Persons with Disabilities, 2006: Guarantees the full and equal enjoyment of all human rights and fundamental freedoms to persons with disabilities and promotes respect for their inherent dignity. It considers disability as the result of an interaction between an individual’s condition and an inaccessible society. The barriers that can make society inaccessible are manifold and the Convention identifies these barriers as discriminatory and requires their removal. In adopting a rights-based approach to disability, the Convention moves away from viewing disability as a sickness inherent in the individual requiring either a medical intervention (medical approach) to fix the person, or a charitable intervention (charity approach) based on voluntary assistance rather than individual right.
MAIN DATA SOURCE
Columns 1–11: UNOHCHR (2018).
HUMAN DEVELOPMENT INDICES AND INDICATORS: 2018 STATISTICAL UPDATE
TABLE 15 Status of fundamental human rights treaties | 79

Human development dashboards
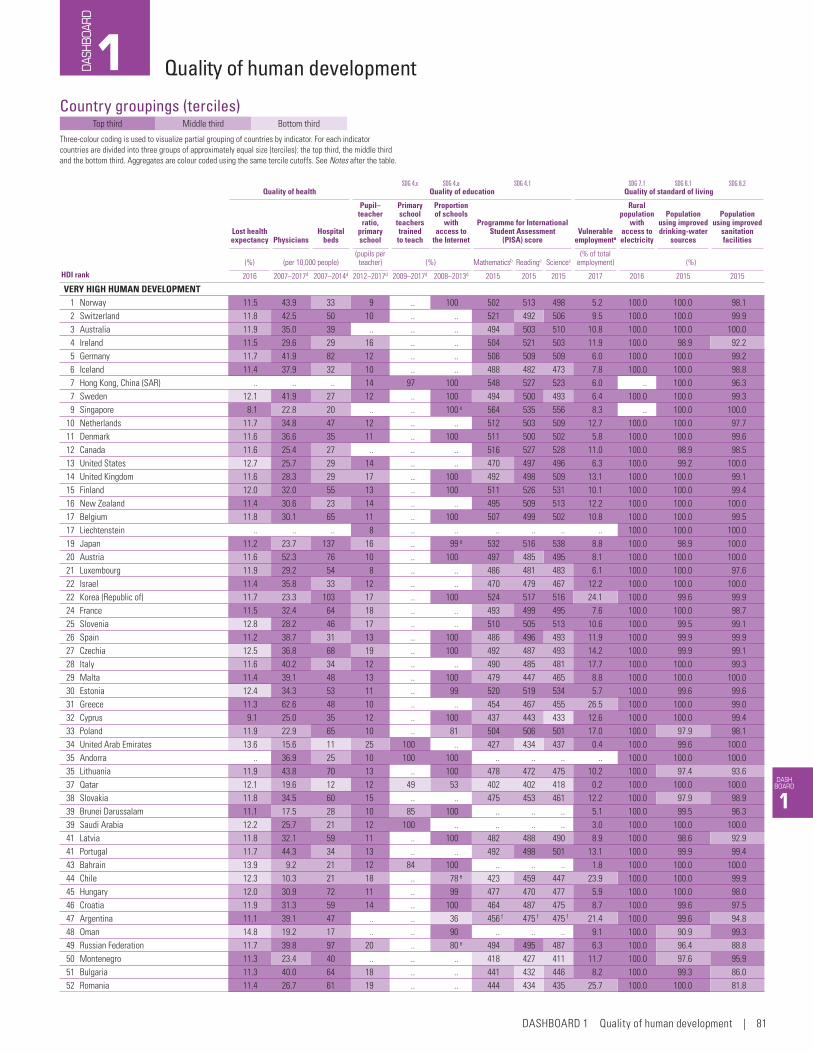
DASH BOARD
1
Country groupings (terciles)Top third Middle third Bottom third
Three-colour coding is used to visualize partial grouping of countries by indicator. For each indicator countries are divided into three groups of approximately equal size (terciles): the top third, the middle third and the bottom third. Aggregates are colour coded using the same tercile cutoffs. See Notes after the table.
1DASHBOA
RDQuality of human development
SDG 4.c SDG 4.a SDG 4.1 SDG 7.1 SDG 6.1 SDG 6.2
HDI rank
Quality of health Quality of education Quality of standard of living
Lost health expectancy Physicians
Hospital beds
Pupil– teacher
ratio, primary school
Primary school
teachers trained to teach
Proportion of schools
with access to
the Internet
Programme for International Student Assessment
(PISA) scoreVulnerable
employmenta
Rural population
with access to electricity
Population using improved drinking-water
sources
Population using improved
sanitation facilities
(%) (per 10,000 people)(pupils per teacher) (%) Mathematicsb Readingc Sciencec
(% of total employment) (%)
2016 2007–2017d 2007–2014d 2012–2017d 2009–2017d 2008–2013d 2015 2015 2015 2017 2016 2015 2015
VERY HIGH HUMAN DEVELOPMENT1 Norway 11.5 43.9 33 9 .. 100 502 513 498 5.2 100.0 100.0 98.12 Switzerland 11.8 42.5 50 10 .. .. 521 492 506 9.5 100.0 100.0 99.93 Australia 11.9 35.0 39 .. .. .. 494 503 510 10.8 100.0 100.0 100.04 Ireland 11.5 29.6 29 16 .. .. 504 521 503 11.9 100.0 98.9 92.25 Germany 11.7 41.9 82 12 .. .. 506 509 509 6.0 100.0 100.0 99.26 Iceland 11.4 37.9 32 10 .. .. 488 482 473 7.8 100.0 100.0 98.87 Hong Kong, China (SAR) .. .. .. 14 97 100 548 527 523 6.0 .. 100.0 96.37 Sweden 12.1 41.9 27 12 .. 100 494 500 493 6.4 100.0 100.0 99.39 Singapore 8.1 22.8 20 .. .. 100 e 564 535 556 8.3 .. 100.0 100.0
10 Netherlands 11.7 34.8 47 12 .. .. 512 503 509 12.7 100.0 100.0 97.711 Denmark 11.6 36.6 35 11 .. 100 511 500 502 5.8 100.0 100.0 99.612 Canada 11.6 25.4 27 .. .. .. 516 527 528 11.0 100.0 98.9 98.513 United States 12.7 25.7 29 14 .. .. 470 497 496 6.3 100.0 99.2 100.014 United Kingdom 11.6 28.3 29 17 .. 100 492 498 509 13.1 100.0 100.0 99.115 Finland 12.0 32.0 55 13 .. 100 511 526 531 10.1 100.0 100.0 99.416 New Zealand 11.4 30.6 23 14 .. .. 495 509 513 12.2 100.0 100.0 100.017 Belgium 11.8 30.1 65 11 .. 100 507 499 502 10.8 100.0 100.0 99.517 Liechtenstein .. .. .. 8 .. .. .. .. .. .. 100.0 100.0 100.019 Japan 11.2 23.7 137 16 .. 99 e 532 516 538 8.8 100.0 98.9 100.020 Austria 11.6 52.3 76 10 .. 100 497 485 495 8.1 100.0 100.0 100.021 Luxembourg 11.9 29.2 54 8 .. .. 486 481 483 6.1 100.0 100.0 97.622 Israel 11.4 35.8 33 12 .. .. 470 479 467 12.2 100.0 100.0 100.022 Korea (Republic of) 11.7 23.3 103 17 .. 100 524 517 516 24.1 100.0 99.6 99.924 France 11.5 32.4 64 18 .. .. 493 499 495 7.6 100.0 100.0 98.725 Slovenia 12.8 28.2 46 17 .. .. 510 505 513 10.6 100.0 99.5 99.126 Spain 11.2 38.7 31 13 .. 100 486 496 493 11.9 100.0 99.9 99.927 Czechia 12.5 36.8 68 19 .. 100 492 487 493 14.2 100.0 99.9 99.128 Italy 11.6 40.2 34 12 .. .. 490 485 481 17.7 100.0 100.0 99.329 Malta 11.4 39.1 48 13 .. 100 479 447 465 8.8 100.0 100.0 100.030 Estonia 12.4 34.3 53 11 .. 99 520 519 534 5.7 100.0 99.6 99.631 Greece 11.3 62.6 48 10 .. .. 454 467 455 26.5 100.0 100.0 99.032 Cyprus 9.1 25.0 35 12 .. 100 437 443 433 12.6 100.0 100.0 99.433 Poland 11.9 22.9 65 10 .. 81 504 506 501 17.0 100.0 97.9 98.134 United Arab Emirates 13.6 15.6 11 25 100 .. 427 434 437 0.4 100.0 99.6 100.035 Andorra .. 36.9 25 10 100 100 .. .. .. .. 100.0 100.0 100.035 Lithuania 11.9 43.8 70 13 .. 100 478 472 475 10.2 100.0 97.4 93.637 Qatar 12.1 19.6 12 12 49 53 402 402 418 0.2 100.0 100.0 100.038 Slovakia 11.8 34.5 60 15 .. .. 475 453 461 12.2 100.0 97.9 98.939 Brunei Darussalam 11.1 17.5 28 10 85 100 .. .. .. 5.1 100.0 99.5 96.339 Saudi Arabia 12.2 25.7 21 12 100 .. .. .. .. 3.0 100.0 100.0 100.041 Latvia 11.8 32.1 59 11 .. 100 482 488 490 8.9 100.0 98.6 92.941 Portugal 11.7 44.3 34 13 .. .. 492 498 501 13.1 100.0 99.9 99.443 Bahrain 13.9 9.2 21 12 84 100 .. .. .. 1.8 100.0 100.0 100.044 Chile 12.3 10.3 21 18 .. 78 e 423 459 447 23.9 100.0 100.0 99.945 Hungary 12.0 30.9 72 11 .. 99 477 470 477 5.9 100.0 100.0 98.046 Croatia 11.9 31.3 59 14 .. 100 464 487 475 8.7 100.0 99.6 97.547 Argentina 11.1 39.1 47 .. .. 36 456 f 475 f 475 f 21.4 100.0 99.6 94.848 Oman 14.8 19.2 17 .. .. 90 .. .. .. 9.1 100.0 90.9 99.349 Russian Federation 11.7 39.8 97 20 .. 80 e 494 495 487 6.3 100.0 96.4 88.850 Montenegro 11.3 23.4 40 .. .. .. 418 427 411 11.7 100.0 97.6 95.951 Bulgaria 11.3 40.0 64 18 .. .. 441 432 446 8.2 100.0 99.3 86.052 Romania 11.4 26.7 61 19 .. .. 444 434 435 25.7 100.0 100.0 81.8
DASHBOARD 1 Quality of human development | 81

DASHBOARD 1 QUALITY OF HUMAN DEVELOPMENT
DASH BOARD
1
SDG 4.c SDG 4.a SDG 4.1 SDG 7.1 SDG 6.1 SDG 6.2
HDI rank
Quality of health Quality of education Quality of standard of living
Lost health expectancy Physicians
Hospital beds
Pupil– teacher
ratio, primary school
Primary school
teachers trained to teach
Proportion of schools
with access to
the Internet
Programme for International Student Assessment
(PISA) scoreVulnerable
employmenta
Rural population
with access to electricity
Population using improved drinking-water
sources
Population using improved
sanitation facilities
(%) (per 10,000 people)(pupils per teacher) (%) Mathematicsb Readingc Sciencec
(% of total employment) (%)
2016 2007–2017d 2007–2014d 2012–2017d 2009–2017d 2008–2013d 2015 2015 2015 2017 2016 2015 2015
53 Belarus 11.8 40.7 113 18 99 61 e .. .. .. 2.7 100.0 98.0 94.354 Bahamas 11.7 22.6 29 19 90 .. .. .. .. 14.6 100.0 97.8 92.055 Uruguay 10.7 37.4 25 12 100 96 418 437 435 23.9 100.0 99.2 95.756 Kuwait 11.3 26.1 22 9 79 .. .. .. .. 1.9 100.0 100.0 100.057 Malaysia 11.5 15.3 19 12 100 91 .. .. .. 22.2 100.0 96.4 99.658 Barbados 11.4 18.1 62 13 69 100 e .. .. .. 15.9 100.0 98.1 96.558 Kazakhstan 10.9 32.7 72 21 100 97 .. .. .. 25.6 100.0 91.1 97.8
HIGH HUMAN DEVELOPMENT60 Iran (Islamic Republic of) 13.6 14.9 1 27 100 87 .. .. .. 41.4 100.0 94.9 88.360 Palau .. 11.9 48 .. .. .. .. .. .. .. 97.2 99.6 100.062 Seychelles 10.4 9.8 36 14 83 .. .. .. .. .. 100.0 96.3 100.063 Costa Rica 11.0 11.5 12 12 94 39 400 427 420 14.0 100.0 99.7 97.164 Turkey 13.6 17.5 25 18 .. 86 420 428 425 28.5 100.0 98.9 96.465 Mauritius 12.0 20.0 34 18 100 85 .. .. .. 16.2 100.0 99.9 93.166 Panama 11.0 15.9 22 22 99 22 .. .. .. 32.2 81.3 95.0 76.967 Serbia 11.7 24.6 54 15 56 .. .. .. .. 28.1 100.0 91.2 94.668 Albania 10.8 12.9 26 18 .. 96 413 405 427 57.2 100.0 91.4 97.769 Trinidad and Tobago 11.9 18.2 27 .. 88 56 e 417 427 425 16.5 100.0 96.9 92.170 Antigua and Barbuda 10.7 .. 21 14 65 88 .. .. .. .. 96.5 96.7 87.570 Georgia 10.6 47.8 26 9 95 100 404 401 411 57.0 100.0 93.3 84.972 Saint Kitts and Nevis .. .. 23 14 72 100 .. .. .. .. 100.0 .. ..73 Cuba 11.6 75.2 53 9 100 .. .. .. .. 10.3 100.0 95.2 90.874 Mexico 11.6 22.3 15 27 97 12 e,g 408 423 416 27.2 100.0 98.3 89.275 Grenada 11.8 .. 35 15 63 61 .. .. .. .. 92.3 95.6 78.376 Sri Lanka 11.2 8.8 36 23 70 18 .. .. .. 40.1 94.6 92.3 94.277 Bosnia and Herzegovina 13.1 18.9 35 17 .. 100 .. .. .. 20.9 100.0 97.7 94.878 Venezuela (Bolivarian Republic of) 10.8 .. 9 .. .. .. .. .. .. 31.9 96.4 97.4 94.979 Brazil 12.1 18.5 23 22 .. 46 377 407 401 27.9 100.0 97.5 86.180 Azerbaijan 11.2 34.0 47 15 90 27 e .. .. .. 56.1 100.0 84.4 89.380 Lebanon 13.4 23.8 35 12 .. .. 396 347 386 25.6 100.0 92.3 95.480 The former Yugoslav Republic of Macedonia 11.5 28.8 45 14 .. .. 371 352 384 22.8 100.0 96.8 90.983 Armenia 11.4 28.0 39 .. .. 100 .. .. .. 41.6 100.0 98.9 91.683 Thailand 11.5 4.7 21 17 100 98 415 409 421 50.2 100.0 98.2 95.085 Algeria 14.2 12.1 17 24 100 53 360 350 376 27.9 99.0 93.5 87.586 China 10.1 36.3 38 17 .. .. 531 h 494 h 518 h 33.0 100.0 95.8 75.086 Ecuador 11.3 16.7 16 25 82 22 .. .. .. 45.6 99.8 92.6 86.188 Ukraine 11.7 30.0 90 13 86 .. .. .. .. 15.6 100.0 97.7 95.989 Peru 11.1 11.2 15 18 .. .. 387 398 397 50.3 75.6 89.9 76.890 Colombia 10.7 18.2 15 24 95 71 e 390 425 416 47.1 95.7 96.5 84.490 Saint Lucia 12.1 1.0 16 15 79 100 .. .. .. 29.1 98.4 98.2 90.992 Fiji 12.3 8.4 21 28 100 .. .. .. .. 38.4 98.0 93.7 95.792 Mongolia 11.3 32.6 68 30 100 91 .. .. .. 46.9 44.2 83.2 59.294 Dominican Republic 11.2 14.9 17 19 85 5 e 328 358 332 40.9 100.0 94.5 82.795 Jordan 10.6 34.3 18 18 100 85 380 408 409 9.5 100.0 98.6 96.795 Tunisia 12.8 12.9 21 16 100 81 367 361 386 20.8 100.0 94.2 93.197 Jamaica 12.0 4.7 17 26 100 93 e,i .. .. .. 37.9 96.0 92.9 85.498 Tonga 12.5 5.6 26 22 97 .. .. .. .. 54.5 96.6 99.9 93.599 Saint Vincent and the Grenadines 11.9 .. 52 15 84 68 .. .. .. 9.1 100.0 95.1 87.2
100 Suriname 12.0 .. 31 14 100 6 i,j .. .. .. 13.6 69.3 94.7 79.2101 Botswana 13.1 3.8 18 23 99 23 .. .. .. 15.0 37.5 79.2 60.0101 Maldives 11.0 36.1 43 10 83 100 e .. .. .. 20.7 100.0 97.9 95.9103 Dominica .. .. 38 13 66 71 .. .. .. .. 100.0 96.5 77.9104 Samoa 12.2 3.4 10 .. .. .. .. .. .. 32.0 100.0 95.5 96.6105 Uzbekistan 10.7 24.5 44 21 99 .. .. .. .. 24.7 100.0 .. 100.0106 Belize 11.3 8.3 11 21 73 .. .. .. .. 26.8 88.4 97.1 87.2106 Marshall Islands .. 4.6 27 .. .. .. .. .. .. .. 89.1 78.2 86.9108 Libya 13.4 20.9 37 .. .. .. .. .. .. 36.0 96.4 96.8 99.7108 Turkmenistan 10.0 22.9 40 .. .. .. .. .. .. 21.1 100.0 94.5 96.6110 Gabon 11.5 4.1 63 .. .. .. .. .. .. 32.2 55.0 87.5 40.9
82 | HUMAN DEVELOPMENT INDICES AND INDICATORS: 2018 STATISTICAL UPDATE

DASH BOARD
1
SDG 4.c SDG 4.a SDG 4.1 SDG 7.1 SDG 6.1 SDG 6.2
HDI rank
Quality of health Quality of education Quality of standard of living
Lost health expectancy Physicians
Hospital beds
Pupil– teacher
ratio, primary school
Primary school
teachers trained to teach
Proportion of schools
with access to
the Internet
Programme for International Student Assessment
(PISA) scoreVulnerable
employmenta
Rural population
with access to electricity
Population using improved drinking-water
sources
Population using improved
sanitation facilities
(%) (per 10,000 people)(pupils per teacher) (%) Mathematicsb Readingc Sciencec
(% of total employment) (%)
2016 2007–2017d 2007–2014d 2012–2017d 2009–2017d 2008–2013d 2015 2015 2015 2017 2016 2015 2015
110 Paraguay 12.0 12.9 13 24 92 9 .. .. .. 39.1 96.1 98.9 91.2112 Moldova (Republic of) 11.1 32.0 62 17 99 .. 420 416 428 28.7 100.0 86.7 78.4MEDIUM HUMAN DEVELOPMENT113 Philippines 11.0 .. 10 30 100 12 e,k .. .. .. 35.4 86.3 90.5 75.0113 South Africa 12.4 8.2 28 30 .. .. .. .. .. 9.6 67.9 84.7 73.1115 Egypt 13.3 8.1 5 23 74 49 .. .. .. 20.1 100.0 98.4 93.2116 Indonesia 11.0 2.0 9 14 .. 42 k 386 397 403 47.5 94.8 89.5 67.9116 Viet Nam 11.5 8.2 20 20 100 .. 495 487 525 55.9 100.0 91.2 78.2118 Bolivia (Plurinational State of) 11.9 4.7 11 18 58 .. .. .. .. 31.3 79.1 92.9 52.6119 Palestine, State of .. .. .. 24 100 30 l .. .. .. 39.9 100.0 87.6 96.0120 Iraq 15.5 8.5 13 .. .. .. .. .. .. 35.2 100.0 86.1 85.7121 El Salvador 11.1 16.0 11 28 96 24 .. .. .. 35.7 98.8 93.0 91.1122 Kyrgyzstan 11.0 18.5 48 25 21 6 .. .. .. 36.5 100.0 87.3 96.6123 Morocco 14.1 6.2 9 27 100 3 .. .. .. 50.7 100.0 83.0 83.5124 Nicaragua 11.4 9.1 9 .. 75 6 k .. .. .. 39.4 56.6 82.3 76.3125 Cabo Verde 11.8 7.9 21 21 93 .. .. .. .. 37.5 91.8 86.5 65.2125 Guyana 11.9 2.1 20 23 70 4 e,k .. .. .. 29.7 81.9 95.1 86.2127 Guatemala 12.3 9.0 6 22 .. .. .. .. .. 34.7 86.4 93.6 67.4127 Tajikistan 10.4 17.1 55 22 100 .. .. .. .. 47.5 100.0 74.1 95.5129 Namibia 12.2 3.7 27 .. 96 .. .. .. .. 25.3 28.7 78.8 33.8130 India 13.9 7.6 7 35 70 .. .. .. .. 77.5 77.6 87.6 44.2131 Micronesia (Federated States of) 12.3 1.8 32 20 .. .. .. .. .. .. 70.7 88.4 ..132 Timor-Leste 13.8 0.8 59 .. .. .. .. .. .. 49.4 49.2 70.2 44.0133 Honduras 11.2 .. 7 28 .. .. .. .. .. 36.1 72.2 92.2 79.8134 Bhutan 14.1 3.8 18 38 100 43 e .. .. .. 71.5 100.0 97.6 62.9134 Kiribati 12.6 2.0 13 26 73 .. .. .. .. .. 82.2 64.4 39.8136 Bangladesh 12.9 4.7 6 34 50 5 e .. .. .. 57.5 68.9 97.3 46.9137 Congo 11.8 1.0 16 44 80 .. .. .. .. 74.9 22.6 68.3 15.0138 Vanuatu 12.9 1.9 17 27 28 .. .. .. .. 73.5 46.4 90.5 53.5139 Lao People’s Democratic Republic 12.1 4.9 15 23 97 .. .. .. .. 82.9 80.3 80.4 72.6140 Ghana 11.1 1.0 9 27 55 .. .. .. .. 66.1 66.6 77.8 14.3141 Equatorial Guinea 9.7 .. 21 23 37 .. .. .. .. 35.7 52.6 49.6 74.5142 Kenya 11.7 2.0 14 31 97 .. .. .. .. 54.3 39.3 58.5 29.8143 Sao Tome and Principe 11.7 .. 29 31 27 .. .. .. .. 34.1 51.1 79.7 40.1144 Eswatini (Kingdom of) 13.1 1.5 21 28 82 .. .. .. .. 19.1 61.2 67.6 58.0144 Zambia 12.8 0.9 20 48 93 .. .. .. .. 77.6 2.7 61.2 31.1146 Cambodia 12.4 1.4 7 43 100 7 e .. .. .. 51.0 36.5 75.0 48.8147 Angola 10.9 1.4 8 .. 47 .. .. .. .. 66.7 16.0 41.0 39.4148 Myanmar 12.6 5.7 6 22 98 .. .. .. .. 58.2 39.8 67.5 64.7149 Nepal 12.7 6.0 50 21 97 5 .. .. .. 78.9 85.2 87.7 46.1150 Pakistan 13.2 9.8 6 48 75 .. .. .. .. 59.7 98.8 88.5 58.3151 Cameroon 12.1 0.8 13 43 59 .. .. .. .. 71.7 21.3 65.3 38.8LOW HUMAN DEVELOPMENT152 Solomon Islands 12.9 1.9 13 25 66 .. .. .. .. 62.7 41.5 64.0 31.3153 Papua New Guinea 11.9 0.6 .. 45 100 .. .. .. .. 74.7 15.5 36.6 18.6154 Tanzania (United Republic of) 11.6 0.2 7 43 99 .. .. .. .. 83.5 16.9 50.1 23.5155 Syrian Arab Republic 12.6 15.5 15 .. .. .. .. .. .. 35.6 100.0 96.7 92.9156 Zimbabwe 11.4 0.8 17 36 86 .. .. .. .. 65.7 15.6 66.6 38.6157 Nigeria 11.3 4.0 5 .. 66 .. .. .. .. 80.4 41.1 67.3 32.6158 Rwanda 11.9 0.6 16 58 90 .. .. .. .. 80.0 17.8 56.7 62.3159 Lesotho 11.9 .. 13 34 83 10 .. .. .. 59.0 15.7 71.6 43.8159 Mauritania 11.8 0.7 4 36 85 .. .. .. .. 45.0 2.3 m 69.6 44.6161 Madagascar 11.8 1.4 2 41 15 .. .. .. .. 85.4 17.3 50.6 9.7162 Uganda 12.2 0.9 5 43 .. .. .. .. .. 74.5 18.0 38.9 19.2163 Benin 12.5 1.5 5 45 69 .. .. .. .. 88.0 18.0 67.0 13.9164 Senegal 12.0 0.7 3 32 70 5 .. .. .. 44.3 38.3 75.2 48.4165 Comoros 11.5 .. 22 28 75 .. .. .. .. 63.9 72.2 83.7 34.2165 Togo 11.0 0.5 7 41 73 .. .. .. .. 80.3 19.4 62.8 13.9167 Sudan 14.4 30.6 8 .. 60 4 .. .. .. 40.5 22.2 58.9 34.6
HUMAN DEVELOPMENT INDICES AND INDICATORS: 2018 STATISTICAL UPDATE
DASHBOARD 1 Quality of human development | 83

DASHBOARD 1 QUALITY OF HUMAN DEVELOPMENT
DASH BOARD
1
SDG 4.c SDG 4.a SDG 4.1 SDG 7.1 SDG 6.1 SDG 6.2
HDI rank
Quality of health Quality of education Quality of standard of living
Lost health expectancy Physicians
Hospital beds
Pupil– teacher
ratio, primary school
Primary school
teachers trained to teach
Proportion of schools
with access to
the Internet
Programme for International Student Assessment
(PISA) scoreVulnerable
employmenta
Rural population
with access to electricity
Population using improved drinking-water
sources
Population using improved
sanitation facilities
(%) (per 10,000 people)(pupils per teacher) (%) Mathematicsb Readingc Sciencec
(% of total employment) (%)
2016 2007–2017d 2007–2014d 2012–2017d 2009–2017d 2008–2013d 2015 2015 2015 2017 2016 2015 2015
168 Afghanistan 15.5 3.0 5 44 .. .. .. .. .. 66.1 79.0 63.0 39.2168 Haiti 12.9 .. 13 .. .. .. .. .. .. 87.5 0.5 n 64.2 30.5170 Côte d’Ivoire 11.6 1.4 4 43 100 .. .. .. .. 73.3 38.1 73.1 29.9171 Malawi 12.5 0.2 13 70 91 .. .. .. .. 59.9 4.0 67.2 43.5172 Djibouti 11.3 2.3 14 30 100 .. .. .. .. 39.1 2.0 o 76.9 51.4173 Ethiopia 12.2 0.2 63 .. 85 2 .. .. .. 88.2 26.5 39.1 7.1174 Gambia 12.1 1.1 11 39 88 .. .. .. .. 71.2 15.5 80.1 41.7175 Guinea 12.8 0.8 3 46 75 .. .. .. .. 90.1 6.9 67.4 22.0176 Congo (Democratic Republic of the) 13.2 0.9 8 33 95 .. .. .. .. 53.5 0.4 m 41.8 19.7177 Guinea-Bissau 13.5 0.5 10 .. 39 .. .. .. .. 65.3 4.0 m 69.2 21.5178 Yemen 15.7 3.1 7 27 .. .. .. .. .. 43.6 57.7 70.4 59.7179 Eritrea 11.6 .. 7 43 61 .. .. .. .. 46.3 39.3 19.3 11.3180 Mozambique 13.2 0.6 7 55 93 .. .. .. .. 84.6 5.0 47.3 23.6181 Liberia 13.3 0.2 8 30 47 .. .. .. .. 77.7 1.3 69.9 16.9182 Mali 12.6 0.9 1 39 52 .. .. .. .. 87.9 1.8 74.3 31.3183 Burkina Faso 12.2 0.5 4 42 73 .. .. .. .. 87.2 0.8 53.9 22.5184 Sierra Leone 10.3 0.2 4 37 54 .. .. .. .. 87.7 2.5 58.1 14.5185 Burundi 12.5 .. 19 50 100 .. .. .. .. 92.4 1.7 55.9 50.5186 Chad 13.0 0.4 4 57 65 .. .. .. .. 91.5 2.2 42.5 9.5187 South Sudan 13.6 .. .. 47 44 .. .. .. .. 49.7 5.9 50.4 10.4188 Central African Republic 15.3 0.5 10 83 58 .. .. .. .. 67.5 0.4 54.1 25.1189 Niger 12.1 0.2 3 36 56 .. .. .. .. 88.5 4.7 45.8 12.9OTHER COUNTRIES OR TERRITORIES
.. Korea (Democratic People’s Rep. of) 10.2 35.1 132 21 .. .. .. .. .. 66.0 39.2 99.6 77.1
.. Monaco .. 66.5 138 14 .. .. .. .. .. .. .. 100.0 100.0
.. Nauru .. 13.9 50 40 100 .. .. .. .. .. .. 100.0 65.6
.. San Marino .. 63.6 38 6 .. .. .. .. .. .. 100.0 100.0 100.0
.. Somalia 9.7 0.3 .. .. .. .. .. .. .. 72.3 11.6 40.0 16.2
.. Tuvalu .. 10.9 .. 13 .. .. .. .. .. .. 98.5 99.3 91.4Human development groups
Very high human development 11.8 30.8 58 14 .. — — — — 10.4 100.0 99.0 97.9High human development 10.9 29.2 32 18 .. — — — — 33.1 99.4 96.0 81.0Medium human development 13.0 6.7 9 29 75 — — — — 63.2 78.9 86.9 54.1Low human development 12.5 3.2 13 41 80 — — — — 75.1 24.4 56.6 27.6
Developing countries 12.0 15.6 20 25 .. — — — — 50.0 74.4 86.1 61.7Regions
Arab States 13.6 13.5 12 20 89 — — — — 26.3 78.9 87.1 81.2East Asia and the Pacific 10.5 27.5 31 17 .. — — — — 37.9 94.0 93.5 74.6Europe and Central Asia 12.0 24.7 51 18 .. — — — — 26.8 100.0 95.0 95.8Latin America and the Caribbean 11.6 20.4 20 22 .. — — — — 32.3 90.5 96.2 85.6South Asia 13.7 7.8 8 35 71 — — — — 72.1 79.8 88.4 48.3Sub-Saharan Africa 12.0 1.9 15 39 79 — — — — 72.2 23.2 57.7 28.1
Least developed countries 12.7 3.2 14 37 76 — — — — 70.5 31.2 61.5 32.0Small island developing states 12.0 25.7 27 19 92 — — — — 46.9 47.9 78.6 61.6Organisation for Economic Co-operation and Development 12.0 28.5 50 16 .. — — — — 12.7 100.0 99.3 98.2World 12.0 18.3 27 23 .. — — — — 42.6 76.3 88.3 67.7
84 | HUMAN DEVELOPMENT INDICES AND INDICATORS: 2018 STATISTICAL UPDATE
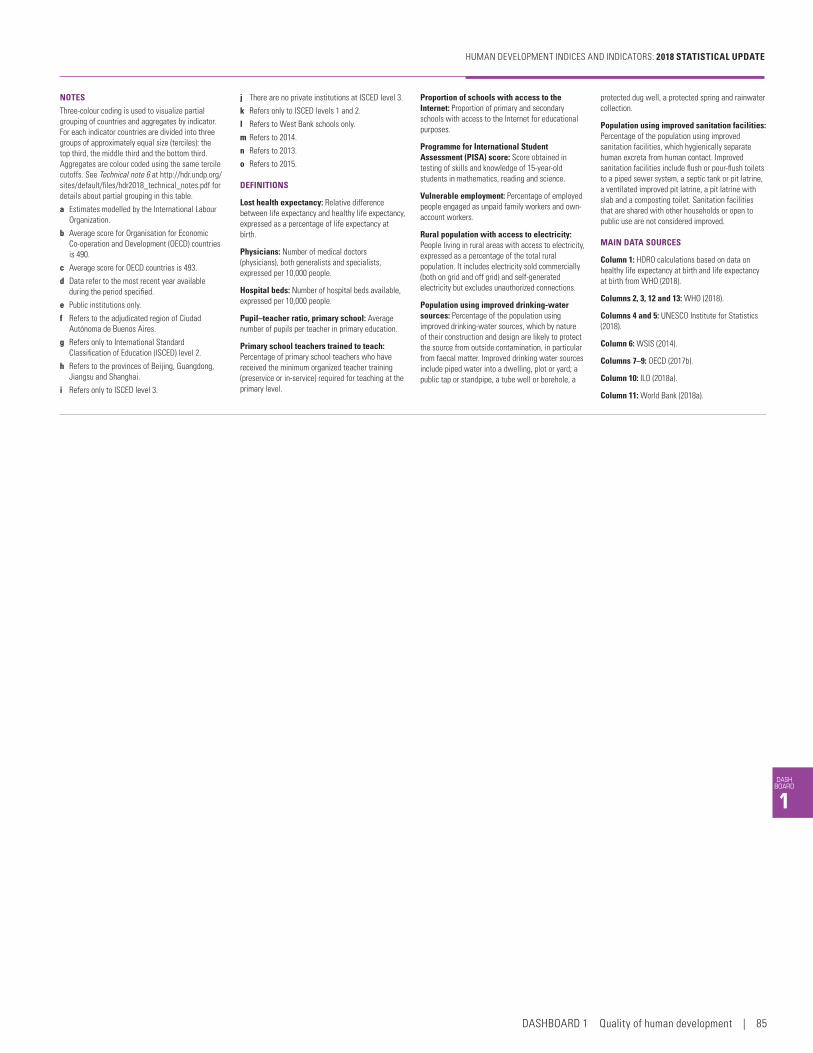
DASH BOARD
1
NOTES
Three-colour coding is used to visualize partial grouping of countries and aggregates by indicator. For each indicator countries are divided into three groups of approximately equal size (terciles): the top third, the middle third and the bottom third. Aggregates are colour coded using the same tercile cutoffs. See Technical note 6 at http://hdr.undp.org/sites/default/files/hdr2018_technical_notes.pdf for details about partial grouping in this table.
a Estimates modelled by the International Labour Organization.
b Average score for Organisation for Economic Co-operation and Development (OECD) countries is 490.
c Average score for OECD countries is 493.
d Data refer to the most recent year available during the period specified.
e Public institutions only.
f Refers to the adjudicated region of Ciudad Autónoma de Buenos Aires.
g Refers only to International Standard Classification of Education (ISCED) level 2.
h Refers to the provinces of Beijing, Guangdong, Jiangsu and Shanghai.
i Refers only to ISCED level 3.
j There are no private institutions at ISCED level 3.
k Refers only to ISCED levels 1 and 2.
l Refers to West Bank schools only.
m Refers to 2014.
n Refers to 2013.
o Refers to 2015.
DEFINITIONS
Lost health expectancy: Relative difference between life expectancy and healthy life expectancy, expressed as a percentage of life expectancy at birth.
Physicians: Number of medical doctors (physicians), both generalists and specialists, expressed per 10,000 people.
Hospital beds: Number of hospital beds available, expressed per 10,000 people.
Pupil–teacher ratio, primary school: Average number of pupils per teacher in primary education.
Primary school teachers trained to teach: Percentage of primary school teachers who have received the minimum organized teacher training (preservice or in-service) required for teaching at the primary level.
Proportion of schools with access to the Internet: Proportion of primary and secondary schools with access to the Internet for educational purposes.
Programme for International Student Assessment (PISA) score: Score obtained in testing of skills and knowledge of 15-year-old students in mathematics, reading and science.
Vulnerable employment: Percentage of employed people engaged as unpaid family workers and own-account workers.
Rural population with access to electricity: People living in rural areas with access to electricity, expressed as a percentage of the total rural population. It includes electricity sold commercially (both on grid and off grid) and self-generated electricity but excludes unauthorized connections.
Population using improved drinking-water sources: Percentage of the population using improved drinking-water sources, which by nature of their construction and design are likely to protect the source from outside contamination, in particular from faecal matter. Improved drinking water sources include piped water into a dwelling, plot or yard; a public tap or standpipe, a tube well or borehole, a
protected dug well, a protected spring and rainwater collection.
Population using improved sanitation facilities: Percentage of the population using improved sanitation facilities, which hygienically separate human excreta from human contact. Improved sanitation facilities include flush or pour-flush toilets to a piped sewer system, a septic tank or pit latrine, a ventilated improved pit latrine, a pit latrine with slab and a composting toilet. Sanitation facilities that are shared with other households or open to public use are not considered improved.
MAIN DATA SOURCES
Column 1: HDRO calculations based on data on healthy life expectancy at birth and life expectancy at birth from WHO (2018).
Columns 2, 3, 12 and 13: WHO (2018).
Columns 4 and 5: UNESCO Institute for Statistics (2018).
Column 6: WSIS (2014).
Columns 7–9: OECD (2017b).
Column 10: ILO (2018a).
Column 11: World Bank (2018a).
HUMAN DEVELOPMENT INDICES AND INDICATORS: 2018 STATISTICAL UPDATE
DASHBOARD 1 Quality of human development | 85

DASH BOARD
2
Country groupings (terciles)Top third Middle third Bottom third
Three-colour coding is used to visualize partial grouping of countries by indicator. For each indicator countries are divided into three groups of approximately equal size (terciles): the top third, the middle third and the bottom third. Aggregates are colour coded using the same tercile cutoffs. See Notes after the table.
Life-course gender gap2DASHBOA
RD
SDG 4.2 SDG 4.1 SDG 4.1 SDG 8.5 SDG 4.6 SDG 8.5 SDG 8.3 SDG 5.5 SDG 5.4 SDG 1.3
HDI rank
Childhood and youth Adulthood Older age
Sex ratio at birtha
Gross enrolment ratioYouth
unemployment rate
Population with at least some
secondary education
Total unemployment
rate
Share of employment in nonagriculture,
female
Share of seats in
parliament
Time spent on unpaid domestic chores and care work
Old-age pension
recipients(female to male ratio)
Women ages 15 and older
(male to female births) Pre-primary Primary Secondary
(female to male ratio)
(female to male ratio)
(female to male ratio)
(% of total employment in nonagriculture)
(% held by women)
(% of 24-hour day)
(female to male ratio)
(female to male ratio)
2015–2020b 2012–2017c 2012–2017c 2012–2017c 2017 2010–2017c 2017 2017 2017 2007–2017c 2007–2017c 2008–2015c
VERY HIGH HUMAN DEVELOPMENT1 Norway 1.06 1.00 1.00 0.97 0.86 1.01 0.73 48.0 41.4 15.3 1.2 1.002 Switzerland 1.05 0.99 0.99 0.96 0.98 0.99 1.04 46.8 29.3 16.8 1.6 1.003 Australia 1.06 0.96 1.00 0.87 0.91 1.00 1.04 46.6 32.7 .. .. ..4 Ireland 1.06 1.00 1.00 1.02 0.87 1.05 0.73 47.4 24.3 .. .. ..5 Germany 1.06 0.99 0.99 0.95 0.90 0.99 0.85 46.8 31.5 15.9 d 1.6 d 1.006 Iceland 1.05 1.01 1.00 1.01 0.95 1.00 1.04 47.9 38.1 .. .. ..7 Hong Kong, China (SAR) 1.07 0.99 0.98 0.97 0.88 0.92 0.83 49.2 .. 10.8 3.3 ..7 Sweden 1.06 1.00 1.04 1.14 0.92 1.00 0.90 48.3 43.6 16.0 1.3 1.009 Singapore 1.07 .. 1.00 0.99 1.35 0.92 1.05 45.0 23.0 .. .. ..
10 Netherlands 1.05 1.00 1.00 1.02 0.96 0.96 1.18 46.3 35.6 14.7 e 1.6 e 1.0011 Denmark 1.06 0.99 0.99 1.03 0.92 0.99 1.15 47.9 37.4 15.6 e 1.4 e 1.0012 Canada 1.06 .. 1.00 1.01 0.89 1.00 0.80 48.0 30.1 14.6 1.5 1.0013 United States 1.05 0.98 1.00 1.01 0.91 1.00 0.98 46.2 19.7 15.9 1.6 1.0014 United Kingdom 1.05 0.96 1.00 1.03 0.88 0.97 0.95 46.8 28.5 12.7 1.8 1.0015 Finland 1.05 1.00 1.00 1.10 0.93 1.00 0.96 49.0 42.0 14.5 d 1.5 d 1.0016 New Zealand 1.06 1.01 1.01 1.06 1.02 1.00 1.18 48.3 38.3 18.1 f 1.7 f 1.0017 Belgium 1.05 0.99 1.00 1.14 0.93 0.95 0.93 46.3 41.4 15.9 f 1.6 f 1.0017 Liechtenstein .. 1.06 0.96 0.78 .. .. .. .. 12.0 .. .. ..19 Japan 1.06 .. 1.00 1.01 0.90 1.03 0.87 43.5 13.7 14.4 d 4.7 d ..20 Austria 1.06 1.00 0.99 0.96 0.94 1.00 0.86 47.2 33.6 18.3 d 1.9 d 1.0021 Luxembourg 1.05 0.97 1.00 1.04 0.96 1.00 1.09 45.3 28.3 14.4 d 2.0 d 1.0022 Israel 1.05 1.00 1.01 1.02 1.05 0.97 1.05 47.3 27.5 .. .. ..22 Korea (Republic of) 1.07 1.00 1.00 1.00 0.97 0.94 0.92 42.0 17.0 14.0 d 4.2 d ..24 France 1.05 1.01 1.00 1.01 0.99 0.94 0.96 47.7 35.4 15.8 1.7 1.0025 Slovenia 1.05 0.98 1.00 1.00 0.98 0.98 1.16 46.8 28.7 .. .. 1.0026 Spain 1.06 1.00 1.01 1.01 1.01 0.93 1.18 46.5 38.6 19.0 e 2.2 e 1.0027 Czechia 1.06 0.97 1.00 1.01 1.06 1.00 1.38 44.7 21.1 .. .. 1.0028 Italy 1.06 0.98 0.99 0.98 1.04 0.91 1.19 42.1 30.1 20.4 2.4 1.0029 Malta 1.06 1.03 1.04 1.04 0.98 0.89 1.18 39.0 11.9 .. .. ..30 Estonia 1.06 0.97 1.00 1.00 0.85 1.00 0.82 49.8 26.7 17.2 d 1.6 d ..31 Greece 1.07 1.01 0.99 0.93 1.08 0.89 1.43 41.9 18.3 17.5 d 2.6 d 0.5532 Cyprus 1.07 0.99 1.00 0.99 1.11 0.95 1.06 47.3 17.9 .. .. ..33 Poland 1.06 0.97 1.01 0.97 1.02 0.93 1.02 45.6 25.5 17.6 d 1.8 d 1.0034 United Arab Emirates 1.05 1.08 0.97 0.94 1.21 1.20 3.38 12.1 22.5 .. .. ..35 Andorra .. .. .. .. .. 0.98 .. .. 32.1 .. .. ..35 Lithuania 1.05 0.99 1.00 0.95 0.91 0.95 0.73 52.6 21.3 .. .. 1.0037 Qatar 1.05 1.03 0.99 1.17 2.50 1.04 7.00 14.2 9.8 8.2 3.7 0.3638 Slovakia 1.05 0.98 0.99 1.01 1.12 0.99 1.22 45.8 20.0 .. .. 1.0039 Brunei Darussalam 1.06 1.02 0.99 1.01 1.09 0.98 1.30 42.4 9.1 .. .. ..39 Saudi Arabia 1.03 0.99 0.98 0.77 1.29 0.90 5.29 14.9 19.9 .. .. ..41 Latvia 1.06 0.98 0.99 0.99 0.81 1.00 0.77 52.2 16.0 .. .. 1.0041 Portugal 1.06 0.98 0.96 0.97 1.04 0.97 1.03 49.9 34.8 17.8 1.7 1.0043 Bahrain 1.04 0.99 1.02 1.01 2.00 1.12 8.60 20.6 15.0 .. .. ..44 Chile 1.04 0.98 0.97 1.01 1.09 0.98 1.15 43.1 15.8 g 22.1 f 2.2 f ..45 Hungary 1.06 0.96 1.00 1.00 1.00 0.98 1.00 46.8 10.1 16.6 d 2.2 d 1.0046 Croatia 1.06 0.96 1.01 1.05 1.00 0.98 1.10 47.1 18.5 .. .. 0.5247 Argentina 1.04 1.01 1.00 1.06 1.17 1.05 1.49 40.1 38.9 23.4 2.5 ..48 Oman 1.05 1.05 1.03 0.94 1.22 1.15 2.30 11.2 8.8 18.9 2.5 ..49 Russian Federation 1.05 0.98 1.01 0.99 0.99 1.01 0.91 49.7 16.1 18.4 2.3 ..
86 | HUMAN DEVELOPMENT INDICES AND INDICATORS: 2018 STATISTICAL UPDATE

DASH BOARD
2
SDG 4.2 SDG 4.1 SDG 4.1 SDG 8.5 SDG 4.6 SDG 8.5 SDG 8.3 SDG 5.5 SDG 5.4 SDG 1.3
HDI rank
Childhood and youth Adulthood Older age
Sex ratio at birtha
Gross enrolment ratioYouth
unemployment rate
Population with at least some
secondary education
Total unemployment
rate
Share of employment in nonagriculture,
female
Share of seats in
parliament
Time spent on unpaid domestic chores and care work
Old-age pension
recipients(female to male ratio)
Women ages 15 and older
(male to female births) Pre-primary Primary Secondary
(female to male ratio)
(female to male ratio)
(female to male ratio)
(% of total employment in nonagriculture)
(% held by women)
(% of 24-hour day)
(female to male ratio)
(female to male ratio)
2015–2020b 2012–2017c 2012–2017c 2012–2017c 2017 2010–2017c 2017 2017 2017 2007–2017c 2007–2017c 2008–2015c
50 Montenegro 1.06 0.92 0.97 1.00 0.98 0.90 0.92 44.6 23.5 .. .. ..51 Bulgaria 1.06 0.99 0.99 0.97 0.99 0.98 0.87 47.8 23.8 18.5 e 2.0 e 1.0052 Romania 1.06 1.00 0.99 0.99 1.04 0.93 0.76 43.9 18.7 19.0 d 2.0 d 1.0053 Belarus 1.06 0.96 1.00 0.98 1.10 0.94 1.00 51.5 33.1 19.2 d 2.0 d ..54 Bahamas 1.06 1.07 1.05 1.06 1.18 1.00 1.20 48.0 21.8 .. .. ..55 Uruguay 1.05 1.01 0.98 .. 1.18 1.07 1.52 46.6 22.3 19.9 2.4 1.0456 Kuwait 1.05 1.03 1.04 1.08 1.31 1.11 1.56 29.0 3.1 .. .. ..57 Malaysia 1.06 1.06 1.01 1.06 1.07 0.97 1.26 39.8 13.1 .. .. ..58 Barbados 1.04 0.96 1.01 1.05 1.07 1.03 1.09 50.0 19.6 .. .. ..58 Kazakhstan 1.06 1.01 1.02 1.01 1.04 0.99 1.33 48.7 22.1 17.1 d 2.2 d ..
HIGH HUMAN DEVELOPMENT 60 Iran (Islamic Republic of) 1.05 0.97 1.05 1.00 1.14 0.93 1.95 16.3 5.9 21.0 4.0 ..60 Palau .. 1.09 0.96 1.05 .. 1.00 .. .. 13.8 .. .. ..62 Seychelles 1.06 1.04 0.99 1.07 .. .. .. .. 21.2 .. .. 1.0063 Costa Rica 1.05 1.00 1.01 1.05 1.25 1.04 1.59 40.6 35.1 21.3 f 2.6 f 0.7564 Turkey 1.05 0.94 0.99 0.97 1.16 0.68 1.47 27.5 14.6 19.2 5.2 ..65 Mauritius 1.04 1.02 1.02 1.06 1.30 0.96 2.34 37.9 11.6 .. .. 1.0066 Panama 1.05 1.02 0.97 1.05 1.22 1.06 1.47 42.0 18.3 17.7 2.4 0.5967 Serbia 1.05 1.00 1.00 1.01 1.09 0.91 1.12 45.1 34.4 19.2 2.2 0.9368 Albania 1.08 0.99 0.97 0.93 0.96 1.00 0.93 37.5 27.9 21.7 d 6.3 d 0.6169 Trinidad and Tobago 1.04 .. .. .. 1.18 1.08 1.56 42.2 30.1 .. .. ..70 Antigua and Barbuda 1.03 0.98 0.94 1.02 .. .. .. .. 20.0 .. .. 0.9570 Georgia 1.08 .. 1.00 1.02 0.98 0.99 0.64 46.4 16.0 .. .. 0.9272 Saint Kitts and Nevis .. .. .. .. .. .. .. .. 13.3 .. .. 0.7773 Cuba 1.06 1.01 0.94 1.04 1.00 0.98 1.30 43.2 48.9 .. .. ..74 Mexico 1.05 1.02 1.01 1.09 1.08 0.95 1.03 40.5 41.4 28.1 f 3.0 f 0.5075 Grenada 1.05 0.95 0.97 1.04 .. .. .. .. 25.0 .. .. ..76 Sri Lanka 1.04 0.99 0.98 1.03 1.24 0.99 2.36 32.2 5.8 .. .. ..77 Bosnia and Herzegovina 1.06 .. .. .. 1.23 0.81 2.09 32.7 19.3 .. .. ..78 Venezuela (Bolivarian Republic of) 1.05 1.01 0.97 1.08 1.16 1.08 1.22 42.4 22.2 .. .. 0.7279 Brazil 1.05 0.99 0.97 1.05 1.14 1.06 1.35 44.4 11.3 13.3 4.3 ..80 Azerbaijan 1.13 1.01 0.99 .. 1.01 0.96 1.30 43.8 16.8 25.4 2.9 1.5180 Lebanon 1.05 0.95 0.91 1.00 0.96 0.96 1.27 24.9 3.1 .. .. ..80 The former Yugoslav Republic of Macedonia 1.05 0.99 1.00 0.98 1.01 0.72 0.93 39.7 37.5 16.7 d 3.0 d ..83 Armenia 1.13 1.10 1.01 1.05 1.18 0.99 1.23 42.4 18.1 21.7 5.0 1.1783 Thailand 1.06 0.87 0.94 0.96 1.31 0.89 1.10 47.4 4.8 11.8 h 3.2 h ..85 Algeria 1.05 .. 0.95 .. 1.14 0.99 2.07 17.5 21.3 21.7 f 5.8 f ..86 China 1.15 1.01 1.01 1.02 0.92 0.90 0.84 42.3 24.2 16.2 2.6 ..86 Ecuador 1.05 1.05 1.01 1.03 1.28 1.00 1.59 42.7 38.0 19.8 4.4 ..88 Ukraine 1.06 0.97 1.02 0.98 0.94 0.99 0.74 49.2 12.3 .. .. ..89 Peru 1.05 1.01 1.00 1.00 1.01 0.85 1.03 46.7 27.7 22.7 f 2.6 f ..90 Colombia 1.05 .. 0.97 1.06 1.23 1.04 1.58 46.4 19.8 16.3 d 3.7 d 0.9990 Saint Lucia 1.03 1.02 .. 1.01 1.08 1.15 1.18 47.0 20.7 .. .. ..92 Fiji 1.06 .. 0.99 1.11 1.30 1.13 1.71 34.3 16.0 15.2 2.9 ..92 Mongolia 1.03 1.00 0.98 1.01 1.04 1.06 0.75 47.4 17.1 19.9 f 2.2 f 1.0094 Dominican Republic 1.05 1.04 0.92 1.10 1.49 1.08 2.16 45.0 24.3 .. .. 0.3895 Jordan 1.05 .. .. 1.04 1.16 0.95 1.95 16.0 15.4 .. .. 0.1495 Tunisia 1.05 1.00 0.97 1.11 1.01 0.78 1.65 25.0 31.3 .. .. ..97 Jamaica 1.05 0.98 .. 1.05 1.13 1.12 1.66 46.6 19.0 .. .. ..98 Tonga 1.05 0.98 0.99 1.09 1.04 1.00 1.00 53.6 7.7 .. .. ..99 Saint Vincent and the Grenadines 1.03 1.00 0.98 0.99 1.12 .. 1.14 44.4 13.0 .. .. ..
100 Suriname 1.07 1.04 1.00 1.32 1.41 1.02 2.36 37.9 25.5 .. .. ..101 Botswana 1.03 1.04 0.97 .. 1.20 0.99 1.46 47.6 9.5 .. .. 1.00101 Maldives 1.07 0.99 1.00 .. 0.99 0.91 1.30 28.5 5.9 .. .. ..103 Dominica .. 1.03 0.97 0.99 .. .. .. .. 25.0 .. .. ..104 Samoa 1.08 1.09 1.01 1.10 1.22 1.11 1.34 38.2 10.0 .. .. ..105 Uzbekistan 1.08 0.96 0.98 0.99 1.04 1.00 0.97 39.4 16.4 .. .. ..
HUMAN DEVELOPMENT INDICES AND INDICATORS: 2018 STATISTICAL UPDATE
DASHBOARD 2 Life-course gender gap | 87
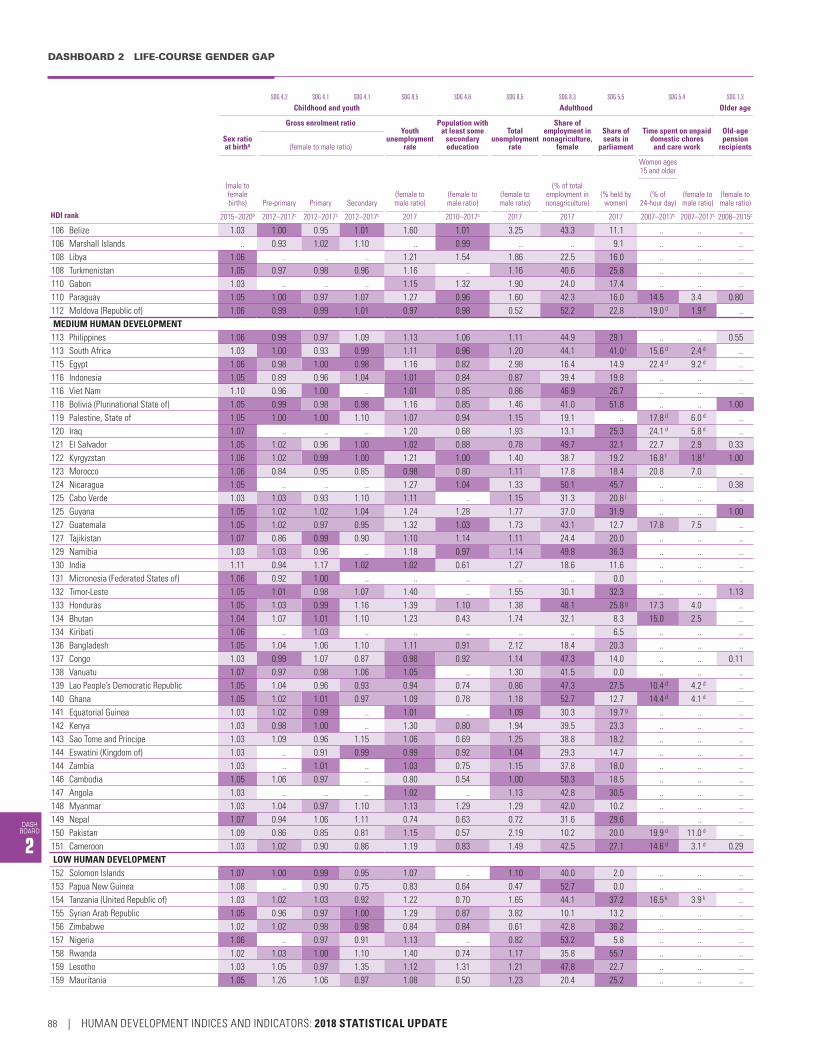
DASHBOARD 2 LIFE-COURSE GENDER GAP
DASH BOARD
2
SDG 4.2 SDG 4.1 SDG 4.1 SDG 8.5 SDG 4.6 SDG 8.5 SDG 8.3 SDG 5.5 SDG 5.4 SDG 1.3
HDI rank
Childhood and youth Adulthood Older age
Sex ratio at birtha
Gross enrolment ratioYouth
unemployment rate
Population with at least some
secondary education
Total unemployment
rate
Share of employment in nonagriculture,
female
Share of seats in
parliament
Time spent on unpaid domestic chores and care work
Old-age pension
recipients(female to male ratio)
Women ages 15 and older
(male to female births) Pre-primary Primary Secondary
(female to male ratio)
(female to male ratio)
(female to male ratio)
(% of total employment in nonagriculture)
(% held by women)
(% of 24-hour day)
(female to male ratio)
(female to male ratio)
2015–2020b 2012–2017c 2012–2017c 2012–2017c 2017 2010–2017c 2017 2017 2017 2007–2017c 2007–2017c 2008–2015c
106 Belize 1.03 1.00 0.95 1.01 1.60 1.01 3.25 43.3 11.1 .. .. ..106 Marshall Islands .. 0.93 1.02 1.10 .. 0.99 .. .. 9.1 .. .. ..108 Libya 1.06 .. .. .. 1.21 1.54 1.86 22.5 16.0 .. .. ..108 Turkmenistan 1.05 0.97 0.98 0.96 1.16 .. 1.16 40.6 25.8 .. .. ..110 Gabon 1.03 .. .. .. 1.15 1.32 1.90 24.0 17.4 .. .. ..110 Paraguay 1.05 1.00 0.97 1.07 1.27 0.96 1.60 42.3 16.0 14.5 3.4 0.80112 Moldova (Republic of) 1.06 0.99 0.99 1.01 0.97 0.98 0.52 52.2 22.8 19.0 d 1.9 d ..MEDIUM HUMAN DEVELOPMENT 113 Philippines 1.06 0.99 0.97 1.09 1.13 1.06 1.11 44.9 29.1 .. .. 0.55113 South Africa 1.03 1.00 0.93 0.99 1.11 0.96 1.20 44.1 41.0 i 15.6 d 2.4 d ..115 Egypt 1.06 0.98 1.00 0.98 1.16 0.82 2.98 16.4 14.9 22.4 d 9.2 d ..116 Indonesia 1.05 0.89 0.96 1.04 1.01 0.84 0.87 39.4 19.8 .. .. ..116 Viet Nam 1.10 0.96 1.00 .. 1.01 0.85 0.86 46.9 26.7 .. .. ..118 Bolivia (Plurinational State of) 1.05 0.99 0.98 0.98 1.16 0.85 1.46 41.0 51.8 .. .. 1.00119 Palestine, State of 1.05 1.00 1.00 1.10 1.07 0.94 1.15 19.1 .. 17.8 d 6.0 d ..120 Iraq 1.07 .. .. .. 1.20 0.68 1.93 13.1 25.3 24.1 d 5.8 d ..121 El Salvador 1.05 1.02 0.96 1.00 1.02 0.88 0.78 49.7 32.1 22.7 2.9 0.33122 Kyrgyzstan 1.06 1.02 0.99 1.00 1.21 1.00 1.40 38.7 19.2 16.8 f 1.8 f 1.00123 Morocco 1.06 0.84 0.95 0.85 0.98 0.80 1.11 17.8 18.4 20.8 7.0 ..124 Nicaragua 1.05 .. .. .. 1.27 1.04 1.33 50.1 45.7 .. .. 0.38125 Cabo Verde 1.03 1.03 0.93 1.10 1.11 .. 1.15 31.3 20.8 j .. .. ..125 Guyana 1.05 1.02 1.02 1.04 1.24 1.28 1.77 37.0 31.9 .. .. 1.00127 Guatemala 1.05 1.02 0.97 0.95 1.32 1.03 1.73 43.1 12.7 17.8 7.5 ..127 Tajikistan 1.07 0.86 0.99 0.90 1.10 1.14 1.11 24.4 20.0 .. .. ..129 Namibia 1.03 1.03 0.96 .. 1.18 0.97 1.14 49.8 36.3 .. .. ..130 India 1.11 0.94 1.17 1.02 1.02 0.61 1.27 18.6 11.6 .. .. ..131 Micronesia (Federated States of) 1.06 0.92 1.00 .. .. .. .. .. 0.0 .. .. ..132 Timor-Leste 1.05 1.01 0.98 1.07 1.40 .. 1.55 30.1 32.3 .. .. 1.13133 Honduras 1.05 1.03 0.99 1.16 1.39 1.10 1.38 48.1 25.8 g 17.3 4.0 ..134 Bhutan 1.04 1.07 1.01 1.10 1.23 0.43 1.74 32.1 8.3 15.0 2.5 ..134 Kiribati 1.06 .. 1.03 .. .. .. .. .. 6.5 .. .. ..136 Bangladesh 1.05 1.04 1.06 1.10 1.11 0.91 2.12 18.4 20.3 .. .. ..137 Congo 1.03 0.99 1.07 0.87 0.98 0.92 1.14 47.3 14.0 .. .. 0.11138 Vanuatu 1.07 0.97 0.98 1.06 1.05 .. 1.30 41.5 0.0 .. .. ..139 Lao People’s Democratic Republic 1.05 1.04 0.96 0.93 0.94 0.74 0.86 47.3 27.5 10.4 d 4.2 d ..140 Ghana 1.05 1.02 1.01 0.97 1.09 0.78 1.18 52.7 12.7 14.4 d 4.1 d ..141 Equatorial Guinea 1.03 1.02 0.99 .. 1.01 .. 1.09 30.3 19.7 g .. .. ..142 Kenya 1.03 0.98 1.00 .. 1.30 0.80 1.94 39.5 23.3 .. .. ..143 Sao Tome and Principe 1.03 1.09 0.96 1.15 1.06 0.69 1.25 38.8 18.2 .. .. ..144 Eswatini (Kingdom of) 1.03 .. 0.91 0.99 0.99 0.92 1.04 29.3 14.7 .. .. ..144 Zambia 1.03 .. 1.01 .. 1.03 0.75 1.15 37.8 18.0 .. .. ..146 Cambodia 1.05 1.06 0.97 .. 0.80 0.54 1.00 50.3 18.5 .. .. ..147 Angola 1.03 .. .. .. 1.02 .. 1.13 42.8 30.5 .. .. ..148 Myanmar 1.03 1.04 0.97 1.10 1.13 1.29 1.29 42.0 10.2 .. .. ..149 Nepal 1.07 0.94 1.06 1.11 0.74 0.63 0.72 31.6 29.6 .. .. ..150 Pakistan 1.09 0.86 0.85 0.81 1.15 0.57 2.19 10.2 20.0 19.9 d 11.0 d ..151 Cameroon 1.03 1.02 0.90 0.86 1.19 0.83 1.49 42.5 27.1 14.6 d 3.1 d 0.29LOW HUMAN DEVELOPMENT 152 Solomon Islands 1.07 1.00 0.99 0.95 1.07 .. 1.10 40.0 2.0 .. .. ..153 Papua New Guinea 1.08 .. 0.90 0.75 0.83 0.64 0.47 52.7 0.0 .. .. ..154 Tanzania (United Republic of) 1.03 1.02 1.03 0.92 1.22 0.70 1.65 44.1 37.2 16.5 k 3.9 k ..155 Syrian Arab Republic 1.05 0.96 0.97 1.00 1.29 0.87 3.82 10.1 13.2 .. .. ..156 Zimbabwe 1.02 1.02 0.98 0.98 0.84 0.84 0.61 42.8 36.2 .. .. ..157 Nigeria 1.06 .. 0.97 0.91 1.13 .. 0.82 53.2 5.8 .. .. ..158 Rwanda 1.02 1.03 1.00 1.10 1.40 0.74 1.17 35.8 55.7 .. .. ..159 Lesotho 1.03 1.05 0.97 1.35 1.12 1.31 1.21 47.8 22.7 .. .. ..159 Mauritania 1.05 1.26 1.06 0.97 1.08 0.50 1.23 20.4 25.2 .. .. ..
88 | HUMAN DEVELOPMENT INDICES AND INDICATORS: 2018 STATISTICAL UPDATE

DASH BOARD
2
SDG 4.2 SDG 4.1 SDG 4.1 SDG 8.5 SDG 4.6 SDG 8.5 SDG 8.3 SDG 5.5 SDG 5.4 SDG 1.3
HDI rank
Childhood and youth Adulthood Older age
Sex ratio at birtha
Gross enrolment ratioYouth
unemployment rate
Population with at least some
secondary education
Total unemployment
rate
Share of employment in nonagriculture,
female
Share of seats in
parliament
Time spent on unpaid domestic chores and care work
Old-age pension
recipients(female to male ratio)
Women ages 15 and older
(male to female births) Pre-primary Primary Secondary
(female to male ratio)
(female to male ratio)
(female to male ratio)
(% of total employment in nonagriculture)
(% held by women)
(% of 24-hour day)
(female to male ratio)
(female to male ratio)
2015–2020b 2012–2017c 2012–2017c 2012–2017c 2017 2010–2017c 2017 2017 2017 2007–2017c 2007–2017c 2008–2015c
161 Madagascar 1.03 1.09 1.00 0.99 1.00 .. 1.12 53.4 19.6 .. .. ..162 Uganda 1.03 1.04 1.03 .. 1.32 0.82 1.87 39.3 34.3 .. .. ..163 Benin 1.04 1.03 0.93 0.71 1.11 0.56 1.17 55.7 7.2 .. .. ..164 Senegal 1.04 1.13 1.12 1.01 1.06 0.55 1.06 36.0 41.8 .. .. ..165 Comoros 1.05 1.07 0.93 1.07 0.88 .. 1.15 35.2 6.1 .. .. ..165 Togo 1.02 1.03 0.95 .. 0.82 0.50 0.76 52.9 17.6 .. .. ..167 Sudan 1.04 0.94 0.92 0.99 1.12 0.76 1.71 27.7 31.0 .. .. ..168 Afghanistan 1.06 .. 0.68 0.57 1.05 0.31 1.59 11.6 27.4 .. .. ..168 Haiti 1.05 .. .. .. 1.18 0.67 1.29 58.5 2.7 .. .. ..170 Côte d’Ivoire 1.03 1.01 0.89 0.73 1.32 0.52 1.57 46.9 9.2 l .. .. ..171 Malawi 1.03 1.01 1.03 0.89 1.08 0.66 1.37 32.2 16.7 .. .. ..172 Djibouti 1.04 0.99 0.89 0.83 1.06 .. 1.29 43.2 10.8 .. .. ..173 Ethiopia 1.04 0.95 0.91 0.96 1.45 0.52 2.42 59.0 37.3 19.3 d 2.9 d ..174 Gambia 1.03 1.07 1.08 .. 1.40 0.69 1.84 39.0 10.3 .. .. ..175 Guinea 1.02 .. 0.85 0.66 0.82 .. 0.64 43.8 21.9 .. .. ..176 Congo (Democratic Republic of the) 1.03 1.07 0.99 0.64 1.11 0.56 1.39 35.8 8.2 .. .. ..177 Guinea-Bissau 1.03 .. .. .. 1.06 .. 1.20 29.8 13.7 .. .. ..178 Yemen 1.05 0.90 0.87 0.73 1.05 0.54 2.16 4.2 0.5 .. .. ..179 Eritrea 1.05 0.98 0.86 0.85 1.06 .. 1.17 28.9 22.0 .. .. ..180 Mozambique 1.03 .. 0.92 0.92 0.98 0.59 1.18 30.5 39.6 .. .. 0.80181 Liberia 1.05 0.97 0.90 0.78 1.27 0.47 1.00 49.0 9.9 6.3 2.4 ..182 Mali 1.05 1.05 0.88 0.74 1.07 0.45 1.19 43.6 8.8 .. .. 0.11183 Burkina Faso 1.05 1.00 0.98 0.95 1.56 0.52 2.22 48.3 11.0 .. .. 0.13184 Sierra Leone 1.02 1.12 1.01 0.91 0.65 0.59 0.70 51.9 12.4 .. .. ..185 Burundi 1.03 1.02 1.01 0.97 0.69 0.72 0.55 21.7 37.8 .. .. 0.29186 Chad 1.03 0.94 0.78 0.46 1.10 0.17 1.40 27.0 12.8 .. .. ..187 South Sudan 1.04 0.95 0.71 0.54 0.93 .. 1.24 52.8 26.6 .. .. ..188 Central African Republic 1.03 .. 0.76 0.64 1.06 0.43 1.24 29.8 8.6 .. .. ..189 Niger 1.05 1.03 0.86 0.73 0.63 0.48 0.50 50.6 17.0 .. .. ..OTHER COUNTRIES OR TERRITORIES
.. Korea (Democratic People’s Rep. of) 1.05 1.01 .. 1.01 0.89 .. 0.73 43.4 16.3 .. .. ..
.. Monaco .. .. .. .. .. .. .. .. 20.8 .. .. ..
.. Nauru .. 1.05 1.03 1.03 .. .. .. .. 10.5 .. .. ..
.. San Marino .. 1.02 0.99 1.03 .. .. .. .. 26.7 .. .. ..
.. Somalia 1.03 .. .. .. 1.03 .. 1.16 12.1 24.3 .. .. ..
.. Tuvalu .. 0.99 0.99 1.27 .. .. .. .. 6.7 .. .. ..Human development groups
Very high human development 1.05 0.99 1.00 1.00 1.01 0.99 1.09 44.8 26.7 — — ..High human development 1.10 1.00 1.00 1.02 1.05 0.92 1.15 41.4 22.3 — — ..Medium human development 1.08 0.96 1.06 1.01 1.07 0.72 1.44 27.0 21.8 — — ..Low human development 1.04 1.00 0.94 0.84 1.10 0.60 1.42 45.1 21.7 — — ..
Developing countries 1.07 0.97 1.01 0.99 1.07 0.83 1.31 36.2 21.9 — — ..Regions
Arab States 1.05 0.96 0.96 0.93 1.15 0.83 2.37 16.6 18.0 — — ..East Asia and the Pacific 1.11 0.98 0.99 1.02 0.96 0.90 0.85 42.5 19.8 — — ..Europe and Central Asia 1.06 0.97 1.00 0.98 1.08 0.91 1.15 39.8 20.7 — — ..Latin America and the Caribbean 1.05 1.01 0.98 1.05 1.15 1.01 1.35 43.5 28.8 — — ..South Asia 1.10 0.94 1.09 1.00 1.05 0.66 1.53 17.9 17.5 — — ..Sub-Saharan Africa 1.04 1.00 0.96 0.87 1.11 0.73 1.25 47.1 23.5 — — ..
Least developed countries 1.04 1.00 0.96 0.92 1.08 0.73 1.56 36.5 22.4 — — ..Small island developing states 1.06 .. 0.94 1.02 1.18 0.97 1.44 46.6 23.4 — — ..Organisation for Economic Co-operation and Development 1.05 0.99 1.00 1.01 0.99 0.97 1.07 44.6 28.9 — — 0.99World 1.07 0.98 1.01 0.99 1.05 0.88 1.24 38.6 23.5 — — ..
HUMAN DEVELOPMENT INDICES AND INDICATORS: 2018 STATISTICAL UPDATE
DASHBOARD 2 Life-course gender gap | 89

DASHBOARD 2 LIFE-COURSE GENDER GAP
DASH BOARD
2
NOTES
Three-colour coding is used to visualize partial grouping of countries and aggregates by indicator. For each indicator countries are divided into three groups of approximately equal size (terciles): the top third, the middle third and the bottom third. Aggregates are colour coded using the same tercile cutoffs. Sex ratio at birth is an exception —countries are divided into two groups: the natural group (countries with a value of 1.04–1.07, inclusive), which uses darker shading, and the gender-biased group (all others), which uses lighter shading. See Technical note 6 at http://hdr.undp.org/sites/default/files/hdr2018_technical_notes.pdf for details about partial grouping in this table.
a The natural sex ratio at birth is commonly assumed and empirically confirmed to be 1.05 male births to 1 female birth.
b Data are annual average of projections for 2015–2020 based on the medium-fertility variant.
c Data refer to the most recent year available during the period specified.
d Refers to the population ages 10 and older.
e Refers to the population ages 20–74.
f Refers to the population ages 12 and older.
g Refers to 2016.
h Refers to the population ages 6 and older.
i Excludes the 36 special rotating delegates appointed on an ad hoc basis.
j Refers to 2013.
k Refers to the population ages 5 and older.
l Refers to 2015.
DEFINITIONS
Sex ratio at birth: Number of male births per female birth.
Gross enrolment ratio, female to male ratio: Total enrolment in a given level of education (pre-primary, primary or secondary), regardless of age, expressed as a ratio of the official school-age female population to the official school-age male population for the same level of education.
Youth unemployment rate, female to male ratio: Ratio of the percentage of the female labour force population ages 15–24 that is not in paid employment or self-employed but is available for work and is actively seeking paid employment or self-employment to the percentage of the male labour force population ages 15–24 that is not in paid employment or self-employed but is available for work and is actively seeking paid employment or self-employment.
Population with at least some secondary education, female to male ratio: Ratio of the percentage of the female population ages 25 and older that has reached (but not necessarily completed) a secondary level of education to the percentage of the male population ages 25 and older with the same level of education achievement.
Total unemployment rate, female to male ratio: Ratio of the percentage of the female labour force population ages 15 and older that is not in paid employment or self-employed but is available for work and is actively seeking paid employment or self-employment to the percentage of the male labour force population ages 15 and older that is not in paid employment or self-employed but is available for work and is actively seeking paid employment or self-employment.
Share of employment in nonagriculture, female: Share of women in employment in the nonagricultural sector, which comprises industry and services activities.
Share of seats in parliament: Proportion of seats held by women in the national parliament, expressed as a percentage of total seats. For countries with a bicameral legislative system, the share of seats is calculated based on both houses.
Time spent on unpaid domestic chores and care work: The average daily number of hours spent on unpaid domestic and care work, expressed as a percentage of a 24-hour day. Unpaid domestic and care work refers to activities related to the provision of services for own final use by household members or by family members living in other households.
Old-age pension recipients, female to male ratio: Ratio of the percentage of women above
the statutory pensionable age receiving an old-age pension (contributory, noncontributory or both) to the percentage of men above the statutory pensionable age receiving an old-age pension (contributory, noncontributory or both).
MAIN DATA SOURCES
Column 1: UNDESA (2017a).
Columns 2–4: UNESCO Institute for Statistics (2018).
Columns 5 and 7: HDRO calculations based on ILO (2018a).
Column 6: HDRO calculations based on UNESCO Institute for Statistics (2018) and Barro and Lee (2016).
Column 8: ILO (2018a).
Column 9: IPU (2018).
Column 10: United Nations Statistics Division (2018a).
Column 11: HDRO calculations based on United Nations Statistics Division (2018a).
Column 12: HDRO calculations based on ILO (2018b).
90 | HUMAN DEVELOPMENT INDICES AND INDICATORS: 2018 STATISTICAL UPDATE

DASH BOARD
3
Country groupings (terciles)Top third Middle third Bottom third
Three-colour coding is used to visualize partial grouping of countries by indicator. For each indicator countries are divided into three groups of approximately equal size (terciles): the top third, the middle third and the bottom third. Aggregates are colour coded using the same tercile cutoffs. See Notes after the table.
3DASHBOA
RDWomen’s empowerment
SDG 3.1 SDG 3.1 SDG 3.7 SDG 3.7, 5.6 SDG 5.6 SDG 5.3 SDG 5.2 SDG 5.2 SDG 5.5 SDG 1.3
HDI rank
Reproductive health and family planning Violence against girls and women Socioeconomic empowerment
Child marriage
Violence against women ever experienceda
Women with
account at financial
institution or with mobile money-service provider
Antenatal care
coverage, at least
one visit
Proportion of births attended by skilled
health personnel
Maternal mortality
ratioAdolescent
birth rate
Contraceptive prevalence, any method
Unmet need for family
planning
Women married
by age 18Intimate partner
Nonintimate partner
Share of female graduates graduating in science,
mathematics, engineering,
manufacturing and construction at tertiary level
Female share of
employment in senior
and middle management
Mandatory paid
maternity leave
(%) (%)
(deaths per
100,000 live births)
(births per 1,000 women
ages 15–19)
(% of married or in-union women of reproductive
age, 15–49 years)
(% of women ages 20–24
who are married or in union)
(% of female population ages 15 and older) (%) (%)
(% of female
population ages 15
and older) (days)
2007–2017b 2012–2017b 2015 2015–2020c 2007–2017b 2007–2017b 2003–2017b 2005–2018b 2005–2018b 2007–2017b 2009–2017b 2017 2017
VERY HIGH HUMAN DEVELOPMENT1 Norway .. 99.1 5 5.6 .. .. .. 27.0 .. 10.4 35.4 100.0 ..2 Switzerland .. .. 5 3.0 72.9 .. .. .. .. 11.4 34.0 98.9 983 Australia 98.3 99.7 6 12.9 66.9 .. .. 16.9 .. 9.7 32.6 99.2 0 d
4 Ireland .. 99.7 8 9.7 .. .. .. 15.0 5.0 13.7 31.1 95.3 1825 Germany .. 98.7 6 6.5 68.7 .. .. 22.0 7.0 .. 28.1 99.2 986 Iceland .. 97.9 3 6.8 .. .. .. 22.4 .. 10.3 34.8 .. 907 Hong Kong, China (SAR) .. .. .. 2.7 74.8 .. .. .. .. .. .. 94.7 707 Sweden .. .. 4 5.2 .. .. .. 28.0 12.0 14.2 39.5 100.0 09 Singapore .. 99.6 10 3.7 .. .. .. 6.1 .. .. .. 96.3 105
10 Netherlands .. .. 7 4.0 73.0 .. .. 25.0 12.0 6.3 24.5 99.8 11211 Denmark .. 94.4 6 4.1 .. .. .. 32.0 11.0 12.2 28.6 100.0 12612 Canada 100.0 97.9 7 9.4 .. .. .. .. .. .. .. 99.9 10513 United States .. 99.1 14 18.8 72.7 9.0 .. .. .. 9.9 .. 92.7 ..14 United Kingdom .. .. 9 12.5 84.0 .. .. 29.0 7.0 17.4 33.8 96.1 4215 Finland .. 99.9 3 6.8 85.5 .. .. 30.0 11.0 13.5 34.1 99.6 14716 New Zealand .. 96.3 11 20.0 .. .. .. .. .. 12.5 .. 99.3 112 e
17 Belgium .. .. 7 4.9 66.8 .. .. 24.0 8.0 7.7 32.0 98.8 10517 Liechtenstein .. .. .. .. .. .. .. .. .. .. .. .. ..19 Japan .. 99.9 5 4.1 39.8 .. .. .. .. .. .. 98.1 9820 Austria .. 98.4 4 6.9 65.7 .. .. 13.0 4.0 14.3 29.5 98.4 11221 Luxembourg .. .. 10 5.2 .. .. .. 22.0 8.0 5.3 14.9 98.2 11222 Israel .. .. 5 9.2 .. .. .. .. .. .. 34.3 93.7 10522 Korea (Republic of) .. 100.0 11 1.6 79.6 .. .. .. .. 15.4 .. 94.7 9024 France .. 97.4 8 8.6 78.4 .. .. 26.0 9.0 14.1 31.1 91.3 11225 Slovenia .. 99.8 9 4.2 .. .. .. 13.0 4.0 14.0 41.8 96.9 10526 Spain .. .. 5 8.6 70.9 .. .. 13.0 3.0 12.7 30.3 91.6 11227 Czechia .. 99.8 4 10.0 86.3 4.3 .. 21.0 4.0 13.2 23.1 78.6 19628 Italy .. 99.9 4 6.1 65.1 .. .. 19.0 5.0 16.0 22.0 91.6 15029 Malta .. 99.8 9 16.6 .. .. .. 15.0 5.0 8.6 29.0 97.0 12630 Estonia .. 99.4 9 12.6 .. .. .. 20.0 9.0 16.3 31.6 98.4 14031 Greece .. .. 3 7.2 .. .. .. 19.0 1.0 19.5 24.7 84.5 11932 Cyprus 99.2 97.4 7 4.6 .. .. .. 15.0 2.0 10.4 27.0 90.0 12633 Poland .. 99.8 3 12.7 50.6 .. .. 13.0 2.0 15.3 38.1 88.0 14034 United Arab Emirates 100.0 99.9 6 28.4 .. .. .. .. .. 17.3 .. 76.4 4535 Andorra .. .. .. .. .. .. .. .. .. .. .. .. ..35 Lithuania .. 100.0 10 10.7 .. .. .. 24.0 5.0 11.4 38.8 81.0 12637 Qatar 90.8 99.9 13 9.9 37.5 12.4 4 .. .. 15.8 .. 61.6 f 5038 Slovakia .. 98.5 6 22.0 .. .. .. 23.0 4.0 12.0 34.3 83.1 23839 Brunei Darussalam 99.0 100.0 23 10.3 .. .. .. .. .. 23.6 32.5 .. 9139 Saudi Arabia 97.0 98.0 12 7.8 24.6 .. .. .. .. 17.4 .. 58.2 7041 Latvia .. 99.9 18 13.5 .. .. .. 32.0 7.0 10.0 46.3 92.5 11241 Portugal .. 98.8 10 9.4 73.9 .. .. 19.0 1.0 18.3 32.2 90.6 ..43 Bahrain 100.0 99.7 15 13.4 .. .. .. .. .. 12.6 .. 75.4 6044 Chile .. 99.7 22 45.6 76.3 .. .. .. .. 6.5 .. 71.3 12645 Hungary .. 99.2 17 19.7 61.6 .. .. 21.0 3.0 11.7 37.7 72.2 168
DASHBOARD 3 Women’s empowerment | 91

DASHBOARD 3 WOMEN’S EMPOWERMENT
DASH BOARD
3
SDG 3.1 SDG 3.1 SDG 3.7 SDG 3.7, 5.6 SDG 5.6 SDG 5.3 SDG 5.2 SDG 5.2 SDG 5.5 SDG 1.3
HDI rank
Reproductive health and family planning Violence against girls and women Socioeconomic empowerment
Child marriage
Violence against women ever experienceda
Women with
account at financial
institution or with mobile money-service provider
Antenatal care
coverage, at least
one visit
Proportion of births attended by skilled
health personnel
Maternal mortality
ratioAdolescent
birth rate
Contraceptive prevalence, any method
Unmet need for family
planning
Women married
by age 18Intimate partner
Nonintimate partner
Share of female graduates graduating in science,
mathematics, engineering,
manufacturing and construction at tertiary level
Female share of
employment in senior
and middle management
Mandatory paid
maternity leave
(%) (%)
(deaths per
100,000 live births)
(births per 1,000 women
ages 15–19)
(% of married or in-union women of reproductive
age, 15–49 years)
(% of women ages 20–24
who are married or in union)
(% of female population ages 15 and older) (%) (%)
(% of female
population ages 15
and older) (days)
2007–2017b 2012–2017b 2015 2015–2020c 2007–2017b 2007–2017b 2003–2017b 2005–2018b 2005–2018b 2007–2017b 2009–2017b 2017 2017
46 Croatia .. 99.9 8 8.9 .. .. .. 13.0 3.0 16.0 29.5 82.7 20847 Argentina 98.1 99.6 52 62.8 81.3 .. .. .. .. 9.1 39.8 50.8 9048 Oman 98.6 99.1 17 7.1 29.7 17.8 .. .. .. 39.8 .. 63.5 f 5049 Russian Federation .. 99.7 25 21.6 68.0 8.0 .. .. .. .. 48.5 76.1 14050 Montenegro 91.7 99.0 7 11.8 23.3 21.8 5 .. .. .. .. 67.6 4551 Bulgaria .. 99.8 11 39.5 69.2 .. .. 23.0 6.0 12.3 39.3 73.6 41052 Romania 76.3 95.2 31 33.1 .. .. .. 24.0 2.0 20.3 32.4 53.6 12653 Belarus 99.7 99.8 4 17.2 63.1 7.0 3 .. .. 15.5 47.0 81.3 12654 Bahamas 98.0 99.6 80 26.7 .. .. .. .. .. .. .. .. 9155 Uruguay 97.2 99.9 15 54.7 79.6 .. 25 .. .. 10.8 33.7 60.6 9856 Kuwait 100.0 99.9 4 9.0 .. .. .. .. .. .. .. 73.5 7057 Malaysia 97.2 99.4 40 13.4 52.2 .. .. .. .. 23.2 20.8 82.5 6058 Barbados 93.4 99.0 27 37.3 59.2 19.9 11 .. .. .. .. .. 8458 Kazakhstan 99.3 99.4 12 27.5 55.7 11.6 7 .. .. 13.7 .. 60.3 126
HIGH HUMAN DEVELOPMENT60 Iran (Islamic Republic of) 96.9 99.0 25 25.0 77.4 5.7 17 .. .. 32.1 .. 91.6 27060 Palau 90.3 100.0 .. .. .. .. .. 25.2 15.1 .. .. .. ..62 Seychelles .. 99.0 .. 56.9 .. .. .. .. .. 9.7 39.9 .. 9863 Costa Rica 98.1 90.0 25 53.5 76.2 7.6 21 .. .. 6.9 36.6 60.9 12064 Turkey 97.0 97.4 16 25.8 73.5 5.9 15 38.0 .. 14.2 16.7 54.3 11265 Mauritius .. 99.8 53 26.6 63.8 12.5 .. .. .. .. 29.7 87.1 9866 Panama 93.4 94.6 94 81.8 62.8 16.4 26 .. .. 12.7 43.4 42.3 9867 Serbia 98.3 98.4 17 18.9 58.4 14.9 3 .. .. 18.2 30.3 70.1 13568 Albania 97.3 .. 29 20.7 69.3 12.9 10 24.6 .. 13.4 29.3 38.1 36569 Trinidad and Tobago 95.1 100.0 63 30.1 40.3 24.3 11 30.2 19.0 .. .. 73.6 9870 Antigua and Barbuda 100.0 100.0 .. 43.5 .. .. .. .. .. .. .. .. 9170 Georgia 97.6 99.9 36 45.9 53.4 12.3 14 6.1 2.7 16.0 .. 63.6 18372 Saint Kitts and Nevis 100.0 100.0 .. .. .. .. .. .. .. .. .. .. 9173 Cuba 98.5 99.9 39 43.6 73.7 8.0 26 .. .. 6.1 .. .. ..74 Mexico 98.5 97.7 38 60.3 66.9 13.0 26 14.1 .. 16.6 36.4 33.3 8475 Grenada 100.0 99.3 27 29.2 .. .. .. .. .. 11.0 .. .. 9076 Sri Lanka 95.5 .. 30 14.1 61.7 7.5 12 .. .. .. 24.0 73.4 8477 Bosnia and Herzegovina 87.0 99.9 11 10.0 45.8 9.0 4 .. .. 14.7 24.2 54.7 36578 Venezuela (Bolivarian Republic of) 97.5 96.2 95 85.3 75.0 .. .. .. .. .. .. 70.0 18279 Brazil 97.2 99.1 44 61.6 80.2 6.0 26 .. .. 8.7 38.8 67.5 12080 Azerbaijan 91.7 99.8 25 53.5 .. .. 11 13.5 .. 15.2 .. 27.7 12680 Lebanon .. .. 15 11.8 54.5 .. 6 .. .. 18.0 .. 32.9 7080 The former Yugoslav Republic of Macedonia 98.6 99.9 8 16.2 40.2 17.2 7 .. .. 15.7 27.3 72.9 27083 Armenia 99.6 99.8 25 23.2 57.1 12.5 5 8.2 .. 7.3 .. 40.9 14083 Thailand 98.1 99.1 20 51.9 78.4 6.2 23 .. .. 14.1 29.5 79.8 9085 Algeria 92.7 96.6 140 10.1 57.1 7.0 3 .. .. 26.9 6.9 29.3 9886 China 96.5 99.9 27 6.4 .. .. .. .. .. .. .. 76.4 12886 Ecuador .. 96.7 64 73.9 80.1 8.8 22 37.5 .. 8.3 35.2 42.6 8488 Ukraine 98.6 99.9 24 23.8 65.4 4.9 9 13.2 1.3 14.6 42.4 61.3 12689 Peru 97.0 92.4 68 47.5 76.2 6.0 22 33.2 .. .. .. 34.4 9890 Colombia 97.2 95.9 64 47.5 81.0 6.7 23 .. .. 14.2 .. 42.5 12690 Saint Lucia 96.9 98.7 48 40.5 55.5 17.0 8 .. .. .. .. .. 9192 Fiji 100.0 99.9 30 43.9 .. .. .. 64.1 8.5 .. 38.6 .. 8492 Mongolia 98.7 98.9 44 23.6 54.6 16.0 5 .. .. 12.4 36.7 95.0 12094 Dominican Republic 98.0 99.6 92 95.0 69.5 11.4 36 20.4 .. 6.6 47.4 54.1 9895 Jordan 99.1 99.6 58 22.4 61.2 11.7 8 23.6 .. 18.4 .. 26.6 7095 Tunisia 98.1 73.6 62 7.7 62.5 7.0 2 .. .. 37.2 .. 28.4 3097 Jamaica 97.7 .. 89 52.8 72.5 10.0 8 19.7 .. .. .. 77.8 g 56
92 | HUMAN DEVELOPMENT INDICES AND INDICATORS: 2018 STATISTICAL UPDATE

DASH BOARD
3
SDG 3.1 SDG 3.1 SDG 3.7 SDG 3.7, 5.6 SDG 5.6 SDG 5.3 SDG 5.2 SDG 5.2 SDG 5.5 SDG 1.3
HDI rank
Reproductive health and family planning Violence against girls and women Socioeconomic empowerment
Child marriage
Violence against women ever experienceda
Women with
account at financial
institution or with mobile money-service provider
Antenatal care
coverage, at least
one visit
Proportion of births attended by skilled
health personnel
Maternal mortality
ratioAdolescent
birth rate
Contraceptive prevalence, any method
Unmet need for family
planning
Women married
by age 18Intimate partner
Nonintimate partner
Share of female graduates graduating in science,
mathematics, engineering,
manufacturing and construction at tertiary level
Female share of
employment in senior
and middle management
Mandatory paid
maternity leave
(%) (%)
(deaths per
100,000 live births)
(births per 1,000 women
ages 15–19)
(% of married or in-union women of reproductive
age, 15–49 years)
(% of women ages 20–24
who are married or in union)
(% of female population ages 15 and older) (%) (%)
(% of female
population ages 15
and older) (days)
2007–2017b 2012–2017b 2015 2015–2020c 2007–2017b 2007–2017b 2003–2017b 2005–2018b 2005–2018b 2007–2017b 2009–2017b 2017 2017
98 Tonga 99.0 95.5 124 14.7 34.1 25.2 6 39.6 6.3 .. .. .. ..99 Saint Vincent and the Grenadines 99.5 99.0 45 49.0 .. .. .. .. .. .. .. .. 91
100 Suriname 90.9 80.0 155 46.0 47.6 16.9 19 .. .. .. .. .. ..101 Botswana 94.1 99.7 129 30.0 52.8 9.6 .. .. .. .. .. 46.8 84101 Maldives 99.1 95.6 68 5.8 34.7 28.6 4 19.5 6.2 .. 20.6 .. 60103 Dominica 100.0 96.0 .. .. .. .. .. .. .. .. .. .. 84104 Samoa 93.3 82.5 51 23.9 26.9 34.8 11 46.1 10.6 .. 41.6 .. 28105 Uzbekistan 99.4 100.0 36 16.5 .. .. 7 .. .. .. .. 36.0 126106 Belize 97.2 96.8 28 63.5 51.4 22.2 26 .. .. 11.7 36.4 52.3 g 98106 Marshall Islands 81.2 .. .. .. 44.6 8.1 26 50.9 13.0 .. .. .. ..108 Libya 93.0 99.9 9 5.7 41.9 27.0 .. .. .. .. .. 59.6 98108 Turkmenistan 99.9 100.0 42 24.4 50.2 12.1 6 .. .. .. .. 35.5 ..110 Gabon 94.7 89.3 291 95.3 31.1 26.5 22 48.6 5.0 .. .. 53.7 98110 Paraguay 98.7 95.5 132 55.7 68.4 12.1 22 .. .. .. .. 46.0 98112 Moldova (Republic of) 98.8 99.7 23 22.0 59.5 9.5 12 45.5 .. 12.1 45.4 44.6 126MEDIUM HUMAN DEVELOPMENT113 Philippines 95.4 72.8 114 60.5 55.1 17.5 15 16.9 .. 17.8 32.7 38.9 60113 South Africa 93.7 96.7 138 42.8 54.6 14.7 6 .. .. 13.4 29.7 70.0 120115 Egypt 90.3 91.5 33 50.0 58.5 12.6 17 25.6 .. 7.7 .. 27.0 90116 Indonesia 95.4 92.6 126 47.4 60.9 14.5 14 18.3 .. 14.9 21.5 51.4 90116 Viet Nam 95.8 93.8 54 27.3 75.7 6.1 11 34.4 2.3 15.4 .. 30.4 180118 Bolivia (Plurinational State of) 90.1 89.8 206 68.1 66.5 20.1 19 .. 4.0 .. .. 53.9 90119 Palestine, State of 99.4 99.6 45 56.2 57.2 10.9 15 .. .. 12.6 15.4 15.9 84120 Iraq 77.7 70.4 50 80.1 52.5 8.0 24 .. .. .. .. 19.5 98121 El Salvador 96.0 99.9 54 69.5 72.0 11.0 26 26.3 .. 9.5 34.1 24.4 112122 Kyrgyzstan 98.4 98.4 76 38.1 42.0 18.0 12 25.4 0.1 9.6 .. 38.9 126123 Morocco 77.1 .. 121 31.1 67.4 10.9 16 .. .. 17.5 .. 16.8 98124 Nicaragua 94.7 88.0 150 85.4 80.4 5.8 35 22.5 .. .. .. 24.8 84125 Cabo Verde .. 91.4 42 73.8 .. .. 18 12.6 .. 7.0 .. .. 60125 Guyana 90.7 85.7 229 85.8 33.9 28.0 30 .. .. 5.2 35.4 .. 91127 Guatemala 91.3 65.5 88 70.9 60.6 13.9 30 18.0 .. 5.4 39.2 42.1 84127 Tajikistan 78.8 90.3 32 36.4 27.9 22.9 12 20.3 .. .. .. 42.1 140129 Namibia 96.6 88.2 265 73.8 56.1 17.5 7 25.0 .. .. .. 80.7 84130 India .. 85.7 174 23.1 53.5 12.9 27 28.7 .. 26.9 .. 76.6 182131 Micronesia (Federated States of) 80.0 .. 100 13.9 .. .. .. 32.8 8.0 .. .. .. ..132 Timor-Leste 84.4 56.7 215 44.0 26.1 25.3 19 58.8 13.9 .. .. .. 84133 Honduras 96.6 82.8 129 70.8 73.2 10.7 34 21.6 .. 8.6 41.1 41.0 84134 Bhutan 97.9 89.0 148 20.3 65.6 11.7 26 26.5 12.5 .. .. 27.7 g 56134 Kiribati 88.4 .. 90 16.2 22.3 28.0 20 67.6 9.8 .. .. .. 84136 Bangladesh 63.9 49.8 176 83.5 62.3 12.0 59 53.3 .. 7.9 .. 35.8 112137 Congo 93.2 91.2 442 111.8 30.1 17.9 27 .. .. .. .. 21.0 105138 Vanuatu 75.6 89.4 78 41.9 49.0 24.2 21 60.0 33.0 .. .. .. 84139 Lao People’s Democratic Republic 54.2 40.1 197 62.6 49.8 19.9 35 15.3 5.3 5.7 .. 31.9 105140 Ghana 90.5 70.8 319 66.6 33.0 26.3 21 24.4 4.0 6.0 26.7 53.7 84141 Equatorial Guinea 91.3 .. 342 155.6 12.6 33.8 30 56.9 .. .. .. .. 84142 Kenya 93.7 61.8 510 80.5 61.6 15.6 23 39.4 .. .. .. 77.7 90143 Sao Tome and Principe 97.5 92.5 156 94.8 40.6 33.7 35 27.9 .. .. .. .. 98144 Eswatini (Kingdom of) 98.5 88.3 389 77.0 66.1 15.2 5 .. .. .. .. 27.4 f 14144 Zambia 95.7 63.3 224 82.8 49.0 21.1 31 42.7 .. .. .. 40.3 84146 Cambodia 95.3 89.0 161 50.2 56.3 12.5 19 20.9 3.8 6.0 14.1 21.5 90147 Angola 81.6 46.9 477 151.6 13.7 38.0 30 34.8 .. 9.9 .. 22.3 g 90148 Myanmar 80.7 60.2 178 28.7 52.2 16.2 16 17.3 .. 47.3 28.3 26.0 98149 Nepal 83.6 58.0 258 60.5 52.6 23.7 40 25.0 .. .. .. 41.6 52
HUMAN DEVELOPMENT INDICES AND INDICATORS: 2018 STATISTICAL UPDATE
DASHBOARD 3 Women’s empowerment | 93

DASHBOARD 3 WOMEN’S EMPOWERMENT
DASH BOARD
3
SDG 3.1 SDG 3.1 SDG 3.7 SDG 3.7, 5.6 SDG 5.6 SDG 5.3 SDG 5.2 SDG 5.2 SDG 5.5 SDG 1.3
HDI rank
Reproductive health and family planning Violence against girls and women Socioeconomic empowerment
Child marriage
Violence against women ever experienceda
Women with
account at financial
institution or with mobile money-service provider
Antenatal care
coverage, at least
one visit
Proportion of births attended by skilled
health personnel
Maternal mortality
ratioAdolescent
birth rate
Contraceptive prevalence, any method
Unmet need for family
planning
Women married
by age 18Intimate partner
Nonintimate partner
Share of female graduates graduating in science,
mathematics, engineering,
manufacturing and construction at tertiary level
Female share of
employment in senior
and middle management
Mandatory paid
maternity leave
(%) (%)
(deaths per
100,000 live births)
(births per 1,000 women
ages 15–19)
(% of married or in-union women of reproductive
age, 15–49 years)
(% of women ages 20–24
who are married or in union)
(% of female population ages 15 and older) (%) (%)
(% of female
population ages 15
and older) (days)
2007–2017b 2012–2017b 2015 2015–2020c 2007–2017b 2007–2017b 2003–2017b 2005–2018b 2005–2018b 2007–2017b 2009–2017b 2017 2017
150 Pakistan 73.1 52.1 178 36.9 35.4 20.1 21 .. .. .. 4.0 7.0 84151 Cameroon 82.8 64.7 596 105.8 34.4 18.0 31 51.1 5.0 .. .. 30.0 98LOW HUMAN DEVELOPMENT152 Solomon Islands 88.5 86.2 114 46.4 29.3 34.7 21 63.5 18.0 .. .. .. 84153 Papua New Guinea .. 40.0 215 52.7 32.4 27.4 21 .. .. .. .. .. 0154 Tanzania (United Republic of) 91.4 63.5 398 115.1 38.4 22.1 31 41.7 .. .. .. 42.2 84155 Syrian Arab Republic 87.7 .. 68 38.6 53.9 16.4 13 .. .. 19.2 .. 19.6 f 120156 Zimbabwe 93.3 78.1 443 104.1 66.8 10.4 32 35.4 .. 20.9 .. 51.7 98157 Nigeria 65.8 43.0 814 107.3 13.4 27.6 44 16.2 1.5 .. .. 27.3 84158 Rwanda 99.0 90.7 290 25.7 53.2 18.9 7 34.4 .. .. .. 45.0 84159 Lesotho 95.2 77.9 487 89.5 60.2 18.4 17 .. .. 4.5 .. 46.5 84159 Mauritania 86.9 69.3 602 79.2 17.8 33.6 37 .. .. 16.8 .. 15.5 98161 Madagascar 82.1 44.3 353 109.6 39.8 19.0 41 .. .. 16.2 24.5 16.3 98162 Uganda 97.3 74.2 343 106.5 38.4 29.6 40 49.9 .. .. 31.5 52.7 84163 Benin 82.8 77.2 405 86.1 17.9 33.1 26 .. .. 19.1 .. 28.6 98164 Senegal 95.0 53.1 315 72.7 25.1 23.6 31 .. .. .. .. 38.4 98165 Comoros 92.1 82.2 335 65.4 19.4 31.6 32 6.4 1.5 .. .. 17.9 f 98165 Togo 72.7 44.6 368 89.1 19.9 33.6 22 22.1 .. .. .. 37.6 98167 Sudan 79.1 77.7 311 64.0 12.2 26.6 34 .. .. 12.8 .. 10.0 g 56168 Afghanistan 58.6 50.5 396 64.5 22.5 24.5 35 50.8 .. .. .. 7.2 90168 Haiti 91.0 41.7 359 37.5 34.3 38.0 18 20.8 2.0 .. .. 30.0 42170 Côte d’Ivoire 93.2 73.6 645 132.7 15.5 30.5 27 25.9 .. .. .. 35.6 98171 Malawi 94.8 89.8 634 140.2 59.2 18.7 42 37.5 .. .. .. 29.8 56172 Djibouti 87.7 87.4 229 18.8 19.0 .. 5 .. .. .. .. 8.8 f 98173 Ethiopia 62.4 27.7 353 62.5 36.5 22.8 40 28.0 .. 7.6 21.1 29.1 90174 Gambia 86.2 57.2 706 79.2 9.0 24.9 30 20.1 .. .. 33.7 .. 180175 Guinea 84.3 62.7 679 135.3 8.7 27.6 51 .. .. .. .. 19.7 98176 Congo (Democratic Republic of the) 88.4 80.1 693 124.2 20.4 27.7 37 50.7 .. .. .. 24.2 98177 Guinea-Bissau 92.4 45.0 549 84.5 16.0 22.3 24 .. .. .. .. .. 60178 Yemen 64.4 44.7 385 60.4 33.5 28.7 32 .. .. .. .. 1.7 g 70179 Eritrea 88.5 .. 501 51.6 8.4 27.4 41 .. .. .. .. .. 60180 Mozambique 90.6 .. 489 135.2 27.1 23.1 48 21.7 .. 5.9 22.2 32.9 60181 Liberia 95.9 61.1 725 127.5 31.0 31.1 36 38.5 2.6 .. 20.1 28.2 98182 Mali 47.9 43.7 587 169.1 15.6 17.2 52 34.6 .. .. 3.9 25.7 98183 Burkina Faso 92.8 79.8 371 104.3 25.4 29.1 52 11.5 .. 12.5 .. 34.5 98184 Sierra Leone 97.1 59.7 1,360 112.8 16.6 25.0 39 45.3 .. .. .. 15.4 84185 Burundi 99.2 85.1 712 26.8 28.5 29.7 20 .. .. 17.1 .. 6.7 g 84186 Chad 54.7 20.2 856 161.1 5.7 22.9 67 28.6 .. .. .. 14.9 98187 South Sudan 61.9 .. 789 62.0 4.0 26.3 52 .. .. .. .. 4.7 56188 Central African Republic 68.2 .. 882 103.8 15.2 27.0 68 29.8 .. .. .. 9.7 98189 Niger 82.8 39.7 553 192.0 18.9 21.0 76 .. .. .. .. 10.9 98OTHER COUNTRIES OR TERRITORIES
.. Korea (Democratic People’s Rep. of) 100.0 .. 82 0.3 78.2 7.0 .. .. .. 22.2 .. .. ..
.. Monaco .. .. .. .. .. .. .. .. .. .. .. .. ..
.. Nauru 94.5 .. .. .. 35.6 23.5 27 48.1 47.3 .. .. .. ..
.. San Marino .. .. .. .. .. .. .. .. .. .. .. .. 630
.. Somalia .. .. 732 100.1 .. .. 45 .. .. .. .. 33.7 g ..
.. Tuvalu 97.4 .. .. .. 30.5 24.2 10 36.8 .. .. .. .. ..Human development groups
Very high human development .. 99.2 15 15.9 66.8 .. .. .. .. 12.9 — 88.4 112High human development 96.8 99.0 38 26.6 .. .. .. .. .. .. — 68.8 119Medium human development .. 79.5 176 41.3 54.2 14.2 25 28.8 .. 23.2 — 56.1 94Low human development 77.7 55.2 554 98.4 26.3 25.3 39 30.8 .. .. — 26.6 86
94 | HUMAN DEVELOPMENT INDICES AND INDICATORS: 2018 STATISTICAL UPDATE

DASH BOARD
3
NOTES
Three-colour coding is used to visualize partial grouping of countries and aggregates by indicator. For each indicator countries are divided into three groups of approximately equal size (terciles): the top third, the middle third and the bottom third. Aggregates are colour coded using the same tercile cutoffs. See Technical note 6 at http://hdr.undp.org/sites/default/files/hdr2018_technical_notes.pdf for details about partial grouping in this table.
a Data collection methods, age ranges, sampled women (ever-partnered, ever-married or all women) and definitions of the forms of violence and of perpetrators vary by survey. Thus data are not necessarily comparable across countries.
b Data refer to the most recent year available during the period specified.
c Data are the annual average of projected values for 2015–2020.
d Refers to 2009.
e Refers to 2015.
f Refers to 2011.
g Refers to 2014.
T From original data source.
DEFINITIONS
Antenatal care coverage, at least one visit: Percentage of women ages 15–49 attended at least once during pregnancy by skilled health personnel (doctor, nurse or midwife).
Proportion of births attended by skilled health personnel: Percentage of deliveries attended by skilled health personnel (generally doctors, nurses or midwives) trained in providing lifesaving obstetric care—including giving the necessary supervision, care and advice to women during pregnancy, labour and the postpartum period, conducting deliveries on their own and caring for newborns. Traditional birth attendants, even if they receive a short training course, are not included.
Maternal mortality ratio: Number of deaths due to pregnancy-related causes per 100,000 live births.
Adolescent birth rate: Number of births to women ages 15–19 per 1,000 women ages 15–19.
Contraceptive prevalence, any method: Percentage of married or in-union women of reproductive age (15–49 years) currently using any contraceptive method.
Unmet need for family planning: Percentage of married or in-union women of reproductive age (15–49 years) who are fecund have an unmet need
if they want to have no (more) births, or if they want to postpone or are undecided about the timing of their next birth, yet they are not using any method of contraception.
Child marriage, women married by age 18: Percentage of women ages 20–24 who were first married or in union before age 18.
Violence against women ever experienced, intimate partner: Percentage of the female population ages 15 and older that has ever experienced physical and/or sexual violence from an intimate partner.
Violence against women ever experienced, nonintimate partner: Percentage of the female population ages 15 and older that has ever experienced sexual violence from a nonintimate partner.
Share of female graduates graduating in science, mathematics, engineering, manufacturing and construction at tertiary level: Share of female tertiary graduates in “Natural Sciences, Mathematics and Statistics,” “Information and Communication Technologies” and “Engineering, Manufacturing and Construction” programmes.
Female share of employment in senior and middle management: Proportion of women in total employment in senior and middle management.
Women with account at financial institution or with mobile money-service provider: Percentage of women ages 15 and older who report having an account alone or jointly with someone else at a bank or other type of financial institution or who report personally using a mobile money service in the past 12 months.
Mandatory paid maternity leave: Number of days of paid time off work to which a female employee is entitled in order to take care of a newborn child.
MAIN DATA SOURCES
Column 1: UNICEF (2018).
Columns 2 and 7: United Nations Statistics Division (2018a).
Column 3: UN Maternal Mortality Estimation Group (2017).
Column 4: UNDESA (2017a).
Columns 5 and 6: UNDESA (2018b).
Columns 8 and 9: UN Women (2018).
Column 10: UNESCO Institute for Statistics (2018).
Column 11: ILO (2018a).
Columns 12 and 13: World Bank (2018c).
SDG 3.1 SDG 3.1 SDG 3.7 SDG 3.7, 5.6 SDG 5.6 SDG 5.3 SDG 5.2 SDG 5.2 SDG 5.5 SDG 1.3
HDI rank
Reproductive health and family planning Violence against girls and women Socioeconomic empowerment
Child marriage
Violence against women ever experienceda
Women with
account at financial
institution or with mobile money-service provider
Antenatal care
coverage, at least
one visit
Proportion of births attended by skilled
health personnel
Maternal mortality
ratioAdolescent
birth rate
Contraceptive prevalence, any method
Unmet need for family
planning
Women married
by age 18Intimate partner
Nonintimate partner
Share of female graduates graduating in science,
mathematics, engineering,
manufacturing and construction at tertiary level
Female share of
employment in senior
and middle management
Mandatory paid
maternity leave
(%) (%)
(deaths per
100,000 live births)
(births per 1,000 women
ages 15–19)
(% of married or in-union women of reproductive
age, 15–49 years)
(% of women ages 20–24
who are married or in union)
(% of female population ages 15 and older) (%) (%)
(% of female
population ages 15
and older) (days)
2007–2017b 2012–2017b 2015 2015–2020c 2007–2017b 2007–2017b 2003–2017b 2005–2018b 2005–2018b 2007–2017b 2009–2017b 2017 2017
Developing countries 90.1 84.5 232 48.0 53.2 14.9 27 .. .. .. — 58.3 99Regions
Arab States 86.5 85.2 149 46.3 48.2 14.4 20 .. .. 18.1 — 27.0 75East Asia and the Pacific 95.8 95.5 62 22.4 .. .. .. .. .. .. — .. 86Europe and Central Asia 97.1 98.6 24 25.5 63.6 8.5 10 26.3 .. 14.2 — 53.5 165Latin America and the Caribbean 97.1 95.5 67 61.5 74.5 9.6 25 .. .. 10.5 — 52.2 96South Asia .. 78.4 176 32.1 53.2 13.5 29 31.7 .. .. — 65.3 110Sub-Saharan Africa 81.4 59.5 549 101.3 30.5 24.0 36 31.5 .. .. — 36.0 89
Least developed countries 77.4 56.6 434 T 91.0 37.6 22.1 40 38.1 .. .. — 28.4 87Small island developing states 95.1 74.3 202 56.5 51.1 21.0 23 .. .. .. — .. ..Organisation for Economic Co-operation and Development .. 98.8 15 20.7 68.7 .. .. .. .. 12.5 — 86.2 114World .. 86.5 216 T 44.0 55.8 14.4 .. .. .. .. — 64.7 107
HUMAN DEVELOPMENT INDICES AND INDICATORS: 2018 STATISTICAL UPDATE
DASHBOARD 3 Women’s empowerment | 95

DASH BOARD
4
Country groupings (terciles)Top third Middle third Bottom third
Three-colour coding is used to visualize partial grouping of countries by indicator. For each indicator countries are divided into three groups of approximately equal size (terciles): the top third, the middle third and the bottom third. Aggregates are colour coded using the same tercile cutoffs. See Notes after the table.
Environmental sustainability4DASHBOA
RD
SDG 12.c SDG 7.2 SDG 9.4 SDG 15.1 SDG 6.4 SDG 3.9 SDG 3.9 SDG 15.5Environmental threats
Mortality rate attributed to
Fossil fuel energy
consumption
Renewable energy
consumption Carbon dioxide emissions Forest areaFresh water withdrawals
Household and ambient air pollution
Unsafe water, sanitation
and hygiene services Red List Index
(% of total energy
consumption)
(% of total final energy
consumption)Per capita (tonnes)
(kg per 2011 PPP $ of GDP)
(% of total land areaa) Change (%)
(% of total renewable water
resources) (per 100,000 population) (value)
HDI rank 2010–2015b 2015 2014 2014 2015 1990/2015 2006–2016b 2016 2016 2017
VERY HIGH HUMAN DEVELOPMENT1 Norway 58.5 57.8 9.3 0.15 33.2 –0.2 0.8 8.6 0.2 0.9432 Switzerland 50.1 25.3 4.3 0.08 31.7 9.0 3.7 10.1 0.1 0.9823 Australia 93.4 9.2 15.4 0.35 16.2 –2.9 3.4 8.4 0.1 c 0.8284 Ireland 85.4 9.1 7.3 0.15 10.9 62.2 1.5 11.9 0.1 c 0.9175 Germany 79.8 14.2 8.9 0.20 32.7 1.1 21.4 16.0 0.6 0.9836 Iceland 11.5 77.0 6.1 0.15 0.5 205.6 0.2 8.7 0.1 0.8727 Hong Kong, China (SAR) 93.2 0.9 6.4 0.12 .. .. .. .. .. 0.8237 Sweden 26.8 53.2 4.5 0.10 68.9 0.8 1.5 7.2 0.2 0.9929 Singapore 97.5 0.7 10.3 0.13 23.1 –5.5 .. 25.9 0.1 c 0.862
10 Netherlands 91.4 5.9 9.9 0.22 11.2 9.2 11.8 13.7 0.2 0.94311 Denmark 65.7 33.2 5.9 0.13 14.6 13.8 10.6 13.2 0.3 0.97212 Canada 73.6 22.0 15.1 0.35 38.2 –0.3 1.3 7.0 0.4 0.97113 United States 82.8 8.7 16.5 0.32 33.9 2.7 13.6 13.3 0.2 0.84014 United Kingdom 80.7 8.7 6.5 0.17 13.0 13.2 5.5 13.8 0.2 0.78915 Finland 39.7 43.2 8.7 0.22 73.1 1.8 6.0 7.2 0.1 c 0.98916 New Zealand 59.4 30.8 7.7 0.22 38.6 5.1 1.6 7.2 0.1 0.63417 Belgium 75.8 9.2 8.3 0.20 22.6 .. 32.8 15.7 0.3 0.98617 Liechtenstein .. 63.1 1.2 .. 43.1 6.2 .. .. .. 0.99319 Japan 93.7 6.3 9.5 0.26 68.5 0.0 18.9 11.9 0.2 0.78520 Austria 66.0 34.4 6.9 0.16 46.9 2.5 4.5 15.3 0.1 0.89621 Luxembourg 80.9 9.0 17.4 0.19 33.5 .. 1.2 11.6 0.1 c 0.98722 Israel 96.3 3.7 7.9 0.25 7.6 25.0 .. 15.4 0.2 0.74822 Korea (Republic of) 82.0 2.7 11.6 0.35 63.4 –3.9 .. 20.5 1.8 0.78224 France 46.6 13.5 4.6 0.12 31.0 17.7 14.1 9.7 0.3 0.87525 Slovenia 60.9 20.9 6.2 0.22 62.0 5.1 3.6 22.6 0.1 c 0.93726 Spain 72.9 16.3 5.0 0.16 36.8 33.2 33.0 9.9 0.2 0.84527 Czechia 76.0 14.8 9.2 0.31 34.5 1.5 12.6 29.6 0.2 0.97128 Italy 79.2 16.5 5.3 0.16 31.6 22.5 28.1 15.0 0.1 0.91729 Malta 97.8 5.4 5.4 0.17 1.1 0.0 44.4 20.2 0.1 c 0.88330 Estonia 12.3 27.5 14.8 0.55 52.7 1.2 13.4 25.0 0.1 c 0.98431 Greece 85.1 17.2 6.2 0.26 31.5 22.9 14.0 27.6 0.1 c 0.84832 Cyprus 92.9 9.9 5.3 0.24 18.7 7.2 28.4 20.1 0.3 0.98333 Poland 89.9 11.9 7.5 0.31 30.8 6.3 19.0 37.9 0.1 c 0.97034 United Arab Emirates 99.8 0.1 23.3 0.36 3.9 31.7 .. 54.7 0.1 c 0.86635 Andorra .. 19.7 5.8 .. 34.0 0.0 .. .. .. 0.91935 Lithuania 68.0 29.0 4.4 0.17 34.8 12.1 2.6 34.0 0.1 c 0.98837 Qatar 100.0 0.0 45.4 0.38 0.0 0.0 .. 47.4 0.1 c 0.83338 Slovakia 64.6 13.4 5.7 0.21 40.3 1.0 1.1 33.5 0.1 c 0.96239 Brunei Darussalam 100.0 0.0 22.1 0.29 72.1 –8.0 .. 13.3 0.1 c 0.82839 Saudi Arabia 100.0 0.0 19.5 0.39 0.5 0.0 943.3 83.7 0.1 c 0.90841 Latvia 56.7 38.1 3.5 0.16 54.0 5.8 0.7 41.3 0.1 c 0.98841 Portugal 76.9 27.2 4.3 0.17 34.7 –7.5 11.8 9.8 0.2 0.85643 Bahrain 100.0 0.0 23.4 0.53 0.8 144.1 .. 40.1 0.1 c 0.84944 Chile 73.3 24.9 4.7 0.21 23.9 16.2 3.8 25.3 0.2 0.76345 Hungary 69.3 15.6 4.3 0.18 22.9 14.0 4.9 38.8 0.2 0.92946 Croatia 70.7 33.1 4.0 0.20 34.3 3.8 0.6 35.5 0.1 0.89947 Argentina 88.5 10.0 4.7 0.25 9.9 –22.1 4.3 26.6 0.4 0.86148 Oman 100.0 0.0 15.4 0.38 0.0 0.0 .. 53.9 0.1 c 0.88549 Russian Federation 90.2 3.3 11.9 0.46 49.8 0.8 1.3 49.4 0.1 0.95650 Montenegro 64.7 43.0 3.6 0.24 61.5 32.1 .. 78.6 0.1 c 0.816
96 | HUMAN DEVELOPMENT INDICES AND INDICATORS: 2018 STATISTICAL UPDATE

DASH BOARD
4
SDG 12.c SDG 7.2 SDG 9.4 SDG 15.1 SDG 6.4 SDG 3.9 SDG 3.9 SDG 15.5Environmental threats
Mortality rate attributed to
Fossil fuel energy
consumption
Renewable energy
consumption Carbon dioxide emissions Forest areaFresh water withdrawals
Household and ambient air pollution
Unsafe water, sanitation
and hygiene services Red List Index
(% of total energy
consumption)
(% of total final energy
consumption)Per capita (tonnes)
(kg per 2011 PPP $ of GDP)
(% of total land areaa) Change (%)
(% of total renewable water
resources) (per 100,000 population) (value)
HDI rank 2010–2015b 2015 2014 2014 2015 1990/2015 2006–2016b 2016 2016 2017
51 Bulgaria 71.0 17.7 5.9 0.36 35.2 17.1 26.4 61.8 0.1 0.94152 Romania 72.8 23.7 3.5 0.18 29.8 7.3 3.0 59.3 0.4 0.94753 Belarus 92.4 6.8 6.7 0.37 42.5 10.9 2.6 60.7 0.1 c 0.97054 Bahamas .. 1.2 6.3 0.22 51.4 0.0 .. 19.9 0.1 c 0.70355 Uruguay 46.8 58.0 2.0 0.10 10.5 131.3 .. 17.5 0.4 0.83356 Kuwait 100.0 0.0 25.2 0.36 0.4 81.2 .. 103.8 0.1 c 0.86857 Malaysia 96.6 5.2 8.0 0.33 67.6 –0.8 .. 47.4 0.4 0.68758 Barbados .. 2.8 4.5 0.27 14.7 0.0 .. 31.1 0.2 0.91458 Kazakhstan 99.2 1.6 14.4 0.61 1.2 –3.3 18.4 62.7 0.4 0.873
HIGH HUMAN DEVELOPMENT60 Iran (Islamic Republic of) 99.0 0.9 8.3 0.49 6.6 17.8 .. 50.9 1.0 0.83560 Palau .. 0.0 12.3 0.96 87.6 .. .. .. .. 0.75062 Seychelles .. 1.4 5.4 0.22 88.4 0.0 .. 49.3 0.2 0.67063 Costa Rica 49.5 38.7 1.6 0.11 54.0 7.5 2.1 23.3 0.9 0.82064 Turkey 87.6 13.4 4.5 0.20 15.2 21.8 19.8 46.6 0.3 0.87665 Mauritius 84.5 11.5 3.4 0.18 19.0 –6.1 .. 38.3 0.6 0.40166 Panama 80.7 21.2 2.3 0.11 62.1 –8.4 0.7 25.8 1.9 0.73567 Serbia 83.9 21.2 5.3 0.40 31.1 9.9 2.6 62.5 0.7 0.95768 Albania 61.4 38.6 2.0 0.18 28.2 –2.2 4.3 68.0 0.2 0.85569 Trinidad and Tobago 99.9 0.3 34.2 1.10 45.7 –2.6 8.8 38.6 0.1 0.81670 Antigua and Barbuda .. 0.0 5.4 0.27 22.3 –4.9 8.5 29.9 0.1 0.89170 Georgia 72.2 28.7 2.4 0.28 40.6 2.6 2.9 101.8 0.2 0.86372 Saint Kitts and Nevis .. 1.6 4.3 0.18 42.3 0.0 51.3 .. .. 0.73273 Cuba 85.8 19.3 3.0 .. 30.8 60.5 18.3 49.5 1.0 0.65174 Mexico 90.4 9.2 3.9 0.23 34.0 –5.3 18.6 36.7 1.1 0.67875 Grenada .. 10.9 2.3 0.19 50.0 0.0 7.1 45.3 0.3 0.76276 Sri Lanka 50.3 52.9 0.9 0.08 33.0 –9.4 .. 79.8 1.2 0.56977 Bosnia and Herzegovina 77.5 40.8 6.2 0.59 42.7 –1.5 0.9 79.8 0.1 c 0.90478 Venezuela (Bolivarian Republic of) 88.4 12.8 6.0 0.36 52.9 –10.3 1.7 34.6 1.4 0.82779 Brazil 59.1 43.8 2.6 0.17 59.0 –9.7 0.9 29.9 1.0 0.90180 Azerbaijan 98.4 2.3 3.9 0.24 13.8 34.6 34.5 63.9 1.1 0.91080 Lebanon 97.6 3.6 4.3 0.31 13.4 4.8 .. 51.4 0.8 0.91880 The former Yugoslav Republic of Macedonia 79.3 24.2 3.6 0.29 39.6 10.3 8.6 82.2 0.1 c 0.97183 Armenia 74.6 15.8 1.9 0.24 11.7 –0.9 42.1 54.8 0.2 0.84583 Thailand 79.8 22.9 4.6 0.31 32.1 17.1 13.1 61.5 3.5 0.79885 Algeria 100.0 0.1 3.7 0.28 0.8 17.3 66.9 49.7 1.9 0.90486 China 87.5 12.4 7.5 0.59 22.2 32.6 20.9 112.7 0.6 0.74686 Ecuador 86.9 13.8 2.8 0.25 50.5 –4.4 .. 24.5 0.6 0.68688 Ukraine 75.3 4.1 5.0 0.64 16.7 4.1 8.5 70.7 0.3 0.94589 Peru 79.6 25.5 2.0 0.17 57.8 –5.1 0.7 63.9 1.3 0.72390 Colombia 76.7 23.6 1.8 0.14 52.7 –9.2 0.5 37.0 0.8 0.74090 Saint Lucia .. 2.1 2.3 0.19 33.3 –6.9 14.3 30.0 0.6 0.84692 Fiji .. 31.3 1.3 0.16 55.7 6.7 .. 99.0 2.9 0.67192 Mongolia 94.1 3.4 7.1 0.63 8.1 0.1 1.6 155.9 1.3 0.94694 Dominican Republic 86.5 16.5 2.1 0.16 41.0 79.5 30.4 43.0 2.2 0.73595 Jordan 97.6 3.2 3.0 0.35 1.1 –0.6 117.8 51.2 0.6 0.95995 Tunisia 88.4 12.6 2.6 0.24 6.7 61.9 69.7 56.1 1.0 0.97497 Jamaica 81.0 16.8 2.6 0.32 31.0 –2.7 7.5 25.4 0.6 0.72498 Tonga .. 1.9 1.1 0.23 12.5 0.0 .. 73.3 1.4 0.71199 Saint Vincent and the Grenadines .. 5.8 1.9 0.19 69.2 8.0 7.9 47.6 1.3 0.772
100 Suriname 76.3 24.9 3.6 0.24 98.3 –0.6 0.6 56.7 2.0 0.985101 Botswana 74.7 28.9 3.2 0.20 19.1 –21.0 .. 101.3 11.8 0.980101 Maldives .. 1.0 3.3 0.24 3.3 0.0 15.7 25.6 0.3 0.846103 Dominica .. 7.8 1.9 0.18 57.8 –13.3 10.0 .. .. 0.669104 Samoa .. 34.3 1.0 0.19 60.4 31.5 .. 85.0 1.5 0.819105 Uzbekistan 97.7 3.0 3.4 0.64 7.6 5.7 .. 81.1 0.4 0.970106 Belize .. 35.0 1.4 0.18 59.9 –15.5 .. 68.6 1.0 0.744106 Marshall Islands .. 11.2 1.9 0.53 70.2 .. .. .. .. 0.841
HUMAN DEVELOPMENT INDICES AND INDICATORS: 2018 STATISTICAL UPDATE
DASHBOARD 4 Environmental sustainability | 97

DASHBOARD 4 ENVIRONMENTAL SUSTAINABILITY
DASH BOARD
4
SDG 12.c SDG 7.2 SDG 9.4 SDG 15.1 SDG 6.4 SDG 3.9 SDG 3.9 SDG 15.5Environmental threats
Mortality rate attributed to
Fossil fuel energy
consumption
Renewable energy
consumption Carbon dioxide emissions Forest areaFresh water withdrawals
Household and ambient air pollution
Unsafe water, sanitation
and hygiene services Red List Index
(% of total energy
consumption)
(% of total final energy
consumption)Per capita (tonnes)
(kg per 2011 PPP $ of GDP)
(% of total land areaa) Change (%)
(% of total renewable water
resources) (per 100,000 population) (value)
HDI rank 2010–2015b 2015 2014 2014 2015 1990/2015 2006–2016b 2016 2016 2017
108 Libya 99.1 2.0 9.2 0.56 0.1 0.0 822.9 71.9 0.6 0.971108 Turkmenistan .. 0.0 12.5 0.87 8.8 0.0 .. 79.3 4.0 0.974110 Gabon 24.2 82.0 2.8 0.17 89.3 4.5 .. 76.0 20.6 0.961110 Paraguay 33.7 61.7 0.9 0.10 38.6 –27.6 0.6 57.5 1.5 0.949112 Moldova (Republic of) 88.7 14.3 1.4 0.29 12.4 28.2 8.7 78.3 0.1 c 0.968MEDIUM HUMAN DEVELOPMENT113 Philippines 62.0 27.5 1.1 0.16 27.0 22.7 17.0 185.2 4.2 0.648113 South Africa 86.9 17.2 9.0 0.72 7.6 0.0 30.2 86.7 13.7 0.778115 Egypt 96.0 5.7 2.2 0.22 0.1 65.9 126.6 108.9 2.0 0.914116 Indonesia 65.6 36.9 1.8 0.18 50.2 –23.2 .. 112.4 7.1 0.763116 Viet Nam 69.8 35.0 1.8 0.34 47.6 65.6 .. 64.5 1.6 0.740118 Bolivia (Plurinational State of) 85.2 17.5 1.9 0.31 50.6 –12.8 0.4 63.7 5.6 0.871119 Palestine, State of .. 10.5 0.6 d 0.13 d 1.5 1.0 .. .. .. 0.787120 Iraq 97.3 0.8 4.8 0.32 1.9 3.3 .. 75.1 3.0 0.819121 El Salvador 48.4 24.4 1.0 0.15 12.8 –29.7 .. 41.9 2.0 0.829122 Kyrgyzstan 69.3 23.3 1.6 0.52 3.3 –23.8 32.6 110.7 0.8 0.984123 Morocco 88.5 11.3 1.7 0.24 12.6 13.7 35.7 49.1 1.9 0.886124 Nicaragua 40.9 48.2 0.8 0.17 25.9 –31.0 0.9 55.7 2.2 0.854125 Cabo Verde .. 26.6 0.9 0.16 22.3 55.7 .. 99.5 4.1 0.881125 Guyana .. 25.3 2.6 0.38 84.0 –0.8 0.5 107.8 3.6 0.922127 Guatemala 37.4 63.7 1.2 0.16 33.0 –25.4 2.6 73.8 6.3 0.722127 Tajikistan 54.9 44.7 0.6 0.24 3.0 1.8 51.1 129.3 2.7 0.984129 Namibia 66.7 26.5 1.6 0.16 8.4 –21.0 .. 145.0 18.3 0.966130 India 73.5 36.0 1.7 0.32 23.8 10.5 33.9 184.3 18.6 0.684131 Micronesia (Federated States of) .. 1.2 1.4 0.46 91.8 .. .. 151.8 3.6 0.691132 Timor-Leste .. 18.2 0.4 0.06 46.1 –29.0 .. 139.8 9.9 0.889133 Honduras 52.5 51.5 1.1 0.25 41.0 –43.6 .. 60.7 3.6 0.744134 Bhutan .. 86.9 1.3 0.18 72.3 34.7 0.4 124.5 3.9 0.799134 Kiribati .. 4.3 0.6 0.31 15.0 0.0 .. 140.2 16.7 0.770136 Bangladesh 73.8 34.7 0.5 0.15 11.0 –4.4 2.9 149.0 11.9 0.766137 Congo 40.5 62.4 0.6 0.11 65.4 –1.7 .. 130.7 38.7 0.984138 Vanuatu .. 36.1 0.6 0.21 36.1 0.0 .. 135.6 10.4 0.665139 Lao People’s Democratic Republic .. 59.3 0.3 0.05 81.3 6.3 .. 188.5 11.3 0.810140 Ghana 52.3 41.4 0.5 0.14 41.0 8.2 .. 203.8 18.8 0.844141 Equatorial Guinea .. 7.8 4.7 0.15 55.9 –15.7 .. 177.7 22.3 0.813142 Kenya 17.2 72.7 0.3 0.11 7.8 –6.6 10.5 78.1 51.2 0.801143 Sao Tome and Principe .. 41.1 0.6 0.20 55.8 –4.3 .. 162.4 11.4 0.788144 Eswatini (Kingdom of) .. 66.1 0.9 0.12 34.1 24.2 .. 137.0 27.9 0.818144 Zambia 10.6 88.0 0.3 0.08 65.4 –7.9 .. 127.2 34.9 0.879146 Cambodia 30.7 64.9 0.4 0.14 53.6 –26.9 0.5 149.8 6.5 0.823147 Angola 48.3 49.6 1.3 0.21 46.4 –5.1 .. 118.5 48.8 0.936148 Myanmar 39.3 61.5 0.4 0.09 44.5 –25.9 .. 156.4 12.6 0.807149 Nepal 15.8 85.3 0.3 0.13 25.4 –24.7 4.5 193.8 19.8 0.825150 Pakistan 59.7 46.5 0.9 0.20 1.9 –41.7 74.4 173.6 19.6 0.862151 Cameroon 29.9 76.5 0.3 0.10 39.8 –22.6 .. 208.1 45.2 0.836LOW HUMAN DEVELOPMENT152 Solomon Islands .. 63.3 0.4 0.16 78.1 –6.0 .. 137.0 6.2 0.769153 Papua New Guinea .. 52.5 0.8 0.22 74.1 –0.2 .. 152.0 16.3 0.839154 Tanzania (United Republic of) 14.4 85.7 0.2 0.09 52.0 –17.6 .. 139.0 38.4 0.691155 Syrian Arab Republic 97.7 0.5 1.6 .. 2.7 32.1 .. 75.2 3.7 0.953156 Zimbabwe 29.1 81.8 0.8 0.41 36.4 –36.6 17.9 133.0 24.6 0.789157 Nigeria 19.0 86.6 0.5 0.10 7.7 –59.4 4.4 307.4 68.6 0.874158 Rwanda .. 86.7 0.1 0.05 19.5 50.9 .. 121.4 19.3 0.849159 Lesotho .. 52.1 1.2 0.43 1.6 22.5 .. 177.6 44.4 0.966159 Mauritania .. 32.2 0.7 0.18 0.2 –45.9 .. 169.5 38.6 0.978161 Madagascar .. 70.2 0.1 0.10 21.4 –8.9 4.0 159.6 30.2 0.795162 Uganda .. 89.1 0.1 0.08 10.4 –56.4 1.1 155.7 31.6 0.752163 Benin 44.4 50.9 0.6 0.31 38.2 –25.2 .. 205.0 59.7 0.910
98 | HUMAN DEVELOPMENT INDICES AND INDICATORS: 2018 STATISTICAL UPDATE

DASH BOARD
4
SDG 12.c SDG 7.2 SDG 9.4 SDG 15.1 SDG 6.4 SDG 3.9 SDG 3.9 SDG 15.5Environmental threats
Mortality rate attributed to
Fossil fuel energy
consumption
Renewable energy
consumption Carbon dioxide emissions Forest areaFresh water withdrawals
Household and ambient air pollution
Unsafe water, sanitation
and hygiene services Red List Index
(% of total energy
consumption)
(% of total final energy
consumption)Per capita (tonnes)
(kg per 2011 PPP $ of GDP)
(% of total land areaa) Change (%)
(% of total renewable water
resources) (per 100,000 population) (value)
HDI rank 2010–2015b 2015 2014 2014 2015 1990/2015 2006–2016b 2016 2016 2017
164 Senegal 53.7 42.7 0.6 0.27 43.0 –11.5 .. 160.7 23.9 0.945165 Comoros .. 45.3 0.2 0.14 19.9 –24.5 .. 172.4 50.7 0.764165 Togo 17.2 71.3 0.4 0.28 3.5 –72.6 .. 249.6 41.6 0.854167 Sudan 31.8 61.6 0.3 0.10 8.1 –37.5 71.2 184.9 17.3 0.934168 Afghanistan .. 18.4 0.3 0.16 2.1 0.0 .. 211.1 13.9 0.837168 Haiti 22.0 76.1 0.3 0.16 3.5 –16.4 10.3 184.3 23.8 0.721170 Côte d’Ivoire 26.5 64.5 0.5 0.16 32.7 1.8 .. 269.1 47.2 0.889171 Malawi .. 83.6 0.1 0.07 33.4 –19.2 .. 115.0 28.3 0.806172 Djibouti .. 15.4 0.8 0.20 e 0.2 0.0 .. 159.0 31.3 0.822173 Ethiopia 6.1 92.2 0.1 0.08 12.5 –17.8 8.6 144.4 43.7 0.840174 Gambia .. 51.5 0.3 0.17 48.2 10.4 .. 237.0 29.7 0.981175 Guinea .. 76.3 0.2 0.12 25.9 –12.4 .. 243.3 44.6 0.896176 Congo (Democratic Republic of the) 5.4 95.8 0.1 0.08 67.3 –4.9 .. 163.9 59.8 0.891177 Guinea-Bissau .. 86.9 0.2 0.11 70.1 –11.0 .. 214.7 35.3 0.960178 Yemen 98.5 2.3 0.9 0.23 1.0 0.0 .. 194.2 10.2 0.881179 Eritrea 22.3 79.8 0.1 e 0.09 e 15.0 .. .. 173.7 45.6 0.909180 Mozambique 12.6 86.4 0.3 0.29 48.2 –12.5 0.7 110.0 27.6 0.830181 Liberia .. 83.8 0.2 0.26 43.4 –15.2 .. 170.2 41.5 0.890182 Mali .. 61.5 0.1 0.04 3.9 –29.5 4.3 209.1 70.7 0.982183 Burkina Faso .. 74.2 0.2 0.10 19.6 –21.9 .. 206.2 49.6 0.989184 Sierra Leone .. 77.7 0.2 0.11 42.2 –2.4 .. 324.1 81.3 0.913185 Burundi .. 95.7 0.0 0.06 10.7 –4.5 .. 179.9 65.4 0.921186 Chad .. 89.4 0.1 0.03 3.9 –27.3 .. 280.1 101.0 0.920187 South Sudan 72.2 39.1 0.1 0.07 .. .. 1.3 165.1 63.3 0.932188 Central African Republic .. 76.6 0.1 0.11 35.6 –1.7 .. 211.9 82.1 0.944189 Niger 24.1 78.9 0.1 0.12 0.9 –41.3 .. 251.8 70.8 0.939OTHER COUNTRIES OR TERRITORIES
.. Korea (Democratic People’s Rep. of) 81.4 23.1 1.6 .. 41.8 –38.7 .. 207.2 1.4 0.913
.. Monaco .. .. .. .. .. .. .. .. .. 0.753
.. Nauru .. 0.1 4.0 0.32 0.0 0.0 .. .. .. 0.773
.. San Marino .. .. .. .. 0.0 0.0 .. .. .. 0.992
.. Somalia .. 94.3 0.0 .. 10.1 –23.2 .. 212.8 86.6 0.902
.. Tuvalu .. 0.0 1.0 0.32 33.3 0.0 .. .. .. 0.832Human development groups
Very high human development 82.6 10.4 10.7 0.28 33.1 1.1 6.1 23.6 0.3 —High human development 85.8 14.6 6.1 0.46 31.5 –1.7 4.8 86.2 0.8 —Medium human development 71.2 35.8 1.7 0.28 30.5 –9.7 .. 156.2 15.6 —Low human development .. 81.0 0.3 0.12 23.1 –14.5 .. 200.2 45.9 —
Developing countries 80.5 23.5 3.4 0.38 26.6 –6.7 .. 133.1 14.0 —Regions
Arab States 97.2 4.0 4.9 0.32 3.0 –23.7 .. 101.2 7.0 —East Asia and the Pacific .. 15.9 5.8 0.50 29.8 3.8 .. 114.4 2.2 —Europe and Central Asia 87.2 9.1 5.1 0.35 9.1 8.3 14.3 66.5 0.5 —Latin America and the Caribbean 74.5 27.7 3.0 0.21 46.3 –9.3 1.6 39.3 1.7 —South Asia 76.7 31.1 1.8 0.32 14.7 7.6 23.8 173.7 17.1 —Sub-Saharan Africa 39.2 70.2 0.8 0.24 28.2 –11.7 .. 186.4 47.7 —
Least developed countries .. 73.2 0.3 0.13 26.8 –12.4 .. 166.5 34.3 —Small island developing states .. 26.4 2.4 0.29 69.5 1.3 .. 100.1 10.0 —Organisation for Economic Co-operation and Development 80.0 12.0 9.5 0.25 31.3 1.5 8.6 18.9 0.4 —World 80.6 18.2 4.6 0.33 30.8 –3.2 7.2 114.1 11.7 —
HUMAN DEVELOPMENT INDICES AND INDICATORS: 2018 STATISTICAL UPDATE
DASHBOARD 4 Environmental sustainability | 99
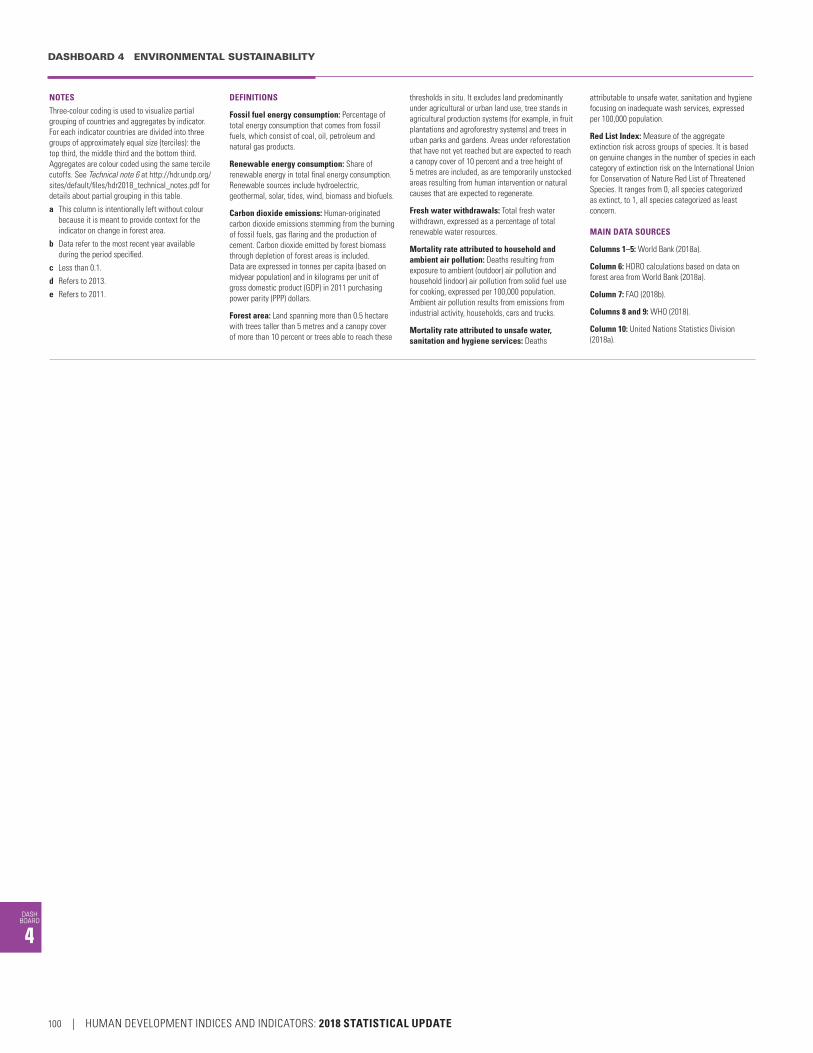
DASHBOARD 4 ENVIRONMENTAL SUSTAINABILITY
DASH BOARD
4
NOTES
Three-colour coding is used to visualize partial grouping of countries and aggregates by indicator. For each indicator countries are divided into three groups of approximately equal size (terciles): the top third, the middle third and the bottom third. Aggregates are colour coded using the same tercile cutoffs. See Technical note 6 at http://hdr.undp.org/sites/default/files/hdr2018_technical_notes.pdf for details about partial grouping in this table.
a This column is intentionally left without colour because it is meant to provide context for the indicator on change in forest area.
b Data refer to the most recent year available during the period specified.
c Less than 0.1.
d Refers to 2013.
e Refers to 2011.
DEFINITIONS
Fossil fuel energy consumption: Percentage of total energy consumption that comes from fossil fuels, which consist of coal, oil, petroleum and natural gas products.
Renewable energy consumption: Share of renewable energy in total final energy consumption. Renewable sources include hydroelectric, geothermal, solar, tides, wind, biomass and biofuels.
Carbon dioxide emissions: Human-originated carbon dioxide emissions stemming from the burning of fossil fuels, gas flaring and the production of cement. Carbon dioxide emitted by forest biomass through depletion of forest areas is included. Data are expressed in tonnes per capita (based on midyear population) and in kilograms per unit of gross domestic product (GDP) in 2011 purchasing power parity (PPP) dollars.
Forest area: Land spanning more than 0.5 hectare with trees taller than 5 metres and a canopy cover of more than 10 percent or trees able to reach these
thresholds in situ. It excludes land predominantly under agricultural or urban land use, tree stands in agricultural production systems (for example, in fruit plantations and agroforestry systems) and trees in urban parks and gardens. Areas under reforestation that have not yet reached but are expected to reach a canopy cover of 10 percent and a tree height of 5 metres are included, as are temporarily unstocked areas resulting from human intervention or natural causes that are expected to regenerate.
Fresh water withdrawals: Total fresh water withdrawn, expressed as a percentage of total renewable water resources.
Mortality rate attributed to household and ambient air pollution: Deaths resulting from exposure to ambient (outdoor) air pollution and household (indoor) air pollution from solid fuel use for cooking, expressed per 100,000 population. Ambient air pollution results from emissions from industrial activity, households, cars and trucks.
Mortality rate attributed to unsafe water, sanitation and hygiene services: Deaths
attributable to unsafe water, sanitation and hygiene focusing on inadequate wash services, expressed per 100,000 population.
Red List Index: Measure of the aggregate extinction risk across groups of species. It is based on genuine changes in the number of species in each category of extinction risk on the International Union for Conservation of Nature Red List of Threatened Species. It ranges from 0, all species categorized as extinct, to 1, all species categorized as least concern.
MAIN DATA SOURCES
Columns 1–5: World Bank (2018a).
Column 6: HDRO calculations based on data on forest area from World Bank (2018a).
Column 7: FAO (2018b).
Columns 8 and 9: WHO (2018).
Column 10: United Nations Statistics Division (2018a).
100 | HUMAN DEVELOPMENT INDICES AND INDICATORS: 2018 STATISTICAL UPDATE

DASH BOARD
5
DASHBOARD 5 Socioeconomic sustainability | 101
Country groupings (terciles)Top third Middle third Bottom third
Three-colour coding is used to visualize partial grouping of countries by indicator. For each indicator countries are divided into three groups of approximately equal size (terciles): the top third, the middle third and the bottom third. Aggregates are colour coded using the same tercile cutoffs. See Notes after the table.
5DASHBOA
RDSocioeconomic sustainability
SDG 17.4 SDG 9.5 SDG 10.1 SDG 5 SDG 10.1
HDI rank
Economic sustainability Social sustainability
Education and health expenditure versus military expenditure
Adjusted net savings
Total debt service
Gross capital
formation
Skilled labour force
Concentration index
(exports)
Research and
development expenditure
Military expenditurea
Ratio of education and health
expenditure to military
expenditureb
Overall loss in
HDI value due to
inequality
Gender Inequality
IndexIncome
quintile ratio
(% of GNI)
(% of exports of goods, services and
primary income) (% of GDP)(% of labour
force) (value) (% of GDP) (% of GDP)Average annual changec
(%)
2006–2016d 2006–2016d 2011–2017d 2011–2017d 2016 2005–2015d 2010–2017d 2010–2015e 2010/2017f 2005/2017f 2005/2017f
VERY HIGH HUMAN DEVELOPMENT1 Norway 15.8 .. 28.8 82.4 0.315 1.9 1.7 11.6 3.0 –3.6 –0.72 Switzerland 16.4 .. 23.3 85.7 0.288 3.0 0.7 25.6 1.5 –3.9 ..3 Australia 5.3 .. 24.2 78.3 0.244 2.2 2.0 8.0 0.6 –1.8 0.44 Ireland 20.6 .. 24.3 82.8 0.242 1.5 0.3 32.0 –0.3 –3.6 –0.65 Germany 13.6 .. 19.8 86.5 0.106 2.9 1.2 13.5 0.1 –3.2 1.06 Iceland 21.8 .. 22.2 73.4 0.441 2.2 0.0 .. –1.3 –4.2 –1.27 Hong Kong, China (SAR) .. .. 22.3 76.9 0.268 0.8 .. .. .. .. ..7 Sweden 20.2 .. 25.7 84.9 0.091 3.3 1.0 16.5 1.2 –1.4 1.19 Singapore 32.7 .. 27.6 81.7 0.240 2.2 3.2 2.2 .. –5.0 ..
10 Netherlands 16.5 .. 20.2 77.4 0.072 2.0 1.2 14.0 –0.3 –3.9 0.011 Denmark 18.3 .. 21.0 76.6 0.097 3.0 1.2 15.6 2.4 –3.2 1.112 Canada 5.3 .. 23.7 90.8 0.138 1.6 1.3 .. –1.1 –2.5 0.513 United States 6.1 .. 19.7 96.3 0.100 2.8 3.1 6.2 3.0 –2.4 0.514 United Kingdom 3.3 .. 17.0 83.2 0.108 1.7 1.8 8.3 –0.5 –3.6 –0.915 Finland 7.8 .. 22.8 88.3 0.143 2.9 1.4 11.4 –3.6 –2.9 0.016 New Zealand 12.0 .. 24.4 82.8 0.162 1.2 1.1 14.3 .. –2.3 ..17 Belgium 9.5 .. 24.6 83.3 0.095 2.5 0.9 17.4 0.5 –4.5 –0.317 Liechtenstein .. .. .. .. .. .. .. .. .. .. ..19 Japan 6.0 .. 23.6 99.9 0.141 3.3 0.9 14.9 .. –2.4 ..20 Austria 12.7 .. 25.1 86.1 0.062 3.1 0.7 21.0 1.0 –3.3 1.321 Luxembourg 18.8 .. 17.3 65.4 0.102 1.3 0.5 24.4 2.1 –4.8 0.322 Israel 15.9 .. 20.5 88.6 0.255 4.3 4.7 2.2 0.3 –3.6 0.322 Korea (Republic of) 19.0 .. 31.1 84.6 0.144 4.2 2.6 4.7 –2.0 –3.4 ..24 France 7.1 .. 23.5 82.6 0.098 2.2 2.3 7.5 1.6 –3.9 1.425 Slovenia 7.9 .. 19.3 90.6 0.106 2.2 1.0 14.2 –2.6 –5.1 0.426 Spain 7.9 .. 21.2 62.9 0.107 1.2 1.2 10.7 8.2 –2.6 2.627 Czechia 4.6 .. 26.3 95.2 0.124 1.9 1.0 12.0 –1.7 –1.6 –0.628 Italy 5.1 .. 17.3 67.5 0.052 1.3 1.5 8.9 0.3 –4.2 1.029 Malta .. .. 23.1 60.6 0.336 0.8 0.5 33.2 .. –2.4 ..30 Estonia 12.6 .. 25.4 89.2 0.110 1.5 2.1 6.0 –1.4 –3.6 –0.331 Greece –8.6 .. 11.7 76.7 0.234 1.0 2.6 .. 4.6 –2.8 1.632 Cyprus 2.2 .. 20.4 84.2 0.234 0.5 1.8 8.4 –0.1 –3.3 1.933 Poland 10.5 .. 20.0 94.5 0.067 1.0 1.9 5.9 –2.3 –1.6 –1.134 United Arab Emirates .. .. 24.8 53.5 0.227 0.9 5.6 .. .. –5.1 ..35 Andorra .. .. .. .. 0.199 .. .. .. .. .. ..35 Lithuania 17.5 .. 17.5 95.7 0.112 1.0 1.7 12.1 0.3 –2.8 0.837 Qatar 25.8 .. 45.2 44.0 0.400 0.5 1.5 .. .. .. ..38 Slovakia 5.1 .. 22.4 93.7 0.195 1.2 1.2 10.2 0.2 –0.4 –0.639 Brunei Darussalam 34.1 .. 34.8 79.1 0.629 .. 2.9 1.8 .. .. ..39 Saudi Arabia 12.2 .. 28.2 60.5 0.593 0.8 10.2 .. .. –5.4 ..41 Latvia 1.9 .. 21.5 91.2 0.093 0.6 1.7 13.9 –0.8 –0.8 –2.241 Portugal 2.4 .. 16.3 52.0 0.071 1.3 1.7 7.9 2.0 –4.3 –0.743 Bahrain 8.0 .. 29.6 .. 0.320 0.1 4.0 1.7 .. –2.6 ..44 Chile 5.1 .. 22.1 69.2 0.306 0.4 1.9 6.8 –2.5 –1.5 –1.945 Hungary 9.7 95.5 22.5 87.2 0.123 1.4 1.0 13.6 –1.2 0.0 –1.646 Croatia 9.0 .. 20.5 90.5 0.066 0.9 1.4 7.2 –5.9 –2.0 ..47 Argentina 5.9 34.9 19.1 63.4 0.195 0.6 0.9 15.0 –3.9 –0.3 –3.148 Oman –6.0 .. 36.4 .. 0.506 0.2 12.0 0.5 .. –2.7 ..49 Russian Federation 6.7 19.2 23.9 96.1 0.305 1.1 4.2 2.5 –2.5 –2.4 –1.8
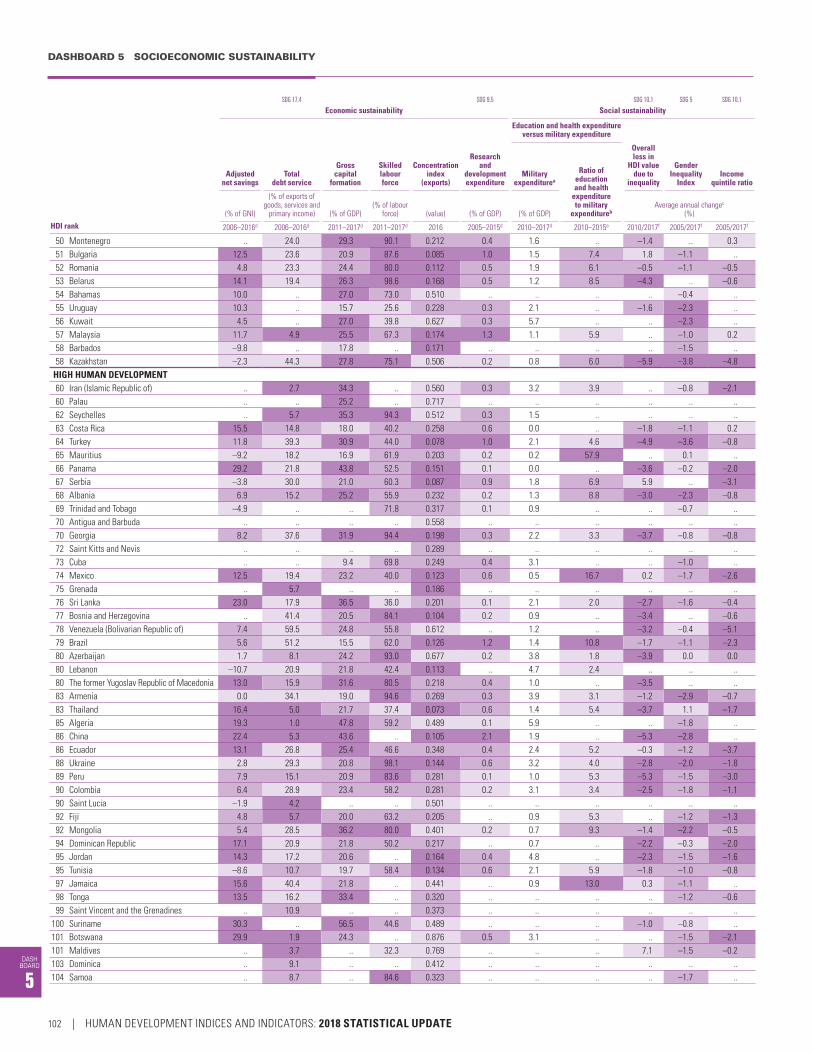
DASHBOARD 5 SOCIOECONOMIC SUSTAINABILITY
DASH BOARD
5
SDG 17.4 SDG 9.5 SDG 10.1 SDG 5 SDG 10.1
HDI rank
Economic sustainability Social sustainability
Education and health expenditure versus military expenditure
Adjusted net savings
Total debt service
Gross capital
formation
Skilled labour force
Concentration index
(exports)
Research and
development expenditure
Military expenditurea
Ratio of education and health
expenditure to military
expenditureb
Overall loss in
HDI value due to
inequality
Gender Inequality
IndexIncome
quintile ratio
(% of GNI)
(% of exports of goods, services and
primary income) (% of GDP)(% of labour
force) (value) (% of GDP) (% of GDP)Average annual changec
(%)
2006–2016d 2006–2016d 2011–2017d 2011–2017d 2016 2005–2015d 2010–2017d 2010–2015e 2010/2017f 2005/2017f 2005/2017f
50 Montenegro .. 24.0 29.3 90.1 0.212 0.4 1.6 .. –1.4 .. 0.351 Bulgaria 12.5 23.6 20.9 87.6 0.085 1.0 1.5 7.4 1.8 –1.1 ..52 Romania 4.8 23.3 24.4 80.0 0.112 0.5 1.9 6.1 –0.5 –1.1 –0.553 Belarus 14.1 19.4 26.3 98.6 0.168 0.5 1.2 8.5 –4.3 .. –0.654 Bahamas 10.0 .. 27.0 73.0 0.510 .. .. .. .. –0.4 ..55 Uruguay 10.3 .. 15.7 25.6 0.228 0.3 2.1 .. –1.6 –2.3 ..56 Kuwait 4.5 .. 27.0 39.8 0.627 0.3 5.7 .. .. –2.3 ..57 Malaysia 11.7 4.9 25.5 67.3 0.174 1.3 1.1 5.9 .. –1.0 0.258 Barbados –9.8 .. 17.8 .. 0.171 .. .. .. .. –1.5 ..58 Kazakhstan –2.3 44.3 27.8 75.1 0.506 0.2 0.8 6.0 –5.9 –3.8 –4.8
HIGH HUMAN DEVELOPMENT60 Iran (Islamic Republic of) .. 2.7 34.3 .. 0.560 0.3 3.2 3.9 .. –0.8 –2.160 Palau .. .. 25.2 .. 0.717 .. .. .. .. .. ..62 Seychelles .. 5.7 35.3 94.3 0.512 0.3 1.5 .. .. .. ..63 Costa Rica 15.5 14.8 18.0 40.2 0.258 0.6 0.0 .. –1.8 –1.1 0.264 Turkey 11.8 39.3 30.9 44.0 0.078 1.0 2.1 4.6 –4.9 –3.6 –0.865 Mauritius –9.2 18.2 16.9 61.9 0.203 0.2 0.2 57.9 .. 0.1 ..66 Panama 29.2 21.8 43.8 52.5 0.151 0.1 0.0 .. –3.6 –0.2 –2.067 Serbia –3.8 30.0 21.0 60.3 0.087 0.9 1.8 6.9 5.9 .. –3.168 Albania 6.9 15.2 25.2 55.9 0.232 0.2 1.3 8.8 –3.0 –2.3 –0.869 Trinidad and Tobago –4.9 .. .. 71.8 0.317 0.1 0.9 .. .. –0.7 ..70 Antigua and Barbuda .. .. .. .. 0.558 .. .. .. .. .. ..70 Georgia 8.2 37.6 31.9 94.4 0.198 0.3 2.2 3.3 –3.7 –0.8 –0.872 Saint Kitts and Nevis .. .. .. .. 0.289 .. .. .. .. .. ..73 Cuba .. .. 9.4 69.8 0.249 0.4 3.1 .. .. –1.0 ..74 Mexico 12.5 19.4 23.2 40.0 0.123 0.6 0.5 16.7 0.2 –1.7 –2.675 Grenada .. 5.7 .. .. 0.186 .. .. .. .. .. ..76 Sri Lanka 23.0 17.9 36.5 36.0 0.201 0.1 2.1 2.0 –2.7 –1.6 –0.477 Bosnia and Herzegovina .. 41.4 20.5 84.1 0.104 0.2 0.9 .. –3.4 .. –0.678 Venezuela (Bolivarian Republic of) 7.4 59.5 24.8 55.8 0.612 .. 1.2 .. –3.2 –0.4 –5.179 Brazil 5.6 51.2 15.5 62.0 0.126 1.2 1.4 10.8 –1.7 –1.1 –2.380 Azerbaijan 1.7 8.1 24.2 93.0 0.677 0.2 3.8 1.8 –3.9 0.0 0.080 Lebanon –10.7 20.9 21.8 42.4 0.113 .. 4.7 2.4 .. .. ..80 The former Yugoslav Republic of Macedonia 13.0 15.9 31.6 80.5 0.218 0.4 1.0 .. –3.5 .. ..83 Armenia 0.0 34.1 19.0 94.6 0.269 0.3 3.9 3.1 –1.2 –2.9 –0.783 Thailand 16.4 5.0 21.7 37.4 0.073 0.6 1.4 5.4 –3.7 1.1 –1.785 Algeria 19.3 1.0 47.8 59.2 0.489 0.1 5.9 .. .. –1.8 ..86 China 22.4 5.3 43.6 .. 0.105 2.1 1.9 .. –5.3 –2.8 ..86 Ecuador 13.1 26.8 25.4 46.6 0.348 0.4 2.4 5.2 –0.3 –1.2 –3.788 Ukraine 2.8 29.3 20.8 98.1 0.144 0.6 3.2 4.0 –2.8 –2.0 –1.889 Peru 7.9 15.1 20.9 83.6 0.281 0.1 1.0 5.3 –5.3 –1.5 –3.090 Colombia 6.4 28.9 23.4 58.2 0.281 0.2 3.1 3.4 –2.5 –1.8 –1.190 Saint Lucia –1.9 4.2 .. .. 0.501 .. .. .. .. .. ..92 Fiji 4.8 5.7 20.0 63.2 0.205 .. 0.9 5.3 .. –1.2 –1.392 Mongolia 5.4 28.5 36.2 80.0 0.401 0.2 0.7 9.3 –1.4 –2.2 –0.594 Dominican Republic 17.1 20.9 21.8 50.2 0.217 .. 0.7 .. –2.2 –0.3 –2.095 Jordan 14.3 17.2 20.6 .. 0.164 0.4 4.8 .. –2.3 –1.5 –1.695 Tunisia –8.6 10.7 19.7 58.4 0.134 0.6 2.1 5.9 –1.8 –1.0 –0.897 Jamaica 15.6 40.4 21.8 .. 0.441 .. 0.9 13.0 0.3 –1.1 ..98 Tonga 13.5 16.2 33.4 .. 0.320 .. .. .. .. –1.2 –0.699 Saint Vincent and the Grenadines .. 10.9 .. .. 0.373 .. .. .. .. .. ..
100 Suriname 30.3 .. 56.5 44.6 0.489 .. .. .. –1.0 –0.8 ..101 Botswana 29.9 1.9 24.3 .. 0.876 0.5 3.1 .. .. –1.5 –2.1101 Maldives .. 3.7 .. 32.3 0.769 .. .. .. 7.1 –1.5 –0.2103 Dominica .. 9.1 .. .. 0.412 .. .. .. .. .. ..104 Samoa .. 8.7 .. 84.6 0.323 .. .. .. .. –1.7 ..
102 | HUMAN DEVELOPMENT INDICES AND INDICATORS: 2018 STATISTICAL UPDATE

DASH BOARD
5
SDG 17.4 SDG 9.5 SDG 10.1 SDG 5 SDG 10.1
HDI rank
Economic sustainability Social sustainability
Education and health expenditure versus military expenditure
Adjusted net savings
Total debt service
Gross capital
formation
Skilled labour force
Concentration index
(exports)
Research and
development expenditure
Military expenditurea
Ratio of education and health
expenditure to military
expenditureb
Overall loss in
HDI value due to
inequality
Gender Inequality
IndexIncome
quintile ratio
(% of GNI)
(% of exports of goods, services and
primary income) (% of GDP)(% of labour
force) (value) (% of GDP) (% of GDP)Average annual changec
(%)
2006–2016d 2006–2016d 2011–2017d 2011–2017d 2016 2005–2015d 2010–2017d 2010–2015e 2010/2017f 2005/2017f 2005/2017f
105 Uzbekistan .. .. 24.9 .. 0.386 0.2 .. .. .. .. ..106 Belize 0.8 10.1 19.0 39.8 0.356 .. 1.2 11.7 –3.2 –1.4 ..106 Marshall Islands .. .. 16.0 .. 0.630 .. .. .. .. .. ..108 Libya 41.5 .. 29.8 .. 0.542 .. 9.1 .. .. –3.1 ..108 Turkmenistan .. .. 47.2 .. 0.722 .. .. .. –4.3 .. ..110 Gabon .. .. 32.4 .. 0.761 0.6 2.1 4.5 0.9 –0.8 0.0110 Paraguay 7.7 11.0 19.5 43.8 0.336 0.1 1.2 9.6 0.5 –1.1 –1.7112 Moldova (Republic of) 13.8 13.0 23.3 60.7 0.165 0.4 0.4 51.4 –3.3 –1.9 –3.8MEDIUM HUMAN DEVELOPMENT113 Philippines 28.4 12.6 25.0 30.6 0.287 0.1 1.4 .. –0.8 –0.7 –0.6113 South Africa –0.1 13.2 18.6 47.2 0.121 0.7 1.0 12.6 1.0 –0.7 0.4115 Egypt 2.3 18.9 15.3 58.1 0.154 0.7 1.4 .. 0.9 –1.9 –0.1116 Indonesia 16.0 39.6 33.5 40.8 0.128 0.1 0.8 7.8 0.9 –1.3 ..116 Viet Nam 18.4 3.9 25.8 32.8 0.173 0.4 2.3 5.5 0.8 –0.3 –0.3118 Bolivia (Plurinational State of) .. 9.3 22.2 45.2 0.324 0.2 1.8 6.9 –4.6 –1.6 –5.4119 Palestine, State of .. .. 22.8 47.6 0.185 0.5 .. .. .. .. –0.4120 Iraq –13.0 .. 17.4 28.4 0.937 0.0 3.8 .. .. .. ..121 El Salvador 4.1 19.9 16.9 38.5 0.221 0.1 1.0 9.7 –2.8 –1.6 –4.0122 Kyrgyzstan –1.0 18.6 32.2 92.1 0.316 0.1 2.9 4.1 –5.0 –3.5 –2.2123 Morocco 21.0 10.9 33.2 20.3 0.175 0.7 3.2 .. .. –1.5 0.0124 Nicaragua 15.1 16.0 29.0 27.7 0.219 0.1 0.6 .. –1.0 –1.3 –0.9125 Cabo Verde 8.6 5.8 37.3 47.7 0.325 0.1 0.5 18.2 .. .. –2.1125 Guyana 18.0 5.3 30.1 .. 0.491 .. 1.6 6.8 0.0 –0.5 ..127 Guatemala 2.3 22.3 12.1 19.0 0.133 0.0 0.4 21.9 –2.3 –1.1 –2.7127 Tajikistan –6.5 28.1 31.1 80.2 0.349 0.1 1.2 9.9 –4.1 –0.9 0.4129 Namibia 2.7 .. 17.7 31.4 0.275 0.3 3.3 .. –3.1 –0.9 –1.1130 India 15.5 17.3 30.8 18.5 0.120 0.6 2.5 3.1 –1.4 –1.3 ..131 Micronesia (Federated States of) .. .. .. .. 0.835 .. .. .. .. .. –0.3132 Timor-Leste 21.2 .. 16.2 38.8 0.579 .. 0.9 .. –2.4 .. –2.9133 Honduras 18.5 15.4 23.8 27.9 0.212 .. 1.6 9.1 –2.3 –0.9 –4.4134 Bhutan 23.6 11.6 47.2 21.1 0.372 .. .. .. .. .. –2.7134 Kiribati .. .. .. .. 0.892 .. .. .. .. .. ..136 Bangladesh 26.0 4.7 30.5 27.2 0.406 .. 1.5 3.5 –2.6 –1.2 0.0137 Congo –22.6 1.8 26.6 .. 0.669 .. 5.6 .. –4.1 –0.6 1.6138 Vanuatu 22.9 1.8 26.4 .. 0.532 .. .. .. .. .. ..139 Lao People’s Democratic Republic –1.0 12.9 29.0 33.2 0.204 .. 0.2 31.1 0.7 –1.3 1.9140 Ghana –14.8 10.5 16.1 24.8 0.428 0.4 0.4 17.2 2.0 –0.5 –0.4141 Equatorial Guinea .. .. 12.1 .. 0.681 .. 0.2 .. .. .. ..142 Kenya 0.8 10.6 19.3 .. 0.196 0.8 1.3 8.0 –2.4 –1.3 0.0143 Sao Tome and Principe .. 2.9 .. .. 0.593 .. .. .. .. .. –0.7144 Eswatini (Kingdom of) 12.3 2.1 12.4 15.8 0.229 .. 2.0 7.7 –2.4 –0.6 0.7144 Zambia 10.9 8.6 38.2 .. 0.664 0.3 1.3 .. 1.2 –1.3 2.3146 Cambodia 6.2 6.0 22.9 9.7 0.286 0.1 2.1 4.9 –4.7 –1.3 ..147 Angola –38.4 26.5 7.8 11.2 0.934 .. 2.5 .. –2.7 .. ..148 Myanmar 23.9 0.8 32.9 17.7 0.289 .. 2.5 .. .. .. ..149 Nepal 32.5 8.9 42.5 24.7 0.147 0.3 1.6 6.3 –2.8 –2.2 –3.3150 Pakistan 14.7 15.4 16.1 28.3 0.214 0.2 3.5 1.5 –0.2 –0.8 –0.6151 Cameroon 2.3 6.3 21.6 21.1 0.407 .. 1.2 6.3 0.1 –1.1 4.1LOW HUMAN DEVELOPMENT152 Solomon Islands –6.4 3.9 14.6 .. 0.713 .. .. .. .. .. –3.5153 Papua New Guinea .. 49.1 .. 27.2 0.286 .. 0.3 .. .. 0.7 ..154 Tanzania (United Republic of) 13.3 5.4 24.8 5.1 0.322 0.5 1.1 9.4 –1.8 –0.8 –0.5155 Syrian Arab Republic .. 3.1 27.8 .. 0.165 .. 4.1 .. .. 0.1 ..156 Zimbabwe –20.7 13.4 16.9 13.4 0.366 .. 1.9 7.1 .. –0.8 ..157 Nigeria 3.3 6.3 15.3 .. 0.734 0.2 0.4 .. –2.4 .. 1.1158 Rwanda –6.7 8.3 23.4 6.8 0.327 .. 1.2 11.9 –2.7 –1.8 –1.3
HUMAN DEVELOPMENT INDICES AND INDICATORS: 2018 STATISTICAL UPDATE
DASHBOARD 5 Socioeconomic sustainability | 103

DASHBOARD 5 SOCIOECONOMIC SUSTAINABILITY
DASH BOARD
5
SDG 17.4 SDG 9.5 SDG 10.1 SDG 5 SDG 10.1
HDI rank
Economic sustainability Social sustainability
Education and health expenditure versus military expenditure
Adjusted net savings
Total debt service
Gross capital
formation
Skilled labour force
Concentration index
(exports)
Research and
development expenditure
Military expenditurea
Ratio of education and health
expenditure to military
expenditureb
Overall loss in
HDI value due to
inequality
Gender Inequality
IndexIncome
quintile ratio
(% of GNI)
(% of exports of goods, services and
primary income) (% of GDP)(% of labour
force) (value) (% of GDP) (% of GDP)Average annual changec
(%)
2006–2016d 2006–2016d 2011–2017d 2011–2017d 2016 2005–2015d 2010–2017d 2010–2015e 2010/2017f 2005/2017f 2005/2017f
159 Lesotho 6.5 4.2 28.3 31.2 0.278 0.1 2.0 .. –1.3 –0.6 1.1159 Mauritania –12.7 13.2 56.8 6.0 0.360 .. 2.9 2.6 –0.9 .. –2.4161 Madagascar 6.5 3.7 15.2 38.4 0.300 0.0 0.6 9.0 –1.6 .. 2.0162 Uganda –10.8 18.8 24.0 .. 0.170 0.5 1.8 5.4 –1.7 –1.1 –0.7163 Benin 3.8 3.5 28.6 17.9 0.312 .. 1.3 7.6 0.6 –0.6 13.3164 Senegal 8.0 10.5 28.5 11.8 0.215 0.5 1.9 7.0 –1.4 –1.5 0.4165 Comoros 2.1 0.6 20.9 .. 0.683 .. .. .. 0.5 .. –2.5165 Togo –31.0 3.2 26.4 7.2 0.204 0.3 1.9 6.9 –0.5 –0.9 ..167 Sudan –5.2 6.4 18.9 .. 0.648 0.3 3.5 .. .. –1.3 ..168 Afghanistan –28.5 3.5 17.7 .. 0.319 .. 0.9 13.6 .. –1.0 ..168 Haiti 22.2 5.2 43.4 .. 0.509 .. 0.0 .. –0.6 0.3 ..170 Côte d’Ivoire 25.9 6.4 22.6 8.8 0.376 .. 1.2 6.0 0.3 –0.3 0.5171 Malawi –19.1 5.0 13.4 11.7 0.415 .. 0.8 23.4 –0.8 –0.4 3.3172 Djibouti .. 7.1 50.4 .. 0.224 .. 3.6 .. –0.6 .. 2.9173 Ethiopia 4.0 21.0 39.0 7.3 0.302 0.6 0.7 10.6 –2.5 –1.5 6.3174 Gambia –16.9 15.2 19.2 12.9 0.353 0.1 1.5 7.7 –0.7 –0.4 –4.2175 Guinea .. 2.6 43.1 .. 0.448 .. 1.6 3.0 –1.9 .. –3.3176 Congo (Democratic Republic of the) –12.4 4.3 20.8 44.4 0.509 0.1 0.8 5.1 –2.3 –0.2 0.3177 Guinea-Bissau –18.7 0.7 10.5 .. 0.876 .. 1.6 3.3 –1.0 .. 10.0178 Yemen –10.0 18.8 1.7 30.9 0.349 .. 4.0 .. –1.0 0.2 1.1179 Eritrea .. .. 10.0 .. 0.402 .. .. .. .. .. ..180 Mozambique –15.8 12.6 35.6 8.0 0.270 0.3 0.8 11.3 –4.0 –1.0 3.9181 Liberia –39.3 2.9 20.1 19.8 0.331 .. 0.6 13.8 –2.2 –0.3 ..182 Mali –5.0 4.2 19.9 5.2 0.737 0.6 3.0 4.1 –1.6 –0.5 –2.7183 Burkina Faso –8.4 4.4 25.5 4.0 0.750 0.2 1.5 6.8 –1.6 –0.4 –3.4184 Sierra Leone –29.5 6.6 20.1 16.3 0.658 .. 0.8 23.0 –1.0 –0.3 –2.4185 Burundi –28.9 16.7 16.9 .. 0.445 0.1 1.8 6.1 –1.4 –0.9 ..186 Chad .. .. 21.4 .. 0.738 .. 2.1 1.4 –0.4 .. 3.2187 South Sudan .. .. 17.3 .. .. .. 4.6 0.4 .. .. ..188 Central African Republic .. .. 17.7 .. 0.460 .. 1.4 .. 0.0 –0.2 8.6189 Niger 2.6 6.3 33.7 1.9 0.297 .. 2.5 7.1 –2.0 –0.6 –3.5OTHER COUNTRIES OR TERRITORIES
.. Korea (Democratic People’s Rep. of) .. .. .. .. 0.399 .. .. .. .. .. ..
.. Monaco .. .. .. .. .. 0.0 .. .. .. .. ..
.. Nauru .. .. .. .. 0.693 .. .. .. .. .. ..
.. San Marino .. .. .. .. .. .. .. .. .. .. ..
.. Somalia .. .. .. .. 0.448 .. 0.0 .. .. .. ..
.. Tuvalu .. .. .. .. 0.536 .. .. .. .. .. ..Human development groups
Very high human development 8.1 .. 21.5 86.1 — 2.4 2.4 7.4 –0.5 –2.4 —High human development 18.0 13.1 36.1 .. — 1.6 1.8 .. –4.2 –1.5 —Medium human development 13.0 16.7 27.2 25.8 — 0.4 2.0 4.3 –1.2 –1.2 —Low human development 0.1 9.8 21.1 .. — .. 1.3 .. –1.9 –0.7 —
Developing countries 15.5 14.1 32.7 33.3 — 1.2 2.1 .. –2.3 –0.9 —Regions
Arab States 8.4 12.5 27.5 47.6 — 0.6 6.0 .. –1.2 –1.1 —East Asia and the Pacific 21.6 7.2 41.0 .. — .. 1.8 .. –4.1 –0.8 —Europe and Central Asia 8.5 34.0 29.1 71.0 — 0.8 2.0 4.5 –3.9 –2.4 —Latin America and the Caribbean 8.0 29.6 19.8 55.0 — 0.7 1.2 .. –2.0 –1.2 —South Asia 16.3 16.2 30.1 20.7 — 0.5 2.6 3.1 –1.7 –1.2 —Sub-Saharan Africa –2.2 11.3 19.8 .. — 0.5 1.1 8.8 –1.8 –0.7 —
Least developed countries 3.3 9.6 25.7 19.7 — .. 1.8 5.2 –2.1 –0.9 —Small island developing states .. 21.5 19.1 .. — .. .. .. –2.4 .. —Organisation for Economic Co-operation and Development 8.0 .. 21.3 81.0 — 2.5 2.1 7.8 –0.6 –2.4 —World 10.7 16.2 25.5 47.9 — 2.0 2.2 7.2 –2.1 –0.9 —
104 | HUMAN DEVELOPMENT INDICES AND INDICATORS: 2018 STATISTICAL UPDATE
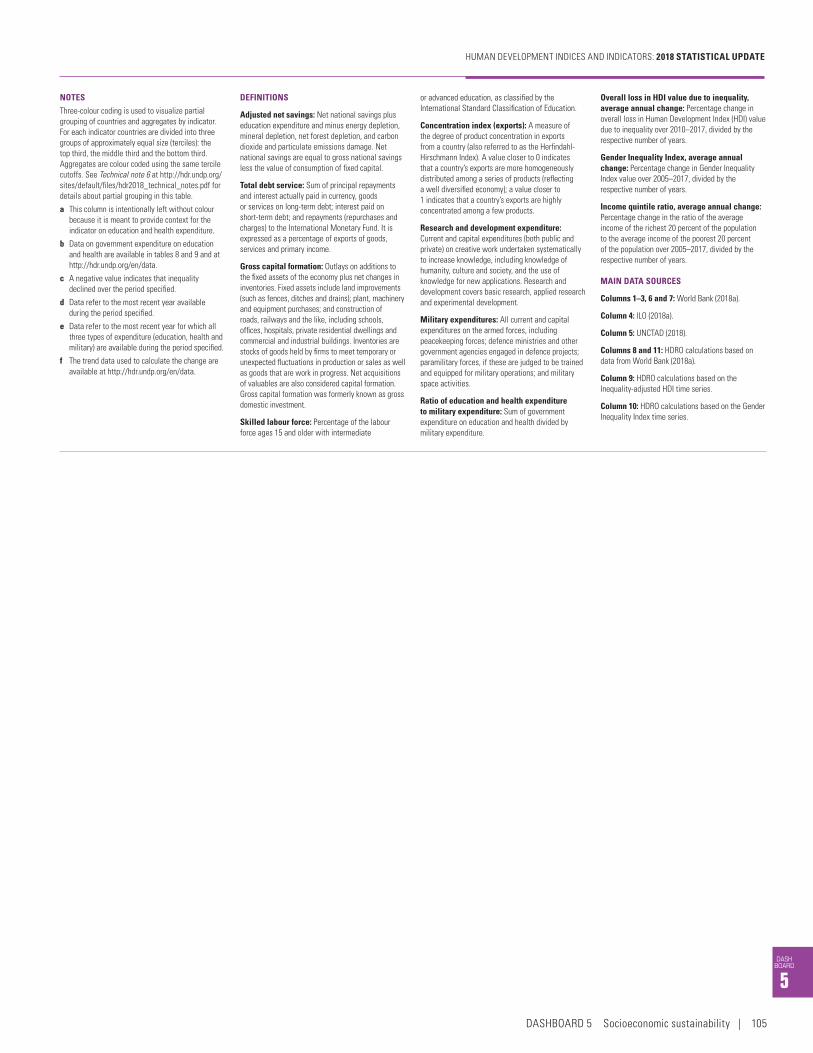
DASH BOARD
5
NOTES
Three-colour coding is used to visualize partial grouping of countries and aggregates by indicator. For each indicator countries are divided into three groups of approximately equal size (terciles): the top third, the middle third and the bottom third. Aggregates are colour coded using the same tercile cutoffs. See Technical note 6 at http://hdr.undp.org/sites/default/files/hdr2018_technical_notes.pdf for details about partial grouping in this table.
a This column is intentionally left without colour because it is meant to provide context for the indicator on education and health expenditure.
b Data on government expenditure on education and health are available in tables 8 and 9 and at http://hdr.undp.org/en/data.
c A negative value indicates that inequality declined over the period specified.
d Data refer to the most recent year available during the period specified.
e Data refer to the most recent year for which all three types of expenditure (education, health and military) are available during the period specified.
f The trend data used to calculate the change are available at http://hdr.undp.org/en/data.
DEFINITIONS
Adjusted net savings: Net national savings plus education expenditure and minus energy depletion, mineral depletion, net forest depletion, and carbon dioxide and particulate emissions damage. Net national savings are equal to gross national savings less the value of consumption of fixed capital.
Total debt service: Sum of principal repayments and interest actually paid in currency, goods or services on long-term debt; interest paid on short-term debt; and repayments (repurchases and charges) to the International Monetary Fund. It is expressed as a percentage of exports of goods, services and primary income.
Gross capital formation: Outlays on additions to the fixed assets of the economy plus net changes in inventories. Fixed assets include land improvements (such as fences, ditches and drains); plant, machinery and equipment purchases; and construction of roads, railways and the like, including schools, offices, hospitals, private residential dwellings and commercial and industrial buildings. Inventories are stocks of goods held by firms to meet temporary or unexpected fluctuations in production or sales as well as goods that are work in progress. Net acquisitions of valuables are also considered capital formation. Gross capital formation was formerly known as gross domestic investment.
Skilled labour force: Percentage of the labour force ages 15 and older with intermediate
or advanced education, as classified by the International Standard Classification of Education.
Concentration index (exports): A measure of the degree of product concentration in exports from a country (also referred to as the Herfindahl-Hirschmann Index). A value closer to 0 indicates that a country’s exports are more homogeneously distributed among a series of products (reflecting a well diversified economy); a value closer to 1 indicates that a country’s exports are highly concentrated among a few products.
Research and development expenditure: Current and capital expenditures (both public and private) on creative work undertaken systematically to increase knowledge, including knowledge of humanity, culture and society, and the use of knowledge for new applications. Research and development covers basic research, applied research and experimental development.
Military expenditures: All current and capital expenditures on the armed forces, including peacekeeping forces; defence ministries and other government agencies engaged in defence projects; paramilitary forces, if these are judged to be trained and equipped for military operations; and military space activities.
Ratio of education and health expenditure to military expenditure: Sum of government expenditure on education and health divided by military expenditure.
Overall loss in HDI value due to inequality, average annual change: Percentage change in overall loss in Human Development Index (HDI) value due to inequality over 2010–2017, divided by the respective number of years.
Gender Inequality Index, average annual change: Percentage change in Gender Inequality Index value over 2005–2017, divided by the respective number of years.
Income quintile ratio, average annual change: Percentage change in the ratio of the average income of the richest 20 percent of the population to the average income of the poorest 20 percent of the population over 2005–2017, divided by the respective number of years.
MAIN DATA SOURCES
Columns 1–3, 6 and 7: World Bank (2018a).
Column 4: ILO (2018a).
Column 5: UNCTAD (2018).
Columns 8 and 11: HDRO calculations based on data from World Bank (2018a).
Column 9: HDRO calculations based on the Inequality-adjusted HDI time series.
Column 10: HDRO calculations based on the Gender Inequality Index time series.
HUMAN DEVELOPMENT INDICES AND INDICATORS: 2018 STATISTICAL UPDATE
DASHBOARD 5 Socioeconomic sustainability | 105
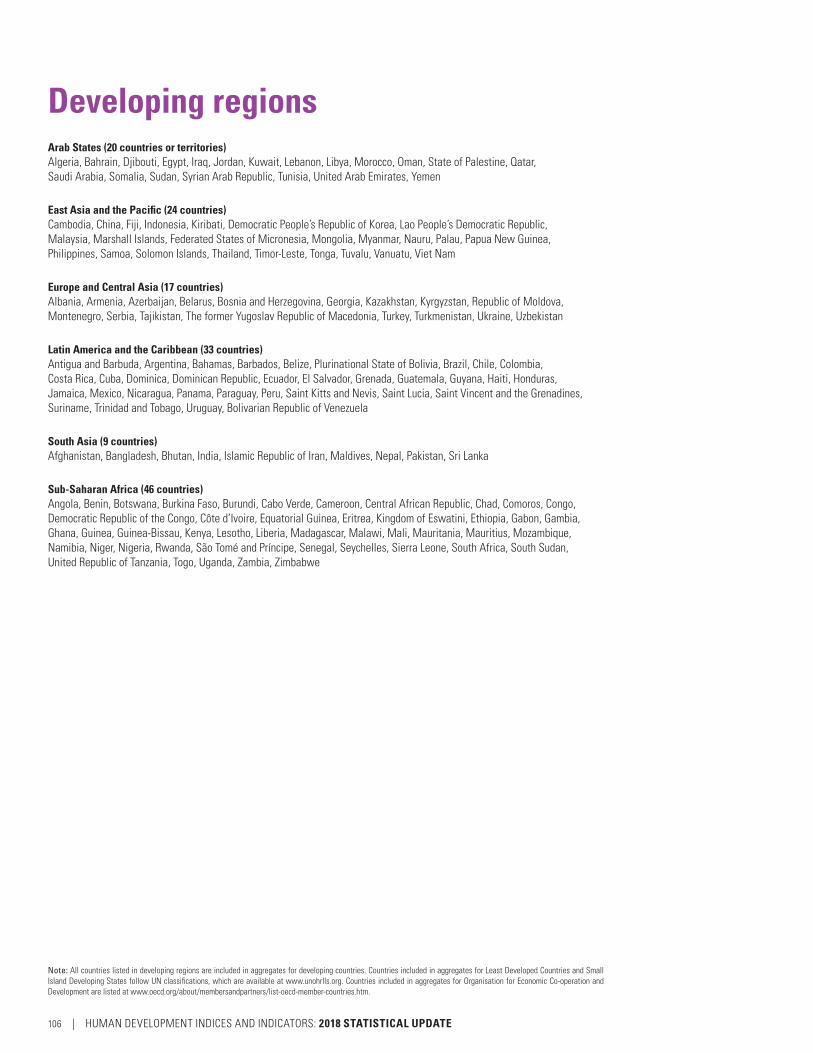
Developing regionsArab States (20 countries or territories)Algeria, Bahrain, Djibouti, Egypt, Iraq, Jordan, Kuwait, Lebanon, Libya, Morocco, Oman, State of Palestine, Qatar, Saudi Arabia, Somalia, Sudan, Syrian Arab Republic, Tunisia, United Arab Emirates, Yemen
East Asia and the Pacific (24 countries)Cambodia, China, Fiji, Indonesia, Kiribati, Democratic People’s Republic of Korea, Lao People’s Democratic Republic, Malaysia, Marshall Islands, Federated States of Micronesia, Mongolia, Myanmar, Nauru, Palau, Papua New Guinea, Philippines, Samoa, Solomon Islands, Thailand, Timor-Leste, Tonga, Tuvalu, Vanuatu, Viet Nam
Europe and Central Asia (17 countries)Albania, Armenia, Azerbaijan, Belarus, Bosnia and Herzegovina, Georgia, Kazakhstan, Kyrgyzstan, Republic of Moldova, Montenegro, Serbia, Tajikistan, The former Yugoslav Republic of Macedonia, Turkey, Turkmenistan, Ukraine, Uzbekistan
Latin America and the Caribbean (33 countries)Antigua and Barbuda, Argentina, Bahamas, Barbados, Belize, Plurinational State of Bolivia, Brazil, Chile, Colombia, Costa Rica, Cuba, Dominica, Dominican Republic, Ecuador, El Salvador, Grenada, Guatemala, Guyana, Haiti, Honduras, Jamaica, Mexico, Nicaragua, Panama, Paraguay, Peru, Saint Kitts and Nevis, Saint Lucia, Saint Vincent and the Grenadines, Suriname, Trinidad and Tobago, Uruguay, Bolivarian Republic of Venezuela
South Asia (9 countries)Afghanistan, Bangladesh, Bhutan, India, Islamic Republic of Iran, Maldives, Nepal, Pakistan, Sri Lanka
Sub-Saharan Africa (46 countries)Angola, Benin, Botswana, Burkina Faso, Burundi, Cabo Verde, Cameroon, Central African Republic, Chad, Comoros, Congo, Democratic Republic of the Congo, Côte d’Ivoire, Equatorial Guinea, Eritrea, Kingdom of Eswatini, Ethiopia, Gabon, Gambia, Ghana, Guinea, Guinea-Bissau, Kenya, Lesotho, Liberia, Madagascar, Malawi, Mali, Mauritania, Mauritius, Mozambique, Namibia, Niger, Nigeria, Rwanda, São Tomé and Príncipe, Senegal, Seychelles, Sierra Leone, South Africa, South Sudan, United Republic of Tanzania, Togo, Uganda, Zambia, Zimbabwe
Note: All countries listed in developing regions are included in aggregates for developing countries. Countries included in aggregates for Least Developed Countries and Small Island Developing States follow UN classifications, which are available at www.unohrlls.org. Countries included in aggregates for Organisation for Economic Co-operation and Development are listed at www.oecd.org/about/membersandpartners/list-oecd-member-countries.htm.
106 | HUMAN DEVELOPMENT INDICES AND INDICATORS: 2018 STATISTICAL UPDATE

Index to Sustainable Development Goal indicatorsGlobal Sustainable Development Goal and target Indicator for measuring progress in human development Indicator table
Goal 1. End poverty in all its forms everywhere1.1 By 2030, eradicate extreme poverty for all people everywhere, currently measured as people living on less than $1.25 a day
Population living below income poverty line, PPP $1.90 a day (%) 6
1.2 By 2030, reduce at least by half the proportion of men, women and children of all ages living in poverty in all its dimensions according to national definitions
Population living below income poverty line, national poverty line (%) 6Population in multidimensional poverty, headcount (%) 6Population in multidimensional poverty, headcount (thousands) 6
1.3 Implement nationally appropriate social protection systems and measures for all, including floors, and by 2030 achieve substantial coverage of the poor and the vulnerable
Old-age pension recipients (% of statutory pension age population) 11Old-age pension recipients (female to male ratio) D2Mandatory paid maternity leave (days) D3
1.5 By 2030, build the resilience of the poor and those in vulnerable situations and reduce their exposure and vulnerability to climate-related extreme events and other economic, social and environmental shocks and disasters
Internally displaced persons (thousands)a 12Refugees by country of origin (thousands)a 12Homeless people due to natural disaster (average annual per million people)b 12
1.a Ensure significant mobilization of resources from a variety of sources, including through enhanced development cooperation, in order to provide adequate and predictable means for developing countries, in particular least developed countries, to implement programmes and policies to end poverty in all its dimensions
Government expenditure on education (% of GDP)c 9
Goal 2. End hunger, achieve food security and improved nutrition and promote sustainable agriculture2.1 By 2030, end hunger and ensure access by all people, in particular the poor and people in vulnerable situations, including infants, to safe, nutritious and sufficient food all year round
Depth of food deficit (kilocalories per person per day)d 12
2.2 By 2030, end all forms of malnutrition, including achieving, by 2025, the internationally agreed targets on stunting and wasting in children under 5 years of age, and address the nutritional needs of adolescent girls, pregnant and lactating women and older persons
Child malnutrition, stunting (moderate or severe) (% under age 5) 8
Goal 3. Ensure healthy lives and promote well-being for all at all ages3. Ensure healthy lives and promote well-being for all at all ages Life expectancy at birth (years) 1
Life expectancy at birth, female (years) 4Life expectancy at birth, male (years) 4Mortality rate, female adult (per 1,000 people)e 8Mortality rate, male adult (per 1,000 people)e 8
3.1 By 2030, reduce the global maternal mortality ratio to less than 70 per 100,000 live births Maternal mortality ratio (deaths per 100,000 live births) 5, D3Proportion of births attended by skilled health personnel (%) D3
3.2 By 2030, end preventable deaths of newborns and children under 5 years of age, with all countries aiming to reduce neonatal mortality to at least as low as 12 per 1,000 live births and under-5 mortality to at least as low as 25 per 1,000 live births
Mortality rate, infant (per 1,000 live births) 8Mortality rate, under-five (per 1,000 live births) 8
3.3 By 2030, end the epidemics of AIDS, tuberculosis, malaria and neglected tropical diseases and combat hepatitis, water-borne diseases and other communicable diseases
Malaria incidence (per 1,000 people at risk) 8Tuberculosis incidence (per 100,000 people) 8HIV prevalence, adult (% ages 15–49)f 8
3.4 By 2030, reduce by one third premature mortality from non-communicable diseases through prevention and treatment and promote mental health and well-being
Suicide rate, female (per 100,000 people) 12Suicide rate, male (per 100,000 people) 12
3.7 By 2030, ensure universal access to sexual and reproductive health-care services, including for family planning, information and education, and the integration of reproductive health into national strategies and programmes
Adolescent birth rate (births per 1,000 women ages 15–19) 5, D3Contraceptive prevalence, any method (% of married or in-union women of reproductive age, 15–49 years)g
D3
3.9 By 2030, substantially reduce the number of deaths and illnesses from hazardous chemicals and air, water and soil pollution and contamination
Mortality rate attributed to household and ambient air pollution (per 100,000 population) D4Mortality rate attributed to unsafe water, sanitation and hygiene services (per 100,000 population)
D4
3.b Support the research and development of vaccines and medicines for the communicable and non-communicable diseases that primarily affect developing countries, provide access to affordable essential medicines and vaccines, in accordance with the Doha Declaration on the TRIPS Agreement and Public Health, which affirms the right of developing countries to use to the full the provisions in the Agreement on Trade-Related Aspects of Intellectual Property Rights regarding flexibilities to protect public health, and, in particular, provide access to medicines for all
Infants lacking immunization, DPT (% of one-year-olds) 8Infants lacking immunization, measles (% of one-year-olds) 8
3.c Substantially increase health financing and the recruitment, development, training and retention of the health workforce in developing countries, especially in least developed countries and small island developing States
Current health expenditure (% of GDP) 8
Goal 4. Ensure inclusive and equitable quality education and promote lifelong learning opportunities for all4.1 By 2030, ensure that all girls and boys complete free, equitable and quality primary and secondary education leading to relevant and effective learning outcomes
Gross enrolment ratio, primary (% of primary school–age population) 9Gross enrolment ratio, secondary (% of secondary school–age population) 9Programme for International Student Assessment (PISA) score in mathematics D1Programme for International Student Assessment (PISA) score in reading D1Programme for International Student Assessment (PISA) score in science D1Gross enrolment ratio, primary (female to male ratio) D2Gross enrolment ratio, secondary (female to male ratio) D2
4.2 By 2030, ensure that all girls and boys have access to quality early childhood development, care and pre-primary education so that they are ready for primary education
Gross enrolment ratio, pre-primary (% of preschool-age children) 9Gross enrolment ratio, pre-primary (female to male ratio) D2
4.3 By 2030, ensure equal access for all women and men to affordable and quality technical, vocational and tertiary education, including university
Expected years of schooling (years) 1Expected years of schooling, female (years)h 4Expected years of schooling, male (years)h 4Gross enrolment ratio, tertiary (% of tertiary school–age population)h 9
Index to Sustainable Development Goal indicators | 107
HUMAN DEVELOPMENT INDICES AND INDICATORS: 2018 STATISTICAL UPDATE
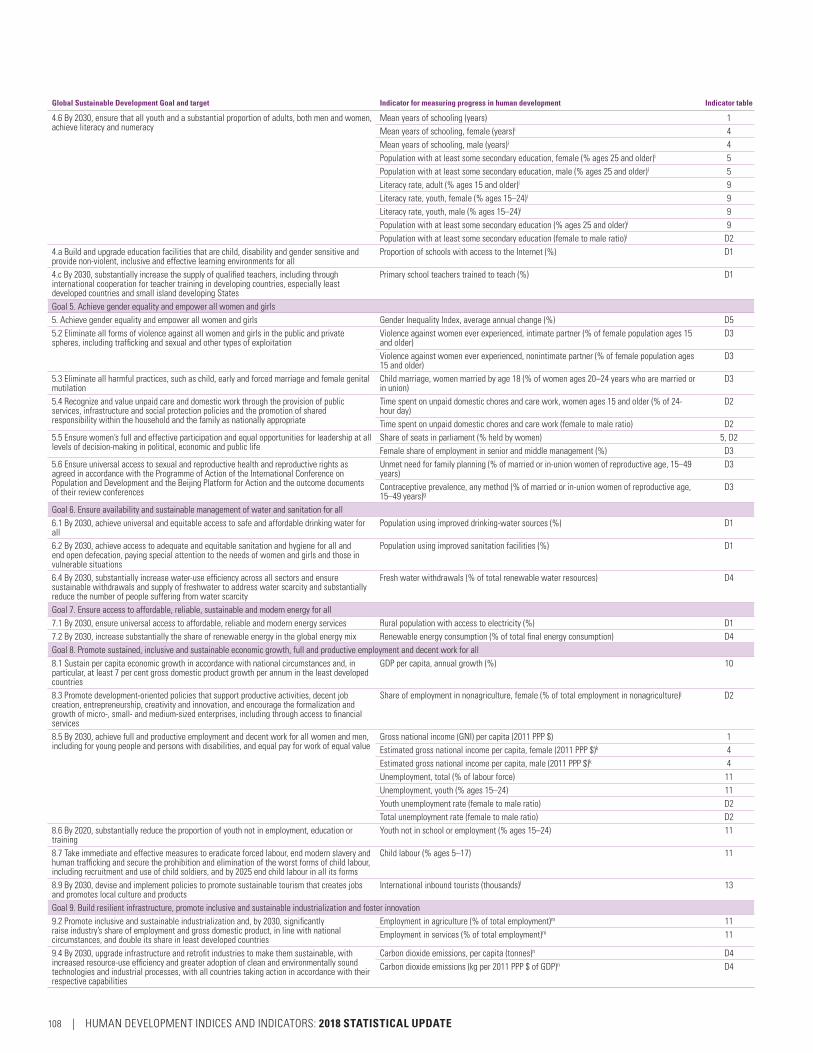
Global Sustainable Development Goal and target Indicator for measuring progress in human development Indicator table
4.6 By 2030, ensure that all youth and a substantial proportion of adults, both men and women, achieve literacy and numeracy
Mean years of schooling (years) 1Mean years of schooling, female (years)i 4Mean years of schooling, male (years)i 4Population with at least some secondary education, female (% ages 25 and older)i 5Population with at least some secondary education, male (% ages 25 and older)i 5Literacy rate, adult (% ages 15 and older)i 9Literacy rate, youth, female (% ages 15–24)i 9Literacy rate, youth, male (% ages 15–24)i 9Population with at least some secondary education (% ages 25 and older)i 9Population with at least some secondary education (female to male ratio)i D2
4.a Build and upgrade education facilities that are child, disability and gender sensitive and provide non-violent, inclusive and effective learning environments for all
Proportion of schools with access to the Internet (%) D1
4.c By 2030, substantially increase the supply of qualified teachers, including through international cooperation for teacher training in developing countries, especially least developed countries and small island developing States
Primary school teachers trained to teach (%) D1
Goal 5. Achieve gender equality and empower all women and girls5. Achieve gender equality and empower all women and girls Gender Inequality Index, average annual change (%) D55.2 Eliminate all forms of violence against all women and girls in the public and private spheres, including trafficking and sexual and other types of exploitation
Violence against women ever experienced, intimate partner (% of female population ages 15 and older)
D3
Violence against women ever experienced, nonintimate partner (% of female population ages 15 and older)
D3
5.3 Eliminate all harmful practices, such as child, early and forced marriage and female genital mutilation
Child marriage, women married by age 18 (% of women ages 20–24 years who are married or in union)
D3
5.4 Recognize and value unpaid care and domestic work through the provision of public services, infrastructure and social protection policies and the promotion of shared responsibility within the household and the family as nationally appropriate
Time spent on unpaid domestic chores and care work, women ages 15 and older (% of 24-hour day)
D2
Time spent on unpaid domestic chores and care work (female to male ratio) D25.5 Ensure women’s full and effective participation and equal opportunities for leadership at all levels of decision-making in political, economic and public life
Share of seats in parliament (% held by women) 5, D2Female share of employment in senior and middle management (%) D3
5.6 Ensure universal access to sexual and reproductive health and reproductive rights as agreed in accordance with the Programme of Action of the International Conference on Population and Development and the Beijing Platform for Action and the outcome documents of their review conferences
Unmet need for family planning (% of married or in-union women of reproductive age, 15–49 years)
D3
Contraceptive prevalence, any method (% of married or in-union women of reproductive age, 15–49 years)g
D3
Goal 6. Ensure availability and sustainable management of water and sanitation for all6.1 By 2030, achieve universal and equitable access to safe and affordable drinking water for all
Population using improved drinking-water sources (%) D1
6.2 By 2030, achieve access to adequate and equitable sanitation and hygiene for all and end open defecation, paying special attention to the needs of women and girls and those in vulnerable situations
Population using improved sanitation facilities (%) D1
6.4 By 2030, substantially increase water-use efficiency across all sectors and ensure sustainable withdrawals and supply of freshwater to address water scarcity and substantially reduce the number of people suffering from water scarcity
Fresh water withdrawals (% of total renewable water resources) D4
Goal 7. Ensure access to affordable, reliable, sustainable and modern energy for all7.1 By 2030, ensure universal access to affordable, reliable and modern energy services Rural population with access to electricity (%) D17.2 By 2030, increase substantially the share of renewable energy in the global energy mix Renewable energy consumption (% of total final energy consumption) D4Goal 8. Promote sustained, inclusive and sustainable economic growth, full and productive employment and decent work for all8.1 Sustain per capita economic growth in accordance with national circumstances and, in particular, at least 7 per cent gross domestic product growth per annum in the least developed countries
GDP per capita, annual growth (%) 10
8.3 Promote development-oriented policies that support productive activities, decent job creation, entrepreneurship, creativity and innovation, and encourage the formalization and growth of micro-, small- and medium-sized enterprises, including through access to financial services
Share of employment in nonagriculture, female (% of total employment in nonagriculture)j D2
8.5 By 2030, achieve full and productive employment and decent work for all women and men, including for young people and persons with disabilities, and equal pay for work of equal value
Gross national income (GNI) per capita (2011 PPP $) 1Estimated gross national income per capita, female (2011 PPP $)k 4Estimated gross national income per capita, male (2011 PPP $)k 4Unemployment, total (% of labour force) 11Unemployment, youth (% ages 15–24) 11Youth unemployment rate (female to male ratio) D2Total unemployment rate (female to male ratio) D2
8.6 By 2020, substantially reduce the proportion of youth not in employment, education or training
Youth not in school or employment (% ages 15–24) 11
8.7 Take immediate and effective measures to eradicate forced labour, end modern slavery and human trafficking and secure the prohibition and elimination of the worst forms of child labour, including recruitment and use of child soldiers, and by 2025 end child labour in all its forms
Child labour (% ages 5–17) 11
8.9 By 2030, devise and implement policies to promote sustainable tourism that creates jobs and promotes local culture and products
International inbound tourists (thousands)l 13
Goal 9. Build resilient infrastructure, promote inclusive and sustainable industrialization and foster innovation9.2 Promote inclusive and sustainable industrialization and, by 2030, significantly raise industry’s share of employment and gross domestic product, in line with national circumstances, and double its share in least developed countries
Employment in agriculture (% of total employment)m 11Employment in services (% of total employment)m 11
9.4 By 2030, upgrade infrastructure and retrofit industries to make them sustainable, with increased resource-use efficiency and greater adoption of clean and environmentally sound technologies and industrial processes, with all countries taking action in accordance with their respective capabilities
Carbon dioxide emissions, per capita (tonnes)n D4Carbon dioxide emissions (kg per 2011 PPP $ of GDP)n D4
108 | HUMAN DEVELOPMENT INDICES AND INDICATORS: 2018 STATISTICAL UPDATE
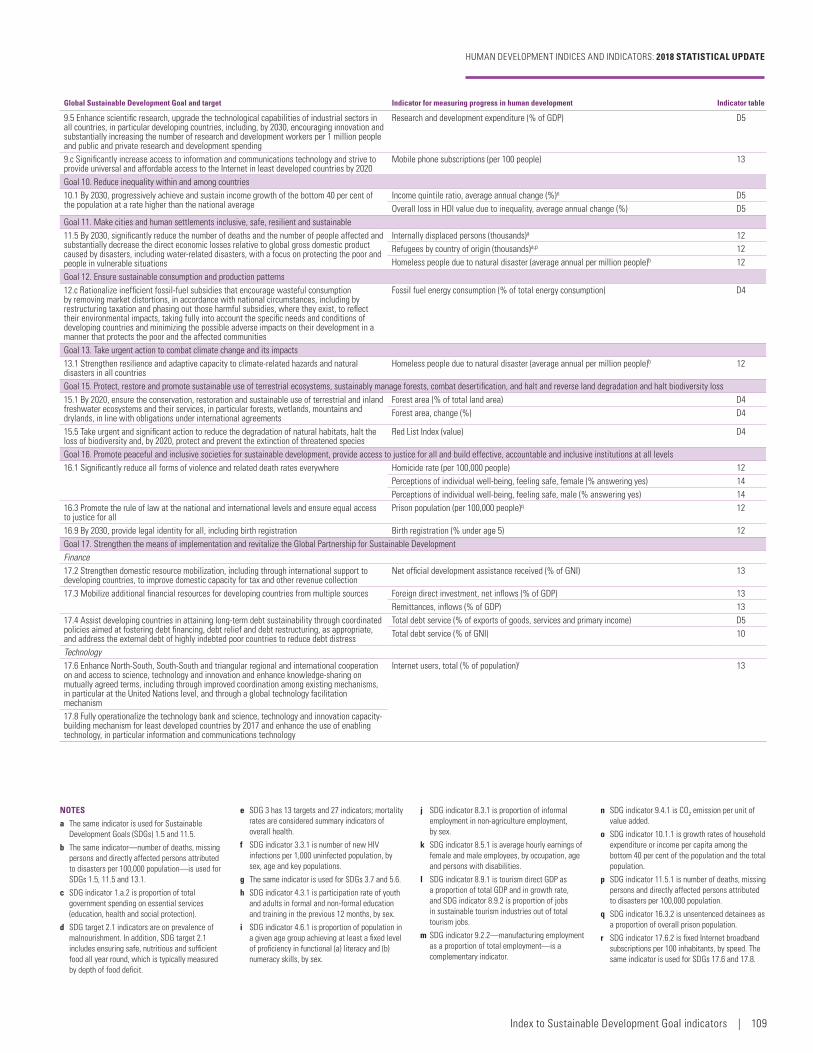
Global Sustainable Development Goal and target Indicator for measuring progress in human development Indicator table
9.5 Enhance scientific research, upgrade the technological capabilities of industrial sectors in all countries, in particular developing countries, including, by 2030, encouraging innovation and substantially increasing the number of research and development workers per 1 million people and public and private research and development spending
Research and development expenditure (% of GDP) D5
9.c Significantly increase access to information and communications technology and strive to provide universal and affordable access to the Internet in least developed countries by 2020
Mobile phone subscriptions (per 100 people) 13
Goal 10. Reduce inequality within and among countries10.1 By 2030, progressively achieve and sustain income growth of the bottom 40 per cent of the population at a rate higher than the national average
Income quintile ratio, average annual change (%)o D5Overall loss in HDI value due to inequality, average annual change (%) D5
Goal 11. Make cities and human settlements inclusive, safe, resilient and sustainable11.5 By 2030, significantly reduce the number of deaths and the number of people affected and substantially decrease the direct economic losses relative to global gross domestic product caused by disasters, including water-related disasters, with a focus on protecting the poor and people in vulnerable situations
Internally displaced persons (thousands)a 12Refugees by country of origin (thousands)a,p 12Homeless people due to natural disaster (average annual per million people)b 12
Goal 12. Ensure sustainable consumption and production patterns12.c Rationalize inefficient fossil-fuel subsidies that encourage wasteful consumption by removing market distortions, in accordance with national circumstances, including by restructuring taxation and phasing out those harmful subsidies, where they exist, to reflect their environmental impacts, taking fully into account the specific needs and conditions of developing countries and minimizing the possible adverse impacts on their development in a manner that protects the poor and the affected communities
Fossil fuel energy consumption (% of total energy consumption) D4
Goal 13. Take urgent action to combat climate change and its impacts13.1 Strengthen resilience and adaptive capacity to climate-related hazards and natural disasters in all countries
Homeless people due to natural disaster (average annual per million people)b 12
Goal 15. Protect, restore and promote sustainable use of terrestrial ecosystems, sustainably manage forests, combat desertification, and halt and reverse land degradation and halt biodiversity loss15.1 By 2020, ensure the conservation, restoration and sustainable use of terrestrial and inland freshwater ecosystems and their services, in particular forests, wetlands, mountains and drylands, in line with obligations under international agreements
Forest area (% of total land area) D4Forest area, change (%) D4
15.5 Take urgent and significant action to reduce the degradation of natural habitats, halt the loss of biodiversity and, by 2020, protect and prevent the extinction of threatened species
Red List Index (value) D4
Goal 16. Promote peaceful and inclusive societies for sustainable development, provide access to justice for all and build effective, accountable and inclusive institutions at all levels16.1 Significantly reduce all forms of violence and related death rates everywhere Homicide rate (per 100,000 people) 12
Perceptions of individual well-being, feeling safe, female (% answering yes) 14Perceptions of individual well-being, feeling safe, male (% answering yes) 14
16.3 Promote the rule of law at the national and international levels and ensure equal access to justice for all
Prison population (per 100,000 people)q 12
16.9 By 2030, provide legal identity for all, including birth registration Birth registration (% under age 5) 12Goal 17. Strengthen the means of implementation and revitalize the Global Partnership for Sustainable DevelopmentFinance17.2 Strengthen domestic resource mobilization, including through international support to developing countries, to improve domestic capacity for tax and other revenue collection
Net official development assistance received (% of GNI) 13
17.3 Mobilize additional financial resources for developing countries from multiple sources Foreign direct investment, net inflows (% of GDP) 13Remittances, inflows (% of GDP) 13
17.4 Assist developing countries in attaining long-term debt sustainability through coordinated policies aimed at fostering debt financing, debt relief and debt restructuring, as appropriate, and address the external debt of highly indebted poor countries to reduce debt distress
Total debt service (% of exports of goods, services and primary income) D5Total debt service (% of GNI) 10
Technology17.6 Enhance North-South, South-South and triangular regional and international cooperation on and access to science, technology and innovation and enhance knowledge-sharing on mutually agreed terms, including through improved coordination among existing mechanisms, in particular at the United Nations level, and through a global technology facilitation mechanism
Internet users, total (% of population)r 13
17.8 Fully operationalize the technology bank and science, technology and innovation capacity-building mechanism for least developed countries by 2017 and enhance the use of enabling technology, in particular information and communications technology
NOTES
a The same indicator is used for Sustainable Development Goals (SDGs) 1.5 and 11.5.
b The same indicator—number of deaths, missing persons and directly affected persons attributed to disasters per 100,000 population—is used for SDGs 1.5, 11.5 and 13.1.
c SDG indicator 1.a.2 is proportion of total government spending on essential services (education, health and social protection).
d SDG target 2.1 indicators are on prevalence of malnourishment. In addition, SDG target 2.1 includes ensuring safe, nutritious and sufficient food all year round, which is typically measured by depth of food deficit.
e SDG 3 has 13 targets and 27 indicators; mortality rates are considered summary indicators of overall health.
f SDG indicator 3.3.1 is number of new HIV infections per 1,000 uninfected population, by sex, age and key populations.
g The same indicator is used for SDGs 3.7 and 5.6.
h SDG indicator 4.3.1 is participation rate of youth and adults in formal and non-formal education and training in the previous 12 months, by sex.
i SDG indicator 4.6.1 is proportion of population in a given age group achieving at least a fixed level of proficiency in functional (a) literacy and (b) numeracy skills, by sex.
j SDG indicator 8.3.1 is proportion of informal employment in non-agriculture employment, by sex.
k SDG indicator 8.5.1 is average hourly earnings of female and male employees, by occupation, age and persons with disabilities.
l SDG indicator 8.9.1 is tourism direct GDP as a proportion of total GDP and in growth rate, and SDG indicator 8.9.2 is proportion of jobs in sustainable tourism industries out of total tourism jobs.
m SDG indicator 9.2.2—manufacturing employment as a proportion of total employment—is a complementary indicator.
n SDG indicator 9.4.1 is CO2 emission per unit of value added.
o SDG indicator 10.1.1 is growth rates of household expenditure or income per capita among the bottom 40 per cent of the population and the total population.
p SDG indicator 11.5.1 is number of deaths, missing persons and directly affected persons attributed to disasters per 100,000 population.
q SDG indicator 16.3.2 is unsentenced detainees as a proportion of overall prison population.
r SDG indicator 17.6.2 is fixed Internet broadband subscriptions per 100 inhabitants, by speed. The same indicator is used for SDGs 17.6 and 17.8.
Index to Sustainable Development Goal indicators | 109
HUMAN DEVELOPMENT INDICES AND INDICATORS: 2018 STATISTICAL UPDATE

Barro, R. J., and J.-W. Lee. 2016. Dataset of Educational Attainment, February 2016 Revision. www.barrolee.com. Accessed 8 June 2018.
CEDLAS (Center for Distributive, Labor and Social Stud-ies and World Bank). 2018. Socio-Economic Database for Latin America and the Caribbean. www.cedlas.econo.unlp .edu.ar/wp/en/estadisticas/sedlac/estadisticas/. Accessed 15 May 2018.
CRED EM-DAT (Centre for Research on the Epidemiology of Disasters). 2018. The International Disaster Database. www.emdat.be. Accessed 17 April 2018.
Eurostat. 2018. European Union Statistics on Income and Living Conditions. Brussels. http://ec.europa.eu/eurostat/web/microdata/european-union-statistics-on- income-and-living-conditions. Accessed 15 June 2018.
FAO (Food and Agriculture Organization). 2018a. FAOSTAT database. www.fao.org/faostat. Accessed 6 June 2018.
———. 2018b. AQUASTAT database. www.fao.org/nr/water/aquastat/main/index.stm. Accessed 17 April 2018.
Gallup. 2018. Gallup World Poll Analytics database. https://ga.gallup.com. Accessed 10 April 2018.
ICF Macro. Various years. Demographic and Health Surveys. www.measuredhs.com. Accessed 15 July 2018.
ICPR (Institute for Criminal Policy Research). 2016. “World Prison Population List (11th edition).” London. www.prisonstudies.org. Accessed 2 July 2018.
IDMC (Internal Displacement Monitoring Centre). 2018. Global Internal Displacement Database. www.internal- displacement.org/database. Accessed 16 May 2018.
ILO (International Labour Organization). 2018a. ILOSTAT database. www.ilo.org/ilostat. Accessed 13 April 2018.
———. 2018b. World Social Protection Report 2017–19. Geneva. www.social-protection.org/gimi/gess/ShowWiki .action?id=594. Accessed 13 April 2018.
IMF (International Monetary Fund). 2018. World Econom-ic Outlook database. Washington, DC. www.imf.org/en/Data. Accessed 15 June 2018.
IPU (Inter-Parliamentary Union). 2018. Women in nation-al parliaments. www.ipu.org/wmn-e/classif-arc.htm. Accessed 24 April 2018.
ITU (International Telecommunication Union). 2018. ICT Facts and Figures 2018. www.itu.int/en/ITU-D/Statistics/Pages/stat/. Accessed 18 July 2018.
LIS (Luxembourg Income Study). 2018. Luxembourg Income Study Project. www.lisdatacenter.org/data-access. Accessed 15 July 2018.
OECD (Organisation for Economic Co-operation and Development). 2017a. Education at a Glance 2017: OECD Indicators. Paris. www.oecd-ilibrary.org/education/edu-cation-at-a-glance-2017_eag-2017-en. Accessed 15 June 2018.
———. 2017b. PISA 2015 Results in Focus. Paris. www .oecd.org/pisa/. Accessed 1 July 2018.
Palma, J. G. 2011. “Homogeneous Middles vs. Heterogene-ous Tails, and the End of the ‘Inverted-U’: The Share of the
Rich is What It’s All About.” Cambridge Working Papers in Economics, 1111. Cambridge University, UK. www.econ .cam.ac.uk/research-files/repec/cam/pdf/cwpe1111.pdf. Accessed 15 September 2013.
Syrian Center for Policy Research. 2017. Social Degrada-tion in Syria: The Conflict Impact on Social Capital. http://scpr-syria.org/publications/social-degradation-in-syria/. Accessed 15 July 2017.
UNCTAD (United Nations Conference on Trade and Development). 2018. Data Center. http://unctadstat. unctad.org. Accessed 16 April 2018.
UNDESA (United Nations Department of Economic and Social Affairs). 2011. World Population Prospects: The 2010 Revision. New York. www.un.org/en/development/desa/population/publications/trends/population-pros-pects_2010_revision.shtml. Accessed 15 October 2013.
———. 2017a. World Population Prospects: The 2017 Revi-sion. New York. https://esa.un.org/unpd/wpp/. Accessed 10 May 2018.
———. 2017b. Trends in International Migrant Stock: The 2017 Revision. New York. www.un.org/en/development/desa/population/migration/data/. Accessed 19 July 2018.
———. 2018a. World Urbanization Prospects: The 2018 Revision. New York. https://esa.un.org/unpd/wup/. Accessed 17 May 2018.
———. 2018b. World Contraceptive Use 2018. New York. www.un.org/en/development/desa/population/ publications/dataset/contraception/wcu2018.shtml. Accessed 16 April 2018.
UNECLAC (United Nations Economic Commission for Latin America and the Caribbean). 2018. Preliminary Overview of the Economies of Latin America and the Caribbean 2017. Santiago. https://repositorio.cepal.org/bitstream/handle/11362/42002/155/S1700699_en.pdf. Accessed 15 July 2018.
UNESCO (United Nations Educational, Scientific and Cultural Organization) Institute for Statistics. 2018. Data Centre. http://data.uis.unesco.org. Accessed 15 June 2018.
UNESCWA (United Nations Economic and Social Com-mission for Western Asia). 2018. Survey of Economic and Social Developments in the Arab Region 2017–2018. Beirut. www.unescwa.org/publications/survey- economic-social-development-arab-region-2017-2018. Accessed 15 June 2018.
UNHCR (Office of the United Nations High Commissioner for Refugees). 2018. UNHCR Global Trends 2017. Gene-va. www.unhcr.org/globaltrends2017/. Accessed 20 June 2018.
UNICEF (United Nations Children’s Fund). 2017. The State of the World’s Children 2017 Statistical Tables. New York. https://data.unicef.org/resources/state-worlds- children-2017-statistical-tables/. Accessed 10 July 2018.
———. 2018. UNICEF Data. https://data.unicef.org. Accessed 16 April 2018.
———. Various years. Multiple Indicator Cluster Surveys. New York. http://mics.unicef.org. Accessed 15 July 2018.
UNICEF (United Nations Children’s Fund), WHO (World Health Organization) and World Bank. 2018. Joint Child Malnutrition Estimates Expanded Database: Stunting. May 2018. New York. https://data.unicef.org/topic/nutrition/malnutrition/. Accessed 11 July 2018.
UN Inter-agency Group for Child Mortality Estimation. 2017. Child mortality estimates. www.childmortality.org. Accessed 13 July 2018.
United Nations Statistics Division. 2018a. Global SDG Indi-cators Database. https://unstats.un.org/sdgs/indicators/database/. Accessed 20 June 2018.
———. 2018b. National Accounts Main Aggregates Data-base. http://unstats.un.org/unsd/snaama. Accessed 15 July 2018.
UN Maternal Mortality Estimation Group (World Health Organization, United Nations Children’s Fund, Unit-ed Nations Population Fund and World Bank). 2017. Maternal mortality data. http://data.unicef.org/topic/maternal-health/maternal-mortality/. Accessed 16 April 2018.
UNODC (United Nations Office on Drugs and Crime). 2018. UNODC Statistics and Data. https://dataunodc .un.org. Accessed 18 June 2018.
UNOHCHR (United Nations Office of the High Commis-sioner for Human Rights). 2018. Human rights treaties. http://tbinternet.ohchr.org/_layouts/TreatyBodyExternal/countries.aspx. Accessed 29 June 2018.
UNRWA (United Nations Relief and Works Agency for Palestine). 2017. “UNRWA in Figures 2017.” Amman. www.unrwa.org/sites/default/files/content/resources/unrwa_in_ figures_2017_english.pdf. Accessed 15 July 2018.
UN Women (United Nations Entity for Gender Equality and the Empowerment of Women). 2018. UN Women Global Database on Violence against Women. New York. http://evaw-global-database.unwomen.org. Accessed 19 April 2018.
WHO (World Health Organization). 2018. Global Health Observatory. www.who.int/gho/. Accessed 8 June 2018.
WHO (World Health Organization) and UNICEF (United Nations Children’s Fund). 2018. Estimates of national routine immunization coverage, 2017 revision (complet-ed July 2018). https://data.unicef.org/topic/child-health/immunization/. Accessed 17 July 2018.
World Bank. 2018a. World Development Indicators data-base. Washington, DC. http://data.worldbank.org. Accessed 6 July 2018.
———. 2018b. World Development Indicators database. Washington, DC. http://data.worldbank.org. Accessed 28 July 2018.
———. 2018c. Gender Statistics database. Washington, DC. http://data.worldbank.org. Accessed 26 April 2018.
WSIS (World Summit on the Information Society). 2014. Forum Report 2014. Geneva.
Statistical references
110 | HUMAN DEVELOPMENT INDICES AND INDICATORS: 2018 STATISTICAL UPDATE

United Nations Development ProgrammeOne United Nations PlazaNew York, NY 10017
www.undp.orgEmpowered lives. Resilient nations.
Hu
man
Develo
pm
ent In
dices an
d In
dicato
rs | 2018 Statistical Up
date
The Human Development Report will remain UNDP’s premier vehicle to advance development thinking. Our mission to capture the state of global human development and inform development policy across the globe has never been more crucial.
—Achim Steiner, Administrator, United Nations Development Programme
While there is ground for optimism that the gaps are narrowing, disparities in people’s well-being are still unacceptably wide. Inequality in all its forms and dimensions, between and within countries, limits people’s choices and opportunities, withholding progress.
—Selim Jahan, Director, Human Development Report Office