Embed Size (px)
Citation preview

Human Capital and the Costs of Non-Research
Alfonso Gambardella
Sant’Anna School of Advanced Studies
Pisa, Italy
Research policy - Incentives and Institutions
Ministry of Finance & Economics
Rome November 28, 2002

Topics
• Five stylised facts about research and innovation in the 1990s
• Some intriguing indicators about Europe and Italy
• Conclusions

Fact 1: Increase in Patent Applications
• US applications from 80k per year in the 1980s to 140-150k in the 1990s
• EPO: 143k applications in 2000. Up 16% from previous year. Annual filings more than doubled compared to 10 yrs ago.
• There is increase in the propensity to patent (e.g semiconductors). Yet, notable increase in innovations as well.

Fact 2: Markets for Technology
• Notable increase in technology transactions in the 1990s (patents, technologies, ideas)
• Implication: Innovators develop their technologies even if they don’t have mfr or mkt assets
• The market is there:
– EPO estimated that in Europe 20 billion $ are spent every year to develop innovations already developed elsewhere
– Studies show that many companies (or patent holders) are willing to license their patents

Fact 3: Human capital externalities
“Using detailed data on California biotechnology, we find that … for an average firm, five articles co-authored by academic stars and the firm’s scientists imply about 5 more products in development, … and 860 more employees.” (Zucker, Darby, Armstrong, 1998)

Fact 4: New industry & business models
• Information technology (and Silicon Valley) have shown how to create development via high-skill intensive business, new models of firms and of economic relationships, markets for technology, etc..
• This has potentials for development as well (e.g. Bangalore, Ireland, Israel)

Fact 5: Openness
• Openness of science has been a major example of the impact of openness of performance in research and related activities (e.g. Paul David’s work)
• A recent study shows that more “open” European regions have higher labour productivity, other things being equal.

To sum up …
• “People” are increasingly central to the overall research and innovation business
• People are crucial to … – invent– manage– develop markets, institutions, and firms– create domestic and int’l networks– take strategic decisions and entrepreneurial actions
(whether in research or business)– etc..

Some intriguing indicators(just released EU Key S&T figures 2002)
• Show that European countries are enhancing the role of “people” (HK)
• Italy is lagging behind. In particular: – Italy has a good innovation and research
productivity;– But the key inputs (number of researchers, scale
of HK) is dramatically modest– Needs to increase the size of the HK base
0
10
20
30
40
50
60
70
80
90
US
A
Uni
ted
Kin
gdo
m
Aus
tria
Ne
the
rland
s
Sw
ede
n
De
nma
rk
Be
lgiu
m
Ire
land
Ita
ly
Ge
rma
ny
Fra
nce
Spa
in
Fin
land
Gre
ece
Japa
n
Po
rtug
al
Source: My calculations on EU Key S&T Figures 2002
Scientific Publications per 1000 Researchers in Govt or Academia

0
10
20
30
40
50
60
US
A
Ne
the
rland
s
Uni
ted
Kin
gd
om
Sw
ed
en
De
nma
rk
Irela
nd
Be
lgiu
m
Aus
tria
Ge
rma
ny
Italy
Fra
nce
Fin
land
Sp
ain
Jap
an
Gre
ece
Po
rtug
al
Source: My calculations on EU Key S&T Figures 2002
Highly Cited Publications per 1000 Researchers in Govt or Academia

0
20
40
60
80
100
120
140
160
Ne
the
rland
s
Ge
rman
y
Ital
y
Fin
land
Sw
ed
en
De
nmar
k
Fra
nce
Aus
tria
Be
lgiu
m
Uni
ted
Kin
gd
om
Sp
ain
Ire
land
US
A
Jap
an
Gre
ece
Po
rtug
al
Source: My calculations on EU Key S&T Figures 2002
EPO Patents 2000 per 1000 Researchers in Business Firms

0
2
4
6
8
10
12
14
Fin
land
Jap
an
Sw
ed
en
US
A
Be
lgiu
m
De
nmar
k
Ge
rman
y
Fra
nce
Uni
ted
Kin
gd
om
EU
-15
Ne
the
rland
s
Ire
land
Aus
tria
Sp
ain
Po
rtug
al
Gre
ece
Ital
y
Source: EU Key S&T Figures 2002
Researchers (FTE) per 1000 labour force: Latest available year

-2
0
2
4
6
8
10
12
Gre
ece
Fin
land
Ire
land
Sp
ain
Po
rtug
al
Be
lgiu
m
US
A
Ne
the
rland
s
Sw
ed
en
De
nmar
k
EU
-15
Uni
ted
Kin
gd
om
Jap
an
Ge
rman
y
Fra
nce
Ital
y
Source: EU Key S&T Figures 2002
Researchers (FTE) per 1000 labour force: Annual growth from 1995 to the latest available year

0
5000
10000
15000
20000
25000
Germany France Italy Netherlands United Kingdom
EPO Patents 2000 and Researchers in Business Firms: D, F, I, NL, UK
Patents Researchers in Firms

0
0.2
0.4
0.6
0.8
1
1.2
1.4
Sw
ed
en
Fin
land
Ge
rman
y
Fra
nce
Uni
ted
Kin
gd
om
Be
lgiu
m
Aus
tria
EU
-15
Ire
land
De
nmar
k
US
A
Sp
ain
Ne
the
rland
s
Po
rtug
al
Jap
an
Gre
ece
Ital
y
Source: EU Key S&T Figures 2002
New S&T PhDs per 1000 population aged 25-34, latest available year

0
0.5
1
1.5
2
2.5
US
A
Fin
land
Sw
ed
en
De
nmar
k
Aus
tria
Ire
land
Gre
ece
Ne
the
rland
s
Fra
nce
Sp
ain
Uni
ted
Kin
gd
om
EU
-15
Ge
rman
y
Po
rtug
al
Jap
an
Be
lgiu
m
Ital
y
Source: EU Key S&T Figures 2002
Private & public expenditures on tertiary education, % of GDP in 1998
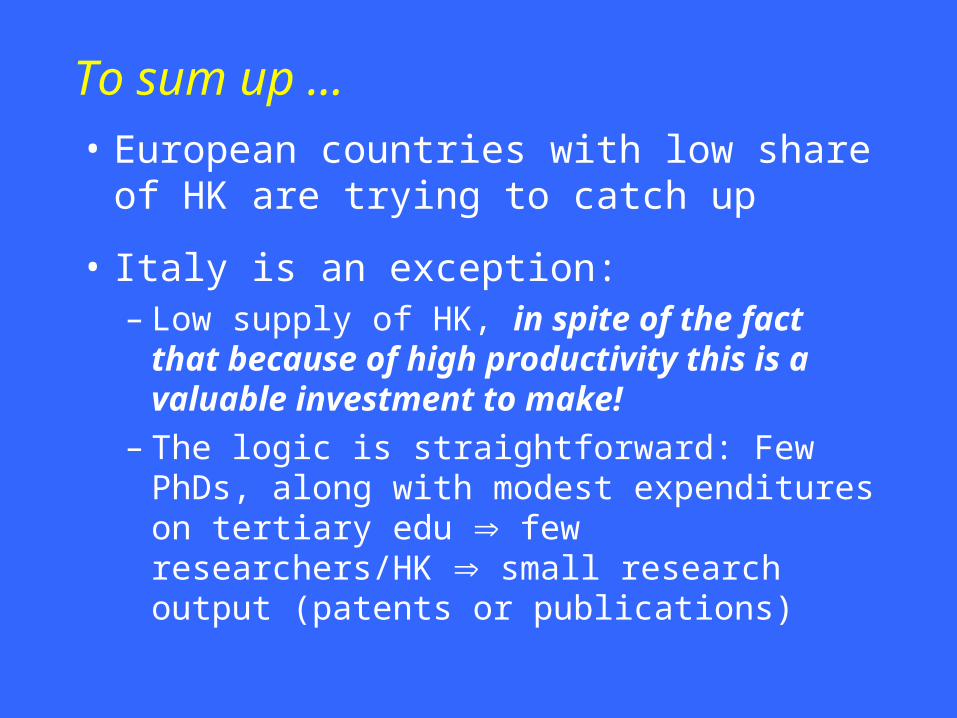
To sum up ...
• European countries with low share of HK are trying to catch up
• Italy is an exception: – Low supply of HK, in spite of the fact that
because of high productivity this is a valuable investment to make!
– The logic is straightforward: Few PhDs, along with modest expenditures on tertiary edu few researchers/HK small research output (patents or publications)

Conclusions
What are the costs of a low supply of HK?
“Using detailed data on California biotechnology, we find that … for an average firm, five articles co-authored by academic stars and the firm’s scientists imply about 5 more products in development, … and 860 more employees.” (Zucker, Darby, Armstrong, 1998)

What then? Increase the supply of PhDs!
• Develop high quality Doctoral Programmes to:– Implement a sound basis of research and HK– Provide the teachers for the other levels of tertiary
education
• They could follow either a one-to-one, apprentship-like “industrial PhD” approach (e.g. in engineering); or an anglosaxon-like PhD (with courses, etc.)

Supply of PhDs!
Most importantly, PhD programmes should be managed by reputed researchers who have experience with leading int’l PhD programmes (and research), possibly within independent or semi-independent institutions Create the “Graduate Schools”

“What are the research university?….
…. Those with a graduate programme.”