Embed Size (px)
Citation preview

Human Capital and Economic Growth: The Role of Governance
Ali Muhammad1, Abiodun Egbetokun
2, Manzoor Hussain Memon
3
Abstract
In this paper we endeavour to assess the role of governance as a precondition to human-led
growth. To the best of our knowledge, the study is first of its kind attempt to introduce the
role of governance in the human capital and growth literature. Specifically, we used rule of
law, control of corruption, regulatory quality and government effectiveness as indicators of
governance in addition to a variable representing average of the four governance indicators.
We divided our data sample into three parts; „low‟, „medium‟ and „high‟ based on
governance indicators. Empirical models Benhabib & Spiegel (1994) and Cohen & Soto
(2007) were used for the purpose of core analysis. Using the data for 134 countries for the
period 1996-2011 we found strong evidence in support of the research hypothesis that
relationship between human capital and growth is much less pronounced in countries with
low level of governance. We also found that magnitude of the coefficient of human capital
was much higher for countries with medium level of governance vis-à-vis countries with
high level of governance. This finding hints towards the threshold level of governance after
which diminishing returns might prevail. Findings of this paper suggest that preconditions in
the form of good governance are necessary for educated labor force in order to contribute to
the economic growth of the country.
Keywords: Human Capital, Growth, Unemployment, Inflation, Pakistan
JEL classification: E24, E30, O40, J24, J60
1 Muhammad Ali, PhD Candidate, DFG Research Training Program, Friedrich Schiller University Jena and the Max
Planck Institute of Economics, Bachstrasse 18k, Jena 07745, Germany Email: [email protected]
2 Dr. Abiodun Egbetokun, DFG Research Training Program, Friedrich Schiller University Jena and the Max Planck
Institute of Economics, Bachstrasse 18k, Jena 07745, Germany Email: [email protected]
3 Manzoor Hussain Memon, Economist, Social Policy and Development Centre (SPDC), Karachi.
Email: [email protected]

Introduction
Economists‟ agrees that human capital is an important determinant of economic growth (Arrow,
1962; Romer, 1986; Aghion and Howitt, 1992). Using theoretical and empirical approaches,
studies generally present a common conclusion of human-led growth by stating that human
capital positively affects economic growth. The main empirical prediction of the traditional
model is that a country‟s economic growth depends on its initial per capita income and on the
factors that drive its steady state. The result is driven by the assumption of catching-up
hypothesis i.e. a country will grow faster the further it is from its steady state (i.e. conditional
convergence).
The standard empirical result of a direct relationship between human capital (however measured)
and economic growth, however, has been criticised on several fronts. First, the impact of other
growth related endogenous variables like quality of education, health of the labour force,
inflation, corruption, unemployment and rule of law etc. should not be ignored. These
endogenous characteristics of a country are included in Becker‟s (1993) definition of human
capital. In addition, as noted by Abramovitz (1986), social capabilities are important in the
adoption and diffusion of technologies but countries differ in social capabilities. Therefore, to the
extent to which human capital contributes to economic growth through innovation, its effect is
conditioned by the country‟s social capabilities which include issues like quality of institutions
as reflected, for instance, in the quality of governance.
The effect of human capital (as a resource) on growth could be influenced by the environment
within which it is deployed. For instance, factors like rule of law, government effectiveness,
corruption, and education quality may influence the relationship between education and
economic growth. In short, the relationship between human capital and growth might be different
for countries with different governance frameworks. Such conditionality is largely ignored in the
literature. In fact, the stylised fact in the literature is that, all else being equal, higher levels of
human capital – particularly the proportion of the population that is educated – leads to higher
economic growth.
The literature on governance presents two kinds of strategies to improve governance; market-
enhancing and growth-enhancing. On one hand, market-enhancing strategy aims at improving
market efficiency and on the other hand growth-enhancing strategy deals with governance issues
at a broader scale and covers areas outside the boundary of market efficiency to ensure
sustainable long term growth. However, sustainable productivity growth requires creation or at-
least understanding of existing technologies. In order to achieve this, only market efficiency is
not enough. Appropriate incentives are required to facilitate the learning and development of
new technologies. The adoption, learning, implementation and development of technologies
require adequate human capital and the literature of governance suggests that growth-enhancing
policies will not be effective in the absence of proper governance preconditions.

This paper, therefore, aims to explore the potential role of governance in the relationship
between human capital and economic growth. We divided our sample based on „low‟, „medium‟
and „high‟ level of governance using three similar but different methodologies. Using Benhabib
& Spiegel (1994) model on data for 134 countries we found that human capital has highest
impact on growth of countries with medium level of governance. The countries with low level of
governance showed insignificant impact of human capital on growth while countries with high
level of governance showed significant but smaller magnitude of coefficient relative to the
countries in medium governance group.
The layout of this paper is as follows. First we present a short review on previous studies on
relationship between human capital and growth. Second the conceptual framework of this study
where we theoretically underpin the role of governance in human capital and growth nexus.
Third, the discussion is on the applied model and a brief note on the data used in this study.
Fourth, we present empirical setup and estimation results and the last section concludes.
Human Capital and Economic Growth
It is not possible to ignore the importance of human capital despite increase in automation and
technology which is an embodiment of a human. While the field of automation and robotics has
been increasing at a faster pace since the beginning of 21st century, no one can avoid the human
behind such innovations and technological advancements. Thus the vital role of human capital in
the current and future scenario remains intact in economic activities and output growth. In the
literature on economic growth and development, knowledge and the human capital are
considered as major endogenous sources and drivers of macroeconomic growth. Human capital,
in particular, has been the subject of much theorising and empirical investigations. The general
understanding is that it is a very important - if not the most important - source of growth (Arrow,
1962; Romer, 1986; Aghion and Howitt, 1992).
Despite being recognised as an important factor in the growth and development of nations, the
concept of human capital does not lend itself to a uniform theoretical or empirical definition. For
simplicity, we stick to the very generic conceptualisation offered by Becker (1993) of human
capital as referring to the resources found in people. These resources would typically include
knowledge, skills, competences and other attributes embodied in humans "that are relevant to
economic activity" (OECD, 1998). As simple as it seems, the aforementioned definition of
human capital leads easily to two observations which are important in the discussion of the role
of human capital in economic growth.
The first, and perhaps most important, is that human capital transcends education and
encompasses all forms of investments made to improve human skills (including schooling,
informal education, training on the job, learning by doing, etc) as well as other factors that

facilitate the productive use of human skills (e.g. health). Besides formal education, nearly all of
the foregoing components of human capital are very difficult to measure; thus, most studies
linking human capital to economic growth have been restricted to studying the impact of formal
education on economic growth. The common understanding is that education is an important
ingredient in sustainable economic growth and that better education in the country ensures
smooth economic growth over time (Lucas, 1988; Barro, 1991).
The standard neoclassical growth model (Solow, 1956) was the cornerstone of growth theorizing
in the 50s and 60s. The model is basically an aggregate production function of the Cobb-Douglas
type and is characterized by constant returns to scale of all inputs, decreasing returns to each
input and a constant positive elasticity of input substitution.
K is physical capital
L is labour (sometimes interpreted as population)
t is time
A is a technology or efficiency index
The main empirical prediction of this model is that a country‟s economic growth depends on its
initial per capita income and on the factors that drive its steady state. This arises from the
theoretical expectation that a country will grow faster the further it is from its steady state (i.e.
conditional convergence). Subsequent models of economic growth extend the canonical Solow
model in two broad ways. In the first approach, human capital is introduced as an additional
factor of production and in the second approach human capital enters as an input into the
innovation process which brings about growth.
Review of Selected Literature
The common assumption of a balanced growth path among countries is also contended. In
Owen‟s et al (2009) analyses of a sample of developed and developing countries, it was shown
that countries do not necessarily follow similar growth paths; rather countries can be sorted into
categories, each with its own unique growth processes. The major source of heterogeneity in this
respect is the quality of institutions, proxied by the degree of law and order. This influences the
growth environment and affects the growth process, determining the effects the usual factors of
production, including human capital accumulation. In Gemmel (1996), it was shown that the
country‟s level of development significantly determines its human capital needs: primary
education is most important in least developed countries (LDCs), secondary education for
intermediate countries and tertiary education for OECD countries. Similarly, in a series of multi-
country analyses by Sunde and Vischer, the balanced growth path assumption was confronted. In
Sunde and Vischer (2011), the authors states „given that countries follow similar and balanced
growth paths, human capital, either as a factor of production or as a pre-requisite for innovation,
directly influences growth‟. However, these results collapse once the balanced growth path

assumption is removed. In such deficiency, human capital as a production factor or an innovation
input no longer directly influence growth. The effect is essentially conditioned by living
conditions: when favourable, the contribution of human capital to growth is amplified (Sunde
and Vischer, 2012).
The quality of the educational system has also shown as a condition for the effect of human
capital on growth. For instance, Dessus (1999) using panel data on 83 countries demonstrated
that differences in the quality composition of human capital across nations must be taken into
account when analyzing the effect of human capital on growth. Ignoring such differences creates
a significant estimation bias. The result of such biased estimation using panel data is that human
capital is presented as playing a negative role in growth models (e.g. Islam, 1995). After
correcting for such bias, a positive effect of human capital on growth was found. Additionally,
using a varying parameter method, he traced the heterogeneity among countries to the
differences in the quality of their human capital. In particular, the difference of education
infrastructure, initial endowment in developing human capital. Such difference affects the human
capital quality and the capacity of the education system to equitably distribute educational
services. These are reported to condition the effect of human capital on growth in the specified
sample of countries. Similarly, Banerjee (2012) used data on 55 countries for the period from
1980 to 2007 to show that quality composition of human capital is important for growth. His
argument is that the stock of human capital affects economic growth through its effect on capital
productivity as well as technological diffusion. This comes from his finding that while the stock
of tertiary educated persons is not a significant determinant of growth, the stock of secondary
and primary educated persons are important. Consequently, basic education – though maybe not
sufficient for research and development (R&D) - is necessary to absorb existing technologies and
its quality therefore plays a key role in conditioning the effect of human capital on growth.
Elias and Fernandez (2000)4 emphasized on role of human capital and income levels on
sustained growth in Latin American Countries. The major variables taken to analyze the impact
of human capital and growth were education indicators (primary, secondary and high school
gross enrolment ratios), dummy variables for low and middle incomes as per the classification of
income per capita of the World Bank indicators and variable of life expectancy. These were
regressed with GDP per capita for the period between 1965 and 1996. The regression result
reveals that the countries which invested more on primary education in 1965 had a tendency to
grow more. While the insignificance is observed for the secondary and high schooling, argued in
the paper with probable poor investment levels in the category. Similarly with inclusion of high
life expectancy variable, the result exhibits the positive high significance on growth regression.
4 Lic. Silvina Elias and Lic. M. del R. Fernandez, “Human Capital Investment, Income Levels and Economic
Grotwh in Latin American Countries”, Departamento de Economics. Universidad Nacional Del Sur, 2000

The study states that together with high level of skill, high life expectancy and better work habits
the improvement in the performance of growth is likely. The model with the inclusion of income
levels differentiation amongst the countries inferred that countries with low and middle low
incomes should have grown little due to a low investment rate in education. The paper however
concluded the importance of use of panel data instead of simple cross-section regression used in
the study; mainly to capture the heterogeneity arising out with the cultural, institutional and
technological differences amongst the observed countries.
Toche (2001)5 in his discussion paper highlights the important aspect of trade-off between
unemployment and growth. The basic model surrounds the determination of wage which is
central to such trade-off. The model combines the two-sector theory of endogenous growth with
the matching theory of unemployment.
Hoti (2003)6 in his paper empirically analyzed the key issues of high unemployment and large-
scale emigration in the transition economy of Kosova; a post-war Kosova. The logit specification
model developed to explore the probability of being unemployed and emigrating. The variables
taken were residence (rural/urban), gender, age, marital status and level of education. The
empirical results reveals that there is high probability of being unemployed in rural areas vis-à-
vis population residing in urban areas. Consequently, people residing in rural area also tend to
emigrate more. The finding also reveals the gender based unemployment probability as males
faces lower probability of being unemployed though the emigration found to be also higher in
male members. Similarly, they found less probability of being unemployed by educated
individual however they are tend to emigrate more than less educated people. The paper
necessitate that there is an immediate and urgent need to reintegrate the highly unemployed
people into employment, otherwise this would have a negative impact on growth.
Khan (2005)7 in his paper focused on the factors that may explain the growth performance of
Pakistan, particularly the quality of human capital. The paper pointed out that despite relatively
high growth rates of Pakistan‟s economy during the period 2004-05, the social development in
the country remained weak and poverty levels widespread with about an estimated 30 percent of
the population. He argued that investing in human capital, by creating a more productive work
force, will led to higher future growth and incomes. The paper mainly emphasized on investment
on education and health care providing opportunity to people under poverty to improve their
5 Patrick Toche, “Is there a Growth –Unemployment Trade-Off?”, Department of Economics, University of Oxford,
2001 6 Avdullah Hoti, “Human Capital and Unemployment in Transition Economies: The Case of Kosova”, International
Conference of The Faculty o Economic Sarajevo, 2003 7 Mohsin S. Khan, “Human Capital and Economic Growth in Pakistan”, The Pakistan Development Review 44:4,
Part I (Winter 2005) pp. 455-478

current living standards and also future prospects. The empirical analysis is based on cob-
douglas production function augmented with education and health indicators as a quality of
human capital. The measure used in the model includes literacy rates, average years of secondary
school enrolment and life expectancy. The model also used rate of inflation as a proxy for sound
economic policies and the overall quality of institutions. The model was estimated for a group of
72 developing countries including Pakistan. The beta coefficient findings from the model suggest
specifically the sizeable impact of population‟s health and education on the output and are
interestingly independent of each other. A strong relationship also found between the economic
policies, quality of institutions such as law and order, absence of corruption and protection of
property rights on growth.
Farida and Ahmadi (2006)8 provided empirical evidence on impact of corruption on human
capital productivity and growth. The paper mainly hypothesise that the corruption reduces the
standards of living as measured by real per capita GDP. The paper argued on patronage for
assuming positions rather than ability and tested the neo-classical growth model that explicitly
includes the direct and indirect effects of corruption on economic growth in Lebanon. The paper
uses the Solow growth model by extending with the inclusion of corruption as an important
determinant in the existing model. The study found significance of this new variable, the
magnitude of coefficients which affect positively on growth have reduced considerable stating
that corruption leads to inefficiency in the economy. The study concludes that corruption lowers
investment, while the effectiveness of government expenditure and the productivity of human
capital are also reduced in the case of Lebanon.
Stark and Fan (2007)9 has extended the existing literature on „brain drain‟ and „brain gain‟ by
analyzing the negative and positive impacts of migration by skilled and educated individuals in a
unified framework. He stated that the international migration in developing countries is largely
on the back of over-education creating educated unemployment situation. The analytical
framework considers two countries as home country and foreign country, i.e. from where the
migration takes place and to the country the immigration is possible, respectively. Based on two
period scenario i.e. current and future; the short run and the long run (one generation down the
road), the result reveals temporary negative impact in short run for migration of educated
individuals. The first negative impact is the reduction of stock of skilled and educated human
capital. Since the possibility of migration motivates individual to acquire higher education, in
turn reduces average income in the economy, and output shrinks. If some of them remain in the
8 Moe Farida and Fredoun Z. Ahmadi-Esfahani, “Corruption and Economic Growth in Lebanon”, Australian
Agricultural and Resource Economics Society, 52nd
Annual Conference (2006) 9 Oded Stark, and C. Simon Fan., “The Brain Drain, Educated Unemployment, Human Capital Formation and
Economic Betterment”, ZEF-Discussion Papers on Development Policy No. 114, Centre for Development Research,
Bonn, July 2007, pp. 36
home country, the returns to their education fall short of the cost incurred for higher education.
However, the entire scenario is beneficial for the long run (one generation down the road), by
improving to a higher average level of human capital in the home country. This can prompt to
„take-off‟ of the economy, and is conducive to achieving the benefit of long-run growth
Sunde and Vischer (2011)10
argued on reasons behind the weal empirical effect of human capital
on growth in existing cross country studies. He elaborated on the model approach which does not
account for the important variables through which human capital affects growth. A total of three
different datasets for average years of schooling from more than 80 countries collected for the
period ranging from 1970 to 2000. The paper identified the two distinct channels, changes in
human capital and the initial levels in human capital. The affect on growth by human capital can
only be identified when the initial levels and the changes in human capital are correlated. The
results suggested that the effect of human capital is likely to be underestimated and biased in
empirical specification that do not account for both channels. The study explained the weak
growth effects found in previous studies were on account of heterogeneity exist in the cross
country data and also other measurement issue.
10
Uwe Sunde and Thomas Vischer, “Human Capital and Growth: Specification Matters”, Institute ofr the Study of
Labor (IZA), Discussion Paper No. 5991, 2011

Governance and Economic Growth
Importance of governance being one of the critical factors that explain performance differences
across countries is widely recognized in economics. The contradiction arises generally on two
points, first is related to the identification of important governance capacities necessary for
economic development and second is related to the relative importance of governance as a
determinant of economic growth.
Evidence suggests that countries that converged to advanced economies had governance capacity
that facilitated the implementation of sound policies to encourage the acquisition, learning and
development of new technologies rapidly. Testing for the second area of disagreement, Sachs et
al. (2004) found that when differences in development are accounted for, the effect of
governance on differences in performance disappears.
The pressure on countries to improve quality of governance i.e. to be more accountable and
transparent is generally higher from external sources through international trade and
globalization. Policy makers are either forced or incentivized to introduce policy reforms to
facilitate international capital flows, technology and information as public spending in the past
have been failed to achieve meaningful results such as poverty reduction due to lack of proper
governance measures. The countries that wish to attract international capital and technology are
encouraged to improve governance framework of their economy, as weak rule of law leads to
rent seeking and corruption (IMF, 2002).
From policy point of view, governance can be viewed as market-enhancing or growth-enhancing.
Market-enhancing growth is a narrow concept which only deals with the efficiency of market.
Primary argument being efficient market attracts technology and capital and eventually improves
economic development of the country. On the contrary, growth-enhancing governance suggests
that markets are inherently inefficient. Specific governance capacities are required for efficient
allocation of resources and to accelerate growth using both market and non-market mechanisms
so that productivity, as well as absorptive capacity, can be increased (Khan, 2007). In short,
growth-enhancing and market-enhancing governance capacities are substantially different from
each other but they are not necessarily mutually exclusive.
Market-enhancing governance relates to development through market efficiency i.e. tools of
governance are used to increase the efficiency of markets which attracts technology and capital
and therefore increase growth. However, evidence suggests that it is very expensive to improve
governance in poor countries and most of the times these issues are persistent regardless of the
efforts and/or political will (Khan, 2005). In other words, market-enhancing governance focuses
on role of governance in reducing transaction costs to make markets more efficient while growth
enhancing governance focuses on role of governance. Thus catching-up of developing countries

by increasing the effectiveness of institutions to accelerate transfer of resources to productive
sectors and accelerate absorption and learning of potentially highly productive technology.
If policy attempts to attract technology and capital through increasing efficiency of the market
then it is less likely to be successful because capital and technology will be attracted to countries
with adequate human capital to understand, use and sometimes develop the technology.
Moreover, there is no universal strategy for technology acquisition as high growth countries have
used very different strategies to achieve high growth rates.
Empirical evidence shows at best, weak support for market-enhancing governance as an
important ingredient for convergence strategy towards developed countries. Both high and low
growth developing countries did not manage to meet governance conditions of market enhancing
governance.
Growth enhancing strategies require growth enhancing governance. However, specific
governance capacities can be quite diversified depending on country specific characteristics.
Rapid catching up strategies required growth enhancing capacities in order to ensure effective
implementation.
Growth strategies are also hampered by the so called „pyramid groups‟ as identified in Morck et
al (2004). Under pyramidal controls, elite families control the corporations without substantial
capital investments. Since these families assume power over many big corporations, eventually
they control their countries‟ economies to considerable extent. Major problem with such control
is the transfer of resources for private benefits. Political influence allows them to control public
policy, such as property rights. This favours the private and personal objectives which results in
inefficient allocation of resources, decrease in innovation and weakens economic development.
These families not only try to sustain their positions under status quo but also use political power
to erect significant entry barriers in capital markets (Morck et al. 2004).

Conceptual Framework
As exhibited in the figure,
the adequate governance
attempts to attract
technology and innovation
augmented by the quality of
human capital for the
improvement and absorption
of these technologies,
eventually improves
economic development of
the country.
Figure 2, states the slow economic
growth resulting from the weak
governance that indicates from
deteriorated law and order conditions,
corruption, ineffective governance
resulting in inefficient utilization of
human resource. The weak governance
in-turn reflected from lack of incentives
and investment in the economy which
further weakens the economic growth
and slowed down both in short run and
in the long run.
Figure 1: Governance as an important factor in human capital-led growth
Figure 2: Consequences of Weak Governance in context of
human-led growth
Human Capital
Adequate Governance
Learning/Absorption
Productivity Growth
Economic Growth
Weak Governance
Inefficient Labor Utilization
Reduced Absorptive Capacity
Inadequate protection of property rights
Lack of incentives to innovation
Low rate of Innovation
Slow Economic Growth
Innovation Innovation

Hypothesis
The relationship between human capital and economic growth, as discussed before, has been
studied in various different settings by many authors especially since the 1990s. Some of them
were case studies while others were cross country comparisons under different settings. A caveat
of these studies, especially in panel data studies, is the universal treatment of countries with
respect to quality of governance. We propose that positive and significant relationship between
human capital and economic growth might not be universal and that it might depend on the
quality of governance in the country. We expect that countries with low quality governance
might not be able to utilize its human capital to its potential. In language of econometrics, we
expect the relationship between human capital and economic growth to be insignificant for
countries with low level of governance.
Hypothesis 1: Relationship between human capital and economic growth is insignificant for
countries with low level of governance.
Model
Human capital-led growth literature provides various different model specifications for empirical
estimations. In this paper we used models proposed by Benhabib & Spiegel (1994) (equation 1)
and Cohen and Soto (2007) (equation 2).
------------------- (1)
Y = GDP at current PPP
HC = human capital index
K = capital stock at current PPP
n = population
---------------------- (2)
y = GDP per capita at current PPP
HC = human capital index
K = capital stock at current PPP
Equation 1 models growth in absolute GDP while equation 2 uses growth in GDP per capita as
dependent variable. Both studies used different variants of their main model for estimations.
Some variants included change in human capital as independent variable to capture instantaneous
impact of change in human capital stock on economic growth while others included first lag of
stock variable of human capital to analyze the lagged impact overall human capital base in the
country. Since qualification and experience reflect in output after some time lag, we used the
second variant in this study (as it is shown in the equations above).

Data
Data used in this study was taken from two sources; Penn World Tables v.8 and World
Governance Indicators of World Bank. Short data descriptions and sources can be found in
Appendix Table A1.
Governance Indicators
Governance indicators used in this study are taken from World Governance Indicators (WGI) of
World Bank. WGI provides six broad types of governance indicators which are generated using
various secondary data sources. WDI aims to quantify the aspects of traditions and institutions
being exercised in a country which includes the process of government selection, its monitoring
and replacement; the ability of government of design and effectively implement sound policies
as well as respect of state and citizens. These indicators are rescaled to follow normal
distribution within the range of -2.5 and +2.5 (except for political stability which exceeds +2.5
bound). An important note should be made here that higher numbers indicate better „control‟ of
government not vice versa. For example, value of 2.0 under corruption index compare to 1.5
would suggest better control of corruption and not that corruption is higher. The six governance
indicators are defined below as defined in WDI documentation11
.
Voice and Accountability
Voice and accountability captures perceptions of the extent to which a country's citizens are able
to participate in selecting their government, as well as freedom of expression, freedom of
association, and a free media.
Political Stability and Absence of Violence/Terrorism
Political Stability and Absence of Violence/Terrorism measures perceptions of the likelihood
that the government will be destabilized or overthrown by unconstitutional or violent means,
including politically-motivated violence and terrorism.
Government effectiveness
Government effectiveness captures perceptions of the quality of public services, the quality of
the civil service and the degree of its independence from political pressures, the quality of policy
formulation and implementation, and the credibility of the government's commitment to such
policies.
11
Definitions are provided in the full dataset of WGI under following link (accessed September 8th
, 2014)
http://info.worldbank.org/governance/wgi/wgidataset.xlsx

Regulatory quality
Regulatory quality captures perceptions of the ability of the government to formulate and
implement sound policies and regulations that permit and promote private sector development.
Rule of law
Rule of law captures perceptions of the extent to which agents have confidence in and abide by
the rules of society, and in particular the quality of contract enforcement, property rights, the
police, and the courts, as well as the likelihood of crime and violence.
Control of Corruption
Reflects perceptions of the extent to which public power is exercised for private gain, including
both petty and grand forms of corruption, as well as "capture" of the state by elites and private
interests.
„Voice and accountability‟ and „political stability and absence of violence‟ are least likely to
have any influence on effect of human capital and growth. This is mainly because they have had
no relation to technical efficiency.12
Therefore we excluded these indicators from our analysis.
An additional overall governance indicator was also generated by taking average of government
effectiveness, regulatory quality, rule of law and control of corruption to give the broader picture
of governance.
Since this study attempts to connect human-led growth with governance, it is useful to visually
asses the data to compare where countries stand with respect to their human capital as compared
to their level of governance. In the following figures, human capital is plotted against all
governance indicators used in this study for the year 2011. A first look at all these comparisons
clearly shows a similar pattern in all figures. This pattern suggests that country with high level of
governance have high level of human capital. However, same is not true for countries with
relatively low level of governance. The distribution at lower level of governance is quite widely
spread which suggests that in presence of medium and low level of governance, countries can
still have high or low levels of human capital. The impact of the level of human capital on
growth in presence of different levels of governance still remains an open question which is the
objective of this study. Scatter plots of rest of the governance indicators are available in the
appendix.
12
Hurryvansh Aubeeluck, “Institutional Governance and Economic Growth, with special reference to
Sub-Saharan Africa”, African Studies Association of Australasia and the Pacific - AFSAAP, Conference
Proceedings, 36th Annual Conference, 2013

Figure 3: Average Governance Index and Human Capital (2011)
Methodological Framework
Since the objective of this study is to ascertain whether human capital effects economic growth
differently in countries with better or worse level of governance, we split the sample in three
groups for each variable i.e. „low‟, „medium‟ and „high‟ level of control. Since WGI warns
against over interpretation of minor differences in countries (Kaufmann et al. 2010), we used
three slightly different schemes to split the sample. If borders of the sections are defined strictly
with a number then two countries on left and right of that border will be assigned to different
sections but in reality they might not be very different (as warned by WGI). In order to account
for this, we used three different schemes; „Overlapping‟ (figure 4), „Separated‟ (figure 5) and
„Strictly Separated‟ (figure 6).

Figure 4: Scheme 1 - Overlapping Sections
Figure 5: Scheme 2 - Separated Sections
Figure 6: Scheme 3 – Strictly-Separated Sections
Empirical Setup
Our sample includes data for 134 countries from 1996 to 2011. The standard empirical methods
used for panel data analysis with stationary variables are pooled OLS, fixed effects and random
effects models. If the sample includes large number of countries, some of which are significantly
different from each other, one should take country specific effects very seriously. Contrary to
pooled OLS approach, fixed effects and random effects models attempt to account for country
specific effects under different set of assumptions. Using hausman specification test, one can
determine whether fixed or random effects should be used for estimation of given model. Using
hausman test, we determined that fixed effects model was efficient and consistent for our model
and was used to estimate the parameters of the models.

Sensitivity of the results is checked using two different model specifications provided by the
literature as well as using different schemes to distribute the data in three sections. Expectedly
there were minor differences in the estimated coefficients and standard errors when different
procedures were used however results as a whole did not change. Therefore, results of scheme 2,
“Separated Sections” for Benhabib & Spiegel (1994) model will be reported and interpreted in
the text. Rest of the models can be found in the appendix.
Estimation Results
The unrestricted base models of Benhabib & Spiegel (BS) and Cohen & Soto (CS) models are
replicated before turning to the restricted models specific to our hypothesis. The results of fixed
effects, random effects and pooled OLS estimations are presented in table 1. The signs of the
coefficients were in accordance with the economic theory. One striking feature of the results is
very low coefficient of determination as compared to the original studies of these models.
However, R-squared improves when sub-samples are analyzed in later models. Although signs
and significance did not change with different estimation methods, the coefficients of human
capital and some other variables increased significantly when fixed effects were used i,e. for
human capital from 0.020 to 0.622, from pooled OLS and fixed effect, respectively in BS model.
It suggests that controlling for country specific effects is necessary which is also suggested by
Hausman test. The null hypothesis of Hausman test states that fixed effects method is consistent
and random effects is efficient while alternate hypothesis states that fixed effects is consistent but
random effects is inconsistent. The result of the test suggests that it is better to use fixed effects
compared to random effects model as results from random effects model will be inconsistent.
Effect on Human capital on economic growth under different levels of governance
In order to test our hypothesis, as explained earlier, we divided our dataset into three categories
(schemes) based on different levels of governance. These schemes serve as the tool for
sensitivity analysis of our results. The scheming is also necessary because small changes in
values of governance should not be over interpreted therefore hard division of the distribution
would result in two countries being in different groups even when their differences are quite low.
We used three schemes to account for this potential caveat; scheme1: “overlapping sections”
where boundaries of the sections overlap with each other, scheme 2: “separated sections” where
sections are created with hard division and scheme 3: “strictly separated sections” where there is
a gap between the sections to exclude countries with very small differences. While estimations
are carried out for all three schemes, we use scheme 2 as our base scheme and the other two
schemes as extensions of this scheme for sensitivity analysis. Since results were not sensitive to
the schemes, we will interpret the results of both BS and CS models estimated under the base
scheme (scheme 2).

Benhabib & Spiegel (BS) model with Scheme 2
Estimation results of BS model under scheme 2 are reported in table 2 where for each
governance indicator, results are reported for three sub-samples based on „low‟, „medium‟ and
„high‟ levels of governance. An important clarification is due at this point. All governance
variables are constructed in a way that high numbers represent better governance. For example,
high number for corruption means high level of control for corruption instead of high of level of
corruption. Results for the average governance support our hypothesis. The insignificance of
human capital in low governance countries clearly states that countries with low level of
governance human capital don‟t affect economic growth. Another observation is that magnitude
of coefficient of human capital for medium level of governance is more than twice as large as its
coefficient for high level of governance. Additionally, significance level was also much higher
for countries with medium level of governance. These observations hint towards a threshold
level of governance after which higher levels are not beneficial anymore. This also indicates the
diminishing returns of human capital investment from a particular threshold level which to some
extent can be observed in countries with high level of governance. Similar results were found for
regulatory quality and government effectiveness with the exception that coefficient of human
capital for countries with medium level of regulatory quality was higher but less than twice the
magnitude for countries with high level of regulatory quality.
We did not find support for our hypothesis for control of corruption and rule of law. We found
that, contrary to our expectations, human capital had positive and significant coefficient for
countries with low level of rule of law and control of corruption. This result suggests that level of
corruption and rule of law does not matter for human-led growth. Similar to the findings
discussed in last paragraph, we found much higher magnitude of the coefficient of human capital
for countries with medium level of rule of law and control of corruption vis-à-vis countries with
high level governance.
Cohen & Soto (CS) model with Scheme 2
Similar to the previous exercise, the estimations were carried out for CS model under scheme 2;
the results are presented in table 3. Contrary to the results of BS model, we found support of our
hypothesis for all governance indicators in CS model. We found that the relationship between
human capital and growth is insignificant for countries with low level of „governance (average)‟,
„rule of law‟, „control of corruption‟, „regulatory quality‟ and „government effectiveness‟. This
finding suggests that human capital in countries with low level of governance will not increase
economic growth unless it is combined with the policy of improving governance. While
coefficients of countries with medium level governance reveals similar results as in BS model
and are highly significant in all governance indicators vis-à-vis countries with high level of
governance.
Concluding Remarks
Empirical literature on relationship between human capital and economic growth provides
contradictory results. Many authors have studied this relationship using different settings,
countries and time periods. The cross country comparisons implicitly assume homogenous
governance systems/quality in all countries which, in our opinion, is a strong assumption. In this
study we used data for 134 countries and divided the sample based on the level of governance in
the countries. Using fixed effects model for estimation, in most of the cases we found that the
relationship between human capital and economic growth is insignificant (or weaker) for
countries with low level of governance. We also found that coefficient of human capital was
larger for countries with medium level of governance vis-à-vis countries with high level of
governance. This finding hint towards the threshold level of governance after which there might
be diminishing returns. The results were robust to the method of data division.
There is a potentially important role of Human Capital in supporting countries economic growth.
However, these findings suggest that increase in human capital might not reflect in the economic
growth if the country has bad governance. The system will not utilize its human capital to its full
potential in absence of proper regulatory framework and control of corruption. The study is one
of its kinds that reveal the importance of strengthening the link between human capital and
economic growth however that is subject to a threshold level as discovered in comparison of
countries having medium level governance with countries having high level governance.

Table 1: Base Models with Hausman test for Method Selection
Dependent variable: Annualized Difference in log GDP
Benhabib & Spiegel (1994)
Pooled OLS Fixed Effects Random Effects
lnHC(t-1) 0.0209* 0.622*** 0.0215*
(2.21) (9.44) (2.12)
ΔlnK 0.360*** 0.345*** 0.362***
(12.37) (10.06) (12.16)
Δlnn 0.741*** 1.222*** 0.721***
(4.89) (4.88) (4.54)
lnY(t-1) -0.00188+ -0.127*** -0.00216+
(-1.72) (-13.03) (-1.83)
Constant 0.0140 0.860*** 0.0169
(1.09) (10.68) (1.21)
N 2010 2010 2010
R-sq 0.099 0.135 -
adj. R-sq 0.098 0.071 -
Hausman test Chi-Squared: 169.87, P-value: 0.000
Dependent variable: Annualized Difference in log GDP per capita
Cohen & Soto (2007)
Pooled OLS Fixed Effects Random Effects
lnHC(t-1) 0.0521*** 0.470*** 0.0573***
(4.25) (8.23) (4.32)
ΔlnK 0.360*** 0.355*** 0.362***
(12.55) (10.41) (12.32)
lnY(t-1) -0.00730* -0.148*** -0.00853*
(-3.17) (-14.12) (-3.42)
Constant 0.0262+ 0.887*** 0.0323*
(1.92) (11.37) (2.18)
N 2010 2010 2010
R-sq 0.075 0.144 -
adj. R-sq 0.073 0.082 -
Hausman test Chi-Squared: 188.69, P-value: 0.000
Hausman test Ho: FE consistent, RE efficient; Ha: FE consistent, RE inconsistent.
t statistics in parentheses
+ p<0.10 * p<0.05 ** p<0.01 *** p<.0001

Table 2: Fixed Effects Estimation Results: Scheme 2- Separated Sections (BS Model)
Dependent variable: Annualized Difference in log GDP
Benhabib & Spiegel (1994)
Governance Average Rule of Law Control for Corruption
Low Medium High Low Medium High Low Medium High
lnHC(t-1) 0.566 0.641*** 0.284* 0.542* 0.661*** 0.303* 0.735* 0.711*** 0.282*
(1.62) (8.80) (2.38) (2.18) (8.64) (2.53) (1.99) (9.48) (2.32)
ΔlnK 0.629* 0.355*** 0.244*** 0.524*** 0.335*** 0.221*** 0.609* 0.358*** 0.227***
(2.80) (9.14) (5.68) (4.67) (7.42) (5.17) (2.05) (9.10) (4.97)
Δlnn 6.606*** 0.688* -0.0730 5.755*** 0.768* 2.064* 8.004*** 0.919* -0.168
(4.44) (2.51) (-0.12) (5.18) (2.66) (2.60) (4.70) (3.17) (-0.47)
lnY(t-1) -0.156* -0.103*** -0.187*** -0.130* -0.114*** -0.208*** -0.116* -0.123*** -0.184***
(-3.61) (-9.39) (-9.37) (-3.94) (-9.77) (-9.99) (-2.66) (-10.62) (-9.47)
Constant 1.021* 0.587*** 2.008*** 0.832* 0.688*** 2.248*** 0.560 0.732*** 2.004***
(2.99) (6.57) (11.77) (3.27) (7.11) (12.59) (1.46) (7.85) (11.80)
N 221 1357 432 292 1300 418 193 1418 399
R-sq 0.233 0.133 0.279 0.238 0.124 0.312 0.213 0.138 0.283
adj. R-sq 0.112 0.059 0.213 0.134 0.045 0.241 0.049 0.063 0.207
t statistics in parentheses
+ p<0.10 * p<0.05 ** p<0.01 *** p<.0001"
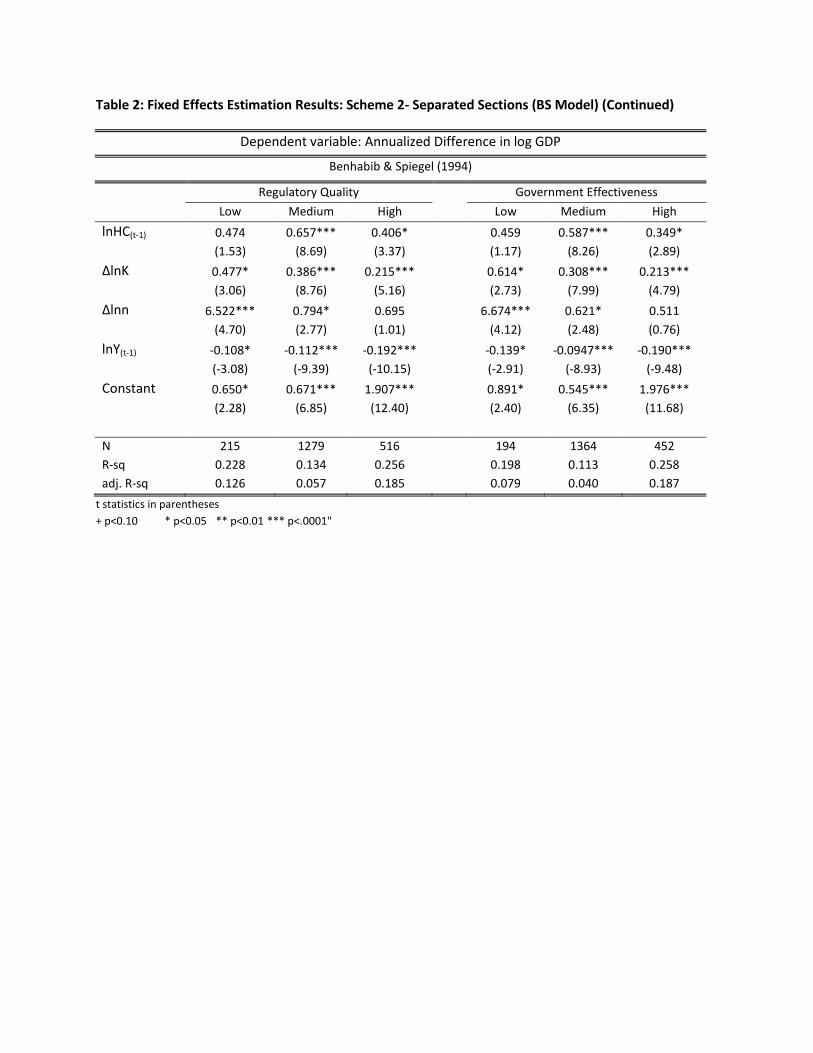
Table 2: Fixed Effects Estimation Results: Scheme 2- Separated Sections (BS Model) (Continued)
Dependent variable: Annualized Difference in log GDP
Benhabib & Spiegel (1994)
Regulatory Quality Government Effectiveness
Low Medium High Low Medium High
lnHC(t-1) 0.474 0.657*** 0.406* 0.459 0.587*** 0.349*
(1.53) (8.69) (3.37) (1.17) (8.26) (2.89)
ΔlnK 0.477* 0.386*** 0.215*** 0.614* 0.308*** 0.213***
(3.06) (8.76) (5.16) (2.73) (7.99) (4.79)
Δlnn 6.522*** 0.794* 0.695 6.674*** 0.621* 0.511
(4.70) (2.77) (1.01) (4.12) (2.48) (0.76)
lnY(t-1) -0.108* -0.112*** -0.192*** -0.139* -0.0947*** -0.190***
(-3.08) (-9.39) (-10.15) (-2.91) (-8.93) (-9.48)
Constant 0.650* 0.671*** 1.907*** 0.891* 0.545*** 1.976***
(2.28) (6.85) (12.40) (2.40) (6.35) (11.68)
N 215 1279 516 194 1364 452
R-sq 0.228 0.134 0.256 0.198 0.113 0.258
adj. R-sq 0.126 0.057 0.185 0.079 0.040 0.187
t statistics in parentheses
+ p<0.10 * p<0.05 ** p<0.01 *** p<.0001"

Table 3: Fixed Effects Estimation Results: Scheme 2- Separated Sections (CS Model)
Dependent variable: Annualized Difference in log GDP per capita
Cohen & Soto (2007)
Governance Average Rule of Law Control for Corruption
Low Medium High Low Medium High Low Medium High
lnHC(t-1) 0.345 0.534*** 0.324* 0.352 0.547*** 0.268* 0.441 0.561*** 0.339*
(1.10) (8.45) (2.91) (1.59) (8.24) (2.41) (1.25) (8.79) (2.92)
ΔlnK 0.686* 0.361*** 0.253*** 0.541*** 0.346*** 0.238*** 0.758* 0.363*** 0.244***
(2.98) (9.36) (6.05) (4.66) (7.74) (5.70) (2.46) (9.28) (5.48)
lny(t-1) -0.221*** -0.124*** -0.263*** -0.165*** -0.142*** -0.256*** -0.172* -0.141*** -0.266***
(-4.45) (-10.80) (-11.31) (-4.48) (-11.43) (-11.00) (-3.23) (-11.84) (-10.87)
Constant 1.384*** 0.607*** 2.360*** 1.002*** 0.755*** 2.349*** 0.983* 0.731*** 2.380***
(4.10) (7.30) (13.59) (4.16) (8.20) (13.71) (2.65) (8.42) (13.02)
N 221 1357 432 292 1300 418 193 1418 399
R-sq 0.163 0.147 0.326 0.160 0.145 0.343 0.109 0.153 0.322
adj. R-sq 0.036 0.076 0.266 0.049 0.069 0.277 -0.070 0.081 0.253
t statistics in parentheses
+ p<0.10 * p<0.05 ** p<0.01 *** p<.0001"

Table 3: Fixed Effects Estimation Results: Scheme 2- Separated Sections (CS Model) (Continued)
Dependent variable: Annualized Difference in log GDP per capita
Benhabib & Spiegel (1994)
Regulatory Quality Government Effectiveness
Low Medium High Low Medium High
lnHC(t-1) 0.289 0.514*** 0.396* 0.174 0.492*** 0.382*
(1.00) (7.92) (3.53) (0.50) (7.97) (3.39)
ΔlnK 0.546* 0.392*** 0.231*** 0.726* 0.318*** 0.228***
(3.41) (8.93) (5.69) (3.22) (8.28) (5.29)
lny(t-1) -0.152* -0.132*** -0.239*** -0.210* -0.116*** -0.263***
(-3.77) (-10.55) (-11.52) (-3.94) (-10.26) (-11.20)
Constant 0.944* 0.684*** 2.022*** 1.380* 0.574*** 2.290***
(3.53) (7.47) (13.68) (3.82) (7.07) (13.28)
N 215 1279 516 194 1364 452
R-sq 0.142 0.147 0.289 0.128 0.128 0.303
adj. R-sq 0.034 0.072 0.222 0.004 0.057 0.239
t statistics in parentheses
+ p<0.10 * p<0.05 ** p<0.01 *** p<.0001"

References
Abramovitz , Moses (1986). Catching Up, Forging Ahead, and Falling Behind. The Journal of
Economic History , Vol. 46, No. 2, 385-406
Aghion, P. and Howitt, P. (1992). A model of growth through creative destruction, Econometrica
60(2): pp. 323–351.
Arrow, K. J. (1962). The economic implications of learning by doing, Review of Economic
Studies 29: 155–173.
Aubeeluck, Hurryvansh. (2013), Institutional Governance and Economic Growth, with special
reference to Sub-Saharan Africa, African Studies Association of Australasia and the
Pacific – AFSAAP, 36th
Annual Conference – 2013.
Banerjee, Sudatta, Economic Growth and the Quality Composition of Human Capital (March 14,
2012). Available at SSRN: http://ssrn.com/abstract=2021735 or
http://dx.doi.org/10.2139/ssrn.2021735
Barro, R. (1991). Economic growth in a cross section of countries, The Quarterly Journal of
Economics 106(2): 407.
Barro, R. (1991). Economic growth in a cross section of countries, The Quarterly Journal of
Economics 106(2): 407.
Becker, G. S. (1993). Human Capital: A Theoretical and Empirical Analysis, with Special
Reference to Education, 3rd ed. edn, University of Chicago Press, Chicago.
Benhabib, J. and Spiegel, M. M. (1994). The role of human capital in economic development:
evidence from aggregate cross-country data, Journal of Monetary Economics 34(2):
143–173.
Cohen, D., & Soto, M. (2007). Growth and human capital: good data, good results. Journal of
economic growth, 12(1), 51-76.
Dessus, Sebastien, Human Capital and Growth: The Recovered Role of Education Systems (July
1, 1999). World Bank Policy Research Working Paper No. 2632. Available at SSRN:
http://ssrn.com/abstract=632700
Elias. Lic. Silvina., and Fernandez. Lic. M. del R., “Human Capital Investment, Income Levels
and Economic Grotwh in Latin American Countries”, Departamento de Economics.
Universidad Nacional Del Sur, 2000
Farida. M and Ahmadi-Esfahani. F. Z., “Corruption and Economic Growth in Lebanon”,
Australian Agricultural and Resource Economics Society, 52nd
Annual Conference
Gemmell, N. (1996). Evaluating the impacts of human capital stocks and accumulation on
economic growth: some new evidence, Oxford Bulletin of Economics and Statistics
58(1): 9–28.
Hoti., A., “Human Capital and Unemployment in Transition Economies: The Case of Kosova”,
International Conference of The Faculty o Economic Sarajevo, 2003
IMF (2002). Governance, corruption, and economic performance. International Monetary Fund.
Islam, N. (1995). “Growth Empirics: A Panel Data Approach”, The Quarterly Journal of
Economics, 110 (4), pp. 1127-1170.
Johansen, S. (1988). Statistical Analysis of Cointegration Vectors. Journal of economic
dynamics and control, 12, pp. 231-54.
Johansen, S. (1991). Estimation and Hypothesis testing of Cointegration vectors in Gaussian
Vector Autoregressive Models. Econometrica, 59, pp. 1551-1580
Johansen, S. (1992). Determination of Cointegration Rank in the Presence of a Linear Trend.
Oxford Bulletin of Economics and Statistics, 54 pp. 383-397.
Johansen, S. and Juselius, K. (1990). Maximum Likelihood Estimation and Inference on
Cointegration with applications to the Demand for Money. Oxford Bulletin of
Economics and Statistics, 52(2), pp. 169-210.
Kaufmann, Daniel and Kraay, Aart and Mastruzzi, Massimo, The Worldwide Governance
Indicators: Methodology and Analytical Issues (September 2010). World Bank Policy
Research Working Paper No. 5430. Available at SSRN:
http://ssrn.com/abstract=1682130
Khan, M. (2007). Governance, economic growth and development since the 1960s. Web:
http://eprints.soas.ac.uk/9921/1/DESA_Governance_Economic_Growth_and_Developm
ent_since_1960s.pdf accessed 29-08-2014
Khan, Mushtaq H. (2005). Review of DFID‟s governance target strategy paper. Commissioned
paper submitted to DFID.Department for International Development, London. (as cited
by Khan 2007)
Khan., Mohsin S., “Human Capital and Economic Growth in Pakistan”, The Pakistan
Development Review 44:4, Part I (Winter 2005) pp. 455-478
Lucas, R. E. (1988). On the mechanics of economic development, Journal of Monetary
Economics 22(1): pp. 3–42.
Mankiw, N., Romer, D. and Weil, D. (1992). A contribution to the empirics of economic growth,
Quarterly Journal of Economics 107(2): pp. 407–437.
Morck, R., Wolfenzon, D., & Yeung, B. (2004). Corporate governance, economic entrenchment
and growth (No. w10692). National Bureau of Economic Research.
Naeem Akram, Ihtsham ul Haq Padda, and Mohammad Khan., “The Long Term Impact of
Health Status on Economic Growth in Pakistan”, The Pakistan Development Review 47:
4 Part II (Winter 2008) pp. 487-500
Nedelkoska, L. and Neffke, F. (2010). Human capital mismatches along the career path, Jena
Economic Research Papers 2010(051).
OECD (1998). Human capital investment: an international comparison, Technical report, OECD,
Paris.
Owen, A.L., Videras, J., & Davis, L. (2009). Do all countries follow the same growth process?.
Journal of Economic Growth, 14(4), 265-286.
Qadri., Faisal Sultan and Waheed., Dr. Abdul, “Human Capital and Growth: Time Series
Evidence from Pakistan”, Pakistan Business Review (January 2011) pp. 815-833
Romer, P. M. (1986). Increasing returns and long run growth, Journal of Political Economy 94:
1002–1037.

Romer, P. M. (1990). Endogenous technological change, The Journal of Political Economy
98(5): pp. S71–S102.
Sachs, J., McArthur, J. W., Schmidt-Traub, G., Kruk, M., Bahadur, C., Faye, M., & McCord, G.
(2004). Ending Africa's poverty trap. Brookings papers on economic activity, 2004(1),
117-240.
Schütt, F. (2003). The importance of human capital for economic growth, Materialien des
Wissenschaftsschwerpunktes „Globalisierung der Weltwirtschaft“ Volume 27, IWIM -
Institute for World Economics and International Management, University of Bremen.
Solow, R. M. (1956). A contribution to the theory of economic growth, The Quarterly Journal of
Economics 70(1): pp. 65–94.
Stark. O., and F., C. Simon., “The Brain Drain, Educated Unemployment, Human Capital
Formation and Economic Betterment”, ZEF-Discussion Papers on Development Policy
No. 114, Centre for Development Research, Bonn, July 2007, pp. 36
Sunde, U. and Vischer, T. (2012). Beyond balanced growth: The effect of human capital on
economic growth reconsidered In: Mennillo, G., Schlenzig, T. And Friedrich, E. (eds)
Balanced Growth. Springer.
Sunde, U., & Vischer, T. (2011). Human Capital and Growth: Specification Matters. University
of St.Gallen, Dept. of Economics Discussion Paper No. 2011-31.
Sunde., U., and Vischer., Thomas, “Human Capital and Growth: Specification Matters”, Institute
ofr the Study of Labor (IZA), Discussion Paper No. 5991, 2011
Wang Yan and Tudong Yao (2003) “Source of China‟s economic growth 1952-1999:
incorporating human capital accumulation” China Economic Review 14 (2003) 32-52.
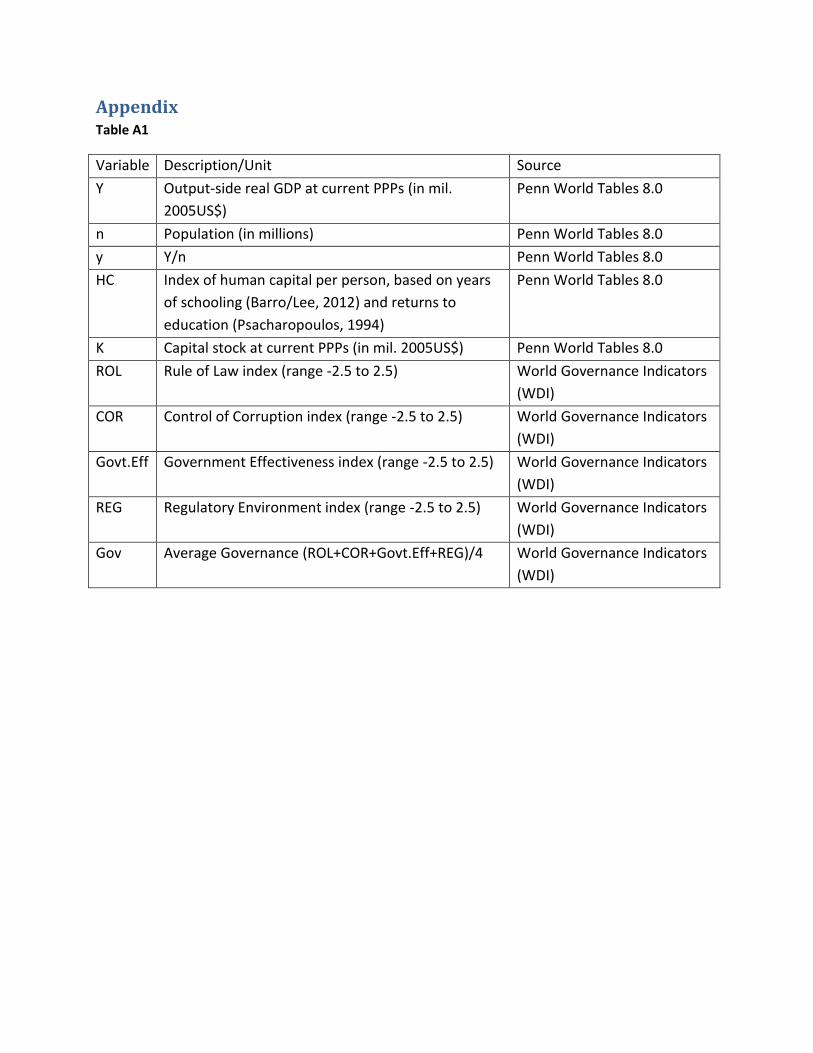
Appendix Table A1
Variable Description/Unit Source
Y Output-side real GDP at current PPPs (in mil.
2005US$)
Penn World Tables 8.0
n Population (in millions) Penn World Tables 8.0
y Y/n Penn World Tables 8.0
HC Index of human capital per person, based on years
of schooling (Barro/Lee, 2012) and returns to
education (Psacharopoulos, 1994)
Penn World Tables 8.0
K Capital stock at current PPPs (in mil. 2005US$) Penn World Tables 8.0
ROL Rule of Law index (range -2.5 to 2.5) World Governance Indicators
(WDI)
COR Control of Corruption index (range -2.5 to 2.5) World Governance Indicators
(WDI)
Govt.Eff Government Effectiveness index (range -2.5 to 2.5) World Governance Indicators
(WDI)
REG Regulatory Environment index (range -2.5 to 2.5) World Governance Indicators
(WDI)
Gov Average Governance (ROL+COR+Govt.Eff+REG)/4 World Governance Indicators
(WDI)
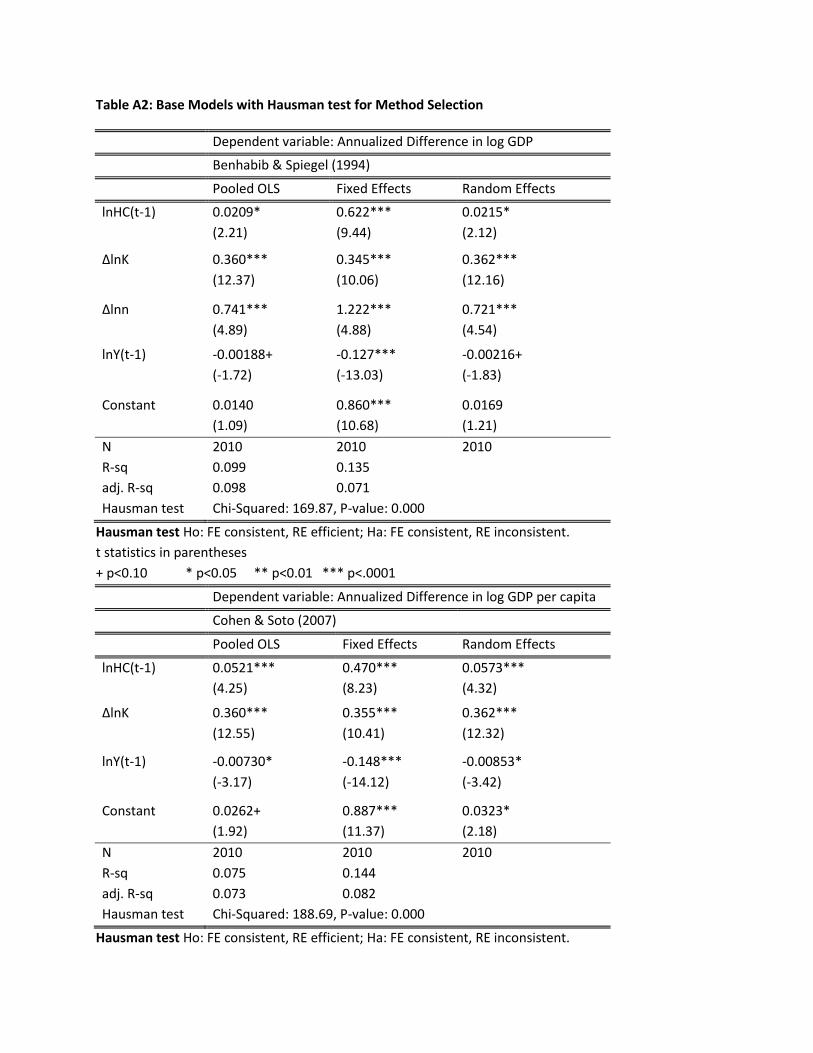
Table A2: Base Models with Hausman test for Method Selection
Dependent variable: Annualized Difference in log GDP
Benhabib & Spiegel (1994)
Pooled OLS Fixed Effects Random Effects
lnHC(t-1) 0.0209* 0.622*** 0.0215*
(2.21) (9.44) (2.12)
ΔlnK 0.360*** 0.345*** 0.362***
(12.37) (10.06) (12.16)
Δlnn 0.741*** 1.222*** 0.721***
(4.89) (4.88) (4.54)
lnY(t-1) -0.00188+ -0.127*** -0.00216+
(-1.72) (-13.03) (-1.83)
Constant 0.0140 0.860*** 0.0169
(1.09) (10.68) (1.21)
N 2010 2010 2010
R-sq 0.099 0.135
adj. R-sq 0.098 0.071
Hausman test Chi-Squared: 169.87, P-value: 0.000
Hausman test Ho: FE consistent, RE efficient; Ha: FE consistent, RE inconsistent.
t statistics in parentheses
+ p<0.10 * p<0.05 ** p<0.01 *** p<.0001
Dependent variable: Annualized Difference in log GDP per capita
Cohen & Soto (2007)
Pooled OLS Fixed Effects Random Effects
lnHC(t-1) 0.0521*** 0.470*** 0.0573***
(4.25) (8.23) (4.32)
ΔlnK 0.360*** 0.355*** 0.362***
(12.55) (10.41) (12.32)
lnY(t-1) -0.00730* -0.148*** -0.00853*
(-3.17) (-14.12) (-3.42)
Constant 0.0262+ 0.887*** 0.0323*
(1.92) (11.37) (2.18)
N 2010 2010 2010
R-sq 0.075 0.144
adj. R-sq 0.073 0.082
Hausman test Chi-Squared: 188.69, P-value: 0.000
Hausman test Ho: FE consistent, RE efficient; Ha: FE consistent, RE inconsistent.

t statistics in parentheses
+ p<0.10 * p<0.05 ** p<0.01 *** p<.0001

Table A3: Fixed Effects Estimation Results: Scheme 1- Overlapping Sections (BS Model)
Dependent variable: Annualized Difference in log GDP
Benhabib & Spiegel (1994)
Governance Average Rule of Law Control for Corruption
Low Medium High Low Medium High Low Medium High
lnHC(t-1) 0.566 0.641*** 0.284* 0.542* 0.670*** 0.303* 0.735* 0.686*** 0.282*
(1.62) (9.24) (2.38) (2.18) (8.99) (2.53) (1.99) (9.58) (2.32)
ΔlnK 0.629* 0.368*** 0.244*** 0.524*** 0.337*** 0.221*** 0.609* 0.364*** 0.227***
(2.80) (9.96) (5.68) (4.67) (7.65) (5.17) (2.05) (9.57) (4.97)
Δlnn 6.606*** 0.670* -0.0730 5.755*** 0.688* 2.064* 8.004*** 0.824* -0.168
(4.44) (2.55) (-0.12) (5.18) (2.45) (2.60) (4.70) (3.15) (-0.47)
lnY(t-1) -0.156* -0.105*** -0.187*** -0.130* -0.115*** -0.208*** -0.116* -0.116*** -0.184***
(-3.61) (-10.03) (-9.37) (-3.94) (-10.08) (-9.99) (-2.66) (-10.84) (-9.47)
Constant 1.021* 0.605*** 2.008*** 0.832* 0.686*** 2.248*** 0.560 0.680*** 2.004***
(2.99) (7.13) (11.77) (3.27) (7.30) (12.59) (1.46) (7.83) (11.80)
N 221 1462 432 292 1354 418 193 1505 399
R-sq 0.233 0.141 0.279 0.238 0.126 0.312 0.213 0.143 0.283
adj. R-sq 0.112 0.070 0.213 0.134 0.050 0.241 0.049 0.073 0.207
t statistics in parentheses
+ p<0.10 * p<0.05 ** p<0.01 *** p<.0001"

Table A3: Fixed Effects Estimation Results: Scheme 1- Overlapping Sections (BS Model) (Continued)
Dependent variable: Annualized Difference in log GDP
Benhabib & Spiegel (1994)
Regulatory Quality Government Effectiveness
Low Medium High Low Medium High
lnHC(t-1) 0.474 0.633*** 0.406* 0.459 0.608*** 0.349*
(1.53) (8.93) (3.37) (1.17) (8.70) (2.89)
ΔlnK 0.477* 0.390*** 0.215*** 0.614* 0.351*** 0.213***
(3.06) (10.25) (5.16) (2.73) (9.30) (4.79)
Δlnn 6.522*** 0.648* 0.695 6.674*** 0.668* 0.511
(4.70) (2.49) (1.01) (4.12) (2.61) (0.76)
lnY(t-1) -0.108* -0.112*** -0.192*** -0.139* -0.107*** -0.190***
(-3.08) (-10.15) (-10.15) (-2.91) (-10.23) (-9.48)
Constant 0.650* 0.683*** 1.907*** 0.891* 0.655*** 1.976***
(2.28) (7.59) (12.40) (2.40) (7.74) (11.68)
N 215 1448 516 194 1471 452
R-sq 0.228 0.148 0.256 0.198 0.135 0.258
adj. R-sq 0.126 0.074 0.185 0.079 0.062 0.187
t statistics in parentheses
+ p<0.10 * p<0.05 ** p<0.01 *** p<.0001"

Table A4: Fixed Effects Estimation Results: Scheme 2- Separated Sections (BS Model)
Dependent variable: Annualized Difference in log GDP
Benhabib & Spiegel (1994)
Governance Average Rule of Law Control for Corruption
Low Medium High Low Medium High Low Medium High
lnHC(t-1) 0.566 0.641*** 0.284* 0.542* 0.661*** 0.303* 0.735* 0.711*** 0.282*
(1.62) (8.80) (2.38) (2.18) (8.64) (2.53) (1.99) (9.48) (2.32)
ΔlnK 0.629* 0.355*** 0.244*** 0.524*** 0.335*** 0.221*** 0.609* 0.358*** 0.227***
(2.80) (9.14) (5.68) (4.67) (7.42) (5.17) (2.05) (9.10) (4.97)
Δlnn 6.606*** 0.688* -0.0730 5.755*** 0.768* 2.064* 8.004*** 0.919* -0.168
(4.44) (2.51) (-0.12) (5.18) (2.66) (2.60) (4.70) (3.17) (-0.47)
lnY(t-1) -0.156* -0.103*** -0.187*** -0.130* -0.114*** -0.208*** -0.116* -0.123*** -0.184***
(-3.61) (-9.39) (-9.37) (-3.94) (-9.77) (-9.99) (-2.66) (-10.62) (-9.47)
Constant 1.021* 0.587*** 2.008*** 0.832* 0.688*** 2.248*** 0.560 0.732*** 2.004***
(2.99) (6.57) (11.77) (3.27) (7.11) (12.59) (1.46) (7.85) (11.80)
N 221 1357 432 292 1300 418 193 1418 399
R-sq 0.233 0.133 0.279 0.238 0.124 0.312 0.213 0.138 0.283
adj. R-sq 0.112 0.059 0.213 0.134 0.045 0.241 0.049 0.063 0.207
t statistics in parentheses
+ p<0.10 * p<0.05 ** p<0.01 *** p<.0001"

Table A4: Fixed Effects Estimation Results: Scheme 2- Separated Sections (BS Model) (Continued)
Dependent variable: Annualized Difference in log GDP
Benhabib & Spiegel (1994)
Regulatory Quality Government Effectiveness
Low Medium High Low Medium High
lnHC(t-1) 0.474 0.657*** 0.406* 0.459 0.587*** 0.349*
(1.53) (8.69) (3.37) (1.17) (8.26) (2.89)
ΔlnK 0.477* 0.386*** 0.215*** 0.614* 0.308*** 0.213***
(3.06) (8.76) (5.16) (2.73) (7.99) (4.79)
Δlnn 6.522*** 0.794* 0.695 6.674*** 0.621* 0.511
(4.70) (2.77) (1.01) (4.12) (2.48) (0.76)
lnY(t-1) -0.108* -0.112*** -0.192*** -0.139* -0.0947*** -0.190***
(-3.08) (-9.39) (-10.15) (-2.91) (-8.93) (-9.48)
Constant 0.650* 0.671*** 1.907*** 0.891* 0.545*** 1.976***
(2.28) (6.85) (12.40) (2.40) (6.35) (11.68)
N 215 1279 516 194 1364 452
R-sq 0.228 0.134 0.256 0.198 0.113 0.258
adj. R-sq 0.126 0.057 0.185 0.079 0.040 0.187
t statistics in parentheses
+ p<0.10 * p<0.05 ** p<0.01 *** p<.0001"

Table A5: Fixed Effects Estimation Results: Scheme 3- Strictly Separated Sections (BS Model)
Dependent variable: Annualized Difference in log GDP
Benhabib & Spiegel (1994)
Governance Average Rule of Law Control for Corruption
Low Medium High Low Medium High Low Medium High
lnHC(t-1) 0.625 0.641*** 0.323* 0.542+ 0.661*** 0.363* 1.392* 0.711*** 0.300*
(1.12) (8.80) (2.57) (1.83) (8.64) (2.90) (2.22) (9.48) (2.32)
ΔlnK 0.379 0.355*** 0.230*** 0.536*** 0.335*** 0.222*** 0.348 0.358*** 0.214***
(1.07) (9.14) (4.95) (4.32) (7.42) (5.13) (0.85) (9.10) (4.45)
Δlnn 7.417*** 0.688* 0.898 5.723*** 0.768* 2.124* 11.76*** 0.919* 0.0626
(4.19) (2.51) (1.26) (4.79) (2.66) (2.64) (5.20) (3.17) (0.10)
lnY(t-1) -0.149* -0.103*** -0.195*** -0.132* -0.114*** -0.217*** -0.124* -0.123*** -0.186***
(-2.70) (-9.39) (-9.36) (-3.62) (-9.77) (-10.18) (-2.08) (-10.62) (-8.70)
Constant 0.910* 0.587*** 2.062*** 0.851* 0.688*** 2.303*** 0.137 0.732*** 2.009***
(2.10) (6.57) (11.37) (3.08) (7.11) (12.63) (0.26) (7.85) (10.75)
N 153 1357 395 259 1300 397 123 1418 382
R-sq 0.224 0.133 0.273 0.234 0.124 0.320 0.296 0.138 0.262
adj. R-sq 0.099 0.059 0.202 0.121 0.045 0.254 0.132 0.063 0.185
t statistics in parentheses
+ p<0.10 * p<0.05 ** p<0.01 *** p<.0001"

Table A5: Fixed Effects Estimation Results: Scheme 3- Strictly Separated Sections (BS Model) (Continued)
Dependent variable: Annualized Difference in log GDP
Benhabib & Spiegel (1994)
Regulatory Quality Government Effectiveness
Low Medium High Low Medium High
lnHC(t-1) 0.756+ 0.657*** 0.370* 0.702 0.587*** 0.270*
(1.73) (8.69) (2.79) (1.45) (8.26) (2.16)
ΔlnK 0.376 0.386*** 0.190*** 0.434 0.308*** 0.173*
(1.24) (8.76) (4.12) (1.18) (7.99) (3.74)
Δlnn 7.130*** 0.794* 0.468 6.651* 0.621* 0.885
(4.28) (2.77) (0.68) (3.66) (2.48) (1.31)
lnY(t-1) -0.159* -0.112*** -0.168*** -0.188* -0.0947*** -0.177***
(-3.26) (-9.39) (-8.18) (-3.11) (-8.93) (-8.60)
Constant 0.977* 0.671*** 1.674*** 1.184* 0.545*** 1.912***
(2.58) (6.85) (9.82) (2.64) (6.35) (10.81)
N 161 1279 401 147 1364 392
R-sq 0.241 0.134 0.218 0.225 0.113 0.250
adj. R-sq 0.139 0.057 0.133 0.102 0.040 0.172
t statistics in parentheses
+ p<0.10 * p<0.05 ** p<0.01 *** p<.0001"

Table A6: Fixed Effects Estimation Results: Scheme 1- Overlapping Sections (CS Model)
Dependent variable: Annualized Difference in log GDP per capita
Cohen & Soto (2007)
Governance Average Rule of Law Control for Corruption
Low Medium High Low Medium High Low Medium High
lnHC(t-1) 0.345 0.535*** 0.324* 0.352 0.553*** 0.268* 0.441 0.548*** 0.339*
(1.10) (8.94) (2.91) (1.59) (8.54) (2.41) (1.25) (8.90) (2.92)
ΔlnK 0.686* 0.374*** 0.253*** 0.541*** 0.349*** 0.238*** 0.758* 0.369*** 0.244***
(2.98) (10.20) (6.05) (4.66) (7.97) (5.70) (2.46) (9.76) (5.48)
lny(t-1) -0.221*** -0.127*** -0.263*** -0.165*** -0.142*** -0.256*** -0.172* -0.136*** -0.266***
(-4.45) (-11.57) (-11.31) (-4.48) (-11.72) (-11.00) (-3.23) (-12.19) (-10.87)
Constant 1.384*** 0.635*** 2.360*** 1.002*** 0.746*** 2.349*** 0.983* 0.700*** 2.380***
(4.10) (7.97) (13.59) (4.16) (8.34) (13.71) (2.65) (8.53) (13.02)
N 221 1462 432 292 1354 418 193 1505 399
R-sq 0.163 0.158 0.326 0.160 0.146 0.343 0.109 0.158 0.322
adj. R-sq 0.036 0.088 0.266 0.049 0.072 0.277 -0.070 0.090 0.253
t statistics in parentheses
+ p<0.10 * p<0.05 ** p<0.01 *** p<.0001"

Table A6: Fixed Effects Estimation Results: Scheme 1- Overlapping Sections (CS Model) (Continued)
Dependent variable: Annualized Difference in log GDP per capita
Benhabib & Spiegel (1994)
Regulatory Quality Government Effectiveness
Low Medium High Low Medium High
lnHC(t-1) 0.289 0.510*** 0.396* 0.174 0.499*** 0.382*
(1.00) (8.40) (3.53) (0.50) (8.25) (3.39)
ΔlnK 0.546* 0.397*** 0.231*** 0.726* 0.359*** 0.228***
(3.41) (10.50) (5.69) (3.22) (9.58) (5.29)
ln(t-1) -0.152* -0.135*** -0.239*** -0.210* -0.129*** -0.263***
(-3.77) (-11.70) (-11.52) (-3.94) (-11.70) (-11.20)
Constant 0.944* 0.720*** 2.022*** 1.380* 0.681*** 2.290***
(3.53) (8.49) (13.68) (3.82) (8.53) (13.28)
N 215 1448 516 194 1471 452
R-sq 0.142 0.165 0.289 0.128 0.152 0.303
adj. R-sq 0.034 0.093 0.222 0.004 0.082 0.239
t statistics in parentheses
+ p<0.10 * p<0.05 ** p<0.01 *** p<.0001"

Table A7: Fixed Effects Estimation Results: Scheme 2- Separated Sections (CS Model)
Dependent variable: Annualized Difference in log GDP per capita
Cohen & Soto (2007)
Governance Average Rule of Law Control for Corruption
Low Medium High Low Medium High Low Medium High
lnHC(t-1) 0.345 0.534*** 0.324* 0.352 0.547*** 0.268* 0.441 0.561*** 0.339*
(1.10) (8.45) (2.91) (1.59) (8.24) (2.41) (1.25) (8.79) (2.92)
ΔlnK 0.686* 0.361*** 0.253*** 0.541*** 0.346*** 0.238*** 0.758* 0.363*** 0.244***
(2.98) (9.36) (6.05) (4.66) (7.74) (5.70) (2.46) (9.28) (5.48)
lny(t-1) -0.221*** -0.124*** -0.263*** -0.165*** -0.142*** -0.256*** -0.172* -0.141*** -0.266***
(-4.45) (-10.80) (-11.31) (-4.48) (-11.43) (-11.00) (-3.23) (-11.84) (-10.87)
Constant 1.384*** 0.607*** 2.360*** 1.002*** 0.755*** 2.349*** 0.983* 0.731*** 2.380***
(4.10) (7.30) (13.59) (4.16) (8.20) (13.71) (2.65) (8.42) (13.02)
N 221 1357 432 292 1300 418 193 1418 399
R-sq 0.163 0.147 0.326 0.160 0.145 0.343 0.109 0.153 0.322
adj. R-sq 0.036 0.076 0.266 0.049 0.069 0.277 -0.070 0.081 0.253
t statistics in parentheses
+ p<0.10 * p<0.05 ** p<0.01 *** p<.0001"

Table A7: Fixed Effects Estimation Results: Scheme 2- Separated Sections (CS Model) (Continued)
Dependent variable: Annualized Difference in log GDP per capita
Benhabib & Spiegel (1994)
Regulatory Quality Government Effectiveness
Low Medium High Low Medium High
lnHC(t-1) 0.289 0.514*** 0.396* 0.174 0.492*** 0.382*
(1.00) (7.92) (3.53) (0.50) (7.97) (3.39)
ΔlnK 0.546* 0.392*** 0.231*** 0.726* 0.318*** 0.228***
(3.41) (8.93) (5.69) (3.22) (8.28) (5.29)
lny(t-1) -0.152* -0.132*** -0.239*** -0.210* -0.116*** -0.263***
(-3.77) (-10.55) (-11.52) (-3.94) (-10.26) (-11.20)
Constant 0.944* 0.684*** 2.022*** 1.380* 0.574*** 2.290***
(3.53) (7.47) (13.68) (3.82) (7.07) (13.28)
N 215 1279 516 194 1364 452
R-sq 0.142 0.147 0.289 0.128 0.128 0.303
adj. R-sq 0.034 0.072 0.222 0.004 0.057 0.239
t statistics in parentheses
+ p<0.10 * p<0.05 ** p<0.01 *** p<.0001"

Table A8: Fixed Effects Estimation Results: Scheme 3- Strictly Separated Sections (CS Model)
Dependent variable: Annualized Difference in log GDP per capita
Cohen & Soto (2007)
Governance Average Rule of Law Control for Corruption
Low Medium High Low Medium High Low Medium High
lnHC(t-1) 0.477 0.534*** 0.354* 0.389 0.547*** 0.343* 0.521 0.561*** 0.343*
(0.93) (8.45) (3.00) (1.47) (8.24) (2.95) (0.84) (8.79) (2.84)
ΔlnK 0.597 0.361*** 0.247*** 0.567*** 0.346*** 0.242*** 0.761+ 0.363*** 0.236***
(1.65) (9.36) (5.45) (4.45) (7.74) (5.74) (1.72) (9.28) (5.02)
lny(t-1) -0.231* -0.124*** -0.266*** -0.177*** -0.142*** -0.271*** -0.183* -0.141*** -0.264***
(-3.59) (-10.80) (-10.95) (-4.29) (-11.43) (-11.33) (-2.39) (-11.84) (-10.61)
Constant 1.366* 0.607*** 2.367*** 1.058*** 0.755*** 2.428*** 1.003+ 0.731*** 2.356***
(3.11) (7.30) (12.96) (4.01) (8.20) (13.93) (1.91) (8.42) (12.68)
N 153 1357 395 259 1300 397 123 1418 382
R-sq 0.126 0.147 0.321 0.159 0.145 0.358 0.107 0.153 0.318
adj. R-sq -0.006 0.076 0.257 0.040 0.069 0.297 -0.089 0.081 0.249
t statistics in parentheses
+ p<0.10 * p<0.05 ** p<0.01 *** p<.0001"

Table A8: Fixed Effects Estimation Results: Scheme 3- Strictly Separated Sections (CS Model) (Continued)
Dependent variable: Annualized Difference in log GDP per capita
Benhabib & Spiegel (1994)
Regulatory Quality Government Effectiveness
Low Medium High Low Medium High
lnHC(t-1) 0.632 0.514*** 0.386* 0.262 0.492*** 0.296*
(1.54) (7.92) (3.14) (0.63) (7.97) (2.51)
ΔlnK 0.493 0.392*** 0.204*** 0.574 0.318*** 0.191***
(1.57) (8.93) (4.52) (1.55) (8.28) (4.23)
lny(t-1) -0.230*** -0.132*** -0.222*** -0.285*** -0.116*** -0.240***
(-4.09) (-10.55) (-9.71) (-4.23) (-10.26) (-9.96)
Constant 1.307* 0.684*** 1.870*** 1.821*** 0.574*** 2.170***
(3.73) (7.47) (11.32) (4.19) (7.07) (12.15)
N 161 1279 401 147 1364 392
R-sq 0.149 0.147 0.261 0.160 0.128 0.293
adj. R-sq 0.042 0.072 0.184 0.034 0.057 0.222
t statistics in parentheses
+ p<0.10 * p<0.05 ** p<0.01 *** p<.0001"

43
Figure 7: Control of Corruption and Human capital (2011)
Figure 8: Regulatory Quality and Human capital (2011)

44
Figure 9: Government Efficiency and Human Capital (2011)
Correlation Matrix
ΔlnY Δlny lnh(t-1) Δlnck Δlnn lnY(t-1) lny(t-1)
ΔlnY 1
Δlny 0.9862 1
lnh(t-1) -0.0588 0.0249 1
Δlnck 0.2937 0.2573 -0.1378 1
Δlnn 0.1702 0.0044 -0.5027 0.2417 1
lnY(t-1) -0.0584 -0.0126 0.4433 -0.035 -0.2772 1
lny(t-1) -0.0497 -0.0031 0.779 -0.0327 -0.2811 0.5527 1
Descriptive Statistics
Variable Obs Mean Std. Dev. Min Max
ΔlnY 2010 0.041222 0.090408 -0.93698 1.12034
Δlny 2010 0.026929 0.089091 -0.94246 1.115328
lnh(t-1) 2010 0.869949 0.252762 0.127135 1.286128
Δlnck 2010 0.05291 0.067864 -0.4877 0.971869
Δlnn 2010 0.014293 0.014988 -0.01841 0.185883
lnY(t-1) 2010 10.99621 1.964236 5.704933 16.39151
lny(t-1) 2010 8.717786 1.334267 4.914746 11.60562
Avg.Governance 2010 0.116643 0.970479 -2.12292 2.201406

45
Rule of Law 2010 0.049999 1.002271 -2.22985 1.99964
Control of Corruption 2010 0.080258 1.042928 -2.05746 2.585616
Regulatory Quality 2010 0.187996 0.935579 -2.41273 2.247345
Government
Effectiveness 2010 0.14832 0.998738 -1.98201 2.429652


![Prophet muhammad1[slideshare]](https://img.dokumen.tips/doc/110x75/5558c240d8b42aa52a8b53b0/prophet-muhammad1slideshare.jpg)