Embed Size (px)
Citation preview
DEPARTAMENTO DE
ENGENHARIA MECÂNICA
Hugoniot characterization of WC-Ni powders Submitted in Partial Fulfilment of the Requirements for the Degree of Master in Mechanical Engineering in the speciality of Energy and Environment
Author
Rui Pedro Tavares de Sousa
Advisors
Professor José Manuel Baranda Moreira da Silva Ribeiro Doctor João Pedro Pereira Piroto Duarte
Jury
President Doctor Ana Paula Bettencourt Martins Amaro
Professor at University of Coimbra
Vowels
Doctor Cristina Maria Gonçalves dos Santos
Professor at University of Coimbra
Doctor Ricardo António Lopes Mendes
Professor at University of Coimbra
Advisor Doctor José Manuel Baranda Moreira da Silva Ribeiro
Professor at University of Coimbra
Institutional Collaboration
Coimbra, September, 2015


A arte consiste em fazer os outros sentir o que nós sentimos,
Em os libertar deles mesmos,
Propondo-lhes a nossa personalidade para especial libertação.
Fernando Pessoa, at Livro do desassossego, 1984
To my parentes and sister

Acknowledgements
Rui Pedro Tavares de Sousa i
Acknowledgements
I would like to acknowledge my family for the invaluable support and
encouragement they have always provided me with and for always inciting me broaden my
horizons. Without them on my side, neither the experiences in Coimbra, Split nor London
experiences would be part of me. To my mum, dad and sister I give a heartfelt thank you.
A special thanks to Dr. William Proud for accepting me at ISP as well as to my
advisor Dr. J. P. Duarte for the warm welcome and all the guidance he has been kindly
offering. I shall also thanks the ISP committee, which succeeded in making me feel at home.
My sincerest thanks to Professor José B. Ribeiro, for the additional advice and mentoring.
Without him or Professor Cristina Santos, this collaboration between institutions would not
be possible, hence I am particularly grateful to them for having given me this excellent
opportunity.
Last but not least, a meaningful thank you to all my friends who have been
patiently supporting me during these beautiful five years, making them more enjoyable,
filled with unforgettable stories.

Hugoniot characterization of WC-Ni powders
ii 2015

Abstract
Rui Pedro Tavares de Sousa iii
Abstract
Tungsten Carbide mixed with Nickel (WC-Ni) is of great importance in
applications that requires high levels of hardness and wear resistance due to the combination
of properties granted by the presence of two different phases: Tungsten Carbide phase
imparts the hardness and the strength while metallic matrix acts to increase ductility and
toughness.
The dynamic behaviour of WC-Ni powders, with Nickel content of 11% was
studied under planar loading conditions. A gas gun was used to conduct planar impact
experiments at velocities of 320, 500 and 620 m/s to determine the shock and wave
propagation characteristics of the material stablishing the Hugoniot relations in different
planes.
When the material is shocked between 1.1 to 4.8 GPa, a steady shock wave is
generated which propagates at a velocity ranging from 866 to 1620 m/s and transfers energy
into particles that moves at velocities between 151 and 300 m/s after its passage.
Based on the achieved results, recommendations will be made for performing
future works aimed at improving the experimental technique, with the purpose of enhancing
the understanding of the behaviour of materials when subjected to shock.
Keywords: Tungsten Carbide powders mixed with Nickel, Porous materials, Shock waves, Hugoniot relations, Plate impact experiments, Heterodyne velocimetry.

Hugoniot characterization of WC-Ni powders
iv 2015
Resumo
Rui Pedro Tavares de Sousa v
Resumo
O carboneto de tungsténio com adição de uma matriz secundária de Níquel (WC-
Ni) é de grande importância em aplicações em que são exigidas grandes valores de
resistência e abrasão. Estas propriedades são garantidas pelas diferentes fases da estrutura,
em que o WC garante rigidez enquanto que o Ni adiciona plasticidade e ductilidade ao
material.
O comportamento ao choque dos pós de WC-Ni (mistura com 11% de Níquel) é
estudado com recurso a condições de impacto planar. Esta experiência recorre a um canhão
de gás comprimido para realizar impactos a altas velocidades de projétil na ordem de 320,
500 e 620 m/s. Esta metodologia permite obter informação suficiente para caracterizar a
propagação das ondas de choque no material estabelecendo a chamada relação de Hugoniot.
Quando o impacto dos corpos gera pressões entre 1,1 e 4,8 GPa, é gerada uma
frente de onda de choque que se propaga a velocidades compreendidas entre 866 e 1620 m/s.
A passagem da onda no material transfere energia às partículas induzindo-lhes velocidades
entre 151 e 300 m/s.
Com base na análise dos resultados, são propostos trabalhos futuros para o
melhoramento da metodologia experimental com o intuito de aprofundar o conhecimento do
comportamento dos materiais face ao choque.
Palavras-chave:
Carboneto de tungsténio misturado com níquel, Materiais porosos, Ondas de choque; Relação de Hugoniot, Impactos planares, Canhão de gás comprimido.
Hugoniot characterization of WC-Ni powders
vi 2015

Contents
Rui Pedro Tavares de Sousa vii
Contents
List of figures ....................................................................................................................... ix
List of tables ......................................................................................................................... xi
Simbology, subscripts and acronyms ................................................................................. xiii Simbology ....................................................................................................................... xiii Subscripts ....................................................................................................................... xiv
Acronyms ....................................................................................................................... xiv
1. Introduction ................................................................................................................... 1 1.1. Background and objectives ..................................................................................... 1
1.2. Outline .................................................................................................................... 2
2. Theoretical background ................................................................................................. 5 2.1. Shock waves ........................................................................................................... 5
2.1.1. The Hugoniot relations .................................................................................... 5
2.1.1. Hugoniot of porous materials .......................................................................... 8 2.1.2. Tungsten Carbide shock data ......................................................................... 11
3. Materials and methods ................................................................................................. 15 3.1. Tungsten Carbide, WC ......................................................................................... 15
3.1.1. Tungsten carbide powders ............................................................................. 15
3.1.2. Powder characterization ................................................................................ 16
3.2. Powder compaction ............................................................................................... 17 3.2.1. Isostatic pressing dye ..................................................................................... 17 3.2.2. Density measurement .................................................................................... 18
4. Experimental methodology.......................................................................................... 21 4.1. Gun description ..................................................................................................... 21
4.2. Target configuration ............................................................................................. 22 4.2.1. Target setup ................................................................................................... 22
4.3. Sabot configuration ............................................................................................... 26 4.3.1. Velocity of the sabot ...................................................................................... 27
4.4. Heterodyne velocimetry ........................................................................................ 27 4.4.1. Basic principles of operation ......................................................................... 27
4.4.2. Measuring technique...................................................................................... 28 4.4.3. Setup .............................................................................................................. 29 4.4.4. Preparation of the optical fibre ...................................................................... 30
4.4.5. HetV system calibration ................................................................................ 31
5. Results and discussion ................................................................................................. 33 5.1. Data analysis ......................................................................................................... 34 5.2. HetV results .......................................................................................................... 35
5.2.1. Experiment I, impact at 500 m/s .................................................................... 37 5.2.2. Experiment II, impact at 320 m/s .................................................................. 38 5.2.3. Experiment III, impact at 660 m/s ................................................................. 39
Hugoniot characterization of WC-Ni powders
viii 2015
5.3. Errors and the influence of tilt .............................................................................. 41 5.3.1. Propagation of errors ..................................................................................... 41
5.4. Hugoniot results .................................................................................................... 43
5.5. Theoretical approaching ....................................................................................... 46 5.5.1. Mie-Grüneisen model .................................................................................... 46 5.5.2. Thouvenin model ........................................................................................... 47
5.6. Discussion of the results and models .................................................................... 48
6. Conclusions and future works ..................................................................................... 51
Bibliography ........................................................................................................................ 53
Appendix A ......................................................................................................................... 55 2D Project of the isostatic pressing dye .......................................................................... 55
A.1. Body part I ........................................................................................................... 55 A.2. Body part II ......................................................................................................... 56 A.3. Punch ................................................................................................................... 57 A.4. Base ..................................................................................................................... 57
Appendix B ......................................................................................................................... 59
2D project of the target .................................................................................................... 59 B.1. Cooper plate ......................................................................................................... 59 B.2. Sample holder ...................................................................................................... 60
B.3. Fiber holder .......................................................................................................... 61 B.4. Ring ..................................................................................................................... 61

List of figures
Rui Pedro Tavares de Sousa ix
LIST OF FIGURES
Figure 2.1. Shock wave state of material............................................................................... 6
Figure 2.2. The Hugoniot curve of solid and porous materials in the P – up plane. .............. 8
Figure 2.3. Schematic representation of the model of Thouvenin (Thouvenin, 1965). ....... 10
Figure 2.4. Experimental shock velocity versus particle velocity (Grady, 2009). .............. 12
Figure 2.5. Measured shock velocity for WC powder versus in-material particle velocity
determined though impedance matching techniques (Vogler et al., 2005). .......... 13
Figure 3.1. Morphology of Powder: a) WC and b) GD20N (Pires, 2012). ......................... 16
Figure 3.2. X-Ray Difractogram of WC and GD20N powders (Pires, 2012). .................... 17
Figure 3.3. Isostatic compressing dye and ring. .................................................................. 18
Figure 4.1. Gas gun at ISP laboratory. ................................................................................ 21
Figure 4.2. Target configuration and description. ............................................................... 23
Figure 4.3. Alignment the centre of the shocking areas. ..................................................... 24
Figure 4.4. Laser setup for alignment of the mirror of reference. ....................................... 25
Figure 4.5. Laser setup for alignment of the target holder. ................................................. 26
Figure 4.6. High velocity sabot. .......................................................................................... 26
Figure 4.7. Schematic representation of HetV (Strand et al., 2004). .................................. 27
Figure 4.8. a)HetV sensors setup and light gates; b) HetV sensors setup identification. .... 29
Figure 4.9. Gas gun, target assembly and measuring systems setup. ................................. 30
Figure 4.10. Schematic section view of optical fibre. ......................................................... 31
Figure 4.11. HetV curves of calibration shifted in time to overlay. .................................... 32
Figure 5.1. Cooper target and reference points of measurement of the thickness
(represented as a cross).......................................................................................... 34
Figure 5.2. Elastic and Plastic wave on Amplitude vs. Time graphic (Strand et al., 2004). 35
Figure 5.3. I Plot Signal: a) C1; b) C2; c) C3; d) C4. .......................................................... 37
Figure 5.4. I C1 Spectrogram (velocity) interpolated within an area of interest. ................ 38
Figure 5.5. II Plot Signal: a) C1; b) C2; c) C3; d) C4. ........................................................ 39
Figure 5.6. II C1 Spectrogram (velocity) interpolated within an area of interest................ 39
Figure 5.7. III Plot Signal: a) C1; b) C2; c) C3; d) C4. ....................................................... 40
Figure 5.8. III C1 Spectrogram (velocity) interpolated within an area of interest. ............. 40
Figure 5.9. Scheme of the propagation of errors in Velocity of shock................................ 42

Hugoniot characterization of WC-Ni powders
x 2015
Figure 5.10. Hugoniot curve and pondered errors in the plane Us-up for the obtained
experimental results and Vogler (2005). ............................................................... 44
Figure 5.11. Hugoniot results and calculated propagation of errors in P – ν plane. ........... 45
Figure 5.12. Mie-Grüneisen Model and experimental results and calculated propagation of
errors in the P-ν. .................................................................................................... 47
Figure 5.13. Thouvenin Model and experimental results and calculated propagation of
errors in the P-ν. .................................................................................................... 48
List of tables
Rui Pedro Tavares de Sousa xi
LIST OF TABLES
Table 3.1. Characteristics of GD20N powders (Pires, 2012). ............................................. 15
Table 3.2. Density measurements of the samples. ............................................................... 18
Table 5.1. Characterization of the experimental shots. ....................................................... 33
Table 5.2. HetV data. ........................................................................................................... 36
Table 5.3. Propagation of errors in the Hugoniot parameters. ............................................ 43
Table 5.4. Hugoniot data in Us-up plane. ............................................................................. 44
Table 5.5. Hugoniot data in P-ν-plane. ................................................................................ 45
Table 5.6. Mie-Grüneisen parameters. ................................................................................ 47

Hugoniot characterization of WC-Ni powders
xii 2015

Simbology, subscripts and acronyms
Rui Pedro Tavares de Sousa xiii
SIMBOLOGY, SUBSCRIPTS AND ACRONYMS
Simbology
𝐴 – Area
c – Light speed
𝐶0– Velocity of sound on the material
d – Diameter
𝑒 – Internal energy
𝑓0 – Initial frequency of light
𝑓𝑏 – Frequency of beat signal
𝑓𝑑 –-Frequency of Doppler shifted light
𝑚 – Mass
𝑃 – Pressure
𝑢𝑝 – Particle velocity
𝑈𝑠– Shock wave velocity
𝑥𝑠𝑎𝑚𝑝𝑙𝑒 –-Thickness of the sample
𝛼 – Coefficient of linear thermal expansion
𝜆 – Wavelength
𝜌 – Density
𝜎 – Stress
Г – Mie-Grüneisen parameter
𝜈 – Specific volume
𝛥𝑡 – Span time

Hugoniot characterization of WC-Ni powders
xiv 2015
Subscripts
P – Porous material
S – Non-porous material
0 – Non- shocked material
1 – Shocked material
Acronyms
DEM – Departamento de Engenharia Mecânica
FCTUC – Faculdade de Ciências e Tecnologia da Universidade de Coimbra
HetV – Heterodyne Velocimetry
ICL – Imperial College of London
ISP – Institute of Shock Physics

Introduction
Rui Pedro Tavares de Sousa 1
1. INTRODUCTION
1.1. Background and objectives
From a basic point of view, experimental study of the dynamic behaviour of
materials is rather simple. An experiment can be easily performed by introducing a stress in
the material and measuring its response in terms of deformation and/or force. For low
velocity impacts, the behaviour of the material is mastered by elastic wave deformation since
the applied stress on it is lower than the material’s yield strength. On the other hand, if it is
a high velocity impact, the scenario is different. The extreme high induced pressures can
exceed the strength of the material driving it into a regime that involves the propagation of
elastic-plastic waves. Under these conditions, the matter has a nonlinear response and
demands a deep study for an entire characterization of the propagation of waves.
The thermodynamic properties of the material allows to better understand how
does the material behaves when subjected to high pressures. Two of these properties can be
measured experimentally. When applying the conservation equations to both parameters, it
is possible to achieve a complete characterization. Referred as Hugoniot equations, these
relations are a locus of shocked states for a given material and can be used as valuable
thermodynamic information at high pressures.
Tungsten Carbide (WC) is a very interesting material because of its low density
and high strength when compared with the pure W. Sometimes referred to as a hard metal,
this ceramic is widely used in the production of cutting tools, molds and also in the petrol
industry has the constituent of drilling tools. The shock behaviour of WC has been studied
throughout the years by many researchers such as McQueen (1970), Amulele (2008), Vogler
(2005), and Grady (1995, 1999 and 2009) among others. However, some of this authors also
studied the shock compression in several ceramic powders, finding out their excellent
behaviour to shock because of their high distention, which results in very slow shock
velocities.
This project focuses on measuring the relation between the velocity of the shock
waves and the particle velocity in Nickel-doped Tungsten Carbide powders compacted by

Hugoniot characterization of WC-Ni powders
2 2015
isostatic pressure. In fact, these two data lead to the Hugoniot relations. The Hugoniot data,
in its turn, can be used for the design of dynamic compaction procedure since the uniformity
of the compaction is related to the velocity of the shock. In this case, shock waves are
regarded as a working tools.
From a wide range of available techniques, the plate impact experiments with
resource to a gas gun was used to achieve the proposed results. The velocities were measured
by Heterodyne Velocimetry (HetV) and for the configured setup the target was designed
regarding all the shock propagation background.
The work planned herein involved using the shock impact platforms at the
Institute of Shock Physics (ISP) at Imperial College of London to perform measurements of
the shock wave and particle velocities in WC samples. This project builds on a collaboration
between the ISP and two research units of the Mechanical Engineering Department of
Coimbra, CEMUC (Centro de Engenharia Mecânica da Universidade de Coimbra) and
ADAI (Associação para o Desenvolvimento da Aerodinâmica Industrial), where the WC
powders were synthesized by ball milling to nominal Nickel concentrations of 11%.
1.2. Outline
The structure of the present thesis is as follows.
A modern theory of the description of shock propagation in solids and powders
is presented in chapter 2. The Hugoniot relations are introduced and explained in regard to
the characterization of the state of materials during the propagation of a shock wave, in terms
of density, pressure, velocity of the particles and shock, among others. In fact, these relations
are shown as combination of conservation equations: mass momentum and energy. The same
theory is also true for powdered materials. Therefore, two different models that predict the
Hugoniot relations of the material under study are presented for posterior comparison with
experimental results. As a closing topic, it is included a compilation of relevant studies of
shock experiments to tungsten carbides.
Chapter 3 contains the characterization of the powders Nickel-doped Tungsten
carbide as well as the final state of the compacted samples. In order to compact the samples,
a powder dye compactor was designed and it is described herein described.
Chapter 4 focuses on the experimental methods used for validating the whole
experimental setup. A basic description of the gas gun is made, as means of providing an
Introduction
Rui Pedro Tavares de Sousa 3
understanding of its operation. Both the design of the target and the selection of the materials
are featured in this chapter and are justified in a theoretical background. In regard to the
adopted HetV measuring system, the basic principles of operation are explained along with
the preparation, installation and usage of the setup.
Chapter 5 contains the experimental results obtained from the measuring system
and the analysis of the results. The section starts with a succinct explanation of the software
used for the treatment of the data. The Hugoniot curves are figured in different planes and
made up of a relation between the data acquired and the conservative equations. Finally, the
Hugoniot curve is compared with the results achieved by other authors, as well as Thouvenin
and Mie-Grüneisen models for porous materials.
Chapter 6 summarises the key points of this thesis and addresses some
considerations for future works.

Hugoniot characterization of WC-Ni powders
4 2015

Theoretical background
Rui Pedro Tavares de Sousa 5
2. THEORETICAL BACKGROUND
2.1. Shock waves
An impact between two similar solids moving in opposite directions with equal
velocities presumes that the particles on the impacted surfaces suddenly come to a stop. This
intensive impulsive loading results on a stress pulse (compressive) which moves, from the
interface, in both directions along the material. Since there is no movement in the plane of
impact, a uniaxial strain is generated and moves herewith the stress pulse. The shock front
is the interface between the shocked and non-shocked one. The passage of the pulse along
the material causes a sudden jump in pressure from P0 to P. This change reflects on an
increase of density, particle velocity and specific internal energy. Depending on the material,
when subjected to a shock wave, it can has different responses like compaction, plastic
deformation or even phase transition.
When a shock wave is propagating into an unstressed and at rest material, and
meets a boundary, there are different possible scenarios depending on the type of interface.
In the case of a free surface, when there are no restrictions on the interface and σ=0, a release
wave is reflected back into the material. The velocity of the material adjacent to the surface,
was found to be twice as great as the velocity of the in-situ particles – free surface
approximation. On the other hand, if it is a fixed surface, it is considered that σ ≠ 0 and the
velocity of the particle is zero. In this situation, the wave is not only reflected but also
transmitted to the adjacent material (Winter, 2009).
2.1.1. The Hugoniot relations
A clearly understanding of the propagation of shock waves can be characterized
as an ideal planar shock where the propagation and the strain are treated as uniaxial – 1D.
The jump between the shocked and non-shocked state is assumed as a discontinuous and
adiabatic transition. Conservation of mass, momentum and energy across the discontinuity
drives into the Hugoniot relationships between the specific volume ν, the pressure P, the
material particular velocity up, the shock speed Us and the specific internal energy e. The
Hugoniot characterization of WC-Ni powders
6 2015
equations below refers to a situation where there is no initial velocity of the impacted
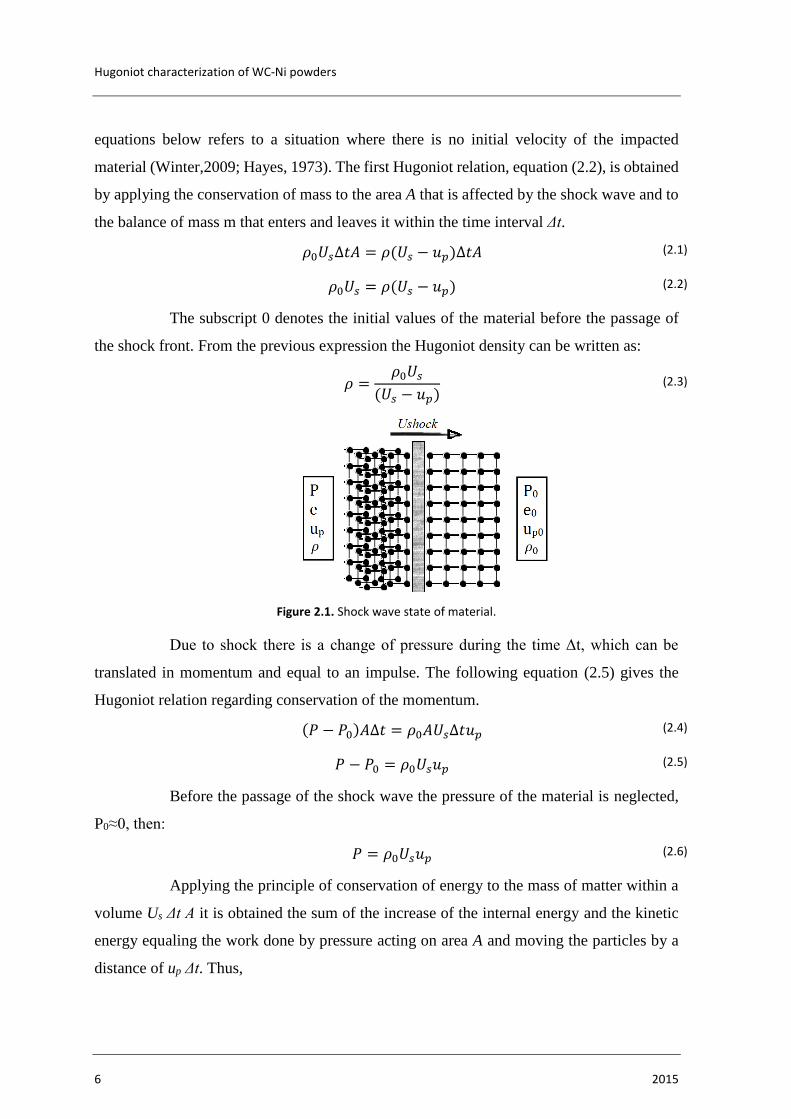
material (Winter,2009; Hayes, 1973). The first Hugoniot relation, equation (2.2), is obtained
by applying the conservation of mass to the area A that is affected by the shock wave and to
the balance of mass m that enters and leaves it within the time interval Δt.
𝜌0𝑈𝑠∆𝑡𝐴 = 𝜌(𝑈𝑠 − 𝑢𝑝)∆𝑡𝐴 (2.1)
𝜌0𝑈𝑠 = 𝜌(𝑈𝑠 − 𝑢𝑝) (2.2)
The subscript 0 denotes the initial values of the material before the passage of
the shock front. From the previous expression the Hugoniot density can be written as:
𝜌 =𝜌0𝑈𝑠
(𝑈𝑠 − 𝑢𝑝) (2.3)
Figure 2.1. Shock wave state of material.
Due to shock there is a change of pressure during the time Δt, which can be
translated in momentum and equal to an impulse. The following equation (2.5) gives the
Hugoniot relation regarding conservation of the momentum.
(𝑃 − 𝑃0)𝐴∆𝑡 = 𝜌0𝐴𝑈𝑠∆𝑡𝑢𝑝 (2.4)
𝑃 − 𝑃0 = 𝜌0𝑈𝑠𝑢𝑝 (2.5)
Before the passage of the shock wave the pressure of the material is neglected,
P0≈0, then:
𝑃 = 𝜌0𝑈𝑠𝑢𝑝 (2.6)
Applying the principle of conservation of energy to the mass of matter within a
volume Us Δt A it is obtained the sum of the increase of the internal energy and the kinetic
energy equaling the work done by pressure acting on area A and moving the particles by a
distance of up Δt. Thus,

Theoretical background
Rui Pedro Tavares de Sousa 7
(𝑃 − 𝑃0)𝐴𝑈𝑠∆𝑡 =1
2𝜌0𝐴𝑈𝑠∆𝑡 𝑢𝑝
2 + (𝑒 − 𝑒0)𝜌0𝐴𝑈𝑠∆𝑡 (2.7)
simplifying to:
(𝑃 − 𝑃0)𝑈𝑠 =1
2𝜌0𝐴𝑈𝑠∆𝑡 𝑢𝑝
2 + (𝑒 − 𝑒0)𝜌0𝑈𝑠 (2.8)
Manipulating Eqs. (2.2) and (2.5) the shock velocity Us is obtained as well as the
particle velocity up:
𝑈𝑠 = 𝜈0√(𝑃 − 𝑃0)
(𝜈0 − 𝜈) (2.9)
𝑢𝑝 = √(𝑃 − 𝑃0)(𝜈0 − 𝜈) (2.10)
The positive and negative value of the solution of the square root is valid,
respectively, for a compressive and for a tensile wave. The combination of Eqs. (2.9) and
(2.10) into equation (2.8) results in
𝑒 − 𝑒0 =1
2(𝑃 + 𝑃0)(𝜈0 − 𝜈) (2.11)
Equations (2.2), (2.5) and (2.11) are the Hugoniot relations justified on
conservation of mass, momentum and energy, respectively. The states produced by shock
compression always lie on a Hugoniot curve where the variables are continuous across
planes of interaction.
Interestingly, experimental results shows that the Hugoniot of some materials
can be represented by a straight line in the Us – Up plane (McQueen et al., 1970) and may
be written as:
𝑈𝑠 = 𝐶0 + 𝑠𝑢𝑝 (2.12)
C0 is approximately equal to the velocity of sound
𝐶0 = √𝐾
𝜌0 (2.13)
where, K is the bulk modulus. The slope s can be obtained for a first approximation
contemplating the Mie-Grüneisen parameter, (Pruemmer et al., 2006)
𝑠 =1
2(Г + 1) (2.14)
From the reference conditions of the material, Г is: (2.15)

Hugoniot characterization of WC-Ni powders
8 2015
Г = 𝜈 (𝜕𝑃
𝜕𝑒)
𝜈=
𝜈
𝑐𝜈(
𝜕𝑃
𝜕𝑇)
𝜈
= −𝜈
𝑐𝜈(
𝜕𝑃
𝜕𝜈)
𝑇(
𝜕𝜈
𝜕𝑇)
𝑃=
3𝛼𝜈
𝑐𝜈𝐾𝑇
where, α is the linear coefficient of thermal expansion and KT is the isothermal
compressibility.
The combination between the linear approximation of the Hugoniot (2.12) and
the relations of conservation of mass (2.2) and momentum (2.5) gives the following equation
that relates pressure with the specific volume.
𝑃 =𝑐0
2(𝜈0 − 𝜈)
[𝜈0 − 𝑆(𝜈0 − 𝜈)]2 (2.16)
A relation between energy and thermal pressure is also given by Mie-Grüneisen
equation:
𝑃 − 𝑃𝑐 =Г(𝜈𝑐)
𝜈𝑐(𝑒1 − 𝑒𝑐) (2.17)
2.1.1. Hugoniot of porous materials
The Hugoniot of Powders tends to equalise the curve of dense solids but its
values are always lower. In fact, the high porosity of powders leads to a dissipation of the
compressive wave on a large plastic deformation, particle rearrangement against friction and
particle break up, or even melting. This increase of internal energy is the explanation for the
lower values of the velocity of shock waves and consequently a decrease on the slope of the
function, as it seen in Figure 2.2, when comparing to solid Hugoniot.
Figure 2.2. The Hugoniot curve of solid and porous materials in the P – up plane.
Theoretical background
Rui Pedro Tavares de Sousa 9
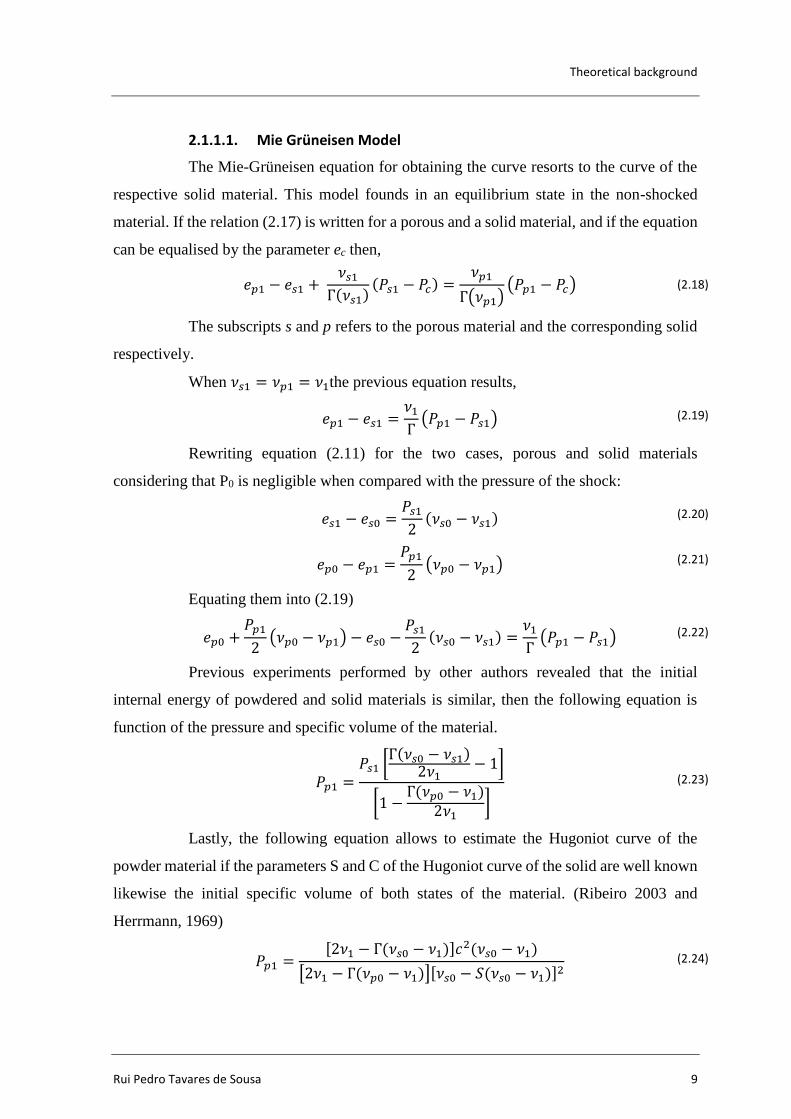
2.1.1.1. Mie Grüneisen Model
The Mie-Grüneisen equation for obtaining the curve resorts to the curve of the
respective solid material. This model founds in an equilibrium state in the non-shocked
material. If the relation (2.17) is written for a porous and a solid material, and if the equation
can be equalised by the parameter ec then,
𝑒𝑝1 − 𝑒𝑠1 + 𝜈𝑠1
Г(𝜈𝑠1)(𝑃𝑠1 − 𝑃𝑐) =
𝜈𝑝1
Г(𝜈𝑝1)(𝑃𝑝1 − 𝑃𝑐) (2.18)
The subscripts s and p refers to the porous material and the corresponding solid
respectively.
When 𝜈𝑠1 = 𝜈𝑝1 = 𝜈1the previous equation results,
𝑒𝑝1 − 𝑒𝑠1 =𝜈1
Г(𝑃𝑝1 − 𝑃𝑠1) (2.19)
Rewriting equation (2.11) for the two cases, porous and solid materials
considering that P0 is negligible when compared with the pressure of the shock:
𝑒𝑠1 − 𝑒𝑠0 =𝑃𝑠1
2(𝜈𝑠0 − 𝜈𝑠1) (2.20)
𝑒𝑝0 − 𝑒𝑝1 =𝑃𝑝1
2(𝜈𝑝0 − 𝜈𝑝1) (2.21)
Equating them into (2.19)
𝑒𝑝0 +𝑃𝑝1
2(𝜈𝑝0 − 𝜈𝑝1) − 𝑒𝑠0 −
𝑃𝑠1
2(𝜈𝑠0 − 𝜈𝑠1) =
𝜈1
Г(𝑃𝑝1 − 𝑃𝑠1) (2.22)
Previous experiments performed by other authors revealed that the initial
internal energy of powdered and solid materials is similar, then the following equation is
function of the pressure and specific volume of the material.
𝑃𝑝1 =𝑃𝑠1 [
Г(𝜈𝑠0 − 𝜈𝑠1)2𝜈1
− 1]
[1 −Г(𝜈𝑝0 − 𝜈1)
2𝜈1]
(2.23)
Lastly, the following equation allows to estimate the Hugoniot curve of the
powder material if the parameters S and C of the Hugoniot curve of the solid are well known
likewise the initial specific volume of both states of the material. (Ribeiro 2003 and
Herrmann, 1969)
𝑃𝑝1 =[2𝜈1 − Г(𝜈𝑠0 − 𝜈1)]𝑐2(𝜈𝑠0 − 𝜈1)
[2𝜈1 − Г(𝜈𝑝0 − 𝜈1)][𝜈𝑠0 − 𝑆(𝜈𝑠0 − 𝜈1)]2 (2.24)

Hugoniot characterization of WC-Ni powders
10 2015
The Grüneisen parameter Г is approximately constant whenever the specific
volume changes are small. However, if it is the case of studying the behaviour of the
materials when there is a high change of pressure and consequently significant change of
specific volume, the coefficient between Г and ν is considered constant.
Г(𝜈)
𝜈=
Г(𝜈0)
𝜈0= 𝑐𝑜𝑛𝑠𝑡. (2.25)
2.1.1.2. Thouvenin Model
In 1965, Jacques Thouvenin came up with a theory which he nominated as
Thouvenin Model or Plate Gap Model. (Thouvenin, 1965). Differently from other authors,
Thouvenin’s founded his model in the way how a wave propagates in a material instead of
the thermodynamic nature. The porous solid material is seen as an assembly of solid plane
plates with equal thickness a, separate by a distance of b, therefore the specific mass of the
set is equal to the specific mass of the porous solid in analysis. Schemed on Figure 2.3, the
propagation of the waves came from the successive impact of the different plates, that results
on the creation of the shock waves and its expansion. The model considers the propagation
of the wave as unidimensional.
Figure 2.3. Schematic representation of the model of Thouvenin (Thouvenin, 1965).
When a shock wave with a velocity of Us propagates into the first plate and meets
its backing interface, it acquires a velocity of 2 𝑢𝑝- free surface approximation. On that
instant, expansion waves are created with opposite direction to the movement, reducing the
pressure to zero. The impact of the first plate on the second one, results in a shock wave that

Theoretical background
Rui Pedro Tavares de Sousa 11
propagates with a velocity of Us in the plate in rest. On the other hand, on the impacting plate
the wave propagates with a velocity of 𝑈𝑠 − 2𝑢𝑝. The same process is repeated on the
remainder plates, and in the global, not only a single shock is generated but a periodic series
of shock in the plates and projection of matter for the space between the plates. (Ribeiro and
Campos, 2003)
The sequence of impacts propagates with a velocity usp and its meaning cannot
be misunderstood neither confound with the velocity of the shock. According with
Thouvenin, before relating these parameters with the conservation equations it is necessary
to make some modifications.
A parameter λ is introduced as inverse of the porosity α
𝜆 =1
𝛼=
𝑆𝑝𝑒𝑐𝑖𝑓𝑖𝑐 𝑚𝑎𝑠𝑠 𝑜𝑓 𝑡ℎ𝑒 𝑝𝑜𝑟𝑜𝑢𝑠 𝑠𝑜𝑙𝑖𝑑
𝑆𝑝𝑒𝑐𝑖𝑓𝑖𝑐 𝑚𝑎𝑠𝑠 𝑜𝑓 𝑡ℎ𝑒 𝑛𝑜𝑛 − 𝑝𝑜𝑟𝑜𝑢𝑠 𝑠𝑜𝑙𝑖𝑑=
𝑎
𝑎 + 𝑏 (2.26)
The parameters a and b of the previous equation are represented in Figure 2.3.
The relation between the time span of the propagation of the shock on the plates and the
movement of the free surface within the gap b is written as:
1
𝑈𝑠𝑝=
𝜆
𝑈𝑠𝑠+
1 − 𝜆
2. 𝑢𝑝𝑠 (2.27)
1
𝑢𝑝𝑝=
𝜆
𝑢𝑝𝑠+
1 − 𝜆
2. 𝑢𝑝𝑠 (2.28)
Equations (2.27) and (2.28) allow to calculate the velocity of shock and the
particle velocity. Although it was not completely in accordance with Thouvenin statements,
Hofmann et al. (1968) defended that the relation between P and ν could be deduced by
relating the conservation equations and usp and upp .
2.1.2. Tungsten Carbide shock data
Properties of the shock waves of tungsten carbides have been studied throughout
the past years. McQueen et al. (1970) studied the shock Hugoniot of near full-density
tungsten carbide with 5wt% Co. In 1995 and 1999 Grady reported shock data of two types
of WC materials. The first one, produced by Kennametal Company, contained 5.7wt% Co,
1.9wt% Ta along with less than 0.9wt% Nb and Ti while the second material, extracted from
armor piercing (AP) rounds, contained 3–4wt% Ni, 0.4-0.8wt% Fe and 0.05-0.2wt% Co.
Amulele et al. (2008) made tests to a material produced by Cercom, a ceramic with 97.2wt%
Hugoniot characterization of WC-Ni powders
12 2015
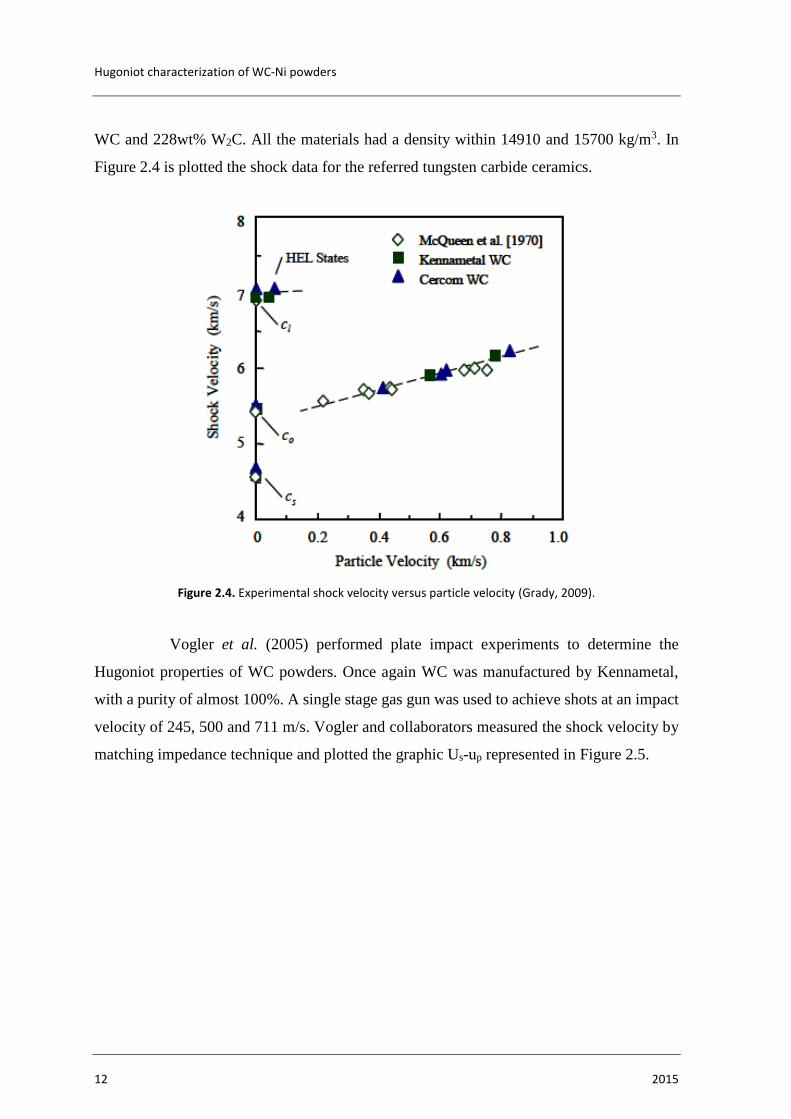
WC and 228wt% W2C. All the materials had a density within 14910 and 15700 kg/m3. In
Figure 2.4 is plotted the shock data for the referred tungsten carbide ceramics.
Figure 2.4. Experimental shock velocity versus particle velocity (Grady, 2009).
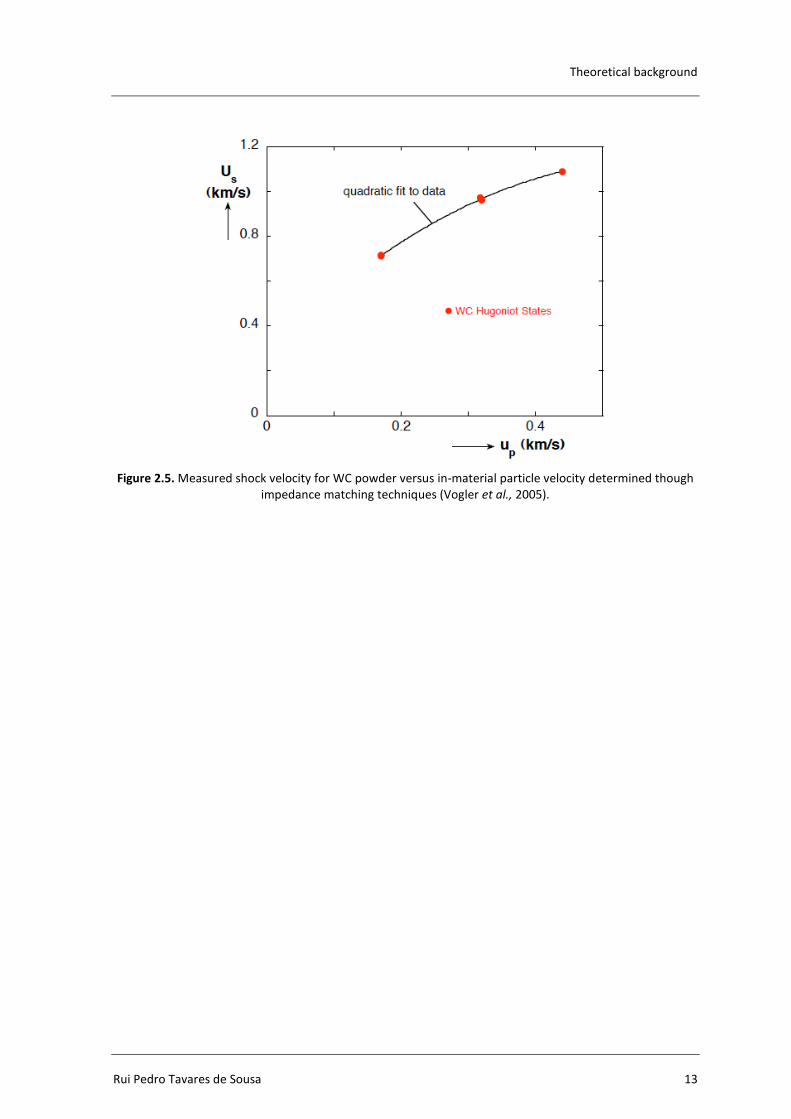
Vogler et al. (2005) performed plate impact experiments to determine the
Hugoniot properties of WC powders. Once again WC was manufactured by Kennametal,
with a purity of almost 100%. A single stage gas gun was used to achieve shots at an impact
velocity of 245, 500 and 711 m/s. Vogler and collaborators measured the shock velocity by
matching impedance technique and plotted the graphic Us-up represented in Figure 2.5.
Theoretical background
Rui Pedro Tavares de Sousa 13
Figure 2.5. Measured shock velocity for WC powder versus in-material particle velocity determined though impedance matching techniques (Vogler et al., 2005).

Hugoniot characterization of WC-Ni powders
14 2015

Materials and methods
Rui Pedro Tavares de Sousa 15
3. MATERIALS AND METHODS
3.1. Tungsten Carbide, WC
Tungsten carbide, a cemented carbide which is also designated as a hard metal,
is commonly used for applications that require high levels of hardness and wear resistance.
Thus, its excellent properties make of it a useful material in the production of cutting tools
and molds, among other applications. The first development of WC took place in Germany,
in the early 20’s, by Osram, an electrical lighting company that sought an alternative to
diamonds for machinating metals. Later, in 1925, a license was sold to Krupps and in 1926
this company launched to the market sintered carbide tungsten named as WIDIA, an
acronym for Wie Diamant - like diamond (at ThyssenKrupp’s website).
3.1.1. Tungsten carbide powders
The WC powders used in the present study were produced by DURIT -
Metalurgia do Tungsténio, Lda. and its general characteristics are summarised in the
following Table 3.1.
Table 3.1. Characteristics of GD20N powders (Pires, 2012).
Ni
[wt%]
Theoretical
density
[g/cm3]
Specific
volume
[cm3/g]
d50
[µm]
GD20N 11 14.7 0.068 1.2
Differently from what the literature states, WC was mixed with Nickel. This
element has been on the focus of some researchers insofar as an adding material in WC,
because the mechanical properties achieved in WC-Ni are very similar to the popular WC-
Co, conceding better resistance to corrosion and higher values of hardness. These adding
materials, also called as soft materials of the mixture, have been used in WC to facilitate the
compaction of the powder and its final form. Its excellent characteristics results from the
combination of properties granted by the presence of two different phases where WC phase

Hugoniot characterization of WC-Ni powders
16 2015
imparts the hardness and strength whilst Ni matrix acts to increase plasticity and toughness
(Shon et al., 2007).
3.1.2. Powder characterization
According to Pires (2012) the powders were characterized by SEM (Scanning
Electron Microscope) and XRD (X-Ray Diffraction). The observation of SEM results
indicates that WC particles have an irregular shape and size distribution between 0.3 and 3
µm without cleavage edges along the counter. The bigger size of WC distinguishes it from
the Ni in the GD20N powders. The structural characterization, made by XRD, demonstrated
two compounds on WC powder, whose principal phase is WC and tungsten semi-carbide the
secondary one, both with hexagonal structure. GD20N revealed the same constitution plus
Ni with a cubic structure.
Figure 3.1. Morphology of Powder: a) WC and b) GD20N (Pires, 2012).

Materials and methods
Rui Pedro Tavares de Sousa 17
Figure 3.2. X-Ray Difractogram of WC and GD20N powders (Pires, 2012).
3.2. Powder compaction
For the purpose of comparing the results achieved, it is presupposed that the
powder samples are geometrically similar and prepared within the same conditions.
Although the rings are 3mm height, the compressed powder must have 1mm height to better
control the shock wave interferences. To fulfil these initial conditions, primary calculations
on the amount of powder for each material were necessary and were based on the densities
calculated by DURIT. For the right amount of powder, 5% was added, accounting for
predictable losses, such as powder that typically gets stuck in the cavity of the dye and in the
interior surface of the ring. A force of 8 kN was applied to the punch of the dye.
3.2.1. Isostatic pressing dye
In order to compress the powders into a certain density, an isostatic compressing
dye was designed. This device was made in hardness steel and was manufactured with very
low tolerances to achieve a precise geometry, good finishing of surface and a uniform density
of the specimens.
Figure 3.3 presents all the separate pieces of the compactor. The body, divided
in two pieces, is connected by the two aligning pins and four screws. The inner surface of
the body has a principal cavity that allows a fit sliding of the punch, and a secondary hollow
that holds the ring along with the bottom base. It is common on this kind of procedures that

Hugoniot characterization of WC-Ni powders
18 2015
the sample gets damaged while it is collected from the device. However its opening geometry
was specially designed to avoid deterioration by infiltrated powder between cavity’s
interface and the ring. Also showed in the figure bellow, is the confining ring, made in steel
with 7.5mm of diameter and 3mm of height.
Figure 3.3. Isostatic compressing dye and ring.
3.2.2. Density measurement
The relative density of the compacted (green) samples was determined by the
relation of the density of the powders and its theoretical values. The densities were calculated
using the relation mass-volume (3.1) and values are provided in Table 3.2.
𝜌 =𝑚
ℎ𝜋𝑑2
4
(3.1)
Table 3.2. Density measurements of the samples.
Specimen
number
Mass
[g]
Thickness
[cm]
Density
[g/cm3]
Specific
volume
[cm3/g]
Theoretical
values of
density
[g/cm3]
Relative
density
[%]
#25 0.395 0.1149 7.777 0.129
14.7
52.9
#27 0.319 0.0865 8.349 0.120 56.8
#31 0.419 0.0963 9.839 0.102 66.5
Materials and methods
Rui Pedro Tavares de Sousa 19
All the rings of the sample were measured and weighted for a final ponderation
of the density. Sample #31 has a density of 66.5%, a higher value than the other specimens.
It is thought that the reason for this difference between values is due to the equipment used
for pressing the dye punch. For logistics reasons, it was applied a different equipment on
sample #31.

Hugoniot characterization of WC-Ni powders
20 2015
Experimental methodology
Rui Pedro Tavares de Sousa 21
4. EXPERIMENTAL METHODOLOGY
4.1. Gun description
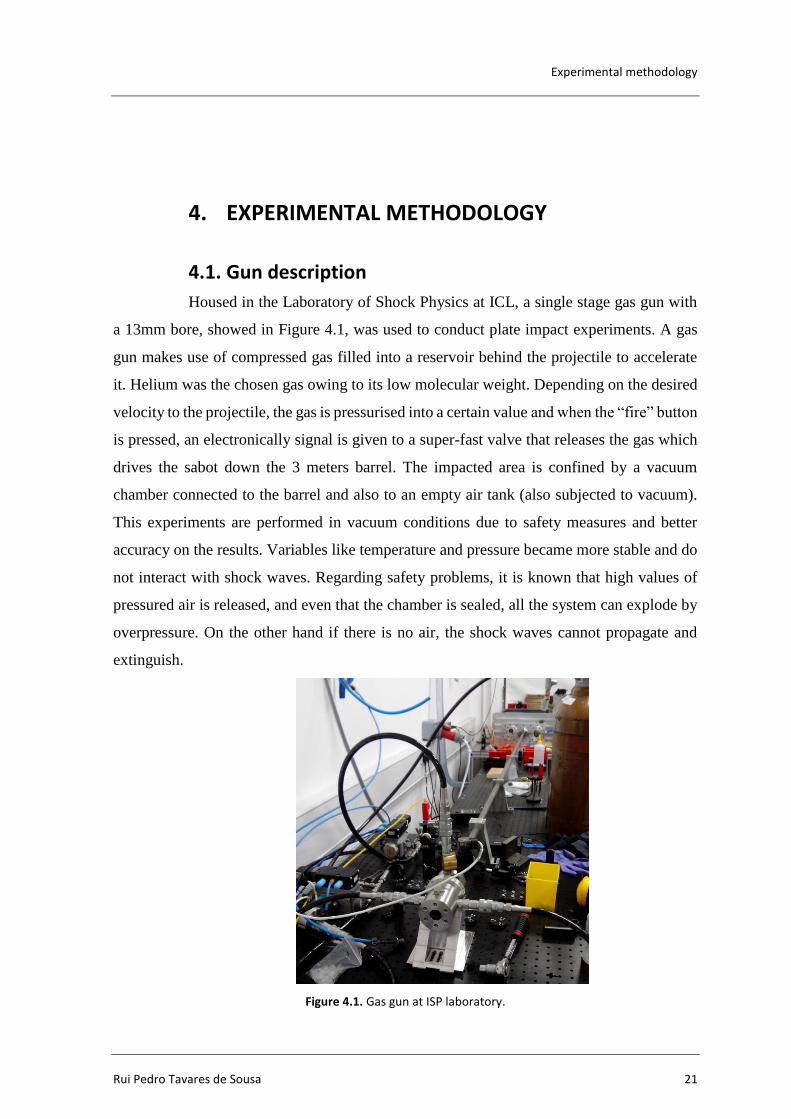
Housed in the Laboratory of Shock Physics at ICL, a single stage gas gun with
a 13mm bore, showed in Figure 4.1, was used to conduct plate impact experiments. A gas
gun makes use of compressed gas filled into a reservoir behind the projectile to accelerate
it. Helium was the chosen gas owing to its low molecular weight. Depending on the desired
velocity to the projectile, the gas is pressurised into a certain value and when the “fire” button
is pressed, an electronically signal is given to a super-fast valve that releases the gas which
drives the sabot down the 3 meters barrel. The impacted area is confined by a vacuum
chamber connected to the barrel and also to an empty air tank (also subjected to vacuum).
This experiments are performed in vacuum conditions due to safety measures and better
accuracy on the results. Variables like temperature and pressure became more stable and do
not interact with shock waves. Regarding safety problems, it is known that high values of
pressured air is released, and even that the chamber is sealed, all the system can explode by
overpressure. On the other hand if there is no air, the shock waves cannot propagate and
extinguish.
Figure 4.1. Gas gun at ISP laboratory.
Hugoniot characterization of WC-Ni powders
22 2015
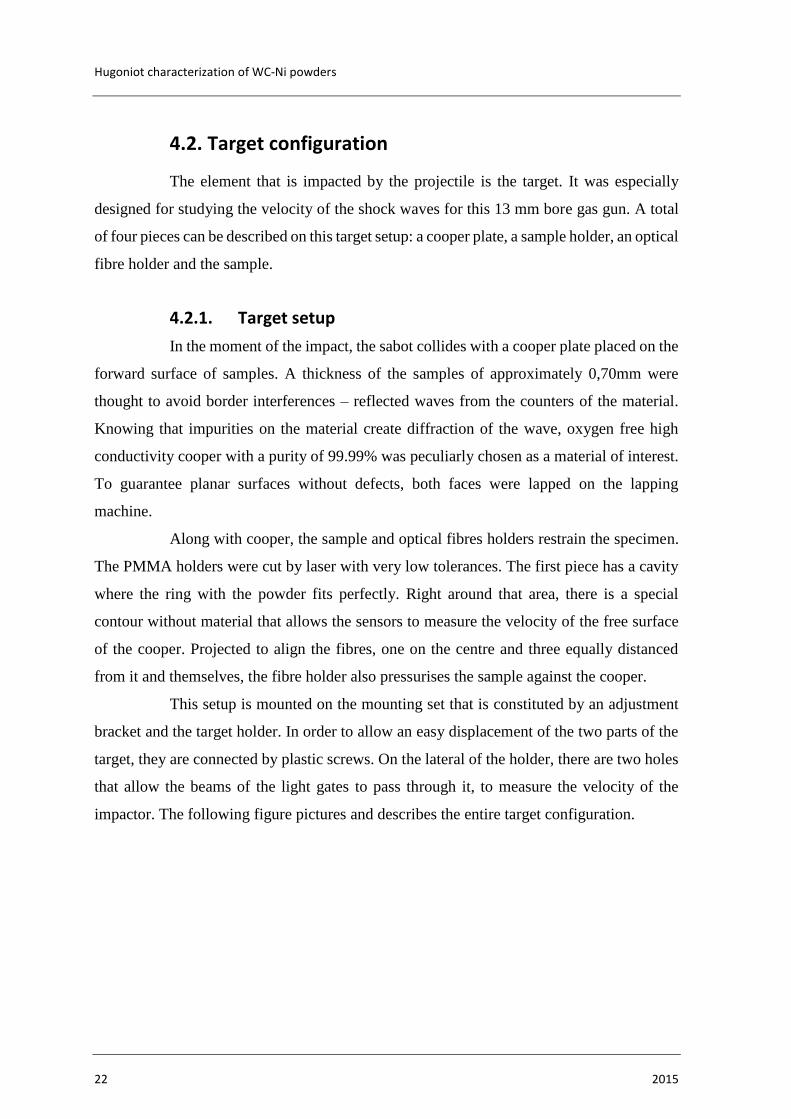
4.2. Target configuration
The element that is impacted by the projectile is the target. It was especially
designed for studying the velocity of the shock waves for this 13 mm bore gas gun. A total
of four pieces can be described on this target setup: a cooper plate, a sample holder, an optical
fibre holder and the sample.
4.2.1. Target setup
In the moment of the impact, the sabot collides with a cooper plate placed on the
forward surface of samples. A thickness of the samples of approximately 0,70mm were
thought to avoid border interferences – reflected waves from the counters of the material.
Knowing that impurities on the material create diffraction of the wave, oxygen free high
conductivity cooper with a purity of 99.99% was peculiarly chosen as a material of interest.
To guarantee planar surfaces without defects, both faces were lapped on the lapping
machine.
Along with cooper, the sample and optical fibres holders restrain the specimen.
The PMMA holders were cut by laser with very low tolerances. The first piece has a cavity
where the ring with the powder fits perfectly. Right around that area, there is a special
contour without material that allows the sensors to measure the velocity of the free surface
of the cooper. Projected to align the fibres, one on the centre and three equally distanced
from it and themselves, the fibre holder also pressurises the sample against the cooper.
This setup is mounted on the mounting set that is constituted by an adjustment
bracket and the target holder. In order to allow an easy displacement of the two parts of the
target, they are connected by plastic screws. On the lateral of the holder, there are two holes
that allow the beams of the light gates to pass through it, to measure the velocity of the
impactor. The following figure pictures and describes the entire target configuration.
Experimental methodology
Rui Pedro Tavares de Sousa 23
Figure 4.2. Target configuration and description.
4.2.1.1. Reflective back surface
As it will be referred in section 4.4, interferometry was the adopted measurement
technique and it requires that the moving object has a reflective back surface, so that there
is enough signal on the oscilloscope. After the first shot (experiment I) it was noticed that
the signal for lower velocities could not be enough for a clean data, therefore a 25µm sheet
of brass was applied on the back surface of sample #27 (experiment II) to guarantee a good
reflection of the laser. It is important to notice that depending on the material chosen for the
reflective window, a very small inaccuracy on time and velocity can be added to the
measurements.
4.2.1.2. Alignment of the target using two laser setups
Inside the vacuum chamber the target must be hold in the most precise position,
as a misalignment may implicate critical errors. To prevent these sort of inaccuracies, it is
essential to align the centre of the sabot with the centre of the target (impacted area) and the
parallelism between the shocking areas, in order to avoid interferences stemming from the
tilt. It is possible to fulfil these conditions by using two laser setups.
It is important to notice that the equipment used for the alignment should be very
precise and that any change on temperature can be reflected on a displacement of the
adjusting micrometric screws. Hence, the alignment must be made right before each
experiment so as to avoid errors. This alignment should mitigate any effects of the project
tilting, resulting in a normal impact.
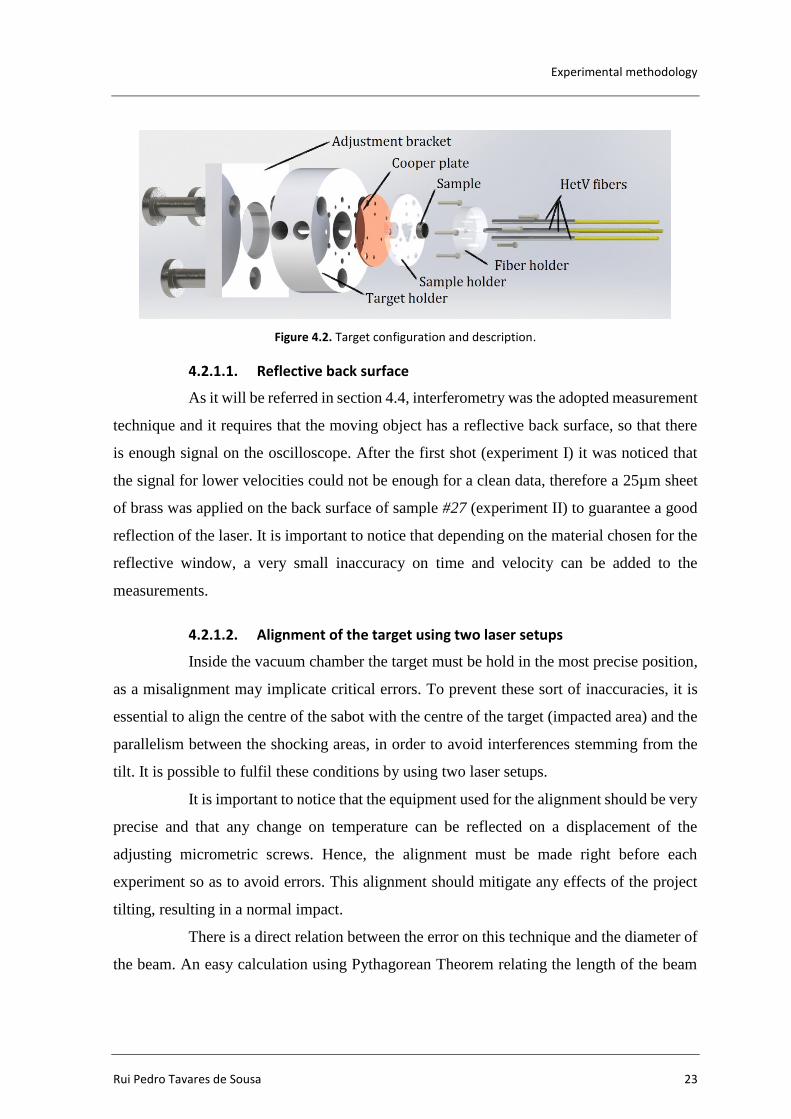
There is a direct relation between the error on this technique and the diameter of
the beam. An easy calculation using Pythagorean Theorem relating the length of the beam
Hugoniot characterization of WC-Ni powders
24 2015
and its diameter gives the imprecision in degrees. For a 3m barrel and 0.001m of the diameter
of beam, the maximum misalignment is approximately 0.33 x 10⁻³ degrees.
Figure 4.3. Alignment the centre of the shocking areas.
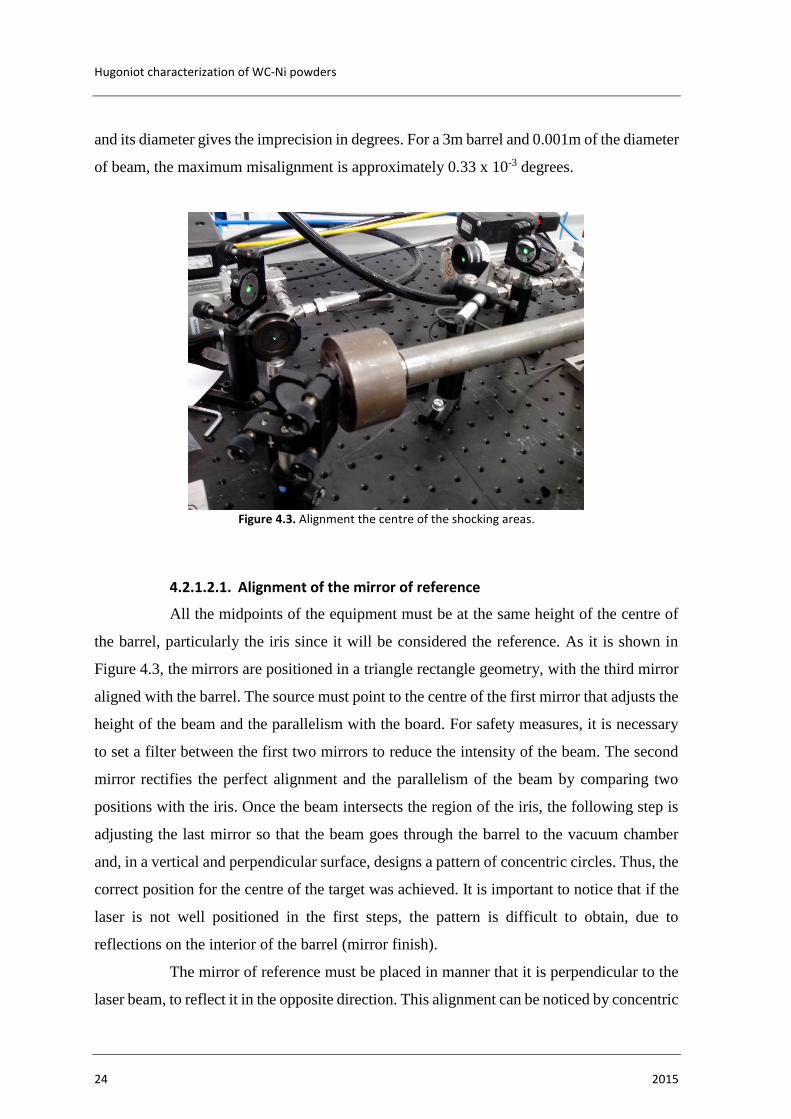
4.2.1.2.1. Alignment of the mirror of reference
All the midpoints of the equipment must be at the same height of the centre of
the barrel, particularly the iris since it will be considered the reference. As it is shown in
Figure 4.3, the mirrors are positioned in a triangle rectangle geometry, with the third mirror
aligned with the barrel. The source must point to the centre of the first mirror that adjusts the
height of the beam and the parallelism with the board. For safety measures, it is necessary
to set a filter between the first two mirrors to reduce the intensity of the beam. The second
mirror rectifies the perfect alignment and the parallelism of the beam by comparing two
positions with the iris. Once the beam intersects the region of the iris, the following step is
adjusting the last mirror so that the beam goes through the barrel to the vacuum chamber
and, in a vertical and perpendicular surface, designs a pattern of concentric circles. Thus, the
correct position for the centre of the target was achieved. It is important to notice that if the
laser is not well positioned in the first steps, the pattern is difficult to obtain, due to
reflections on the interior of the barrel (mirror finish).
The mirror of reference must be placed in manner that it is perpendicular to the
laser beam, to reflect it in the opposite direction. This alignment can be noticed by concentric
Experimental methodology
Rui Pedro Tavares de Sousa 25
circles around the surface of the iris. This pattern is the result of the diffraction of light after
the first passage on the iris.
Figure 4.4. Laser setup for alignment of the mirror of reference.
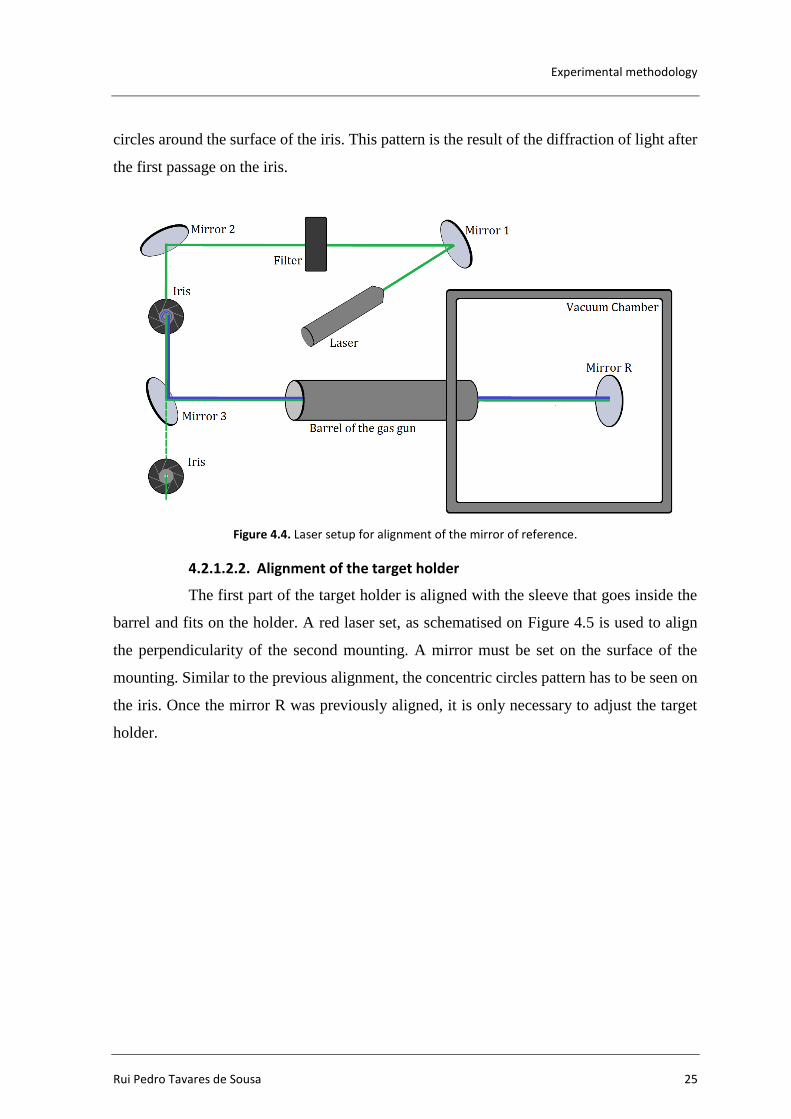
4.2.1.2.2. Alignment of the target holder
The first part of the target holder is aligned with the sleeve that goes inside the
barrel and fits on the holder. A red laser set, as schematised on Figure 4.5 is used to align
the perpendicularity of the second mounting. A mirror must be set on the surface of the
mounting. Similar to the previous alignment, the concentric circles pattern has to be seen on
the iris. Once the mirror R was previously aligned, it is only necessary to adjust the target
holder.

Hugoniot characterization of WC-Ni powders
26 2015
Figure 4.5. Laser setup for alignment of the target holder.
4.3. Sabot configuration
The projectile, also named impactor, flyer or sabot, is made of a very light weight
PMMA (Poly Methyl Methacrylate) and oxygen free high conductivity cooper. This type of
cooper, also used on the impacting surface of the target, while impacting, creates a steady
shock wave on the material. The sabot also wears two sealing rings that along with its design,
seals the launch tube maximising the efficiency of the acceleration by the gas.
According to the velocity of the impact, two different sabots were used. The first
one, for lower velocities, has a dense solid body with a 2mm copper. For velocities greater
than 550m/s was used a lighter sabot with a hollowed PMMA body and a 1mm cooper disk.
Figure 4.6 shows the high velocity sabot, although both of them have a similar geometry.
Figure 4.6. High velocity sabot.

Experimental methodology
Rui Pedro Tavares de Sousa 27
4.3.1. Velocity of the sabot
A set of two light gates and an oscilloscope was used for measuring the velocity
of the sabot. Referred in 4.2.1, the target holder had two holes on the lateral surface which
allowed the passage of two laser beams distanced by 11.211mm. When the laser beams
would be interrupted, start and stop signal, on the oscilloscope was generated a temporal
data. Distance and span of time led to the velocity of the sabot. Figure 4.8 a) and Figure 4.9
picture the basic setup.
4.4. Heterodyne velocimetry
The most common techniques for measuring velocities up to several kilometres-
per-second are VISAR system, Fabry-Perot-based system and Heterodyne Velocimetry
(HetV), all based in interferometry. This last technique provides a point of an interface
velocity with high temporal resolution resorting to many products developed for the
communication industry, such as fibre laser and single mode fibres.
4.4.1. Basic principles of operation
A HetV setup is schematically represented in Figure 4.7, where the different
components and the path of the light are distinguished. A light with a frequency f0 is
launched from a laser through the optical fibre, which in its end can have a lens responsible
for emitting the light and collecting part of it that is reflected or scattered by the moving
surface. Because it has to reflect an amount of light sufficient to guarantee reliable data, the
surface of study of the specimen must retain a reflecting finish. The collected Doppler-
shifted light, fd (reflected light), is transported by fibre to the detector and is mixed to a
portion of the emitted light with frequency f0, which is sent directly from the laser (Strand et
al., 2004).
Figure 4.7. Schematic representation of HetV (Strand et al., 2004).
Hugoniot characterization of WC-Ni powders
28 2015
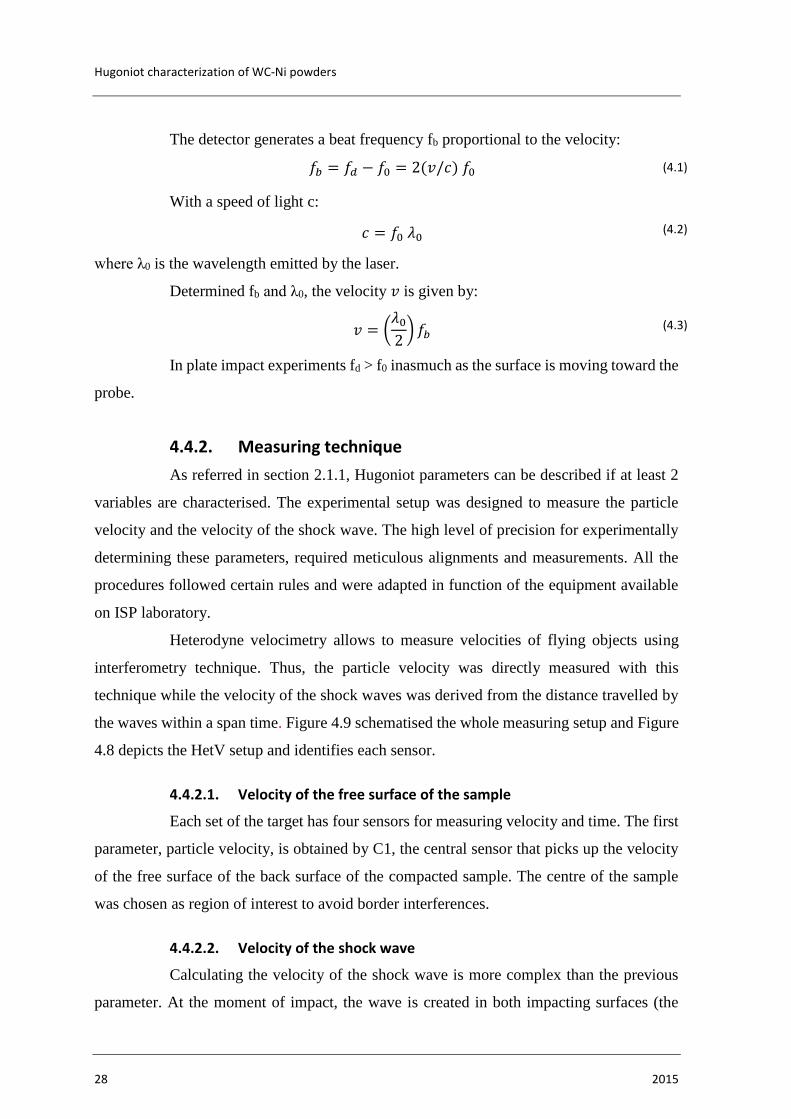
The detector generates a beat frequency fb proportional to the velocity:
𝑓𝑏 = 𝑓𝑑 − 𝑓0 = 2(𝑣/𝑐) 𝑓0 (4.1)
With a speed of light c:
𝑐 = 𝑓0 𝜆0 (4.2)
where λ0 is the wavelength emitted by the laser.
Determined fb and λ0, the velocity 𝑣 is given by:
𝑣 = (𝜆0
2) 𝑓𝑏 (4.3)
In plate impact experiments fd > f0 inasmuch as the surface is moving toward the
probe.
4.4.2. Measuring technique
As referred in section 2.1.1, Hugoniot parameters can be described if at least 2
variables are characterised. The experimental setup was designed to measure the particle
velocity and the velocity of the shock wave. The high level of precision for experimentally
determining these parameters, required meticulous alignments and measurements. All the
procedures followed certain rules and were adapted in function of the equipment available
on ISP laboratory.
Heterodyne velocimetry allows to measure velocities of flying objects using
interferometry technique. Thus, the particle velocity was directly measured with this
technique while the velocity of the shock waves was derived from the distance travelled by
the waves within a span time. Figure 4.9 schematised the whole measuring setup and Figure
4.8 depicts the HetV setup and identifies each sensor.
4.4.2.1. Velocity of the free surface of the sample
Each set of the target has four sensors for measuring velocity and time. The first
parameter, particle velocity, is obtained by C1, the central sensor that picks up the velocity
of the free surface of the back surface of the compacted sample. The centre of the sample
was chosen as region of interest to avoid border interferences.
4.4.2.2. Velocity of the shock wave
Calculating the velocity of the shock wave is more complex than the previous
parameter. At the moment of impact, the wave is created in both impacting surfaces (the

Experimental methodology
Rui Pedro Tavares de Sousa 29
target cooper and cooper flyer interfaces). Regarding the target side, the shock propagates
along the cooper until the interface with the powder. As soon as the shock front arrives the
back interface of the cooper, it arrives to the powder, therefore, that instant of time is
acquired by C2, C3 and C4. Ideally the instants of time would be exactly the same but due
to uncontrollable errors, the sabot impacts with a small tilt that generates different arriving
instants of time. The mean time of the measured values gives the instant of time when the
shock wave was transmitted to the powder while C1 reads the value of the arrival of the
shock to the back surface of the powder. The difference between this two values is the span
time that the wave travelled along the compacted powder. Using the basic equation (4.4) ,
the velocity of the shock wave can be calculated.
𝑈𝑠ℎ𝑜𝑐𝑘 =𝑥𝑠𝑎𝑚𝑝𝑙𝑒
∆𝑡 (4.4)
Figure 4.8. a)HetV sensors setup and light gates; b) HetV sensors setup identification.
4.4.3. Setup
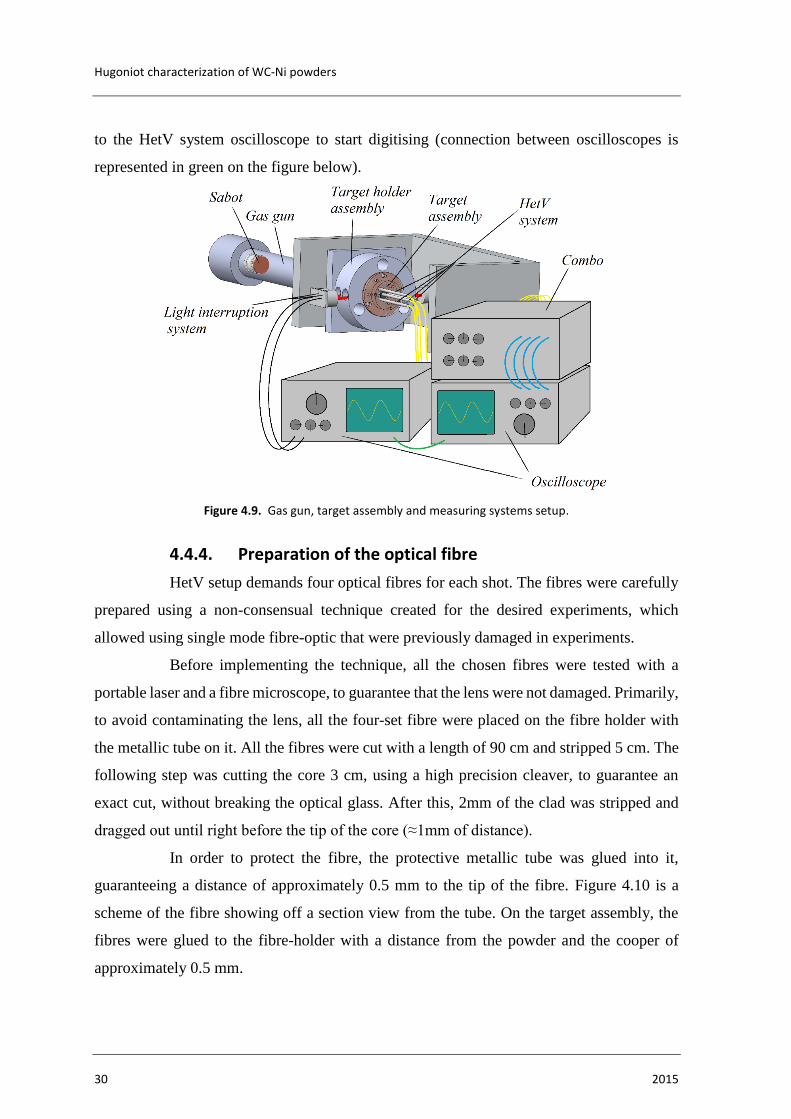
The setup used on this experiment is schemed in Figure 4.9. The light is
transported to the experiment via single mode fibres-optic (1550nm), which are connected
to the channels on the combo box, an assembly of a fibre laser, a detector and an amplifier.
An oscilloscope Lecroy WaveMaster 816 ZI-A, with a bandwidth of 16GHz, 4 input
channels and 40GS/s max sample rate converted the signal into a beat frequency. The
channels of this device are connected to the specific channels of the combo box (represented
in blue on the figure below). At the appropriate time, a trigger signal is to be sent to the
oscilloscope from the system that measures the velocity of the sabot. When the projectile
interrupts the second trigger of the system that measures its velocity, a trigger signal is sent
Hugoniot characterization of WC-Ni powders
30 2015
to the HetV system oscilloscope to start digitising (connection between oscilloscopes is
represented in green on the figure below).
Figure 4.9. Gas gun, target assembly and measuring systems setup.
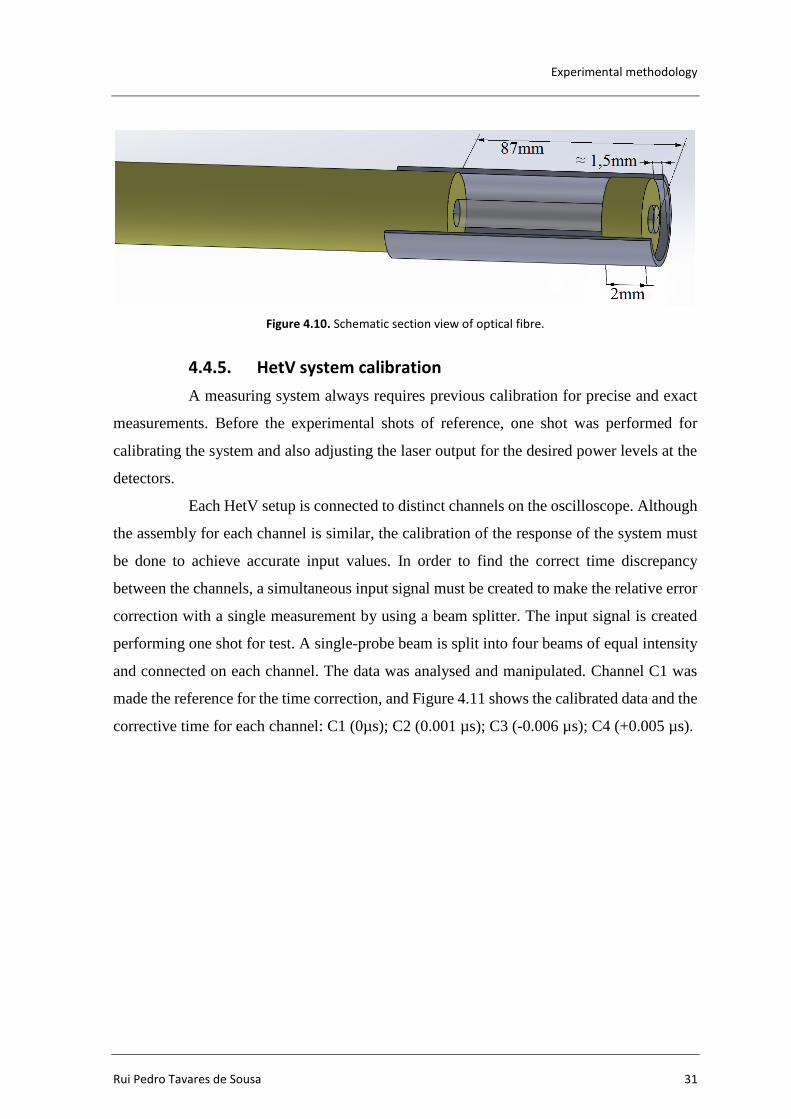
4.4.4. Preparation of the optical fibre
HetV setup demands four optical fibres for each shot. The fibres were carefully
prepared using a non-consensual technique created for the desired experiments, which
allowed using single mode fibre-optic that were previously damaged in experiments.
Before implementing the technique, all the chosen fibres were tested with a
portable laser and a fibre microscope, to guarantee that the lens were not damaged. Primarily,
to avoid contaminating the lens, all the four-set fibre were placed on the fibre holder with
the metallic tube on it. All the fibres were cut with a length of 90 cm and stripped 5 cm. The
following step was cutting the core 3 cm, using a high precision cleaver, to guarantee an
exact cut, without breaking the optical glass. After this, 2mm of the clad was stripped and
dragged out until right before the tip of the core (≈1mm of distance).
In order to protect the fibre, the protective metallic tube was glued into it,
guaranteeing a distance of approximately 0.5 mm to the tip of the fibre. Figure 4.10 is a
scheme of the fibre showing off a section view from the tube. On the target assembly, the
fibres were glued to the fibre-holder with a distance from the powder and the cooper of
approximately 0.5 mm.
Experimental methodology
Rui Pedro Tavares de Sousa 31
Figure 4.10. Schematic section view of optical fibre.
4.4.5. HetV system calibration
A measuring system always requires previous calibration for precise and exact
measurements. Before the experimental shots of reference, one shot was performed for
calibrating the system and also adjusting the laser output for the desired power levels at the
detectors.
Each HetV setup is connected to distinct channels on the oscilloscope. Although
the assembly for each channel is similar, the calibration of the response of the system must
be done to achieve accurate input values. In order to find the correct time discrepancy
between the channels, a simultaneous input signal must be created to make the relative error
correction with a single measurement by using a beam splitter. The input signal is created
performing one shot for test. A single-probe beam is split into four beams of equal intensity
and connected on each channel. The data was analysed and manipulated. Channel C1 was
made the reference for the time correction, and Figure 4.11 shows the calibrated data and the
corrective time for each channel: C1 (0µs); C2 (0.001 µs); C3 (-0.006 µs); C4 (+0.005 µs).

Hugoniot characterization of WC-Ni powders
32 2015
Figure 4.11. HetV curves of calibration shifted in time to overlay.

Results and discussion
Rui Pedro Tavares de Sousa 33
5. RESULTS AND DISCUSSION
The principal objective of this work is to determine the Hugoniot relation of the
GD20N powders prepared for these experiments. For this effect, the previously described
gas gun setup was used.
A total of five plate impact experiments were performed, but only three were
conducted to Hugoniot data. The remaining two shots were performed with the purpose of
calibrating the HetV and checking the alignment. Summarised in Table 5.1, is the
characterisation of the conditions previous to the impact on the target
Table 5.1. Characterization of the experimental shots.
Shot
Sample/
mass [g]/
thickness
[mm]/
Brass [mm]
Sabot/
msabot
[g]
Cooper
plate
thickness/
tol/tol
[mm]
Light
gates
time
[µs]
Light
gates
distance
[mm]
Velocity
of the
impactor
[m/s]
I
#25/
0.395/
1.149/
-
2mm Cu/
6.08
0.690/
+0/
+0
22.5
11.211
498.2
≈500
II
#27/
0.319/
0.963/
0.025
2mm Cu/
6.05
0.694/
+0/
+0
35 320.3
≈320
III
#31/
0.419/
0.963/
-
1mm Cu/
2.48
0.691/
+0/
+0
17 659.5
≈660
On shot II it was used a sample with a 25 µm brass reflective back surface which,
on the analysis, the window will be neglected because its thickness is very low and due to
its high impedance, the material gains the velocity of the free surface of the powder. As

Hugoniot characterization of WC-Ni powders
34 2015
referred in 4.3, for high velocities, the sabot considered must be different. Hence on
experience III the 1mm Cu sabot was used.
With a distance of 11.211 mm between the light gates, the velocity of the sabot
was calculated regarding the time counted on the oscilloscope. Three points between C2, C3
and C4 were measured to check an equal thickness on that area (represented as a cross in
Figure 5.1)
Figure 5.1. Cooper target and reference points of measurement of the thickness (represented as a cross).
5.1. Data analysis
The data collected from the HetV measurements was analysed with resource to
the software HetV Analysis Tool version 2.08. On this type of measurements the variables
of interest are frequency and time. This data is obtained by using a sliding Fourier transform
(FT) on a time-varying sinusoid.
The software runs a code that performs several preparatory operations on the
beat wave form prior to perform the actual FT. First, the user must input the start and finish
time for analysis and define a window – desired number of points which the FT should be
performed (Strand et al., 2004). The window function called Hamming is chosen to reduce
the undesirable effects related to the spectral leakage. Therefore, it reduces the side lobe
leakage causing the main lobe to broaden or in another words, reducing the resolution
(Kumar et al., 2011). Given these inputs to the software, the sliding Fourier transformer is
calculated and displays an image of frequency in function of time.
For the present case, it is important to analyse the instant of time when the wave
arrives the surface of interest and its velocity. As it is seen in Figure 5.2, the mark on the
curve represents the considered instant of time, the passage from an elastic precursor to the
plastic wave: sinusoidal wave. On the graphic velocity vs. time, once there is a lot of noise

Results and discussion
Rui Pedro Tavares de Sousa 35
on the region of interest, it is necessary to make an interpolation within a drawing polygon
– ROI. Constraining this area for analysis, allows to discard unwanted noise in the frequency
spectrum and in the final velocity history. Attention must be taken while choosing very short
windows in the hope of obtaining very high time response. However, if the length of the
window is small enough to approach the size of a single beat, the code will return noisier
data with increased errors of velocities.
Figure 5.2. Elastic and Plastic wave on Amplitude vs. Time graphic (Strand et al., 2004).
5.2. HetV results
Three experiments were performed on GD20N powder at nominal velocities of
320, 500 and 660 m/s. The results which consist of interface particle velocity measurements
and calculated shock velocities are displayed in this section. All the following figures,
graphics time-signal and time- velocity are shifted on time as it was explained in chapter
4.4.5. In general, the data of the velocity of the free surface of the powder was analysed
according to the following window parameters: Hamming - 512; Overlap - 409 and FFT -
4096. Different colour filters were applied to the graphics for better resolution.
Hugoniot characterization of WC-Ni powders
36 2015
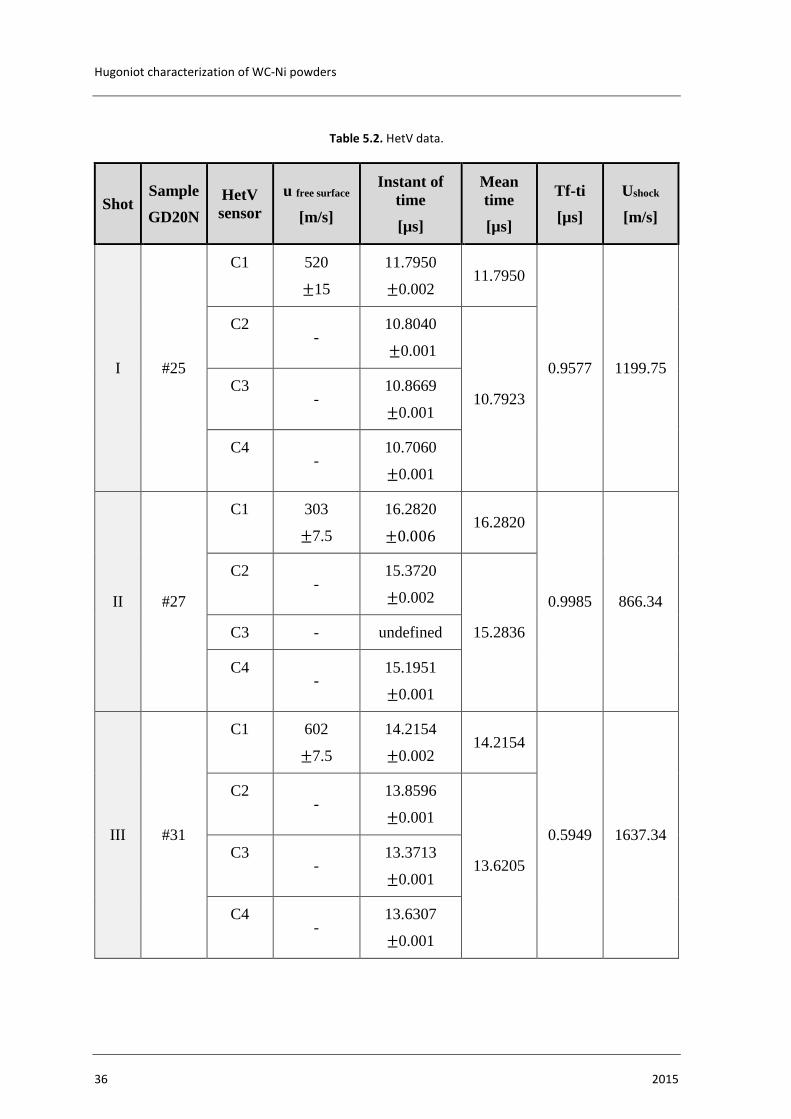
Table 5.2. HetV data.
Shot Sample
GD20N
HetV
sensor
u free surface
[m/s]
Instant of
time
[µs]
Mean
time
[µs]
Tf-ti
[µs]
Ushock
[m/s]
I #25
C1 520
±15
11.7950
±0.002 11.7950
0.9577 1199.75
C2 -
10.8040
±0.001
10.7923 C3
- 10.8669
±0.001
C4 -
10.7060
±0.001
II #27
C1 303
±7.5
16.2820
±0.006 16.2820
0.9985 866.34
C2 -
15.3720
±0.002
15.2836 C3 - undefined
C4 -
15.1951
±0.001
III #31
C1 602
±7.5
14.2154
±0.002 14.2154
0.5949 1637.34
C2 -
13.8596
±0.001
13.6205 C3
- 13.3713
±0.001
C4 -
13.6307
±0.001

Results and discussion
Rui Pedro Tavares de Sousa 37
5.2.1. Experiment I, impact at 500 m/s
One experiment was conducted at 498.2 m/s, approximately 500 m/s. The plot
signals of all the sensors can be seen in Figure 5.3. The first graphic of the figure shows the
intensity of the signal on C1. It was registered some interference on the data, so 4ns were
given for tolerance. On the remaining figures, the arrival of the plastic wave is obvious,
though there is an inaccuracy of 2ns. The time of the propagation of the wave in the powder
was about 0.9577 µs, which, considering 1.149mm of thickness, accounts for a velocity of
1199.75 m/s.
The velocity of the free surface of the powder is taken from Figure 5.4. This
analysis took a considerable amount of time, as there was significant interference, which
added to the fact that data was not so intuitive. The window parameter overlap was then
changed to 150, which resulted in lower resolution, but clearer data. On the plot signal
graphic, it was perceived the moment when the wave arrived at the sensor and, taking that
value as a reference, it was observed on the spectrogram which data might be used. After
selecting such information, the values were interpolated on the region of interest to better
figure out the velocity. It was estimated that the value would be of approximately 520 m/s,
with a maximum error of 30 m/s.
Figure 5.3. I Plot Signal: a) C1; b) C2; c) C3; d) C4.

Hugoniot characterization of WC-Ni powders
38 2015
Figure 5.4. I C1 Spectrogram (velocity) interpolated within an area of interest.
5.2.2. Experiment II, impact at 320 m/s
One experiment was conducted at 320.3 m/s, approximately 320 m/s. The plot
signals of all the sensors can be seen in Figure 5.5. The first graphic of the figure shows the
intensity of the signal on C1. 12ns were given for tolerance, as the data registered some
noise. The data of C2 and C4 is evident, however in C3 this is not as perceptive despite of
the very meticulous analysis conducted and therefore it is believed that this sensor has failed.
The sinusoidal pattern was not found on the span time of interest. For this reason, the average
between C2 and C4 is taken as the correct value for the initial instant of time with a 2ns of
error. The time of the propagation of the wave in the powder was about 0.9985µs, which,
considering 1.018mm of thickness, accounts for a velocity of 866.34 m/s.
The velocity of the free surface of the powder is taken from Figure 5.6. On the
spectrogram, an interpolation was made in the region of interest, which resulted in a well-
defined function. The value of the velocity was taken based on the point where the slope of
the curve is not accentuated and starts becoming uniform. It is estimated that the value is of
approximately 303 m/s, with a tolerance of 15 m/s.

Results and discussion
Rui Pedro Tavares de Sousa 39
Figure 5.5. II Plot Signal: a) C1; b) C2; c) C3; d) C4.
Figure 5.6. II C1 Spectrogram (velocity) interpolated within an area of interest.
5.2.3. Experiment III, impact at 660 m/s
One experiment was conducted at 659.2 m/s, approximately 660 m/s. The plot
signals of all the sensors are displayed in Figure 5.7. All the data on this experiment is
particularly good and it was also easier to define the values. The velocity of the wave was of
approximately 1637.34 m/s, for a thickness of 0.97 and a span time of 0.59.
Hugoniot characterization of WC-Ni powders
40 2015
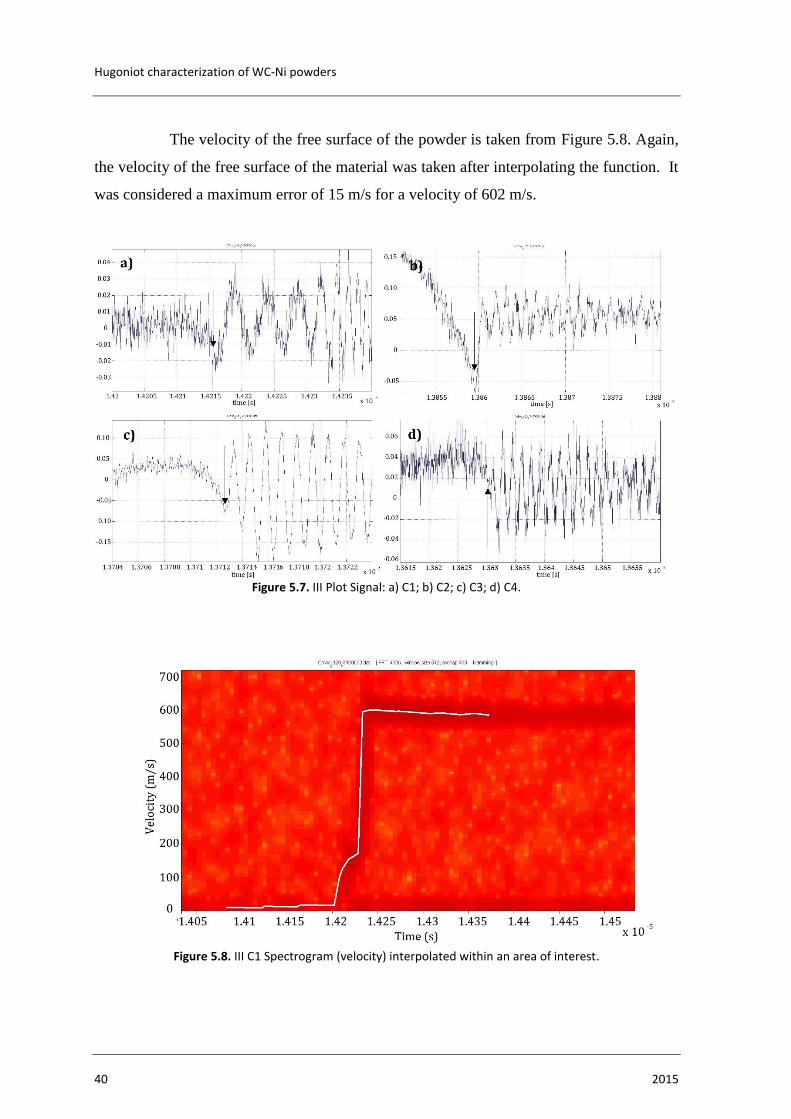
The velocity of the free surface of the powder is taken from Figure 5.8. Again,
the velocity of the free surface of the material was taken after interpolating the function. It
was considered a maximum error of 15 m/s for a velocity of 602 m/s.
Figure 5.7. III Plot Signal: a) C1; b) C2; c) C3; d) C4.
Figure 5.8. III C1 Spectrogram (velocity) interpolated within an area of interest.
Results and discussion
Rui Pedro Tavares de Sousa 41
5.3. Errors and the influence of tilt
The very small thickness of the samples used on this experiments, of
approximately 1mm, made it possible to admit that the propagation of the shock wave would
be perfectly planar. In fact, if the values of the sensor C2, C3 and C4 were analysed, an error
can be found and previous theory cannot be fully verified. Despite of the high velocity and
the small distance to the target, after leaving the barrel of the gun, the projectile tilts before
the impact. This phenomena is not manipulated and it was tried to minimise its likelihood
by proceeding with the alignment of the target. If the sabot impacts with tilt, the distance
propagated through the waves is no longer correspondent to the thickness but a higher value.
Despite this distance, it is admitted that thickness is the distance propagated by the shock
and the arrival time of the shock wave is the average value of the three instants.
5.3.1. Propagation of errors
Once the experimental values are obtained, they are combined according to a
formula, to reach the quantity desired. Even if the values register small inaccuracies, errors
tend to propagate. Thus, the propagation of errors in the Hugoniot relations will be quantified
in order to identify the influence they exert on the results. This “sum” of errors is calculated
depending on the mathematical procedure, as it is shown in the following equations:
a) 𝑧 = 𝑥 ± 𝑦
∆𝑧 = [(∆𝑥)2 + (∆𝑦)2]1/2
(5.1)
b) 𝑧 = 𝑐𝑥𝑦 or 𝑧 = 𝑐𝑥
𝑦
∆𝑧
𝑧= [(
∆𝑥
𝑥)
2
+ (∆𝑦
𝑦)
2
]
1/2
(5.2)
z is the resulting parameter and x and y the equating parameters, while Δz, Δx
and Δy are the respective inaccuracies.
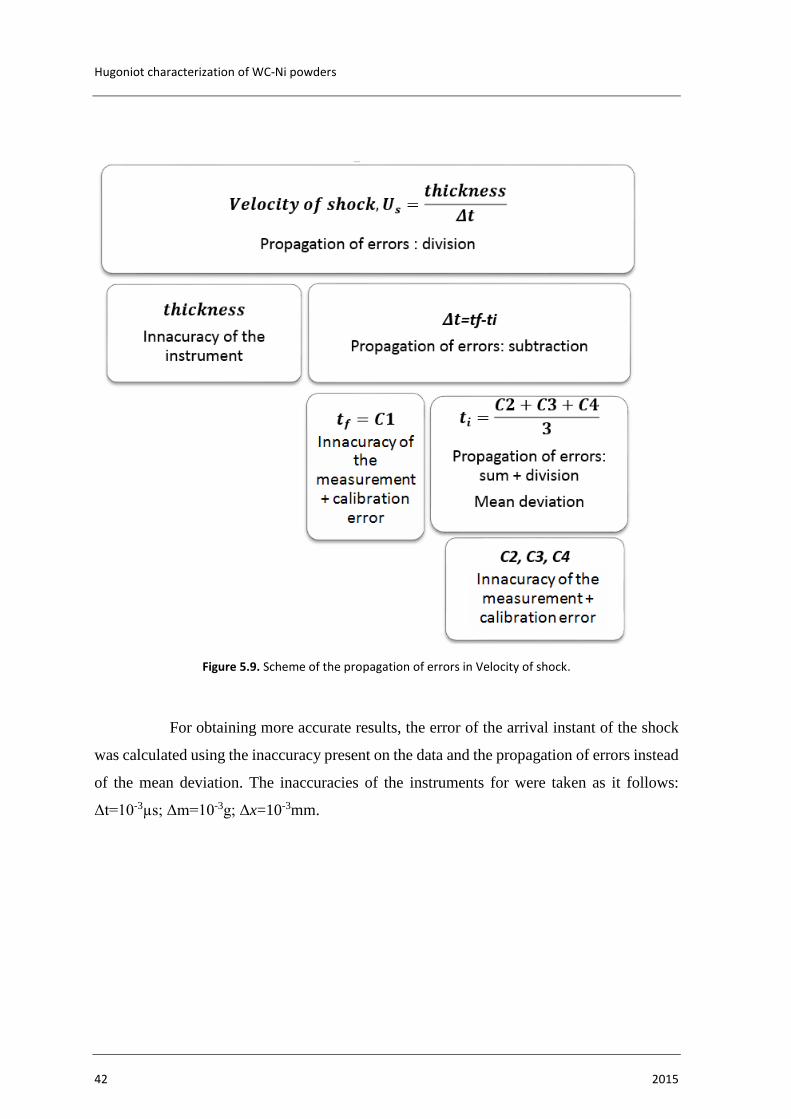
Figure 5.9 best describes the propagation of errors in the calculated parameters.
The velocity of shock was chosen as an example, but the same logic may be used for all the
variables according with their origin. The values of the velocity are taken from HetV data of
the measuring experiments and dimensions of the samples.
Hugoniot characterization of WC-Ni powders
42 2015
Figure 5.9. Scheme of the propagation of errors in Velocity of shock.
For obtaining more accurate results, the error of the arrival instant of the shock
was calculated using the inaccuracy present on the data and the propagation of errors instead
of the mean deviation. The inaccuracies of the instruments for were taken as it follows:
Δt=10-3µs; Δm=10-3g; Δx=10-3mm.

Results and discussion
Rui Pedro Tavares de Sousa 43
Table 5.3. Propagation of errors in the Hugoniot parameters.
Inaccuracy Mean
deviation
Shots Us
[m/s]
up
[m/s]
ρ
[g/cm3]
P
[GPa]
ν
[cm3/g]
ti of Shock
[µs]
I 5.512
(0.73%)
30
(5.77%)
0.00945
(0.94%)
0.280
(11.54%)
0.03246
(32.23%) 0.199
II 5.465
(0.63%)
15
(4.95%)
0.01227
(1.23%)
0.108
(9.91%)
0.02233
(22.59%) 0.088
III 11.877
(0.46%)
15
(2.5%)
0.01098
(1.10%)
0.239
(4.99%)
0.01452
(17.54%) 0.199
Regarding equations (2.3) and (2.6), in Table 5.3 it is visible a significant
influence of the error in the pressure and specific volume. Due to the great precision of the
HetV technique, the initial and final instants of the propagation of the wave in the material
were clearly found, resulting in errors inferior to 1%. On the other hand, the velocity of the
particle was measured with a minor error within 2 – 6%.
Resulting from the last three variables, pressure and specific volume register
errors ranging from 5 to 12% and 17 to 32%, respectively. Both parameters are significantly
changed by the inaccuracies of Us and up and in experiment I it is easily perceptible where
an inaccuracy of 30 m/s gives a maximum error of 32%, in the value of ν.
This variation of values is mostly explained by an uncontrollable error, the tilt
of the projectile, since the measuring instruments have a great accuracy. On sample #27
(experiment II) not even the tilt is a possible cause, but also the brass back surface may be
responsible for adding errors to the measurement. The fact that only three values of P – ν or
Us –up are being analysed suggests that a small error in the data have an effect on the curves.
5.4. Hugoniot results
Before plotting the data into a graphic displaying the particle velocity vs. shock
velocity, it is necessary to make an assumption. The velocity in situ of the particles is known

Hugoniot characterization of WC-Ni powders
44 2015
as half of the velocity on the free surface according to the free surface condition. Thus the
following table resumes the data plotted on Hugoniot curve (Figure 5.10) which correlates
the velocity of the shock with the particle velocity and its maximum pondered error as well
results obtained by Vogler (2005).
Table 5.4. Hugoniot data in Us-up plane.
Shot
Velocity of
the shock
[m/s]
Velocity of in
situ particles
[m/s]
I 1199.75 260.00
II 866.34 151.37
III 1618.85 300.77
Shock velocities for the experiments on WC powder are shown as function of
particle velocity in Figure 5.10. Represented as a black line, a linear relationship between
the velocities represents the data well over the range of these experiments. The best fit is
given by:
𝑈𝑠 = 128.94 + 4.6313 𝑢𝑝 (5.3)
Figure 5.10. Hugoniot curve and pondered errors in the plane Us-up for the obtained experimental results and Vogler (2005).
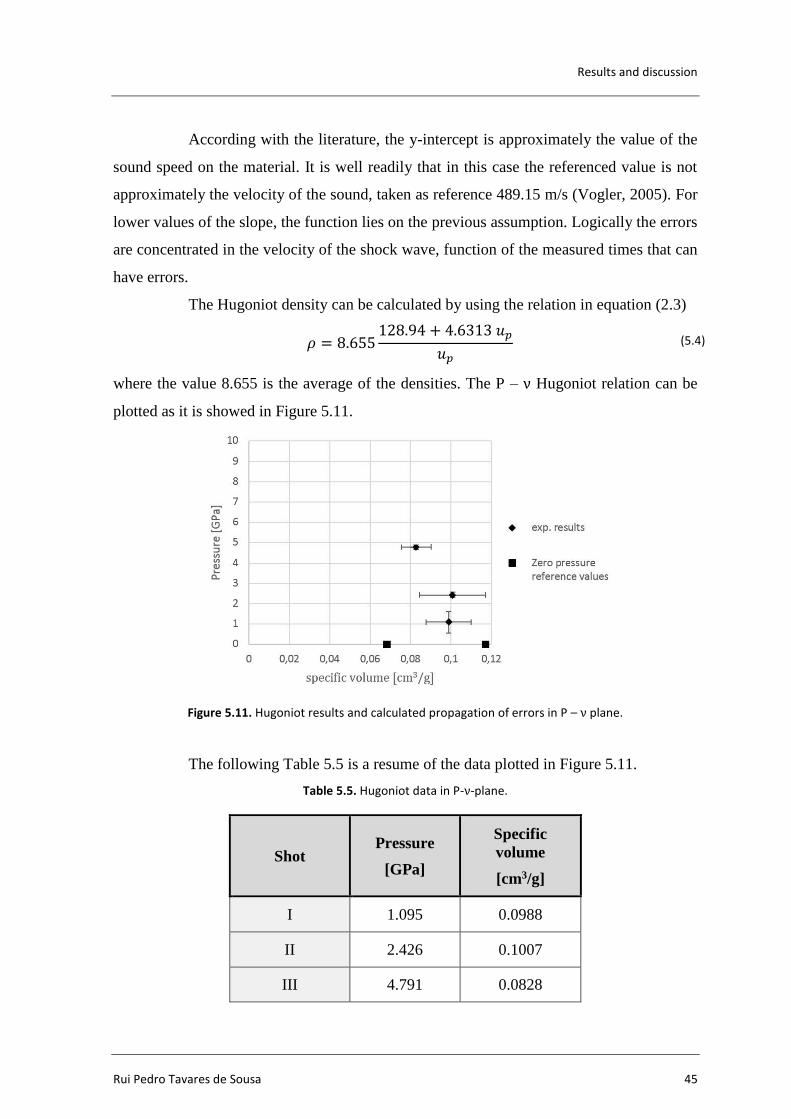
Results and discussion
Rui Pedro Tavares de Sousa 45
According with the literature, the y-intercept is approximately the value of the
sound speed on the material. It is well readily that in this case the referenced value is not
approximately the velocity of the sound, taken as reference 489.15 m/s (Vogler, 2005). For
lower values of the slope, the function lies on the previous assumption. Logically the errors
are concentrated in the velocity of the shock wave, function of the measured times that can
have errors.
The Hugoniot density can be calculated by using the relation in equation (2.3)
𝜌 = 8.655128.94 + 4.6313 𝑢𝑝
𝑢𝑝 (5.4)
where the value 8.655 is the average of the densities. The P – ν Hugoniot relation can be
plotted as it is showed in Figure 5.11.
Figure 5.11. Hugoniot results and calculated propagation of errors in P – ν plane.
The following Table 5.5 is a resume of the data plotted in Figure 5.11.
Table 5.5. Hugoniot data in P-ν-plane.
Shot Pressure
[GPa]
Specific
volume
[cm3/g]
I 1.095 0.0988
II 2.426 0.1007
III 4.791 0.0828

Hugoniot characterization of WC-Ni powders
46 2015
5.5. Theoretical approaching
The prediction of the curves of the porous materials may be performed by using
the Mie-Grüneisen model and the Thouvenin model. The experimental results are compared
with the calculated curves to verify if there is a correlation in-between these models. This
theoretical hypothesis distinctly bases on thermodynamic nature and shock propagation
configuration foundations, as it was explained respectively in section 2.1.1.1 and.2.1.1.2.
5.5.1. Mie-Grüneisen model
An approximation of the Hugoniot curve of porous materials can be calculated
using the Mie-Grüneisen equation, which relates the pressure with specific volume. This
theory, was successful applied in prevising the curve for porous materials such as tungsten
(Boade, 1969 and Linde et al., 1972), syntactic foams (Ribeiro, 2003) and copper (Boade,
1970) For this purpose, the constants C0 and S of the Hugoniot curve of the solid material as
well as the initial specific volume of the solid (νs0) and porous material (νp0) must be known.
For the present case, equation (2.24) was modified for:
𝑃𝑝1 =[2𝜈1 − Г(𝜈𝑠0 − 𝜈1)]𝑐2(𝜈𝑠0 − 𝜈1)
[2𝜈1 − Г(𝜈𝑝0 − 𝜈1)][𝜈𝑠0 − 𝑆(𝜈𝑠0 − 𝜈1)] (5.5)
The information collected from measurements (section 3.2.2) gives that νp0 is
approximately 0.117cm3/g, considering it as an average of the three values of measurements
given in Table 3.2. Once more, νs0 is 0.068 g/cm3.
After a review based on the literature, the parameters of the curve could not be
found for nickel-doped tungsten carbide. However, considered as an approximation, a
pondered mean for 89% of WC and 11% of Ni was calculated for the desired parameters.
Nickel’s properties were taken as: 𝑘 = 180 𝐺𝑃𝑎; 𝜌 = 8908𝐾𝑔
𝑚3 ; 𝑐𝑣 = 456 𝐽 (𝑘𝑔. 𝐾)⁄ ; 𝛼 =
13 ∗ 10−6 𝑚 (𝑚. 𝐾)⁄ 𝑈𝑠 = 4.59 + 1.44𝑢𝑝 (Marsh, 1980) and 𝐶𝑏 = 4590 𝑚/𝑠 (RFCafe).
According to Grady (2009) neither shock velocity nor shock impedance is markedly affected
by the variations in the composition, among the ceramics analysed on his report. On Figure
2.4 this statement is corroborated by the linear approximation of all the plotted experiments.
Hence parameters of the curve Hugoniot of WC are taken as: 𝑆 = 1.31 and 𝐶0 = 4.93 𝑘𝑚/𝑠.
(Dandekar and Grady 1992). The remaining values for WC are 𝑐𝑣 = 961.6 𝐽/(𝑘𝑔. 𝐾), 𝑘 =
381.6 𝐺𝑃𝑎 (Dandekar, 2001), 𝛼 = 4.228 𝑚/(𝑚. 𝐾) (Kurlov) and 𝐶𝑏 = 4930 𝑚/𝑠 (at

Results and discussion
Rui Pedro Tavares de Sousa 47
RFCafe website) The following table shows the values that were inserted in the equation
(5.5).
Table 5.6. Mie-Grüneisen parameters.
ν0porous
[m3/kg]
ν0solid
[m3/kg]
C0
[m/s] S0
Cb
[m/s]
α
[K-1]
Cv
[J/(kg.K)] Г
1.170x10⁻⁴ 6.903x10⁻⁵ 4892.6 1.3 4828.2 6.325 x 10⁻⁶ 905.984 0.584
On the following figure the interrupted line represents the curve for the Mie-
Grüneisen model, whilst the plots figure the experimental results and the zero pressure point
for an initial ν and fully compacted material.
Figure 5.12. Mie-Grüneisen Model and experimental results and calculated propagation of errors in the P-ν.
5.5.2. Thouvenin model
The shock behaviour on powdered materials is regarded as a sequence of
successive shocks between a set of plates, according with Thouvenin. The model has been
used over the years as a prediction to the Hugoniot Curve of the materials. Authors such as
Heyda (1968), Ribeiro et al. (2003 and (2009) and Kubota et al. (2014) successfully achieved
their results.
The prevision for the Hugoniot curve is pictured in the following Figure 5.13.

Hugoniot characterization of WC-Ni powders
48 2015
Figure 5.13. Thouvenin Model and experimental results and calculated propagation of errors in the P-ν.
The parameter λ, the inverse of porosity, was calculated using equation (2.26)
regarding the same values of specific volume as in Table 5.6. Equations (2.27) and (2.28)
calculates the velocity of the phase and shock using Us and up given by the Hugoniot equation
characterised by the terms C0 and S0 from Table 5.6. Once Usp and upp are well characterised,
Hoffman suggests the application of the conservation equations (2.4) and (2.6) to obtain the
ν – P Hugoniot relation.
5.6. Discussion of the results and models
In Figure 5.12 and Figure 5.13 are depicted the graphics predicted by Mie-
Grüneisen and Thouvenin /Hofmann models respectively. In fact, the experimental results
do not perfectly lay down in none of the models, but Thouvenin’s better describe their
behaviour. According to Oh et al (Ribeiro, 2003), in the Gruneisen model, significant errors
can be presented in the values of pressure, reflection of Г coefficient, even if they are small.
It is important to notice the Г/ν was assumed as constant for Г and ν values. From the analysis
of the values of pressure and specific volume, it is noticeable that after the shock the material
was not fully compressed owing to the velocity of the projectile that originated relatively
low pressures. However, the point with highest velocity and pressure seems to be in
concordance with the Thouvenin’s curve, therefore the material was fully compacted by the
shock.

Results and discussion
Rui Pedro Tavares de Sousa 49
After being quantified, the estimative of errors can be reflected on the
experimental results in the Hugoniot curves. Results obtained by Vogler (2005) in WC
powders are plotted in Figure 5.10 along with results from the present work. The values of
velocity of sound in the material C0 and the gradient S0 are very different and neither the
influence of a possible error changes the curve into a similarity between results.
In another point of view, on P-ν plane the inaccuracy on experimental points
approaches the results to the curve predicted by Thouvenin model (Figure 5.13).
Hugoniot characterization of WC-Ni powders
50 2015

Conclusions and future works
Rui Pedro Tavares de Sousa 51
6. CONCLUSIONS AND FUTURE WORKS
A series of planar impact experiments using a gas gun were conducted on the
ceramic Nickel-doped Tungsten Carbide powders for measuring the relation between the
velocity of shock waves and particle velocity – the Hugoniot relation. A cylindrical flyer
made of PMMA and pure cooper, was used to shock a target. This one was designed in
accordance with the Heterodyne Velocimetry and consisted of a cylindrical cooper interface
adjacent to the powdered sample compressed using an isostatic compressing dye. The impact
between the moving flyer and the target resulted in the propagation of a shock wave that was
quantified by means of four sensors, located next to the cooper and powder back interface.
The velocity of the shock is calculated using the thickness of the sample and the difference
between the final and initial instants, measured by the sensors. On the other hand, a sensor
directly assessed the particle velocity of the sample by measuring the velocity of the free
surface of the back surface of the specimen, found to be twice of the referenced velocity.
Thus, the Hugoniot relation was characterised for different planes, using the two parameters
of velocity obtained by analysing the data with a specific software. The experiments were
performed at velocities at the projectile of 320, 500 and 620 m/s obtaining pressures in the
range of 1.1 to 4.8 GPa. This stress created a shock with velocities of approximately 866 to
1620 m/s which imparted particle velocities between 151 and 300 m/s.
The design of the target revealed to be very practical and functional and the
technique for preparing the optical fibres reliable, since the HetV measurement led to very
precise results.
In the moment of impact the sabot collided with tilt which adds a small error to
the results. This uncontrollable event generated different instants of time that were corrected
the average value of the measurements instead.
Two models which from the Hugoniot relation of the non-porous material
predicts the curve for porous material under study, were reviewed and used for comparison
with experimental results. Although none of the models perfectly describes the results, data
suggests that the material was not fully compacted for the impacts of lower velocities. In
Hugoniot characterization of WC-Ni powders
52 2015
fact, if this issue is considered, in addition to errors calculated to quantify the inaccuracy of
the measurements, experimental results can approximately fit the curve of Thouvenin model.
For future works it is suggested a study the Hugoniot relation of GD20N powders
for higher velocities, as well the characterisation of other WC-Ni powders with different
percentages of Ni for posterior comparison of results. An improvement of the measurement/
quantification of the tilt of the sabot and a comparison between a similar setup with a
transparent back window, for directly measuring the particle velocity, is also a suggested
task for the future.
Bibliography
Rui Pedro Tavares de Sousa 53
BIBLIOGRAPHY
Amulele, G. M., Manghnani, M. H., Marriappan, S., Hong, X., Li, F., Qin, X., Liermann, H.
P., (2008) “Compression behavior of WC and WC-6%Co up to 50 GPa. Determined
by Synchrotron X-Ray Diffraction and ultrasonic technique”, J. Appl. Phys., 103, 1.
Boade, R., 1969, “Dynamic compression of porous tungsten”, Journal of Applied Physics,
vol. 40, nº9, pp. 3781-3785
Boade, R. 1970, “Principal-Hugoniot, second-shock Hugoniot and release behavior of
pressed cooper”, Journal of Applied Physics, vol. 41, nº11, pp. 4542-4551.
Bulk sound speed of materials, searched in 20th of August at http://www.rfcafe.com
Dandekar, P. D., 2001, “Shock response of Boron carbide”, Weapons and materials research
directorate, ARL
Dandekar, P. D., Grady, D., E., “Shock equation of state and dynamic strength of tungsten
carbide, AIP Conference proceedings 620, 783 (2002).
Gourdin, W.H. (1986), “Dynamic consolidation of metal powders”, In: Progress in materials
science, Vol. 30, 30-39.
Grady, D. E. (1995), “Dynamic Properties of Ceramic Materials” Sandia National
Laboratories Technical Report, SAND94-3266, February.
Grady, D. E., (1999), “Impact Failure and Fragmentation Properties of Tungsten Carbide”,
Int. J. Impact Eng. 23, 307-317.
Grady, D. E., (2009), “Analysis of shock and high-rate data for ceramics: Equation of state
properties and fragmentation in the ballistic environment, Applied Research
Associates, Inc.
Hayes, D. B., (1973), “Introduction to stress wave phenomena”, SLA-73-0801
Herrmann, W., 1969, “Constitutive equation for the dynamic compaction of ductile porous
materials”, Journal of Applied Physics, 40, pp: 2490-2499
Heyda, J., F., 1968, “Plate-gap model of a porous solid and its application to impact by
reduced density projectiles”, NASA contractor report, NASA CR - 1140
History of Weimar republic, Searched in 4th of April at http://www.thyssenkrupp.com
Hofmann, R., Andrews, D., Maxwell, D., 1968, “Computed shock response of porous
aluminum, Journal of Applied Physics 39, pp: 4555-4562.
Kubota, S., Saburi, T., Ogata, Y., Wada, Y., Nagayama, K., 2014, “Experiments and
numerical simulations of plate gap model for high energetic materials”, Journal of
physics: Conf. Ser. 500 052022
Kumar, Sanjay, Singh, Kulbir, Saxena, Rajiv, (2011), “Analysis of Dirichlet and generalized
Hamming window functions in the fractional Fourier transform domains”, Signal
processing 91, pages 600 to 606

Hugoniot characterization of WC-Ni powders
54 2015
Kurlov, A. S., Gusev, A. I., “Tungsten carbides: structure, properties and application in
hardmetals”, Dordretch: Springer 2013
Linde, R., Seaman, L., Schmidt, D., 1972, “Shock response of porous copper, iron, tungsten
and polyurethane”, Journal of applied Physics, vol. 43, nº8, pp 3367-3375
Marsh, S., P., 1980, “LASL shock Hugoniot data”, University of California Press, Berkeley,
EUA.
McQueen, R. G., Marsh, S. P., Taylor, J. W., Fritz J. N., Carter, W. J., (1970), “The Equation
of State of Solids from Shock Wave Studies, In High Velocity Impact Phenomena”,
R Kinslow ed., Academic Press
Pires, A. S. (2012) “Aplicação da compactação por explosivos na produção de compósitos
de carboneto de tungsténio”. Doctor thesis in Cience and Engineering of materials at
University of Aveiro.
Pruemmer, R. A., Bhat, T. B., Kumar, K. S. and Hokamoto, K. (2006), “Explosive
Compaction of Powders & Composites”, CRC Press, 2-16
Ribeiro, J., Mendes, R., Plaksin, I., Campos, J., Capela, C., 2009, “High pressure range shock
wave data for syntactic foams”, AIP conference proceedings 1195
Ribeiro, J., Campos, J., 2003, “Shock behavior of syntactic foams”, Manufacture, testing
and utilization of light- weight armour materials, Vol. 1, pp. 75-133
Rice University, Houston. “Error analysis and significant figures” visited in 10th of May,at
http://owlnet.rice.edu
Ribeiro, J. B. (2003) “Propagação de ondas de choque em espumas sintácticas”. Doctor
thesis in Mechanical Engineering at University of Coimbra
Shon, I., J., Jeong, I. K., Ko, I. Y., Doh, J. M., Woo, K. D., (2007), “Sintering behavior and
mechanical properties of WC-10Co, WC-10Ni and WC-10Fe hard materials
produced by high-frequency induction heated sintering”, Ceramics international 35
(2009) 339-344
Strand, O. T., Berzins, l. V.., Goosman, D. R., Kuhlow W. W., Sargis, P. D., Whitworth, T.
L. (2004), “Velocimetry Using Heterodyne Techniques”, UCRL-CONF-206034
Thouvenin, J., 1965, “Effect of a shock wave on a porous solid”, Fourth International
Symposium on detonation, ACR-126, Office of Naval Research, Department of the
Navy, Washington DC, EUA pp 258-265
Vogler, T. J., Gluth, J. W., Grady, D. E., (2005), “Dynamic compaction of Tungsten Carbide
Powder”, Sandia National Laboratories.
Winter, R. E., (2009), “Key concepts of shock hydrodynamics”, AWE report 881/09,
Imperial college

Appendix A
Rui Pedro Tavares de Sousa 55
APPENDIX A
2D Project of the isostatic pressing dye
A.1. Body part I

Hugoniot characterization of WC-Ni powders
56 2015
A.2. Body part II

Appendix A
Rui Pedro Tavares de Sousa 57
A.3. Punch
A.4. Base

Hugoniot characterization of WC-Ni powders
58 2015

Appendix B
Rui Pedro Tavares de Sousa 59
APPENDIX B
2D project of the target
B.1. Cooper plate

Hugoniot characterization of WC-Ni powders
60 2015
B.2. Sample holder

Appendix B
Rui Pedro Tavares de Sousa 61
B.3. Fiber holder
B.4. Ring


![wc EME žäC&ff DAIOU ILLUST MAP (77? wc wc wc ÞY5 260 260 ... · DAIOU ILLUST MAP (77? wc wc wc ÞY5 260 260 wc (DÎIÉ] 167 wc 9155} 7—Jb wc -k ;knlc 220km 61 km 55B R 167 45](https://img.dokumen.tips/doc/110x75/5f097c067e708231d4270c2d/wc-eme-cff-daiou-illust-map-77-wc-wc-wc-y5-260-260-daiou-illust.jpg)