Embed Size (px)
DESCRIPTION
hub and costs
Citation preview

Hubbing and Airline Costs
Adlb KanafamMark Hansen
Working PaperUCTC No 410
The Umverszty of CahfornzaTranspoztatlon Center
Umversltv of Cahforma
Berkeley, CA 94720

The University of CahformaTransportation Center
The Umverszty of CahformaTransportation Center (UCTC)~s one of ten reponal umts
mandated by Congress andestabhshed m Fall 1988 tosupport research, education,and trammg m surface trans-portatmn The UC Centerserves federal Region IX andis supported b3, matching
grants from the U S Depart-ment of Transportanon. theCahfornm Department ofTransportation (Caltrans), andthe Lmvers~ty
Based on the Berkele)~Campus, UCTC draws upone,clstmg capab,lmes andresources of the Insnmtes ofTransportation Studies atBerke.rey, Davis, Ir~me anoLos Ange,es, the [nsnmte otUrean and Regional Develop-
ment at Berke’e,, anc~ severalacademic departmen°s at theBerkeley Davis lr, me and
Los A-geles campuse~
Facuk,, and students on otherUmverslt,, of Cahfornla
campuses ma’, pamclpate m
Center actwmes Researchersat other umversmes within the
regmn also have opportunmesto collaborate wlth UC facul~’on selected studies
UCTC’s educatmnal andresearch programs are focusedon strategic planning for
impro,,mg metropohtanaccess~Nhty, with emphasis
on the special conditions mRegmn IX Pamcular attentionis directed to strategies for
using transportation as aninstrument of economicdevelopment while also ac-commodating to the region spersistent expansion andwhile malr’mmmg and enhanc-ing the quality of hfe there
Tne Center dlstrlbutes reportson ,is research in wo-kmgpapers monographs and mrepnnts of pubnshed art:cles
It also pubnshes Access, amagazine presenting sum-maries of selected studies Fora hst of pubhcatmns in pnn:wtnte to the address below
Umverslty of CahformaTransportation Center
108 Naval Architecture BuddingBerkeley, Cahfomm 94720Tel 510/663-7378FAX 510/643-5456
The contents of tlxs report reflect the vmws of the author who is responsiblefor the facts and accuracy of the data presented hereto The contents do notnecessarily reflect the officml views or pohcles of the State of Caltforma or theU S Department of Transportatmn Thas report does not constitute a standard,speclficauon, or regulatmn

Hubbing and Airline Costs
Adlb KanafamMark Hansen
Insntute ol Transportanon StudiesUmverslt~ of Cahforma
BerkeIey, CA 94720-1720
Workmg PaperAugust 1985
UCTC No 410
The University of Cahforma Transportatlon CenterUmverslty of Cahfom~a at Berkeley

I. Introduction
The ampac~s of alrhne deregulaUon have been the subject of conslderable
research The work generally falls into two categories The flrst analyzes
the impacts of deregulation on mdustry structure and conducL Route
structures, marketing strategies, and pattet-ns of market entry, exit, and
concen~Lration are among the toplcs considered in these studies Despite this
bread~ of subject matter, mvestigaUons m this category are slmilar m thelr
focus on "value-neutral" impacts and avoidance of normative issues.
The second strand of airline deregulalaon research focuses on the
performance of the industry since deregulalaon. Efflciency, servzce quality
and convemence, and equlty are among the maior criteria employed to
evaluate that performance Although much of the work m tins category is
czrcum~pect in ~ts use of normative termLnology, it has clear normative
imphcauons Whereas investigations m the f~rst set look at what the
Ludustry Is doing differently, these consider whether it is dmng "better" or
"worse."
Both types of studies have produced valuable results, but they also raise
further questions. One largely unexplored area concerns the relationship
between structure and conduct on the one hand and performance on the
other. The existing literature, in focusing rather exclusively on one or the
other of these sets of varmbles, has avmded the task of establishing |_~l~s
between them. For example, wh~le post-deregulatmn productivity growth
and route structure changes has received considerable attention, the
connection between these trends has yet to be investigated.

2
That connection ~s the subiect of tbJs paper SpecLr~cally, we consider the
effect oF a~r network hubbmg on airhne productlvtty Has increased hubbmg
contributed to :ncreased product~vity~ Or are these trends unrelated, or even
opposed, to one another? To investigate tb~s issue, we include measures of
hubbing m the specification of mrbne cost functions, and calibrate them
using pooled cross-sect~ona| data spannm_g the 1976-84 time period° We
t’md no direct connection between the degree of hubb~ng and and airhne cost
leve!s over these years We argue that the signElcance of this finding
depends upon the nature of the process underlying the trend toward
increased hubblng, a process not yet thoroughly understood.
The ba!ance of th~s paper includes four sections In Section 2, we review
trends m alrhne productivity and hubbmg, and discuss theoretzcal bases for
relating these trends. Our methodology ts described m Section 3, and our
results are presented m Section 4 Section 5 assesses the implication of our
findings for the product~v~ty-hubbmg relationship.
2. Productivity and Bubbb~g - A Review or ~e Evidence
There ~s substantial evidence that airline productivity growth has
accelerated since deregulation. Increased bubbing of air carrier route
networks has also been observed. Ftnatly, there is a theoretical basis for
assocmttng increased hubbmg with gains m productivity. Here, we review
evidence of hubbing and productivity trends and discuss possible
connections between them.

3
Trends in Product~vltv
Caves, Chmstla~son, and TrethawayI have carried out the most thorough
research to date on productlvity trends in the a~rlme industry. They employ
superl~.Uve index numbers as measures of input and output in order to
measure total factor productivity (TFP). Some five categories of output (first
class, coach, and charter passenger miles, freight, and mail ton-miles} and
five categories of input (labor, aircraft, ground property and equipment, fuel,
and materials) are considered m their analysis. These categories are
aggregated together on the basts of revenue and cost shares, respectively,
according to formulas developed by Caves, Chistlanson, and Diewart.2
Their results suggest that TFP of both the trunks and the local carriers
increased thoughout the 1970s, but that gains accelerated during the latter
part of the decade as regulatlon was relaxed. For trunks, the average annual
TFP increase from ]970-75 was 2.6 per cent, jumping to 4.9 percent in the
! 975-803 period For locals, the comparable figures were 4.0 percent and
6.3 per cent, while for the industry as a whole they were 2.8 percent and 5.1
percen’L.
I Dougi~s Caves, Laurits C-hristensen, and Michael Tretheway, ’3>roducth~ityPerformance of U.S. Trunk and Local Service Airlines in the Era ofDeregulation," Economic Inquiry, XXI (July 1983), pp. 312-324.2Dougt~ts Caves, Laurits Chrlstenson, and W. Erwin Diewart, "MultilateralCompm’tsons of Output, Input, and Productivity Using Superlative IndexNumbers," Economic Journal, 92 (March 1982), pp. 73-86.3Although leglslation deregulating the ratlines was not passed until 1978, theCAB began to liberalize its pohcies concerning route awards and fare levelsm 1975 The authors therefore compare the 1970-75 and 1975-80 periodsm thmr assessment.

4
The authors attempt to assess sources of atrhne productivity gain by
performing analysls of covariance regresslons of ~ growth using airline
operating characteristics--output level, load factor, stage length, and
available capacity--as mdependent varlables. Changes in these
characteristics--particularly increased output--are found to account for most
of the acceleratlon m TFP growth during the late 1970s Insofar as these
sources of accelerated growth themselves stem from deregulation, one can
conclude that the latter has improved alrhne efficiency. The authors,
attributing increased output to fare reductlons induced by deregulation,
credit it for roughly half of the increase in TFP grow~.h dunng the 1975-80
period
Barley, Graham, and Kaplan4 measure productlvlty growth by comparing
changes In a~rflne industry aggregate costs per revenue ton-mile with
changes m input factor prices. Like Caves e~ el°, they find accelerating
product~vlty growth for the local airlines from 1975-8 I, but, in contrast to
the former, they fred no such pattern for the trunks. This difference is
attributed to the inclusion m the time series of 1981, a year when
performance was adversely affected by economic recession and the aircraft
controllers strike. Indeed, Bailey et el. find that the 1975-78 perlod
w~tnessed an annual trunk productlvtty increase of 8.1 percent, followed by
an armual rate of 0.5 percent between ! 978-8 I. Any deregulation=induced
productivity gems during the latter period were thus apparently dominated
by other factors.
4Bhzabeth Barley, Davld R. Graham, and Daniel P. Kaplan, Deregulating theAirlines (Cambridge MA. MIT Press, 1985), Chapter

5
BaJ1ey et al also consider evldence of changes in speciflc operational
charactertstlcs that have a dlrect bearing on overall efhclency. For example,
the authors fred that trunk !oad factors increased fairly steadily between
1974 aad 1979, but fetl sharply from 1979-81. Nonetheless, during the
latter period, load factors were substantially higher than during the two
prevmus recessions (1974-75 and 1969-70) Moreover, when market
average load factors are regressed on market characteristics, the sign of the
coef[icmnt on the distance variable is found to change from negative in ! 969
to pos~tlve m 1976 and 1981. This suggests that, whereas airlines were
mducecl to offer excessive number of flights on long-haul routes under CAB-
imposed fare structures, deregulatmn led to a more economlcally efficlent
distribution of service levels5 The authors also fred evidence of post-
deregul, at~on productlviW improvement m higher aircraft utilization rates
and se~tmg densities, as well as increased stage lengths, since 1975.
To summarize, there are strong indications that alrline productlvity has
increased as a result of deregulatmn. The directly observable improvement
is mos~ pronounced over the late ] 970s, before a weakened economy and
the controllers’ strike took their toil. Complimenting the direct evidence are
trends m load factors and other variables that also suggest a more efficient
industry.
5The ume savings resulting from increased frequency are independent ofroute length, while the cos~ of an additional Hight is higher for longer routes.Thus ol~tlmal frequencies should decrease with stage length, ceterusparahus. Under regulation, however, fares were sel so tha% long-haulroutes were potentmlly the most profitable. This caused carrmrs to vie forlong-haul traffic by offering service frequencles in excess of optimal levels.See G.W Douglas and J.C. Miller, Economic Regulation of Domestic AirTransport: Theory and Policy(Washington DC The Brookmgs Institute.1974}.

6
Tre,nds in Hubbirm
Comparison of route maps of today wlth those of the mld-1970s amply
demonstrates tha~. a~rIine network hubbing has increased. The now familiar
pattern of multlp~e links emanating from a ban~ul of hub azrports has
repla~d the seeming hodge-podge tba~ claaracterized many route systems
under regulation. In addltlon to being visually apparent, the increase m
bubbmg ts manifested quamtat~vely in airline operating statistics.
One md~cat~on oI a hubbed network is the concentration of operations at a
handful of a~rports which serve as transfer points for connecting traffic.
Measures of concentratlon of an alrline’s operations can therefore serve as
measures of the degree of hubbing of that airline’s route network. Methods
for measuring concentrat, on have been developed for a variety of social
science appl~cat~ons, such as assessing mdustrlal concentration and analy~J_ing
income d~str, but, on Table ! shows the results when three such measures
are apphed to mdlv~dual aarlmes’ dzstributions of scheduled departures for
the years 1976, 1980, and 1984. The upward trend in these measures ~s
quzte apparent. The few instances of downward movement also involve
large scale network expansions, which naturally tend to reduce
concentrat,on Indeed, ttts notable that some airlines (American and
Umted, for example), have increased concentrations of departures despite
substantial increases m the number of points served.

7
Table I - Concentration of DeparturesAmong Airports for Selected Airlines, 1976=84
Herfmdahl 1 -Airport 4-A~rport PointsAirlhne Index I Concentratlon2 Concentratia~3 Served
76 80 84 76 80 84 76 80 84 76 80 84Amerlcan .055.065 .I00 .142.164.190 .337.403.440 52 58 103Brannif .109.122 n.a .290.321 n.a. .481.482 n.~ 39 58 n,a.Delt~ .047.066.073 .171.224,232 .303.354.401 74 76 87Eastern .052.062.065 .172.207.219 .336.360 -3(~3 75 80 89Frontlet .036.058 .I 10 .153.218.319 .256.281 366 93 96 81Nor~l~west .063.061 .078 .151 156.234 419.403.424 48 48 56Ozark .051 .068.161 .144.205.389 .350.403.483 48 51 51Pan Am .184.071 .100 .279.141 .204 .764 424.549 10 29 40Piedmont .034.040.060 .080.080.189 .253.280.365 50 49 64Repubhc n.s .026.033 n.s..066.095 n.a..244.296 n.a. 129 I17TWA .058.056.111 .135.143.307 .373.375.465 38 57 63Umt(;d .044.055.064 .142.164.190 .337 403.440 95 95 132US Air .047.060.078 .144.189.243 .321 .368.401 55 57 69Wesl,ern .069.080.083 .162.170.208 .430.471 .468 41 43 64
NotesIComputed by summing the squares of airport shares the airline’s totalscheduled departures2The share of the a~rI~ne’s total departures from the a~’port where the~arla~e had the most departures3The combined shares of the airline’s total departures from the fourairports where the a~rline had the most departures.
Source CAB Form 41 data as stored on I.P. Sharp data base.
Other mdicauons of increased hubbing include growth in the number of
flights connecting smaller ~urports with larger ones, and increases in the
share of trips made on a smgle airline. Large airports tend to have larger
local markets, making them the most desirable sites for hubs. Thus, as more
traffic ts funneled through hubs, d~rect fhghts between smaller airports and
larger ones should increase relatlve to direct connections between the
former. Table 2 reveals that thls has happened. Likewise, hubbmg enables
a single airline to serve both trunk and feeder routes, and should therefore

increase the share of trips made onttne Consistent with this expectation, the
onhne share of total trlps went from 89.1 percent in 1978 to 96.7 percent m
8
1983.6
Table 2 - Growth in Non-Stop ConnectionsInvolving Small a n_d Non-Hubs
From Small HubsFrom Non-Hubs
Percent Increase in Non-StopFlights, 1978 to 198 l
To Large To Medmm To SmallHubs Hubs Hubs18.3 -7. I -23.212.3 I 0.5 -2 I. 1
To Non-Hubs
-21.1-12.6
Source. Bailey et al. (1985), p. 84.
Thus, increased hubbmg of airline networks is evident m a number
statistical trends. Increased concentration of operations, more direct fhghts
between small and large airports, and the greater proportion of passengers
receiving on-line service all tend to confirm the impression alrtme route
maps graphically convey.
6U.S C~vil Aeronautics Board, J?eport to Congress on fmplementation ofthe Provisions of the Airline Deregulation Act of 1978, (WashingtonDC C1vll Aeronautics Board, 1984)

9
and ProO.~ctlvltv
The preceding sect:ons have presented evldence of increased productlvlty
and hubbkng since deregulation We now conslder possible connections
between these trends.
The productivity enhancing impacts of a~rlme hubbing are well understood.
Airl~ne routes exhib:t strong economies of traffic density. These may take
several different forms. First, there are economies of aircraft size. As the
amount of trafhc on a hnk increases, it becomes possible to use serve the
hnk with larger, more economlca/, planes. Second, there are economies of
schedLLle frequency. H~gher hnk flows mean tha~ more departures can be
scheduled, allowing travelers a greater selectlon of travel times. Third, while
the st[~hasUc nature of travel demand causes temporal vamatlon in traffic,
mcreased trafflc density reduces the relative magn,tude of this variation.
This al[Iows airlines to operate on a regular schedule, with reasonably high
load factors, while at the same time offerktg suff,cient capacity to serve most
travelers des,rmg a particular flight.
By consohdating trafhc between a large number of origin-destination pairs
on a r(:lat~vely small number of knks, hubbmg allows increased realization of
economies of traffic density. Suppose a glven airhne serves a total of n
communit:es In order to provide direct service between each city-pair, E
would need n2=n links. But instead, the airline could establish a hub at one
of the n airports, and thereby offer one-stop service between each city-pa/r
with only n-! links For a glven level of traffic, this implies a n-fold increase
m trafhc density on each link.

Hubbmg is not the only means of increasing the level of traffic on md:vidual
links. Indeed, a much more common strategy tn most pubhc transportation
systems :s to estabhsh linear route structures with relatively closely spaced
stops This strategy has also been used m air transportation, where it is
called "’hedgehopping". However, the costs and passenger inconvenience
entailed in making a stop is much greater tn air transportation than it is in
other modes As a result, post-deregulation route rationalization has
revolved a move away from hedgehopping and toward hubbmg.
These considerations suggest that hubbmg could increase productivity m a
variety of ways First, airlines that hub could employ larger, more
econom:cal, aircraft while maintaining an acceptable level of service
frec~uency. Second, such airlines could maintain higher load factors and still
be able to offer most passengers a seat on their preferred flight. Third, the
airime could choose to improve service rather than reduce cost? For
example, instead of :ncreasmg the size of aircraft for a given service
frequency, the frequency could be increased for a given see of aircraft.
Finally, hubbing could allow a~rlines to avoid the frequent, costly, stops
necessitated by hedgehoppmg.
Yet, there are are also ways m which hubbmg can detract from productivity.
First, although increased service frequency may result, so also does
increased ctrculty and the inconvenience of transferring flights. On balance,
therefore, there :s no guarantee that hubbmg improves the quality of service
?increased conven:ence can be vlewed as a form of cost reductlon in whichthe savings take the form of reduced expend:~ure of passengers’ tame andeffort

11
experienced by passengers. Increased circuity also means that airlines must
supply more passenger miles for a glven origin-destination movement
The need to bank flights at the hub can also inhibit efficiency. If connections
are to be convenient, arrivals and departures at the hub must be scheduled
wlthm a fairly short time perlod, during which terminal facilities are likely
to become congested. The exchange of passengers and baggage between
many different aircraft at the hub is complex and time-consuming, and
departure of outgoing fhghts must await the completion of this process.
These constraints can result in unavoidable delays as well as slack periods
when resources are underutilized. While the concentration of operations at
e single airport entailed by hubbing may increase productivity, the temporal
concentration can have the opposite effect.
In summary, while there is a basis for associating increased productivity
with increased hubbing, It ts far from certain that airlines whose networks
are more hubbed wiLl actually be more efficient. The link between post-
deregIJlatory trends in hubbing and airline productivity awaits empirical
conflrmatlon
3. Methodology
As the previous dtscusslon shows, the productivity ~mprovements deriving
from hubbing can be realized in a variety of ways. On the one hand, costs
can be decreased, while on the other service can be improved. Moreover,
because these benefits arise as a result of increased traffic density, they
must be assessed relative to the level of traffic in the markets being served.
A complete analysis of the productlvlty effects of hubbing should therefore

12
take into account the interrelated variables of cost, convenience, and size of
market
The analysts presented here falls considerably short of th~s ideal. The
question we attempt to answer is "do airlines that hub more incur lower
costs?" Although less fundamental than the relation between hubbin~ and
productlvlty, the relation between hubbing and costs is nonetheless
:mportant. In the first place, the former is a key component of the latter.
Secondly, the studies of a~rline productlvity trends cited earlier also isolate
on alrlme costs. The analysis we undertake is therefore consistent with the
research obtective of relat~ changes m network structure and airline
performance found m these studies.
To explore the relationship between product:v~ty and costs, we analysed
data for 13 a:rlines over the period from 1976 to ! 984.8 We used this data
to develop economic cost functions relating output to factor prices and other
variables, incluclmg the degree of hubbmg.9
awe consldered those airlines used in TabJe I, with the exception of Pan Am.To reduce data aqulsitlon costs, we used annual d~ta for even numberedyears only. Special circumstances caused us use to chromate sevenobservations, mclud~g Republic, 1976 and 1978 (airline formed in 1980);Northwest, 1978, Eastern and Ozark, 1980 (airlines were on strike for muchof the year); and Brannif, 1982 and 1984 (airline ceased operations due bankruptcy in 1982, and did not furnish Form 41 data for 1984) Tbas left total of 58 usable observations.9The I.P Sharp Form 41 data base was the source of all our data Whenconsidering a~rlmes with both domestic and international operations, weused data for domestic operations only

A futly specified cost function includes prices of all factors used m
productlon. This presented a problem, because prices of many atrhne inputs
are difficult to determine. We therefore assumed that, with the exception of
labor, input prices faced by airlines in any given year were roughly the
same Th~s enabled us to substitute dummy variables corresponding to
different years for non-labor factor prices. The dummy variables may also
represent other cost-influencing factors that may change from year to year
but are not explicitly included in the cost function specification.
Because of the great dtsparlty in labor costs faced by different airlines, this
variable was incorporated explicitly mto our cost models. To assess labor
costs, we employed a supermdex number techmque developed by Caves et
al The procedure used the number of employees and associated labor costs
m each of twelve personnel categories to compute a superlative index
number measuring total labor input.10 Total labor costs, including payroll
and payroll taxes, fringe beneflts, and other personnel expenses, was then
divided by the index of input to obtain a measure of unit labor cost.
J0The index number Is computed according to the formula:
In(Lk) - ~ (Wii+Wi)(in(Lik/L, All I
where Lk is the index of labor input for observation k, Wi~ is the share oftotal payrotl going to employees in category i for observatlon k, Wi. is themean share (over all observations) of payroll for employees in category i, Likis the number of empioyees in category i for observation k, and Li. i~ thegeometric mean (over at[ observations) of the number of employees category i.

14
Superlative inde% numbers were also used to measure a~rtme output. Two
categorles of output, revenue passenger miles and non-passenger revenue
ton-miles, were considered These quantities, combined with the revenue
generated by passenger and non-passenger traffic, were used to compute the
output index.11 It should be noted that this output measure does not reHect
differences in circuity in the foulings offered by different airli~eso To the
extent that hubbmg Increases circuity, this omission would tend to bias
results in favor of this strategy On the other hand, a substantial effort
would have been required to replace route miles with or~gin=destlnation
miles Moreover, the studies of productivity clted previously also neglect
clrcuity.
To’,al cost was computed as the sum of operating expenses and the
opportunity cost of working capital. The latter was estimated as 15% of the
stated total value of operating property and equipment, plus current assets,
remus current liabilities
A Cobb-Douglas form, modified to allow for the use of dummy variables, was
used to specify the cost function.
Cobb-Douglas productlon function
assumed to take the form:
This specification is consistent with a
Speciflc~y, if the production/unctlon is
Y = F(OC)LaXb,
11The formula used was the same as tha~ for labor input, except that twooutpu~ categories replaced the %welve personnel categories, and revenueshares replaced payroll shares. The revenue ~hares were computed usingdata for scheduled servlces only, while the passenger- and ton-m~eage dataalso included a small amount of non-scheduled servlce

15
where Y ts output, F(OC) is a function of a~rhne operating characteristics
(mcludmg hubbmg), L ks the quamtlty of labor, and X ,s the quantlty of other
inputs, then there is an associated cost funcUon,
C = (I/F(OC))ydWLeWXf,
where C ts total cost, WL is the unit cost of labor, and WX is the unit cost of
If WX is a functlon of time only, this equation can be modifiedother ,~nputs.
to become:
C = (I/F(OC))ydWLep(t).
When, as in our case, ~ takes only a few different values, {’t I ,_,in), P(t) can
represented as:
p(t) = ExP( 6iDi),
where D~ takes the value one when t=t i and the value zero otherwise. The
exponent,al form ks desirable because it can be linearized with a logarithmic
transformation.
Atrhne costs are known to depend on several other variables m addition to
output and factor prlces. The most important of these are stage length, load
factor, and size of aircraft operated. To control for these effects, we
employed measures of average stage length (passenger-miles divided by
number of passengers), load factor (passenger-miles dlvided by available
seat-m.iles), and average a~rcraft capacity (available ton-miles divided
revenue plane-miles).~a Because these variables may also mediate hubbing
effects, we also tried some specifications without them.
An airline’s costs may also be effected by the airports it serves. Large,
conges, ted a~rports result in greater delays, t~ghter scheduling constraints,
X2These variables were introduced in power form to maintain log-linearity.

16
and more circultous fhght paths In an effort to contro! for th~s effect, we
included in our models the proportion of departures from three of the most
congested alrports O~4are, Laguardia, and JFK Average delays at these
a~rports were among the flve hLghest m the U3. thoughout the period under
study 13
To incorporate hubbmg into our models, we chose to ~JternaIJvely try each of
the concentration measures used m Table i o These measures, while highly
correlated w~th one another, are suff~clently dErferent to warrant seperate
conslderat~on of thelr m.rluence on airUne costs. The I-airport concentration,
for example, is not well=suited for systems w~th multiple hubs. The 4-
a~rport concentratlon, while in some respects better sulted to multiple-hub
systems, faJJs to detect changes in the concentration of departures among the
top four alrports. Finally, the Herftndahl Index ~vo~ds the above defects, but
~s also subject to influences unrelated to the phenomenon of hubbing° 14 It
seemed preferable to try each of these measures rather than choose between
their various shortcomings
In addmon to the concentration measure, we ~Jso included the number of
domestic points served by the airline. AM other things being equ~, the
concentration of departures would be expected ~o decrease as the number of
points being served increased. Thus, if route systems A and B are equaUy
ISThe variable was introduced in exponenti~I (rather than power) formbecause tt took the value zero m several observations° It should be notedthat several other airports are also recognized to be extremely congested,but had greater year-~.o-year fluctuations in their average delay levels thanthe three mentloned14$pecif~ca]ly, the mdex is sensltive to changes In the distribution ofdepartures among airports that are clearly not system hubs.

17
concentrated m terms of the measures we have defined, but A includes twice
as many points, It seems reasonable to conclude that A is "more hubbed."
Th~s intuition imphes that our analysts should control for the number of
points We refer to the concentration measure and the number of points
served coUectlvely as the "network varlables".f5
Results
Tables 3, 4, and 5 present estimated coefflclents along with their standard
errors for the airline cost function under a total of twelve different
specif~catlons. The specifications differ with respect to which of the
varmbles stage length, load factor, and capacity, as well which of the
network vamables, they include. Set I, the results for which appear in Table
3, controls for all three of the former variables. Specifications I-A contains
no network variables. SpecificaUons I-B, I-C, and I-D respectively include
the l-a~rport concentration, 4-airport concentration, and Herfindahl index,
plus the number of points served. In the second set of specifications {Table
4), stage length, load factor, and capaclty are excluded, while Set III (Table
5) mc],udes stage length but not load factor or capacity. The network
vartables m Sets I I and I I I correspond to those m Set I. Included with each
specification ~s the coefficient of determination (R-square}. Each
speciflcat, on mvolv~ network variables also includes the results of an F-
test o~ the hypothesis that these variables do not effect costs (i.e., that their
coefflclents are zero} An F-statistic of roughly 3.2 or more Is necessary to
re)ect this hypothesls with a 95 percent degree of confidence.
15The network varmbles were included in power form
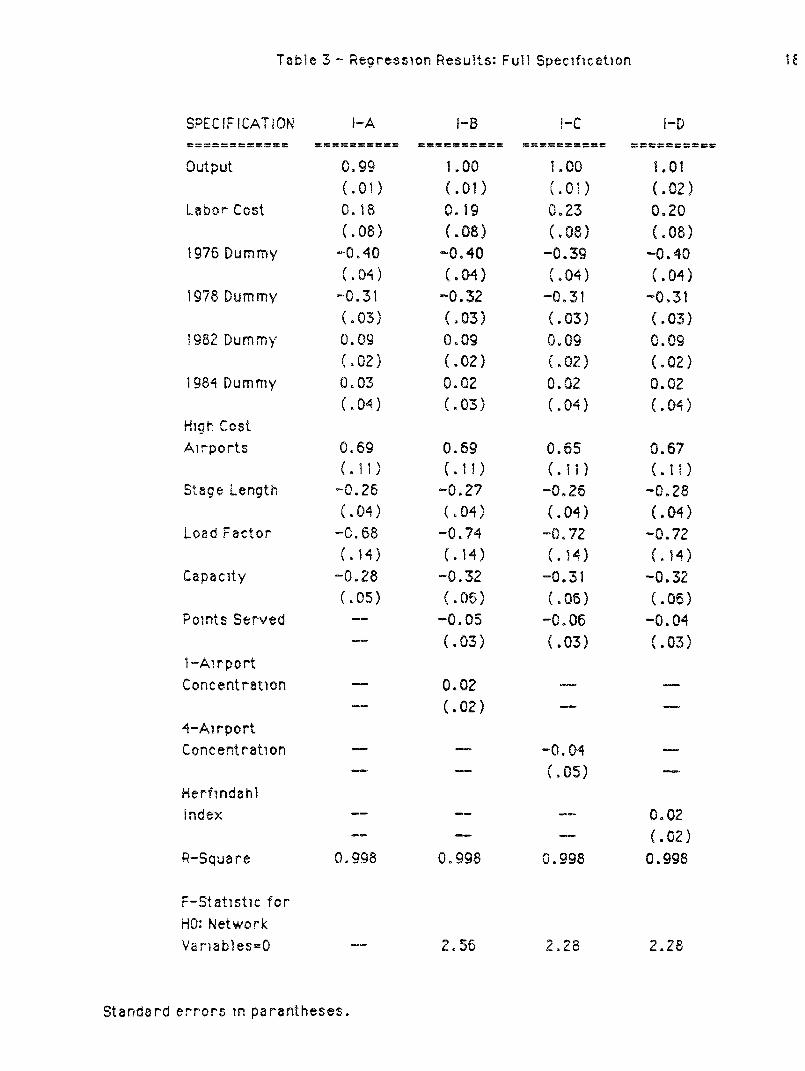
Table 3 - Regression Results: Full Specification
SPE C I F I CAT ~ ON I-A t-B ~-C f-D
Output O. 9g 1o O0 I. O0 1.0 !(.0I) (.01) (,0~) (.02)
Labor Cost 0,18 0.19 0.23 0.20(.08) (.08) (.08) (.08)
g?6 bum my -0.40 -0.40 -0.39 -0.40(.04) (.04) (.04) (.04)
1978 Dummy -0,31 -0.32 -0.:51 -0.31(.03) (.03) (.03) (.03)
1982 bum my O. Og O, OCj O. og O, og
(,02) (.02) (,02) (.02)1984 Dummy 0,03 0.02 0.02 0.02
(. 04 (. 03 (. 04 (. 04
Stage Length
Load Factor
Capacity
Pmnts Served
l-Airport
ConcentraQon
’~-AIrport
Content ratlon
HerflndahlIndex
R-Square
F-Stat]stlc forHO: NetworkVamables=O
0.69 0.6g 0.55 0.67(,11) (,II) (.11) (.11)-o.26 -o.z? -o.26 -o.28(.o4) (.o4) (.o4) (.o4)
-0.68 -0.74 -0.72 -0.72(.~4) (.14) (.t4) (.14)-o.z8 -0.32 -o.31 -0.32(,o5) (.o6) (,o6) (.o6)-- -0.05 -0.06 -0.04-- (.03) (.03) (.03)
O. OZ(.02)
...... O. 02
.... (.02)O. 998 O. 998 O. 998 O. 998
2.56 2.28 2.28
Standard errors tn parantheses.

"Table 4 - Regresslon Results: Stege Length, Capaclty, end Loed Footer Excluded 19
SPECIFICATION I~-A l t-B I f-C t~-D
Output 0.82 0.81 0.84 0.82
(.03) (.0Z) (.0Z) (.02)Labor Cost 0.Z6 0.18 0.25 0.21
(.Tg) (.19) (.17) (.78)I g76 Dum my -0.35 -0.36 -0.37 -0.37
(. 10) (.09) (.08) (.Og)
!g78 Dummy -0.31 -0.32 -0.34 -0.33
(.06) (.06) (.05) (.06)Ig82 Dummy 0.04 0.05 0.05 0.05
(.07) (.06) (.05) (.05)Ig84 Dummy -0.01 0.03 0.04 0.0~
(.09) (.08) (.07) (.08)H1gln Cost
A~rports
Stage Length
Loe, d Factor
Capacity
Points Served
l-Airport
Concentratlon
4-A~rport
Concentration
Herfmdahl
Index
R-Squa re
F-,Statlstlc for
HO: Network
Vamables=O
o.si o.64 o.6o o.si(.zg) (.z6) (.zT) (.zg)
-- o. 18 o.o2 o. Io-- (. 06 ) (. o8 ) (.
~m
-0.06
(.05)
Im
iw
m--
-0.40(.IZ)
u
u
N
....... O. 13
..... (. 06)O. g83 O. g88 O. 989 O. 987
6,g7 12.53 8.86
;tandard Errors in Parantheses

Table 5 - Regression Results: Cepec~ty and Load F~ctor Excluded
SPECIF ICAT ION II ~-A tl I-B II t-C II t-D
Output O. g7 O. 97 O. 97 O. 97(.01) (.OZ) (.02) (.02)
Labor Cost 0.07 0.07 0.09 0.06(.08) (.og) (.og) (.09)
I g75 Dummy -0.42 -0.42 -0.42 -0.’~2(.04) (,05) (,04) (.05)
1978 Dummy -0.36 -0.36 -0.36 -0.36(.03) (.03) (,03) (.03)
1982 Dummy O, 10 O. I0 O, I0 O. I 1(.03) (.03) (.03) (.03)
1984 Dummy O. 08 O. 08 O. 08 O. 08(.04) (.04) (,04) (.04)
High CostAirports
Stage Length
Load Factor
Capacity
P,rots Served
t-AirportConcentration
4-AirportConcentration
HerflndahtIndex
R-Square
F-Statistic forH0: NetworkVamabtes=0
0.77 0.77 0.76 0.78(.14) (.15) (.15) (.~5)
-0.46 -0.47 -0.46 -0.47
(.o3) (.o4) (.o4) (.o43
-- -o.oi -o.o3 -o.ooz-- (.o3) (.o4) (.o4)
o. bo4(.o3) II
-0.05(.07)
m~
m
I
..... 0.01
.... (,03)O. 997 O. 997 O. 997 O, 997
0.06 0.3Z 0. ti
Standard errors in parantheses.

21
In genera!, the estimates presented have predmted signs and reasonable
magmtudes The output coeffmient ts very dose to umty when stage length
is controUed for, suggesting an absence of firm-level scale economms.16
The labor cost coeff~ment, while consistently positive, is somewhat lower
than expected -- labor costs account for roughly 35 percent of total airline
operating expenses -- and is significant at the .05 probability level only
when stage length, capacity, and load factor are included m the model.
Colmearity of labor co-~t wlth these other varmbles, wlth the yearly dummy
variables, or deficiencies in the co~t index employed,t7 could account for
the~e results The yearly dummy variables suggest steadily r~ing co~ts
between 1976 and 1982, wlth 1984 cost levels returnin_g to the approximate
level of 1980 (the "control" year m our model), a pattern wh{nh accords with
fuel price trends although It may be influenced by other factors as well. Use
nf ~gl~ co~t mrports appears to substantialJy increase total costs an airline
wlth one fourth of its departures originating from the three airports so
~den~’md would recur costs 20 percem greater than an mdenti~ airline
t SWhen stage length is not controUed for, the coefflclent is significamly lessthan umty. This reflects continued dominance of long-haul markets on thepart of large e.arr~ersi~Spec’iflcally, the index was based on numbers of employees rather than theamount of time worked.

22
wlth no such dep~rture~ 18 Fin~Jy, the esUmated stage length, load factor,
and capacity bruits all faU within reasonable bounds.|9
The coeffmmnts on the network varlables in specfflcatJoz~s I-B, C, and D ate
qmte low. With one exception (the number of points served m I-C), none
the coefficients are significant at the .05 level. Nor, on the basis of the F-
stalasIJcs, can the hypotheses that the network variables have no effect be
rejected. Thus, it appears that when stage length, capacity, and load factor
are controlled for, the degree of hubbing does not affect airline costs. The
apparent lack of cost saving when these variables are controUed for is not
too surprmmg in Light of the discussion of the last section, where it was
argued that the product~vlty etxhancement occurs as a resuR of the higher
load factors and/or larger aircraft On the other hand, it is notable that more
strongly hubbed airlines do not experience higher costs, controUing for
a~rcrsf~ size and load factor. If, as specuIat~d above, the temporal
concentration of operations at hub airports causes inefficient resource
utktJzat~on, hlgher costs would be expected to result. Our results give no
mdtcatlon of this effect.
18Assuming a coefficient of 0.7: exp(0.71,~)- 1.I 9. The one=fourth figurerepresents the largest proportion of departures from Otese a3rports found inour data Th~s is a surprzsmgJy strong effect, whmh almost certainlyincludes more than the direct costs of delay, bm what other factors arerevolved is no~ immediately apparent.tgThe load factor estimate of -0.75, for example, is conszstent with theproportion of tot~J costs that are "traffic specific", such as ezpendEures forfood, service, and reservations and sales (BaJJey et at, 1985, p. 49). 198 I, such costs amounted to 22% of the total recurred by the trunk strImes.Thls would imply a load factor cost el~stlcity of -(Io00-0.22) or -0.78, quiteclose to our f~gure.

23
A much different plcture of the importance of hubbmg emerges when the
second set of specifications are considered When neither stage length,
capacity, or load factor are controlled for, estlmated coefhcients on network
variables increase markedly m magn/tude. In specification II-B, the number
of points on the network appears to significantly increase costs, while in II-C
and ll.-D increased concentration appears to have a substantial cost-reducing
effect (A strong negative correlation between the number of points and the
4-~port concentration and Herfindahl index may account for the results in
II-B.) In all three cases, F-tests justify rejectlon of the hypothesis that the
network variables do not affect costs Rather, ratlines with more
concentrated operatlons and/or serving fewer points seem to be significantly
more economical°
The in(~eased importance of the network variables in specification II reflects
the correlation between them and stage length, capacity, and load factor, as
shown in Table 6. To justify excluding these latter variables, one would have
to asst3me that this correlation reflects causahty: that longer stage lengths,
larger ~trcra/t, and I~gher load factors result from increased hubbing. We
have )~Iready argued that such causal relationships may exist between
hubb~ng and aircraft size and hubbing and load factor. It remains to be
considered whether a similar causal relationship could underly the
correi~t~on between hubbmg and stage length In fact, there is no apparent
bas~s l’or such a relationship. On the contrary, one would expect that
replacing direct, point-to-point service with hubbed service would decrease

stage-lengths.20 The positive correlzUo~ between stage |ength s.o.d
hubbJng suggested by our data is most Eke]y the result, not of a causaJ
relationship, bu~, rather of simultaneous c~anges in the degree of hubbing
and the type of routes served
Network StageVariable
Points Served -0°042
LoadFactor Capacity0.I 13 -0.068
l -AirportConcentration 0.3 I0 0.272 0.261
4-AirportConcentration 0.638 0.228 0.605
HerfindahlIndex 0.414 0.202 0.357
Note: Correlations based on Jog-tr~formed variables.
T~ts pattern is most pronounced m the experience of the locaJ service
carriers. With deregulation, carriers Eke Fron14er, Ozark, Pledmont, and
USAir, were ab|e to o~er service on long-haul routes for which they had
previously provided feeder service. In explo11Jng this opportumty, they
employed a strategy of establishing service on routes between a single
airport in their tradition~l service area and distant points. USAir, for
example, began to offer service between Pittsburgh and severaJ cities m
a01ncreased hubbmg could resuE in longer average lengths between stops ifIt led to a reduction in hedgehoppmg. This would no~ effect our stage lengthvariable, however, because it Is based on enplanements A passenger isconsidered to be enplaned on a fhghl, only once, regardless of the number ofstops ~t makes

25
West ~md South. Likewise, Frontier, Ozark, and Piedmont established long
haul service out of Denver, St. Louts, and Charlotte, respectively. As a result,
local servlce passenger-miles on routes over 500 miles more than doubled
between 1978 and 198 I. 21 Table I documents the vast increase in the
concentration of departures among these carriers. The Herfmdahl indexes
for Ozark and Frontlet, for example, more than tripled between 1976 and
1984, while those for Piedmont and USAir nearly doubled.
Trunk carrier stage lengths, while not increasing as dramatically as those of
the Icx;als, have also edged upward since deregulation In this case, stage
length growth has been the result of exit from short-haul markets rather
than entry into long-haul ones. Eased restrictions on exit, joint-fare
requirements that tended to make short-haul routes less profitable, and
aircraft fleets better suited to long-haul service were the prlmary reasons
for this shift. Thus, the trunks’ route adjustments, like the locals’, involved
simult~aneous changes in route mix and route structure, creating the spurious
positive correlation between hubbing and stage length observed in our data.
As a consequence, stage length must be controlled for if the effects of
hubb~Lg on airline costs are to be accurately assessed. The second set of
cost function speciflcatlons, by excluding a stage length variable, attribute to
network variables effects that are largely the result of changes in service
offerings. This motivates the third set of cost function specifications, in
whJch stage length is controlled for, but load factor and capacity are not.
21Bailey, Graham, and Kaplan, p.75.

26
In th~s set, as m the [trst, the estimated coefficients on the network variables
are very low The magmtude of each of these coefficients is exceeded by its
standard error, and F-statistics are extremely low. It therefore appears that
the entire effect attributed to network variables in the second set of
specifications is actu~y the result of service ch_~n_~ges which occurred
simultaneously with, but independently of, increased hubbing.22 Just as
hubbmg doesn’t increase costs, controlling for load factor and capacity, so
also does i~. fall to decrease costs when these potentially mediating variables
are not controlled for.
Conclusions
Our results suggest that the productivity effects of hubbJ~ are not directly
manifested in ~Jxline cost levels. When other relevant veriables are
controlled for, airhnes with strongly hubbed route systems incur roughly the
same cost to provide a given amount of tr~sportation as those with less
hubbed systems. This finding, although succ~ctly stated, has ambiguous
tmplicatlons for the actu~J relationship between productivity and hubbing.
The interpretation depends in large part on the nature of the process
underlying the trend toward increased hubbin_~g.
Tha~ trend can be understood in two disth~ct ways. In the first, a hubbed
network Is opposed to a linear one. Thus, increased hubbing implies the
substitution of two-Hight servlce, with a change at a hub airport, for one-
flight (although perhaps multiple-stop), direct, service. This in turn implies
22S~milarly, the correlations between hubbmg and load factor and betweenhubbing and capacity shown in Table 6 apparently result from each of thesevarmbies being correlated wlth stage length.

27
an met"ease in cn~cutty and decrease in stage lengths, as well as possible
increases in service frequency, ~h’craft size, and load factor. Our study
looked: for, and failed to fred, cost saving effects deriving from increases in
the latter two of these variables.
In the second interpretation, hubbing is seen as a consequence of increased
vertic~ integration of trunk and feeder services by individual airlines. For
local carriers, tb~s means an expansion into long haul markets to which they
had previously provided feed, while for trunks it implies increased self-
feeding. These changes effect the route structures and operations of
individual airlines, and lead to increased availability of single-line service.
They do not, however, imply change of the overall route structure.
These differing conceptions of the hubbing process suggest different
mterpretatlons of our results. If increased hubbing is viewed in terms of a
shift from linear networks, our results would imply that that hubbin~ entails
higher" costs as a result of increased circuity and shorter stage lengths. These
effects are not seen directly because our cost functions control for sta~e
length and don’t take circuity into account. But insofar as our results give
no indication of cost savings, they strongly suggest that hubbing would have
a net cost-increasing effect if its circuity and stage-length implications were
consldered.
This would not necessarily mean that hubbing reduces productivity, for we
have also failed ~.o control for variations m service frequency and market
density in our analysts. It is therefore possible that the airlines with

strongly hubbed networks
convenlent servlce, or both.a3
~so serve thinner markets, provide more
28
If hubbing is seen as a process of vertic~ integration of trunk and feeder
services, our results take a different significance. In this case, they simph/
imply that vertica/ integration has not significantly effected the cost
efficiency of the air~e industry. Insofar as such inte~ation improves
service by faci~tali~ connections, and without entailing addltional costs, it
would appear to be a desirable strategy. Of particular note in this regard is
our finding that hubb~ does not s’~t~J_ricantly increase costs when stage
length, capacity, and load factor are controJJed for. This suggests that the
efficiency losses stemming from banked schedules are either not very great,
or are not internalized by airlines with strongly hubbed networks.
Our investigation does no~,, therefore, yield definitive conclusions, but it does
clarify some important issues. The most important concerns the nature of
the hubbing process. Does it imply a fundamenta/cha~e in the structure of
airline networks, or is it merely the result of increased integration of tru~
and feeder, or (more likely) does it involve both of these? A related issue
pertains to the approprlate level at which to study the effects of hubbing. Is
it vatid to use the mdrvidua~ airhne as the unJ~ of analysis in such an inquiry,
or must one conslder the industry as a whole? Finally, the ambiguity of our
results demonstrates a critica/need to refine our concept of air)ine "output."
The significance of a mile of air travel depends upon circuity of route,
convenience of schedule and connections, and density of market. These
factors must be accounted for before airline productivity, or any connections
between this and other variables, can be adequately assessed

29
References
Bailey, F.lizabeth, Davld R. Graham, and Daniel P. Kaplan, Deregulating theAirlines (Cambridge MAr MIT Press, 1985).
Caves, Douglas, Laurits Christenson, and W. Erwin Diewart, "Multilateral,Comparisons of Output, Input, and Productivity Using Superlative IndexNumbers," BconomicJournal, 92 (March 1982), pp. 73=86.
Caves, Douglas, Laurits Christensen, and Michael Tretheway, "ProductivityPerformance of U~S Trunk and Local Service Airlines in the Era ofDeregulation," Economlc Inquiry, XXI (July 1983), pp. 312-324.
deNeufville, Richard, and Steve Gordon, ’Design of Air TransportationNetworks," Transportation Research, 7, 3, PP. 207-222.
Douglas,, G.W. and J.C. Miller, Bconomic Regulation ofDomestic AirTransport: Theory and Policy(Washington D~ The Brookings Institute:1974).
Ghobrial, Atef, Analysis of the Air Network Structure: The HubbingPhenomenon, (Berkeley CA: ITS Dissertation DS-83-2).
Kanafa~i, Adib and Atef Ghobrial, "Airline Hubbing: Some Implications forAzrport Economics" (Berkeley CA: ITS Working Paper WP-84-5, 1984).
Kanaf~i, Adib and Atef Ghobrial, "Aircraft Evaluation in Air NetworkPLanning," Transportation Engineering Journal, ASCE 108, TE3, pp. 282-300.
Tretheway, Michael, Productivity Grovth and Returns to Scale in theU.S. Trunk Airline Industry, 1972-1978, (unpublished Ph.D.Dissertation, University of Wisconsm-Madison, 1981 ).
U~S. Cavil Aeronautlcs Board, Report to Congress on ImDlementation ofthe Provisions of the Airline Deregulation Act of 1978, (WashingtonDC C~vtl Aeronautlcs Board, 1984).


![Performance Measurement and Management · number of units in stock and hub reference [Braithwaite, Samakh 1998, p. 79]. The second of master groups is operating costs, which is required](https://img.dokumen.tips/doc/110x75/5f0ba90b7e708231d4319875/performance-measurement-and-management-number-of-units-in-stock-and-hub-reference.jpg)