Embed Size (px)
Citation preview

r-I 'AL 91~r14 Pt.. a -a I.- ¢. • g .. flt 4. 4 m .& , .
HTY1FJCATION O" 0COMPON~~~
"01S~ IA SSOCIATED WiTH AiVMý1A GES IN FREEZE DRIED CHICKEN
AND PORK DURING STORAGE
W. E*Townsndd•: ... ,:• •q;•AJ(AIKose
SE. W alker .
Richard 8. Russell AgricultualResearch Center
us oepartment 'of A-g'cuture"Athens' Georqia
STSOL 75-113
June 1978
Best Available Copy ~~Lbrtr
FE

UNCLASS IFIED ______
SECURITYd[L IFICATION OF THIS PAGE (When Dag. Entered)
REPORT DOCUMAENTATION PAGE ____________________
2. GOVT ACCESSION No. 3. RECIPIENT'S CATALOG NUMBER
44. Ti'Ltdu6..-J- P QL mmn ~EEP ENTIFICATION OF., MPONENTS OR ACTIONS TechnicalASSOCIATED WITH DVRS MAGf EEZEQRIED C'4ICKEN U'PORKi DRN TORGg E. ~ PERFORING ORG. REPORT NUMBER
- . CONTRACT OR GRANT NUMISER(.)
WL wer pCM1-STSNL -75-1 13 1G.r./Wnkerd
9 nrowva OAGANIZATION AltM AND ADDRESS 10. PROGRAM ELEMENT. PROJECT. TASKt R~chard B. Rusei 1 Agricultural Research Center AE OKUI UBRUnited States Departmient of Agriculture AH 9908029 AF 3-12Athens, Georgia _______________ _____________
It. CONTROLt.INO OPFIZ-t NAMJE AND ADDRESSj US AmWn Natic'4 Research & Development Conunan 'J JunVM7 .1
Natic'.., M~assachusetts 01760 C1'3- NUMBER OF PAOGES
14. MtAIYORIiG -AGENCY NAME &ADORE Wit 40110MI ftrn CNMaIJIihA OfficeO) IS- SECURITY CLASS. (of ALV bpean)
UNCLASSIFIEDIlls. DECL ASSI F1CATION/ DOWN GRADING
19. DIVRIBUTION STATEMENT (of*) i.AWN0t
Ap.proved for public reloase; distribution unlimited.
17. CMSTRIUSUT104 STATEMENT (*t the .hsoe"uc ingWe to Stok A0 It EU.,mat kef ARap) H
III. SUPPI.EAWMARY MOTLtS
to. KEtY UCROS (CWA~fm. solo",."t. 4Iit a"""" 4d Ietfst0' IV *4WA MP.We)
FOOD(S) PRECOOKED FOODS DETERIORATIONFREEZE DRI1ED FOODS STORAGE STABILITY STORAGE DETERIORATION ElCHICKEN STORAGE SENSES (PHYSIOLOGY) NPORK STABILITY TEMPERATURE
A1011IT"AC" rcama -"ft sof ff nevm Mu #&"#& bp 6"Ch e )
'Reported are the procedures and results of a six-month storage stabilitystudy, the objective of which was to further define and correlate the majurphysical, chemical. and sensory changes which occur during the storagedeterioration of pr-ecooked, diced, freeze-dried chicken, and raw and pre-cooked sliced freeze-dried pork under very low oxygen and moisture conditions.Physical, chemical, and sensory changes were determined in cooked diced
DO~,. 3 K~SOUO'dOV5S&O.ETSUNCLASSIFIED -
"SEG)nTY CIL&3UVIC&T10,1 Of TH#S PA44 (MM 00* SM 0
It' 1%f
UNCLASSIFIEDSECURITY CLASSIFICATION OF TH3$ PAOE(I%-, DEate Ene"d)
20. Abstract Continued
chicken, and raw and cooked sliced pork that were freeze-dried toresidual moisture levels of less thao 2% and stored in sealed tin cansunder nitrogen at -40, 28, 38 and 48 C for 1, 3, and 6 months,.
Analysis of headspace gas confirmed the absence of oxygen and no carbondioxide developed during storage. There were no appreciable changes inresidual moisture content of any of the products during the six-monthstorage period. Level of glucose decreased with increasing temperatureand time of storage. Lactic acid content was 50-to 100-fold that ofglucose on a molal basis and exgerienced no detectable change over sixmonths at temperatures up to 48 C. No appreciable change in the levelof e-amino nitrogen was apparent. Reducing substances, expressed asascorbic acid, increased with increasing temperature and time of storage.
There were no marked changes in percent rehydration due to storagetemperature and time for cooked diced chicken, raw and cooked sliced pork.
The decrease in Hunter L values (lightness) of cooked chicken, raw andcooked pork agree with the visual observations of darkening made by thepanelists.
Sensory evaluation of the differences between control samples at -400Cand samples at the three experimental temperatures, by triangle tests,revealed detectable deter oration in couked chicken at 48 C for I monthand thereafter; and at 38 C for three months and thereafter. For rawpork, there was significart deterioration at 38 and 48 C at three monthsand thereafter. For cooked pork, there was significant deterioration at1, 3, and 6 months for all three tempe-atures.
A corollary experiment showed that the use of polyphosphates with sal'increased the water pick-up by abott 8 percent and the cooked yield basedon the original unsoaked weight was 13 percent higher du, to the poly-phosphate treatment, Also observed was a substantial increase in the ashcontent that could not be accounted for entirely as increases in phosphateplus salt.
UNCLASSIFIEDISCURITY CLAIIVICATIOM OF TWIS PAOGEIM Oarf* RAr*
'~-I-Is _______________________1____6_
PREFACE
•In 1�4 Project Order STSNL 75-113 was issued to the Animal Products Util-ization and Marketing Research Laboratory, Richard B. Russcll Agricultural ResearchCenter, Agricultural Research Service, United States Department. of Agriculture,Athens, Georgia for the purpose of identify-ing components of fractions that areassociated with adverse changes during storage in freeze-drieci chicken and pork.This report includes the procedures for preparation and analysis and the chemicalphysical and sensory changes in freeze-dried chicken and pork during high temper-ao
-rature, oxygen-free storage.
This effort was undertaken as part of the U.S. Air Force requirements 3-12"Identify Components of Post Mortem Muscle which Affect Rehydrated, Stored,Freeze Dried Meat."
An addendum reports the results of a corollary experiment in which chickenbreast meat was soaked in a salt/phosphate solution, then cooked and freeze-dried. The purpose of the experiment was to determine the effect of the saltphosphate treatment on rehydration.
Dr. Arthur J. Mercuri, Chief, Animal Products Utilization and MarketingResearch Laboratory served as Project Lj.ader, with Fir. A. A. Klose and Dr. W.
E. Townsend, Frincipal investigators, and Ms. Brenda Lyon, Technician. Dr.Maxwell C. Brockmann and Mr. Justin M. Tuomy served as Project Officers, and Dr.Larry Hinnergardt as Alternate Project Officer for the U.S. Army Natick Researchand Development Command.
1A
"F UI
Ll

TABLE OF CONTENTS
Preface
List of' Tables 5
Introduction 7
Mat erials and Methods 9
Resul.ts and Discussion 13
Conclusions 20
References 21
Addendum: The Effect of 3oaking Chicken Breasts in Salt/ 24
Phosphate Solutions on Improving Rehydration
Si •i ..... 3

LIST OF TABLES
Page
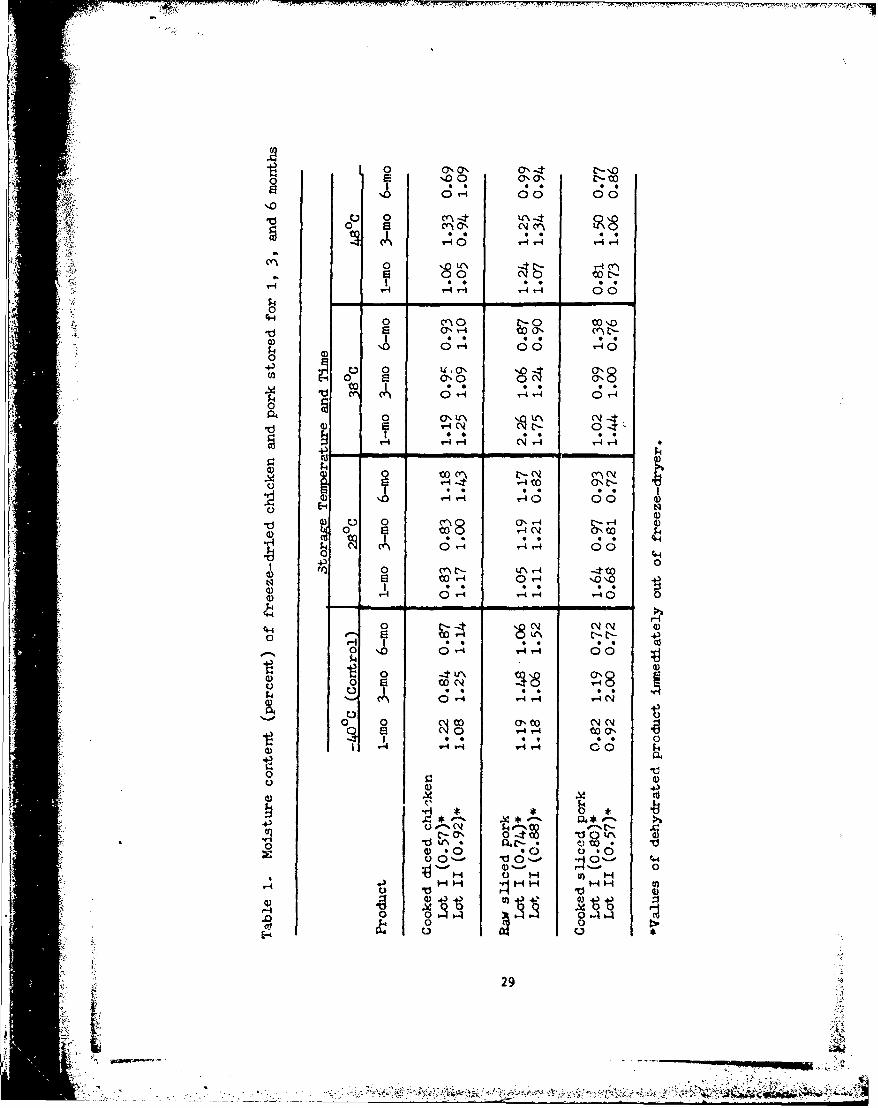
1. Moisture content (percent) of freeze-dried chicken and pork 29stored for 1, 3, and 6 months.
2. Glucose content (mg/lOO g dry product) of freeze-dried chicken 30and pork stored for 1, 3, and 6 months.
3. Lactic acid content (mg/gm dry product) of freeze-dried chicken 31and pork stored for 1, 3, and 6 months.
4. Famiio nitrogen content (millimoles/ gram dry weight) of freeze- 32dried chicken and pork stored for 1, 3, and 6 months.
5. Reducing substances, asp g equivalent ascorbic acid per gram 33dry product, of freeze-cried chicken and pork stored for 1, 3,and 6 months.
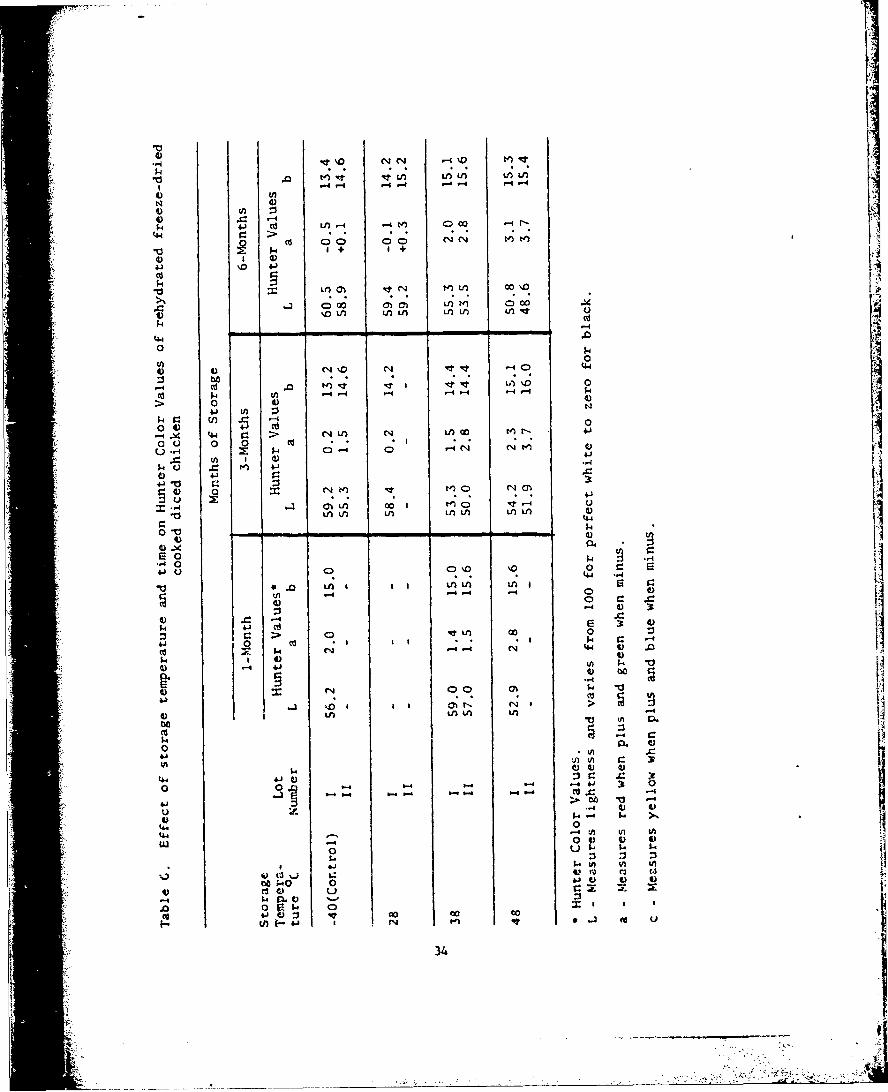
6. Effect of storage temperature and time on Hunter Color Values 34of rehydrated freeze-dried cooked, diced chicken.
7. Effect of storage temperature and time on Hunter Color Values 35of rehydrated freeze-dried sliced raw pork.
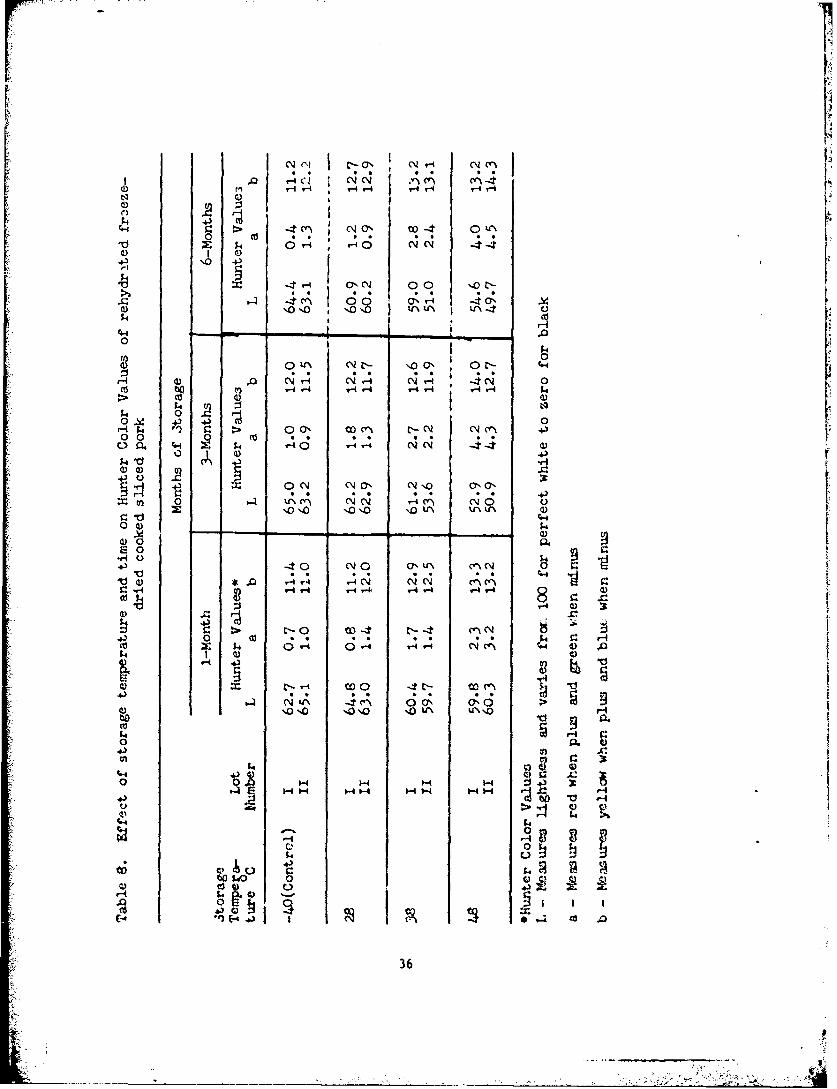
8. Effect of storage temperature and time on Hunter Color Values 36of rehydrated freeze-dried cooked sliced pork.
9. Effect of storage time and temperature on (percent) rehydration 37of freeze-dried chicken and pork.
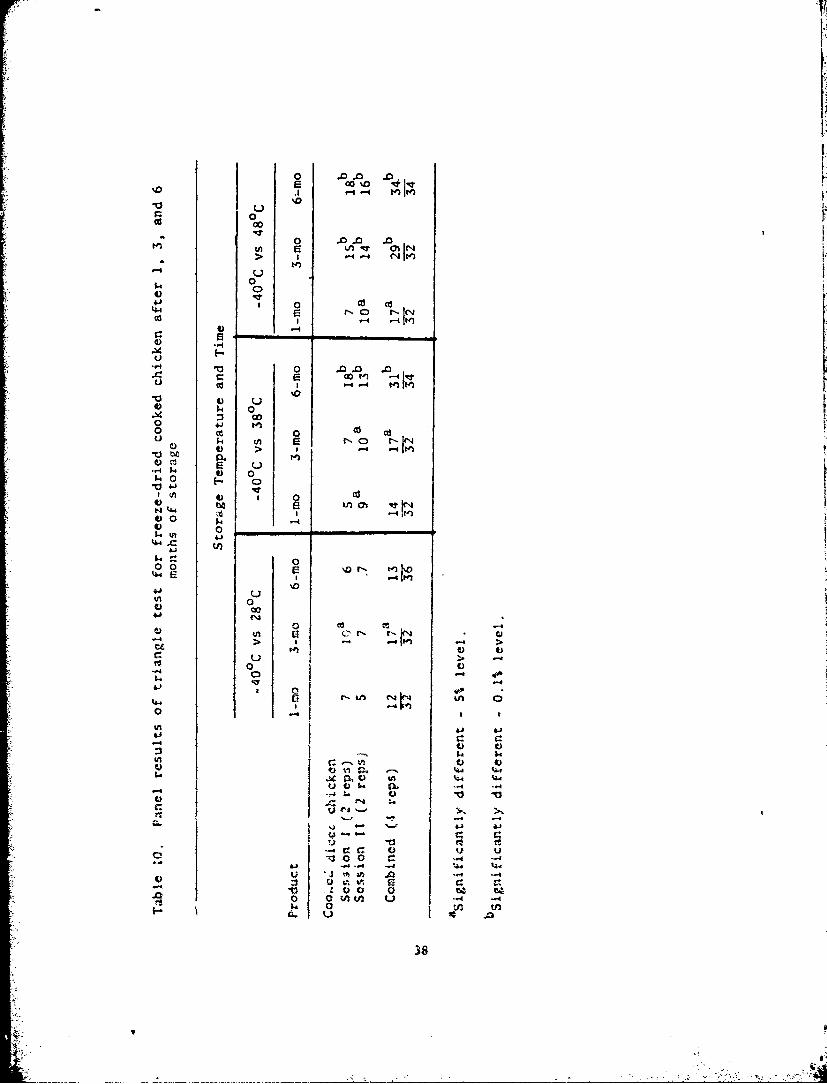
10. Panel results of triangle test for freeze-dried cooked chicken 38after 1, 3, and 6 months of storage.
11. Mean scores mid differences, and significance of differences 39between paired scores for freeze-dried cooked chicken after 6months of storage.
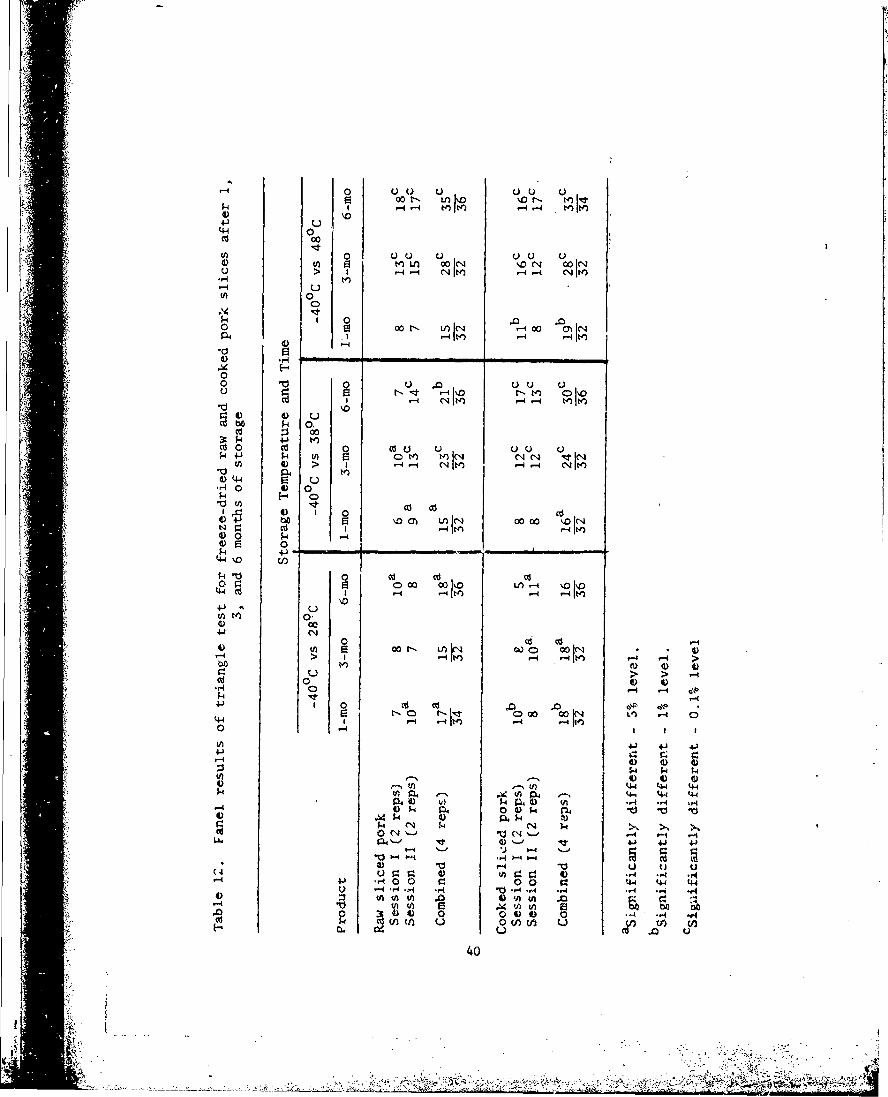
12. Panel results of triangle test for freeze-dried raw and 0cooked pork slices after 1, 3, and 6 months of storage.
13. 1ewi scores and differences, and significance of difference 41between paired scores for f.eeze-dried raw pork slicesafter 6 months of storage.
htrCWIMd PArA UAINI4T flAW

r
LI 3T OF TAB13 (Cont' d)
Page
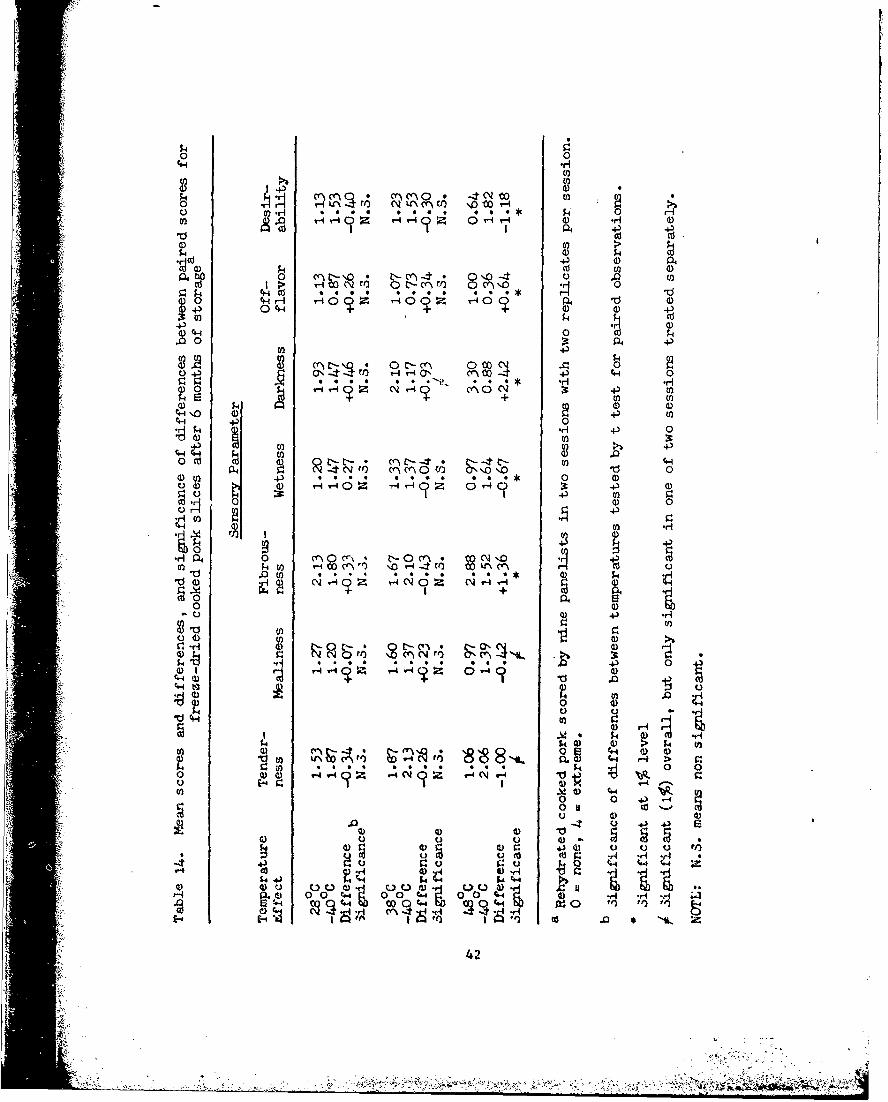
14. Mean scores and differences, and significance of difference 42between paired scores for freeze-dried cooked pork slices 42
after 6 months of storage.
15. Effect of phosphate-salt treatment on moisture pick-up, 43cooked yield and rehydration. 4
16. Mineral content of freeze dried products. 44
I5
I
iW
2:1
.1•. . . .. :
17
IDENTIFICATION OF COMPONITS OR FRACTIONS ASSOCIATED WITH ADVtM CHANGES INFREEZE DRIED CHICKEN AND PORK DURING 3TOUAGE
INTRODUCTION
A wide variety of freeze-dried foodstuffs is available for procurementby the Armed Services, and/or civilian cornumers. Complete meals can now beserved using dehydrated foods only. Many of these products rehydrate quicklyand, when cooked using conventional large or small scale equipment, are dif-ficult to distinguish from fresh or frozen foods.
However, despite all of the advantages of freeze-drying (reduction inweight, inhibition of bacteria, savings in storage and transportation), andthe fact that freeze-dried meat products initially possess a number of idealquality characteristics, initial rehydration and texture are often ..nadequate,and deteriora.tion may occur during subsequent storage.
Sumerous publications (Regier and Tappel, 1956a; 1 arper and Tappel,1957; Tappel et al., 1957 and Ballantyne et al., 1958") have describedthe effects of freezm-drying of meat and poultry on quality and stability.Tappel et al. (1957) reported that precooked freeze-dried poultry rehydratedpoorly, was tougher and had a drier texture6than the control meat. Similarresults were reported by Bele et al. (1966) in their study on the effect offreeze-drying on the quality of cooked and raw breast and thigh meat.
Regier, L. W. and A. L. Tappel. Freeze-dried meat. III. Non-oxidativedeterioration of freeze-dried beef. Food Res. 21: 630 (1956a).
2 Harper, J. C. and A. L. Tappel. Freeze-drying of food products. Adv. in
Food Res. 7: 220 (1957).
Tappel, A. L., lR.Maortin, and E. Plocher. Freeze-dried meat. V. Prepara-tlon, properties, and storage stability of precooked freeze-dried meats,poultry, and seafoods. Food Technol. 11: 599 (1957).-
Ballantyne, R. M., C. Brynko, A. J. Ducker, and W. R. Smithies. Dehy-drated cooked meat products. Food Techmol. 12: 398 (1958).
5 See footnote 3
Bele, L. M., H. H. Palm-r, A. A. Klose, and T. F. Irmiter. Evaluation; of
objective methods of measuring differences in texture of freeze-driedchicken meat. J. Food Sci. 31: 791 (1966).
7
1 I~i iiii 1 .
According to Tuomy and Felder (1964),7 freeze-dried cooked sliced porkwas considered for inclusion in military operational rations, but its usewas questioned because of t ougnness and lack of a typical cooked pork flavor.They also reported that bot4 cooked and raw freeze-dried pork were sensitiveto browning. Sharp (1957a) stated that browning was due to the Maillardreaction, involving r~ducing sugars, protein, and amino acid constituents,Thomson et al. (1962) stated that browning reactions can account for allof the undesirable characteristics observed during the storage of freeze-driedmeats, with the exception of the development of rancidity.
Dehydrated meat and poultry with good storage stability and high accept-ability after rehydrating and cooking are needed by the military and wouldhave many civilian uses. As a step toward achieving such products, it wasthe purpose of this research to further define and correlate the major physical,
chemical, and sensory changes which occur during the storage deteriorationof precooked, diced, freeze-dried chicken, and raw and precooked slicedfreeze-dried pork under very low oxygen and moisture conditions.
7 Tuoy, J. M. and J. Felder. Effect of processing temperatures and cookingmethods on the quality of freeze-dried pork. Food Technol. 18. 135 (1964).
Sharp, J. G. Deterioration of dehydrated meat during storage. I. Non-
enzymic deterioration in absence of oxygen at tropical temperatures. J.ici. Food Agric. 8: !4 (1957a).
Thomson, J. S., J. B. Fox, jr. and W. A. Landn!nan. The effect of waterand temperature on the deterioration of freeze-dried beef during storage.Food Technol. 16: 131 (1962).
8
si
MATERIALS AND METHODS
Preparation and freeze drying of product
Chicken. Freshly slaughtered commercial whole broiler breasts packed in0ice were purchased from a local poultry plans. The breasts were cooked in 88 Cwater to an internal temperature of about 77 C, chilled in ice overnight,deboned, tempered to about -3 G md diced to 1.25 x 1.25 x 0.9-cm size withthe largest surface area perpendicular to the direction of the fibers.
Raw and Cooked Pork. Fresh, bone-in loins having normal quality werepurchased at a local meat packing plant and returned to the laboratory forfurther procesting. The longissimus muscle was trimmed of excessive fat, Ltempered to -3 C and sliced in 1-cm thick slices perpendicular to fiber direc-tion. For cooked pork, the trimmed longissimu3 muscle was stuffed in amoisture proof fibrous casing, cooked in 88C water to an internal temper-ature of 77 0 C, chilled overnight at 2.0 C and sliced in 3-me thick slicesperpendicular to fiber direction.
Representative samples of the three types of product were removed forinitial moisture analyses. All products were 8laced on stainless steeltrays and frozen in a blast freezer set at -40 C.
Two lots of each product (22-27 kg) were freeze-dried in a Vacudyne PilotFreeze-Dryer (Model VPFD-CX). operating at a pressure of less than 600 microns.Heat was applied to the dryeS trays by direct platen contact, with the platentemperature maintained at 47 C throughout the sublimation process. Forty toforty-four hours of drying were sufficient to yield a product with less than2% moisture. Upon completion of drying, the chamber vacuum was released withhigh purity nitrogen, and sa mples of dried product were quickly removed fordeterid-nation of residual moisture.
PlckaRing and stor.Ay
A standard amount (1480 &rarm diced chicken; 520 gm of raw or coooedpork) of the dried product froct each lot was weighed into N~o. 10 tin cans.Cans were sealed with a Rooney Semiautomatic Can Sealer", after evacuationand fluthing three times with high purity nitrogen. To inavre a zero oygoenatmoupherej the cans were punctured, placed in a desiccator oM evacuited mndflushed with nitroVn three times. Cans were resealed with solder end checkedfor leaks by sub.erging the cmns in water under vacuuint. The car* were r'ndomlydivided into groupM for stor 'e at varioww terperatures. Test saqnls uerestored at 28 C; 38 C, and 48 C. Contrgl or reference sanpies were packedin a similar manner, and stored at -40 C. A rand."ly selected can fro- eachlot at each storage tetperature ww opened for apnlysis after 1, 3, and 6month3 of sturege.
•Vacudymte Corp., 375 East Jco Orr Road, Chicago HPeA ta, IL 60411."#Roaney Machine Co., 423 Baypide Road, Bellingham, WA 98-115.
9
r
Analytical Methods
All chemical analyses and physical measurements were performed in dupli-cate or triplicate. Moisture content of raw, cookq, and freeze-dried productwas determined using standard AOAC methods (1955).
Glucose was extracted from the freeze-dried ýyoduct according to theprocedure described by Hendrickson et al. (1955), and the content of glucosedetermined by a modificati?ý of the glucose-oxidase method as described byFleming and Pegler (1963).
Lactic acid was determined using the procedure descr4bed in 3igma Tech-nical Bulletin No. 826-UV, Sigma Chemical Company (1974). This method isbased on the enzymatic oxidation of lactic acid to pyruvic acid mediated byMAD and LDH.
Content of E-amino nitrogen groups was determined by the trinitroben-zene sfifonic acid (TNB3) method for available }•sine (Kakade and Liener,1969), as used by Ousterhout and Wood (1970). Modifications were madein the procedure to accommodate a smaller sample size. V
10-AOAC. Offi:ial Methods of Analysis, 10th Edition, Association of OfficialAgricultural Chemists, Washington, DC (1965).
1lHendric-son, R. L., D. ý. Brady, C. W. Guhrke, and R. F. Brooks. Dehy-drated pork studies: Removal of glucose by yeast fermentation. FoodTechmol. 9: 290 (1955).
12 Fleming, I. E. and H. F. Pegler. The determination of glucose in the pre.-ence of maltose and isomaltose by a stable, specific eozymic reage.t.Analyst 88- 967 (1963).
"AnorVnyous. Tho quantitative determination of pyruvic acid and lactic acid.
.3igma Techmical Bulletin No. 7Z6 - UV/No. 826-UVl. Sigma Cheical Coc'pany,
.3t. Louis (197).
"Ickado, H. L. and I. E. Lioenar. Datermination of available lyvinc ir. pro-teira. Ainaltical Biochew. 27: 27: (1969).
15Oraterhout, L. K. a-nd S. 1l. Wood. Avai'Lable lysine in fish rmals:(TIS) method comped with a chick asaay. Poultry Sci. 09: 1423 (Abstract)
*i.

Reducing substances, expressed as ascorbic acid, wereg.letermined by amodification of the method of Loeffler and Ponting (1942).l Reducing sub-stances were extra-ted from the product by mixing 0.5 g of ground freeze-dried meat with 10 ml of 1% metaphosphoric acid and centrifuging the result-ant slurry. The reduction of a standard 2,6-dichlorophenolindophenol dyesolution by an aliquot of the extract was determined quantitatively andcalculated as an equivalent amount of ascorbic acid, a typical reductone.
Analysis of headspace gas of each can was made just prior to opening thecans of stored product for sensory evaluation. Samples were taken and pres-sures were determined with a Beckmail Headspace Sampler.* Oxygen and carbondioxide content of headspace gas were determined by standard Orsat procedures.
Surface color reflectance values were determined with the Hunter Colorand Color Difference Meter (D-25-D)** equipped with a 5-cm circular pc t.Shortly after opening the cans of stored products for sensory evaluation,representative samples of the product were rehydrated in an excess of water(chicken at 100 C for 20 minutes; raw pork at 38 0C for 20 minutes; and cookedpork at 94 C for 20 minutes) drained for 5 minutes and the reflectance valuesdetermined using the Hunter Meter.
Rehydration and preparation of samples for sensory evaluation
Approximately 750 ml of distilled water was brought to a boil, 100 g dryfreeze-dried chicken were added, and heat reduced so that the water was boil-ing slowly. After 20 minutes, water was poured off and chicken allowed todrain and cool 5 minutes before weighing. Approximately 18 g of the rehydratedsamples was used as an individual portion for sensory tests.
Slices of raw pork were rehydrated in water (28-38 0 C) for 20-25 minutes,drained, wgighed, and grilled 2 minutes on each side in electric skilletsset at 193 C. Cooking oil (100 ml) was used to coat the skillets. Sliceswere cut into pieces approximately 2.5 cm square. A test portion consistedof 2 to 3 squares.
Slices of cooked freeze-dried pork were rehydrated in water at 94-100 0C
.1or 20-25 minutes, turning once after 10 minutes. Slices were cut into
* * Beckman Instruments, Inc., 2500 Harbor Blvd, FR1lerton, CA 92634.
**Hun+,er Associates Laboratorias, Inc., 9529 Lee Highway, Fairfax, VA 22030.
16* 1Loeffler, H. J. and J. D. Ponting. Ascorbic Acid - Rapid determination infresh, frozen, or dehydrated fruits and vegetables. Ind. and Eng. Chem.Anal. Ed. 14: 846 (1942).
11
V
6-~

pieces approximately 2.5 cm square. Test portion consisted of 2 to 3 squares.
Percent rehydration (gross rehydrated weight as a percentage of thegross initial weight before freeze-drying) was calculated from the data ob-tained during reconstitution of the product for sensory evaluation and frommoisture contents before and after freeze-drying. Percent rehydrat n wascalculated according to the formula used by Osman and Morse (1960), whichincluded a correction for the moisture content of the freeze-dried product.
Sensory Evaluation
The triangle test with categorical basis for selection was used to deter-mine if there were differences in the freeze-dried products stored at threetemperatures compared to the control sample stored at -40 0C. A number ofpanelists participated in orientation and screening sessions using productssimilar to the ones to be tested. On the basis of performance in selectingthe odd sample (i.e. at least 70% accurate), 8 panelists and 2 alternateswere chosen to participate as descriminating panelists in evaluating testproducts after 1, 3, and 6 monthr storage. Panelists evaluated two sets ofsamples at each session, with 2 3 r-s being held each day (4 reps).
For the 1- and 3-month storage samples, triangle tests combined with adescriptive term (appearance, texture, juiciness, et..) werti used as a basis
for selection and characterization of the odd sample. For the 6-month stor-age samples, triangle tests combined wi'h scoring of seven parameters wereused to evaluate effects of storage temperature and time. For each set ofsamples, panelists selected the odd sample and then scored the odd sampleand same samples for tenderness, mealiness, fibrousness, wetness, darkness,off-flavor and desirability, using an intensity scale from 0 (none or notapplicablej to 4 (extremely). Scoring data were recorded and then analyzedby the "t" test for paired observations only for the panelists who correctlyidentified the odd-sample. Triangle test Mta were interpreted from thetables of Roessler (Amerine et al., 1965).
17 Osman, 0. A. H. and R. E. Morse. Preparation and storage characteristicsof freeze dried sausages. I. Formulation and processing of comminutedsausages (frankfurters). Food Technol. 14: 37 (Abstract) (1960).
1Amerine, M. A., R. M. Pangborn, and E. P. Roessler. Principles of SensoryEvaluation of Foods. Academic Press, New York 602 pp. (1Q65).

RESULTS & DISCUS3ION
Headspace Gas Analysis
Within the accuracy of the Ors at apparatus (0O.2%), no carbon dioxide oroxygen could be detected in the headspace of any of the cans of product for allstorage temperatures and storage times. The zero oxygen level in the headspaceconfirmed the adequacy of nitrogen packing and can tightness. The lack ofcarbon %oxide production in our study is in contrast to the results of Sharp(1957a) who noted production of carbon dioxide in freeze-dried precooked pork20stored in nitrogen at high relative hum~idities, and as reported by Hodge (1953)in a review of browning reactions in model systems. The lack of carbon dioxidmproduction may have been due to thu Low residual moisture content or otherconditions that inhibited the Strecker degradation; i.e. conversion of £-aminoacids to aldehydes containing one less carbon, with the liberation of carbondioxide.
Residual Moisture ContentThe average residual moisture coitent of the three types of freeze-dried
products is shown in Table 1. There were no appreciable changes in residualmoisture content during the 6-month storage period. Before freeze-drying,cooked chicken contained 72.7% moisture, raw pork 69.9% moisture, and cookedpork 63.3% moisture. The mean residual moisture content of the six lots offreeze-dried product, immediately after removal from the freeze drier, was0.75% with a range frou, 0.57 to 0.92. The mean moisture content of all pro-ducts taken from cans over the 6 month period was 1.09%, with a standa.-ddeviation of 0.29. In only one instance (raw pork, Lot 1, 38 C storage for 1month) did this absorption result in a product moisture level greater than2.0%. Apparently the products absorbed a small amount of atmaspheric moisturein transfer from drier to can. The increase cannot be explained on the basisof the water formed from the hypothetical loss of 3 moles of water per moleof glucose degraded, because this would contribute less than 0.03% watercontent, at a maximum.
Glucose Content
3ubstantial, increasing losses of glucose (Table 2) occurred withincreasing temperatures and time of storage for cooked chicken, raw and
See footnote 8
2Hodge, J. E. Dehydrated fcods chemistr-y of browrdng reactiors in modelsystems. J. Agric. Food Chem. 1: 928 (1953).
13
70..
I k=
0CC.)ked por", with little or none remaining after 6 ugnths at 48 C. Morerapid losses of glucose were noted by Sharp, (1957a)" in samples of dlehy-d -ated ccokece perkt bint at much higher relative humidities than ours. Hereported an initial concertration of free fermentable sugar in samples of(1,hydrat~ed cooked pork equilibrated 8t 60% Rh of 0.26% of which 0.18% wasglucose. After 60 dlays at 3R and 50 0, no fi'eo sugar cou:ld be detected inthe meat.
The rates of loss of glucose in the freeze-dried chick-en over the six-month storage period was used to calculate the temperature coefficient andcor-responding energy of activation. The loss of glucose over the six-monthperiod corresponded to first.-order reactions for the three experimental 3tor-enryo ciaino bu cJml.age temperatures. The temperature coefficient Q was 2.8, equivalent2 o an
enegyofactvaio ofabut20 kclml.Reg&~ and Tappiel (1956b)reported an apparent activation energy of 25 kcal/mole for the deteriorationoffreeze-dried beef during storage at several temperatures.
Glucose data for cooked ch '.cke and cooked pork were subjected to anal-ysi~s of variance; data for raw pork were not analyzed because of missing
kill.. data in the. critical t~rqjerature region. Food cooked chicken, all maineffects (temperature, time, lot) were hi6'ly significant (P 4 0.01), andinteractions were also signifir-mt. The import-ant effects were cbviously
temperature and the ýemroeratrure multiplied by 'he time intez action. Simi-lar results were obitained from an analysi.s of variance of the cooked porkdata, but with relatively less infl.uence of timfe.
Lacti,. Acid Content
The mean values for lactic acid content of freez.e-dried samples areshown in Table 3. The lactic acid content o.f £reez~e-dried samples wasessentially the same fo.- all temperature.- ard iength of sturage, as deter-mined by analysis of vrriance cf the experimental values. Dverall means,in mg lactic acid per gram of dry product, were 22.? for cooked chicken,28.8 for raw pork., And 21.4 fox, cooked pork. Thure was a significant dif-ferenice between the two lots of chickon, 20.3 versuts 25.2. The absence ofstorage related charges in lI.ctic acid cor~tent does not rille out its na~tic-
* ipatien in deteriorative reactioro~, because the mol,-1 evntent of lactic acice
21e footnote 8.
Regiar , L. W. and A. L. T&ppel. Fr-eeze dried m-!at. IV. Factors af fect.-* ~ing tt~e r~ito of deteric~ation. Food Rea. 21'- 64-0 (1956b).
14

is about 100 times the initial molal content of glucose, and small changes (sayless than 1%) in lactic acid would not be detected by the analytical method.The question of lactic acid involvement has been raised by Lewis et al. (1949)3I ~ who reported formation of brown pigments fropinteraction of glucose and nitro- •
gen-free hydroxy acids, and by Sharp (1957a) who found no effeqt on browningby additions of lactic acid to a mixture of insoluble pork protein and glucose.However, Sharp's tests were run at 60% relative humidity, which is quite atypi-cal and far removed from the much less than 5% relative humidity existing inour freeze-dried products.
E-Amino Nitrogen Content
The mean values for E-amino nitrogen content of the three types of freeze-dried samples are shown in Table 4. The £ -amino nitrogen content was from100 to 200 times the initial glucose content on a molal basis, and displayedno statistically significant differences due to storage temperature, storagetime, or lot. The overall mean S -amino nitrogen content under all conditionswas in millimoles per gram dry weight, 0.48 for cooked chicken, 0.45 for rawpork, and 0.42 for cooked pork. Due to the overwhelming proportion of S -aminonitrogen content to glucose, a l-to-- molal reaction between the two could havetaken place without being statistically detectable in changes in the • -aminonitrogen content.
Reducing Substances Expressed as Ascorbic Acid
Changes in the content of reducing substances, expressed as ug equiva-lents of ascorbic acid, a known reductone, are shown in Table 5. The datawere analyzed by analysis of variance. For freeze-dried chicken, level ofreducing substances increased significantly (P 4 0.01) as a function ofstorage temperature and time, and also differed significantly between lots.For raw freeze-dried pork slices, there were significant differences betweentemperature (P L 0.01) and between times (P 1. 0.05). For cooked pork, therewere significant differences between temperatures (P 4 0.01), times (P L0.01),lots (P 4. 0.05), and temperature by time interaction (P A. 0.01). The maximummolal content of reducing substances formed corresponds to 15-30% of initialmolal glucose content.
The development of reductone like reducing power is a well-ký3wncharacteristic of sugar-amine browning reactions (Stadtman, 1948). The
23 Lewis, V. M., W. B. Ebselen, Jr. and C. R. Fellers. Nitrogen-free carbo.Vlicacids in the browning reaction. Ind. Eng. Chem. 41: 2591 (1949).
Sefootnote 8.
2 53tadtman, E. R. Non-enzymatic browning in fruit products. Adv. in FoodRes. 325 (1948).
15
W&

structures of the reductones formed during sugar degradation are not knownwith certainty, and in orly a few model systems2,as the browning of reductoneswith amines been studied (Cocker et al., 1950). Therefore, it should be ofimportance to search for and quantitatve intermediates in the sugar-amLnebrowning reaction such as ketosamines, osones, and reductones.
Color Changes
The panel easily detected dar~ening in the 48°C samples of cooked chickenand cooked pork compared to the -40 C (Control) samples after one month. Afterthree months of storage, darkening was detected in the 38 C samples of allthree products, and in the 280C samples of raw pork after six months of stor-age. The reactions leading to color changes obviously had high 2emperaturecoefficients. These findings agree with those of Sharp (1957b) 2u who observedan increase in the development of brown discoloration with an increase in tem-peraturý8of storage. Similar observations were reported by Regier and Tappel(195 6 a) for beef stored at 35.5 and 54.40C.
Tables 6, 7, and 8 give the mean Hunter Color Values for cooked dicedchicken, raw sliced pork and cooked sliced pork, respectively. The decreasein L values (lightness) of cooked chicken and cooked pork agree with thevisual observations of darkening. For cooked chicken, effects of storage timeon L values were inconsistent, but definite decreases in L values with increas-ing storage temperature were observed at 3 and 6 months. For cooked pork,there were small but statistically significant (P 4. O.01) decreases in L valueswlith increases in either storage time or storage temperature. Differences inL values between lots were significant at the 5% level. For raw pork, there wasa small, statistically significant (P4 0.01) decrease in L value with increasein storage time, Differences in L values of raw pork between storage temperia-tures were significant (P4 0.01), but they were not simply explained, sincehighest values appear at the two intermediate temperatures. 4
The Hunter a, values, a measure of redness, exhibited much greater per-centage variation tian did the L values, with a range from 1 to 5. For cookedchicken, aL values increased with increase in storage temperature, and withincrease in storage time at 38 and 48 C storage temperatures. For cooked pork,-. 6
'2Cocker, W., R. A. Q. O'Meara, J. C. P. Schwartz, -nd E. R. Stuart. Thechemistriy of reductone. Part, II. $ome condensation producct- Qf redu~toncwith amino compounds. J. Chem. Soc. No. 420: 2052 (1950).
2Sharp. J. G. Deterioration of dehydrated meat during kic rage. II. Effec'of pH and temperature on browning changes in dehydrated aqueo"u e_-.racts.J. Science Food Agric. 8: 21 (1957b).
i28 Sjee foot~note 1. 1
- ..1

there was a significant (P 4 O.01) consistent large increase in aT values withincrease in temperature; in comparison, effects of storage time wlre small andinconsistent. For raw pork, there were significant differences in aT valuesbetween temperatures and between times, but the trends were not consitent,and so the overall meaning is questionable.
Hunter b values, a measure of yellowness, increased slightly but sig-nificantly with increases in storage temperature for all three products, andshowed essentially no change with increase in storage time.
Based on observations of the senior author, color of cooked diced chickenchanged from a pale pinkish tan to a dark yellowish tan. Similar changesoccurred in cooked pork. For raw pork, the color changed from a reddish tanto a reddish-brown tan.
"Rehydration
Rehydration values (percent rehydration based on gross rehydrated weightas a percentage of the gross initial weight) for cooked diced chicken, rawand cooked pork are given in Table 9. There was no significant change in per-cent rehydration of the freeze-dried products due to 3torage temperature ortime. The data show that precooked freeze-dried chicken and pork slices haverelativW poor rehydration charactyistics. According to Tawel et al.(1955), Harper and Tappel (1957), and Hamdy et al. (1959) poor rehydra-tion is one of the principal problems in fi ,ze-dried meats. In our study,percent rehydration ranged from 70.6 to 84.9% for chicken; 52.3 to 100% forraw pork slices, and 63.6 to 75.2% for cooked pork slices. In general, cookedpork sliceq rehydrated to a much lower level than raw pork slices. Tappel etal. (1957)_32 rehydrated precooked freeze-dried chicken thigh meat in a bouillon.
2 9Tappel, A. L., A. Conroy, M. R. Emnerson, L. W. Regier, and G. F. 3tewart.Freeze-dried vieat. I. Preparation and properties. Food Technol. 9: 401(1955).
See footnote 2.
.3 1famdy, M. K., V. R. Cahill, and F. E. Deatherage. Some observations on
the modification of freeze-dehydrated meat. Food Res. 24: 79 (1959).
S32 See footnote 3.
17___ 4Si.-

!ii
sodium chloride, sodium pyrophosphate solution and obtained a rehydrated watercontent that was 68% of the original water content before freeze-drying. Thisvalue converts to 76.8% in Osman units (gross rehydrated weight over originalweight before freeze-drying, times 100), which compares well with the valuesin Table 9 that we obtain• for precooked chicken breast meat without use ofsalts. Yao et al. (1956)31 reported for freeze-dried precoc''-Yd chicken breastmeat a value of 74% for the rehydration ratio defined as the ... cf waterabsorbed by the dehydrated sample to water lost by the sample during drying.
The relatively low rehydration values cannot be attribk4 ed to inferior
muscle fiber to surface orientation (Anglemier et al., 1960)'! because bothchicken dices and pork slices were cut with the fibers perpendicular to the
greatest surface, the optimum orientation for rehydration.
Sensory Evaluation
Upon opening of the cans for rehydration tests and ultimate panel eval-uation of the product, a stale and somewhat rancid odor was found to be char- Lacteristic of the samples stored at the higher temperatures. The intensityof these odors increased with storage time. Similar observations of off-odors were reported by Burigtt et al. (1955)35 for cooked freeze-dried pork;and Chipault et al. (1961)' for freeze-dried chicken.
Table 10 shows panel results of the triangle tests for cooked dicedfreeze-dried chicken. 3ensory evaluation of the differences between controlsamples at -40 C and samples at the three experimental temperatures revealeddetectable deterioration in the 480C samples at 1 month and thgreafter, andin the 38 C samples at 3 months and thereafter. The 38 9d 48 C samples wereless tender, more fibrous, darker,oand drier than the -40 C samples. 3ignifi-cant differentiation of 28 and -40 C samples was established at 3 months, butnot at I and 6 months, so an overall effect for 280C seems questionable.
Scores given by panelists who successfully differentiated the -40Ccontrols from exerimental temperature samples are suzmnarized and evaluated
33ao, A., A. I. Nelson, and M. P. Steinberg. Factors affecting the rateof chicken moat dehydration runder vacuum. Food Technol. 10: 145 (1956).
34Anglemicr, A. F., D. L. Crawford, and H. W. Schultz. Improving the sta-bility and acceptability of precooked freeze-dried ham. Food Tochnol.
14: 8 (1960).
35Burnett, H. C., C. W. Gehrke, and D. S. Brady. Volatile components ofp vacuum packed dehydrated pork. J. Agr. Food Chem. 3: 524 (1955).
%36Chipault, J. R., J. M. Hawkins, and E. McMears. Factors controlling ran-cidity development in freeze-dried meats. A.AF. and C.I. Contract No. DA19-129-Q(r. 1725. Mile No. A-339. (1961).
14
in Table 11 for cooked chicken. No signiflcant effect for a of the sevenqualities was observed for 28 C versus -40 C. Samples at 38 C were signifi-cantly darker than -40 C controls, and there were good indi8 ations that they
were ;ess tender, more fibrous, and less desirable than -40 C samples. Samplesat 48 C were significantly less tender, darker, and more off-flavored thancontrols, and there was a good indication that they were less desirable than-40 C controls.
Table 12 shows panel results of triangle tests for raw and cooked freeze-dried pork slices. For raw por', there were easily detectable and highlysignificant changes at 38 and 48 C at 3 months and thereafter 6 Based on scor-ing data, for raw pork stored for 6 months (Table 13)tthe 28 C samples werenot significantly different from the pontgols. The 38 C samples were signifi-cantly darker and less desirable than -40 C controls, and there were go8 dindications that they were less tender, more fibrous and drier. The 48 Csamples were significantly less tender, more fibrous, drier, darker, more off-flavored and less desirable than the controls. It was more difficult to detectdifferences in the raw freeze-dried pork samples because grilling after rehydra-tion masks much of the color difference and renders both the treated and con-trol samples dry.
Significant changes were detected in the cooked freeze-dried pork slicesat e, 3g and 6 months for all three temperatures, with the degree of signifi-cance increasing as the experimental temperature increased. On the basis ofthe scoring data (Table 14, compared to the -40 C controls, there were nosignificant effects f 8 r 28 C samples, an indication of greater darkness in38 C samples. The 48 C samples were significantly more fibrous, drier,darker, more off-flavored, and less desirable and were less tender and lessmealy than the controls.
11
19
, -t*

CONCLUSION S
The results of this investigation indicate that excessive (38, 48°0C)- temperatures for three to six months were required to develop serious
deterioration in freeze-dried chicken and pork at 1% moisture and 0% oxygenlevel. Color, tenderness, and flavor were affected.
Rehydration capacity of freeze-dried cooked chicken and raw and cookedpork at 1% moisture content was not influenced by storage in nitrogen attemperatures as high as 48 C and for periods as long as 6 months. Improve-ments in rehydration should be sought in pretreatment and freeze-drying steps.
E -amino nitrogen content was 100- and 200-fold that of glucose on amolal basis, and experienced no detectable change over six months at tempera-tures up to 480C. Loss of 1 mole amino nitrogen per 1 mole of glucose prob-ably could not have been established within the accuracy of the analyticalmethods. Based on the molal ratio of . -amino nitrogen to glucose in somemeats found here, the molal ratios used in most model system studies, say0.5 to 5, are unrealistic and may lead to erroneous conclusions about thebehavior of natural products.
Reducing substances, as measured by 2,6-dichlorophenolindophenol, accum-ul 8ted to 15-30% of initial glucose level on a molal basis after 6 months atL8 C and may be a good cherical indicator of deterioration.
ThL document reports 1.lse•ýrch undertaken at the US Ammy 'Ntick Resar'th ;.niDevelopfnet Coi-urnd and has been assigned 1Jo. NATICK/TIR-78/0X)7 in the 'se40-ieof reports approved for publication.
20

• Amerine, M. A., R. M. Pargborn, and E. P. Roessler. Principles of 3ensory
Evaluation of Foods. Academic Press, New York, 602 pp. (1965).Anglemier, A. F., D. L. Crawford, and H. W. ochultz. Improving the stability
and acceptability of precooked freeze-dried ham. Food Techno3. 14: 8 (t960).
Anonymous. The quantitative determination of pyruvic acid and lactic acid.Sigma Technical Bulletin No. 726-UV/No. 826-UV. Sigma Chemical Company,-t. Louis (1974).
AOAC. "Official Methods of Analysis," 10th ed. Association of OfficialAgricultural Chemists, Washington, DC (1965).
Ballantyne, R. M., C. Brynko, A. J. Ducker, and W. R. Smithies. Dehydrated
cooked meat products. Food Technol. 12: 398 (1958).
Bele, L. M., H. H. Palmer, A. A. Klose, and T. F. Irmiter. Evaluation ofobjective methods of measuring differences in texture of freeze-driedchicken meat. J. Food Sci. 31: 791 (1966).
Burnett, M. C., C. W. Gehrke, and D. E. Brady. Volatile components ofvacuum-packed dehydrated pork. J. Agr. Food Tech. 3: 524 (1955).
Chipault, J. R., J. M. Hawkins, and E. McMeans. Factors controlling ranciditydevelopment, in freeze-dried meats. A.4.F. and C.I. Contract No. Dk 19-129-Q4-1725. File No. A-339 (1961).
Cocker, W., R. A. Q. O'Meara, J. C. P. Schwartz, and E. R. Stuart. The chem-istry of reductone. Part II. Some coradensation products of reductonewith amino-compounds. J. Chem. Soc. No. 420: 2052 (1950).
Fleming, I. E. and H. F. Pegler. The determination of glucose in the pres-ence of maltose and isomaltose by a stable, specific erzymic reagent.
IAnalyst. 8S: 967 (1963).
SHamdy, M. K., V. R. Cahill, and F. E. Deatherae. Some observations on themodification of freeze-dehydrated meat. Food Res. 24: 79 (1959).
Harper, J. C. and A. L. Tappel. Freeze-drying of food products. Adv. inFood Rea. 7: 220 (1957).
Hendrickson, R. L., D. E. Brady, C. W. Gehrke, and R. F. Brooks. Dehydratedpor• studies : Removal of glucose by yeast fermentation. Food Technol.9: 290 (1955).
f 21

Iinergardt, L. C., 3. R. Drake, and R. A. KLuter. Grilled freeze-driedsteaks. Effects of mechanical tenderization plus phosphate and salt.J. Food Sci. 40: 621 (1975).
Hodge, J. E. Dehydrated foods. Chemistry of browning reactions in modelsystems. J. Agr. Food Chem. 1: 928 (1953).
Kakade, M. L. ane. I. E. Liener. Determination of available lysine in pro-teins. Analytical Biochem. 27: 273 (1969).
Lewis, V. M., W. B. Esselen, Jr., and C. R. Fellers. Nitrogen-free carboxylicacids in the browning reaction. Ind. Eng. Chem. 41: 2591 (1949).
Loeffler, H. J. and J. D. Ponting. Ascorbic acid - Rapid determination infresh, frozen, or dehydrated fruits and vegetables. Ind. and Eng. Chem.Anal. Ed. 14: 846 (1942).
Osman, 0. A. H. and R. E. Morse. Preparation and storage characteristics offreeze-dried sausages. *I. Formulation and processing of comminuted sausages(frankfurters). Food Technol. 14: 37 (Abstract) (19o60).
Ousterhout, L. E. and E. M. Wood. Available lysine in fish meals: Chemical(TNB3) method compared with a chick assay. Poultry Sci. 49: 1423 (Abstract)(1970).
Regier, L. W, and A. L. Tappel. Freeze-dried meat. III. Non-oxidativedeterioration of freeze-dried beef. Food Res. 21: 630 (1956).
Regier, L. W. and A. L. Tappel. Freeze-dried meat. IV. Factors affectingthe rate of deterioration. Food Res. 21: 640 (1956).
Sharp, J. G. Deterioration of dehydrated meat during storage. I. Non-enzymic deterioration in absence of ox'gon at tropical temperatures. J.3ci. Food Agric. 8: 14 (1957).
Sharp, J. G. Deterioration of dehyd-ated V ;tat durin, storMae. II. Effectof pH and terparatuia on browning ch-anps in d0hdrated aqueous extracts.J. Sci. Food Agric. 8:21 (1957).
Stadtman E. R. Nion-eonzyatic browning in fruit products. Adv. in FoudRe3. 1: 325 (1948).
Tappel, A. L., A. Conray, H. R. &Crson, L. W. Reger, and G. F. 5tewart.Freeze-dried meat. I. Preparation and properties. Food TechnoZl. 9:4,01 (1955).
22

Tappel, A. L., R. Martin, and E. Plocher. Freeze-dried meat. V. Preparation,properties and storage stability, of precooked freeze-dried meats, poultry,and seafoods. Food Technol. 11: 599 (1957).
Thomson, J. S., J. B. Fox, Jr. and W. A. Landman. The effect of water andtemperature on the deterioration of freeze-dried beef during storage.Food Technol. 16: 131 (1962).
Tuomy, J. M. and J. Felder. Effect of processing temperatures and cookingmethods on the quality of freeze-dried pork. Food Technol. 18: 135 (1964).
Tuoay, J. M. and R. L. Helmer. Effect of freeze-drying on the quality of thelongissimus dorsi muscle of pork. Food Technol. 21: 167 (1969).
Yao, A., A. I. Nelson, and M. P. Steinberg. Factors affecting the rate ofchicken meat dehydration under vacuum. Food Technol. 10: 145 (1956).
23
I.
I

Solutions on Improving Rehydration i
24
2'
-. U
"" gF
• DDENDUM
THE EFFECT OF SOAKING C1HICKEN BREASTS IN SALT/PH03PHATESOLUTIONS ON IMROVING REHY]MATION
INTRODUCTION
Results of the study to identify the components or fractions associated
with adverse changes in freeze-dried chicken and pork during storage indicate
that the rehydration values obtained agree with those of previous investigators,
and that precooked freeze-dried poultry and pork rehydrate rather poorly.
37 38
Aointo Tappel et al. (1955), 40Harper and Tappel (1957),38 Hamd4 et
al. (1959), Tuomy and Fe 4er (1964), Tuonry and Helmer (1967), and
Hinnergardt et al. (1975), dry texture and poor rehydration are the prin-
cipal problems in freeze-dried meat.
Various attempts have been made to improve the rehydration of meat. Hamdy
et al. (1959)4 3 tried to improve rehydration of freeze-dried meats by rehydrat-
ing them in solutions of 0.2 M NaCl, 0.01 M KC1 and 0.05 1' sodium ascorbateo
These treatments seemed to improve the texture and water-nol#ng capacity
(heC) cf the freeze-dried meats Hinnergardt et al. ( 1 975)4 undertook a
373ee footnote 29.
38See footnote 2.
39'See footnote 31.
4OSee footnote 7.
Tuony, J. M. and R. L. Helmer. Effect of freeze-drying on the quality of
the longissimus dorsi muscle of pork. Food Technol. 21: 167 (1967).
"4 "Hinnergardt, L. C., S. R. Drake, and R. A. Kluter. Grilled freeze-dried
steaks. Effects of mechanical tenderization plus phosphate and salt. J.
Food Sci. 40: 621 (1975).
433ee footnote 31.
ISee footnote 12.
25
wy"
"
study to determine the effect of a phosphate and salt solution in combinationwith mechanical tenderization of beef prior to cooking and freeze-dehydrationon the juiciness, tenderness, and rehydration of precooked freeze-dried steaks.Phosphate-salt treatments, with or without mechanical tenderization, increasedtenderness and juiciness, and raised final percent moisture from 50 to 56%.
The objective of this portion of the project was to determine the effectof soaking chicken breasts prior to and after cooking in salt (NaCl)/phosphatesolutions on improving the rehydration characteristics of precooked diced,freeze-dried chicken.
26
. .... -

SMIALUS AND WHODS
Two hundred eviscerated and washed broilers, totaling 500 pounds, wereremoved from a commercial processing line at a location just before the chillerand transported in ice to the laboratory. Three hours postmortem the breastmeat (Pectoralis major and minor) was cut from the chilled carcasses, dividedinto two equal lots, I and II, and soaked in water, and a solution contain-ing 3% Kena plus 4% sodium ,.hloride, respective*y. After three hours, themeat was drained free of solution and held at 3 C overnight. Meat was thencooked in 89 C water to an internal temperature of 77 C, drained and chilledin 3 C air for two hours. Each lot was then dividedointo two equal sub-lots,la and ib, and 2a and 8b, the a's be`.ng chilled in 3 C air for three hours, andthe b's chilled in a 3 C solution containing 3% Kena and 4% sodium chloride,for three hours. The fur sub-lots were drained free of solution, diced todimensions of 1.25 x 1.25 x 0.95 cm frozen on trays in a -23 C air blastfreezer, and freeze-dried in a pilot Size freeze-dryer at a pressure of 250migrons, condenser temperature of -40 C to -51 C, and platen temperature of49 C. Vacuum was released with high purity nitrogen, the dry product was1 nitrogen packed in No. 2-1/2 tin cans, and stored at -340C.
Determinations were made of yields, moisture contents, rehydration capa-city, and phosphorus and chloride contents. Approximately 20 grams of accurate-
V:ly weighed, diced, freeze-dried material was soaked in 150 ml of 80 C distilledwater for 20 minutes, drained for five minutes, and weighed. Water wasexpressed from the rehydrated samples by a 500-kg Instron activated forceacting through a 105-sqcm plunger on about 20 grams of sample.
10Phosphorus and chloride contents were determined by AOAC methods.
4 %ee footnote 10.
Z7
S4i
RESULTS AND DISCUSSION
Table 15 summarizes the effects of phosphate-salt treatments prior toand after cooking on water pick-up, cooked yields, and rehydration capacityof the freeze-dried products. As expected, the use of polyphosphates withsalt increased the water pick-up by about 8 percent, and cooked yield. basedon original unsoaked weight was 13 percent due to the polyphosphate-salttreatment. Polyphosphate-salt treatment of sub-lots of lots 1 and 2 producedonly 5 perceht water pick-up. Percentage moisture in the frozen, precookedsamples was 7.4. percent higher in the polyphosphate-salt treated lot 2b than
in the control la. When the four lots were freeze-dried to moisture levelsbelow 0.3 percent and rehydrated, lot 2b which received two phosphate-salttreatments held 4 percent more water than the control and lost 5 percent lesswater under pressure. The 4 percent additional water, t the 64 percentinitial level may be compared to Hinnergardt's (1975)4 6 percent additionby phosphate-salt at the 50 percent initial level.
Table 16 summarizes data on the mineral content of the four products.Increases in ash content are substantial and cannot be accounted for entirelyas increases in Kena plus sodium chloride. Somewhat more chloride and phos-phorus were incorporated into the meat by treatment before cooking than bytreatment after cooking.
46.
See footnote 42.
28
.....................................~ i-..
0 '.00 0'0 00
CrA c-t 0
0 2to
Id01 -4Q Ot-uc% 4
-4r- I ..
00
04 - ! a- - -800
00
0 IO C-% '.
q(D( V-4 j-1 $ 0E-
Q)0 0 M8 3N -4 C--40 1o ,-ý o'.ýSýto
1 0 V4 -4 sfl'.0)
- 0Qy4 .4v4 y40
$4 -4 -8 - -oH
'-4-
0N 0to.t cs~
00
c; C,)
tctt
.04
E0-'~'
29 g
~ ~HH P"H

.. )
0
ý0
.9 E- 0O\o) 1004
0
r-I I4 H
M 40
Q) 4 0 0
.10
H 0
't0 0400
0E go 00 t
-e -0 C t
\02 -t00O\ 2$4
0 2 0*
4V34
43
01 0 43
0)0
:3 $A

00.4)
0
$44
c )~
*r0 41. 0rto I C'JC V-
00
a) 4,
CD 0
04) 0. 0
0 E T-4 004 (n-'CC% R
0 0
.l - e - -
0, 1 V- CV m 1
0$
o
0 0)
00
0 0
U 4)
4, fn 1-41-4 1-4
00
31
/A

00
0
Q) 0
0
0 E0$4 E4
-C4 5
0 .0
-0 Ei rxoc
20
iiC 00,~ [
0 0
'1) 0
0~ £ 0.4
0 ~ (~er~C)32
0 .4.Am

0 0
0 04
0% O%-4 q-i r-4 cq -.3C' \ 4 V4 T4 T-4
0
0 6 U'- 0'-4Cl -
o 140
04
S40
01
0 ý0
S00 00r 1
00
1 00
r-4 0
00
V-4 "4
00
100 0 10
01, 33
--co---~----7~----7-- r.4
4) tnN 4)
$44) Cd LI).-4 04t00 0-
4) 400 N D-4
0 4)
CD$- 0-4 0 a4N ai 4)rn.n In 4)) V)ul ul1
$40 ~ td~ 4) *0-
Cd $4
>) 0 4.)) (3:4) -4
$4 X. t1 > 31 4)Ln0
0 0 0 cU C)$4 I 4
N- 004- 4
4JJ *a iiN > w
0) N4 V) N 1uV In WQý
In LJnI In 3n U I nt
4)4 4)
C)) 0- \0 \0
4J ~ 4 >C*1c) >4- I-t >
'4. 0
0- 04) 4) 4)
Ln U-4 $4 l
t4 .-.41 In I
0)~ ~ .>~4 ) 6
Ow$ 0 v a
I--~ IA v
34

00 OOO v1- 4U~ C'
T-4 1-4 r-4 V-1 T-4 r-4 V4
4t)0
r-4. 10 4 cý N I
0 0~ 00
)1- 4
-Jl N
iiN4
1 0
0. 4
0
4.)4
ý4)
o '-
1-
1-4 C-4,
U % 14 O %9 7 C-4
4.))
0 35
* .--- --
)-4
ILI+12
:3C N h -0
$4 A~4~4
-ý C41 C4 .44cv' 4a 0
r- V- - a r - .to :j N
Cf4 0
0 014i 100 N I
'4 ce -.
\40 \DJ OU-\ 11 0a
0. 944' 4CJ (J'
00
0 0 - -i2-N C'-4 N
0 03 . * . . * * ** . S v-14 0-4 V-4 -4 0 .
-4 Al 0 \ 7-
$4
041
00
:4 00
363

0 C%4cr (n to C
0 0 cn. -D 04 4-t )0 a . .
4) '00 WC 0U.
.4)
4qr-4 (n-0 0
0 0 r-4
to E- r 0
CP 0 a,- 0%o to7
'00
O r-4
000 0~ 00 N CC '
040 E-'0-'404) 4 ~ 0 so V *
14-0 EU 0..)40 sr- CA -t
4 c4 co48 c- c
0) >) 90C-) ~ C0t-.
4 P) 0 0 %4 '0 r
tov- -Hr4C'3
4)0 0
4)0 CV N O t C- 0 4) 04) so. . .44
U)44
4)0 to '0 ''.0 00
0 U, %00NOc
0 14 42
0 r.
0) 8 j
r4 -1 id
Eli C)5 >~
01 0. 00
i10 0 V-
37
0 .0.0 .0..
0 '00
00
0
44
1- -4 0 0
00
00 .0o .0
> 0 -- 4 .
0 '14 0 C
it 0IU
Nt$4 040 0 -
0
0
M) 0 0
U4 4
0 C;
Isf
- C) C8

0 A4024-44. C'Q
02Ol 02 *r4
00 r-P-
0 0
t:N~ 'it0 4-t -4rf 0 "A P
~4) 0 00ý4 0 14
00
0 02
CA Lt- t0-O 0l ý0 ~4 0
W+ + 4-)
Ce 4) 0 $2
'0 0 0- -p M0- f) 0C
VA~ 04 0~~*0~~
002 0d N\ Z Ol N N'C'0 CŽC') 0
a)0 0 0 0
CI~~4.d- 00 0$-4 V) -- Y - o IO - l\ly\1
qj~' -0- Z -
020
020) 4o 02 0
~40 4d )
0 (
41I4 0 $41
to 'dt ('L~-t t 0~~ P. .- s 02
O 00 r4 ~4-40l 0 - r4
-81 00 Oil1
0 0d 0
00 0 L
to'- m5 4 U) 0' ri r ,A'rn 4
0k 00 C.cd' ~ ~ o~~
39
4 4'
0 uQ u u
4- u i~ --
4-4 0Cd 00
0 4A K nL 0C4 % 0100
0 C00 r- U l 00 C.)P4) k 4 V'4 )
E-'
0
0 u uu
1.) -4C.t.)414
4) 0~-. CtkN COO u OI *
4-)~4 4)0 ) M 1tA 4) > 1 - 1 C- - -4 C44
0 4) 0)
t.4 g co4. 0 k -o -i
4~) -ik-4-
4- 0- 15C0.04' A 4 xl4~~4 44 1. 4,t
4-.' u'4, 44 40~4 A -O0 n--4 " -
4) 005 4)l p4 5 CA 4)0 (> - ,r- t) -4 -4 -
'4J 0. I'd4 C::4: 00 .0 OW 4,\ 4
4-4
44) 04 04)4) 0 --4C1 k'4 ..
u t 40
. -4 ., F
-4 , -M 4- 4 .A 4 .- ,

z 0 - Tir
04 OW Cl -0
00 4- +-u~C
8~ 4,4 4) o4LNqNO m T- \'C i0r p 4- )
CV %- 5-4 (s0 N43 U+) 0
0 4 4)
0 U) 4
04 L.0CM' - 40"' r- OkC 4,-04,T 02
4, 002 00
-0 4,1
+ 04
4) 00H 4,C0~j* 0
02
(D 4, *r
:6 4) 02 f
0 00
0 0 4
00 (1' 0r0) 0 04 4 0 0 4)- C
4)~ 4) 4,4) 00 eP
(-as
41
ri 5
44
$44
04
P4 0o C",~ i $A-I -i c 0C z?4 0 '
4' p00 0~ cP\. 4Ozt0
t-~ 8, 0~ b
0+ zc. +\ A I 0 4' r
q' 0)0c.- 4-0
0) 4
04'% m--a 0 U4'-\010' 0.0 '* * . * * * 0 a
-4'0 -4- + 4-)43 U)U
4' 0
4-'l 40) M.0r '-0N .
0 ~ ~ . .) 4' 0 * * 0 * *00 -4~Q C -' 4C) O(DC 4
4' U8H 0 t0 0 ;
00
*Hp4 0) (D\C~ t'Ott 0\04toU .- 0c'ý' 4 -4 ý') >UC~ -
1.4 0
0 0
00 it~
U 0
O.' 000) 44 0~ 0 U4) r
0 ~42
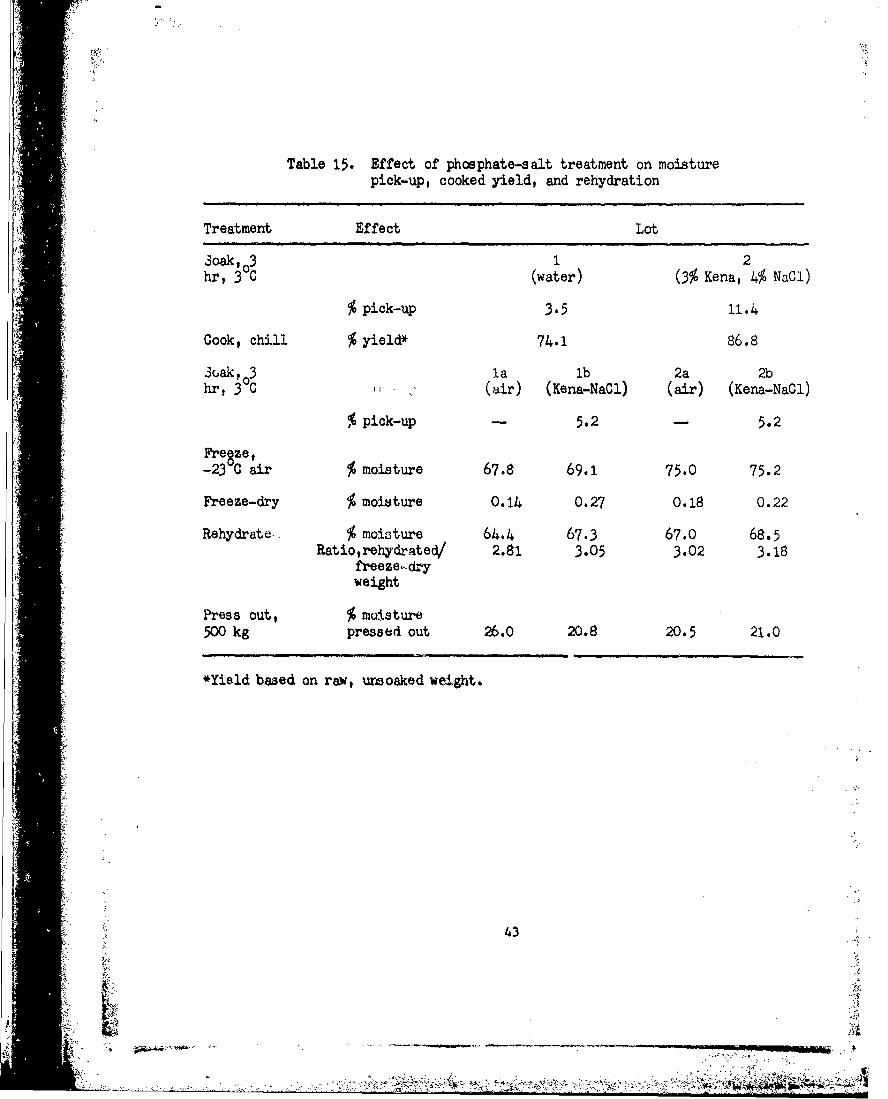
Table 15. Effect of phosphate-salt treatment on moisturepick-up, cooked yield, and rehydration
Treatment Effect Lot
'Oak, 30 1 2hr, 3 C (water) (3% Kenai 46 NaCi)
% pick-up 3.5 11.4
Cook, chil % yield* 74.1 86.8
30askP03 la lb 2a 2b
hr, 3 C I(air) (Kena-NaCl) (air) (Kena-NaCi)
% pick-up -5.2 -5.2
Freaze,-23 C air % moisture 67.8 69.1 75.0 75.2
Freeze-dry % moisture 0.14 0.27 0.18 0.22
Rehydrate. %a moizture 64.4 67.3 67.0 68.5Ratiolrehydrated/ 2.81 3.05 3.02 3.18
freeze~-dryweight
Press out, % moisture500 kg pressed out 26.0 20.8 20.5 21.0
*Yield based on raw,. unsoaked weight.
43

Table 16. Mineral content of freeze-dried products
Soaking Lot
Treatment Ia lb 2a 2b
Water-Air Water-Salts - Salts-Air Salts-Salts
% Ash 3.63 6.58 6.06 10.62
% Chloride (Cf) 0.09 0.66 1.03 1.04
% Phosphorus 0.62 0.81 0.92 1.16
44
I! .*


![Dehydrated Vegetables: Great Taste That’s Built to Last1].pdf · DEHYDRATED ONION Powder Flavor without pieces. Granulated ... Dehydrated Vegetables: Great Taste That’s Built](https://img.dokumen.tips/doc/110x75/5aaff5d57f8b9a6b308df457/dehydrated-vegetables-great-taste-thats-built-to-1pdfdehydrated-onion-powder.jpg)


![Prediction of Moisture Adsorption Characteristics of Dehydrated Fruits … · dehydrated fruits that contain high TSS [9,27,32] such as osmotically dehydrated, freeze drayed and solar](https://img.dokumen.tips/doc/110x75/60ee73f0491c6b7db71286c0/prediction-of-moisture-adsorption-characteristics-of-dehydrated-fruits-dehydrated.jpg)