Embed Size (px)
DESCRIPTION
http://www.livemint.com/2010/03/31210101/DB3B4D74-6A59-4D7E-A759-A93A89165150ArtVPF.pdf
Citation preview
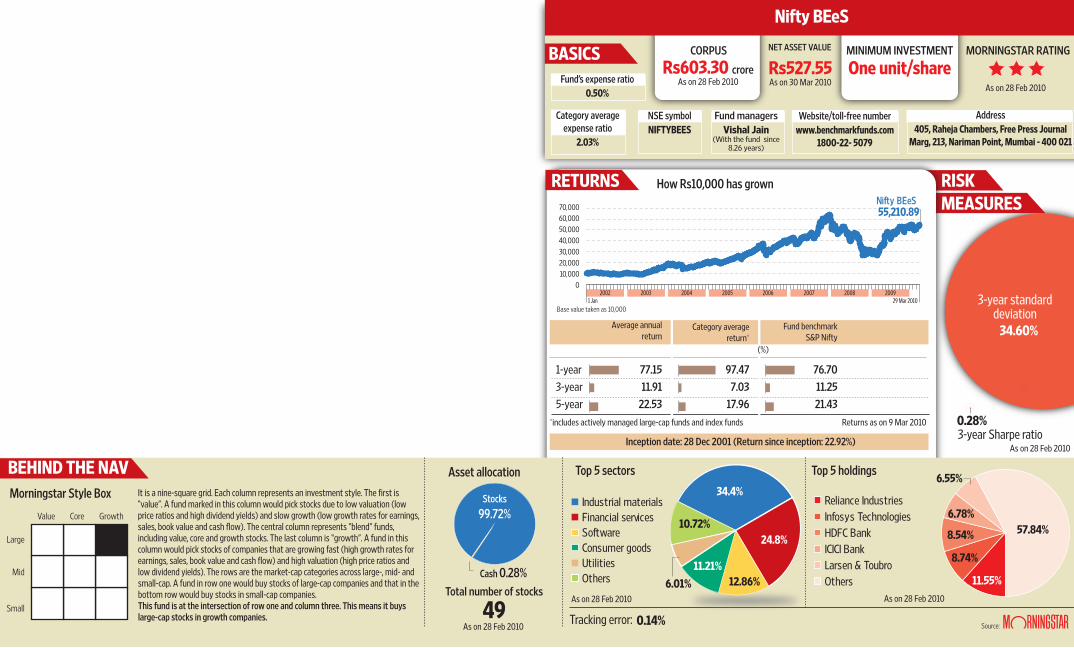
RISK
Total number of stocks
49
Asset allocationIt is a nine-square grid. Each column represents an investment style. The first is “value”. A fund marked in this column would pick stocks due to low valuation (low price ratios and high dividend yields) and slow growth (low growth rates for earnings, sales, book value and cash flow). The central column represents “blend” funds, including value, core and growth stocks. The last column is “growth”. A fund in this column would pick stocks of companies that are growing fast (high growth rates for earnings, sales, book value and cash flow) and high valuation (high price ratios and low dividend yields). The rows are the market-cap categories across large-, mid- and small-cap. A fund in row one would buy stocks of large-cap companies and that in the bottom row would buy stocks in small-cap companies.This fund is at the intersection of row one and column three. This means it buys large-cap stocks in growth companies.
Top 5 sectors
As on 28 Feb 2010
As on 28 Feb 2010
Top 5 holdings
As on 28 Feb 2010
Inception date: 28 Dec 2001 (Return since inception: 22.92%)
1-year3-year5-year
Average annual return
Category average return*
3-year Sharpe ratioAs on 28 Feb 2010
Returns as on 9 Mar 2010*includes actively managed large-cap funds and index funds
BASICS
RETURNSMEASURES
Rs603.30 croreAs on 28 Feb 2010
Rs527.55As on 30 Mar 2010
As on 28 Feb 2010 Fund’s expense ratio
0.50%
Fund managersVishal Jain
(With the fund since 8.26 years)
NSE symbolNIFTYBEES
Category average expense ratio
2.03%
Website/toll-free numberwww.benchmarkfunds.com
1800-22- 5079
Address405, Raheja Chambers, Free Press Journal
Marg, 213, Nariman Point, Mumbai - 400 021
BEHIND THE NAV
CORPUS NET ASSET VALUE
One unit/shareMINIMUM INVESTMENT MORNINGSTAR RATING
Source:
34.60%
3-year standard deviation
0.28%
Tracking error: 0.14%
Cash 0.28%
(%)
77.1511.91
22.53
97.477.03
17.96
Fund benchmarkS&P Nifty
76.7011.2521.43
Value Core Growth
Small
Mid
Large
Nifty BEeS
57.84%
11.55%
8.74%
8.54%
6.78%
6.55%
Stocks99.72%
Industrial materialsFinancial servicesSoftwareConsumer goodsUtilitiesOthers
34.4%
24.8%
11.21%
10.72%
12.86%6.01%
Reliance IndustriesInfosys TechnologiesHDFC BankICICI Bank Larsen & Toubro Others
Morningstar Style Box
How Rs10,000 has grown
Base value taken as 10,0001 Jan 29 Mar 2010
2002 2003 2004 2005 2006 2007 2008 2009
Nifty BEeS
010,00020,00030,00040,00050,00060,00070,000 55,210.89


![PPDP 2010 [http://xkcd.com/208/]. http://www.cs.au.dk/index.php?id=141&view=details 13/02/2010 66.249.65.107 get /support.html 20/02/2010 42.116.32.64](https://img.dokumen.tips/doc/110x75/56649d2d5503460f94a04501/ppdp-2010-httpxkcdcom208-httpwwwcsaudkindexphpid141viewdetails.jpg)


![DANSAS 2010 (In proc. of PPDP 2010)[http://xkcd.com/208/]](https://img.dokumen.tips/doc/110x75/56649d2c5503460f94a02ddb/dansas-2010-in-proc-of-ppdp-2010httpxkcdcom208.jpg)