Embed Size (px)
DESCRIPTION
http://www.cddep.org/sites/cddep.org/files/publication_files/Takala.Smith_.etal_.2006.HighThroughputMethodForQuantifyingAllelesAndHaplotypesOfMalVax.pdf
Citation preview
BioMed CentralMalaria Journal
ss
Open AcceMethodologyA high-throughput method for quantifying alleles and haplotypes of the malaria vaccine candidate Plasmodium falciparum merozoite surface protein-1 19 kDaShannon L Takala1, David L Smith3, O Colin Stine4, Drissa Coulibaly2, Mahamadou A Thera2, Ogobara K Doumbo2 and Christopher V Plowe*1Address: 1Center for Vaccine Development, University of Maryland School of Medicine, 685 West Baltimore Street, HSF1-480, Baltimore, Maryland 21201, USA, 2Malaria Research and Training Center, University of Bamako, BP 1805, Bamako, Mali, 3Fogarty International Center, National Institutes of Health, 16 Center Drive, Room 202, Bethesda, Maryland 20892, USA and 4Department of Epidemiology and Preventive Medicine, 660 West Redwood Street, University of Maryland School of Medicine, Baltimore, Maryland 21201, USA
Email: Shannon L Takala - [email protected]; David L Smith - [email protected]; O Colin Stine - [email protected]; Drissa Coulibaly - [email protected]; Mahamadou A Thera - [email protected]; Ogobara K Doumbo - [email protected]; Christopher V Plowe* - [email protected]
* Corresponding author
AbstractBackground: Malaria vaccine efficacy may be compromised if the frequency of non-target allelesincreases following vaccination with a genetically polymorphic target. Methods are needed tomonitor genetic diversity in polymorphic vaccine antigens, but determining which genetic variantsof such antigens are present in infected individuals is complicated by the frequent occurrence ofmixed infections.
Methods: Pyrosequencing was used to determine allele frequencies at each of six single nucleotidepolymorphisms in the Plasmodium falciparum blood-stage vaccine antigen merozoite surface protein1 19 kDa (MSP-119) in field samples from a vaccine-testing site in Mali. Mixtures of MSP-119 cloneswere created to validate a haplotype-estimating algorithm that uses maximum likelihood methodsto determine the most probable combination of haplotypes given the allele frequencies for aninfection and the haplotypes known to be circulating in the population.
Results: Fourteen unique MSP-119 haplotypes were identified among 351 genotyped infections.After adjustment to a standard curve, Pyrosequencing provided accurate and precise estimates ofallele frequencies in mixed infections. The haplotype-estimating algorithm provided accurateestimates of haplotypes in mixed infections containing up to three haplotypes. Based on the MSP-119 locus, approximately 90% of the 351 infections contained two or fewer haplotypes.
Conclusion: Pyrosequencing in conjunction with a haplotype-estimating algorithm providesaccurate estimates of haplotypes present in infections with up to 3 haplotypes, and can be used tomonitor genetic diversity in parasite populations prior to and following introduction of MSP-1-based malaria vaccines.
Published: 20 April 2006
Malaria Journal2006, 5:31 doi:10.1186/1475-2875-5-31
Received: 16 February 2006Accepted: 20 April 2006
This article is available from: http://www.malariajournal.com/content/5/1/31
© 2006Takala et al; licensee BioMed Central Ltd.This is an Open Access article distributed under the terms of the Creative Commons Attribution License (http://creativecommons.org/licenses/by/2.0), which permits unrestricted use, distribution, and reproduction in any medium, provided the original work is properly cited.
Page 1 of 10(page number not for citation purposes)
Malaria Journal 2006, 5:31 http://www.malariajournal.com/content/5/1/31
BackgroundMalaria remains a major cause of disease and death intropical regions. A malaria vaccine could contribute tomalaria control, but as with other pathogens (e.g. HIV,Streptococcus pneumoniae, and influenza virus), malariavaccine development is complicated by genetic diversityin vaccine antigens. Most malaria vaccine antigens have ahigh rate of non-synonymous amino acid substitutionsand continue to evolve under selection from the immunesystem [1-3]. If immunity conferred by a subunit vaccineis allele-specific, then vaccination could lead to anincreased frequency of alleles not targeted by the vaccine.Such changes in the parasite population could compro-mise vaccine efficacy. It is therefore important to under-stand the genetic diversity in polymorphic antigens inendemic populations before and after the introduction ofa malaria vaccine, including the prevalence of differentgenetic variants and their natural dynamics, and to meas-ure allele-specific protective efficacy in clinical trials ofmalaria vaccines.
Merozoite Surface Protein 1 is a leading malaria vaccinecandidate antigen. It is the most abundant protein on thesurface of the merozoite and is synthesized as a 195 kDaprecursor. After undergoing proteolytic cleavage, only thec-terminal 19 kDa remains on the surface of the merozoiteas it enters the erythrocyte [4]. The 19 kDa fragment con-tains two epidermal growth factor (EGF)-like domains,which are thought to have an important function in eryth-rocyte invasion [5]. Antibodies to this region can blockerythrocyte invasion in vitro [4] and are associated withprotection from clinical malaria in field studies [6-8]. Thesequence of MSP-119 is highly conserved [9], which, alongwith its putative critical function, make it an attractive vac-cine target. However, this region has six non-synonymoussingle nucleotide polymorphisms (SNPs) at amino acidpositions 1644, 1691, 1699, 1700, 1701, and 1716 [9-12], which result in expression of different amino acids atthose sites (e.g. EKSNGL, QKSNGF, ETSSRL, etc.). It is notknown whether or how this polymorphism affects immu-nity.
Determining which genetic variants of polymorphicmalaria antigens are present in infected individuals iscomplicated by the frequent occurrence of mixed infec-tions. When region of interest is amplified using polymer-ase chain reaction (PCR), the product and subsequentsequence generated by direct DNA sequencing representsthe pool of all parasite types present in that infection.Consequently, it is difficult to distinguish which nucle-otides reside together on one parasite (i.e. haplotypes).Haplotypes can be identified using PCR cloning [11,13],since each clone contains a single copy of the amplifiedregion of interest; however, cloning is time consuming,
expensive, and not all sequences clone with equal effi-ciency.
Pyrosequencing™ (Biotage, Charlottesville, VA) is a real-time sequencing method that detects release of pyrophos-phate during nucleotide incorporation by an enzyme cas-cade that generates light proportional to the amount ofnucleotide incorporated. This technique allows sequenc-ing of short stretches of nucleotides (10–20 bp) surround-ing known polymorphisms without sequencing the rest ofthe conserved sequence. Pyrosequencing software canquantify the proportion of each alternative nucleotide ateach SNP site based on relative peak heights. This methodhas been shown to provide accurate and precise measure-ments of allele frequencies in pools of human DNA[14,15] and of the degree of DNA methylation [16].
If allele frequencies at each polymorphic site in a candi-date antigen can be determined, and it is known whichunique haplotypes are circulating in the population, thena mathematical model can be developed to estimatewhich haplotypes are present in mixed infections. In thisstudy, Pyrosequencing was used to determine allele fre-quencies at each of the six SNPs in MSP-119, and an algo-rithm was developed to reconstruct the frequency of MSP-119 haplotypes in mixed malaria infections. This methodwill provide a time- and cost-effective alternative to PCRcloning for monitoring parasite populations before andafter vaccine introduction.
MethodsSamples and DNA extractionAll samples used in this study were collected at a malariavaccine-testing site in Bandiagara, Mali. DNA wasextracted from 3 MM Whatman (Whatman Inc., Clifton,NJ) filter paper blood samples using a QIAamp DNA MiniKit (Qiagen, Valencia, CA). PCR followed by directsequencing was used to screen 55 samples collected fromchildren participating in a case-control study of severemalaria [17]. PCR followed by Pyrosequencing was usedto screen 296 samples collected from children and youngadults participating in a malaria incidence study [18].Both the case-control study and the malaria incidencestudy were conducted during the years 1999–2001, andwere approved by Institutional Review Boards of the Uni-versity of Bamako Faculty of Medicine and the Universityof Maryland Baltimore. Samples with sequences consist-ent with the presence of unique MSP-119 haplotypes wereidentified and one representative of each haplotypeunderwent PCR cloning.
PCRPCR primers were designed, using Pyrosequencing AssayDesign Software version 1.0.6 (Biotage, Charlottesville,VA), to amplify 272 bp of MSP-119 containing the six SNPs
Page 2 of 10(page number not for citation purposes)

Malaria Journal 2006, 5:31 http://www.malariajournal.com/content/5/1/31
of interest (forward: 5'-CAATGCGTAAAAAAACAAT-GTCC-3', reverse: 5'-TTAGAGGAACTGCAGAAAATACCA-3'). The reverse primer contains a 5' biotin label. Each 50µl PCR contained 33.35 µl sterile distilled water, 5 µl 10×PCR buffer (Qiagen, Valencia, CA), 4 µl MgCl2 (25 mM),0.4 µl DNTPs (100 mM with nucleotides mixed in equalproportions), 1 µl each of forward and reverse primer (5µM), 0.25 µl HotStarTaq polymerase (Qiagen, Valencia,CA), and 5 µl template DNA. Cycling conditions were asfollows: 95°C for 15 minutes; 94° for 30 seconds, 65° for30 seconds, and 72° for 30 seconds for 10 touchdowncycles -0.5°/cycle; 94° for 30 seconds, 60° for 30 seconds,and 72° for 30 seconds for 35 cycles; and a final extensionat 72° for 10 minutes. PCR products were visualized on1.5% agarose gels.
PyrosequencingFor each Pyrosequencing reaction, 5–10 µl of each bioti-nylated PCR product (depending on product yield) wasaliquotted into the wells of a 96-well plate. To bind theproducts to sepharose beads, 70 µl of binding reactionmix was added to each well. The binding reaction mixconsists of 40 µl Binding Buffer (Biotage, Charlottesville,VA), 28 µl high purity water, and 2 µl Streptavidin-Sepha-rose™ beads (Amersham Biosciences, Piscataway NJ). Thebinding reaction mix and PCR products were mixed at1400 rpm at room temperature for at least five minutes.
Four Pyrosequencing reactions are required to genotypethe six SNPs in MSP-119. Table 1 shows the sequence ofthe primers for each Pyrosequencing reaction. Primerswere designed using Pyrosequencing Assay Design Soft-ware version 1.0.6 (Biotage, Charlottesville, VA). EachPyrosequencing primer was diluted to 0.417 µM inAnnealing Buffer (Biotage, Charlottesville, VA), and 12 µlof the annealing mix (including Pyrosequencing primer)was added to each well of a PSQ™ HS 96-well plate, result-ing in 5 pmol of Pyrosequencing primer per well. Negativecontrols (i.e. Pyrosequencing primer only and bioti-nylated primer and Pyrosequencing primer without tem-
plate) were included on each plate to confirm thatbackground signal was negligible.
Sepharose-bound PCR products were captured on theprobes of the Pyrosequencing Vacuum Prep Tool (Biotage,Charlottesville, VA). The beads were washed in 70% etha-nol, followed by denaturation solution (0.2 M NaOH),and then washing buffer (Biotage, Charlottesville, VA) for15 seconds each. The vacuum was released, and theprobes were immersed in the PSQ HS 96-well plate con-taining the annealing solution, and the beads werereleased by gentle shaking. The plate was then incubatedon a heat block at 80°C for 2 minutes and allowed to coolto room temperature prior to reading. Plates were read ona PSQ HS Pyrosequencer using PSQ HS 96A SNP reagentsand analysis software version 1.2 in AQ mode. Only sam-ples with single peak signals of at least 30 RLU (relativeluminescence units) were considered suitable for allelequantification. Samples that gave "wide peak" warningsupon analysis were also rejected and the Pyrosequencingrepeated.
PCR cloningFor samples chosen for cloning, PCR products were gener-ated using nonbiotinylated versions of the MSP-119 PCRprimers. These products were cloned using a PCR CloningPlus Kit (Qiagen, Valencia, CA). Transformed cells wereplated on LB plates containing 100 mg ampicillin, 80 mgX-gal, and IPTG. Clones with successful ligations werechosen by blue-white screening, followed by PCR screen-ing with MSP-119 PCR primers. Twelve clones were pickedfor each ligation. The nucleotide sequence of each clonewas determined using Pyrosequencing and confirmed bydirect sequencing.
Standard curve generationTo account for variation in the accuracy of allele frequencydetermination and to standardize across the differentSNPs, standard curves were generated for each of the sixpolymorphic positions in MSP-119 (Figure 1). Experimen-tal mixtures of MSP-119 clones were created to generate
Table 1: Pyrosequencing primers used to genotype polymorphisms in MSP-119.
SNP PrimerLocation Nucleotides Amino Acids
1644 G/C E/Q 5'-GCGTAAAAAAACAATGTC-3'1691 A/C K/T 5'-GTGATGCAGATGCCA-3'1699a G/A S/N 5'-CCGAAGAAGATTCAGGTA-3'1700a G/A S/N1701a G/A G/R1716b C/T L/F 5'-TCACATGTGAATGTACTAAA-3'
aSNPs at these three positions are genotyped in the same Pyrosequencing reaction.b Primer sits down prior to position 1711 where there is a rare polymorphism not considered in this analysis.
Page 3 of 10(page number not for citation purposes)

Malaria Journal 2006, 5:31 http://www.malariajournal.com/content/5/1/31
standard curves and estimate the magnitude of experi-mental errors. Plasmids were extracted from clones usinga QiaPrep Spin Miniprep kit (Qiagen, Valencia, CA). Plas-mid concentrations for dilutions and mixtures were deter-mined using a NanodropTM ND-1000Spectrophotometer (NanoDrop Technologies, Wilming-
ton, DE). Because no two clones differed at all six SNPs,two curves were generated: one using clones that differedat all sites except 1699 and the other using clones that dif-fered at all sites except 1716. Plasmids were combined inratios of 10:0, 9:1, ...1:9, 0:10. TE was added to each mix-ture to dilute to a final concentration of 1 ng/µl. 2 µl of
Standard curves for each of the six single nucleotide polymorphisms in MSP-119Figure 1Standard curves for each of the six single nucleotide polymorphisms in MSP-119. Graphs depict the percent devia-tion between expected and observed frequencies (y-axis) over a range of expected frequencies (x-axis). Circles indicate the observed frequencies, the red line indicates the smoothed data, and the blue line represents the fitted standard curve.
Page 4 of 10(page number not for citation purposes)
Malaria Journal 2006, 5:31 http://www.malariajournal.com/content/5/1/31
each dilution was used in PCR as described above, andproducts underwent Pyrosequencing. To generate stand-ard curves for each of the SNPs, the deviations betweenthe expected and observed allele frequencies (i.e. theerrors) were plotted, and a function, Si, was chosen to cor-rect these errors. Standard curves were chosen from thefamily of curves given by the five-parameter function ofthe allele frequency, p: a + bp + cp2 - dsin(2gπp). Back-wards fitting was used to find the most parsimoniousfunction Si for each of the SNPs (Table 2). Thus, given a setof measured frequencies pi, the best estimate of the actualfrequencies is Si(pi).
Haplotype estimationThe haplotype-estimating algorithm uses maximum like-lihood methods to determine the most probable combi-nation of haplotypes given the allele frequencies for aninfection, the haplotypes known to be circulating in thepopulation (Table 3), and a probability distribution of the
measurement errors. To estimate the distribution of meas-urement errors associated with each SNP (i.e. the residualerrors after adjustment to the standard curve), the abso-lute values of the errors were assumed to be exponentiallydistributed. The mean residual error for each SNP, εi, wascalculated using the same clone mixtures that were used togenerate the standard curve data. Given a putative set ofhaplotype frequencies, fi, and a set of allele frequencies, pi,the negative log-likelihood of fi is ∑i(|A(fi) - S(pi)|/εi),where A (fi) indicates the allele frequencies for a putativecombination of haplotypes, S(pi) represents observedallele frequencies adjusted to the standard curve, and εi isthe mean residual error for each SNP. To estimate the mul-tiplicity of infection (MOI) for each infection, Mi, thenumber of haplotypes per infection was assumed to bedistributed as a conditional Poisson [19] (i.e. each infec-tion has at least one haplotype) with a mean of 1.38 hap-lotypes (estimated from 296 infections from theBandiagara malaria incidence study). Thus, the full equa-
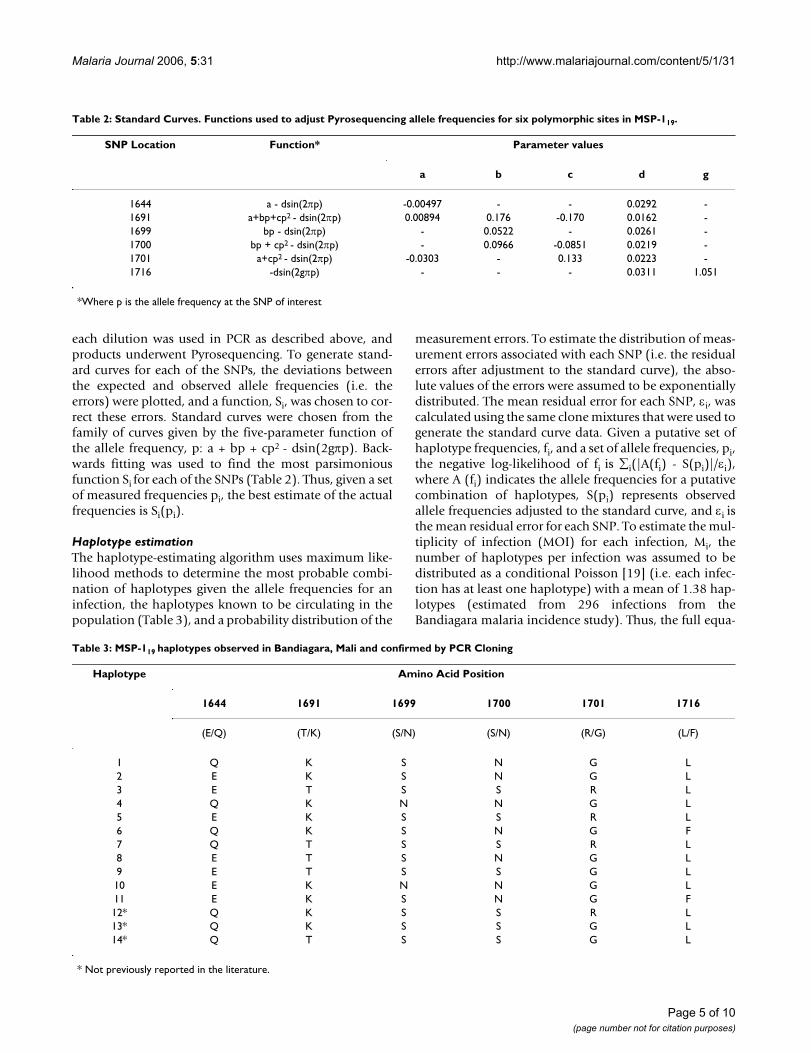
Table 2: Standard Curves. Functions used to adjust Pyrosequencing allele frequencies for six polymorphic sites in MSP-119.
SNP Location Function* Parameter values
a b c d g
1644 a - dsin(2πp) -0.00497 - - 0.0292 -1691 a+bp+cp2 - dsin(2πp) 0.00894 0.176 -0.170 0.0162 -1699 bp - dsin(2πp) - 0.0522 - 0.0261 -1700 bp + cp2 - dsin(2πp) - 0.0966 -0.0851 0.0219 -1701 a+cp2 - dsin(2πp) -0.0303 - 0.133 0.0223 -1716 -dsin(2gπp) - - - 0.0311 1.051
*Where p is the allele frequency at the SNP of interest
Table 3: MSP-119 haplotypes observed in Bandiagara, Mali and confirmed by PCR Cloning
Haplotype Amino Acid Position
1644 1691 1699 1700 1701 1716
(E/Q) (T/K) (S/N) (S/N) (R/G) (L/F)
1 Q K S N G L2 E K S N G L3 E T S S R L4 Q K N N G L5 E K S S R L6 Q K S N G F7 Q T S S R L8 E T S N G L9 E T S S G L10 E K N N G L11 E K S N G F12* Q K S S R L13* Q K S S G L14* Q T S S G L
* Not previously reported in the literature.
Page 5 of 10(page number not for citation purposes)
Malaria Journal 2006, 5:31 http://www.malariajournal.com/content/5/1/31
tion for the negative log likelihood is ∑i[(|A(fi) - S(pi)|/εi)- log(POIS(Mi-1, 0.38))].
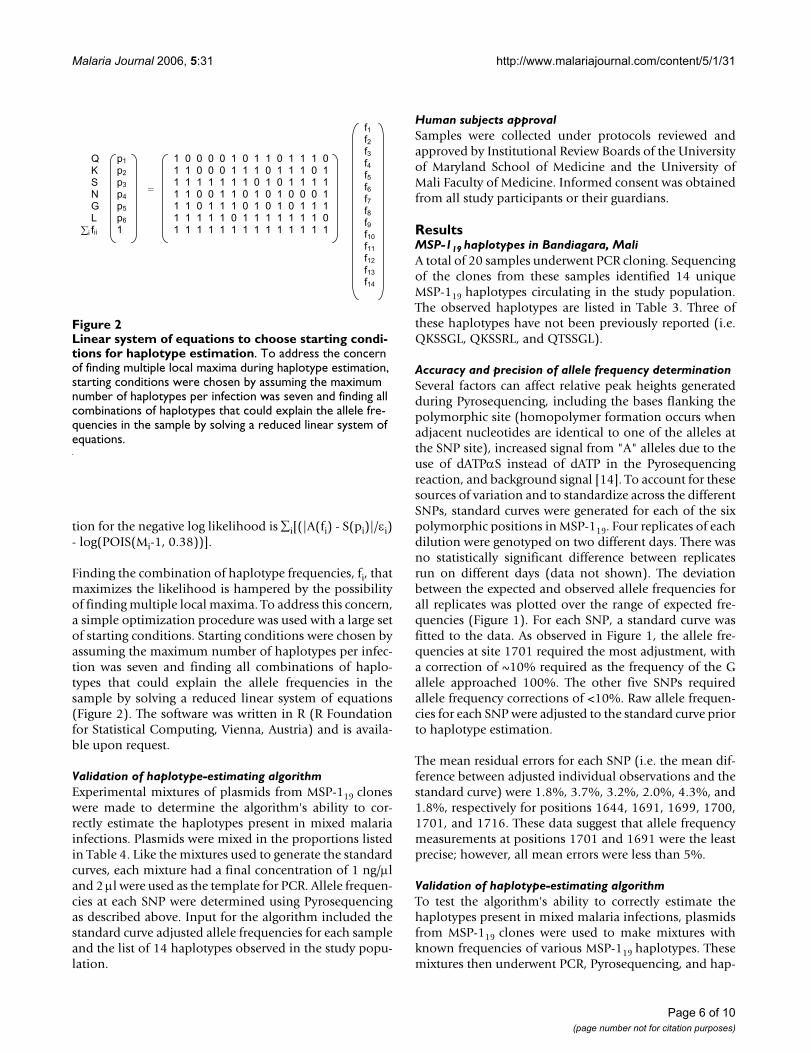
Finding the combination of haplotype frequencies, fi, thatmaximizes the likelihood is hampered by the possibilityof finding multiple local maxima. To address this concern,a simple optimization procedure was used with a large setof starting conditions. Starting conditions were chosen byassuming the maximum number of haplotypes per infec-tion was seven and finding all combinations of haplo-types that could explain the allele frequencies in thesample by solving a reduced linear system of equations(Figure 2). The software was written in R (R Foundationfor Statistical Computing, Vienna, Austria) and is availa-ble upon request.
Validation of haplotype-estimating algorithmExperimental mixtures of plasmids from MSP-119 cloneswere made to determine the algorithm's ability to cor-rectly estimate the haplotypes present in mixed malariainfections. Plasmids were mixed in the proportions listedin Table 4. Like the mixtures used to generate the standardcurves, each mixture had a final concentration of 1 ng/µland 2 µl were used as the template for PCR. Allele frequen-cies at each SNP were determined using Pyrosequencingas described above. Input for the algorithm included thestandard curve adjusted allele frequencies for each sampleand the list of 14 haplotypes observed in the study popu-lation.
Human subjects approvalSamples were collected under protocols reviewed andapproved by Institutional Review Boards of the Universityof Maryland School of Medicine and the University ofMali Faculty of Medicine. Informed consent was obtainedfrom all study participants or their guardians.
ResultsMSP-119 haplotypes in Bandiagara, MaliA total of 20 samples underwent PCR cloning. Sequencingof the clones from these samples identified 14 uniqueMSP-119 haplotypes circulating in the study population.The observed haplotypes are listed in Table 3. Three ofthese haplotypes have not been previously reported (i.e.QKSSGL, QKSSRL, and QTSSGL).
Accuracy and precision of allele frequency determinationSeveral factors can affect relative peak heights generatedduring Pyrosequencing, including the bases flanking thepolymorphic site (homopolymer formation occurs whenadjacent nucleotides are identical to one of the alleles atthe SNP site), increased signal from "A" alleles due to theuse of dATPαS instead of dATP in the Pyrosequencingreaction, and background signal [14]. To account for thesesources of variation and to standardize across the differentSNPs, standard curves were generated for each of the sixpolymorphic positions in MSP-119. Four replicates of eachdilution were genotyped on two different days. There wasno statistically significant difference between replicatesrun on different days (data not shown). The deviationbetween the expected and observed allele frequencies forall replicates was plotted over the range of expected fre-quencies (Figure 1). For each SNP, a standard curve wasfitted to the data. As observed in Figure 1, the allele fre-quencies at site 1701 required the most adjustment, witha correction of ~10% required as the frequency of the Gallele approached 100%. The other five SNPs requiredallele frequency corrections of <10%. Raw allele frequen-cies for each SNP were adjusted to the standard curve priorto haplotype estimation.
The mean residual errors for each SNP (i.e. the mean dif-ference between adjusted individual observations and thestandard curve) were 1.8%, 3.7%, 3.2%, 2.0%, 4.3%, and1.8%, respectively for positions 1644, 1691, 1699, 1700,1701, and 1716. These data suggest that allele frequencymeasurements at positions 1701 and 1691 were the leastprecise; however, all mean errors were less than 5%.
Validation of haplotype-estimating algorithmTo test the algorithm's ability to correctly estimate thehaplotypes present in mixed malaria infections, plasmidsfrom MSP-119 clones were used to make mixtures withknown frequencies of various MSP-119 haplotypes. Thesemixtures then underwent PCR, Pyrosequencing, and hap-
Linear system of equations to choose starting conditions for haplotype estimationFigure 2Linear system of equations to choose starting condi-tions for haplotype estimation. To address the concern of finding multiple local maxima during haplotype estimation, starting conditions were chosen by assuming the maximum number of haplotypes per infection was seven and finding all combinations of haplotypes that could explain the allele fre-quencies in the sample by solving a reduced linear system of equations.
f1f2f3f4f5f6f7f8f9f10
f11
f12
f13
f14
QKSNGLfii
p1
p2
p3
p4
p5
p6
1
1 0 0 0 0 1 0 1 1 0 1 1 1 0 1 1 0 0 0 1 1 1 0 1 1 1 0 1 1 1 1 1 1 1 1 0 1 0 1 1 1 11 1 0 0 1 1 0 1 0 1 0 0 0 11 1 0 1 1 1 0 1 0 1 0 1 1 11 1 1 1 1 0 1 1 1 1 1 1 1 01 1 1 1 1 1 1 1 1 1 1 1 1 1
=
i
Page 6 of 10(page number not for citation purposes)

Malaria Journal 2006, 5:31 http://www.malariajournal.com/content/5/1/31
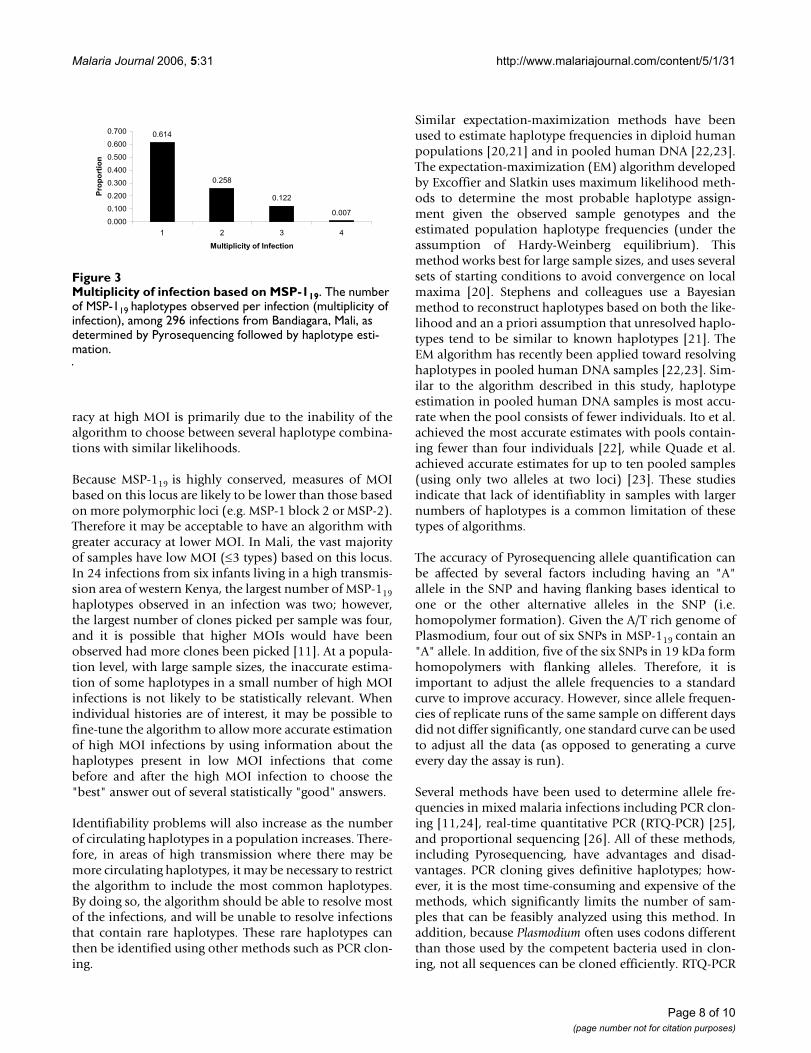
lotype-estimation. The actual and estimated haplotypesand their frequencies are shown in Table 4. Based solelyon maximum likelihood, the algorithm does very wellestimating up to three haplotypes. Haplotype estimationis less accurate for four or more haplotypes. Examiningthe algorithm output for the higher multiplicity of infec-tion (MOI) mixtures shows that the model yields multiple"good" answers with similar likelihoods, and conse-quently it is difficult to choose which "good" answer iscorrect (i.e. identifiability becomes a problem with highMOI infections). However, lower MOI infections make upa majority of the infections observed in Mali (Figure 3).Based on data from 296 infections from a malaria inci-dence study in Bandiagara, Mali, nearly 90% of infectionshave one or two MSP-l19 haplotypes (Figure 3).
DiscussionA high-throughput method that combines allele fre-quency determination by Pyrosequencing with a mathe-matical model was developed to estimate the MSP-119haplotypes present in mixed malaria infections. Afteradjustment to a standard curve, Pyrosequencing yieldsaccurate and precise estimates of the relative frequency ofalleles in mixed infections. The haplotype-estimatingalgorithm uses maximum likelihood methods to deter-mine the most probable combination of haplotypes giventhe allele frequencies for an infection and the haplotypesknown to be circulating in the population, and providesaccurate estimates of haplotypes present in lower multi-plicity of infection (MOI) infections (≤3 types). For higherMOI infections (≥4 types), the algorithm gives statisticallyreasonable, but less accurate, estimates. The reduced accu-
Table 4: Validation of haplotype-estimating algorithm. Known haplotype frequencies present in artificial mixtures of MSP-119 clones were compared to maximum likelihood estimates of haplotype frequencies generated using the algorithm.
Mixture Actual Haplotype (%) Maximum Likelihood Estimate Haplotype (%)
1 2 3 4 5 1 2 3 4 5
1 QKSNGL (70)
EKSNGL (30)
QKSNGL (73)
EKSNGL (27)
2 QKSNGL (30)
EKSNGL (70)
QKSNGL (37)
EKSNGL (63)
3 QKSNGL (70)
ETSNGL (30)
QKSNGL (72)
ETSNGL (28)
4 QKSNGL (30)
ETSNGL (70)
QKSNGL (33)
ETSNGL (67)
5 EKSSRL (70)
ETSNGL (30)
EKSSRL (70)
ETSNGL (30)
6 EKSSRL (30)
ETSNGL (70)
EKSSRL (29)
ETSNGL (63)
EKSNGF (07)
7 QKSNGF (70)
EKSSRL (30)
QKSNGF (75)
EKSSRL (25)
8 QKSNGF (30)
EKSSRL (70)
QKSNGF (38)
EKSSRL (62)
9 ETSSRL (35)
QKNNGL (15)
QKSNGL (50)
ETSSRL (31)
QKNNGL (14)
QKSNGL (55)
10 ETSSRL (15)
QKNNGL (35)
QKSNGL (50)
ETSSRL (14)
QKNNGL (38)
QKSNGL (49)
11 QKSNGL (47)
EKSNGL (20)
EKSSRL (33)
QKSNGL (50)
EKSNGL (21)
EKSSRL (29)
12 QKSNGL (20)
EKSNGL (47)
EKSSRL (33)
QKSNGL (21)
EKSNGL (49)
EKSSRL (31)
13 ETSSRL (23)
QKNNGL (10)
QKSNGL (33)
EKSNGL (33)
ETSSRL (21)
QKNNGL (15)
QKSNGL (31)
EKSNGL (33)
14 ETSSRL (10)
QKNNGL (23)
QKSNGL (33)
EKSNGL (33)
ETSSRL (10)
EKNNGL (30)
QKSNGL (60)
15 QKSNGL (31)
EKSNGL (13)
EKSSRL (22)
ETSSRL (33)
EKSNGL (49)
EKSSRL (18)
QTSSRL (33)
16 QKSNGL (13)
EKSNGL (31)
EKSSRL (22)
ETSSRL (33)
QKSNGL (14)
ETSNGL (33)
EKSSRL (53)
17 ETSSRL (15)
QKNNGL (07)
QKSNGL (22)
EKSNGL (22)
QKSNGF (33)
QTSSRL (14)
QKNNGL (07)
QKSNGL (47)
EKSNGF (32)
18 QKSNGL (21)
EKSNGL (09)
EKSSRL (15)
ETSSRL (22)
QKSNGF (33)
ETSNGL (17)
EKSNGL (22)
QKSSRL (31)
QKSNGF (30)
* Haplotypes indicated in bold type are not present and represent errors in haplotype estimation.
Page 7 of 10(page number not for citation purposes)
Malaria Journal 2006, 5:31 http://www.malariajournal.com/content/5/1/31
racy at high MOI is primarily due to the inability of thealgorithm to choose between several haplotype combina-tions with similar likelihoods.
Because MSP-119 is highly conserved, measures of MOIbased on this locus are likely to be lower than those basedon more polymorphic loci (e.g. MSP-1 block 2 or MSP-2).Therefore it may be acceptable to have an algorithm withgreater accuracy at lower MOI. In Mali, the vast majorityof samples have low MOI (≤3 types) based on this locus.In 24 infections from six infants living in a high transmis-sion area of western Kenya, the largest number of MSP-119haplotypes observed in an infection was two; however,the largest number of clones picked per sample was four,and it is possible that higher MOIs would have beenobserved had more clones been picked [11]. At a popula-tion level, with large sample sizes, the inaccurate estima-tion of some haplotypes in a small number of high MOIinfections is not likely to be statistically relevant. Whenindividual histories are of interest, it may be possible tofine-tune the algorithm to allow more accurate estimationof high MOI infections by using information about thehaplotypes present in low MOI infections that comebefore and after the high MOI infection to choose the"best" answer out of several statistically "good" answers.
Identifiability problems will also increase as the numberof circulating haplotypes in a population increases. There-fore, in areas of high transmission where there may bemore circulating haplotypes, it may be necessary to restrictthe algorithm to include the most common haplotypes.By doing so, the algorithm should be able to resolve mostof the infections, and will be unable to resolve infectionsthat contain rare haplotypes. These rare haplotypes canthen be identified using other methods such as PCR clon-ing.
Similar expectation-maximization methods have beenused to estimate haplotype frequencies in diploid humanpopulations [20,21] and in pooled human DNA [22,23].The expectation-maximization (EM) algorithm developedby Excoffier and Slatkin uses maximum likelihood meth-ods to determine the most probable haplotype assign-ment given the observed sample genotypes and theestimated population haplotype frequencies (under theassumption of Hardy-Weinberg equilibrium). Thismethod works best for large sample sizes, and uses severalsets of starting conditions to avoid convergence on localmaxima [20]. Stephens and colleagues use a Bayesianmethod to reconstruct haplotypes based on both the like-lihood and an a priori assumption that unresolved haplo-types tend to be similar to known haplotypes [21]. TheEM algorithm has recently been applied toward resolvinghaplotypes in pooled human DNA samples [22,23]. Sim-ilar to the algorithm described in this study, haplotypeestimation in pooled human DNA samples is most accu-rate when the pool consists of fewer individuals. Ito et al.achieved the most accurate estimates with pools contain-ing fewer than four individuals [22], while Quade et al.achieved accurate estimates for up to ten pooled samples(using only two alleles at two loci) [23]. These studiesindicate that lack of identifiablity in samples with largernumbers of haplotypes is a common limitation of thesetypes of algorithms.
The accuracy of Pyrosequencing allele quantification canbe affected by several factors including having an "A"allele in the SNP and having flanking bases identical toone or the other alternative alleles in the SNP (i.e.homopolymer formation). Given the A/T rich genome ofPlasmodium, four out of six SNPs in MSP-119 contain an"A" allele. In addition, five of the six SNPs in 19 kDa formhomopolymers with flanking alleles. Therefore, it isimportant to adjust the allele frequencies to a standardcurve to improve accuracy. However, since allele frequen-cies of replicate runs of the same sample on different daysdid not differ significantly, one standard curve can be usedto adjust all the data (as opposed to generating a curveevery day the assay is run).
Several methods have been used to determine allele fre-quencies in mixed malaria infections including PCR clon-ing [11,24], real-time quantitative PCR (RTQ-PCR) [25],and proportional sequencing [26]. All of these methods,including Pyrosequencing, have advantages and disad-vantages. PCR cloning gives definitive haplotypes; how-ever, it is the most time-consuming and expensive of themethods, which significantly limits the number of sam-ples that can be feasibly analyzed using this method. Inaddition, because Plasmodium often uses codons differentthan those used by the competent bacteria used in clon-ing, not all sequences can be cloned efficiently. RTQ-PCR
Multiplicity of infection based on MSP-119Figure 3Multiplicity of infection based on MSP-119. The number of MSP-119 haplotypes observed per infection (multiplicity of infection), among 296 infections from Bandiagara, Mali, as determined by Pyrosequencing followed by haplotype esti-mation.
0.614
0.258
0.122
0.0070.000
0.100
0.200
0.300
0.400
0.500
0.600
0.700
1 2 3 4
Multiplicity of Infection
Pro
po
rtio
n
Page 8 of 10(page number not for citation purposes)

Malaria Journal 2006, 5:31 http://www.malariajournal.com/content/5/1/31
is a more sensitive method than Pyrosequencing at detect-ing very low frequency alleles (<5%); however, it has alower throughput and requires more optimization thanPyrosequencing. Like RTQ-PCR, Pyrosequencing assaysare designed to detect known polymorphisms. Methodsthat rely on sequencing an entire region or gene of interest(e.g. PCR cloning) are better for detecting new SNPs. Pro-portional sequencing is a method that estimates allele fre-quencies in mixed infections by measuring the peakheights in direct sequencing electropherograms [26].While this method has similar applications and accuracyas Pyrosequencing, it is more expensive and has a lowerthroughput [26]. Because Pyrosequencing sequencesshort stretches of nucleotides (10–20 bp), for certain verypolymorphic loci (e.g. domain I of P. falciparum apicalmembrane antigen-1, another vaccine candidate antigen),it is not possible to set down a sequencing primer every 20bp. In this instance, proportional sequencing may bemore appropriate. If MSP-119 haplotypes are of interest,allele frequencies from any of these methods can be usedwith the haplotype-estimating algorithm described here.
The cost of equipment for Pyrosequencing is similar tothat for standard DNA sequencing, which is now done inseveral sub-Saharan African countries, including Mali.Pyrosequencing may be suitable for other applicationssuch as typing known single nucleotide polymorphismsin parasite genes that serve as molecular markers for drugresistant malaria.
ConclusionIn conclusion, Pyrosequencing is a technique that allowsreliable quantification of alleles in mixed malaria infec-tions. It is fast, relatively inexpensive, and can be used togenotype polymorphisms of interest in many importantPlasmodium genes such as those responsible for drugresistance, immunity, and virulence. In this study, Pyrose-quencing was adapted to measure the frequency of allelesin an erythrocytic vaccine candidate antigen MSP-119 andcombined with a haplotype-estimating algorithm to esti-mate the frequency of MSP-119haplotypes in infectedindividuals. This method is being used to understand thenatural dynamics of MSP-119, at both population andindividual levels, at a malaria vaccine-testing site in Ban-diagara, Mali, and can be used to monitor populationsduring large-scale vaccine trials to determine allele-spe-cific vaccine efficacy.
Authors' contributionsSLT conceived of the molecular aspects of the study, per-formed the laboratory work, and worked in collaborationwith DLS to develop the haplotype-estimating algorithm.DLS also helped draft the manuscript. OCS conceived ofthe haplotype-estimating algorithm. DC, MAT, and OKDparticipated in the conception, design, and conduct of the
malaria incidence and case-control studies at the Bandia-gara, Mali field site. CVP participated in the conception,design, and coordination of both the molecular and fieldstudies, and helped draft the manuscript.
AcknowledgementsWe thank the population of Bandiagara, Mali for their continued participa-tion in our studies, as well as the regional and district health authorities of Bandiagara, Mali for their continued support. We also thank Dr. Alan Shuldiner and the Division of Endocrinology, Diabetes, and Nutrition, Uni-versity of Maryland School of Medicine, for use of the Pyrosequencer, and Keith Tanner for technical support. This study was funded by MAID Con-tract N01AI85346 and the USAID Malaria Vaccine Program.
References1. Escalante AA, Lal AA, Ayala FJ: Genetic polymorphism and natu-
ral selection in the malaria parasite Plasmodium falciparum.Genetics 1998, 149:189-202.
2. Hughes AL: Positive selection and interallelic recombinationat the merozoite surface antigen-1 (MSA-1) locus of Plasmo-dium falciparum. Mol Biol Evol 1992, 9:381-393.
3. Hughes MK, Hughes AL: Natural selection on Plasmodium sur-face proteins. Mol Biochem Parasitol 1995, 71:99-113.
4. Blackman MJ, Heidrich HG, Donachie S, McBride JS, Holder AA: Asingle fragment of a malaria merozoite surface proteinremains on the parasite during red cell invasion and is thetarget of invasion- inhibiting antibodies. J Exp Med 1990,172:379-382.
5. Holder AA, Blackman MJ, Burghaus PA, Chappel JA, Ling IT, McCal-lum-Deighton N, Shai S: A malaria merozoite surface protein(MSP1)-structure, processing and function. Mem Inst OswaldoCruz 1992, 87:37-42.
6. Branch OH, Udhayakumar V, Hightower AW, Oloo AJ, Hawley WA,Nahlen BL, Bloland PB, Kaslow DC, Lal AA: A longitudinal investi-gation of IgG and IgM antibody responses to the merozoitesurface protein-1 19-kiloDalton domain of Plasmodium falci-parum in pregnant women and infants: associations withfebrile illness, parasitemia, and anemia. Am J Trop Med Hyg1998, 58:211-219.
7. Egan AF, Morris J, Barnish G, Allen S, Greenwood BM, Kaslow DC,Holder AA, Riley EM: Clinical immunity to Plasmodium falci-parum malaria is associated with serum antibodies to the 19-kDa C-terminal fragment of the merozoite surface antigen,PfMSP-1. J Infect Dis 1996, 173:765-769.
8. Riley EM, Allen SJ, Wheeler JG, Blackman MJ, Bennett S, Takacs B,Schonfeld HJ, Holder AA, Greenwood BM: Naturally acquired cel-lular and humoral immune responses to the major mero-zoite surface antigen (PfMSP1) of Plasmodium falciparum areassociated with reduced malaria morbidity. Parasite Immunol1992, 14:321-337.
9. Miller LH, Roberts T, Shahabuddin M, McCutchan TF: Analysis ofsequence diversity in the Plasmodium falciparum merozoitesurface protein-1 (MSP-1). Mol Biochem Parasitol 1993, 59:1-14.
10. Ferreira MU, Ribeiro WL, Tonon AP, Kawamoto F, Rich SM:Sequence diversity and evolution of the malaria vaccine can-didate merozoite surface protein-1 (MSP-1) of Plasmodiumfalciparum. Gene 2003, 304:65-75.
11. Qari SH, Shi YP, Goldman IF, Nahlen BL, Tibayrenc M, Lal AA: Pre-dicted and observed alleles of Plasmodium falciparum mero-zoite surface protein-1 (MSP-1), a potential malaria vaccineantigen. Mol Biochem Parasitol 1998, 92:241-252.
12. Sakihama N, Kimura M, Hirayama K, Kanda T, Na-Bangchang K, Jong-wutiwes S, Conway D, Tanabe K: Allelic recombination and link-age disequilibrium within Msp-1 of Plasmodium falciparum,the malignant human malaria parasite. Gene 1999, 230:47-54.
13. Da Silveira LA, Ribeiro WL, Kirchgatter K, Wunderlich G, MatsuokaH, Tanabe K, Ferreira MU: Sequence diversity and linkage dise-quilibrium within the Merozoite Surface Protein-1 (MSP-1)locus of Plasmodium falciparum: A longitudinal study in Bra-zil. J Eukaryot Microbiol 2001, 48:433-439.
Page 9 of 10(page number not for citation purposes)

Malaria Journal 2006, 5:31 http://www.malariajournal.com/content/5/1/31
Publish with BioMed Central and every scientist can read your work free of charge
"BioMed Central will be the most significant development for disseminating the results of biomedical research in our lifetime."
Sir Paul Nurse, Cancer Research UK
Your research papers will be:
available free of charge to the entire biomedical community
peer reviewed and published immediately upon acceptance
cited in PubMed and archived on PubMed Central
yours — you keep the copyright
Submit your manuscript here:http://www.biomedcentral.com/info/publishing_adv.asp
BioMedcentral
14. Gruber JD, Colligan PB, Wolford JK: Estimation of single nucle-otide polymorphism allele frequency in DNA pools by usingPyrosequencing. Hum Genet 2002, 110:395-401.
15. Wasson J, Skolnick G, Love-Gregory L, Permutt MA: Assessingallele frequencies of single nucleotide polymorphisms inDNA pools by pyrosequencing technology. Biotechniques 2002,32:1144-1146.
16. Tost J, Dunker J, Gut IG: Analysis and quantification of multiplemethylation variable positions in CpG islands by Pyrose-quencing. Biotechniques 2003, 35:152-156.
17. Lyke KE, Dicko A, Kone A, Coulibaly D, Guindo A, Cissoko Y, TraoreK, Plowe CV, Doumbo OK: Incidence of severe Plasmodium fal-ciparum malaria as a primary endpoint for vaccine efficacytrials in Bandiagara, Mali. Vaccine 2004, 22:3169-3174.
18. Coulibaly D, Diallo DA, Thera MA, Dicko A, Guindo AB, Kone AK,Cissoko Y, Coulibaly S, Djimde A, Lyke K, Doumbo OK, Plowe CV:Impact of preseason treatment on incidence of falciparummalaria and parasite density at a site for testing malaria vac-cines in Bandiagara, Mali. Am J Trop Med Hyg 2002, 67:604-610.
19. Hill WG, Babiker HA: Estimation of numbers of malaria clonesin blood samples. Proc R Soc Lond B 1995, 262:249-257.
20. Excoffier L, Slatkin M: Maximum-likelihood estimation ofmolecular haplotype frequencies in a diploid population. MolBiol Evol 1995, 12:921-927.
21. Stephens M, Smith NJ, Donnelly P: A new statistical method forhaplotype reconstruction from population data. Am J HumGenet 2001, 68:978-989.
22. Ito T, Chiku S, Inoue E, Tomita M, Morisaki T, Morisaki H, KamataniN: Estimation of haplotype frequencies, linkage-disequilib-rium measures, and combination of haplotype copies in eachpool by use of pooled DNA data. Am J Hum Genet 2003,72:384-398.
23. Quade SR, Elston RC, Goddard KA: Estimating haplotype fre-quencies in pooled DNA samples when there is genotypingerror. BMC Genetics 2005, 6:25.
24. Escalante AA, Grebert HM, Chaiyaroj SC, Magris M, Biswas S, NahlenBL, Lal AA: Polymorphism in the gene encoding the apicalmembrane antigen-1 (AMA-1) of Plasmodium falciparum. X.Asembo Bay Cohort Project. Mol Biochem Parasitol 2001,113:279-287.
25. Cheesman SJ, de Roode JC, Read AF, Carter R: Real-time quanti-tative PCR for analysis of genetically mixed infections ofmalaria parasites: technique validation and applications. MolBiochem Parasitol 2003, 131:83-91.
26. Hunt P, Fawcett R, Carter R, Walliker D: Estimating SNP propor-tions in populations of malaria parasites by sequencing: vali-dation and applications. Mol Biochem Parasitol 2005, 143:173-182.
Page 10 of 10(page number not for citation purposes)