Embed Size (px)
Citation preview

June 24-25, 2004昆明(Kunming), China
Ryosuke Hata
HTS Transmission Network will be the key of 21st
Century’s Power Grid
HTS Transmission Network will be the key of 21st
Century’s Power Grid
Symposium on HTS Cable ApplicationsSymposium on HTS Cable Applications
1
2
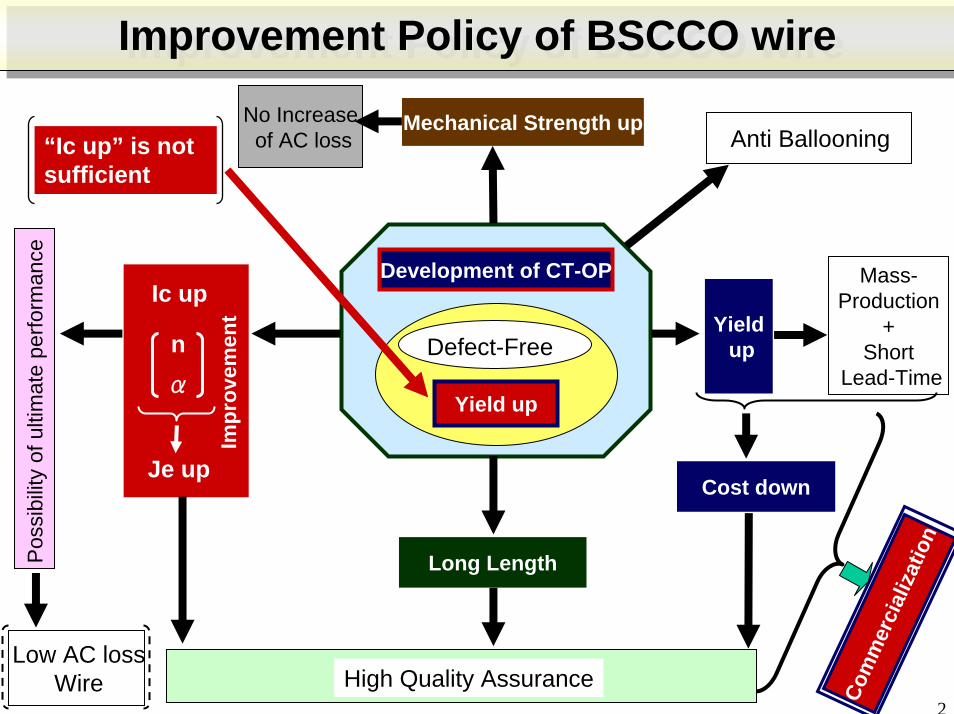
Improvement Policy of BSCCO wireImprovement Policy of BSCCO wire
Com
mer
cial
izat
ion
Pos
sibi
lity
of u
ltim
ate
perfo
rman
ce
Long Length
Cost down
Yieldup
Mechanical Strength upNo Increaseof AC loss
Yield up
Development of CT-OP
Defect-Free
“Ic up” is notsufficient
Anti Ballooning
Ic up
nα
Je up
Low AC lossWire High Quality Assurance
Mass-Production
+Short
Lead-Time
Impr
ovem
ent
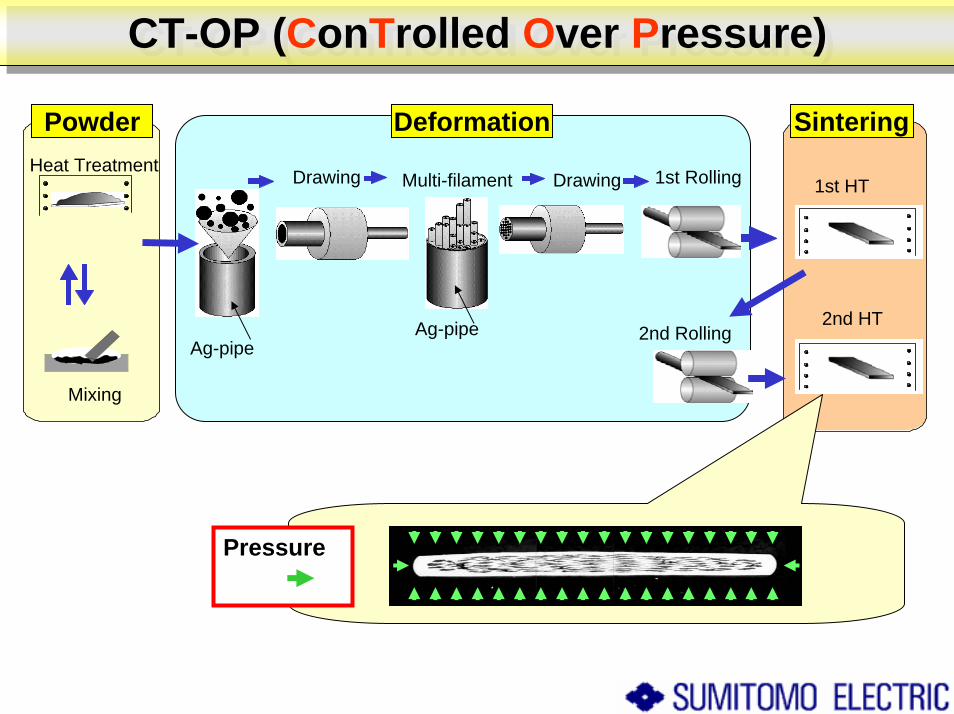
CT-OP (ConTrolled Over Pressure)CT-OP (ConTrolled Over Pressure)
焼結Heat Treatment
Mixing
Powder
Drawing Multi-filament
Deformation
Drawing 1st Rolling
Sintering
テープ線材
1st HT
2nd Rolling2nd HT
Ag-pipeAg-pipe
Pressure
3
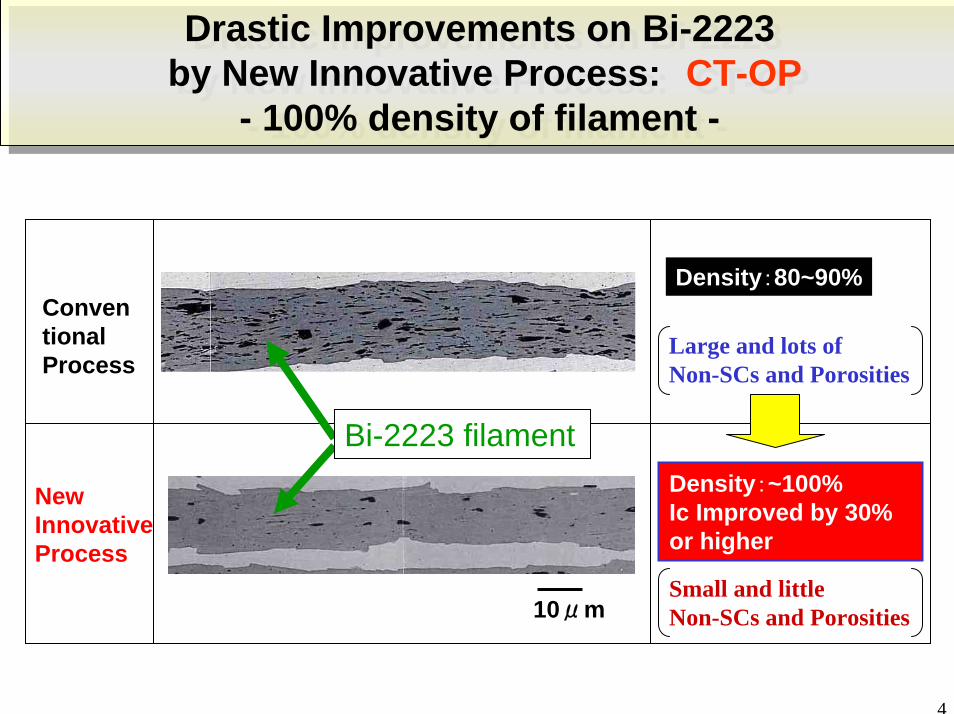
Large and lots of Non-SCs and Porosities
Small and little Non-SCs and Porosities10μm
Density:~100%Ic Improved by 30% or higher
Density:80~90%Conventional Process
New Innovative Process
Bi-2223 filament
Drastic Improvements on Bi-2223by New Innovative Process: CT-OP
- 100% density of filament -
Drastic Improvements on Bi-2223by New Innovative Process: CT-OP
- 100% density of filament -
4

●High Yield and Long Length by exterminating Defects During Sintering
1atm CT-OP
Critical Current (Ic)
Critical Current
Density (Jc)
99 A ~130A~1,000m
37 kA/cm226 kA/cm2
~40% UP
●Improved Jc & Ic by Increased Density up to 100% and Decreased Non-superconducting Phases
Effects achieved with CT-OP (1)Effects achieved with CT-OP (1)
~30% UP
5

0.0
0.2
0.4
0.6
0.8
1.0
1.2
0 50 100 150 200 250Tensile Stress@77 K (MPa)
Ic/Ic
o
1atm122 MPa
CT-OP213 MPa
No Need for Additional Metal for Mechanical Properties
●Increased Tensile Strength by 70%
●Anti-Ballooning when immersed in LN2
Cables & Magnets
Improved MechanicalProperties
(70% or more)
CT-OP
100% Density
No Room for LN2 Immersion
Effects achieved with CT-OP (2)Effects achieved with CT-OP (2)
Ballooning :zero in 1,000m CT-OP Wire6

7
M= $A・m
($ / m)A=
(Cost ↓)(Ic ↑)
A×# of wire
A×Turn
Cable
Magnet➪A・m
Cost reduction by CT-OP
C cost =∂Dαβ
1+X
∂: Available Ic(A)D : Merit Figure($/A・m)α: Yield (Long Wire)β: Ic Increment Ratio X : Cost of CT-OP($/m)
(A) Non CT-OP(Old Process)
(B) CT-OP(New Process)
=∂D 0.2×11
C1
=∂D 0.9×1.31
C2 ・ +X≒∂D0.9×1.31
Z =C1C2
=∂D 0.9×1.3
1・
∂D 0.21
・=0.9×1.3
0.2=0.17・~~・ 0.2
Long-length(>500m) BSCCO wire is expected to be lower than $100/KA・m as a price.
Expectation of Cost Reduction
Cost Down and Merit Figure of BSCCO wireCost Down and Merit Figure of BSCCO wire
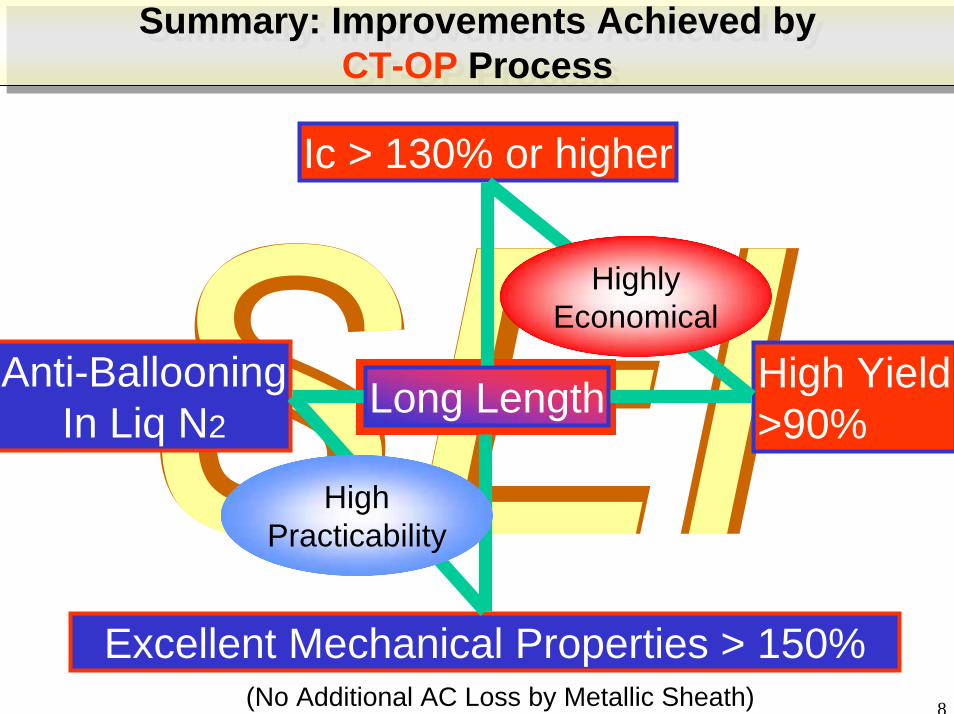
Summary: Improvements Achieved byCT-OP Process
Summary: Improvements Achieved byCT-OP Process
Ic > 130% or higher
Long Length High Yield>90%
Anti-BallooningIn Liq N2
Excellent Mechanical Properties > 150%
HighlyEconomical
HighPracticability
(No Additional AC Loss by Metallic Sheath) 8

Comparison of Japan, US, EU, China and RussiaComparison of Japan, US, EU, China and Russia
Japan US EU China Russia
Population Million 127 281 456 1270 146
Nation’s Currency
465Trillion-Yen
11.0Trillion-USD
8.0Trillion-EUR
10.2Trillion-Yuan
13.0Trillion-Rouble
Trillion-USD 4.23 11.0 9.70 1.23 0.45
USD/capita 33,000 39,000 21,000 970 3,000
GW 260 860 650 320 210
kW/capita 2.0 3.1 1.4 0.25 1.44
Electric Power Generation
GDP
1275273126
2004 20002004 20002004 2000
0.998.904.43
0.182.91.6
240800200
78033,00035,000
8.28.9500
<Investigated at 2004>
9
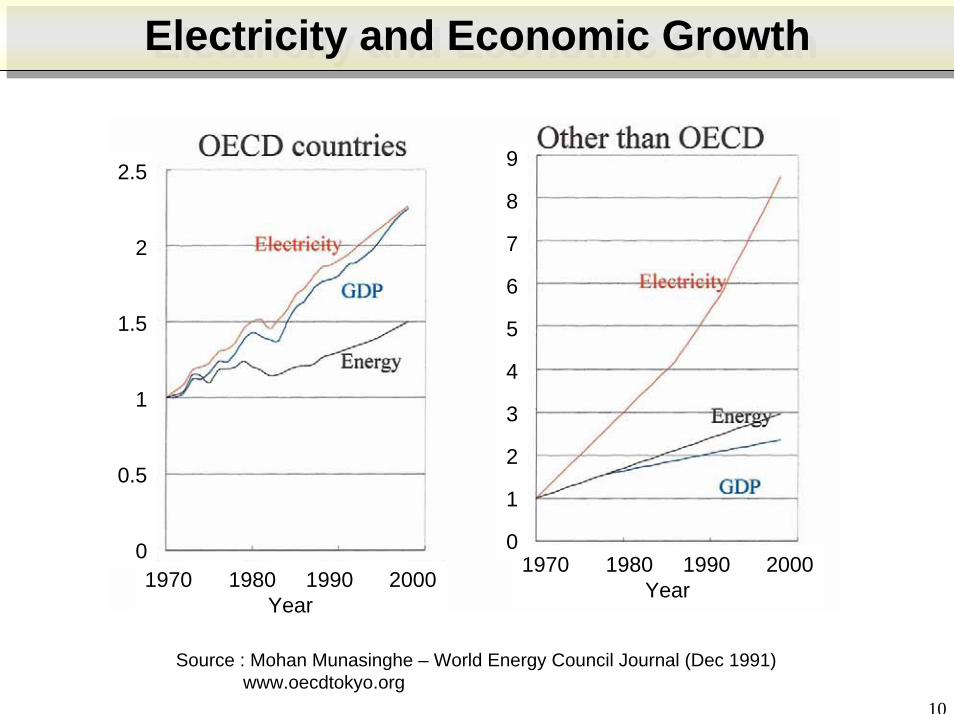
Electricity and Economic GrowthElectricity and Economic Growth
1970 1980 1990 2000Year
1970 1980 1990 2000Year
2.5
2
1.5
1
0.5
0
9
8
7
6
5
4
3
2
1
0
Source : Mohan Munasinghe – World Energy Council Journal (Dec 1991)www.oecdtokyo.org
10
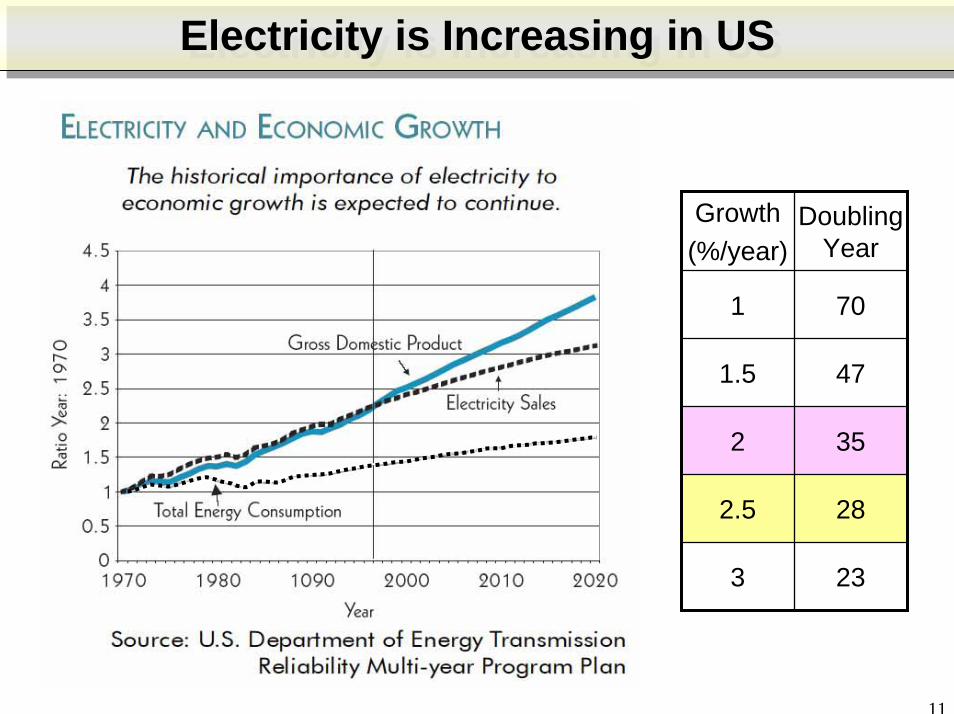
Electricity is Increasing in USElectricity is Increasing in US
Growth(%/year)
Doubling Year
1 70
1.5 47
2 35
2.5 28
3 23
11

Transmission Investments are Decreasing in USTransmission Investments are Decreasing in US
Note
×
California Blackout
Few cables
Numerous Power Generations
12

Trend of Maximum Electricity (TEPCO in Japan)Trend of Maximum Electricity (TEPCO in Japan)
Max. at Summer
Max. at Winter
Max. Total Demand per Day
Max
. Tot
al D
eman
d pe
r Day
(GW
h)
Max
. Pow
er D
eman
d (1
0MW
)
<Average Electricity Growth of Japan : 1~2% in Coming 10 Years >
~7%/Year
Trend of Maximum Demand of Electricity (TEPCO)
Electricity Supply Must Satisfy Max. Demand !13
14
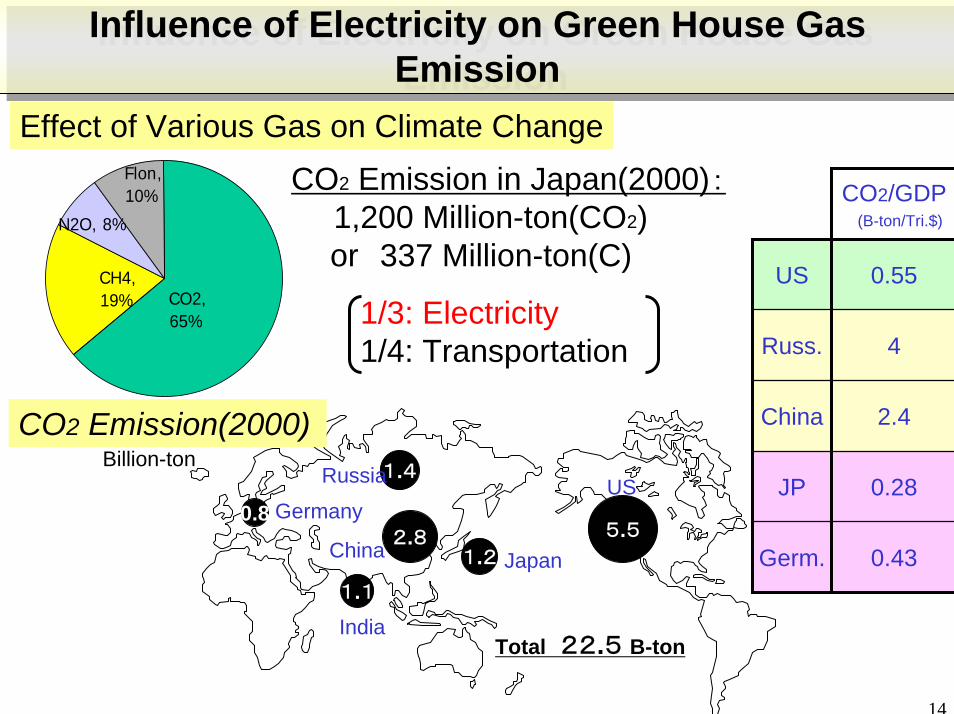
Effect of Various Gas on Climate ChangeCO2 Emission in Japan(2000):
1,200 Million-ton(CO2)or 337 Million-ton(C)
1/3: Electricity1/4: Transportation
Influence of Electricity on Green House Gas Emission
Influence of Electricity on Green House Gas Emission
0.8
1.11.2
1.4
2.8 5.5Germany
Russia
China
India
Japan
US
CO2 Emission(2000)
Total 22.5 B-ton
Billion-ton
Flon,10%
N2O, 8%
CH4,19% CO2,
65%
CO2/GDP(B-ton/Tri.$)
US 0.55
Russ. 4
China 2.4
JP 0.28
Germ. 0.43
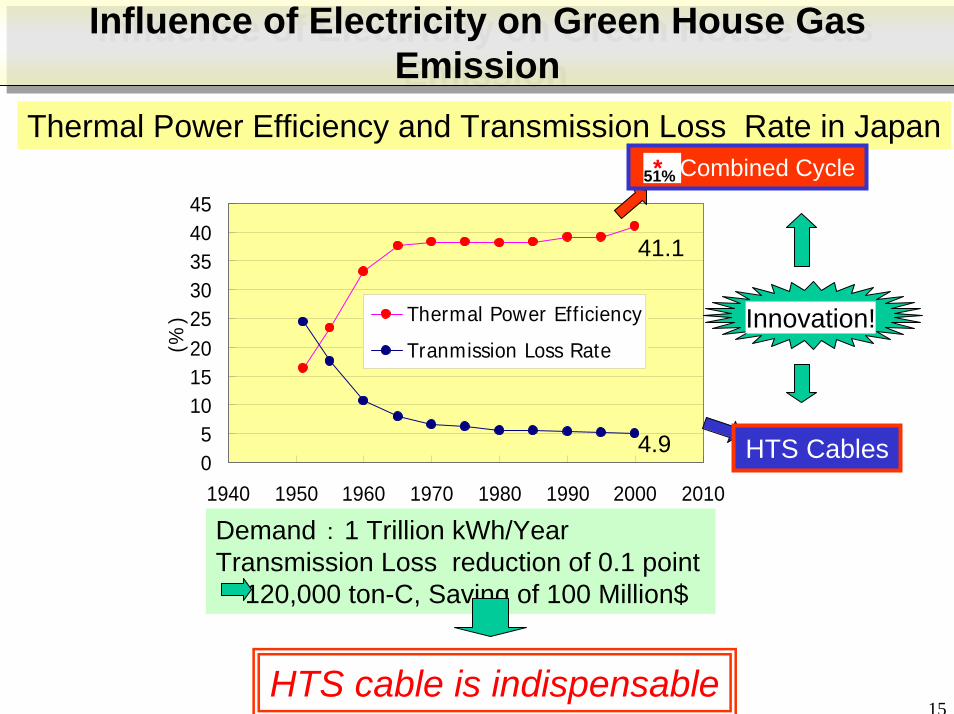
Influence of Electricity on Green House Gas Emission
Influence of Electricity on Green House Gas Emission
05
1015202530354045
1940 1950 1960 1970 1980 1990 2000 2010
(%) Thermal Power Efficiency
Tranmission Loss Rate
Demand : 1 Trillion kWh/YearTransmission Loss reduction of 0.1 point
120,000 ton-C, Saving of 100 Million$
4.9
41.1
Thermal Power Efficiency and Transmission Loss Rate in JapanCombined Cycle
HTS Cables
*51%
Innovation!
HTS cable is indispensable15
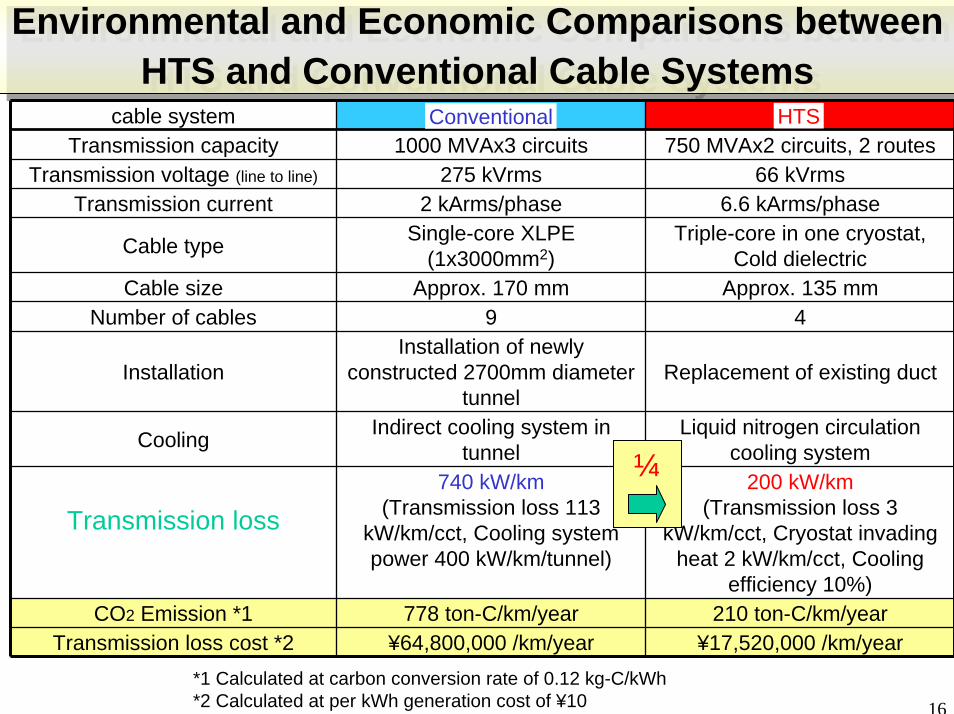
16*1 Calculated at carbon conversion rate of 0.12 kg-C/kWh *2 Calculated at per kWh generation cost of ¥10
Environmental and Economic Comparisons between HTS and Conventional Cable Systems
Environmental and Economic Comparisons between HTS and Conventional Cable Systems
cable system Conventional HTSTransmission capacity 1000 MVAx3 circuits
275 kVrms2 kArms/phase
Single-core XLPE (1x3000mm2)
Approx. 170 mm9
Installation of newly constructed 2700mm diameter
tunnelIndirect cooling system in
tunnel740 kW/km
(Transmission loss 113 kW/km/cct, Cooling system power 400 kW/km/tunnel)
778 ton-C/km/year¥64,800,000 /km/year
750 MVAx2 circuits, 2 routesTransmission voltage (line to line) 66 kVrms
Transmission current 6.6 kArms/phase
Cable type Triple-core in one cryostat,Cold dielectric
Cable size Approx. 135 mmNumber of cables 4
Installation Replacement of existing duct
Cooling Liquid nitrogen circulation cooling system
Transmission loss200 kW/km
(Transmission loss 3 kW/km/cct, Cryostat invading
heat 2 kW/km/cct, Cooling efficiency 10%)
CO2 Emission *1 210 ton-C/km/yearTransmission loss cost *2 ¥17,520,000 /km/year
¼
Conventional HTS

100m-114MVA-1000A CableCold dielectric designed 3-Phase in One Cryostat100m-114MVA-1000A Cable
Cold dielectric designed 3-Phase in One Cryostat
φ136mm
φ39mm
Corrugated SUS pipe cryostat (thermal insulation)-High Integrity
former
Superconducting conductor
PPLP Electric insulation(high dielectric stress,small dielectric loss)
Developed by SEI
Superconducting shield
Bi-2223 tape
0.5mm
17

18
Underground Transmission CableUnderground Transmission Cable
Liquid
Solid
Gas
OF
AC
DC
AC
Solid (Mass-Impregnation)
AC
DCXLPE
GIL
HTS
H/Q: PPLP 800kV Sub-Marine
Honshu-Shikoku Interconnection:PPLP 500kV
Tachibana-bay: PPLP 500kV Sub-Marine
Kraft/PPLP 500 ~ 800kV400M ~ 2GW
275/500kV
275/500kV
275/500kV
Electric Insulation
DC
AC
DC PPLP 1kV~
(Paper-Lapped)
PPLP
PPLP
PPLP
PPLP
Commercially Used
Prototype Produced
Under Development
PPLP 35-275kVPPLP
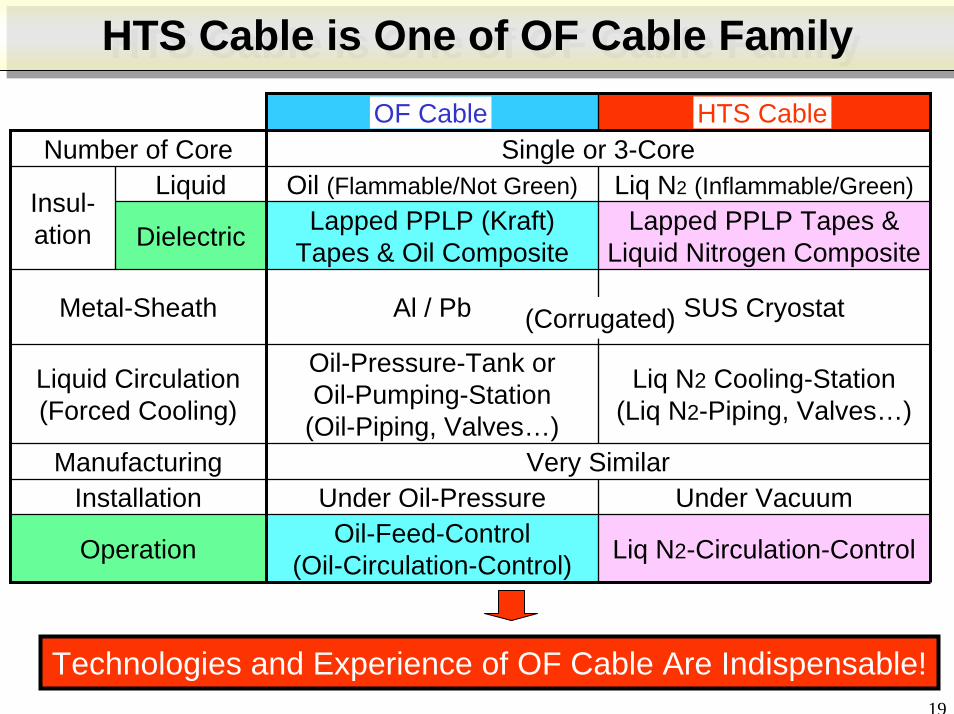
OF Cable HTS CableNumber of Core Single or 3-Core
Liquid Oil (Flammable/Not Green) Liq N2 (Inflammable/Green)Insul-ation
Metal-Sheath
Liquid Circulation(Forced Cooling)
ManufacturingInstallation
Operation
Dielectric Lapped PPLP (Kraft) Tapes & Oil Composite
Lapped PPLP Tapes & Liquid Nitrogen Composite
Al / Pb SUS Cryostat
Oil-Pressure-Tank orOil-Pumping-Station
(Oil-Piping, Valves…)
Liq N2 Cooling-Station(Liq N2-Piping, Valves…)
Very SimilarUnder Oil-Pressure Under Vacuum
Oil-Feed-Control(Oil-Circulation-Control) Liq N2-Circulation-Control
HTS Cable is One of OF Cable FamilyHTS Cable is One of OF Cable Family
(Corrugated)
Technologies and Experience of OF Cable Are Indispensable!
HTS CableOF Cable
19

Hollow porcelain
FRP bushingCurrent lead
Electrical shielding
Epoxy resin unit
Insulation paperHTSC cable core
SC-NC joint
LN2
Thermallyinsulated layer
Oil
Hollow porcelain
FRP bushingCurrent lead
Electrical shielding
Epoxy resin unit
Insulation paperHTSC cable core
SC-NC joint
LN2
Thermallyinsulated layer
Oil
HTS Wire Stranding Electric
Insulation 3 cores Cabling Cryostat
Laying
Splitter& Splicing Termination Cooling system
Operation System
Wide Range of Technologies for HTS CableManufacturing, Installation & Operation
Wide Range of Technologies for HTS CableManufacturing, Installation & Operation
Plastics Jacketing
&Evacuating and Testing
&ShippingShipping
Evacuating and Testing
Plastics Jacketing
20

21
2.7kA(77K) →4kA(69.5K)
Phase C
-2000
-1500
-1000
-500
0
500
1000
1500
2000
0 10 20 30 40 50 60
Time [msec]
Current [Apeak]
ConductorShield Shielding Current with
Opposite Phase
-0.01
0
0.01
0.02
0.03
0.04
0.05
0.06
0 1000 2000 3000 4000 5000
DC Current [A]
Voltage[V]
69.5K
73.2K76.6K
Ic Criterion (1μV/cm)
Merits of HTS cableMerits of HTS cable
*No Loss in Cryostat& Outside*EMI-Free
Time [msec]
Cur
rent
[A p
eak]
Shield
Conductor
69.5K
73.2K76.6K
DC Current [A]V
olta
ge [V
]
77.3K
0 1000 2000 3000 4000 5000
Ic can be increased “Largely and Easily”by “Controlling Liq-N2 Flow”
Ic Criterion (1µV/cm)

22
“3-2” “2-2”
3cct. 2/3 Load Each(67%/cct.×3=200%)
2cct. Full Load(100%/cct.×2=200%)
<Capacity/Route:1>
3cct. Full Load(100%/cct.×3=300%)<Capacity/Route:1.5>
Full load on 2cct.(100%/cct.×2=200%)
Overload on 1cct.(200%/cct.×1=200%)
Overload on 2cct.(150%/cct.×2=300%)
Over-redundancyHigh reliability
Less LossBut high cost
Reliability and Not costly in Initial Investment.Less Right of Way,Reduction of Civil and Cable Cost
“3-3”
Establishment of Transmission System ReliabilityEstablishment of Transmission System Reliability
LN2 pipe
CoolingStation[1]
Cooling Station[2]
Conventional Cable(OF/XLPE) HTS Cable
Circuit Configuration
per Route
Normal Condition
In case of Emergency
Failure on One Circuit
Economy
CoolingStation[1]
Cooling Station[2]
Cooling Station[3]
CoolingStation[1]
Cooling Station[2]
CoolingStation[1]
Cooling Station[2]
Cooling Station[3]
LN2 pipe
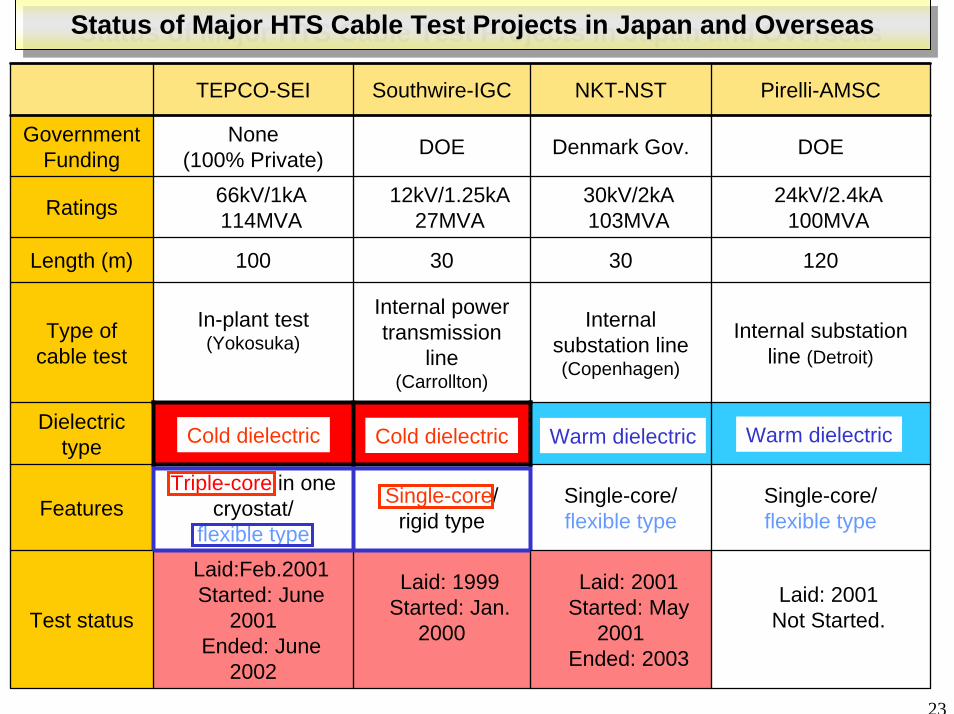
Status of Major HTS Cable Test Projects in Japan and OverseasStatus of Major HTS Cable Test Projects in Japan and Overseas
TEPCO-SEI Southwire-IGC NKT-NST Pirelli-AMSC
Government Funding
None (100% Private) DOE Denmark Gov. DOE
Ratings 66kV/1kA114MVA
12kV/1.25kA27MVA
30kV/2kA103MVA
24kV/2.4kA100MVA
Length (m) 100 30 30 120
Type of cable test
In-plant test (Yokosuka)
Internal power transmission
line(Carrollton)
Internal substation line (Copenhagen)
Internal substation line (Detroit)
Dielectric type Cold dielectric Cold dielectric Warm dielectric Warm dielectric
FeaturesTriple-core in one
cryostat/ flexible type
Single-core/rigid type
Single-core/flexible type
Single-core/flexible type
Test status
Laid:Feb.2001Started: June
2001Ended: June
2002
Laid: 1999Started: Jan.
2000
Laid: 2001Started: May
2001Ended: 2003
Laid: 2001Not Started.
Cold dielectric Cold dielectric Warm dielectric Warm dielectric
23

24
International CollaborationInternational Collaboration
AmericanSuperconductorNexans
SuperPower
ULTERAMaterial
Cable
Japan
Europe
United States
Albany Project
Ohio ProjectLIPA Project
Wire Cross Licensing& Cable Business LOI
Sumitomo Electric

Albany ProjectAlbany Project
Purpose: Demonstration of the long length HTS cablein the real net work in US
Members: Super Power / SEI / Niagara-Mohawk /BOCProject cost :26M$ including NY (6M$) and DOE(13M$)
Huds
on R
iver
HTS Cable350m
25
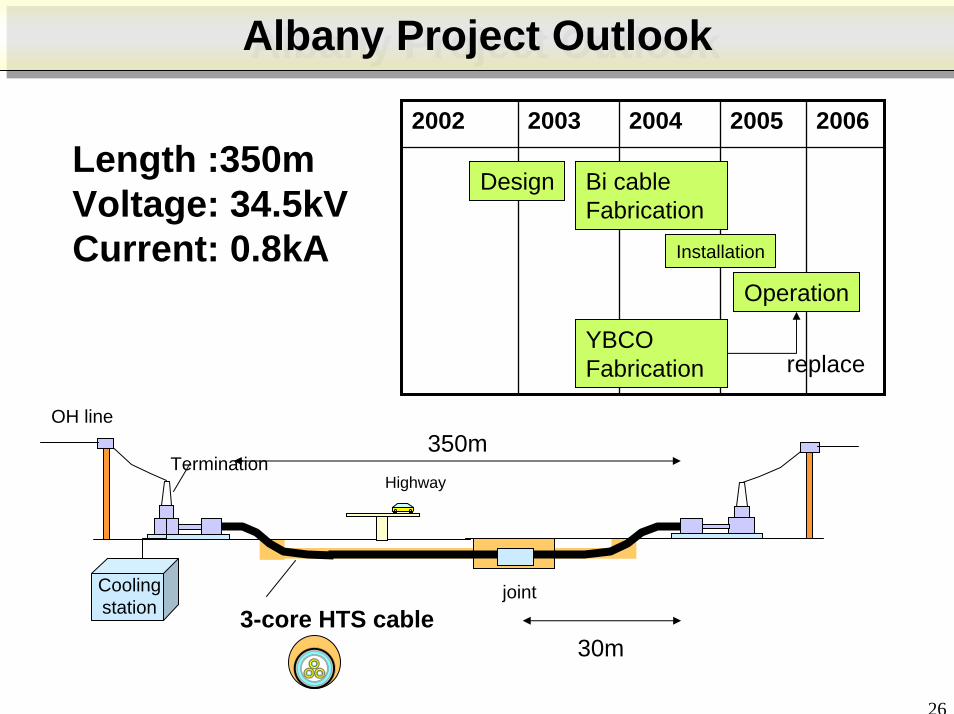
Albany Project OutlookAlbany Project Outlook
Length :350m Voltage: 34.5kVCurrent: 0.8kA
2002 2003 2004 2005 2006
Design Bi cableFabrication
Installation
Operation
YBCOFabrication replace
OH line
joint
350mTermination
3-core HTS cableCoolingstation
Highway
30m
26

Power cable market of 21th CenturyPower cable market of 21th Century
1975 2000 2025 2050 2075 2100
Demand
HTS cable will enjoy Long Life Market for New Installation and Replacement.
Capacity of Generation*
Demand growth rate (%/yr.)
Demand doubling year
Peak of renewal
0.7% ~2040~20102.0%
9.0%6.0%
Capacity ratio (2020/2003)
Japan 260GW 100 1.1(286GW)USA 860GW 35 1.4(1200GW)Korea 50GW 8 3.7(185GW)China 320GW 12 2.7(860GW)
* (investigated at 2003) 27
ConclusionConclusion
(I) 3 HTS Cable Demonstrations in Yokosuka (Japan), Copenhagen (Denmark) and Carrollton (US) were successfully implemented.
(II) 3 Bi-based Cable projects have started in US under international collaborations. Also, HTS cable Projects are on-going in Korea and China.
(III) Big Innovation of Bi-based wire has been achieved. Ic, Mechanical Properties, Anti-Ballooning Properties and Yield of Bi-Based wires are simultaneously improved greatly.
(IV) HTS Cables with Large Transmission Capacity and Low Loss are Environmentally Friendly, hence Indispensable for 21st Century’s Power Grid.
HTS’s Era is about to dawn !28


![AP1000 Installation Guide eng 040623 Guide_eng.pdf[Organization] The VoiceFinder AP1000 VoIP Gateway Installation Guide is offered to assist the ... VoiceFinder AP1000 VoIP Gateway](https://img.dokumen.tips/doc/110x75/6023a9082d103d7c1a084ddd/ap1000-installation-guide-eng-040623-guideengpdf-organization-the-voicefinder.jpg)