Embed Size (px)
Citation preview

Document ID: TEV-672Revision ID: 2
Effective Date: 09/30/2011
Technical Evaluation Study
Project No. 23843
HTGR-Integrated Coal and Gas to Liquids Production Analysis


Form 412.09 (Rev. 10)
Idaho National Laboratory
HTGR-INTEGRATED COAL AND GAS TO
LIQUIDS PRODUCTION ANALYSIS
Identifier: Revision: Effective Date:
TEV-672
2
09/30/2011 Page: 2 of 76
REVISION LOG
Rev. Date Affected Pages Revision Description
0 11/05/2009 All Newly issued document.
1 05/15/2010 All Added economic and GHG emissions sections.
2 09/30/2011 All Updated process model to Aspen Plus version 7.3, updated economic analysis to include updated HTGR cost estimate.

Form 412.09 (Rev. 10)
Idaho National Laboratory
HTGR-INTEGRATED COAL AND GAS TO
LIQUIDS PRODUCTION ANALYSIS
Identifier: Revision: Effective Date:
TEV-672
2
09/30/2011 Page: 3 of 76
EXECUTIVE SUMMARY
This technical evaluation (TEV) has been prepared as part of a study for the Next Generation Nuclear Plant (NGNP) Project to evaluate the integration of high-temperature gas-cooled reactor (HTGR) technology with conventional chemical processes. This TEV addresses the integration of HTGR heat and power into both coal to liquids (CTL) and gas to liquids (GTL) production; specifically, the technical and economic feasibility of the HTGR integration. The main liquid product produced in the CTL and GTL processes is diesel fuel. The economic results presented in this TEV are preliminary and should be refined as the design of the HTGR progresses, if the design of the HTGR is changed significantly, or if additional refinements of the HTGR and/or CTL and GTL capital and/or operating costs become available. The HTGR capital, operating and maintenance (O&M) costs, fuel, and decommissioning costs are based on the correlations and costs presented for an nth of a kind HTGR in TEV-1196 (Idaho National Laboratory [INL] 2011a).
The following conclusions were drawn when evaluating the nuclear-integrated CTL process against the conventional process:
One 664 MWt 850°C ROT HTGR for heat production and nine 604 MWt 700°C ROT HTGRs for power production would be required to support production of 50,000 bbl/day of liquid fuel products.
Nuclear integration decreases coal consumption by 65% using an HTGR and high temperature steam electrolysis as the hydrogen source.
Nuclear integration decreases CO2 emissions by 83% if sequestration is assumed and 96% without sequestration.
Economically, the nuclear-integrated CTL case provides a lower internal rate of return (IRR) than the conventional CTL case, either with or without CO2 sequestration. Figure ES-1 presents the IRR versus the diesel selling price for the conventional and nuclear-integrated cases.
The carbon tax results show that the nuclear-integrated CTL case outperforms the conventional case at a 12% IRR when the carbon tax is approximately $120/ton-CO2. Figure ES-2 presents the carbon tax results for the CTL cases analyzed.
An economic sensitivity analysis was performed, it was determined the uncertainty in the HTGR TCI can have the largest impact on the required product selling price, followed by assumed IRR, the debt to equity ratio, and the assumed economic recovery period. Figure ES-3 presents a tornado diagram for nuclear-integrated CTL process, showing the resulting diesel price when varying the baseline economic assumptions.

Form 412.09 (Rev. 10)
Idaho National Laboratory
HTGR-INTEGRATED COAL AND GAS TO
LIQUIDS PRODUCTION ANALYSIS
Identifier: Revision: Effective Date:
TEV-672
2
09/30/2011 Page: 4 of 76
Figure ES-1. CTL cases, IRR as a function of the diesel selling price, 12% IRR.
Figure ES-2. CTL cases, diesel price as a function of a carbon tax on CO2 emissions, 12% IRR.
-10
-5
0
5
10
15
20
25
30
35
40
$1.5 $2.0 $2.5 $3.0 $3.5 $4.0 $4.5
% I
RR
Diesel Price ($/gal)
HTGR CTL CTL CTL Sequestration
$0.00
$1.00
$2.00
$3.00
$4.00
$5.00
$6.00
$7.00
$0 $20 $40 $60 $80 $100 $120 $140 $160 $180 $200
Die
sel P
rice
-($
/gal
)
Carbon Tax ($/ton-CO2 emitted))
HTGR CTL CTL CTL Sequestration

Form 412.09 (Rev. 10)
Idaho National Laboratory
HTGR-INTEGRATED COAL AND GAS TO
LIQUIDS PRODUCTION ANALYSIS
Identifier: Revision: Effective Date:
TEV-672
2
09/30/2011 Page: 5 of 76
Figure ES-3. HTGR CTL tornado diagram.
The following conclusions were drawn when evaluating the nuclear-integrated GTL process against the conventional process:
Approximately one 450 MWt 700°C ROT HTGR would be required to support production of 50,000 bbl/day of liquid fuel products
Nuclear integration decreases natural gas consumption by 9% using nuclear heat for gas combustion for preheating in the reforming and refining areas.
Incorporating an HTGR into the GTL process decrease CO2 emissions by 42% when sequestration is not assumed and by 88% if the pure CO2 stream produced in the nuclear-integrated GTL process is sequestered.
Economically, the nuclear-integrated GTL case, either with or without sequestration, requires a higher diesel selling price to achieve a 12% IRR than the conventional case, for natural gas prices less than approximately $14.00/MSCF. Figure ES-4 presents the diesel selling price versus the natural gas purchase price for the conventional and nuclear-integrated cases.
The carbon tax results show that the nuclear-integrated GTL case without sequestration outperforms the conventional case at a 12% IRR for an average natural gas purchase price when the carbon tax is approximately $120/ton-CO2. When sequestration is
$4.43
$4.20
$4.40
$4.39
$4.40
$4.27
$4.01
$3.78
0.06
20 year Loan Term
4.5% Interest
24 month Construction Period
24 month Refueling Period
40 year Economic Recovery Period
80% Debt/20% Equity
10% IRR
-30% TCI
$4.61
$4.70
$4.77
$4.83
$4.94
$4.95
$5.10
$5.18
$5.59
$5.91
0 1 2
50 $/ton CO2
INL Staffing Plan
10 year Loan Term
10% Interest
60 month Construction Period
12 month Refueling Period
20 year Economic Recovery Period
0% Debt/100% Equity
15% IRR
+50% TCI
Product Selling Price ($/gal) - Baseline of $4.57 0 10 20 30 40 50
0 $/ton CO2
Vendor Staffing Plan
15 year Loan Term
8% Interest
36 month Construction Period
18 month Refueling Period
30 year Economic Recovery Period
50% Debt/50% Equity
12% IRR
TCI
Baseline Sensitivity Values

Form 412.09 (Rev. 10)
Idaho National Laboratory
HTGR-INTEGRATED COAL AND GAS TO
LIQUIDS PRODUCTION ANALYSIS
Identifier: Revision: Effective Date:
TEV-672
2
09/30/2011 Page: 6 of 76
assumed for the nuclear-integrated GTL case, the required CO2 tax decreases to approximately $70/ton-CO2. Figure ES-5 presents the carbon tax results for the GTL cases analyzed.
From the economic sensitivity analysis, the natural gas purchase price can have the largest impact on the required product selling price, followed by assumed IRR, the debt to equity ratio, and a $50/ton CO2 tax. Figure ES-6 presents a tornado diagram for nuclear-integrated GTL process, showing the resulting diesel price when varying the baseline economic assumptions.
Figure ES-4. GTL cases, diesel selling price versus natural gas purchase price, 12% IRR.
$1.50
$2.00
$2.50
$3.00
$3.50
$4.00
$4.50
$4.5 $6.5 $8.5 $10.5 $12.5 $14.5
Die
sel P
rice
-($
/gal
)
Natural Gas Price ($/MSCF)
HTGR GTL HTGR GTL Seq. GTL

Form 412.09 (Rev. 10)
Idaho National Laboratory
HTGR-INTEGRATED COAL AND GAS TO
LIQUIDS PRODUCTION ANALYSIS
Identifier: Revision: Effective Date:
TEV-672
2
09/30/2011 Page: 7 of 76
Figure ES-5. GTL cases, diesel price as a function of a carbon tax on CO2 emissions, 12% IRR, average natural gas purchase price.
Figure ES-6. HTGR GTL tornado diagram.
$1.70
$1.90
$2.10
$2.30
$2.50
$2.70
$0 $20 $40 $60 $80 $100 $120 $140 $160 $180 $200
Die
sel P
rice
-($
/gal
)
Carbon Tax ($/ton-CO2 emitted)
HTGR GTL HTGR GTL Seq. GTL
$2.02
$2.02
$2.00
$1.98
$2.00
$1.97
$1.95
$1.93
$1.81
0.03 1.03 2.03
24 month Construction Period
24 month Refueling Period
20 year Loan Term
4.5% Interest
40 year Economic Recovery Period
Low TCI
80% Debt/20% Equity
10% IRR
Low Natural Gas Price
$2.04
$2.05
$2.06
$2.06
$2.06
$2.09
$2.11
$2.12
$2.14
$2.19
$2.19
$3.43
0 1 2
60 month Construction Period
12 month Refueling Period
10 year Loan Term
10% Interest
INL Staffing Plan
50 $/ton CO2 w/ Sequestration
20 year Economic Recovery Period
High TCI
50 $/ton CO2
0% Debt/100% Equity
15% IRR
High Natural Gas Price
Product Selling Price ($/gal) - Baseline of $2.04 0 10 20 30 40 50
36 month Construction Period
18 month Refueling Period
15 year Loan Term
8% Interest
Vendor Staffing Plan
No Sequestration
30 year Economic Recovery Period
TCI
0 $/ton CO2
50% Debt/50% Equity
12% IRR
Average Natural Gas Price
Baseline Sensitivity Values

Form 412.09 (Rev. 10)
Idaho National Laboratory
HTGR-INTEGRATED COAL AND GAS TO
LIQUIDS PRODUCTION ANALYSIS
Identifier: Revision: Effective Date:
TEV-672
2
09/30/2011 Page: 8 of 76
CONTENTS
EXECUTIVE SUMMARY .............................................................................................................3
1. INTRODUCTION .............................................................................................................12
2. PROCESS MODELING OVERVIEW..............................................................................13
2.1 Conventional Coal to Liquids Case .......................................................................14
2.2 Nuclear-Integrated Coal to Liquids Case ...............................................................19
2.3 Conventional Natural Gas to Liquids Case ............................................................22
2.4 Nuclear-Integrated Natural Gas to Liquids Case ...................................................25
3. PROCESS MODELING RESULTS..................................................................................26
4. ECONOMIC MODELING OVERVIEW ..........................................................................31
4.1 Capital Cost Estimation .........................................................................................31
4.2 Estimation of Revenue ...........................................................................................38
4.3 Estimation of Manufacturing Costs .......................................................................40
4.4 Economic Comparison ...........................................................................................45
4.4.1 Cash Flow ...............................................................................................46
4.4.2 Internal Rate of Return ...........................................................................49
5. ECONOMIC MODELING RESULTS ..............................................................................50
6. SENSITIVITY ANALYSIS ..............................................................................................59
7. GHG MODELING OVERVIEW ......................................................................................64
7.1 GHG Methodology ................................................................................................65
7.2 Resource Extraction and Production ......................................................................65
7.2.1 Coal Extraction .......................................................................................66
7.2.2 Natural Gas Production ..........................................................................66
7.3 Transportation and Distribution .............................................................................66

Form 412.09 (Rev. 10)
Idaho National Laboratory
HTGR-INTEGRATED COAL AND GAS TO
LIQUIDS PRODUCTION ANALYSIS
Identifier: Revision: Effective Date:
TEV-672
2
09/30/2011 Page: 9 of 76
7.4 Conversion and Refining .......................................................................................67
7.5 End Use Combustion .............................................................................................68
8. GREENHOUSE GAS MODELING RESULTS ...............................................................68
9. CTL CONCLUSIONS .......................................................................................................70
10. GTL CONCLUSIONS .......................................................................................................71
11. FUTURE WORK AND RECOMMENDATIONS ...........................................................73
12. REFERENCES ..................................................................................................................73
13. APPENDIXES ...................................................................................................................76

Form 412.09 (Rev. 10)
Idaho National Laboratory
HTGR-INTEGRATED COAL AND GAS TO
LIQUIDS PRODUCTION ANALYSIS
Identifier: Revision: Effective Date:
TEV-672
2
09/30/2011 Page: 10 of 76
ACRONYMS AND NOMENCLATURE
AACE Association for the Advancement of Cost Engineering
ASF Anderson Schulz Flory
ASU air separation unit
ATCF after tax cash flow
BTCF before tax cash flow
CEPCI chemical engineering plant cost index
CTL coal to liquids
DOE Department of Energy
EIA Energy Information Administration
FT Fischer-Tropsch
GHG greenhouse gas
GIF GEN-IV International Forum
GTL gas to liquids
GWP global warming potential
HP high pressure
HRSG heat recovery steam generator
HTSE high temperature steam electrolysis
HTGR high temperature gas-cooled reactor
INL Idaho National Laboratory
IPCC Intergovernmental Panel on Climate Change
IRR internal rate of return
LHV lower heating value
LP low pressure
LPG liquefied petroleum gas
MACRS modified accelerated cost recovery system
MARR minimum annual rate of return
NETL National Energy Technology Laboratory
NIBT net income before taxes
NGNP Next Generation Nuclear Plant
O&M operations and maintenance

Form 412.09 (Rev. 10)
Idaho National Laboratory
HTGR-INTEGRATED COAL AND GAS TO
LIQUIDS PRODUCTION ANALYSIS
Identifier: Revision: Effective Date:
TEV-672
2
09/30/2011 Page: 11 of 76
PSA pressure swing absorption
PW present worth
ROT reactor outlet temperature
SMR steam methane reforming
TCI total capital investment
TEV technical evaluation
WTW well to wheel
C1 cost of equipment with capacity q1
C2 cost of equipment with capacity q2
Ck capital expenditures
c_months total number of months in the current modules construction period
CapF capital breakdown per month
dk depreciation
Ek cash outflows
i' IRR
k year
Mod module/train being evaluated
ModF capital fraction per module/train
month current month in reactor/fossil construction period
Number total number of reactor modules/fossil trains
n exponential factor
q1 equipment capacity
q2 equipment capacity
Rk revenues
t tax rate
Tk income taxes
y exponent for current module/train

Form 412.09 (Rev. 10)
Idaho National Laboratory
HTGR-INTEGRATED COAL AND GAS TO
LIQUIDS PRODUCTION ANALYSIS
Identifier: Revision: Effective Date:
TEV-672
2
09/30/2011 Page: 12 of 76
1. INTRODUCTION
This technical evaluation (TEV) has been prepared as part of a study for the Next Generation Nuclear Plant (NGNP) Project to evaluate the integration of high-temperature gas-cooled reactor (HTGR) technology with conventional chemical processes. The NGNP Project is being conducted under U.S. Department of Energy (DOE) direction to meet a national strategic need identified in the 2005 Energy Policy Act to promote reliance on safe, clean, economic nuclear energy and to establish a greenhouse-gas-free technology for the production of hydrogen. The NGNP represents an integration of high-temperature reactor technology with advanced hydrogen, electricity, and process heat production capabilities, thereby meeting the mission need identified by DOE. The strategic goal of the NGNP Project is to broaden the environmental and economic benefits of nuclear energy in the U.S. economy by demonstrating its applicability to market sectors not being served by light water reactors.
The HTGR produces high-temperature helium that can be used to produce electricity and/or process heat for export in the form of high-temperature helium or steam. A summary of these products and a brief description is shown in Table 1. This TEV specifically addresses HTGR integration opportunities for coal to liquids (CTL) and gas to liquids (GTL) production. For this study, an HTGR reactor outlet temperature (ROT) of up to 850°C is assumed. An ROT of 700°C is assumed for heat delivery to the GTL process based on a maximum process preheat temperature of 650°C and an assumed 25°C temperature approach for the gas to gas process heat exchangers. An ROT of 700°C was assumed for power generation, this reflects the economically optimal HTGR outlet temperature for a Rankine power cycle, as documented in TEV-988 (Idaho National Laboratory [INL] 2011c). Finally, an ROT of 850°C is assumed for heat delivery to the high-temperature steam electrolysis (HTSE) system for the CTL process, this ROT eliminates the need of co-firing fossil fuel in the HTSE process (INL 2010). In conventional chemical processes heat and power are generated by the combustion of fossil fuels such as coal and natural gas, resulting in significant emissions of greenhouse gases (GHGs), including carbon dioxide. Heat or electricity produced in an HTGR could be used to supply process heat or electricity to conventional chemical processes while generating minimal GHGs. The use of an HTGR to supply process heat or electricity to conventional processes is referred to as a nuclear-integrated process.
Table 1. Projected outputs of the HTGR. HTGR Product Product Description Process Heat
High-Temperature Helium to HTSE Delivered at 825°C and 7 MPa High-Temperature Helium to GTL Delivered at 675°C and 7 MPa Electricity Generated by a Rankine cycle, 43% efficiency
The HTGR would produce high-temperature heat and/or electricity and be physically located near the CTL or GTL production facility. A separate study has been conducted to

Form 412.09 (Rev. 10)
Idaho National Laboratory
HTGR-INTEGRATED COAL AND GAS TO
LIQUIDS PRODUCTION ANALYSIS
Identifier: Revision: Effective Date:
TEV-672
2
09/30/2011 Page: 13 of 76
assess heat losses associated with transporting HTGR heat long distances, using a variety of transport fluids, in TEV-1351 (INL 2011b). HTGR capital and operating costs used in the economic analysis are based on the detailed cost estimate presented in TEV-1196 (INL 2011a). A separate study should be conducted to assess the optimal siting of the HTGR with respect to the CTL and GTL facilities, balancing safety concerns associated with separation distance and heat losses associated with transporting high temperature heat long distances.
The CTL and GTL simulations were developed using version 7.3 of Aspen Plus, a state-of-the-art steady-state chemical process simulator (Aspen 2011). The outputs from the material and energy balances generated in Aspen Plus were utilized as inputs into the Excel economic models (Excel 2007). This TEV assumes familiarity with both Aspen Plus and Excel. A detailed explanation of the software capabilities, of both Aspen Plus and Excel, is beyond the scope of this study. Similarly, this study assumes a familiarity with gasification, steam methane reforming (SMR), Fischer-Tropsch (FT) synthesis, product refining and upgrading, and common gas purification technologies. Hence, a thorough explanation of these technologies is considered to be beyond the scope of this TEV.
The TEV first presents an overview of the process modeling performed for the conventional and nuclear-integrated CTL and GTL cases. Afterwards, the process modeling results are presented for each case, specifically the impact of the HTGR integration. Next, the details of the economic model are discussed along with the analysis results. Following the economic modeling discussion, the method for calculating greenhouse gas emissions is discussed. Results for CTL, nuclear-integrated CTL, GTL, and nuclear-integrated GTL follow, with emphasis placed on impact of the HTGR integration. Finally, conclusions for CTL and GTL cases are discussed, separately.
2. PROCESS MODELING OVERVIEW
The plant models for the CTL and GTL processes were developed using version 7.3 of Aspen Plus (Aspen 2011). Because of the size and complexity of the processes modeled, the simulations were constructed using “hierarchy” blocks, a method for nesting one simulation within another simulation. In this fashion, submodels for each major plant section were constructed separately and then combined to represent the entire process. For the purpose of modeling, English units were used.
Significant emphasis in the models has been placed on heat integration between different parts of the plant. To facilitate energy tracking, Aspen’s “utility” blocks were used extensively. Utilities tracked in this manner for the CTL cases were electricity generated, electricity consumed, steam generated (medium pressure 700 psia, FT 300 psia, and low pressure 150 psia), steam consumed (medium pressure 700 psia, FT 300 psia, and low pressure 150 psia), and cooling water usage. Utilities tracked in this manner for the GTL cases were electricity generated, electricity consumed, steam generated (medium pressure 1500 psia, Fischer-Tropsch (FT) 300 psia, and low pressure 150 psia), steam consumed

Form 412.09 (Rev. 10)
Idaho National Laboratory
HTGR-INTEGRATED COAL AND GAS TO
LIQUIDS PRODUCTION ANALYSIS
Identifier: Revision: Effective Date:
TEV-672
2
09/30/2011 Page: 14 of 76
(medium pressure 1500 psia, FT 300 psia, and low pressure 150 psia), and cooling water usage.
Four cases were originally identified for modeling:
Conventional CTL process
Conventional GTL process with light gas recycle
Nuclear-integrated CTL process
Nuclear-integrated GTL process with light gas recycle
For the coal cases, a generic Illinois #6 coal was used as the feedstock. Illinois #6 was chosen as the coal type because it is a very commonly used and abundant coal. A dry-fed, entrained-flow, slagging gasifier (similar to a Shell, Uhde, or Siemens design) was selected as the gasification technology for this evaluation. Capacities for the coal cases were also set to produce 50,000 bpd of liquid products.
For the gas cases, natural gas composition was taken from data published by Northwest Gas Association. Capacity for the plant was set to produce 50,000 bpd of liquid products, including diesel, naphtha, and liquefied petroleum gas (LPG).
For the Aspen models described in this analysis, rigorous submodels of the nuclear power cycle and HTSE have not yet been integrated. Hence, in order to account for water usage, heat rejection for the HTSE system was calculated separately using the UNISIM modeling package. Cooling water requirements for this operation were then estimated and added to the overall Aspen model results. Water consumption for the HTGR has not been included, as a detailed water balance for the HTGR has not been completed at this time.
The general model descriptions for all cases are presented below. Although the method of producing syngas varies from case to case, production of the liquid product is essentially unchanged between cases.
2.1 Conventional Coal to Liquids Case
The block flow diagram for the conventional CTL process is shown in Figure 1. The proposed process includes unit operations for air separation, coal milling and drying, coal gasification, syngas cleaning and conditioning, sulfur recovery, CO2 compression/liquefaction, FT synthesis, product upgrading and refining, power production, cooling towers, and water treatment. Each unit operation is briefly described below.

Form 412.09 (Rev. 10)
Idaho National Laboratory
HTGR-INTEGRATED COAL AND GAS TO
LIQUIDS PRODUCTION ANALYSIS
Identifier: Revision: Effective Date:
TEV-672
2
09/30/2011 Page: 15 of 76
Figure 1. Block flow diagram for the conventional CTL process.
Air Separation (ASU) – Oxygen is produced via a standard cryogenic Linde type air separation unit (ASU) that utilizes two distillation columns and extensive heat exchange in a cold box (Linde 2008). The oxygen product is used for gasification. In order to reduce the inert content in the synthesis gas, an O2 purity of 99.5% is specified. It should be noted that lower oxygen purity could be specified, such as 95%; however, the high purity oxygen is desired to minimize diluent nitrogen in the fuel synthesis loops. The nitrogen co-product from the ASU can be used for coal drying and transport, and as an inert gas to be used throughout the plant. The waste stream from the ASU is an O2-enriched air stream. A portion of the enriched air stream is used as feed to the Claus unit in place of air (WorleyParsons 2002).
Coal Milling & Drying (CMD) – Coal is pulverized to below 90 μm using a roller mill to ensure efficient gasification. Currently, coal milling power consumption is modeled based on the power calculated by Aspen assuming a Hardgrove grindability index of 60. Drying is accomplished simultaneously using a heated inert gas stream. The gas stream removes evaporated water as it sweeps the pulverized coal through an internal classifier for collection in a baghouse. Inert nitrogen, from the ASU, is heated using heat recovered throughout the process. The nitrogen is mixed with this hot gas to create a hot inert gas stream which dries the Illinois coal down to 6% moisture (Shell 2005). Nitrogen is also used as transport gas for the coal from the baghouse to the lock hoppers. Pressurized carbon dioxide, from the Rectisol unit, is then used to transport the dry, sized coal into the gasifier. The transport gas is assumed to be 0.15 pounds of gas per pound of solids, for both the nitrogen and

Form 412.09 (Rev. 10)
Idaho National Laboratory
HTGR-INTEGRATED COAL AND GAS TO
LIQUIDS PRODUCTION ANALYSIS
Identifier: Revision: Effective Date:
TEV-672
2
09/30/2011 Page: 16 of 76
carbon dioxide transport gases. The amount of CO2 vented during depressurization of the feed hopper is estimated using the ideal gas law.
Gasification (GASIFIER) – The dry coal is gasified at 2,800°F using Shell’s SCGP technology (entrained-flow, dry-fed, slagging, oxygen-blown, upflow gasifier). Oxygen is fed to the gasifier to achieve an outlet temperature of 2,800°F, while steam (700 psia) is fed such that the molar ratio of dry coal to steam is 7:1. This ratio was selected in order to inhibit methane formation in the gasifier. Although some heat is recovered in the membrane wall of the gasifier, the majority of the heat recovery is accomplished downstream of the gasifier in the syngas coolers, which cool the gas down to 464°F, generating medium and FT pressure steam (Shell 2004). The syngas is further cooled by a water quench. A portion of the quenched syngas is returned to the top of the gasifier to cool the particle-laden gas to below the ash softening point. Makeup water is provided to the quench loop to achieve a blowdown rate of approximately 5% around the quench loop. This blowdown is then used in the slag quench loop. 2.5% of the water from the slag quench loop is assumed to be sent to water treatment to avoid any buildup of contaminants.
Syngas Cleaning & Conditioning (GAS-CLN) – After gasification, a fraction of the syngas is passed through sour shift reactors and then remixed with unshifted syngas to provide the optimal H2:CO ratio to the FT reactors which utilize a cobalt catalyst; a ratio of approximately 2.1 H2:CO. Steam (700 lb) is added to the syngas stream to maintain the water concentration necessary for the water gas shift reaction (steam to dry gas molar ratio of 1.2 is currently specified). To minimize the steam requirement, heat recuperation around the shift converters is employed in conjunction with a saturation/desaturation water recycle loop. Five percent of the water recycled around the water gas shift loop is sent to water treatment to avoid high concentrations of ammonia and chloride compounds. Heat is further recovered from the syngas after shifting and used for nitrogen heating for coal drying and Rectisol heat requirements. Elemental mercury is then captured in a mercury guard bed. The syngas is further treated in an absorber with refrigerated methanol which acts as a physical solvent for the removal of CO2, H2S, and COS (Rectisol process). It is assumed that 1.5% CO2 and less than 1 ppm of H2S are present in the clean syngas stream. The H2S rich stream is assumed to contain approximately 55% H2S, with the remainder being CO2 (Lurgi 2006). Gas containing H2S from the sulfur reduction unit is also sent to the Rectisol process for sulfur removal, the nitrogen and argon contained in this stream are assumed to pass through to the CO2 rich stream. It is also assumed that a steam reboiler, rather than nitrogen flow, is used for stripping in order to ensure a sufficiently pure CO2 stream for sequestration or enhanced oil recovery. Utility usage is calculated based on values

Form 412.09 (Rev. 10)
Idaho National Laboratory
HTGR-INTEGRATED COAL AND GAS TO
LIQUIDS PRODUCTION ANALYSIS
Identifier: Revision: Effective Date:
TEV-672
2
09/30/2011 Page: 17 of 76
presented in literature for the Rectisol process (Cover 1986). However, confidence in the predicted utility usage is low due to the substitution of steam for nitrogen stripping. This substitution may significantly increase the power requirement for refrigeration and steam usage. Because of the extreme sulfur intolerance of the Fischer-Tropsch catalyst, guard beds are included as an added measure of protection against poisoning. A portion of syngas is sent to a pressure swing absorption unit (PSA), where a pure hydrogen stream is produced for use in the refinery, for hydrocracking and hydrotreating, and the sulfur reduction unit, to reduce sulfur compounds to H2S. A portion of the PSA tailgas is sent to the sulfur reduction unit, where it is fired to provide heat for the reduction reactions, the remaining PSA tailgas is fired to provide heat in the refinery.
Sulfur Plant (CLAUS & S-REDUCT) – Sulfur recovery is based on the Claus process. The Illinois coal has a sufficiently high sulfur content, which can create a sour gas stream with up to 60% H2S. As a result, a straight through Claus process can be used. In order to achieve optimal sulfur recovery, air flow to the Claus furnace is adjusted to achieve a molar ratio of 0.55:1 O2 to H2S (Kohl 1997). Tail gas from the Claus unit is hydrogenated over a catalyst to convert the remaining sulfur species to H2S, and this stream is recycled to the Rectisol unit to maximize sulfur recovery. A small stream of clean syngas is used to fire and preheat the feed gas to the sulfur reduction unit.
CO2 Compression (CO2-COMP) – Carbon dioxide is removed from the syngas in the Rectisol process. By properly designing the solvent regeneration scheme, a pure stream of CO2 is produced. The resulting stream is then compressed, along with the CO2 recycle from coal transport, and liquefied prior to being pumped to the required pressure for use in enhanced oil recovery or sequestration. CO2 for filtration is split from the CO2 pressurization scheme at 700 psia, while the CO2 for coal slurrying is split from the CO2 pressurization scheme at 1,160 psia. Eight stages are assumed for the CO2 compression scheme resulting in an overall efficiency of 84.4%. At 2,005 psia CO2 should be liquid; however, Aspen’s physical property methods do not predict the proper phase of the CO2 stream because a small quantity of inert gas is present. The number of stages, stage efficiencies, and resulting power requirement were tuned to commercial CO2 compression turbines; thus, the incorrect phase prediction will not impact the resulting power requirement.
Fischer-Tropsch Synthesis (FT) – Syngas is converted to liquid synthetic crude in a slurry bubble column reactor utilizing a cobalt catalyst, a chain growth factor of 0.92 was assumed for the catalyst. Syngas flow to the reactor is preheated to the reaction temperature of 428°F. FT steam (300 psia) is generated from the exothermic FT reactions. The resulting

Form 412.09 (Rev. 10)
Idaho National Laboratory
HTGR-INTEGRATED COAL AND GAS TO
LIQUIDS PRODUCTION ANALYSIS
Identifier: Revision: Effective Date:
TEV-672
2
09/30/2011 Page: 18 of 76
product is primarily paraffinic, but also contains some olefins and oxygenates. The product distribution is estimated using a modified version of the Anderson Schulz Flory (ASF) distribution (Dry 2001). Modifications are required to the classical ASF distribution to better match actual performance of FT catalysts, especially for carbon numbers between one and four. Carbon chain length in the product stream varies from one (methane) to more than 100; hence, separations are performed to fractionate the product into light gas, crude naphtha, middle distillate, and molten wax. To improve conversion a light gas recycle is implemented. Currently a single-stage slurry bubble column reactor is modeled; however, a two-stage reactor may improve conversion and reduce the amount of light gas recycled. In addition, depending on column design, the steam pressure generated may have to be reduced below 300 psia.
Product Upgrading & Refining (REFINERY, HYDTREAT, HYDCRACK) – The middle distillate product is hydrotreated to saturate olefinic bonds. The hydrotreated product is refined via a combination of pressurized and vacuum distillation into naphtha and diesel fuel products. The bottoms product from vacuum distillation and the molten wax stream are hydrocracked to improve overall yield of the diesel and naphtha fractions (Parkash 2003). The hydrotreating and hydrocracking operations are modeled as separate hierarchies within the refinery hierarchy. Hydrogen for hydrotreating and hydrocracking is supplied using pressure swing absorption, modeled in the gas cleaning hierarchy. A fraction of the light gasses produced are combusted to provide the heat required in the refining section, the remaining light gases are sent to LPG recovery. At present, no attempt is made to refine the naphtha fraction.
Power Production (GAS-TURB, ST-HRSG) – Light gas from FT synthesis and refining areas is used to fire gas turbines to produce electricity. The gas turbine model is tuned to reflect actual turbine performance as modeled in GT-Pro (Thermoflow 2009). To increase power production, a combined cycle is utilized. Hot exhaust from the gas turbine is routed to the heat recovery steam generator (HRSG) to produce superheated steam. This steam is used in conventional condensing turbines to produce additional power. To further maximize power production, the medium (700 psia), FT (300 psia), and low pressure (150 psia) steam generated throughout the plant are sent to the power production block where they are passed through three saturated steam turbines. The efficiencies of the turbines for the various steam pressures were calculated using Steam Pro, steam turbine modeling software from Thermoflow (2009). It was found that even given low quality steam at 150 psia, efficiencies for the saturated steam turbines remain constant at approximately 80%. The condensed steam from the turbine outlets are mixed with condensate return from the plant and makeup water is added to

Form 412.09 (Rev. 10)
Idaho National Laboratory
HTGR-INTEGRATED COAL AND GAS TO
LIQUIDS PRODUCTION ANALYSIS
Identifier: Revision: Effective Date:
TEV-672
2
09/30/2011 Page: 19 of 76
provide the necessary flow to the boiler feedwater pumps. FT steam is added to the deaerator to achieve the appropriate dew point temperature. Aspen Utility blocks are used to track all steam generation and use in the plant. This information is used as input to the power production section of the model, allowing reconciliation of the entire plant steam balance.
Cooling Towers (COOL-TWR) – Conventional cooling towers are modeled in Aspen Plus using literature data. Air cooling could potentially be used in certain areas of the plant to decrease water consumption; however, for simplicity cooling water only was assumed. The evaporation rate, drift, and blowdown are based on a rule of thumb guide for the design and simulation of wet cooling towers (Leeper 1981). Aspen utility blocks are used to track all cooling water use in the plant. This information is used as input to the cooling tower section of the model, allowing reconciliation of the entire plant cooling water balance.
Water Treatment (H2O-TRTM) – Water treatment is simplistically modeled in Aspen Plus using a variety of separation blocks. It is anticipated that energy consumption for the water treatment portion of the plant could change considerably based on input from a water treatment vendor. Aspen transfer blocks are used to reconcile water in and out flows from various parts of the plant, allowing reconciliation of the entire plant water balance.
2.2 Nuclear-Integrated Coal to Liquids Case
The block flow diagram for the nuclear-integrated CTL case is shown in Figure 2. The proposed process includes the same unit operations as the conventional process with the following exceptions: the cryogenic ASU and water gas shift reactors are replaced by high-temperature steam electrolysis to provide oxygen and hydrogen for the process.

Form 412.09 (Rev. 10)
Idaho National Laboratory
HTGR-INTEGRATED COAL AND GAS TO
LIQUIDS PRODUCTION ANALYSIS
Identifier: Revision: Effective Date:
TEV-672
2
09/30/2011 Page: 20 of 76
Figure 2. Block flow diagram for the nuclear-integrated CTL process.
While developing the nuclear-integrated case, opportunities for heat integration between the nuclear, electrolysis, and fossil plants were evaluated; however, very few opportunities were identified. The primary reason for this conclusion was that the fossil plant produced an excess of heat that could provide for the heat requirements within the fossil portion of the plant. In a few instances (notably product refining), it was believed that nuclear heat could displace burning of light gas to reduce overall plant greenhouse gas emissions. However, the modeling analysis indicated that full light gas recycle would lead to unacceptable buildup of inert gases in the process. Hence, it was deemed practical to use this gas as fuel rather than develop complex schemes to separate inerts from the light gas.
In the previous revision of this TEV an upper limit on the HTGR ROT of 750°C required syngas firing for topping heat in the HTSE process. However, this upper limit was lifted for this revision, and topping heat is no longer required.
With the ASU and water gas shift reactors removed from the flowsheet, an unexpected result was observed. A shortage of inert gas for use in coal drying, transport, and feeding was created. To overcome this issue, air was selected for use in coal drying and transport, rather than nitrogen.
Each unit operation in the nuclear-integrated CTL flowsheet is briefly described below. Because the majority of unit operations remain unchanged from the conventional CTL flowsheet, emphasis is placed on differences in configuration between the two cases.
Electrolysis (ELEC) – Water is converted to hydrogen and oxygen utilizing high-temperature electrolysis units. Helium at 1,517°F, provided by the HTGR, is used to convert the water to steam and raise the

Form 412.09 (Rev. 10)
Idaho National Laboratory
HTGR-INTEGRATED COAL AND GAS TO
LIQUIDS PRODUCTION ANALYSIS
Identifier: Revision: Effective Date:
TEV-672
2
09/30/2011 Page: 21 of 76
temperature to 1,472°F for electrolysis. Conversion and power consumption are based on information presented in TEV-981 (INL 2010). The oxygen generated is used for gasification and air enrichment for the Claus and sulfur reduction units, the hydrogen is used to adjust the hydrogen to carbon monoxide ratio for the FT reactions, in place of sour shift reactors.
Coal Milling & Drying (CMD) – Coal milling and drying for the nuclear-integrated case is similar to the conventional case. However, because nitrogen is not readily available in this scenario, coal drying is accomplished using air; the airflow for drying is specified to be 2.5 times the coal flowrate (Mullinger 2008). Air is also used as transport gas for the pulverized coal. Although air is used industrially for coal drying and transport, it introduces additional flammability issues compared to using an inert gas for this purpose. Transport of coal into the gasifier is accomplished using CO2 recovered from the Rectisol unit. The air for drying is heated using heat recovered throughout the process.
Gasification (GASIFIER) – Gasification for the nuclear-integrated case is similar to the conventional case. However, because hydrogen is supplied externally from the electrolyzers rather than shifting the syngas, the gasification island throughput is reduced to 35% of the conventional design to produce the same amount of liquid fuel product.
Syngas Cleaning & Conditioning (GAS-CLN) – Syngas cleaning is greatly simplified for the nuclear-integrated case, because the water gas shift reactors are eliminated. Hydrogen from the electrolyzers is added to the syngas to achieve the optimal H2:CO of approximately 2.1 for the cobalt FT catalyst. When the shift reactors are eliminated, the CO2 concentration entering the Rectisol unit is reduced from 30 mol.% in the conventional case to 10 mol.% in the nuclear-integrated case. Similarly, CO2 concentration in the purified syngas is reduced from 1.3 mol.% in the conventional case to 0.1 mol.% in the nuclear-integrated case. Rectisol capacity and utility usage are reduced by more than half in the nuclear-integrated case as compared to the conventional case.
Sulfur Plant (CLAUS & S-REDUCT) – The Claus and sulfur reduction plants for the nuclear-integrated case are similar to those in the conventional case. However, as with the gasification island, the required capacity of these units is approximately less than half that of the conventional case configuration.
CO2 Compression (CO2-COMP) – CO2 compression for the nuclear-integrated case is similar to CO2 compression in the conventional case. However, when the shift reactors are eliminated, required capacity

Form 412.09 (Rev. 10)
Idaho National Laboratory
HTGR-INTEGRATED COAL AND GAS TO
LIQUIDS PRODUCTION ANALYSIS
Identifier: Revision: Effective Date:
TEV-672
2
09/30/2011 Page: 22 of 76
and utility usage are reduced by a factor of approximately seven. Additionally, the last stage of compression is removed, as all CO2 is recycled to the gasifier to increase carbon conversion to the liquid product.
Fischer-Tropsch Synthesis (FT) – The FT synthesis plant remains unchanged between the conventional and nuclear-integrated cases. Inlet gas composition is slightly different between the cases because of increased N2 in the nuclear-integrated case from the recycle of CO2 back to the gasifier.
Product Upgrading & Refining (REFINERY, HYDTREAT, HYDCRACK) – The product refining and upgrading process in the nuclear-integrated case remains essentially unchanged from the process in the conventional case.
Power Production (ST) – Power production in the nuclear-integrated case changes because the gas turbine system is removed, since the light gases are recycled to the gasification island. As a result there is no longer hot tailgas to superheat steam to use in the condensing steam turbines. Only the saturated turbines remain, being fed the medium pressure (700 psia), Fischer-Tropsch (300 psia), and low pressure (150 psia) steam generated throughout the plant. Due to size reductions in some portions of the plant, the capacity of the steam system in the nuclear-integrated case is approximately 60% of the conventional case. The saturated steam turbines are also smaller in the nuclear-integrated case, approximately 80% of the conventional case capacity.
Cooling Towers (COOL-TWR) – The cooling water system requirements are similar for both cases. Again, cooling water requirements for the HTGR are not included in this analysis.
Water Treatment (H2O-TRTM) – The water treatment system in the nuclear-integrated case is similar to the conventional case. No further comparison will be made on water treatment between the two cases until the water treatment hierarchy has been refined.
2.3 Conventional Natural Gas to Liquids Case
The block flow diagram for the conventional GTL process is shown in Figure 3. The proposed process includes unit operations for air separation, natural gas purification and reforming, FT synthesis, product upgrading and refining, power production, cooling towers, and water treatment. Because many unit operations remain unchanged from the conventional CTL flowsheet, emphasis is placed on differences in configuration between the natural gas and coal cases.

Form 412.09 (Rev. 10)
Idaho National Laboratory
HTGR-INTEGRATED COAL AND GAS TO
LIQUIDS PRODUCTION ANALYSIS
Identifier: Revision: Effective Date:
TEV-672
2
09/30/2011 Page: 23 of 76
Figure 3. Block flow diagram for the conventional GTL process.
Air Separation (ASU) – Air separation in the conventional GTL case is identical to that of the conventional CTL case. However, because the natural gas flowsheets do not require coal drying, the N2 product from the ASU could be available for sale as a byproduct. However, the amount of nitrogen produced in the GTL scenarios would potentially saturate the industrial nitrogen market; as a result revenues from sales were not included in the economic model.
Natural Gas Purification and Reforming (NG-RFMR) – Two reforming scenarios were considered: autothermal reforming and two-step reforming consisting of primary steam reforming followed by secondary autothermal reforming. Although two-step reforming appears to offer the best opportunity for nuclear heat integration, the steam to carbon ratio entering the primary reformer is too low for commercial operation and whisker carbon formation would occur (Pedersen 2010). As a result, only autothermal reforming was assumed for the GTL process. The desired syngas H2:CO ratio for the FT reactors, which utilize a cobalt catalyst, is approximately 2.1. This ratio was achieved by setting the steam to carbon inlet molar ratio to 0.92 and the exit temperature of the autothermal reformer to 1,870°F (1,021°C).
Natural gas and the light gas recycle are first compressed to 500 psia, saturated with water, then preheated to 750°F and passed through a hydrotreater and sulfur removal bed. Hydrotreating will break down any olefins present in the light gas recycle, which would cause operational issues in the preformer. The gas is then heated further and mixed with steam (1,500 psia) to achieve the desired H2:CO ratio downstream of the autothermal reformer (Pedersen 2010). The hot natural gas stream is then fed to a preformer that irreversibly converts C2+ hydrocarbons to CH4,

Form 412.09 (Rev. 10)
Idaho National Laboratory
HTGR-INTEGRATED COAL AND GAS TO
LIQUIDS PRODUCTION ANALYSIS
Identifier: Revision: Effective Date:
TEV-672
2
09/30/2011 Page: 24 of 76
CO, H2, and CO2. The preforming step is required, as further heating of the natural gas and steam could result in steam cracking of the C2+ components to olefins, which tend to form carbon in the autothermal reformer. Carbon formation is detrimental to long-term operation, as it deactivates the reforming catalyst.
The effluent from the preformer is preheated to 1,202°F (650°C) mixed with oxygen and fed to an autothermal reformer. The outlet temperature is set at 1,870°F, which results in an oxygen to carbon molar ratio of 0.57 and a steam to carbon ratio of 0.94. The steam to carbon ratio in the autothermal reformer is sufficiently high to avoid the formation of whisker carbon. The hot gas from the outlet of the autothermal reformer is quickly cooled and produces medium and FT pressure steam, followed by water removal in a quench. Finally, a portion of syngas is sent to a pressure swing absorption unit, where a pure hydrogen stream is produced to use in the refinery for hydrocracking and hydrotreating. The tailgas stream is remixed with the main syngas stream. The resulting syngas has a H2 to CO ratio of 2.1, contains 8.0 mol.% CO2, and contains 8.8 mol.% inerts.
A portion of the light gas recycled is fired and used for preheating the inlet syngas, water, and steam for hydrotreating, preforming, and autothermal reforming.
Fischer-Tropsch Synthesis (FT) – FT synthesis in the conventional GTL case is identical to that of the conventional CTL case.
Product Upgrading & Refining (REFINERY, HYDTREAT, HYDCRACK) – Product upgrading and refining in the conventional GTL case is identical to that of the conventional CTL case
Power Production (ST) – Power production in the conventional GTL case differs slightly from the conventional CTL case. Since light gases are recycled to the steam methane reformer tailgas is no longer fired in a gas turbine, and therefore no longer produces hot tailgas used to superheat steam for the condensing steam turbines. Only the saturated steam turbines are used to generate power. Furthermore, the medium pressure steam generated in the GTL case is 1,500 psia, rather than 700 psia.
Cooling Towers (COOL-TWR) – The cooling towers in the conventional GTL case are modeled identically to those in the conventional CTL case.
Water Treatment (H2O-TRTM) – Water treatment in the conventional GTL case is identical to that of the conventional CTL case.

Form 412.09 (Rev. 10)
Idaho National Laboratory
HTGR-INTEGRATED COAL AND GAS TO
LIQUIDS PRODUCTION ANALYSIS
Identifier: Revision: Effective Date:
TEV-672
2
09/30/2011 Page: 25 of 76
2.4 Nuclear-Integrated Natural Gas to Liquids Case
The block flow diagram for the nuclear-integrated GTL case is shown in Figure 4. The proposed process includes the same unit operations as the conventional process with the following except nuclear heat is used for preheating in the reforming section and reboiler duty in the refining section rather than burning light gas.
Figure 4. Block flow diagram for the nuclear-integrated GTL process.
It should be noted, that a full light gas recycle would lead to unacceptable buildup of inert gases in the process. Hence, it was deemed practical to fire a small portion of the tailgas recycle to minimize inert gas buildup. The fraction fired, was too small to adequately displace the heat provided by the HTGR, as a result steam is generated instead.
Each unit operation in the nuclear-integrated GTL flowsheet is briefly described below. Because the majority of unit operations remain unchanged from the conventional GTL flowsheet, emphasis is placed on differences in configuration between the two cases.
Air Separation (ASU) – Air separation in the nuclear-integrated cases is identical to that of the conventional case.
Natural Gas Purification and Reforming (NG-RFMR) – Conditions in the reforming section of the plant are nearly identical to those of the

Form 412.09 (Rev. 10)
Idaho National Laboratory
HTGR-INTEGRATED COAL AND GAS TO
LIQUIDS PRODUCTION ANALYSIS
Identifier: Revision: Effective Date:
TEV-672
2
09/30/2011 Page: 26 of 76
conventional case, excluding the fact that nuclear heat is used to provide the heat for all preheat streams and the light gas recycle must be treated for CO2 removal to avoid a buildup of inert gases. CO2 is partially removed using Fluor’s propylene carbonate solvent given its low solubility of light hydrocarbons and nitrogen (BRE 2008). The steam to carbon ratio is 0.50 for the autothermal reformer. To achieve the 1,870°F outlet temperature on the autothermal reformer, an oxygen to carbon molar ratio of 0.54 was required. The resulting syngas has a H2:CO ratio of 2.1, contains 4.5 mol.% CO2, and contains 9.8 mol.% inerts.
CO2 Compression (CO2-COMP) – CO2 compression is not present in the conventional GTL case; however it is required if the pure CO2 stream is to be sequestered. CO2 compression for the nuclear-integrated case is similar to CO2 compression in the conventional CTL case. However, the required capacity and utility usage are reduced significantly. Additionally, the CO2 off-take splits are removed as the natural gas reforming section does not require CO2.
Fischer-Tropsch Synthesis (FT) – The FT synthesis plant remains unchanged between the conventional and nuclear-integrated cases. Inlet gas composition is slightly different between the cases due to the substitution of nuclear heat in the reforming section.
Product Upgrading & Refining (REFINERY, HYDTREAT, HYDCRACK) – The product refining and upgrading process in the nuclear-integrated case remains unchanged from the process in the conventional case, except that nuclear heat provides the reboiler heat duties.
Power Production (ST) – Steam generation and power production in the nuclear-integrated case is identical to that of the conventional case.
Cooling Towers (COOL-TWR) – The cooling towers in the nuclear-integrated case is identical to that of the conventional case.
Water Treatment (H2O-TRTM) – The water treatment system in the nuclear-integrated case is similar to the conventional case.
3. PROCESS MODELING RESULTS
Analysis of the conventional CTL case indicated a potential need for hydrogen supplementation from HTSE. By supplementing the process with an external hydrogen source, the need to “shift” the syngas using conventional water-gas shift reactors was eliminated. The primary benefit of this change is a reduction in greenhouse gas emissions from the process. It was also determined that the conventional CTL case

Form 412.09 (Rev. 10)
Idaho National Laboratory
HTGR-INTEGRATED COAL AND GAS TO
LIQUIDS PRODUCTION ANALYSIS
Identifier: Revision: Effective Date:
TEV-672
2
09/30/2011 Page: 27 of 76
produced heat beyond what was needed to support demands of the plant. Based on these observations, a nuclear-integrated model was developed which focuses primarily on integrating nuclear hydrogen rather than nuclear heat.
Analysis of the conventional GTL case indicates a strong potential heat integration opportunity for an HTGR. In the conventional case, light gases are burned to provide heat to the reforming and refinery processes. Both the conventional and nuclear-integrated cases assume recycling of light gas back to the reformer.
Results from the nuclear-integrated CTL case indicate that integration of nuclear hydrogen can improve carbon utilization and reduce GHG emissions. Coal consumption is decreased by 65% using electrolysis and nuclear power as the hydrogen source. Similarly, with nuclear-integration the fraction of carbon in the coal partitioned to the liquid fuel products increases from 32 to 92%. Integrating nuclear power and high temperature steam electrolysis also decreases CO2 emissions from the plant. If carbon capture and sequestration are assumed for the conventional configuration, CO2 emissions decrease by 83% when electrolysis and nuclear power are utilized. However, if carbon capture and sequestration are not assumed for the conventional configuration, CO2 emissions decrease by 96% when electrolysis and nuclear power are utilized. In the nuclear-integrated case, nuclear energy is used to offset a portion of the energy requirement derived from coal. This is evident, as power consumption is increased from producing 220 MWe to consuming 2,348 MWe. It is estimated that one 664 MWt 850°C ROT HTGR for heat production and nine 604 MWt 700°C ROT HTGRs for power production would be required to support production of 50,000 bbl/day of liquid fuel products. Water consumption for the HTGR has not been included, as a detailed water balance for the HTGR has not been completed.
Results for the nuclear-integrated natural gas to liquids case look promising. Approximately one 450 MWt 700°C ROT HTGR would be required to support this configuration. In addition, the reactor would supply only heat to the fossil process, as more power is generated in the process than is required. By substituting nuclear heat for light gas combustion for preheat in the reformer and reboiler duty in the refinery; natural gas consumption is decreased by 9%. Power production for the plant decreases by 8% for the nuclear-integrated case. CO2 emissions from the plant also decrease by integrating HTGRs into the flowsheet. CO2 emissions decrease by 42% when sequestration is not assumed and by 88% if the pure CO2 stream is sequestered in the nuclear-integrated GTL case. Water consumption for the HTGR has not been included, as a detailed water balance for the HTGR has not been completed.
A summary of the modeling results for all cases is presented in Table 2. A high-level material and energy balance summary for each case is graphically presented in Figure 5. The conventional coal and natural gas cases serve as a basis for comparison with the nuclear-integrated cases. For the complete Aspen stream results for the CTL and nuclear-integrated CTL cases, see Appendixes B and C, for GTL and nuclear-integrated GTL see Appendixes D and E.

Form 412.09 (Rev. 10)
Idaho National Laboratory
HTGR-INTEGRATED COAL AND GAS TO LIQUIDS
PRODUCTION ANALYSIS
Identifier: Revision: Effective Date:
TEV-672
2
09/30/2011 Page: 28 of 76
Table 2. CTL and GTL modeling case study results.
Conventional CTL Nuclear Integration
CTL Conventional GTL
Nuclear Integration GTL
Inputs Coal Feed rate (ton/day) 26,941 9,354 N/A N/A Natural Gas Feed Rate (MMSCFD)1 N/A N/A 427 390 % Carbon to Liquid Product 31.8% 91.7% 71.9% 79.3% # HTGRs (600 MWt) N/A 10.17 N/A 0.75 Outputs Total Liquid Products (bbl/day)t 50,002 50,002 49,994 49,998 Diesel 35,587 35,194 34,581 35,410 Naphtha 12,259 11,810 11,892 11,674 LPG 2,156 2,998 3,521 2,914 Utility Summary Total Power (MW) 220.3 -2,347.8 66.6 69.7 Power Consumed -739.7 -2,749.4 -330.1 -402.3 Electrolyzers N/A -2,511.8 N/A N/A Secondary Helium Circulator N/A -23.0 N/A -48.4 ASU -301.3 N/A -132.7 -131.3 Coal Milling and Drying -13.8 -9.5 N/A N/A Natural Gas Reforming N/A N/A -68.0 -68.9 Gasification and Gas Cleanup -174.7 -82.1 N/A N/A CO2 Compression/Liquefaction -140.8 -19.6 N/A -11.7 Fischer Tropsch & Refining Processes -40.9 -45.7 -53.8 -60.3 Refrigeration -24.0 -26.2 -41.5 -47.1 Cooling Tower -26.6 -18.5 -18.8 -20.8 Water Treatment -17.6 -13.0 -15.4 -13.9 Power Generated 960.0 401.7 396.7 471.9 Gas Turbine 300.0 N/A N/A N/A Condensing Turbines 178.6 N/A N/A N/A Saturated Turbines 481.4 401.7 396.7 471.9 Water Requirements2 Water Consumed (gpm) 20,856 15,454 13,790 14,552 Water Consumed/lb Feed (lb/lb) 4.65 9.92 8.55 9.86 Water Consumed/bbl Product (bbl/bbl) 14.3 10.6 9.5 10.0

Form 412.09 (Rev. 10)
Idaho National Laboratory
HTGR-INTEGRATED COAL AND GAS TO LIQUIDS
PRODUCTION ANALYSIS
Identifier: Revision: Effective Date:
TEV-672
2
09/30/2011 Page: 29 of 76
Table 2. CTL and GTL modeling case study results.
Conventional CTL Nuclear Integration
CTL Conventional GTL
Nuclear Integration GTL
CO2 Summary Total CO2 Produced (ton/day) 40,046 1,473 7,164 4,190 Emitted 8,803 1,473 7,164 841 Capturable 31,243 N/A N/A 3,349 Nuclear Integration Summary Electricity (MW) N/A -2,643.0 N/A -13.9 HTSE N/A -2,511.8 N/A N/A HTGR House Loads N/A -295.2 N/A -13.9 Balance of Fossil Plant N/A 164.0 N/A N/A Electrolysis Heat (MMBTU/hr) N/A 2408.7 N/A N/A From Nuclear Plant N/A 2330.2 N/A N/A From Secondary Circulator N/A 78.5 N/A N/A Electrolysis Products Total Hydrogen (ton/day) N/A 1,957 N/A N/A Total Oxygen (ton/day) N/A 15,430 N/A N/A Used in Plant (ton/day) N/A 9,198 N/A N/A Excess (ton/day) N/A 6,232 N/A N/A HTGR Heat Use (MMBTU/hr) N/A N/A N/A 1,633 Reformer N/A N/A N/A 1,057 Refinery N/A N/A N/A 741 From Secondary Circulator N/A N/A N/A -165 1Standard temperature of 60 degrees F. 2Does not include water usage for HTGR.

Form 412.09 (Rev. 10)
Idaho National Laboratory
HTGR-INTEGRATED COAL AND GAS TO LIQUIDS
PRODUCTION ANALYSIS
Identifier: Revision: Effective Date:
TEV-672
2
09/30/2011 Page: 30 of 76
Figure 5. CTL and GTL modeling case material balance summary.

Form 412.09 (Rev. 10)
Idaho National Laboratory
HTGR-INTEGRATED COAL AND GAS TO
LIQUIDS PRODUCTION ANALYSIS
Identifier: Revision: Effective Date:
TEV-672
2
09/30/2011 Page: 31 of 76
4. ECONOMIC MODELING OVERVIEW
The economic viability of the CTL and GTL processes was assessed using standard economic evaluation methods, specifically the internal rate of return (IRR). The economics were evaluated for the conventional and nuclear-integrated cases described in the previous sections. The total capital investment (TCI), based on the total equipment costs; annual revenues; and annual manufacturing costs were first calculated for the cases. . The present worth was then calculated based on the annual after tax cash flows. The following sections describe the methods used to calculate the capital costs, annual revenues, annual manufacturing costs, and the resulting economic results. For the economics it is assumed that the primary selling product is diesel. The economics were analyzed for multiple owner operator scenarios, with the HTGR and synthetic fuel facilities operated by independent organizations or a single owner/operator. The economic results are preliminary and should be refined as the design of the HTGR progresses, if the design of the HTGR is changed significantly, or if additional refinements of the HTGR and/or CTL/GTL capital and/or operating costs become available.
4.1 Capital Cost Estimation
The Association for the Advancement of Cost Engineering (AACE) International recognizes five classes of estimates. The level of project definition for this study was determined to be an AACE International Class 4 estimate, which has a probable error of -30% and +50%, as described in TEV-1196 (INL 2011a). A Class 4 estimate is associated with a feasibility study or top-down cost estimate and has one to fifteen percent of full project definition (AACE 2005).
Equipment items for this study were not individually priced. Rather, cost estimates were based on scaled costs for major plant processes from published literature. Cost estimates were generated for coal preparation, the ASU, gasification, gas cleanup, FT synthesis, product refining and upgrading, gas turbines, steam turbines, the HRSG, cooling towers, HTSE electrolysis, and the HTGRs for the CTL scenarios. Cost estimates were generated for SMR, the ASU, FT synthesis, product refining and upgrading, steam turbines, the HRSG, and the HTGR for the GTL scenarios. In some instances, several costs were averaged. Gas cleanup includes costs for water-gas-shift reactors, the Rectisol process, sulfur recovery, and CO2 compression/liquefaction for CTL. Gas cleanup is not necessary in the GTL flowsheets, except for CO2 compression/liquefaction when sequestration is assumed for the nuclear-integrated case.
The installed capital costs presented are for inside the battery limits, and exclude costs for administrative offices, storage areas, utilities, and other essential and nonessential auxiliary facilities. Fixed capital costs were estimated from literature estimates and scaled estimates (capacity, year, and material) from previous quotes. Capacity adjustments were based on the six-tenths factor rule:

Form 412.09 (Rev. 10)
Idaho National Laboratory
HTGR-INTEGRATED COAL AND GAS TO
LIQUIDS PRODUCTION ANALYSIS
Identifier: Revision: Effective Date:
TEV-672
2
09/30/2011 Page: 32 of 76
(1)
where C1 is the cost of the equipment item at capacity q1, C2 is the cost of the equipment at capacity q2, and n is the exponential factor, which typically has a value of 0.6 (Peters 2002). It was assumed that the number of trains did not have an impact on cost scaling.
The HTGR installed capital costs are based on the capital cost correlations presented in Section 2.6 of TEV-1196 for an nth of a kind HTGR, a mature commercial installation. Preconstruction costs, balance of equipment costs, indirect costs, and project contingencies were added in accordance with the costs outlined in Sections 2.1 through 2.5 of TEV-1196 (INL 2011a).
Cost indices were used to adjust equipment prices from previous years to 2010 values using the Chemical Engineering Plant Cost Index (CEPCI) as depicted in Table 3.
Table 3. CEPCI data. Year CEPCI Year CEPCI 1991 361.3 2001 394.3 1992 358.2 2002 395.6 1993 359.2 2003 402 1994 368.1 2004 444.2 1995 381.1 2005 468.2 1996 381.7 2006 499.6 1997 386.5 2007 525.4 1998 389.5 2008 575.4 1999 390.6 2009 521.9 2000 394.1 2010 550.8
After cost estimates were obtained for each of the process areas, the costs for water systems, piping, instrumentation and control, electrical systems, and buildings and structures were added based on scaling factors for the total installed equipment costs, based on information provided in studies performed by the National Energy Technology Laboratory (NETL) (2000). These factors were not added to the cost of the HTGR, as the cost basis for the HTGR was assumed to represent a complete and operable system. Table 4 presents the factors utilized in this study.
C2 C1
q2
q1
n

Form 412.09 (Rev. 10)
Idaho National Laboratory
HTGR-INTEGRATED COAL AND GAS TO
LIQUIDS PRODUCTION ANALYSIS
Identifier: Revision: Effective Date:
TEV-672
2
09/30/2011 Page: 33 of 76
Table 4. Capital cost adjustment factors. Year Factor Water Systems 7.1% Piping 7.1% Instrumentation and Control 2.6% Electrical Systems 8.0% Buildings and Structures 9.2%
Finally, an engineering fee of 10% and a project contingency of 18% were assumed to determine the TCI for the fossil processes. The capital cost correlations used for the HTGR includes all engineering fees and contingencies; therefore, these factors were not applied to this cost.
Based on the AACE International contingency guidelines it would appear that the overall project contingency for the non-nuclear portion of the capital should be in the range of 30% to 50%. However, because the cost estimates were scaled based on estimated, quoted, and actual project costs, the overall non-nuclear project contingency should be more in the range of 15% to 20%. Eighteen percent was selected based on similar studies conducted by NETL (2007).
Table 5 and Figure 6 presents the capital cost estimate breakdown for the conventional CTL case, Table 6 and Figure 7 for the nuclear-integrated CTL case, Table 7 and Figure 8 for the conventional GTL case, and Table 8 and Figure 9 for the nuclear-integrated GTL case. Capital costs are presented assuming no CO2 sequestration; however, cases that have sequestration as an option list the differential TCI that would be required to include CO2 sequestration, i.e. compression and/or liquefaction equipment.

Form 412.09 (Rev. 10)
Idaho National Laboratory
HTGR-INTEGRATED COAL AND GAS TO
LIQUIDS PRODUCTION ANALYSIS
Identifier: Revision: Effective Date:
TEV-672
2
09/30/2011 Page: 34 of 76
Table 5. Total capital investment, conventional CTL case. Installed Cost Engineering Fee Contingency Total Capital Cost Coal Preparation $294,826,984 $29,482,698 $58,375,743 $382,685,426 ASU $412,284,613 $41,228,461 $81,632,353 $535,145,428 Gasification $948,158,150 $94,815,815 $187,735,314 $1,230,709,279 Gas Cleaning $811,266,409 $81,126,641 $160,630,749 $1,053,023,798 FT Reactors & Refining $355,434,504 $35,543,450 $70,376,032 $461,353,986 Gas Turbines $76,258,421 $7,625,842 $15,099,167 $98,983,430 Steam Turbines $143,343,132 $14,334,313 $28,381,940 $186,059,385 HRSG $51,579,237 $5,157,924 $10,212,689 $66,949,850 Cooling Towers $9,985,833 $998,583 $1,977,195 $12,961,611 Water Systems $220,322,747 $22,032,275 $43,623,904 $285,978,926 Piping $220,322,747 $22,032,275 $43,623,904 $285,978,926 I&C $80,681,569 $8,068,157 $15,974,951 $104,724,677 Electrical Systems $248,250,983 $24,825,098 $49,153,695 $322,229,775 Buildings & Structures $285,488,630 $28,548,863 $56,526,749 $370,564,242 Total Capital Investment $5,397,348,737 Differential for Adding CO2 Sequestration $33,564,727
Figure 6. Total capital investment, conventional CTL case, no sequestration.
Coal Preparation7%
ASU10%
Gasification23%
Gas Cleaning20%
FT Reactors & Refining
9%
Gas Turbines2%
Steam Turbines3%
HRSG1%
Cooling Towers0%
Water Systems5%
Piping5%
I&C2%
Electrical Systems
6%
Buildings & Structures
7%

Form 412.09 (Rev. 10)
Idaho National Laboratory
HTGR-INTEGRATED COAL AND GAS TO
LIQUIDS PRODUCTION ANALYSIS
Identifier: Revision: Effective Date:
TEV-672
2
09/30/2011 Page: 35 of 76
Table 6. Total capital investment, nuclear-integrated CTL case. Installed Cost Engineering Fee Contingency Total Capital Cost 850°C ROT HTGR(s) $858,289,406 Included Included $858,289,406 700°C ROT HTGR(s) $6,673,774,875 Included Included $6,673,774,875 Power Cycles $2,575,261,279 Included Included $2,575,261,279 HTSE $742,126,119 $74,212,612 $146,940,972 $963,279,703 Coal Preparation $111,361,310 $11,136,131 $22,049,539 $144,546,980 Gasification $360,189,281 $36,018,928 $71,317,478 $467,525,687 Gas Cleaning $355,702,237 $35,570,224 $70,429,043 $461,701,504 FT Reactors and Refining $362,827,302 $36,282,730 $71,839,806 $470,949,838 Steam Turbines $106,441,282 $10,644,128 $21,075,374 $138,160,784 HRSG $9,315,065 $931,507 $1,844,383 $12,090,955 Cooling Towers $25,254,070 $2,525,407 $5,000,306 $32,779,783 Water Systems $147,198,383 $14,719,838 $29,145,280 $191,063,502 Piping $147,198,383 $14,719,838 $29,145,280 $191,063,502 I&C $53,903,633 $5,390,363 $10,672,919 $69,966,916 Electrical Systems $165,857,333 $16,585,733 $32,839,752 $215,282,819 Buildings and Structures $190,735,933 $19,073,593 $37,765,715 $247,575,242 Total Capital Investment $13,713,312,773 HTGR and Power Cycle $3,605,987,213 CTL Process $10,107,325,559
Figure 7. Total capital investment, nuclear-integrated CTL case.
850 C ROT HTGR(s)
6%
700 C ROT HTGR(s)
49%
Power Cycles19%
HTSE7%
Coal Preparation1%
Gasification3%
Gas Cleaning3%
FT Reactors & Refining
3%
Steam Turbines1%
HRSG0%
Cooling Towers0%
Water Systems1%
Piping1%
I&C1%
Electrical Systems
2%
Buildings & Structures
2%

Form 412.09 (Rev. 10)
Idaho National Laboratory
HTGR-INTEGRATED COAL AND GAS TO
LIQUIDS PRODUCTION ANALYSIS
Identifier: Revision: Effective Date:
TEV-672
2
09/30/2011 Page: 36 of 76
Table 7. Total capital investment, conventional GTL case. Installed Cost Engineering Fee Contingency Total Capital Cost ASU $258,831,117 $25,883,112 $51,248,561 $335,962,790 Autothermal Reforming $349,828,953 $34,982,895 $69,266,133 $454,077,981 FT Reactors & Refining $414,248,152 $41,424,815 $82,021,134 $537,694,101 Steam Turbines $105,644,360 $10,564,436 $20,917,583 $137,126,380 HRSG $9,848,554 $984,855 $1,950,014 $12,783,423 Cooling Towers $25,355,761 $2,535,576 $5,020,441 $32,911,778 Water Systems $82,626,740 $8,262,674 $16,360,094 $107,249,508 Piping $82,626,740 $8,262,674 $16,360,094 $107,249,508 I&C $30,257,679 $3,025,768 $5,991,021 $39,274,468 Electrical Systems $93,100,552 $9,310,055 $18,433,909 $120,844,516 Buildings & Structures $107,065,635 $10,706,563 $21,198,996 $138,971,194 Total Capital Investment $2,024,145,646
Figure 8. Total capital investment, conventional GTL case.
ASU17%
Autothermal Reforming
22%
FT Reactors & Refining
26%
Steam Turbines7%
HRSG1%
Cooling Towers2%
Water Systems5%
Piping5%
I&C2%
Electrical Systems
6%
Buildings & Structures
7%

Form 412.09 (Rev. 10)
Idaho National Laboratory
HTGR-INTEGRATED COAL AND GAS TO
LIQUIDS PRODUCTION ANALYSIS
Identifier: Revision: Effective Date:
TEV-672
2
09/30/2011 Page: 37 of 76
Table 8. Total capital investment, nuclear-integrated GTL case. Installed Cost Engineering Fee Contingency Total Capital Cost 700°C ROT HTGR(s) $1,006,875,557 Included Included $1,006,875,557 ASU $257,209,828 $25,720,983 $50,927,546 $333,858,357 Autothermal Reforming $355,019,247 $35,501,925 $70,293,811 $460,814,982 CO2 Removal $41,008,243 $4,100,824 $8,119,632 $53,228,699 FT Reactors & Refining $430,422,340 $43,042,234 $85,223,623 $558,688,198 Steam Turbines $117,240,857 $11,724,086 $23,213,690 $152,178,632 HRSG $5,575,514 $557,551 $1,103,952 $7,237,017 Cooling Towers $29,243,593 $2,924,359 $5,790,231 $37,958,184 Water Systems $87,736,093 $8,773,609 $17,371,746 $113,881,449 Piping $87,736,093 $8,773,609 $17,371,746 $113,881,449 I&C $32,128,710 $3,212,871 $6,361,485 $41,703,066 Electrical Systems $98,857,570 $9,885,757 $19,573,799 $128,317,126 Buildings & Structures $113,686,205 $11,368,621 $22,509,869 $147,564,694 Total Capital Investment $3,156,187,410 HTGR and Power Cycle $2,149,311,853 GTL Process $1,006,875,557 Differential for Adding CO2 Sequestration $16,394,475
Figure 9. Total capital investment, nuclear-integrated GTL case, no sequestration.
700 C ROT HTGR(s)
32%
ASU10%Autothermal
Reformer14%
CO2 Removal2%
FT Reactors & Refining
18%
Steam Turbines5%
HRSG0%
Cooling Towers1%
Water Systems4%
Piping4%
I&C1%
Electrical Systems
4%
Buildings & Structures
5%

Form 412.09 (Rev. 10)
Idaho National Laboratory
HTGR-INTEGRATED COAL AND GAS TO
LIQUIDS PRODUCTION ANALYSIS
Identifier: Revision: Effective Date:
TEV-672
2
09/30/2011 Page: 38 of 76
4.2 Estimation of Revenue
Yearly revenues were estimated for all cases based on recent price data for the various products generated. When a separate owner operator configuration is assumed, the HTGR collects revenues from the heat and electricity supplied to the CTL/GTL processes. When heat is exported from the HTGR, the selling price is assumed to be related to electricity price based on the HTGR power generation efficiency as follows:
(2)
An HTGR power generation efficiency of 43% is assumed, regardless of the power cycle configuration. This allows for an equal comparison for cases where cycle efficiencies may be higher due to power cycle type and/or steam extraction.
Revenues were estimated for low, average, and high prices for diesel and naphtha. High prices correspond to values from July 2008, low prices are from March 2009, and average prices were the average of the high and low values (EIA 2011a). Diesel prices were gathered from the Energy Information Administration (EIA) and represent wholesale prices and do not include taxes. Naphtha prices were scaled based on diesel prices. Selling prices for LPG, electricity, slag, and sulfur were not varied in the study; this was a reasonable assumption since these prices historically follow the standard rate of inflation and do not vary widely during the year, unlike liquid fuel products. The electricity selling price to the industrial process is based on the current industrial market price of electricity, $67.90/MWe-hr (EIA 2011b). When electricity is sold to the grid, the price is based on 60%1 of the current average market price of electricity, $59.28/MWe-hr (EIA 2011b). Revenues were also calculated to determine the necessary selling prices of diesel and heat and electricity, for the separate owner operator scenario, to achieve a specific rate of return; however, these revenues are not presented in the following tables. Additionally, revenues are only presented for the non-sequestration cases; however, cases that have sequestration as an option list the differential revenue that would result from including CO2 sequestration, i.e. revenue losses associated with electricity use from compression and/or liquefaction equipment.
Oxygen and nitrogen are generated in the CTL and GTL cases. However, it was determined that the volume produced would saturate the U.S. industrial gas market for both commodities if several plants were constructed. Therefore, revenues for these streams are not included in the analysis.
1 The current average market price for electricity is $98.80/MWe-hr, 60% represents the fraction of the power
price that accounts for generation.

Form 412.09 (Rev. 10)
Idaho National Laboratory
HTGR-INTEGRATED COAL AND GAS TO
LIQUIDS PRODUCTION ANALYSIS
Identifier: Revision: Effective Date:
TEV-672
2
09/30/2011 Page: 39 of 76
The revenues presented for the fossil portion are for selling diesel at the low, average, and high product prices. When intermediate revenues for the HTGR are presented, for the independent owner operator scenarios, the heat and electricity prices are presented at the market price. A stream factor of 90% is assumed for both the fossil and nuclear plants. Table 9 presents the revenues for the conventional CTL case and Table 10 presents the revenues for the HTGR-integrated CTL case. Table 11 presents the revenues for the conventional GTL case and Table 12 presents the revenues for the HTGR-integrated GTL case.
Table 9. Annual revenues, conventional CTL case. Price Generated Annual Revenue LPG 1.52 $/gal 90,552 gal/day $45,253,392 Electricity 59.28 $/MWe-hr 248 MWe $115,725,080 Slag 20.00 $/ton 1,924 ton/day $12,640,680 Sulfur 40.00 $/ton 847 ton/day $11,129,580 Diesel, low 1.54 $/gal 1,494,654 gal/day $753,675,543 Naphtha, low 1.41 $/gal 514,878 gal/day $238,597,480 Diesel, average 2.80 $/gal 1,494,654 gal/day $1,373,064,271 Naphtha, average 2.57 $/gal 514,878 gal/day $434,682,640 Diesel, high 4.06 $/gal 1,494,654 gal/day $1,992,452,999 Naphtha, high 3.73 $/gal 514,878 gal/day $115,725,080 Annual Revenue, low $1,177,021,755 Annual Revenue, average $1,992,495,643 Annual Revenue, high $2,807,969,531 Differential for Adding CO2 Sequestration -$12,718,160
Table 10. Annual revenues, nuclear-integrated CTL case. Price Generated Annual Revenue LPG 1.52 $/gal 125,916 gal/day $62,926,563 Slag 20.00 $/ton 668 ton/day $4,388,760 Sulfur 40.00 $/ton 298 ton/day $3,915,720 Diesel, low 1.54 $/gal 1,478,148 gal/day $745,352,434 Naphtha, low 1.41 $/gal 496,020 gal/day $229,858,572 Diesel, average 2.80 $/gal 1,478,148 gal/day $1,357,901,030 Naphtha, average 2.57 $/gal 496,020 gal/day $418,761,887 Diesel, high 4.06 $/gal 1,478,148 gal/day $1,970,449,626 Naphtha, high 3.73 $/gal 496,020 gal/day $607,665,203 Annual Revenue – Fossil, low $1,046,442,049 Annual Revenue – Fossil, average $1,847,893,960 Annual Revenue – Fossil, high $2,649,345,872 Heat 29.20 $/MWt-hr 683 MWt $157,219,188 Electricity 69.70 $/MWe-hr 2,348 MWe $1,256,832,748 Annual Revenue – HTGR (separate owner operator) $1,414,051,936

Form 412.09 (Rev. 10)
Idaho National Laboratory
HTGR-INTEGRATED COAL AND GAS TO
LIQUIDS PRODUCTION ANALYSIS
Identifier: Revision: Effective Date:
TEV-672
2
09/30/2011 Page: 40 of 76
Table 11. Annual revenues, conventional GTL case. Price Generated Annual Revenue LPG 1.52 $/gal 147,882 gal/day $73,904,079 Electricity 59.28 $/MWe-hr 67 MWe $31,126,410 Diesel, low 1.54 $/gal 1,452,402 gal/day $732,370,077 Naphtha, low 1.41 $/gal 499,464 gal/day $231,454,542 Diesel, average 2.80 $/gal 1,452,402 gal/day $1,334,249,460 Naphtha, average 2.57 $/gal 499,464 gal/day $421,669,464 Diesel, high 4.06 $/gal 1,452,402 gal/day $1,936,128,843 Naphtha, high 3.73 $/gal 499,464 gal/day $611,884,385 Annual Revenue, low $1,068,855,109 Annual Revenue, average $1,860,949,413 Annual Revenue, high $2,653,043,718
Table 12. Annual revenues, nuclear-integrated GTL case. Price Generated Annual Revenue LPG 1.52 $/gal 122,388 gal/day $61,163,444 Electricity 59.28 $/MWe-hr 81 MWe $38,043,391 Diesel, low 1.54 $/gal 1,487,220 gal/day $749,926,967 Naphtha, low 1.41 $/gal 490,308 gal/day $227,211,598 Diesel, average 2.80 $/gal 1,487,220 gal/day $1,366,235,025 Naphtha, average 2.57 $/gal 490,308 gal/day $413,939,566 Diesel, high 4.06 $/gal 1,487,220 gal/day $1,982,543,083 Naphtha, high 3.73 $/gal 490,308 gal/day $600,667,534 Annual Revenue – Fossil, low $1,076,345,399 Annual Revenue – Fossil, average $1,879,381,425 Annual Revenue – Fossil, high $2,682,417,451 Differential for Adding CO2 Sequestration -$5,468,153 Heat 29.20 $/MWt-hr 479 MWt $110,191,545 Annual Revenue – HTGR (separate owner operator) $110,191,545
4.3 Estimation of Manufacturing Costs
Manufacturing cost is the sum of direct and indirect manufacturing costs. Direct manufacturing costs for this project include the cost of raw materials, utilities, and operating labor and maintenance. Indirect manufacturing costs include estimates for the cost of overhead and insurance and taxes (Perry 2008).
Labor costs are assumed to be 1.15% of the TCI for both cases. This percentage is based on staffing requirements for a conventional 50,000 bbl/day CTL plant, which is assumed to adequately represent the labor for the fossil portion of the nuclear-integrated CTL plant and the GTL plants. Maintenance costs were assumed to be 3% of the TCI per the Handbook of Petroleum Processing. The power cycles and HTSE were not included in the TCI for operation and

Form 412.09 (Rev. 10)
Idaho National Laboratory
HTGR-INTEGRATED COAL AND GAS TO
LIQUIDS PRODUCTION ANALYSIS
Identifier: Revision: Effective Date:
TEV-672
2
09/30/2011 Page: 41 of 76
maintenance costs, as they were calculated separately. Taxes and insurance were assumed to be 1.5% of the TCI, excluding the HTGR, an overhead of 65% of the labor and maintenance costs was assumed, and royalties were assumed to be 1% of the coal or natural gas cost, this value was assumed based on information presented in the Handbook of Petroleum Processing (Jones 2006). Table 13 and Table 14 provide the manufacturing costs for the conventional CTL case and the nuclear-integrated CTL case, respectively. Table 15 and Table 16 provide the manufacturing costs for the conventional GTL case and the nuclear-integrated GTL case, respectively. Again, availability of both the fossil and nuclear plants was assumed to be 90%. The conventional CTL and nuclear-integrated GTL annual manufacturing costs presented do not include costs for CO2 sequestration; however, the differential manufacturing costs that would result from including CO2 sequestration are presented, i.e. costs associated with CO2 pipeline transport and injection.
Table 13. Annual manufacturing costs, conventional CTL case. Price Consumed Annual Cost Direct Costs Materials Coal 34.35 $/ton 26,941 ton/day $304,000,353 Fly Ash Disposal 34.20 $/ton 807 ton/day $9,065,343 Rectisol Solvent 1.03 $/gal 7,830 gal/day $2,649,169 Wastewater Treatment 1.37 $/k-gal 6,668 k-gal/day $3,010,079 Makeup H2O Clarifying 0.03 $/k-gal 30,032 k-gal/day $252,192 Carbon, Hg Guard Bed 5.56 $/lb 35 lb/day $64,605 Zinc Oxide 300 $/ft3 10.72 ft3/day $1,056,784 Sour Shift Catalyst 825 $/ft3 4.42 ft3/day $1,198,267 Claus Catalyst 21 $/ft3 6.46 ft3/day $44,573 Sulfur Reduction Catalyst 275 $/ft3 1.33 ft3/day $120,537 FT Catalyst 37.50 $/lb 856 lb/day $10,547,297 Hydrocracking Catalyst 850 $/ft3 10 ft3/day $2,819,344 Hydrotreating Catalyst 360 $/ft3 3 ft3/day $387,644 CO2 Sequestration 15.19 $/ton 0 ton/day $0 Utilities Water 0.05 $/k-gal 30,032 k-gal/day $467,427 Royalties $3,040,004 Labor and Maintenance $223,989,973 Indirect Costs Overhead $145,593,482 Insurance and Taxes $80,960,231 Manufacturing Costs $789,267,303 Differential for Adding CO2 Sequestration $158,746,570

Form 412.09 (Rev. 10)
Idaho National Laboratory
HTGR-INTEGRATED COAL AND GAS TO
LIQUIDS PRODUCTION ANALYSIS
Identifier: Revision: Effective Date:
TEV-672
2
09/30/2011 Page: 42 of 76
Manufacturing costs for the nuclear plant were based on information presented in TEV-1196. HTGR manufacturing costs include operations and maintenance (O&M) costs, fuel costs, and decommissioning costs. The O&M, fuel, and decommissioning costs are based on the total thermal rating of the plant (INL 2011a). O&M and decommissioning costs are presented on an annual basis, fuel costs are presented as the total refueling cost per core. The nuclear-integrated case is presented for the single owner operator scenario only. When the HTGR is operated independently, the CTL process would purchase heat and electricity as specified in the HTGR revenues table presented previously (Table 10) and the manufacturing costs would be comprised of the nuclear fuel, O&M, and decommissioning costs presented below (Table 14). Again, availability was assumed to be 90%.
The decommissioning fund payment is calculated using the decommissioning cost in dollars per MWt presented in TEV-1196, which is based on NUREG-1307 (NRC 2010). That cost is multiplied by the total reactor power level to determine the total decommissioning cost and then inflated to the year decommissioning will occur, which is based on the economic recovery period. The sinking fund payment is calculated based on the estimated decommissioning cost and a 5% discount rate (GIF 2007).
It is recognized that the HTGR may operate longer than the specified economic recovery period. However, assuming that the reactor is decommissioned at the end of the recovery period is an economically conservative assumption.

Form 412.09 (Rev. 10)
Idaho National Laboratory
HTGR-INTEGRATED COAL AND GAS TO
LIQUIDS PRODUCTION ANALYSIS
Identifier: Revision: Effective Date:
TEV-672
2
09/30/2011 Page: 43 of 76
Table 14. Annual manufacturing costs, nuclear-integrated CTL case. Price Consumed Annual Cost Direct Costs Materials Coal 34.35 $/ton 9,354 ton/day $105,552,967 Fly Ash Disposal 34.20 $/ton 280 ton/day $3,145,348 Rectisol Solvent 1.03 $/gal 3,023 gal/day $1,022,706 Wastewater Treatment 1.37 $/k-gal 5,714 k-gal/day $2,579,464 Makeup H2O Clarifying 0.03 $/k-gal 22,253 k-gal/day $186,871 Carbon, Hg Guard Bed 5.56 $/lb 12 lb/day $22,119 Zinc Oxide 300 $/ft3 9.40 ft3/day $925,949 Claus Catalyst 21 $/ft3 2.44 ft3/day $16,824 Sulfur Reduction Catalyst 275 $/ft3 0.50 ft3/day $45,397 FT Catalyst 37.50 $/lb 856 lb/day $10,547,297 Hydrocracking Catalyst 850 $/ft3 10 ft3/day $2,769,742 Hydrotreating Catalyst 360 $/ft3 3 ft3/day $379,396 HTSE Cell Replacement 0.025 $/lb H2 3,914 k-lb/hr H2 $32,742,109 Utilities Water 0.05 $/k-gal 22,253 k-gal/day $346,356 Royalties $1,055,530 Labor and Maintenance $132,598,419 Indirect Costs Overhead $86,188,972 Insurance and Taxes $54,089,808 Nuclear Costs O&M 4.31 $/MWt-hr 6,104 MWt $207,640,555 Decommissioning Fund Payment $46,536,365 Annual Manufacturing Costs $688,392,193 Cost Per Core Refueling Cost $52,608,619
The natural gas purchase price for the GTL cases was varied to account for the large fluctuations seen in the market. Costs were calculated for a low ($4.50/MSCF), average ($5.50/MSCF), and high ($12.00/MSCF) industrial natural gas price. High prices correspond to prices from June 2008, low prices are from September 2009, and the average price was chosen to reflect current natural gas prices (EIA 2011c). Only average natural gas prices are presented in the tables that follow.

Form 412.09 (Rev. 10)
Idaho National Laboratory
HTGR-INTEGRATED COAL AND GAS TO
LIQUIDS PRODUCTION ANALYSIS
Identifier: Revision: Effective Date:
TEV-672
2
09/30/2011 Page: 44 of 76
Table 15. Annual manufacturing costs, conventional GTL case. Price Consumed Annual Cost Direct Costs Materials Average Natural Gas 5.50 $/MSCF 427,000 MSCFD $771,482,250 Wastewater Treatment 1.37 $/k-gal 7,741 k-gal/day $3,494,846 Makeup H2O Clarifying 0.03 $/k-gal 19,857 k-gal/day $166,754 Zinc Oxide 300 $/ft3 7.33 ft3/day $722,837 Hydrolysis Catalyst 450 $/ft3 2 ft3/day $238,856 Preforming Catalyst 2,350 $/ft3 2 ft3/day $1,630,522 Reforming Catalyst 650 $/ft3 1 ft3/day $135,581 FT Catalyst 37.50 $/lb 856 lb/day $10,545,609
Hydrocracking Catalyst 850 $/ft3 10 ft3/day $2,657,422 Hydrotreating Catalyst 360 $/ft3 3 ft3/day $409,280 Utilities Water 0.05 $/k-gal 19,857 k-gal/day $309,070 Royalties $7,714,823 Labor and Maintenance $84,002,044 Indirect Costs Overhead $54,601,329 Insurance and Taxes $30,362,185 Manufacturing Costs, Average Natural Gas $968,473,408
When the HTGR is operated independently, the GTL process would purchase heat and electricity as specified in the HTGR revenues table presented previously (Table 12) and the manufacturing costs would be comprised of the nuclear fuel, O&M, and decommissioning costs presented below (Table 16). Again, availability was assumed to be 90%.

Form 412.09 (Rev. 10)
Idaho National Laboratory
HTGR-INTEGRATED COAL AND GAS TO
LIQUIDS PRODUCTION ANALYSIS
Identifier: Revision: Effective Date:
TEV-672
2
09/30/2011 Page: 45 of 76
Table 16. Annual manufacturing costs, nuclear-integrated GTL case. Price Consumed Annual Cost Direct Costs Materials Average Natural Gas 5.50 $/MSCF 390,000 MSCFD $704,632,500 Wastewater Treatment 1.37 $/k-gal 6,297 k-gal/day $2,842,748 Makeup H2O Clarifying 0.03 $/k-gal 20,955 k-gal/day $175,973 Zinc Oxide 300 $/ft3 7.79 ft3/day $767,293 Hydrolysis Catalyst 450 $/ft3 2 ft3/day $270,709 Preforming Catalyst 2,350 $/ft3 2 ft3/day $1,445,513 Propylene Carbonate 1.64 $/lb 186 lb/day $100,330 Reforming Catalyst 650 $/ft3 1 ft3/day $119,203 FT Catalyst 37.50 $/lb 856 lb/day $10,546,453 Hydrocracking Catalyst 850 $/ft3 10 ft3/day $2,717,156 Hydrotreating Catalyst 360 $/ft3 3 ft3/day $409,340 CO2 Sequestration 15.19 $/ton 0 ton/day $0 Utilities Water 0.05 $/k-gal 20,955 k-gal/day $326,158 Royalties $7,046,325 Labor and Maintenance $89,196,442 Indirect Costs Overhead $57,977,687 Insurance and Taxes $32,239,678 Nuclear Costs O&M 9.83 $/MWt-hr 479 MWt $34,820,406 Decommissioning Fund Payment $3,895,985 Manufacturing Costs, Average Natural Gas $949,529,898 Differential for Adding CO2 Sequestration $18,084,561 Cost Per Core Refueling Cost $38,716,117
4.4 Economic Comparison
Several economic indicators were calculated for each case to assess the economic desirability of synthetic diesel production. For all cases the IRR was calculated for the CTL and GTL2 processes at low, average, and high diesel prices, as well as for multiple owner operator scenarios for the nuclear-integrated cases. In addition, the diesel price necessary for a return of 12% was calculated for all cases, as well as the heat and electricity prices for a 12% rate of return for the separate owner operator nuclear configurations. Table 17 lists the economic assumptions used for the analyses.
2 For low, average, and high natural gas prices for the GTL scenarios.

Form 412.09 (Rev. 10)
Idaho National Laboratory
HTGR-INTEGRATED COAL AND GAS TO
LIQUIDS PRODUCTION ANALYSIS
Identifier: Revision: Effective Date:
TEV-672
2
09/30/2011 Page: 46 of 76
Table 17. Economic assumptions. Assumption Year Construction Begins 2012 Construction Information Preconstruction Period 6 months Nuclear Construction Period – per Reactor 36 months Reactor Startup Staggering 6 months Fossil Construction Period – per Train 36 months Train Startup Staggering 6 months Percent Capital Invested Each Year S-Curve Distribution Plant Startup Information Startup Time 12 months Operating Costs Multiplier 1.2 Revenue Multiplier 0.65 Economic Analysis Period 30 years Availability 90% Inflation Rate 3% Debt to Equity Ratio 50%/50% Loan Information Interest Rate on Debt 8% Interest on Debt During Construction 8% Loan Repayment Term 15 years Tax Information Effective Tax Rate 35.9% State Tax Rate 6% Federal Tax Rate 35% MACRS Depreciation Term 15 year life IRR 12%
4.4.1 Cash Flow
To assess the IRR and present worth (PW) of each scenario, it is necessary to calculate the after tax cash flow (ATCF). To calculate the ATCF, it is necessary to first calculate the revenues (Rk); cash outflows (Ek); sum of all noncash, or book, costs such as depreciation (dk); net income before taxes (NIBT); the effective income tax rate (t); and the income taxes (Tk), for each year (k). The taxable income is revenue minus the sum of all cash outflows and noncash costs. Therefore the income taxes per year are defined as follows (Sullivan 2003):
(3)
Depreciation for the economic calculations was calculated using a standard Modified Accelerated Cost Recovery System (MACRS) depreciation method with a property class of 15 years. Depreciation was

Form 412.09 (Rev. 10)
Idaho National Laboratory
HTGR-INTEGRATED COAL AND GAS TO
LIQUIDS PRODUCTION ANALYSIS
Identifier: Revision: Effective Date:
TEV-672
2
09/30/2011 Page: 47 of 76
assumed for the TCI for each reactor module and fossil process train with the first charge occurring the year the corresponding HTGR/process train comes online, i.e. when initial revenues are received. Table 18 presents the recovery rates for a 15-year property class (Perry 2008).
Table 18. MACRS depreciation. Year Recovery Rate Year Recovery Rate
1 0.05 9 0.0591 2 0.095 10 0.059 3 0.0855 11 0.0591 4 0.077 12 0.059 5 0.0693 13 0.0591 6 0.0623 14 0.059 7 0.059 15 0.0591 8 0.059 16 0.0295
The ATCF is then the sum of the before tax cash flow (BTCF) minus the income taxes owed. Note that the expenditures for capital are not taxed but are included in the BTCF each year there is a capital expenditure (Ck); this includes the equity capital and the debt principle. Figure 10 presents the yearly ATCFs for the nuclear-integrated CTL case for a 12% IRR.
Figure 10. ATCFs, HTGR-integrated CTL process, 12% IRR.
The BTCF is defined as follows (Sullivan 2003):
(4)
-$2,000,000,000
-$1,000,000,000
$0
$1,000,000,000
$2,000,000,000
$3,000,000,000
$4,000,000,000
1 6 11 16 21 26 31 36
Yea
rly
Aft
er T
ax C
ash
Flo
w
Analysis Year

Form 412.09 (Rev. 10)
Idaho National Laboratory
HTGR-INTEGRATED COAL AND GAS TO
LIQUIDS PRODUCTION ANALYSIS
Identifier: Revision: Effective Date:
TEV-672
2
09/30/2011 Page: 48 of 76
The ATCF can then be defined as:
(5)
4.4.1.1 Capital Cash Flows during Construction
Capital cash flows for the HTGR and fossil processes during construction were calculated for each year of construction based on two separate correlations. First, the percentage of capital assigned to each module or train was calculated based on an exponential correlation (Demick 2011). The exponent for the correlation is calculated based on the current module/train number, such that:
0.102 ln 0.963 0.402 (6)
where y is the exponent for the current module/train and Mod is the module/train being evaluated. The capital fraction is then determined for each module/train:
1 ∑ 11 (7)
where Number is the total number of reactor modules or process trains. The yearly fractional breakdown for each module’s/train’s capital is calculated by applying a generic standard cumulative distribution, the S-Curve, as recommended by the GEN-IV International Forum (GIF) (2007). The capital breakdown per month is calculated as follows:
0.5 sin_
1
1 (8)
where month is the current month in the reactor/fossil construction period and c_months is the total number of months in the current module’s/train’s construction period. The capital fraction for each year is calculated by summing the capital fraction for the corresponding months. The yearly capital fractions are then multiplied by the module/train fraction to determine to overall yearly capital fractional breakdown per module/train. Figure 11 presents the percentage of the TCI spent each year of construction for the HTGR-integrated CTL case.

Form 412.09 (Rev. 10)
Idaho National Laboratory
HTGR-INTEGRATED COAL AND GAS TO
LIQUIDS PRODUCTION ANALYSIS
Identifier: Revision: Effective Date:
TEV-672
2
09/30/2011 Page: 49 of 76
Figure 11. Percentage of TCI spent each year of construction, HTGR-integrated CTL process.
4.4.1.2 Reactor Refueling Cash Flows
Reactor refueling charges occur in the year a refueling is scheduled. The occurrences are determined based on the total number of reactor modules, when the modules come online, and the specified refueling period.
4.4.2 Internal Rate of Return
The IRR method is the most widely used rate of return method for performing engineering economic analyses. This method solves for the interest rate that equates the equivalent worth of an alternative’s cash inflows to the equivalent worth of cash outflows (after tax cash flow), i.e., the interest rate at which the PW is zero. The resulting interest is the IRR (i'). For the project to be economically viable, the calculated IRR must be greater than the desired minimum annual rate of return (MARR), which was assumed to be 12% (Sullivan 2003).
∑ 1 0 (9)
IRR calculations were performed for the calculated TCI for all cases. In addition, the price of diesel and heat and electricity, for the separate owner/operator scenario, necessary for an IRR of 12% and a PW of zero was calculated for each case. All calculations were performed using Excel (Excel 2007).
Finally, a CO2 tax was included into the calculations to determine the price of diesel necessary in all cases for a 12% IRR and a CO2 tax of
0%
5%
10%
15%
20%
25%
1 3 5 7 9
% T
CI
Construction Year

Form 412.09 (Rev. 10)
Idaho National Laboratory
HTGR-INTEGRATED COAL AND GAS TO
LIQUIDS PRODUCTION ANALYSIS
Identifier: Revision: Effective Date:
TEV-672
2
09/30/2011 Page: 50 of 76
$0/ton to $200/ton. The tax calculated was added to the existing yearly tax liability.
5. ECONOMIC MODELING RESULTS
Table 19 presents the results for the conventional CTL case, presenting the IRR for selling diesel at low, average, and high product prices, and the diesel selling price required for a 12% IRR. The nuclear-integrated CTL results are presented in Table 20, for both the single and independent owner/operator scenarios. A value of “N/A” indicates that the manufacturing costs exceeded the revenues.
Table 19. Conventional CTL economic results.
TCI
% IRR Product Price
Conventional CTL Process
$5,402,509,707 6.1 $1.54/gal
21.1 $2.80/gal 31.9 $4.06/gal
12.0 $1.95/gal
Conventional CTL Process
with Sequestration
$5,430,913,464 23.3 $1.54/gal
44.9 $2.80/gal
56.9 $4.06/gal
12.0 $2.22/gal

Form 412.09 (Rev. 10)
Idaho National Laboratory
HTGR-INTEGRATED COAL AND GAS TO
LIQUIDS PRODUCTION ANALYSIS
Identifier: Revision: Effective Date:
TEV-672
2
09/30/2011 Page: 51 of 76
Table 20. Nuclear-integrated CTL economic results.
TCI
% IRR Product Price
HTGR CTL Process
Single Owner/Operator
$13,713,312,773 N/A $1.54/gal 4.1 $2.80/gal
10.2 $4.06/gal 12.0 $4.57/gal
HTGR CTL Process
Independent Owner/Operator
Heat/Power at Market Price
$10,107,325,559 6.7 $67.90/MWe-hr 6.7 $29.20/MWt-hr
$3,605,987,213 N/A $1.54/gal N/A $2.80/gal 18.5 $4.06/gal 12.0 $1.95/gal
HTGR CTL Process
Independent Owner/Operator
Heat/Power at
12% IRR
$10,107,325,559 12.0 $92.77/MWe-hr 12.0 $39.89/MWt-hr
$3,605,987,213 N/A $1.54/gal N/A $2.80/gal 5.1 $4.06/gal
12.0 $4.47/gal
From the nuclear-integrated results, it is apparent that selling heat and power at the market price provides for the largest return on investment for the CTL process. However, the HTGR only has a 7% IRR selling heat and power at the market price to the fossil process; therefore, this case will not be included in the results comparison. Considering the two remaining cases, it is economically beneficial to have an independent owner operator for the CTL and HTGR facilities at an IRR of 12%; however, the single owner/operator scenario is more economical for a variety of diesel selling prices. As a result, the single owner operator scenario will be presented for the breakeven analyses. Figure 12 presents a graphical comparison of the IRR versus the diesel selling price for the convention and nuclear-integrated CTL cases, the nuclear-integrated case presented is for the single owner/operator scenario. The results demonstrate that the nuclear-integrated CTL case provides a lower IRR than the conventional case, either with or without CO2 sequestration.

Form 412.09 (Rev. 10)
Idaho National Laboratory
HTGR-INTEGRATED COAL AND GAS TO
LIQUIDS PRODUCTION ANALYSIS
Identifier: Revision: Effective Date:
TEV-672
2
09/30/2011 Page: 52 of 76
Figure 12. Conventional and nuclear-integrated CTL, IRR as a function of diesel selling price, single owner/operator for the nuclear-integrated process.
Table 21 presents the carbon tax results for the conventional and nuclear-integrated CTL cases, excluding the separate owner/operator scenario where heat and electricity are sold at the market price. Figure 13 depicts the carbon tax results for the conventional and nuclear-integrated CTL cases for the single owner/operator scenario and a 12% IRR.
-10
-5
0
5
10
15
20
25
30
35
40
$1.5 $2.0 $2.5 $3.0 $3.5 $4.0 $4.5
% I
RR
Diesel Price ($/gal)
HTGR CTL CTL CTL Sequestration
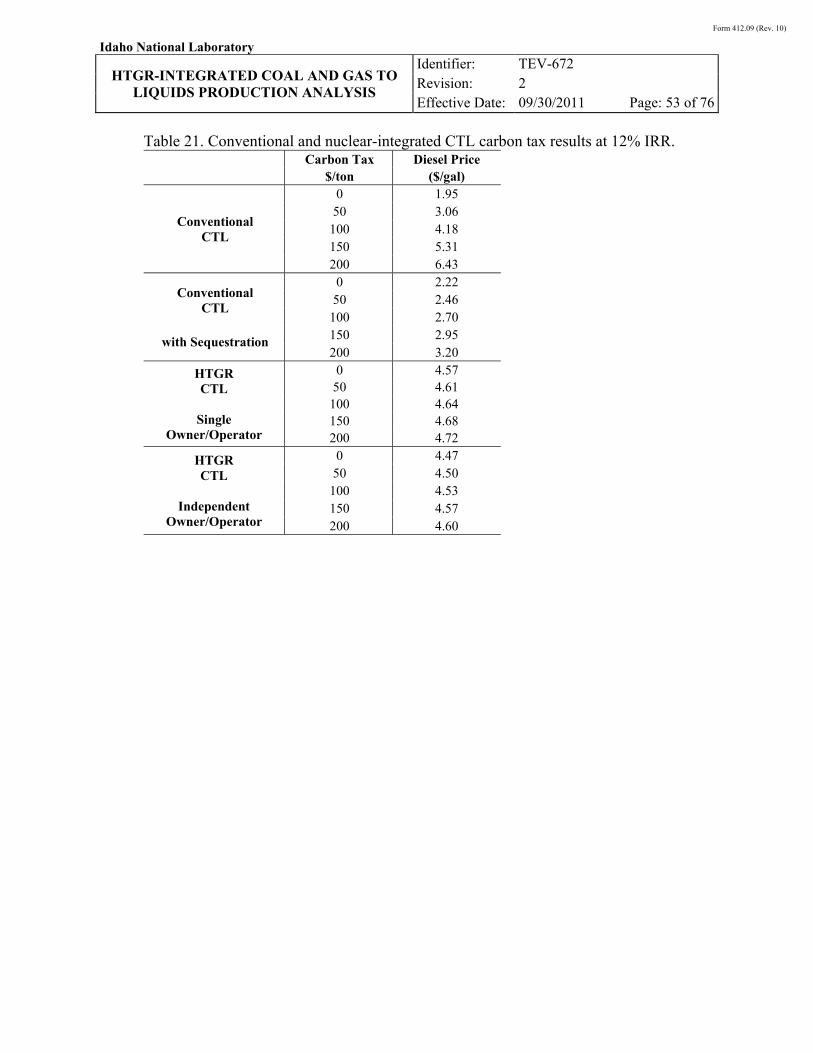
Form 412.09 (Rev. 10)
Idaho National Laboratory
HTGR-INTEGRATED COAL AND GAS TO
LIQUIDS PRODUCTION ANALYSIS
Identifier: Revision: Effective Date:
TEV-672
2
09/30/2011 Page: 53 of 76
Table 21. Conventional and nuclear-integrated CTL carbon tax results at 12% IRR. Carbon Tax Diesel Price
$/ton ($/gal)
Conventional CTL
0 1.95 50 3.06
100 4.18 150 5.31 200 6.43
Conventional CTL
with Sequestration
0 2.22 50 2.46
100 2.70 150 2.95 200 3.20
HTGR CTL
Single
Owner/Operator
0 4.57 50 4.61
100 4.64 150 4.68 200 4.72
HTGR CTL
Independent
Owner/Operator
0 4.47 50 4.50
100 4.53 150 4.57 200 4.60

Form 412.09 (Rev. 10)
Idaho National Laboratory
HTGR-INTEGRATED COAL AND GAS TO
LIQUIDS PRODUCTION ANALYSIS
Identifier: Revision: Effective Date:
TEV-672
2
09/30/2011 Page: 54 of 76
Figure 13. Conventional and nuclear-integrated CTL as a function of a carbon tax, 12% IRR, single owner/operator for the nuclear-integrated process.
The carbon tax results show that the nuclear-integrated CTL case outperforms the conventional case at a 12% IRR when the carbon tax is approximately $120/ton-CO2.
Table 22 presents the results for the conventional GTL case, presenting the IRR for selling diesel at low, average, and high product prices, and the diesel selling price required for a 12% IRR for low, average, and high natural gas purchase prices. The nuclear-integrated GTL results are presented in Table 23, for both the single and independent owner/operator scenarios. A value of “N/A” indicates that the manufacturing costs exceeded the revenues.
$0.00
$1.00
$2.00
$3.00
$4.00
$5.00
$6.00
$7.00
$0 $20 $40 $60 $80 $100 $120 $140 $160 $180 $200
Die
sel P
rice
-($
/gal
)
Carbon Tax ($/ton-CO2 emitted))
HTGR CTL CTL CTL Sequestration

Form 412.09 (Rev. 10)
Idaho National Laboratory
HTGR-INTEGRATED COAL AND GAS TO
LIQUIDS PRODUCTION ANALYSIS
Identifier: Revision: Effective Date:
TEV-672
2
09/30/2011 Page: 55 of 76
Table 22. Conventional GTL economic results.
TCI
% IRR Product Price
Conventional GTL Process
Low Natural Gas
Price ($4.50/MSCF)
$2,024,145,646 10.5 $1.54/gal 38.1 $2.80/gal 57.3 $4.06/gal 12.0 $1.59/gal
Conventional GTL Process
Average Natural Gas Price ($5.50/MSCF)
$2,024,145,646 2.1 $1.54/gal
33.3 $2.80/gal 53.5 $4.06/gal 12.0 $1.83/gal
Conventional GTL Process
High Natural Gas
Price ($12.00/MSCF)
$2,024,145,646 N/A $1.54/gal N/A $2.80/gal 25.8 $4.06/gal 12.0 $3.38/gal
Table 23. Nuclear-integrated GTL economic results.
TCI – no Sequestration TCI – with Sequestration % IRR Product Price % IRR Product Price
Low
Nat
ura
l Gas
Pri
ce (
$4.5
0/M
SCF
)
HTGR GTL Process
Single Owner/Operator
$3,156,187,410 $3,172,581,885 5.4 $1.54/gal 4.6 $1.54/gal
27.7 $2.80/gal 27.2 $2.80/gal 42.9 $4.06/gal 42.5 $4.06/gal 12.0 $1.82/gal 12.0 $1.85/gal
HTGR GTL Process
Independent Owner/Operator
Heat at Market
Price
$1,006,875,557 $1,006,875,557 1.9 $29.20/MWt-hr 1.9 $29.20/MWt-hr
$2,149,311,853 $2,165,706,328 6.4 $1.54/gal 5.4 $1.54/gal
35.2 $2.80/gal 34.6 $2.80/gal 54.9 $4.06/gal 54.4 $4.06/gal 12.0 $1.72/gal 12.0 $1.75/gal
HTGR GTL Process
Independent Owner/Operator
Heat/Power at
12% IRR
$1,006,875,557 $1,006,875,557 12.0 $49.41/MWt-hr 12.0 $49.41/MWt-hr
$2,149,311,853 $2,165,706,328 1.8 $1.54/gal 0.7 $1.54/gal
32.7 $2.80/gal 32.1 $2.80/gal 52.9 $4.06/gal 52.3 $4.06/gal 12.0 $1.84/gal 12.0 $1.87/gal
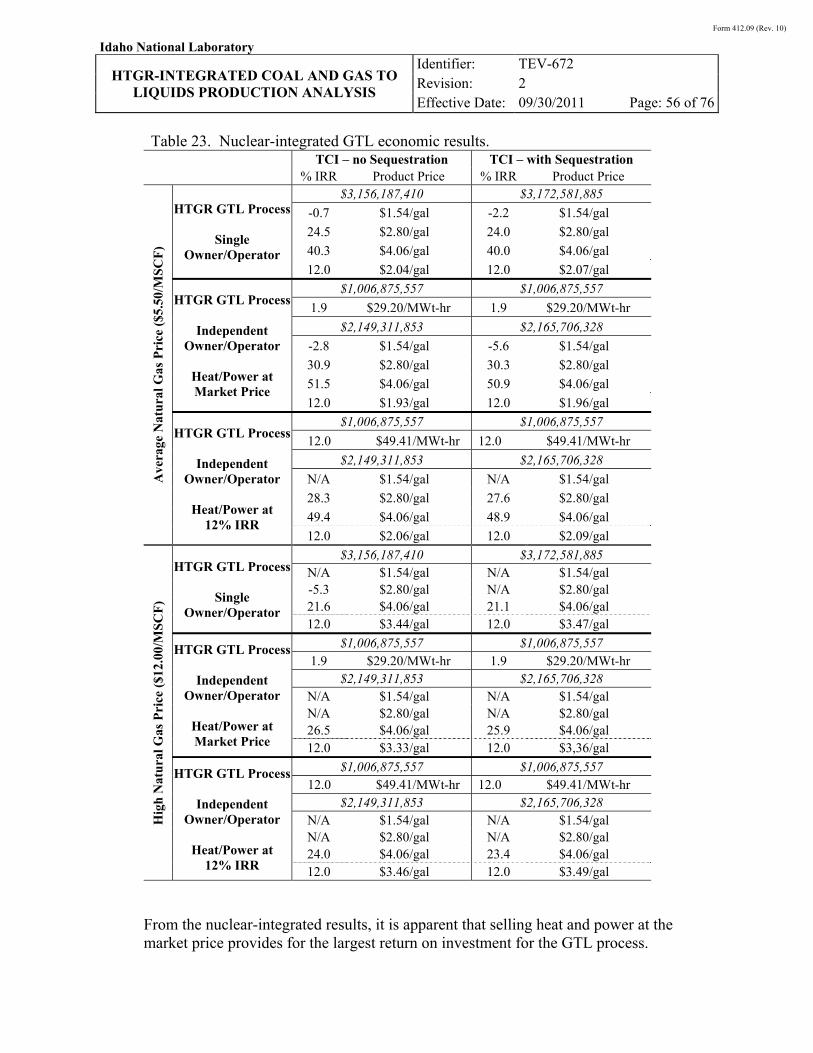
Form 412.09 (Rev. 10)
Idaho National Laboratory
HTGR-INTEGRATED COAL AND GAS TO
LIQUIDS PRODUCTION ANALYSIS
Identifier: Revision: Effective Date:
TEV-672
2
09/30/2011 Page: 56 of 76
Table 23. Nuclear-integrated GTL economic results. TCI – no Sequestration TCI – with Sequestration % IRR Product Price % IRR Product Price
Ave
rage
Nat
ura
l Gas
Pri
ce (
$5.5
0/M
SC
F)
HTGR GTL Process
Single Owner/Operator
$3,156,187,410 $3,172,581,885
-0.7 $1.54/gal -2.2 $1.54/gal
24.5 $2.80/gal 24.0 $2.80/gal
40.3 $4.06/gal 40.0 $4.06/gal
12.0 $2.04/gal 12.0 $2.07/gal
HTGR GTL Process
Independent Owner/Operator
Heat/Power at Market Price
$1,006,875,557 $1,006,875,557
1.9 $29.20/MWt-hr 1.9 $29.20/MWt-hr
$2,149,311,853 $2,165,706,328
-2.8 $1.54/gal -5.6 $1.54/gal
30.9 $2.80/gal 30.3 $2.80/gal
51.5 $4.06/gal 50.9 $4.06/gal
12.0 $1.93/gal 12.0 $1.96/gal
HTGR GTL Process
Independent Owner/Operator
Heat/Power at
12% IRR
$1,006,875,557 $1,006,875,557
12.0 $49.41/MWt-hr 12.0 $49.41/MWt-hr
$2,149,311,853 $2,165,706,328
N/A $1.54/gal N/A $1.54/gal
28.3 $2.80/gal 27.6 $2.80/gal
49.4 $4.06/gal 48.9 $4.06/gal
12.0 $2.06/gal 12.0 $2.09/gal
Hig
h N
atu
ral G
as P
rice
($1
2.00
/MS
CF
)
HTGR GTL Process
Single Owner/Operator
$3,156,187,410 $3,172,581,885 N/A $1.54/gal N/A $1.54/gal -5.3 $2.80/gal N/A $2.80/gal 21.6 $4.06/gal 21.1 $4.06/gal 12.0 $3.44/gal 12.0 $3.47/gal
HTGR GTL Process
Independent Owner/Operator
Heat/Power at Market Price
$1,006,875,557 $1,006,875,557 1.9 $29.20/MWt-hr 1.9 $29.20/MWt-hr
$2,149,311,853 $2,165,706,328 N/A $1.54/gal N/A $1.54/gal N/A $2.80/gal N/A $2.80/gal 26.5 $4.06/gal 25.9 $4.06/gal 12.0 $3.33/gal 12.0 $3,36/gal
HTGR GTL Process
Independent Owner/Operator
Heat/Power at
12% IRR
$1,006,875,557 $1,006,875,557 12.0 $49.41/MWt-hr 12.0 $49.41/MWt-hr
$2,149,311,853 $2,165,706,328 N/A $1.54/gal N/A $1.54/gal N/A $2.80/gal N/A $2.80/gal 24.0 $4.06/gal 23.4 $4.06/gal 12.0 $3.46/gal 12.0 $3.49/gal
From the nuclear-integrated results, it is apparent that selling heat and power at the market price provides for the largest return on investment for the GTL process.

Form 412.09 (Rev. 10)
Idaho National Laboratory
HTGR-INTEGRATED COAL AND GAS TO
LIQUIDS PRODUCTION ANALYSIS
Identifier: Revision: Effective Date:
TEV-672
2
09/30/2011 Page: 57 of 76
However, the HTGR only has a 2% IRR selling heat at the market price to the fossil process; therefore, this case will not be included in the results comparison. Considering the two remaining cases, it is economically beneficial to have a single owner operator for the GTL and HTGR facilities at an IRR of 12%; additionally, the single owner/operator scenario is more economical for a variety of diesel selling prices. As a result, the single owner operator scenario will be presented for the breakeven analyses. Figure 14 presents a graphical comparison of the diesel price versus the natural gas purchase price for the convention and nuclear-integrated GTL cases, the nuclear-integrated case presented is for the single owner/operator scenario. The results demonstrate that the nuclear-integrated GTL case, either with or without sequestration, requires a higher diesel selling price to achieve a 12% IRR than the conventional case, for natural gas prices less than approximately $14.00/MSCF.
Figure 14. Conventional and nuclear-integrated GTL, diesel price as a function of natural gas purchase price.
Table 24 presents the carbon tax results for the conventional and nuclear-integrated GTL cases, excluding the separate owner/operator scenario where heat and electricity are sold at the market price. Figure 15 depicts the carbon tax results for the conventional and nuclear-integrated CTL cases for the single owner/operator scenario and a 12% IRR.
$1.50
$2.00
$2.50
$3.00
$3.50
$4.00
$4.50
$4.5 $6.5 $8.5 $10.5 $12.5 $14.5
Die
sel P
rice
-($
/gal
)
Natural Gas Price ($/MSCF)
HTGR GTL HTGR GTL Seq. GTL

Form 412.09 (Rev. 10)
Idaho National Laboratory
HTGR-INTEGRATED COAL AND GAS TO
LIQUIDS PRODUCTION ANALYSIS
Identifier: Revision: Effective Date:
TEV-672
2
09/30/2011 Page: 58 of 76
Table 24. Conventional and nuclear-integrated GTL carbon tax results at 12% IRR.
Carbon Tax
$/ton
Low Natural Gas Price
Average Natural Gas Price
High Natural Gas Price
Diesel Price ($/gal)
Conventional GTL
0 1.59 1.83 3.38 50 1.79 2.02 3.58
100 1.99 2.23 3.78 150 2.20 2.43 3.98 200 2.40 2.64 4.18
HTGR GTL
Single
Owner/Operator
0 1.82 2.04 3.44 50 1.93 2.15 3.55
100 2.05 2.26 3.66 150 2.16 2.38 3.77 200 2.28 2.49 3.89
HTGR GTL
Independent
Owner/Operator
0 1.84 2.06 3.46 50 1.95 2.17 3.57
100 2.07 2.28 3.68 150 2.18 2.40 3.79 200 2.30 2.51 3.91
HTGR GTL with Sequestration
Single
Owner/Operator
0 1.85 2.07 3.47 50 1.87 2.09 3.49
100 1.90 2.11 3.51 150 1.92 2.13 3.53 200 1.94 2.16 3.56
HTGR GTL with Sequestration
Independent
Owner/Operator
0 1.87 2.09 3.49 50 1.89 2.11 3.51
100 1.92 2.13 3.53 150 1.94 2.15 3.55 200 1.96 2.18 3.58

Form 412.09 (Rev. 10)
Idaho National Laboratory
HTGR-INTEGRATED COAL AND GAS TO
LIQUIDS PRODUCTION ANALYSIS
Identifier: Revision: Effective Date:
TEV-672
2
09/30/2011 Page: 59 of 76
Figure 15. Conventional and nuclear-integrated GTL as a function of a carbon tax, 12% IRR, single owner/operator for the nuclear-integrated process, average natural gas price.
The carbon tax results show that the nuclear-integrated GTL case without sequestration outperforms the conventional case at a 12% IRR for an average natural gas purchase price when the carbon tax is approximately $120/ton-CO2. When sequestration is assumed for the nuclear-integrated GTL case, the required CO2 tax decreases to approximately $70/ton-CO2.
6. SENSITIVITY ANALYSIS
A sensitivity analysis was conducted for the nuclear-integrated CTL and GTL cases, for the single owner operator scenario only. The sensitivity analysis assesses the impact on the required product selling price for various changes in the baseline economic assumptions; the result of this sensitivity analysis is a tornado diagram. A tornado diagram is useful in comparing the relative importance of variables, where the sensitive variable is varied while all other variables are held at baseline values.
For the economic assumptions sensitivity analysis, the baseline economic assumptions were varied to determine the effect on the product selling price for the HTGR-integrated cases only. Table 25 lists the values used in the economic sensitivity analysis.
$1.70
$1.90
$2.10
$2.30
$2.50
$2.70
$0 $20 $40 $60 $80 $100 $120 $140 $160 $180 $200
Die
sel P
rice
-($
/gal
)
Carbon Tax ($/ton-CO2 emitted)
HTGR GTL HTGR GTL Seq. GTL

Form 412.09 (Rev. 10)
Idaho National Laboratory
HTGR-INTEGRATED COAL AND GAS TO
LIQUIDS PRODUCTION ANALYSIS
Identifier: Revision: Effective Date:
TEV-672
2
09/30/2011 Page: 60 of 76
Table 25. Lower, baseline, and upper values used in the economic sensitivity analysis. Lower Value Baseline Value Upper Value IRR (%) 10 12 15 Debt Ratio (%) 80 50 0 Debt Interest Rate (%)3 4.5 8 10 Loan Term (years) 20 15 10 Construction Period per HTGR (months) 24 36 60 HTGR Staffing Level Design Supplier INL Staffing4 Economic Recovery Period (years) 40 30 20 HTGR TCI -30% TCI +50% HTGR Refueling Period (months) 24 18 12 CO2 Tax $0/ton $50/ton Sequestration5 No Yes Natural Gas Price5 Low Average High
Again, the sensitivity analysis was only conducted for the single owner operator scenario. Table 26 summarizes the results of the sensitivity analysis listing the required product selling prices for the nuclear-integrated CTL case as well as the percent change in the product selling price versus the baseline case. The tornado plot is presented in Figure 16. Table 27 summarizes the results of the sensitivity analysis listing the required product selling prices for the nuclear-integrated GTL case as well as the percent change in the product selling price versus the baseline case. The tornado plot is presented in Figure 17.
3 The debt interest rate selected in the sensitivity analysis is also used for the interest on debt during construction. 4 The INL staffing level is outlined in TEV-1196. It assumes 595 employees for a four-pack facility versus the
design supplier estimate of 418 employees (INL 2011a). 5 Variation only assessed for the nuclear-integrated GTL case.
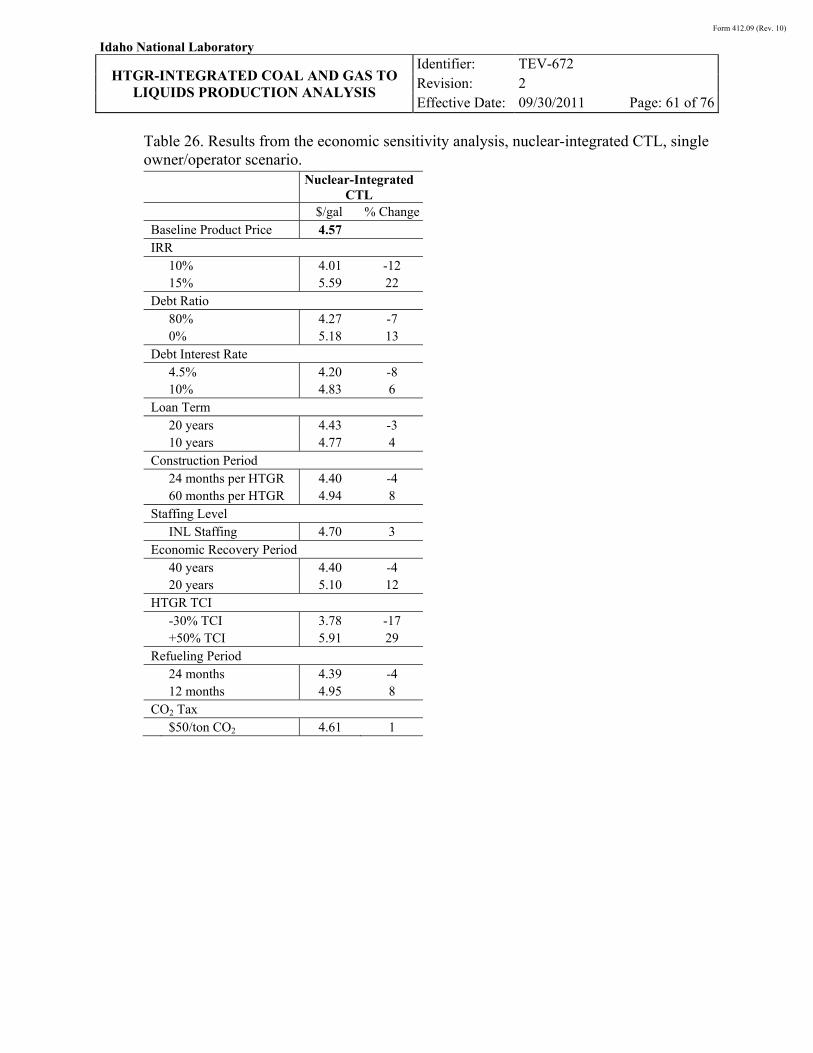
Form 412.09 (Rev. 10)
Idaho National Laboratory
HTGR-INTEGRATED COAL AND GAS TO
LIQUIDS PRODUCTION ANALYSIS
Identifier: Revision: Effective Date:
TEV-672
2
09/30/2011 Page: 61 of 76
Table 26. Results from the economic sensitivity analysis, nuclear-integrated CTL, single owner/operator scenario.
Nuclear-Integrated
CTL $/gal % ChangeBaseline Product Price 4.57 IRR 10% 4.01 -12 15% 5.59 22 Debt Ratio 80% 4.27 -7 0% 5.18 13 Debt Interest Rate 4.5% 4.20 -8 10% 4.83 6 Loan Term 20 years 4.43 -3 10 years 4.77 4 Construction Period 24 months per HTGR 4.40 -4 60 months per HTGR 4.94 8 Staffing Level INL Staffing 4.70 3 Economic Recovery Period 40 years 4.40 -4 20 years 5.10 12 HTGR TCI -30% TCI 3.78 -17 +50% TCI 5.91 29 Refueling Period 24 months 4.39 -4 12 months 4.95 8 CO2 Tax $50/ton CO2 4.61 1

Form 412.09 (Rev. 10)
Idaho National Laboratory
HTGR-INTEGRATED COAL AND GAS TO
LIQUIDS PRODUCTION ANALYSIS
Identifier: Revision: Effective Date:
TEV-672
2
09/30/2011 Page: 62 of 76
Figure 16. HTGR CTL sensitivity analysis.
From the economic sensitivity analysis, the uncertainty in the HTGR TCI (AACE Class 4) can have the largest impact on the required product selling price, followed by assumed IRR, the debt to equity ratio, and the assumed economic recovery period.
$4.43
$4.20
$4.40
$4.39
$4.40
$4.27
$4.01
$3.78
0.06
20 year Loan Term
4.5% Interest
24 month Construction Period
24 month Refueling Period
40 year Economic Recovery Period
80% Debt/20% Equity
10% IRR
-30% TCI
$4.61
$4.70
$4.77
$4.83
$4.94
$4.95
$5.10
$5.18
$5.59
$5.91
0 1 2
50 $/ton CO2
INL Staffing Plan
10 year Loan Term
10% Interest
60 month Construction Period
12 month Refueling Period
20 year Economic Recovery Period
0% Debt/100% Equity
15% IRR
+50% TCI
Product Selling Price ($/gal) - Baseline of $4.57 0 10 20 30 40 50
0 $/ton CO2
Vendor Staffing Plan
15 year Loan Term
8% Interest
36 month Construction Period
18 month Refueling Period
30 year Economic Recovery Period
50% Debt/50% Equity
12% IRR
TCI
Baseline Sensitivity Values

Form 412.09 (Rev. 10)
Idaho National Laboratory
HTGR-INTEGRATED COAL AND GAS TO
LIQUIDS PRODUCTION ANALYSIS
Identifier: Revision: Effective Date:
TEV-672
2
09/30/2011 Page: 63 of 76
Table 27. Results from the economic sensitivity analysis, nuclear-integrated GTL, single owner/operator scenario.
Nuclear-Integrated
GTL $/gal % ChangeBaseline Product Price 2.04 Natural Gas Price Low Natural Gas Price 1.81 -11 High Natural Gas Price 3.43 68 IRR 10% 1.93 -5 15% 2.19 7 Debt Ratio 80% 1.95 -4 0% 2.19 7 Debt Interest Rate 4.5% 1.98 -3 10% 2.06 1 Loan Term 20 years 2.00 -2 10 years 2.06 1 Construction Period 24 months per HTGR 2.02 -1 60 months per HTGR 2.04 0 Staffing Level INL Staffing 2.06 1 Economic Recovery Period 40 years 2.00 -2 20 years 2.11 3 HTGR TCI -30% TCI 1.97 -3 +50% TCI 2.12 4 Refueling Period 24 months 2.02 -1 12 months 2.05 0 CO2 Tax $50/ton CO2 2.14 5 Sequestration with CO2 Tax $50/ton CO2 with Seq. 2.09 2

Form 412.09 (Rev. 10)
Idaho National Laboratory
HTGR-INTEGRATED COAL AND GAS TO
LIQUIDS PRODUCTION ANALYSIS
Identifier: Revision: Effective Date:
TEV-672
2
09/30/2011 Page: 64 of 76
Figure 17. HTGR GTL sensitivity analysis.
From the economic sensitivity analysis, the natural gas purchase price can have the largest impact on the required product selling price, followed by assumed IRR, the debt to equity ratio, and a $50/ton CO2 tax.
7. GHG MODELING OVERVIEW
This section presents a full life-cycle inventory or well-to-wheel (WTW) analysis of greenhouse gas emissions for the production of synthetic diesel using the conventional and nuclear CTL and GTL processes described in the preceding sections. The WTW analysis conducted for this study was based on the formal methodology presented by NETL in the “Life-Cycle Greenhouse-Gas Emissions Inventory for Fischer-Tropsch Fuels,” and categorizes GHG emissions according to the following sources (NETL 2001):
1. Resource extraction
2. Transportation of the resources to the plant
3. Conversion and refining of the product
4. Transportation and distribution of the product
5. End use combustion of the product
$2.02
$2.02
$2.00
$1.98
$2.00
$1.97
$1.95
$1.93
$1.81
0.03 1.03 2.03
24 month Construction Period
24 month Refueling Period
20 year Loan Term
4.5% Interest
40 year Economic Recovery Period
Low TCI
80% Debt/20% Equity
10% IRR
Low Natural Gas Price
$2.04
$2.05
$2.06
$2.06
$2.06
$2.09
$2.11
$2.12
$2.14
$2.19
$2.19
$3.43
0 1 2
60 month Construction Period
12 month Refueling Period
10 year Loan Term
10% Interest
INL Staffing Plan
50 $/ton CO2 w/ Sequestration
20 year Economic Recovery Period
High TCI
50 $/ton CO2
0% Debt/100% Equity
15% IRR
High Natural Gas Price
Product Selling Price ($/gal) - Baseline of $2.04 0 10 20 30 40 50
36 month Construction Period
18 month Refueling Period
15 year Loan Term
8% Interest
Vendor Staffing Plan
No Sequestration
30 year Economic Recovery Period
TCI
0 $/ton CO2
50% Debt/50% Equity
12% IRR
Average Natural Gas Price
Baseline Sensitivity Values

Form 412.09 (Rev. 10)
Idaho National Laboratory
HTGR-INTEGRATED COAL AND GAS TO
LIQUIDS PRODUCTION ANALYSIS
Identifier: Revision: Effective Date:
TEV-672
2
09/30/2011 Page: 65 of 76
Results from the WTW analysis for FT diesel were compared to WTW emissions for the U.S. baseline and average imported WTW emissions for conventional diesel fuel to determine the environmental impact of the synthetic fuels in comparison to standard petroleum fuels. The U.S. baseline and average imported WTW emissions for diesel were derived from a 2009 NETL refinery report (NETL 2009).
7.1 GHG Methodology
The following sections outline the methodology used for calculating GHG emissions for the conventional and nuclear CTL and GTL cases analyzed. For this study, all results are scaled for the diesel, naphtha, LPG, and/or electricity products. This is accomplished by ratioing the lower heating values of the products along with the electricity, if produced in the plant, to determine the emissions assignment, or the percentage of the total energy content for the diesel, naphtha, LPG, and/or electricity product. LPG, naphtha, and diesel all have similar heating values on a mass basis; thus, including the LPG and naphtha with the diesel product has no appreciable impact on overall WTW emissions. The emissions for the diesel product are converted to a gram per mile basis using a vehicle fuel economy of 25.8 miles per gallon. The fuel economy was adjusted to account for the heating value of the synthetic fuel versus traditional petroleum derived products (SAE 1999). The vehicle fuel economy represents the average mileage of a diesel powered SUV.
The GHG emissions considered in this report include carbon dioxide (CO2), methane (CH4), and nitrous oxide (N2O). Emissions for CH4 and N2O are converted into CO2 equivalents using their global warming potentials (GWP). CO2 equivalents are the amount of carbon dioxide by weight emitted into the atmosphere that would produce the same radiative force as a given weight of another radiatively active gas. The GWPs used in this report are referenced from the Intergovernmental Panel on Climate Change’s (IPCC) climate study in 2006. The 100-year GWP for CH4 and N2O are 23 and 296, respectively (IPCC 2006).
7.2 Resource Extraction and Production
GHG emissions for resource extraction are calculated for the two feeds considered in this study, coal and natural gas. Coal extraction emissions include emissions from fuel usage associated with coal mining and coal bed methane. Natural gas production emissions include emissions associated with natural gas extraction, natural gas processing, and natural gas transport from the wellhead to the processing facility. Natural gas production emissions include all vents and leaks from the wellhead through the processing phase.

Form 412.09 (Rev. 10)
Idaho National Laboratory
HTGR-INTEGRATED COAL AND GAS TO
LIQUIDS PRODUCTION ANALYSIS
Identifier: Revision: Effective Date:
TEV-672
2
09/30/2011 Page: 66 of 76
7.2.1 Coal Extraction
The CTL plant is intended to operate using Illinois #6 bituminous coal. The majority of this coal will be mined in the state of Illinois. According to the Energy Information Administration in 2007 approximately 82% of the coal mined in Illinois was mined using underground mining methods, the remainder was surface mined (EIA 2009). Fuel usage per ton of coal mined for both surface and underground mining were calculated based on the most recent U.S. Census data available, either 2002 or 1997 depending upon data released to the public. Based on this census data, power, coal, diesel, residual fuel oil, natural gas, and gasoline usage for mining activities were calculated. The associated CO2 emissions were calculated based on the lower heating values (LHV) and carbon contents of the various fuel types, for power the emissions for the average U.S. energy mixed were assumed. Emissions for CH4 and N2O were calculated assuming either mobile or stationary combustion emission factors from the 2006 IPCC report (IPCC 2006). Emissions for mining support activities were calculated in a similar fashion. Finally, coal bed methane emissions are calculated for the methane released during Illinois mining operations based on the 2009 EPA report, Inventory of U.S. Greenhouse Gas Emissions and Sinks (U.S. EPA 2009).
7.2.2 Natural Gas Production
Methane and non-combustion CO2 emissions from natural gas systems are generally process related, with normal operations, routine maintenance, and system upsets being the primary contributors. Emissions from normal operations include: natural gas engines and turbine uncombusted exhaust, bleed and discharge emissions from pneumatic devices, and fugitive emissions from system components. Routine maintenance emissions originate from pipelines, equipment, and wells during repair and maintenance activities. Pressure surge relief systems and accidents can lead to system upset emissions. The total CO2 equivalent emissions were calculated for 2007 in the 2009 EPA report, “Inventory of U.S. Greenhouse Gas Emissions and Sinks” (U.S. EPA 2009). To determine the CO2 equivalent emissions per MMSCF of natural gas utilized, the equivalent emissions were divided by the amount of natural gas processed in 2007, which is available from the EIA website (EIA 2010).
7.3 Transportation and Distribution
All scenarios considered in this study include transportation of resources and products over large distances. The mode of transportation depends upon the

Form 412.09 (Rev. 10)
Idaho National Laboratory
HTGR-INTEGRATED COAL AND GAS TO
LIQUIDS PRODUCTION ANALYSIS
Identifier: Revision: Effective Date:
TEV-672
2
09/30/2011 Page: 67 of 76
location and destination of the products as well as the type of product being transported. For instance, dry materials being transported short distances would utilize trucks as the main mode of transportation, while dry materials being transported long distances would take advantage of rail transportation. Table 28 lists the distances and modes of transportation assumed for the various resources and products.
Table 28. Transportation information for resources and products.
Product Transported Miles
Transported Mode of
Transport Petroleum Products to Mine 50 Rail Natural Gas to Mine 50 Pipeline Natural Gas to GTL Plant 50 Pipeline Coal to CTL Plant 100 Rail Petroleum Products to CTL/MTG Plant 50 Rail CO2 to Sequestration Area 50 Pipeline Diesel – Plant to Distribution Point 200 Pipeline Diesel – Distribution Point to Pump 200 Truck
The modes of transportation were assumed based on the amount of product being transported, the product state, the distance transported, and the available transportation methods. The emissions associated with the various transportation methods include the combustion of fuel necessary for the transportation (or electricity use) as well as the upstream emissions associated with producing the fuel or electricity. Fuel use per mode of transportation was developed based on information provided by the U.S. EPA “Inventory of U.S. Greenhouse Gas Emissions and Sinks” (U.S. EPA 2009), the Transportation Energy Databook (Davis 2009), and the “Freight in America” report (U.S. DOT 2006).
7.4 Conversion and Refining
GHG emissions are generated from several sources within the conventional and nuclear-integrated CTL and GTL plants, including: emissions from importing power, emissions associated with nuclear power use, upstream emissions associated with methanol use, emissions from coal milling and drying, SMR emissions, Rectisol plant emissions, HRSG stack emissions, fired heater emissions, high pressure (HP) and low pressure (LP) flare systems, and fugitive emissions. Fugitive emissions are emissions from leaking equipment, such as valves and pumps, storage tanks, and wastewater treatment facilities. Emissions for the HP and LP flare systems were assumed based on generalized plant startup parameters and fugitive emissions were calculated based on recommendations from the 2006 IPCC guidelines (IPCC 2006). All other emissions were taken from the Aspen modeling results. Emissions were calculated for CH4 and N2O for all sources based on IPCC emission factors for CH4 and N2O.

Form 412.09 (Rev. 10)
Idaho National Laboratory
HTGR-INTEGRATED COAL AND GAS TO
LIQUIDS PRODUCTION ANALYSIS
Identifier: Revision: Effective Date:
TEV-672
2
09/30/2011 Page: 68 of 76
7.5 End Use Combustion
Emissions for the end use combustion of the fuel were estimated from the carbon content of the synthetic diesel. It was assumed that all carbon present in the fuel is completely combusted to form CO2. Based on the fuel density, this would provide the emissions of CO2 per barrel of fuel. Again, emissions for CH4 and N2O were added based on IPCC guidelines for mobile combustion sources.
8. GREENHOUSE GAS MODELING RESULTS
A summary of the GHG results for the cases analyzed is presented in Table 29 for conventional and nuclear CTL diesel and Table 30 for conventional and nuclear GTL diesel. GHG emissions results are presented on a gram CO2 equivalent per barrel of diesel fuel (g CO2-eq/bbl) basis, a gram CO2 equivalent per LHV (g CO2-eq/MMBTU), and a gram CO2 equivalent per mile (g CO2-eq/mile). GHG emissions results are presented in Figure 18 for the CTL diesel cases and Figure 19 for GTL cases.
Table 29. CTL fuels GHG case study results.
CTL CTL w/
Seq HTGR CTL
Baseline Diesel
Imported Diesel
gCO2-eq/bbl diesel Extraction and Production 41,786 42,167 15,729 35,894 45,683 Transportation to Plant 1,493 1,507 562 7,070 9,245 Conversion and Refining 696,731 159,355 64,372 51,666 57,104 Transportation to Pump 4,359 5,953 4,360 4,895 4,351 End Use Combustion 360,375 360,375 360,375 439,910 439,910 Total Fuel Chain 1,104,744 569,357 445,398 539,434 556,293 gCO2-eq/MMBTU diesel Extraction and Production 8,652 8,730 3,256 6,600 8,400 Transportation to Plant 309 312 116 1,300 1,700 Conversion and Refining 144,255 32,994 13,325 9,500 10,500 Transportation to Pump 902 1,233 903 900 800 End Use Combustion 74,614 74,614 74,599 80,888 80,888 Total Fuel Chain 228,732 117,883 92,199 99,188 102,288 gCO2-eq/mile Extraction and Production 43 44 16 33 42 Transportation to Plant 2 2 1 7 9 Conversion and Refining 724 166 67 48 53 Transportation to Pump 5 6 5 5 4 End Use Combustion 375 375 375 406 406 Total Fuel Chain 1,149 592 463 498 513

Form 412.09 (Rev. 10)
Idaho National Laboratory
HTGR-INTEGRATED COAL AND GAS TO
LIQUIDS PRODUCTION ANALYSIS
Identifier: Revision: Effective Date:
TEV-672
2
09/30/2011 Page: 69 of 76
Table 30. GTL fuels GHG case study results.
GTL HTGR GTL
HTGR GTL w/ Seq.
Baseline Diesel
Imported Diesel
gCO2-eq/bbl diesel Extraction and Production 74,879 67,470 67,750 35,894 45,683 Transportation to Plant 39 35 35 7,070 9,245 Conversion and Refining 136,467 79,572 31,221 51,666 57,104 Transportation to Pump 4,365 4,365 4,547 4,895 4,351 End Use Combustion 360,375 360,375 360,375 439,910 439,910 Total Fuel Chain 576,124 511,816 463,927 539,434 556,293 gCO2-eq/MMBTU diesel Extraction and Production 15,483 13,950 14,008 6,600 8,400 Transportation to Plant 8 7 7 1,300 1,700 Conversion and Refining 28,219 16,452 6,455 9,500 10,500 Transportation to Pump 903 903 940 900 800 End Use Combustion 74,518 74,512 74,512 80,888 80,888 Total Fuel Chain 119,130 105,824 95,922 99,188 102,288 gCO2-eq/mile Extraction and Production 78 70 70 33 42 Transportation to Plant 0 0 0 7 9 Conversion and Refining 142 83 32 48 53 Transportation to Pump 5 5 5 5 4 End Use Combustion 375 375 375 406 406 Total Fuel Chain 599 532 482 498 513
Figure 18. CTL fuels WTW GHG results.
0
200
400
600
800
1,000
1,200
CTL CTL w/ Seq HTGR CTL
g C
O2-e
q/m
ile
Imported Baseline

Form 412.09 (Rev. 10)
Idaho National Laboratory
HTGR-INTEGRATED COAL AND GAS TO
LIQUIDS PRODUCTION ANALYSIS
Identifier: Revision: Effective Date:
TEV-672
2
09/30/2011 Page: 70 of 76
Figure 19. GTL fuels WTW GHG results.
From the results presented in the tables and figures above, integration of an HTGR into CTL and GTL processes can reduce WTW GHG emissions to levels below imported and/or baseline conventional diesel. Conventional CTL WTW emissions are significantly higher than conventional diesel, even with incorporation of sequestration. Nuclear integration into the CTL process reduces WTW GHG below conventional diesel without CO2 sequestration.
Incorporation of an HTGR with a GTL process reduces WTW GHG emissions when compared to the conventional case; however, they are still slightly higher than baseline and imported diesel. In order to reduce emissions below conventional fuels the pure CO2 stream produced in the CO2 removal process in the reforming section must be sequestered.
9. CTL CONCLUSIONS
Results from the nuclear-integrated CTL case indicate that integration of nuclear hydrogen can drastically improve carbon utilization and reduce GHG emissions:
Coal consumption is decreased by 65% using an HTGR and high temperature steam electrolysis as the hydrogen source.
Integrating nuclear power and HTSE decreases CO2 emissions from the plant:
If carbon capture and sequestration are assumed for the conventional configuration, CO2 emissions decrease by 83% when electrolysis and nuclear power are utilized.
0
100
200
300
400
500
600
GTL HTGR GTL HTGR GTL w/ Seq
g C
O2-e
q/m
ile
Imported Baseline

Form 412.09 (Rev. 10)
Idaho National Laboratory
HTGR-INTEGRATED COAL AND GAS TO
LIQUIDS PRODUCTION ANALYSIS
Identifier: Revision: Effective Date:
TEV-672
2
09/30/2011 Page: 71 of 76
If carbon capture and sequestration are not assumed for the conventional configuration, CO2 emissions decrease by 96% when electrolysis and nuclear power are utilized.
It is estimated that one 664 MWt 850°C ROT HTGR for heat production and nine 604 MWt 700°C ROT HTGRs for power production would be required to support production of 50,000 bbl/day of liquid fuel products.
Economically, the incorporation of 10 HTGRs and the associated HTSEs significantly impacts the expected return on investment, when compared to conventional CTL with or without sequestration:
The required selling price of diesel to achieve a 12% IRR for the nuclear-integrated case is more than two times the selling price required for the conventional CTL case, with or without sequestration.
In a carbon constrained scenario where CO2 emissions are taxed and sequestration is not an option, a CO2 tax of $120/ton CO2 equates the economics of the nuclear-integrated CTL case with the conventional CTL case.
From the economic sensitivity analysis, the uncertainty in the HTGR TCI can have the largest impact on the required product selling price, followed by assumed IRR, the debt to equity ratio, and the assumed economic recovery period.
Integration of the HTGR reduces WTW GHG emissions to levels below imported and/or baseline conventional diesel:
Conventional CTL WTW emissions are significantly higher than conventional diesel and even with incorporation of sequestration emissions are greater than conventional fuels.
Nuclear-integration is an option where WTW GHG emissions of coal based synthetic fuels are lower than conventional fuels without CO2 sequestration.
If there is policy enacted which legislates that synthetically produced diesel fuels must meet or beat current fuel WTW GHG emissions; HTGR incorporation provides a solution with less risk than options which employ CO2 sequestration.
10. GTL CONCLUSIONS
Results for the nuclear-integrated natural gas to liquids case look promising:
Approximately one 450 MWt 700°C ROT HTGR would be required to support this configuration.

Form 412.09 (Rev. 10)
Idaho National Laboratory
HTGR-INTEGRATED COAL AND GAS TO
LIQUIDS PRODUCTION ANALYSIS
Identifier: Revision: Effective Date:
TEV-672
2
09/30/2011 Page: 72 of 76
The reactor would supply only heat to the fossil process, as more power is generated in the process than is required.
By substituting nuclear heat for gas combustion for preheating in the reforming and refining areas, natural gas consumption is decreased by 9%.
Incorporating an HTGR into the GTL process decrease CO2 emissions by 42% when sequestration is not assumed and by 88% if the pure CO2 stream is sequestered.
Economically, the nuclear-integrated GTL option provides economic stability with respect to fluctuations in natural gas prices:
Though the IRR is slightly lower at higher diesel selling prices, it is still significantly above 12%, indicating a sizable return on investment.
The nuclear-integrated case requires a higher diesel selling price to achieve a 12% IRR than the conventional case, for natural gas prices less than approximately $14.00/MSCF.
In a carbon constrained scenario where CO2 emissions are taxed and sequestration is not an option, a CO2 tax of $120/ton CO2 equates the economics of the nuclear-integrated GTL case with the conventional GTL case. When CO2 is sequestered for the nuclear-integrated GTL case, the necessary CO2 tax decreases to $70/ton.
From the economic sensitivity analysis, the natural gas purchase price can have the largest impact on the required product selling price, followed by assumed IRR, the debt to equity ratio, and a $50/ton CO2 tax.
Integration of the HTGR reduces WTW GHG emissions when compared to the conventional case:
Conventional GTL WTW emissions are slightly higher than conventional diesel.
It would be possible reduce nuclear-integrated GTL emissions below conventional fuels with sequestration of the pure CO2 stream produced in the propylene carbonate process in the reforming section.

Form 412.09 (Rev. 10)
Idaho National Laboratory
HTGR-INTEGRATED COAL AND GAS TO
LIQUIDS PRODUCTION ANALYSIS
Identifier: Revision: Effective Date:
TEV-672
2
09/30/2011 Page: 73 of 76
11. FUTURE WORK AND RECOMMENDATIONS
As the design of the HTGR progresses towards finalization, this TEV should be updated if the design of the HTGR is changed significantly or if additional refinements of the capital, O&M, fuel, and decommissioning costs become available.
The costs utilized in this study were developed for the prismatic block reactor configuration. Costs for the pebble bed reactor configuration will be included in a future revision of the TEV, when TEV-1196 is updated; however, the capital costs are roughly equivalent and the difference does not affect the overall accuracy of the estimates for both prismatic and pebble bed configurations (INL 2011a).
The capital and operating costs for the CTL and GTL process are based on scaled estimates. If costs come down significantly in the near term or if refined costs become available, this TEV should be updated.
12. REFERENCES
AACE, 2005, Cost Estimate Classification System – As Applied in Engineering, Procurement, and Construction for the Process Industries, AACE International Recommended Practice No. 18R-97.
Aspen Plus, Version 7.3, Burlington, Massachusetts: Aspen Tech, 2011.
BRE, 2008, A Comparison of Physical Solvents for Acid Gas Removal.
Cover, E., D. A. Hubbar, S. K. Jain, and K. V. Shah, 1986, Advanced Coal Gasificatio Technical Analyses, DOE Report.
Davis, Stacy C., Susan W. Diegel, and G. Boundy Robert, 2009, Tansportation Energy Data Book (Edition 2), ORNL-6984.
Demick, Larry, 2011, HTGR Cost Information, personal communications.
Dry, Mark E, 2001, "High Quality Diesel via the Fischer-Tropsch Process - A Review," Journal of Chemical Technology & Biotechnology, Vol. 77, pp. 43-50.
EIA, 2011a, U.S. No 2 Diesel Low Sulfur 15-500 ppm Retail Sales by Refiners, http://www.eia.gov/dnav/pet/hist/LeafHandler.ashx?n=PET&s=EMA_EPD2DM10_PTG_NUS_DPG&f=M, July 1, 2011, July 19, 2011.
EIA, 2011b, Average Retail Price of Electricity to Ultimate Customers: Total by End-Use Sector, http://www.eia.doe.gov/cneaf/electricity/epm/table5_3.html, April 14, 2011, April 29, 2011.

Form 412.09 (Rev. 10)
Idaho National Laboratory
HTGR-INTEGRATED COAL AND GAS TO
LIQUIDS PRODUCTION ANALYSIS
Identifier: Revision: Effective Date:
TEV-672
2
09/30/2011 Page: 74 of 76
EIA, 2011c, Monthly United States Natural Gas Industrial Price, http://www.eia.gov/dnav/ng/hist/n3035us3m.htm, June 29, 2011, July 6, 2011.
EIA, 2010, Natural Gas Gross Withdrawals and Production, http://tonto.eia.doe.gov/dnav/ng/ng_prod_sum_dcu_NUS_a.htm (accessed March 15, 2009), September 18, 2009, April 16, 2010.
EIA, 2009, Coal Production and Number of Mines by State and Mine Type, http://www.eia.doe.gov/cneaf/coal/page/acr/table1.html, September 18, 2009, March 1, 2010.
Excel 2007, Version 12.0, Redmond, Washington: Microsoft Corporation, 2007.
GIF, 2007, Cost Estimating Guidelines for Generaiton IV Nuclear Energy Systems, GIF/EMWG/2007/004, Rev. 4.2.
INL, 2011a, “Assessment of High Temperature Gas-Cooled (HTGR) Capital and Operating Costs,” Idaho National Laboratory, TEV-1196, Rev. 0, April 29, 2011.
INL, 2011b, “An Analysis of Fluids for the Transport of Heat with HTGR-Integrated Steam Assisted Gravity Drainage,” Idaho National Laboratory, TEV-1351, DRAFT.
INL, 2011c, “Sensitivity of HTGR Heat and Power Production to Reactor Outlet Temperature, Economic Analysis,” Idaho National Laboratory, TEV-988, Rev. 1, June 30, 2011.
INL, 2010, “An Analysis of the Effect of Reactor Outlet Temperature of a High Temperature Reactor on Electric Power Generation, Hydrogen Production, and Process Heat,” Idaho National Laboratory, TEV-981, Rev. 0, September 14, 2010.
IPCC, 2006, 2006 IPCC Guidelines for National Greenhouse Gas Inventories, IPCC National Greenhouse Gas Inventories Programme.
Jones, David S. J., and Peter R. Rujado, 2006, Handbook of Petroleum Processing, Dordrecht: Springer.
Kohl, Arthur L., and Richard B. Nielsen, 1997, Gas Purificatin (5th Edition), Houston: Elsevier.
Leeper, C. Stephen A, 1981, Wet Cooling Towers: 'Rule-of-Thumb' Design and Simulation, EGG-GTH-5775.
Linde, 2008, Cryogenic Air Separation History and Technological Process, Product Brochure.

Form 412.09 (Rev. 10)
Idaho National Laboratory
HTGR-INTEGRATED COAL AND GAS TO
LIQUIDS PRODUCTION ANALYSIS
Identifier: Revision: Effective Date:
TEV-672
2
09/30/2011 Page: 75 of 76
Lurgi, 2006, The Rectisol Process Lurgi's Leading Technology for Purification and Conditioning of Synthesis Gas, Product Brochure.
Mullinger, Peter and Barrie Jenkins, 2008, Industrial and Process Furnaces, Oxford: Butterworth-Hienemann.
NETL, 2009, An Evaluation of the Extraction, Tansport and Refining of Imported Crude Oils and the Impact of Life Cycle Greenhouse Gas Emissions, DOE/NETL-2009/1362.
NETL, 2007, Cost and Performance Baseline for Fossil Energy Plants, DOE/NETL-2007/1281.
NETL, 2001, Life-Cycle Greenhouse-Gas Emissions Inventory for Fischer-Tropsch Fuels.
NETL, 2000, Shell Gasifier IGCC Base Cases. PED-IGCC-98-002.
NRC, 2010, Report of Waste Burial Charges: Changes in Decommissioning Waste Disposal Costs at Low-Level Waste Burial Facilities, NUREG-1307, Rev. 14.
Parkash, Surinder, 2003, Refining Processes Handbook, Amsterdam: Elsevier.
Pedersen, Peter, 2009, Steam Reforming Information, Personal Communication with Anastasia Gribik.
Perry, Robert H., and Don W. Green, 2008, Perry's Chemical Engineers' Handbook (8th Edition), New York: McGraw Hill.
Peters, Max S., and Klaus D. Timmerhaus, 2002, Plant Design and Economics for Chemical Engineers (5th Edition), New York: McGraw Hill.
SAE, 1999, Emissions from Buses with DDC 6V92 Engines Using Synthetic Diesel Fuel, 199-01-1512.
Shell, 2005 "Shell Coal Gasification Process Using Low Rank Coal," Gasification Technologies Conference,San Francisco, CA, October 2005.
Shell, 2004, "The Shell Coal Gasification Process for the U.S. Industry," Gasification Technologies Conference, Washington D.C.,October, 2004.
Sullivan, William G., Elin M. Wicks, and James T. Luxhoj, 2003, Engineering Economy. Upper Saddle River: Printice Hall.
Thermoflow Suite, Version 19, Sudbury, Massachusetts: Thermoflow, 2009.

Form 412.09 (Rev. 10)
Idaho National Laboratory
HTGR-INTEGRATED COAL AND GAS TO
LIQUIDS PRODUCTION ANALYSIS
Identifier: Revision: Effective Date:
TEV-672
2
09/30/2011 Page: 76 of 76
U.S. DOT, 2006 Freight in America - A New National Picture, Bureau of Trasportation Statistics.
U.S. EPA, 2009, Inventory of U.S. Greenhouse Gas Emissions and Sinks.
WorleyParsons, 2002, "Cost Effective Options to Expand SRU Capacity Using Oxygen," Sulfur Recovery Symposium, Banff, Alberta, Canada, May 6 – 10, 2002.
13. APPENDIXES
Appendix A, Detailed Modeling Results and Flowsheets
Appendix B, [Electronic] CTL Baseline Stream Results.xlsx
Appendix C, [Electronic] CTL HTGR Stream Results.xlsx
Appendix D, [Electronic] GTL Baseline Stream Results.xlsx
Appendix E, [Electronic] GTL HTGR Stream Results.xlsx

Form 412.09 (Rev. 10)
Idaho National Laboratory
HTGR-INTEGRATED COAL AND GAS TO
LIQUIDS PRODUCTION ANALYSIS
Identifier: Revision: Effective Date:
TEV-672
2
09/30/2011 Page: A-1
Appendix A Detailed Modeling Results and Flowsheets

Conventional CTL Nuclear Integration CTL Conventional GTL Nuclear Integration
GTLInputs Coal Feed rate (ton/day) 26,941 9,354 N/A N/A Natural Gas Feed Rate (MMSCFD)1 N/A N/A 427 390 % Carbon to Liquid Product 31.8% 91.7% 71.9% 79.3% # HTGRs (600 MWt) N/A 10.17 N/A 0.75 Outputs
Total Liquid Products (bbl/day)t 50,002 50,002 49,994 49,998 Diesel 35,587 35,194 34,581 35,410 Naphtha 12,259 11,810 11,892 11,674 LPG 2,156 2,998 3,521 2,914
Utility Summary Total Power (MW) 220.3 -2,347.8 66.6 69.7
Power Consumed -739.7 -2,749.4 -330.1 -402.3 Electrolyzers N/A -2,511.8 N/A N/A Secondary Helium Circulator N/A -23.0 N/A -48.4 ASU -301.3 N/A -132.7 -131.3 Coal Milling and Drying -13.8 -9.5 N/A N/A Natural Gas Reforming N/A N/A -68.0 -68.9 Gasification and Gas Cleanup -174.7 -82.1 N/A N/A CO2 Compression/Liquefaction -140.8 -19.6 N/A -11.7 Fischer Tropsch & Refining Processes -40.9 -45.7 -53.8 -60.3
Refrigeration -24.0 -26.2 -41.5 -47.1 Cooling Tower -26.6 -18.5 -18.8 -20.8 Water Treatment -17.6 -13.0 -15.4 -13.9
Power Generated 960.0 401.7 396.7 471.9 Gas Turbine 300.0 N/A N/A N/A Condensing Turbines 178.6 N/A N/A N/A
Saturated Turbines 481.4 401.7 396.7 471.9 Water Requirements2
Water Consumed (gpm) 20,856 15,454 13,790 14,552 Water Consumed/lb Feed (lb/lb) 4.65 9.92 8.55 9.86 Water Consumed/bbl Product (bbl/bbl) 14.3 10.6 9.5 10.0
���

Conventional CTL Nuclear Integration CTL Conventional GTL Nuclear Integration
GTLCO2 Summary
Total CO2 Produced (ton/day) 40,046 1,473 7,164 4,190 Emitted 8,803 1,473 7,164 841 Capturable 31,243 N/A N/A 3,349
Nuclear Integration Summary Electricity (MW) N/A -2,643.0 N/A -13.9
HTSE N/A -2,511.8 N/A N/A HTGR House Loads N/A -295.2 N/A -13.9 Balance of Fossil Plant N/A 164.0 N/A N/A
Electrolysis Heat (MMBTU/hr) N/A 2408.7 N/A N/A From Nuclear Plant N/A 2330.2 N/A N/A From Secondary Circulator N/A 78.5 N/A N/A
Electrolysis Products Total Hydrogen (ton/day) N/A 1,957 N/A N/A Total Oxygen (ton/day) N/A 15,430 N/A N/A Used in Plant (ton/day) N/A 9,198 N/A N/A Excess (ton/day) N/A 6,232 N/A N/A
HTGR Heat Use (MMBTU/hr) N/A N/A N/A 1,633 Reformer N/A N/A N/A 1,057 Refinery N/A N/A N/A 741 From Secondary Circulator N/A N/A N/A -165
1Standard temperature of 60 degrees F. 2Does not include water usage for HTGR.
���

D
C
B
A
4 3 2 1
D
C
B
A
4 3 2 1
CTL and GTL Modeling Summary Comparison
SHEET 1 OF 1
REV
2
DWG NO
CTL-GTL-SUM-1
Date
Sep. 30, 2011
PREPARED BY A. Gandrik
SIZE
LTR
TYPE Summary Diagram
Traditional Coalto Liquids Process with
CO2 Capture
Coal26,940 ton/day
Water20,856 gpm
CO2 Emitted8,803 ton/day
Capturable CO231,243 ton/day
Electricity Produced220 MWe
Products Produced50,002 bbl/day Liquids
35,587 Diesel12,259 Naphtha
2,156 LPG
Nuclear AssistedCoal to Liquids Process
utilizing HighTemperature Electrolysisfor Hydrogen Production
6,104 MWt HTGR1 – 664 MWt 850°C – Heat
9 – 604 MWt 700°C –Power
Coal9,354 ton/day
Water15,454 gpm
CO2 Emitted1,473 ton/dayNuclear Electricity
2,348 MWe
Products Produced50,002 bbl/day Liquids
35,194 Diesel11,810 Naphtha
2,998 LPG
Nuclear Heat683 MWt
Conventional Gasto Liquids Process with
Recycle
Natural Gas9,690 ton/day427 MMSCFD
Water13,790 gpm
CO2 Emitted7,619 ton/day
Electricity Produced67 MWe
Products Produced49,994 bbl/day Liquids
34,581 Diesel11,892 Naphtha
3,521 LPG
Nuclear AssistedGas to Liquids Process
with Recycle
449 MWt HTGR1 – 449 MWt 700°C – Heat
Natural Gas8,862 ton/day390 MMSCFD
Water14,552 gpm
CO2 Emitted841 ton/day
Products Produced49,998 bbl/day Liquids
35,410 Diesel11,674 Naphtha
2,914 LPG
Nuclear Heat479 MWt Electricity Produced
56 MWe
Capturable CO23,349 ton/day
���

Conventional CTL Nuclear Integration CTL
Inputs Coal Feed rate (ton/day) 26,941 9,354 % Carbon to Liquid Product 31.8% 91.7% # HTGRs (600 MWt) N/A 10.17 Outputs
Total Liquid Products (bbl/day)t 50,002 50,002 Diesel 35,587 35,194 Naphtha 12,259 11,810 LPG 2,156 2,998 Utility Summary
Total Power (MW) 220.3 -2,347.8 Power Consumed -739.7 -2,749.4 Electrolyzers N/A -2,511.8 Secondary Helium Circulator N/A -23.0 ASU -301.3 N/A Coal Milling and Drying -13.8 -9.5 Gasification and Gas Cleanup -174.7 -82.1 CO2 Compression/Liquefaction -140.8 -19.6 Fischer Tropsch & Refining Processes -40.9 -45.7 Refrigeration -24.0 -26.2 Cooling Tower -26.6 -18.5 Water Treatment -17.6 -13.0 Power Generated 960.0 401.7 Gas Turbine 300.0 N/A Condensing Turbines 178.6 N/A Saturated Turbines 481.4 401.7
Water Requirements1
Water Consumed (gpm) 20,856 15,454 Water Consumed/lb Feed (lb/lb) 4.65 9.92 Water Consumed/bbl Product (bbl/bbl) 14.3 10.6 CO2 Summary
Total CO2 Produced (ton/day) 40,046 1,473 Emitted 8,803 1,473 Capturable 31,243 N/A
Nuclear Integration Summary Electricity (MW) N/A -2,643.0
HTSE N/A -2,511.8 HTGR House Loads N/A -295.2 Balance of Fossil Plant N/A 164.0
Electrolysis Heat (MMBTU/hr) N/A 2408.7 From Nuclear Plant N/A 2330.2 From Secondary Circulator N/A 78.5
Electrolysis Products Total Hydrogen (ton/day) N/A 1,957 Total Oxygen (ton/day) N/A 15,430 Used in Plant (ton/day) N/A 9,198 Excess (ton/day) N/A 6,232
1Does not include water usage for HTGR.
���

Traditional Coalto Liquids Process with
CO2 Capture
Coal26,940 ton/day
Water20,856 gpm
CO2 Emitted8,803 ton/day
Capturable CO231,243 ton/day
Electricity Produced220 MWe
Products Produced50,002 bbl/day Liquids
35,587 Diesel12,259 Naphtha
2,156 LPG
Nuclear AssistedCoal to Liquids Process
utilizing HighTemperature Electrolysisfor Hydrogen Production
6,104 MWt HTGR1 – 664 MWt 850°C – Heat
9 – 604 MWt 700°C – Power
Coal9,354 ton/day
Water15,454 gpm
CO2 Emitted1,473 ton/dayNuclear Electricity
2,348 MWe
Products Produced50,002 bbl/day Liquids
35,194 Diesel11,810 Naphtha
2,998 LPG
Nuclear Heat683 MWt
D
C
B
A
4 3 2 1
D
C
B
A
4 3 2 1
Coal to LiquidsSummary Comparison
SHEET 1 OF 1
REV
2
DWG NO
CTL-SUM-1
Date
Sep. 30, 2011
PREPARED BY A. Gandrik
SIZE
LTR
TYPE Summary Diagram
���

Coal Milling & Drying
Gasification & Syngas
Cleaning & Conditioning
Sulfur Plant (Claus) and
Tailgas Sulfur Reduction
CO2Compression
Air Separation
Fischer-TropschSynthesis
ProductUpgrading &
Refining
PowerProduction
N2
Coal Syngas FTLiquids
TailGas
TailGas
Sulfur CO2
Slag
LPGNaphthaDiesel
O2
HRSG Exhaust
Coal
TailGas
CO2
SourGas
Air
D
C
B
A
4 3 2 1
D
C
B
A
4 3 2 1
Coal to Liquids
SHEET 1 OF 1
REV
2
DWG NO
CTL-BFD-1
Date
Sep. 30, 2011
PREPARED BY A. Gandrik
SIZE
LTR
TYPE Block Flow Diagram
CO2
PlantWater
Treatment
CoolingTowers
��

WaterScrubber
Coal
Slag
BlackWater
System
Soot
Syngas
SuperheatedSteam
BFW
BFW Pump
ActivatedCarbon Bed
Compression
SyngasCooler
Steam
BFW(jacket)
Syngas
Steam(jacket)
Steam
Cyclone
Fly Ash
Condenser
Water
Rectisol Process +Sulfur Guard Beds
(H2S, CO2 Removal)
CO,H2
H2S, CO2
ClausProcess
Elemental Sulfur
Byproduct
SCOTProcess
ClausTailGas
SCOTOffgas
CO2
Generator
Condensing and Saturated
Steam Turbines
EntrainedFlow
Gasifier
Pulverizer
FeedDrying
Coal(Dried &Sized)
Compression
Gas
Separation
Water
HeavyLiquids
MiddleDistillate
&Light
Liquids
Hydrocracker
DistillationColumns Heavy
Liquids
NaphthaProduct
DieselProduct
F-TReactor
Tail Gas
Compression
H2
RecycleQuench
Gas
TailGas
BFW
BFW
Steam
CryogenicASU &
O2Compression
Air
O2
N2
SourShift
Reactors
Steam
CO2Byproduct
HRSG
Air
ExhaustGas
Stack
Exhaust Gas
BFW
Steam Generatedvia Heat Recovery
Gas Turbine Generator
Compressor
TailGas
PSA
FuelGas to
Refinery
Separation
TailGas
LPGProduct
BFW
SteamShift
Bypass
Hydrotreater
D
C
B
A
4 3 2 1
D
C
B
A
4 3 2 1
Coal to Liquids
SHEET 1 OF 1
REV
2
DWG NO
CTL-PFD-1
Date
Sep. 30, 2011
PREPARED BY A. Gandrik
SIZE
LTR
TYPE Process Flow Diagram
Water Treatment
System
��

CALCULATOR BLOCK SUMMARY
FEED & PRODUCT SUMMARY:
FEEDS:
RAW COAL FEED RATE = 26940.5 TON/DY COAL HHV AS FED = 10934. BTU/LB COAL MOISTURE AS FED = 13.70 %
PROXIMATE ANALYSIS: MOISTURE 13.70 % FIXED CARBON 40.12 % VOLATILE MATTER 49.28 % ASH 10.60 %
ULTIMATE ANALYSIS: ASH 10.60 % CARBON 70.27 % HYDROGEN 4.84 % NITROGEN 1.36 % CHLORINE 0.11 % SULFUR 3.72 % OXYGEN 9.10 %
SULFANAL ANALYSIS: PYRITIC 1.94 % SULFATE 0.08 % ORGANIC 1.70 %
INTERMEDIATES:
COAL FEED RATE AFTER DRYING = 24733.7 TON/DY COAL HHV AFTER DRYING = 11910. BTU/LB COAL MOISTURE AFTER DRYNG = 6.00 %
RAW SYNGAS MASS FLOW = 4041893. LB/HR RAW SYNGAS VOLUME FLOW = 1737. MMSCFD RAW SYNGAS HHV (WET) = 280.8 BTU/SCF RAW SYNGAS HHV (DRY) = 305.2 BTU/SCF RAW SYNGAS COMPOSITION: H2 27.4 MOL.% CO 56.6 MOL.% CO2 5.8 MOL.% N2 0.6 MOL.% H2O 8.0 MOL.% CH4 51. PPMV H2S 10664. PPMV
QUENCHED SYNGAS MASS FLOW = 3973714. LB/HR QUENCHED SYNGAS VOLUME FLOW = 1675. MMSCFD QUENCHED SYNGAS HHV (WET) = 290.2 BTU/SCF QUENCHED SYNGAS HHV (DRY) = 299.8 BTU/SCF QUENCHED SYNGAS COMPOSITION: H2 28.5 MOL.% CO 58.9 MOL.% CO2 7.4 MOL.% N2 0.7 MOL.% H2O 3.2 MOL.% CH4 53. PPMV H2S 11092. PPMV
CLEANED SYNGAS MASS FLOW = 1706773. LB/HR CLEANED SYNGAS VOLUME FLOW = 1422. MMSCFD CLEANED SYNGAS HHV (WET) = 315.6 BTU/SCF
���

CLEANED SYNGAS HHV (DRY) = 315.6 BTU/SCF CLEANED SYNGAS COMPOSITION: H2 66.6 MOL.% CO 31.1 MOL.% CO2 1.3 MOL.% N2 0.8 MOL.% H2O 0.0 MOL.% CH4 56. PPMV H2S 0. PPMV
PRODUCTS:
LIQUID PRODUCTS PRODUCED = 516804. LB/HR LIQUID PRODUCTS PRODUCED = 6201.6 TON/DY DIESEL = 378230. LB/HR DIESEL = 4539. TON/DY NAPHTHA = 117319. LB/HR NAPHTHA = 1408. TON/DY LPG = 21255. LB/HR LPG = 255. TON/DY LIQUID PRODUCTS PRODUCED = 50002. BBL/DY DIESEL = 35587. BBL/DY NAPHTHA = 12259. BBL/DY LPG = 2156. BBL/DY LIQUIDS PRODUCED / COAL FED = 0.23 LB/LB LIQUIDS PRODUCED / COAL FED = 1.86 BBL/TON
FUEL PROPERTIES: DIESEL NAPHTHA LPG PROD. RATE, BBL/DAY 35587. 12259. 2156. LHV RATE, MMBTU/DAY 171880. 52590. 9285. MW 187.8 79.6 58.2 API GRAVITY 54.3 84.9 DENSITY, LB/GAL 6.07 5.47 5.63 CETANE N0. 93.9 29.2 HHV CONTENT, BTU/LB 20369. 20161. 19667. LHV CONTENT, BTU/LB 18935. 18678. 18202. % CARBON 84.7 81.7 79.2 D86T CURVE, DEG. C: 0% 147. -107. 10% 182. 20. 20% 200. 49. 50% 247. 80. 90% 327. 119. 100% 355. 161.
POWER CALCULATIONS:
POWER GENERATORS: GAS TURBINE POWER OUTPUT = 300.0 MW CONDENSING TURBINE POWER OUTPUT = 178.6 MW SATURATED TURBINE POWER OUTPUT = 481.4 MW TOTAL POWER GENERATED = 960.0 MW
POWER CONSUMERS: COAL PROCESSING POWER CONSUMPTION = 13.8 MW ASU POWER CONSUMPTION = 301.3 MW GASIFIER POWER CONSUMPTION = 17.4 MW GAS CLEANING POWER CONSUMPTION = 146.9 MW SCOT PROCESS POWER CONSUMPTION = 9.3 MW CLAUS POWER CONSUMPTION = 1.1 MW CO2 LIQUEF. POWER CONSUMPTION = 140.8 MW FISHER TROPSCH POWER CONSUMPTION = 24.2 MW REFINERY POWER CONSUMPTION = 10.8 MW POWER BLOCK POWER CONSUMPTION = 5.9 MW
���

REFRIGERATION POWER CONSUMPTION = 24.0 MW COOLING TOWER POWER CONSUMPTION = 26.6 MW WATER TREATMENT POWER CONSUMPTION = 17.6 MW TOTAL POWER CONSUMED = 739.7 MW
NET PLANT POWER (+ GEN, - CONS)= 220.3 MW
WATER BALANCE:
EVAPORATIVE LOSSES: CMD WATER NOT RECOVERED = 367.5 GPM COOLING TOWER EVAPORATION = 24194.3 GPM ZLD SYSTEM EVAPORATION = 696.3 GPM TOTAL EVAPORATIVE LOSSES = 25258.1 GPM
WATER CONSUMED: GASIFIER ISLAND MAKEUP = 99.9 GPM BOILER FEED WATER MAKEUP = 2544.0 GPM COOLING TOWER MAKEUP = 22157.4 GPM TOTAL WATER CONSUMED = 24801.3 GPM
WATER GENERATED: GASIFIER ISLAND BLOWDOWN = 414.9 GPM SYNGAS CONDENSER BLOWDOWN = 84.1 GPM RECTISOL BLOWDOWN = 22.2 GPM SULFUR REDUCTION BLOWDOWN = 75.6 GPM FT PROCESS BLOWDOWN = 1635.2 GPM REFINERY PROCESS BLOWDOWN = 2.0 GPM COOLING TOWER BLOWDOWN = 2396.5 GPM TOTAL WATER GENERATED = 4630.4 GPM
PLANT WATER SUMMARY: NET MAKEUP WATER REQUIRED = 20855.5 GPM WATER CONSUMED / COAL FED = 4.65 LB/LB WATER CONSUMED / LIQUID PRODUCT = 14.3 BBL/BBL
BYPRODUCTS SUMMARY:
SLAG = 1924. TON/DY FLYASH = 807. TON/DY SULFUR = 847. TON/DY
CARBON BALANCE SUMMARY:
% CARBON TO LIQUID FUEL = 31.8 % % CARBON TO SLAG & FLYASH = 0.4 % % CARBON TO SEQ OR EOR = 52.9 % % CARBON TO CMD VENT = 0.0 % % CARBON TO HRSG TAILGAS = 14.7 % % UNACCOUNTED CARBON = 0.2 %
CO2 CAPTURED (SEQ OR EOR) = 31243. TON/DY CO2 CAPTURED (SEQ OR EOR) = 547. MMSCFD CO2 PURITY = 94.3 % CO2 CAPTURED / LIQ PROD = 5.04 LB/LB CO2 CAPTURED / LIQ PROD = 0.01 MMSCF/BBL CO2 CAPTURED / COAL FED = 1.16 LB/LB
CO2 EMITTED = 8803. TON/DY CO2 EMITTED = 154. MMSCFD FROM GT = 6662. TON/DY LHV TO GT = 84684. MMBTU/DY FROM CMD = 0. TON/DY LHV TO CMD = 0. MMBTU/DY FROM REFINERY = 2141. TON/DY
����

LHV TO REFINERY = 21902. MMBTU/DY CO2 EMMITED / LIQ PROD = 1.42 LB/LB CO2 EMMITED / COAL FED = 0.33 LB/LB
STARTUP FLARE SUMMARY:
CO2 FROM FLARE = 326. TON/DY LHV TO FLARE = 2380. MMBTU/DY
EFFICIENCY CALCULATIONS:
HEAT IN (HHV BASED): COAL HEAT CONTENT = 24547.7 MMBTU/HR
HEAT OUT (HHV BASED): NET POWER = 751.8 MMBTU/HR LIQUID HEAT CONTENT = 10487.6 MMBTU/HR
PLANT EFFICIENCY (HHV BASED): EFFICIENCY = 45.8 %
CALCULATOR BLOCK GAS-TURB HIERARCHY: GAS-TURB
GAS TURBINE CALCULATIONS:
TAILGAS FLOW = 349949. LB/HR GAS HEAT CONTENT (60 DEG F) = 534.1 BTU/SCF
N2 FLOW = 1. LB/HR
FUEL + DILUENT TOTAL FLOW = 349950. LB/HR GAS HEAT CONTENT (60 DEG F) = 534.1 BTU/SCF
GAS TURBINE AIR FLOW = 7778823. LB/HR COOLING FRACTION = 10.8 %
COMBUSTION TEMPERATURE = 2321. DEG F (A LITTLE HIGH - TUNED TO MATCH POWER OUTPUT) EXHAUST TEMPERATURE = 1200. DEG F
AIR COMPRESSOR LOAD = 360.2 MW TURBINE GROSS POWER = 671.3 MW GENERATOR LOSSES = 8.6 MW FUEL COMPRESSOR LOSSES = 2.6 MW NET GAS TURBINE POWER = 300.0 MW
����

HIERARCHY
ASU
HIERARCHY
CLAUS
HIERARCHY
CMD
HIERARCHY
CO2-COMP
HIERARCHY
COOL-TWR
HIERARCHY
FT
HIERARCHY
GAS-CLN
HIERARCHY
GAS-TURB
HIERARCHY
GASIFIER
HIERARCHY
H2O-TRTM
HIERARCHY
REFINERY
HIERARCHY
RU
HIERARCHY
S-REDUCT
HIERARCHY
ST-HRSG
7015
2245040
COAL
9917
5550484N2-DRY
1821160
703211
CO2-TRN2
23015
5425216 EXHAUST
21815
2370308
DRY-COAL
21915
309171 N2-VNT
16715
394041
CO2-VENT
HEAT-CMD
Q
230665
1584116O2-GFR
502700
294449
STM-GFR
186700
110333
CO2-FLT2
12015
50000
MU-H2O
46215
67268FLYASH
19615
160339
SLAG
221579
3973713
SYNGAS-1
10415
207596
GFR-SH2O
48330
34503
FT-NAP
428350
303406
FT-WAX
117340
215200
FT-MID-D
195391
8156
H2-REF2
19525
69659
PSA-REF
7015
679394AIR-REF
80015
777981FH-EXH
5333
35821 TG-REF
10415
378230
DIESEL
10415
117319
NAPHTHA
1402065985
REF-H2O
502700
968609
STM-WGS
221579
3973713
SYNGAS-2
104500
152663
SRED-EX
104150
HG-ACCUM
19525
71964PSA-GAS
195391325 H2-SRED1
195391
8156
H2-REF1
10929
3120833CO2
12929
133673H2S
195401
1706773 FT-SYNG
11625
11089
RECT-H2O
104449
42065
COND-H2O
9517
119975
CLAU-EO2
37620
183089
CLAUS-EX
37515
70559SULFUR
19525
2305
FUELSRU1
9517
4770
SRED-EO2
11315
37827
SCOT-H2O
7015
221010049
AIR-CT
6715
11087562
CT-MKUP
10415
230898405
CT-EX
8630
1199206
CT-BD
7015
8260111
AIR-ASU
9917
5550485
N2-1
9517
1584116
O2-1
9517
1070709
ENR-AIR
10494
54801
ASU-VENT
48330
335382
TG-FT
115330
818268FT-H2O
59319
349949
TG-LPG-4
99171
GT-N2
7015
7778823
AIR-GT
120015
8128773
GT-POC12015
1273000
BFW-MKUP
34415
8906875
STACKGAS
1042005
2701330
CO2-EOR
1821160
703211
CO2-TRN1
186700
110333
CO2-FLT1
104449
42065
COND-BD
10415
207596
GFR-BD
1402065985
REF-BD
11625
11089
RECT-BD
8630
1199206
COOL-BD
6015
10436088MAKEUP
11315
37827
SCOT-BD
115330
818268
FT-BD
12015
1273000
TO-HRSG
23015
348437
ZLD-EX
12015
50000
TO-GFR
6415
11087562
TO-CT
9517
1584116O2-2
9917
5550484
N2-2
282335
35821
TG-REF-2
79330
371203
TG-TOT
28327
371203TG-LPG2
-3322
349949TG-LPG3
-3322
21255
LPG
9517
945963
ASU-EXH
CL-CHG-3
O2-COMP
W=81323
CL-CHG-1
PSA-SPLT
CL-CHG-4
TG-MIX
REC-COMPW=2062
COOLERQ=-7
PRECOOLQ=10
N2-SPLT3
ENR-SPLT
Temperature (F)
Pressure (psia)
Mass Flow Rate (lb/hr)
Q Duty (MMBtu/hr)
W Power(kW)
Warnings
Conventional Coal to Liquid Fuels
When adding N2 injectionturn on the GT-N2-MF designspec and add the spec to theconvergence spec C-2.
4-Stages;Efficiency=83%
Reconcile
Reconcile Reconcile
Reconcile
Reconcile
ReconcileColor Legend
Water or Steam
CO2 Source
Reconcile
Reconcile
����

7015
8260111AIR
AIR-ASU(IN)
9917
5550485N2
N2-1(OUT)
9517
1584116O2
O2-1(OUT)
9517
1070709WASTE
ENR-AIR(OUT)
10494
54801BLOWDOWN
ASU-VENT(OUT)
10494
8205310
AIR-3
10494
7630939
AIR-3B
10494
574372AIR-3A
104109
574372
AIR-5
-29617
5550485N2-1
-29517
1584116
O2-1
-30717
1070709
C2-WASTE
-274102
574372AIR-6
-27887
7630939
TO-HPCOL
10494
8260111
AIR-2
10494
54801
MS-LIQ
-29517
1584116
LPCOLBOT
10494
8260111AIR-1
940KO-LIQ -311
17574372
TO-LPCOL
-31817
3281304
HP-TOP-3
-31017
4349635 HP-BOT-2
-31817
5550485
LPCOLTOP
-28687
3281304
HPCOLTOP
-27987
4349635
HPCOLBOT
-28687
3281304
HP-TOP-1
-31287
3281304HP-TOP-2
-31217
4349635HP-BOT-1
138109
574372AIR-4
AIR-SPLT
H-EXQ=783
MOLSIEVE
COLD-1BQ=143
ACOMP-1
W=220994
KO-DRUM
H20-MIX
LP-COL
QC=0QR=338
HP-COL
QC=-338QR=0
COLD-1AQ=-143
VALVE-2
VALVE-1
COLD-2BQ=32
COLD-2AQ=-139
ACOMP-2
W=1376
CW-EXCHQ=-5
COLD-2CQ=107
A-EXPAND
W=-2389
Temperature (F)
Pressure (psia)
Mass Flow Rate (lb/hr)
Q Duty (MMBtu/hr)
W Power(kW)
Air Separation Unit
4-Stages;Efficiency=83%
Efficiency=83%
����

7015
2245040COAL-1
COAL(IN)
9917
5550484N2
N2-DRY(IN)
1821160
703211
CO2 CO2-TRN2(IN)
23015
5425216DRYVENT2
EXHAUST(OUT)
21815
2370308
COAL-10 DRY-COAL(OUT)
21915
309171N2-VENT
N2-VNT(OUT)
16715
394041CO2-VNT3
CO2-VENT(OUT)
HEAT-CMDHEAT-CMD(OUT)
15015
2245040
COAL-4
42717
5241313HOTGAS-3
23015
7486353
COAL-5
23015
5425216DRY-VENT
23015
2061137COAL-6
230150
HG-BP
222650
2370308COAL-9
7015
2245040COAL-2
15015
2245040COAL-3
21915
2370308
COAL-7
21915
2061137COAL-8
1821160
703211
CO2-1
222650
394041
CO2-VNT1
9917
309171
N2-TRANS
9917
5241313N2-DRY
16715
394041CO2-VNT2
22217
5241313
HOTGAS-1
39917
5241313
HOTGAS-2
RYIELD
DRYER
Q=-0
BAGHOUSE
SEP
HG-BYPASQ=-0
HG-MIX
PULVERIZ
W=11032
COMPR
PULV-PWR
W=11032
PULV-HT
SSPLIT
LOCK-HOP
SSPLIT
FEED-HOP
MIXER
N2-SPLT
CO2-VENT
CL-CHG-1
CL-CHG-2
LGHTGCLNQ=161
FTS-USEQ=232
MPS-USEQ=37
Temperature (F)
Pressure (psia)
Mass Flow Rate (lb/hr)
Q Duty (MMBtu/hr)
W Power(kW)
PSD tracking droppedhere. Balance achievedusing Calculator block"PSD" and Transferblock "PSD".
Coal Milling & Drying
Used toincludepulverizerpower inutilitycalcs.
����

230
665
1584116
O2-GFRO2-GFR(IN)
218
15
2370308
COALDRY-COAL(IN)
502
700
294449
STM-GFRSTM-GFR(IN)
186
700
110333
CO2-FLTRCO2-FLT2(IN)
120
15
50000
H2O-MKUPMU-H2O(IN)
462
15
67268FLY-ASH
FLYASH(OUT)
196
15
160339
SLAG SLAG(OUT)
221
579
3973713
SYNGAS SYNGAS-1(OUT)
104
15
207596
G-WAT-BD GFR-SH2O(OUT)
COAL-5
ELEMENTS
HEAT
218
15
309171
GFR-CO2
2753
600
4248873GFR-EFF1
2800
600
4248873GFR-EFF2
2800
598
136607SLAG-1
2800
598
4112266
SYNG-1
464
591
7763677SYNG-4
462
584
7806741
SYNG-5
218
15
2061137COAL-4
231
603
3600182
RECY-SG2
200
600
51528H2O-EVAP
1616
598
7763677SYNG-2
521
594
7763677SYNG-3
220
579
3600182
RECY-SG1
104
15
112198
VG-1
230
579
107001
VENT-GAS
102
15
5196
LIQ-KO
104
15
8095977
G-WAT-4
104
15
7893577G-WAT-5
104
15
202399
G-WAT-6
199
600
47105182
SCRUB-4
218
579
7466894SYNG-6
218
579
47445040 SCRUB-1
199
574
47105182SCRUB-3
218
579
39161605
SCRUB-2
218
579
8283435SCR-BD
105
579
7943577
MU-H2O-1
574
0SCR-VENT
200
15
1175080
SLAG-3
200
15
151785
SLAG-4
200
15
1023295
B-WAT-1
104
30
1090002
G-WAT-3
200
15
1226609
SLAG-2
104
15
9194532
B-WAT-2
104
15
1090002
G-WAT-2
220
579
3866712
SYNG-7
104
15
8554SOLIDS
104
15
9185979
G-WAT-1
DECOMPQ=-17080
GIBBSQ=17080
SEP
GFR-SEPQ=-0
SEP
DSRQ=-0
HT-LOSSQ=-221
ADJUSTQ=0
QNCH-MIX
FD-SPLT2
SC-1Q=-3258
SC-2Q=-159
RECY-CMP
W=3852
RE-COMPW=7625
GW-SPLT2
SCRUBBERQ=0 SCR-PUMP
W=1334
SCR-SPLT
SCR-TANKQ=0
SEP
CON-SCRNQ=0
MIXER
SLG-QNCH
BW-TANKQ=-1021
QCH-PUMPW=18
QCH-SPLT
SEP
SETTLERQ=-0
GW-SPLT
MU-PMP-1W=4569
SEP
H2O-EVAPQ=0
SLAG-MIX
SG-MIX
BD-MIX
Temperature (F)
Pressure (psia)
Mass Flow Rate (lb/hr)
Q Duty (MMBtu/hr)
W Power(kW)
Shell Gasifier w/ Heat Recovery
Gasifier Heat Recovery Water Scrub System
Water Handling System
May need evaporator &crystalizer here to treat aside stream for control ofdissolved solids.
����

502700
968609
SHFT-STMSTM-WGS(IN)
221579
3973713
SYNG-7SYNGAS-2(IN)
104500
152663
SRED-GASSRED-EX(IN) 104150
HG-ACCUM HG-ACCUM(OUT)
19525
71964
PSA-GAS PSA-GAS(OUT)
195391325
H2-SRED H2-SRED1(OUT)
1953918156
H2-REF H2-REF1(OUT)
10929
3120833
CO2
CO2(OUT)
12929
133673
H2S H2S(OUT)
195401
1706773
FT-SYNG FT-SYNG(OUT)
11625
11089
REC-H2O RECT-H2O(OUT)
104449
42065COND-BD
COND-H2O(OUT)
195401
80445PSA
1953918481
H2-1
104454
4900153
SYNGAS
104447
4900153 SYNG-1
482580
1052409SAT-5
221579
2141804
WGS-SG-1
380579
3194213
WGS-SG-2
104449
799243
COND-2
308494
253270SAT-1
154449
1052409SAT-2
413579
4162822WGS-SG-3
450569
4162822WGS-SG-4
545541
4162822 WGS-SG-6
454531
4162822 WGS-SG-7
483590
1052409SAT-4
154600
1052409SAT-3
529514
4162822 WGS-SG-8
331504
4162822WGS-SG-9
869551
4162822
WGS-SG-5
104454
841309KO-LIQ
104449
841308COND-1
1044490
COND-VNT
205464
5741461
SYNG-13
309504
5994732
SYNG-9 308494
5741461
SYNG-10
72429
1787221 SYNG-2
221579
1831909
WGS-BP
195401
1787219
SYNG-6
177422
1787221
SYNG-3
285415
1787221
SYNG-4
HEAT-S-1Q
300152
S-ADS
300408
1787219
SYNG-5
HEAT-RECQ
299484
5741461SYNG-11
232474
5741461SYNG-12
HEAT-S-2QHEAT-CMD
Q
SEP
PSA
Q=0
HG-BED
Q=0
SAT-MIX2 SAT-MIX1
WGS-EX2BQ=169
WGS-EX2AQ=-169
WGS-EX1BQ=621
WGS-EX3BQ=583
WGS-EX3AQ=-583
WGS-2Q=0
WGS-EX1AQ=-621
WGS-1Q=0
WGS-MIX1
CON-PMP1W=202
CON-TANKQ=0
KO-DRM-2Q=-399
KO-DRM-1Q=0
H2-SPLT
SEP
RECTISOL
Q=-21
HEATER
R-CWUQ=-1108
COMPR
R-EU
W=146669COMPR
PSA-PWR
W=7
WGS-SPLT
WGS-MIX
PSA-SPLT
HEATER
RECHTUSE
Q=663
HX-2Q=124
S-BEDQ=17
HX-1Q=121
H2O-SPLT
REC-HTRQ=-663
SBED-PHQ=-116
CMD-LT-HQ=-161
Temperature (F)
Pressure (psia)
Mass Flow Rate (lb/hr)
Q Duty (MMBtu/hr)
W Power(kW)
Syngas Cleaning & Conditioning
Sour Shift Conversion
Manual adjustvapor fractionto achievedesired inlettemp to WGS-2
Used to includeRectisol coolng water,
power, and steam requirements as well as PSA power requirement
in utility calcs.
Reconcile
ReconcileBlock
From CMDblock....
���

12929
133673
H2S-GASH2S(IN)
9517
119975
AIRCLAU-EO2(IN)
37620
183089
TO-SCOT CLAUS-EX(OUT)
37515
70559
SULFUR SULFUR(OUT)
52127
253648
TO-SEP-1
37626
201881SEPGAS-1
37626
51768
S-1
50026
201881TO-RX-2
86424
201881RX-2-OUT
74824
201881
TO-SEP-2
37623
195532
SEPGAS-2
37623
6349S-2
41022
195532TO-RX-3
51321
195532RX-3-OUT
48120
195532
TO-SEP-3
37620
12443
S-3
86424
201881TO-COOL251321
195532TO-COOL3
228127
253648RX-1-OUT
228127
253648TO-COOL1
12929
133673TO-RX-1
0
RX-1-BP
23630
119975 AIR-2
COOL-1C
Q=-10
RX-2
Q=0
COOL-2D
Q=-21
RX-3
Q=0
COOL-3B
Q=-6
MIX
RGIBBS
PHASE-2Q=19
RGIBBS
PHASE-3Q=42
RGIBBS
PHASE-1
Q=144
H2S-SPLT
REHEAT-1Q=7
REHEAT-2Q=2
RX-1
Q=0
COOL-1AQ=-129
COOL-2AQ=-7
COOL-3AQ=-2
AIR-COMPW=1145
Temperature (F)
Pressure (psia)
Mass Flow Rate (lb/hr)
Q Duty (MMBtu/hr)
W Power(kW)
Claus Process
Note: To simulate a straightthrough process rather than asplit-flow process, simplydeactivate design spec "TEMP"and change the temperature of"REHEAT-1" from 640°F to500°F (640°F is necessary tohydrolize COS and CS2 in split-flow configuraiton to protectsubsequent catalyst stagesfrom poisoning).
Note: Aspen seems to be lacking some thermodynamicproperties for S2, S3, S4, S5, S6, S7, and S8 related tovapor pressure that are necessary to perform a flashcalculation. For this reason, blocks "PHASE-1","PHASE-2", and "PHASE-3" are used to convert all ofthese compounds to S prior to the flash blocks. Notethat there is some enthalpy change associated withthis simplification, and it is neglected in this simulation.
Note: H2S-SPLT is currentlyadjusted manually to aid inconvergence.
���

19525
2305
FUEL-GASFUELSRU1(IN)
37620
183089
CLAUSGASCLAUS-EX(IN)
9517
4770
AIRSRED-EO2(IN)
195391325
H2H2-SRED1(IN)
104500
152663
GAS-5 SRED-EX(OUT)
11315
37827
H2O-7 SCOT-H2O(OUT)
16417
184824
GAS-4
10417
32161H2O-5
37618
190490
GAS-3
16422
107648
H2O-3
16417
113313H2O-1
65319
190490
GAS-2
57220
190165
GAS-1
19826
4770AIR-1
16417
5666
H2O-4
16417
107648
H2O-2
11317
37827
H2O-6
TG-COMPW=9268
QUENCH
Q=-17
BOILER
Q=-15
REDUCEQ=0
PREHEAT
Q=0
AIR-COMPW=33
H2O-SPLT
PUMPW=1
H2O-MIX
PUMP-2
W=-0
MIX
Temperature (F)
Pressure (psia)
Mass Flow Rate (lb/hr)
Q Duty (MMBtu/hr)
W Power(kW)
Warnings
Catalytic Sulfur Reduction (SCOT or Beavon Process w/o H2S Absorber)
Preheat Burner
����

16715
394041CO2-REC1
CO2-VENT(IN)
10929
3120833
CO2-INCO2(IN)
1042005
2701330
CO2-EOR CO2-EOR(OUT)
1821160
703211CO2-GFR
CO2-TRN1(OUT)
186700
110333CO2-FLTR
CO2-FLT1(OUT)
28430
394041CO2-REC2
10430
394041CO2-REC3
1882005
2701330
CO2-7
186700
3404541
CO2-2
104700
3404541
CO2-3
1821160
3404541
CO2-4
1821160
2701330
CO2-5
186700
3514874
CO2-1
1041160
2701330
CO2-6
REC-COOLQ=-15
REC-COMPW=3036
ST8-COOLQ=-48
ST6-COOLQ=-59
SPLT-2SPLT-1
ST7-COOLQ=-44
STAGE-8W=14173
STAGE-7W=16411
STGS-1-6
W=107135
Temperature (F)
Pressure (psia)
Mass Flow Rate (lb/hr)
Q Duty (MMBtu/hr)
W Power(kW)
CO2 Compression/Liquefaction
(8-Stages Total; Efficiency = 84.4)
���

195401
1706773SYNGAS-1
FT-SYNG(IN)
48330
335382
FT-TG TG-FT(OUT)
428350
303406
FT-WAXFT-WAX(OUT)
117340
215200
FT-MID-D FT-MID-D(OUT)
48330
34503
FT-NAP FT-NAP(OUT)
115330
818268
FT-WATER FT-H2O(OUT)
428395
4607521SYNGAS-2
FT-HX
428355
4607506
FT-PROD1
FT-MPS-1Q
376345
4304100
FT-GAS-2
117340
3284086
FT-GAS-3
117340
804814WATER-2
428350
4304100
FT-GAS-1
3500
WATER-1
41335
3284086
FT-GAS-4
48330
3236130FT-GAS-5
48330
13454WATER-3
FT-REF-1
Q
48330
2900748
REC-GAS1116475
2900748
REC-GAS2
117340
804814
H2O-MIX1
FT-RX-1
Q=-3224
MID-SEP1
Q=-1391
COOL-1Q=-111
WAX-SEP1
Q=0
NAP-SEP1Q=0
COOL-2Q=-120
GAS-SPLT
REC-COMPW=24169
H2O-MIX1 H2O-MIX2
SG-PRHT1
Q=692
Temperature (F)
Pressure (psia)
Mass Flow Rate (lb/hr)
Q Duty (MMBtu/hr)
W Power(kW)
Fischer Tropsch Synthesis
����

HIERARCHY
HYDCRACK
HIERARCHY
HYDTREAT
48
330
34503
FT-NAPFT-NAP(IN)
428
350
303406
FT-WAXFT-WAX(IN)
117
340
215200
FT-MID-D FT-MID-D(IN)
195
391
8156
H2-REFT H2-REF2(IN)
195
25
69659
PSA-REFPSA-REF(IN)
70
15
679394
AIR-REFAIR-REF(IN)
800
15
777981
FH-EXHSTFH-EXH(OUT)
53
33
35821
TAILGAS2 TG-REF(OUT)
104
15
378230
DIESEL-4DIESEL(OUT)
104
15
117319
NAPHTHA3NAPHTHA(OUT)
140
2065
985
REF-H2O REF-H2O(OUT)
376
345
417040
HC-WAX2
195
391
5638
H2-CRAK
448
1
398816
HCRACK
865
0
HCRACK-W
140
110
23869 H2-HCPRG
Q-REBL2
195
391
2518H2-TREAT
140
110
7510H2-HTPRG
140
2065
209224
HTREAT 140
2065
985
HTREAT-W
104
0
378230
DIESEL-3
376
2
378230
DIESEL-2
464
4
378230
DIESEL
494
39
491870
ATM-BOT
595
5
113640
BOT-WAX
Q-REBOIL
598
350
113640BOT-WAX2
123
33
532446
COL-FEED
Q-FURN
189
17
40575
TOP-NAPH
104
34
13097HCRACK-5
104
34
313276
HCRACK-3
123
33
3168FLSHGAS1
33
0
H2O
135
25
98587
TG-FH-2 COL-HEAT
800
15
777981FH-EX-1
53
33
28928TG-FH
151
17
82816
NAPHTHA1
126
17
117319
NAPHTHA2
48
33
42241
HCHT-NAP
476
350
417040
HC-WAX
376
1
398816
HCRACK-1
104
0
85540 CRAK-GAS 104
0
313276 HCRACK-2
104
4
13097HCRACK-4
137
34
23869H2HCPRG2
139
34
7510H2HTPRG2
104
34
72443
CRAKGAS2
48
33
61581CRAKGAS3
53
33
64749
TAILGAS
D-PUMPW=8
D-COOL2Q=-90
D-COOL1Q=-33
VAC-COLQC=-178QR=218QF=0
BOT-PUMPW=83
ATM-COLQC=-19QR=139
FLASHQ=0
FIRED-HTQ=-764
RSTOIC
NOX-ADJQ=0
Q
MIXER
HEAT-MIX
TG-MIX-2
NAP-MIX NAP-MIX2
WAX-MIX
HC-SEPQ=-85
HC-PUMP2W=1
NAP-SEPQ=-4
HC-VLVE
HT-VLVE
TG-MIX TG-SPLT
H2-SPLT
HC-PUMPW=17
CG-COMPW=2957
H2O-MIX
NAP-COOLQ=-3
CRK-COOLQ=-28
WAX-COOLQ=-28
Temperature (F)
Pressure (psia)
Mass Flow Rate (lb/hr)
Q Duty (MMBtu/hr)
W Power(kW)
Product Upgrading and Refining
����

376345
417040
WAXHC-WAX2(IN)
195391
5638
H2-CRAK H2-CRAK(IN)
4481
398816
HRACK-7 HCRACK(OUT)
8650 H2O
HCRACK-W(OUT)
140110
23869
H2-PURGE H2-HCPRG(OUT)
Q-REBL Q-REBL2(OUT)
3781076
417040
WAX-2
39510769223H2-CRAK4
6191076
205622CRK-WAX2
7001066
631913
WAX-3
HEAT
7021028
631913HCRACK
7551028
631913
HCRACK-2
5501026
631913
HCRACK-3
6142
205622
CRK-WAX
3551024
631913
HCRACK-4
140865
27453H2-REC
140865
604460
HCRACK-5
140855
3584
H2-REC2
435855
5638
H2-CRAK2
320855
9223
H2-CRAK3
3371
604438
HCRACK-7
1171
604438
HCRACK-6
WAX-PMP1W=505
HC-PRHTQ=121
HCRAK-R1Q=0
HCRAK-R2Q=0
HC-RECPQ=-121
WAX-PMP2W=427
H2-FLASHQ=-84
PSAQ=0
H2-MIX
H2-COMPW=1365
H2-COMP2W=707
HCRK-FRCQC=-319QR=407QF=0
HC-VLVE
COMPR
PSA-PWR
W=3
RECUPQ=91
Temperature (F)
Pressure (psia)
Mass Flow Rate (lb/hr)
Q Duty (MMBtu/hr)
W Power(kW)
Used to includePSA power requirement
in utility calcs.
Hydrocracking
����

195391
2518
H2TRTH2-TREAT(IN)
117340
215200
MDFT-MID-D(IN)
140110
7510
H2-PURGE H2-HTPRG(OUT)
1402065
209224
HTREAT-3 HTREAT(OUT)
1402065985
H2O HTREAT-W(OUT)
1262290
215200
MD-2
3382290
10204H2TRT-4
6452280
225404
MD-3
HEAT
7402245
225404
HTREAT
3032245
225404
HTREAT-2
1402065
15197H2-REC
14020557686
H2-REC2
80320552518
H2TRT-2
3042055
10204
H2TRT-3
HT-PUMPW=731
HT-PRHT
Q=92
HT-RECP
Q=-92HTREAT-R
Q=0
PSAQ=0
H2-COMPW=1569
H2-COMP2W=365
H2-MIX
H2-FLASH
Q=-27
COMPR
PSA-PWR
W=5
Temperature (F)
Pressure (psia)
Mass Flow Rate (lb/hr)
Q Duty (MMBtu/hr)
W Power(kW)
Used to includePSA power requirement
in utility calcs.
Hydrotreating
����

59319
349949
GT-FUELTG-LPG-4(IN)
99171
GT-N2GT-N2(IN)
7015
7778823
GT-AIR-1AIR-GT(IN)
120015
8128773
EXHAUST GT-POC(OUT)
709184
6938979GT-AIR-5
118435
349950
GT-FUEL3
2324175
7288928
GT-NOX
2321175
7288928GT-POC-1
709184
839845
GT-AIR-4
709184
7778823GT-AIR-3
7015
7778823
GT-AIR-2
104319
1 GT-N2-2
59319
349950
GT-FUEL2
GT-COMB
Q=0
GT-NOX
Q=-18
GT-TURB
W=-671330
GT-SPL-1
GT-COMP
W=360154
N2-MIX
FILTER
FUELCOMP
W=2597
N2-COMP
W=0
Temperature (F)
Pressure (psia)
Mass Flow Rate (lb/hr)
Q Duty (MMBtu/hr)
W Power(kW)
Gas Turbine
����

800
15
777981FH-EXHST
FH-EXH(IN)
1200
15
8128773EXHAUST
GT-POC(IN)
120
15
1273000
MAKEUP BFW-MKUP(IN)
344
15
8906875
STACKG STACKGAS(OUT)
220
1929
992480HP-BFW-2752
15
8906754
EX-3 631
1929
992480
HP-BFW-3
555
15
8906754
EX-4
948
15
8906754
EX-2
629
1900
992480
HPS
200
17
8469878BFW-2
417
300
142099FT-DA
217
17
8611960BFW-3
217
17
992480HP-BFW-1
629
1900
982555
HPS-1
688
463
982555
TO-REHT
1200
15
8128773EXHST-2
1040
1800
982555HPS-2
1040
400
982555
LPS
963
15
8128773
EX-1
105
1
982555
COND-1
555
15
8906875
EX-5
142
17
8469878BFW-1
105
1
5064590
T-EFF-3
105
1
6047145
CON-4
105
17
6047145CON-5
FUEL-GAS
AIR-1
FG-EXH-1
0
FG-EXH-2
217
17
3554083
MPGEN-1
217
17
250388
LPGEN-1
217
17
3815009FTGEN-1
358
150
21724
LP-COND
122
17
1273000
BFW
358
150
1128008 CON-2
217
60
250388
LPGEN-2
217
300
3815009
FTGEN-2
218
700
3554083
MPGEN-2
503
700
2238394MP-STM-2 417
300
2238394
T-EFF-1
417
300
2081093KO-1-VAP
417
300
2909434FT-STM-3
358
150
4990528T-EFF-2358
150
4835926KO-2-VAP
358
150
228664LP-STM-2
503
700
52631MP-COND
417
300
209932
CON-1
417
300
763475
FT-COND
417
300
3051534
FT-STM-2
68
20
122NH3
629
1900
9925HPB-BD
503
700
3554083
MP-STM
417
300
3815009
FT-STM
358
150
250388
LP-STM
417
300
763475FT-USRS
503
700
52631
MP-USRS
358
150
21724
LP-USRS
417
300
3815009
FT-STM-1
0FT-INJ
358
150
250388
LP-STM-1
0 LP-INJ
503
700
3554083
MP-STM-1
503
700
1263058
MP-INJ
120
17
1273000
MAKEUP-2
HPEQ=468
HPBQ=478
DA
HP-PUMP
W=2106
SHRHQ=-541
HP-TURBW=-42259
LP-TURBW=-136385
LTEQ=489
CONDSR-1Q=-5309
C-PUMP-1W=99
EXST-MIX
D-FIRE-1
RSTOIC
NOX-ADJ1EX-MIX-1
BFW-SPLT
COND-MIX
LP-PUMPW=14
FT-PUMPW=1141
MP-PUMPW=2566
S-TURB-1W=-36804
S-TURB-2W=-67644
S-TURB-3W=-376948
KO-1Q=0 KO-2
Q=0
FT-SPLT2
SCR
Q=0
HPB-BD
MP-GEN
Q=3604
FT-GEN
Q=3878
LP-GEN
Q=253
FT-USEQ=-617
MP-USEQ=-37
LP-USEQ=-19
FT-SPLT1
LP-SPLT1
MP-SPLT1
C-PUMP-3W=3
Temperature (F)
Pressure (psia)
Mass Flow Rate (lb/hr)
Q Duty (MMBtu/hr)
W Power(kW)
HRSG & Steam Turbines
Condensing Steam Turbines
HRSG
(Manual Adjust)
Saturated Steam Turbines
Note: If you change the design specthat controls the deaerator temperature,be sure to update the utility inlet specsfor all three steam levels.
����

7015
221010049
AIR-1AIR-CT(IN)
6715
11087562
MU-H2OCT-MKUP(IN)
10415
230898405
AIR-3 CT-EX(OUT)
8630
1199206
BLOWDOWN CT-BD(OUT)
10230
699350956
CWR-3
HEAT
10415
689462600
CWS-1
10415
230898405AIR-2
10215
699350956
CWR-2
8615
700550162
CWS-3
8630
700550162
CWS-4
8630
166556365
CWS-6
12225
166556365
CWR-1
8615
700550162
CWS-2
8630
699350956
CWS-5
8630
532794592
CWS-6-C
9625
532794592
CWR-1-C
CT-FLASH
Q=14650
CT-PUMPW=10466
CWS-PUMPW=10879
CT-FAN
W=5221
CW-USERS
Q=5981
CT-COOL
Q=-14649
BLOWDOWN
COLDWELL
Q=0
CW-USERC
Q=5309
HOT-WELL
Temperature (F)
Pressure (psia)
Mass Flow Rate (lb/hr)
Q Duty (MMBtu/hr)
W Power(kW)
Warnings
Cooling Tower���

104449
42065COND-1
COND-BD(IN)
10415
207596GFR-1
GFR-BD(IN)
1402065985REF-1
REF-BD(IN)
11625
11089RECT-1
RECT-BD(IN)
8630
1199206COOL-1
COOL-BD(IN)
6015
10436088MKUP-1
MAKEUP(IN)
11315
37827SCOT-1
SCOT-BD(IN)
115330
818268
FT-1
FT-BD(IN)
12015
1273000
TO-HRSGTO-HRSG(OUT)
23015
348437
EVAP-EXHZLD-EX(OUT)
12015
50000TO-GFR
TO-GFR(OUT)
6415
11087562TO-CT
TO-CT(OUT)
10515
42065COND-2
10515
42065COND-3
11215
830342DGST-EFF27242
43703SCOT-3
11815
1123706BIO-EFF
12315
1199206COOL-2
12015
1974475RO-EFF
12015
348437
RO-BD
12015
1273000
TO-BFW
6015
10436088MKUP-2
12015
651475
TO-MKUP
29460
6317
LPS
11345
37827SCOT-2
26739
441
S-GAS
MIXER
CN-OXYL
MIXER
NH3-NH4
MIXER
BIOTREAT
FSPLIT
UF-RO
MIXER
POLISH
MIXER
DIGESTER
HEATER
ZLDQ=385
MIXER
SOFTEN
MIXER
CLARIFY
SPLITMIX
S-STRIP
QC=-0QR=1
PUMPW=2
COMPR
PWR-CALCW=17618
Temperature (F)
Pressure (psia)
Mass Flow Rate (lb/hr)
Q Duty (MMBtu/hr)
W Power(kW)
Routed backto Claus
Simplified Water Treatment���

300226
295732
NH3-VAP1
104224
295732
NH3-LIQ1
-3512
295732
NH3-VAP2
-4110
295732NH3-VAP3
CONDENSR
Q=-179
VALVEEVAPORTR
Q=131
COMPRESR
W=24028
Temperature (F)
Pressure (psia)
Mass Flow Rate (lb/hr)
Q Duty (MMBtu/hr)
W Power(kW)
Refrigeration Unit
3-Stages;Efficiency=75%
����

D
C
B
A
4 3 2 1
D
C
B
A
4 3 2 1
Coal Milling & Drying
Gasification & Syngas
Conditioning
Sulfur Plant (Claus) and
Tailgas Sulfur Reduction
CO2Compression
HighTemperatureElectrolysis
Units
Fischer-TropschSynthesis
ProductUpgrading &
RefiningCoal Syngas FT
Liquids
TailGas
Sulfur
Slag
LPGNaphthaDiesel
O2 & H2
Coal
Tail GasCO2
Sour Gas
H2O
4 3 2 1
Coal to Liquids Nuclear Integration Opportunities
SHEET 1 OF 1
REV
2
DWG NO
CTL-NUCLEAR-BFD-1
Date
Sep. 30, 2011
PREPARED BY A. Gandrik
SIZE
LTR
TYPE Block Flow Diagram
Tail GasRecycle
CO2Recycle
Nuclear Heat Integration
Nuclear Power Integration
PlantWater
Treatment
Air
PowerProduction
CO2
CoolingTowers
HTGR850°C ROT
Heat Generation
HTGR700°C ROTPower Gen.
Power
Nuclear Heat(He 825°C) He Return
���

WaterScrubber
Coal
Slag
BlackWater
System
Soot
ActivatedCarbon Bed
CO2Compressor
Steam
BFW(Jacket)
Syngas
Steam(Jacket)
Cyclone
Fly Ash
Condenser
Water
Rectisol Process +Sulfur Guard Beds
(H2S, CO2 Removal)CO, H2
H2S, CO2
ClausProcess
CO2
CO2 Recycle to Gasifier
E-326
E-325
EntrainedFlow
Gasifier
Pulverizer
CoalDrying
Coal(Dried &Sized)
Compressor
Gas
Separation
Water
HeavyLiquids
MiddleDistillate
&Light
Liquids
Hydrocracker
DistillationColumns Heavy Liquids
NaphthaProduct
DieselProduct
F-TReactor
RecycleQuench Gas
TailGas
TailGas
BFW
Steam
O2 &Sweep
Air
Tail GasCompressor
RecycleCompressor
Elemental Sulfur
Byproduct
SCOTProcess
ClausTailGas
SCOTOffgas
Hydrotreater
H2
Nuclear Heat Integration
Nuclear Power Integration
D
C
B
A
4 3 2 1
D
C
B
A
4 3 2 1
Coal to LiquidsNuclear Integration Opportunities
SHEET 1 OF 1
REV
2
DWG NO
CTL-PFD-NUCLEAR-1
Date
Sep. 30, 2011
PREPARED BY A. Gandrik
SIZE
LTR
TYPE Process Flow Diagram
SweepAir
Recuperator
WaterPump
Exchangewith NuclearHeat Source
Recuperator
Exchangewith NuclearHeat Source
Water
H2 &Steam
H2
O2 &Sweep
Air
Cooler
Separator
CWCW
Water
High-Temperature
Electrolyzer
Air Compressor (Multi-Stage)
HotSweep
Gas
Steam& H2
H2
Tail Gas
Water Treatment
System
Separation
LPGProduct
Tail GasRecycle
H2
H2
Steam Generatedvia Heat
Recovery
BFW
BFW Pump
Generator
SaturatedSteam Turbines
����

Calculator Block ELECSUM
ELECTROLYSIS SUMMARY:
FEED SUMMARY:
H2O FEED: MASS FLOW = 1448890. LB/HR TEMPERATURE = 70. DEG. F PRESSURE = 14.7 PSI
PRODUCT SUMMARY:
H2 PRODUCT: MASS FLOW = 163068. LB/HR H2 PURITY = 99.92 MOL-% TEMPERATURE = 79. DEG. F PRESSURE = 710.7 PSI
O2 PRODUCT: MASS FLOW = 1285026. LB/HR O2 PURITY = 100.00 MOL-% TEMPERATURE = 79. DEG. F PRESSURE = 710.7 PSI
HEAT AND POWER SUMMARY:
ELECTROLYSIS POWER REQUIREMENT = 2511.8 MW
HEAT SUMMARY:
REACTOR HEAT: DUTY REQUIRED = 2330.2 MMBTU/HR HELIUM MASS FLOW = 2569270. LB/HR INLET TEMPERATURE = 1517. DEG. F OUTLET TEMPERATURE = 786. DEG F. PRESSURE DROP = -20.3 PSI
TOPPING HEAT: DUTY REQUIRED = 0.0 MMBTU/HR SYNGAS MASS FLOW = 4199040. LB/HR INLET TEMPERATURE = 1616. DEG. F OUTLET TEMPERATURE = 0. DEG F. PRESSURE DROP = 600.0 PSI
Calculator Block SUMMARY
FEED & PRODUCT SUMMARY:
FEEDS:
RAW COAL FEED RATE = 9354.1 TON/DY COAL HHV AS FED = 10934. BTU/LB COAL MOISTURE AS FED = 13.70 %
PROXIMATE ANALYSIS: MOISTURE 13.70 % FIXED CARBON 40.12 % VOLATILE MATTER 49.28 % ASH 10.60 %
ULTIMATE ANALYSIS: ASH 10.60 % CARBON 70.27 % HYDROGEN 4.84 %
����

NITROGEN 1.36 % CHLORINE 0.11 % SULFUR 3.72 % OXYGEN 9.10 %
SULFANAL ANALYSIS: PYRITIC 1.94 % SULFATE 0.08 % ORGANIC 1.70 %
INTERMEDIATES:
COAL FEED RATE AFTER DRYING = 8587.9 TON/DY COAL HHV AFTER DRYING = 11910. BTU/LB COAL MOISTURE AFTER DRYNG = 6.00 %
RAW SYNGAS MASS FLOW = 2188240. LB/HR RAW SYNGAS VOLUME FLOW = 932. MMSCFD RAW SYNGAS HHV (WET) = 239.4 BTU/SCF RAW SYNGAS HHV (DRY) = 277.0 BTU/SCF RAW SYNGAS COMPOSITION: H2 25.5 MOL.% CO 46.7 MOL.% CO2 7.7 MOL.% N2 5.5 MOL.% H2O 13.6 MOL.% CH4 20. PPMV H2S 7064. PPMV
QUENCHED SYNGAS MASS FLOW = 1997748. LB/HR QUENCHED SYNGAS VOLUME FLOW = 827. MMSCFD QUENCHED SYNGAS HHV (WET) = 268.9 BTU/SCF QUENCHED SYNGAS HHV (DRY) = 273.2 BTU/SCF QUENCHED SYNGAS COMPOSITION: H2 28.8 MOL.% CO 52.8 MOL.% CO2 9.6 MOL.% N2 6.4 MOL.% H2O 1.6 MOL.% CH4 22. PPMV H2S 7993. PPMV
CLEANED SYNGAS MASS FLOW = 1720988. LB/HR CLEANED SYNGAS VOLUME FLOW = 1425. MMSCFD CLEANED SYNGAS HHV (WET) = 310.4 BTU/SCF CLEANED SYNGAS HHV (DRY) = 310.5 BTU/SCF CLEANED SYNGAS COMPOSITION: H2 65.5 MOL.% CO 30.6 MOL.% CO2 0.1 MOL.% N2 3.7 MOL.% H2O 0.0 MOL.% CH4 14. PPMV H2S 0. PPMV
PRODUCTS:
LIQUID PRODUCTS PRODUCED = 516180. LB/HR LIQUID PRODUCTS PRODUCED = 6194.2 TON/DY DIESEL = 374138. LB/HR DIESEL = 4490. TON/DY NAPHTHA = 112920. LB/HR NAPHTHA = 1355. TON/DY LPG = 29122. LB/HR LPG = 349. TON/DY
����

LIQUID PRODUCTS PRODUCED = 50002. BBL/DY DIESEL = 35194. BBL/DY NAPHTHA = 11810. BBL/DY LPG = 2998. BBL/DY LIQUIDS PRODUCED / COAL FED = 0.66 LB/LB LIQUIDS PRODUCED / COAL FED = 5.35 BBL/TON
FUEL PROPERTIES: DIESEL NAPHTHA LPG PROD. RATE, BBL/DAY 35194. 11810. 2998. LHV RATE, MMBTU/DAY 170016. 51098. 13285. MW 188.2 80.8 59.8 API GRAVITY 54.3 81.8 DENSITY, LB/GAL 6.07 5.46 5.55 CETANE N0. 94.3 28.3 HHV CONTENT, BTU/LB 20369. 20351. 20542. LHV CONTENT, BTU/LB 18934. 18855. 19008. % CARBON 84.7 82.2 81.4 D86T CURVE, DEG. C: 0% 147. -113. 10% 182. 21. 20% 200. 50. 50% 248. 81. 90% 327. 120. 100% 355. 162.
POWER CALCULATIONS:
POWER GENERATORS: SATURATED TURBINE POWER OUTPUT = 401.7 MW TOTAL POWER GENERATED = 401.7 MW
POWER CONSUMERS: COAL PROCESSING POWER CONSUMPTION = 9.5 MW ELECTROLYSIS POWER CONSUMPTION = 2511.8 MW PRIMARY CIRC. POWER CONSUMPTION = 18.5 MW SECONDARY CIRC. POWER CONSUMPTION = 23.0 MW GASIFIER POWER CONSUMPTION = 18.1 MW GAS CLEANING POWER CONSUMPTION = 59.7 MW SCOT PROCESS POWER CONSUMPTION = 3.8 MW CLAUS POWER CONSUMPTION = 0.5 MW CO2 LIQUEF. POWER CONSUMPTION = 19.6 MW FISHER TROPSCH POWER CONSUMPTION = 28.0 MW REFINERY POWER CONSUMPTION = 15.1 MW POWER BLOCK POWER CONSUMPTION = 2.6 MW REFRIGERATION POWER CONSUMPTION = 26.2 MW COOLING TOWER POWER CONSUMPTION = 18.5 MW WATER TREATMENT POWER CONSUMPTION = 13.0 MW TOTAL POWER CONSUMED = 2767.9 MW
NET PLANT POWER (+ GEN, - CONS)= -2366.3 MW
WATER BALANCE:
EVAPORATIVE LOSSES: CMD WATER NOT RECOVERED = 151.7 GPM COOLING TOWER EVAPORATION = 17086.5 GPM ZLD SYSTEM EVAPORATION = 595.8 GPM TOTAL EVAPORATIVE LOSSES = 17834.0 GPM
WATER CONSUMED: ELECTROLYSIS FEED = 2895.5 GPM GASIFIER ISLAND MAKEUP = 0.0 GPM BOILER FEED WATER MAKEUP = 204.3 GPM COOLING TOWER MAKEUP = 15730.3 GPM
����

TOTAL WATER CONSUMED = 18830.1 GPM
WATER GENERATED: GASIFIER ISLAND BLOWDOWN = 442.6 GPM SYNGAS CONDENSER BLOWDOWN = 71.8 GPM RECTISOL BLOWDOWN = 51.6 GPM SULFUR REDUCTION BLOWDOWN = 28.1 GPM FT PROCESS BLOWDOWN = 1614.7 GPM REFINERY PROCESS BLOWDOWN = 1.9 GPM COOLING TOWER BLOWDOWN = 1757.2 GPM TOTAL WATER GENERATED = 3967.9 GPM
PLANT WATER SUMMARY: NET MAKEUP WATER REQUIRED = 15453.6 GPM WATER CONSUMED / COAL FED = 9.92 LB/LB WATER CONSUMED / LIQUID PRODUCT = 10.6 BBL/BBL
BYPRODUCTS SUMMARY:
SLAG = 668. TON/DY FLYASH = 280. TON/DY SULFUR = 298. TON/DY
CARBON BALANCE SUMMARY:
% CARBON TO LIQUID FUEL = 91.7 % % CARBON TO SLAG & FLYASH = 0.4 % % CARBON TO SEQ OR EOR = 0.0 % % CARBON TO HRSG TAILGAS = 7.1 % % UNACCOUNTED CARBON = 0.8 %
CO2 EMITTED = 1473. TON/DY CO2 EMITTED = 26. MMSCFD FROM REFINERY = 1473. TON/DY LHV TO REFINERY = 22012. MMBTU/DY CO2 EMMITED / LIQ PROD = 0.24 LB/LB CO2 EMMITED / COAL FED = 0.16 LB/LB
STARTUP FLARE SUMMARY:
CO2 FROM FLARE = 152. TON/DY LHV TO FLARE = 1083. MMBTU/DY
EFFICIENCY CALCULATIONS:
HEAT IN (HHV BASED): COAL HEAT CONTENT = 8523.3 MMBTU/HR
HEAT OUT (HHV BASED): NET POWER = -8074.0 MMBTU/HR LIQUID HEAT CONTENT = 10517.0 MMBTU/HR
PLANT EFFICIENCY (HHV BASED): EFFICIENCY = 28.7 %
HTGR SUMMARY:
850C SUMMARY - HEAT ONLY: 850C ROT NET HEAT = 664. MWT GROSS HEAT SUPPLIED = 683. MWT PRIMARY CIRC. PWR = 19. MWE
700C SUMMARY - ELECTRICITY ONLY: 700C ROT NET HEAT = 5440. MWT NET PWR SUPPLIED = 2366. MWT
����

PWR TO 850C PRI CIRC. = 19. MWE PWR TO PROCESS = 2348. MWE
����

HIERARCHY
CLAUS
HIERARCHY
CMD
HIERARCHY
CO2-COMP
HIERARCHY
COOL-TWR
HIERARCHY
ELECTROL
HIERARCHY
FT
HIERARCHY
GAS-CLN
HIERARCHY
GASIFIER
HIERARCHY
H2O-TRTM
HIERARCHY
REFINERY
HIERARCHY
RU
HIERARCHY
S-REDUCT
HIERARCHY
ST
7015
779505
COAL
7015
1948762
AIR-CMD1831160
244164
CO2-TRN2
23015
2012616 EXHAUST
22415
823000 DRY-COAL
21615
136816
CO2-VENT
81711
761575
O2-GFR
502700
102236
STM-GFR
187700
38309
CO2-FLT2
120150
MU-H2O
187650
307417 TG-REC2
187700
265878
CO2-REC2
46215
23357
FLYASH
19615
55672
SLAG186581
1997748
SYNGAS-1
10315
221499
GFR-SH2O
48328
33396
FT-NAP
428348
294587
FT-WAX
117338
211331
FT-MID-D
797117906
H2-REF2
7015
720016AIR-REF
62317
95810
TG-FH
Q-TPH2
Q
10415
374138
DIESEL
10415
112920
NAPHTHA
1402065930
REF-H2O
5333
59212
TG-REF
37615
815825 FH-EXH
104585
60570SRED-EX
186581
1997748
SYNGAS-2
79711
155034
H2-FT
189150
HG-ACCUM
10929
411555 CO2
12929
54999H2S
11625
25806
RECT-H2O
138400
1720988FT-SYNG
6815
41502
ENR-CLAU
37620
71643
CLAUS-EX
37515
24859SULFUR
49328534 FUELSRU1
6815
2342
ENR-SRED
79711128H2-SRED1
11315
14073
SCOT-H2O
7015
156438379
AIR-CT
6715
7871452
CT-MKUP
10415
163430531
CT-EX
8630
879299
CT-BD
48328
373669TG-FT115328
808003FT-H2O
12015
102236
BFW-MKUP
1831160
244164
CO2-TRN1
187700
38309
CO2-FLT1
187700
265898
CO2-REC1
104491
35944
COND-BD
10315
221499
GFR-BD
1402065930
REF-BD
11625
25806
RECT-BD
8630
879299
COOL-BD
6015
7732999MAKEUP
11315
14073
SCOT-BD
115328
808003
FT-BD
12015
102236
TO-HRSG
27515
298161
ZLD-EX
120150
TO-GFR
7015
7871452
TO-CT
7015
1448890
TO-ELEC
7015
1448890
H2OEFEED
15171015
2569270
HE-IN
Q-TPH1Q
81711
519284
O2-EX
79711
163068
H2-ELEC
7861036
2569270HE-OUT
230400
59212
TG-REF-2
49328
373135 TG-FT-2
82328
432347
TG-TOT
31325
432347TG-LPG2
-3320
403227TG-LPG3
-3320
29122
LPG
62317
403227TG-LPG-4
62317
307417
TG-LPG-5
187650
307417 TG-REC1
817114694
O2-CLS
7015
36808
AIR-CLAU
7015
2073AIR-SRED
81711268
O2-SRED
797117906
H2-REF1
817114962O2-ENR
15171015
2569270
HE-IN-2
CL-CHG-3
TG-MIX
REC-COMPW=3816
COOLERQ=-9
PRECOOLQ=12
TG-COMPW=4927
CLAU-MIX
SRED-MIX
TG-SPLT
H2-SPLT
O2-SPLT2
SRU-SPLT
IHXQ=2330
Temperature (F)
Pressure (psia)
Mass Flow Rate (lb/hr)
Q Duty (MMBtu/hr)
W Power(kW)
Warnings
Nuclear-Integrated Coal to Liquid Fuels
Reconcile
ReconcileReconcile
Reconcile
Reconcile
Reconcile
Reconcile
Reconcile
Reconcile
Reconcile
Color Legend
Water or Steam
CO2 Source
Nuclear Heat Use
���

7015
1448890
H2O-FEEDH2OEFEED(IN)
15171015
2569270HE
HE-IN(IN)
HEAT-2 Q-TPH1(OUT)
81711
519284O2-EX
O2-EX(OUT)
79711
163068
H2-ELEC1 H2-ELEC(OUT)
7861036
2569270HE-3
HE-OUT(OUT)
1476725
1446935
H2O-F-4
1472650
1446935
ELE-PROD
79711
1285026
O2-ELEC
77711
161910H2-ELEC
1472725
1448890
H2O-F-2
1476725
1448890
H2O-F-3
145740
1448890
H2O-F-1
761995
2569270HE-2
81711
1285822
O2-ELEC1
81711
766538
O2-PROC
1476725
1158 H2-SWP
1476725797
O2-SWP
RSTOIC
ELEC-1
Q=8601
SEP
ELEC-2
Q=-1239
COMPR
ELEC-PWRW=2511820
H2O-HTR4Q=0
H2O-HTR2Q=2409
O2-SPLT
HEATER
ELEC-CWQ=-1123
SWP-SPLT
H2-MIX
O2-MIX
HT-RQ=111
SEC-CIR
W=22991
COMPR
PRI-CIRCW=18531
Temperature (F)
Pressure (psia)
Mass Flow Rate (lb/hr)
Q Duty (MMBtu/hr)
W Power(kW)
Used to includeElectrolysis power requirement
and cooling water in utility calcs.
Electrolysis
Used to includeprimary circulator power
requirements.
���

7015
779505COAL-1
COAL(IN)
7015
1948762AIR-1
AIR-CMD(IN)
1831160
244164CO2
CO2-TRN2(IN)
23015
2012616DRYVENT2
EXHAUST(OUT)
22415
823000
COAL-10 DRY-COAL(OUT)
21615
136816
CO2-VNT6 CO2-VENT(OUT)
15015
779505
COAL-4
41817
1948762AIR-523015
2728268
COAL-5
23015
2012616DRY-VENT
23015
715652
COAL-6
230150
HG-BP
227650
823000COAL-9
7015
779505COAL-2
15015
779505COAL-3
9717
1948762 AIR-2
22615
823000
COAL-7
22615
107348 CO2-VNT4
22615
715652COAL-8
1831160
244164
CO2-1
227650
136816
CO2-VNT1
17715
107348
CO2-TRNS
17715
136816
CO2-VNT2
17715
29468
CO2-VNT3
21615
136816
CO2-VNT5
34017
1948762 AIR-3
39917
1948762 AIR-4
RYIELD
DRYER
Q=0
BAGHOUSE
SEP
HG-BYPASQ=-0
HG-MIX
PULVERIZ
W=3830
COMPR
PULV-PWR
W=3830
PULV-HT
AIR-BLWR
W=3755
SSPLIT
LOCK-HOP
SSPLIT
FEED-HOP
MIXER
N2-SPLT
CO2-VENT
CL-CHG-1
CL-CHG-2
LPS-HTRQ=115
FTS-HTRQ=28
MPS-HTRQ=9
CO2-MIX
Temperature (F)
Pressure (psia)
Mass Flow Rate (lb/hr)
Q Duty (MMBtu/hr)
W Power(kW)
PSD tracking droppedhere. Balance achievedusing Calculator block"PSD" and Transferblock "PSD".
Coal Milling & Drying
Used toincludepulverizerpower inutilitycalcs.
Ensure the outlettemperature is lessthan 485 F, otherwiseadjust the airflow to themill to be between 1.5and 3.5 times the coalrate. Increasing the airflowdecreases the inlet temperature. If the inlettemperature cannot be maintained below 485 anotherheat source must be used.
����

81
711
761575
O2-GFRO2-GFR(IN)
224
15
823000
COALDRY-COAL(IN)
502
700
102236
STM-GFRSTM-GFR(IN)
187
700
38309
CO2-FLTRCO2-FLT2(IN)
120
15
0
H2O-MKUPMU-H2O(IN)
187
650
307417
TG-RECTG-REC2(IN)
187
700
265878
CO2-RECCO2-REC2(IN)
462
15
23357FLY-ASH
FLYASH(OUT)
196
15
55672
SLAG SLAG(OUT)
186
581
1997748
SYNGAS SYNGAS-1(OUT)
103
15
221499
G-WAT-BD GFR-SH2O(OUT)
COAL-5ELEMENTS
HEAT
224
15
107348
GFR-CO2
2768
600
2260106GFR-EFF1
2800
600
2260106GFR-EFF2
2800
598
47431SLAG-1
2800
600
2212674
SYNG-1
464
593
4223474SYNG-4
462
586
4238426
SYNG-5
224
15
715652COAL-4
197
605
1992978
RECY-SG2
200
600
17891H2O-EVAP
1616
600
4223474
SYNG-2
521
596
4223474SYNG-3
184
581
1992978
RECY-SG1
104
15
153472
VG-1
230
600
146681
VENT-GAS
104
15
6791
LIQ-KO
104
15
8588319
G-WAT-4
104
15
8373611 G-WAT-5
104
15
214708
G-WAT-6
154
600
21970997
SCRUB-4
184
581
3844046SYNG-7
184
581
22365310 SCRUB-1
153
576
21970997SCRUB-3
184
581
13597386
SCRUB-2
184
581
8767923SCR-BD105
600
8373611
MU-H2O-1
576
0SCR-VENT
200
15
403914
SLAG-3
200
15
52702
SLAG-4
200
15
351211
B-WAT-1
104
30
374373
G-WAT-3
200
15
421805
SLAG-2
104
15
8965662
B-WAT-2
104
15
374373
G-WAT-2
184
581
1851068
SYNG-6
104
15
2970SOLIDS
104
15
8962692
G-WAT-1
DECOMPQ=-5932
GIBBSQ=5932
SEP
GFR-SEPQ=0
SEP
DSRQ=0
HT-LOSSQ=-77
ADJUSTQ=0
QNCH-MIX
FD-SPLT2
SC-1Q=-1776
SC-2Q=-87
RECY-CMP
W=2004
RE-COMPW=10547
GW-SPLT2
SCRUBBERQ=0 SCR-PUMP
W=567
SCR-SPLT
SCR-TANKQ=0
SEP
CON-SCRNQ=0
MIXER
SLG-QNCH
BW-TANKQ=-720
QCH-PUMPW=7
QCH-SPLT
SEP
SETTLERQ=-0
GW-SPLT
MU-PMP-1W=5010
SEP
H2O-EVAPQ=0
SLAG-MIX
SG-MIX
BD-MIX
Temperature (F)
Pressure (psia)
Mass Flow Rate (lb/hr)
Q Duty (MMBtu/hr)
W Power(kW)
Shell Gasifier w/ Heat Recovery
Gasifier Heat Recovery Water Scrub System
Water Handling System
May need evaporator &crystalizer here to treat aside stream for control ofdissolved solids.
���

104585
60570
SRED-GASSRED-EX(IN)
186581
1997748
SYNGASSYNGAS-2(IN)
79711
155034
H2-FTH2-FT(IN)
189150
HG-ACCUM HG-ACCUM(OUT)
10929
411555
CO2
CO2(OUT)
12929
55000
H2S H2S(OUT)
11625
25806
REC-H2O RECT-H2O(OUT)
138400
1720988 FT-SYNG
FT-SYNG(OUT)
189574
1997748SYNG-1
72556
1565958SYNG-3
176549
1565958
SYNG-4
300542
1565955
SYNG-5
300151
S-ADS
300535
1565954
SYNG-6
194528
1565954
SYNG-7
HG-BEDQ=0
SEP
RECTISOL
Q=-98
HEATER
R-CWU
Q=-451
COMPR
R-EU
W=59747
HEATER
RECHTUSE
Q=270 HX-2Q=71 S-BED
Q=0
HX-1Q=60
H2-MIX
Temperature (F)
Pressure (psia)
Mass Flow Rate (lb/hr)
Q Duty (MMBtu/hr)
W Power(kW)
Syngas Cleaning & Conditioning
Used to includeRectisol coolng water,
power, and steam requirements.
����

12929
54999
H2S-GASH2S(IN)
6815
41502
AIRENR-CLAU(IN)
37620
71643
TO-SCOT CLAUS-EX(OUT)
37515
24859
SULFUR SULFUR(OUT)
52127
96502
TO-SEP-1
37626
78669SEPGAS-1
37626
17833
S-1
50026
78669TO-RX-2
81824
78669RX-2-OUT
70224
78669
TO-SEP-2
37623
75808
SEPGAS-2
37623
2860S-2
41023
75808TO-RX-3
49821
75808RX-3-OUT
46621
75808
TO-SEP-3
37620
4166
S-3
81824
78669TO-COOL2
49821
75808TO-COOL3
213327
96502RX-1-OUT
213327
96502TO-COOL1
12929
54999TO-RX-1
0
RX-1-BP
23930
41502 AIR-2
COOL-1C
Q=-4
RX-2
Q=0
COOL-2D
Q=-7
RX-3
Q=0
COOL-3B
Q=-2
MIX
RGIBBS
PHASE-2
Q=9 RGIBBS
PHASE-3
Q=14
RGIBBS
PHASE-1
Q=50
H2S-SPLT
REHEAT-1Q=3
REHEAT-2Q=1
RX-1
Q=0
COOL-1AQ=-45
COOL-2AQ=-3
COOL-3AQ=-1
AIR-COMPW=500
Temperature (F)
Pressure (psia)
Mass Flow Rate (lb/hr)
Q Duty (MMBtu/hr)
W Power(kW)
Claus Process
Note: To simulate a straightthrough process rather than asplit-flow process, simplydeactivate design spec "TEMP"and change the temperature of"REHEAT-1" from 640°F to500°F (640°F is necessary tohydrolize COS and CS2 in split-flow configuraiton to protectsubsequent catalyst stagesfrom poisoning).
Note: Aspen seems to be lacking some thermodynamicproperties for S2, S3, S4, S5, S6, S7, and S8 related tovapor pressure that are necessary to perform a flashcalculation. For this reason, blocks "PHASE-1","PHASE-2", and "PHASE-3" are used to convert all ofthese compounds to S prior to the flash blocks. Notethat there is some enthalpy change associated withthis simplification, and it is neglected in this simulation.
Note: H2S-SPLT is currentlyadjusted manually to aid inconvergence.
����

49328534
FUEL-GASFUELSRU1(IN)
37620
71643
CLAUSGASCLAUS-EX(IN)
6815
2342
AIRENR-SRED(IN)
79711128
H2H2-SRED1(IN)
104585
60570
GAS-5 SRED-EX(OUT)
11315
14073
SCOT-H2O SCOT-H2O(OUT)
16317
72453
GAS-4
10417
11883H2O-5
37618
74647
GAS-3
16322
41610
H2O-3
16317
43800H2O-1
65019
74647
GAS-2
57220
74518
GAS-1
17824
2342AIR-1
16317
2190
H2O-4
16317
41610
H2O-2
11317
14073
H2O-6
TG-COMPW=3750
QUENCH
Q=-7
BOILER
Q=-6
REDUCEQ=0
PREHEAT
Q=0
AIR-COMPW=18
H2O-SPLT
PUMPW=0
H2O-MIX
PUMP-2
W=-0
MIX
Temperature (F)
Pressure (psia)
Mass Flow Rate (lb/hr)
Q Duty (MMBtu/hr)
W Power(kW)
Warnings
Catalytic Sulfur Reduction (SCOT or Beavon Process w/o H2S Absorber)
Preheat Burner
����

21615
136816CO2-REC1
CO2-VENT(IN)
10929
411555
CO2-INCO2(IN)
1831160
244164
CO2-GFR CO2-TRN1(OUT)
187700
38309
CO2-FLTR CO2-FLT1(OUT)
187700
265898
CO2-RECCO2-REC1(OUT)
34230
136816CO2-REC2
10430
136816CO2-REC3
187700
244164
CO2-2
104700
244164
CO2-3
187700
304207CO2-4
187700
548371
CO2-1
REC-COOL
Q=-7
REC-COMPW=1167
ST6-COOL
Q=-4
SPLT-2
SPLT-1
STAGE-7
W=1209STGS-1-6
W=17176
Temperature (F)
Pressure (psia)
Mass Flow Rate (lb/hr)
Q Duty (MMBtu/hr)
W Power(kW)
CO2 Liquefaction
(7-Stages Total; Efficiency = 84.4)
����

138400
1720988SYNGAS-1
FT-SYNG(IN)
48328
373669
FT-TG TG-FT(OUT)
428348
294587
FT-WAXFT-WAX(OUT)
117338
211331
FT-MID-D FT-MID-D(OUT)
48328
33396
FT-NAP FT-NAP(OUT)
115328
808003
FT-WATER FT-H2O(OUT)
428393
4952878
SYNGAS-2
FT-HX
428353
4952878
FT-PROD1
FT-MPS-1
Q
376343
4658291
FT-GAS-2
117338
3654042
FT-GAS-3
117338
792916WATER-2
428348
4658291
FT-GAS-1
3480
WATER-1
41333
3654042
FT-GAS-4
48328
3605559FT-GAS-5
48328
15086WATER-3
FT-REF-1
Q
48328
3231890
REC-GAS1119475
3231890
REC-GAS2
117338
792916
H2O-MIX1
FT-RX-1Q=-3177
MID-SEP1
Q=-1408
COOL-1Q=-117
WAX-SEP1
Q=0
NAP-SEP1Q=0
COOL-2Q=-129
GAS-SPLT
REC-COMPW=27957
H2O-MIX1 H2O-MIX2
SG-PRHT1
Q=781
Temperature (F)
Pressure (psia)
Mass Flow Rate (lb/hr)
Q Duty (MMBtu/hr)
W Power(kW)
Fischer Tropsch Synthesis
����

HIERARCHY
HYDCRACK
HIERARCHY
HYDTREAT
48
328
33396
FT-NAPFT-NAP(IN)
428
348
294587
FT-WAXFT-WAX(IN)
117
338
211331
FT-MID-D FT-MID-D(IN)
79
711
7906
H2-REFT H2-REF2(IN)
70
15
720016
AIR-REFAIR-REF(IN)
62
317
95810
TG-FH-2TG-FH(IN)
Q-ETPHQ-TPH2(IN)
104
15
374138
DIESEL-4DIESEL(OUT)
104
15
112920
NAPHTHA3NAPHTHA(OUT)
140
2065
930
REF-H2O REF-H2O(OUT)
53
33
59212
TAILGAS TG-REF(OUT)
376
15
815825
FH-EXH-3FH-EXH(OUT) 376
343
408423
HC-WAX2
79
711
5519
H2-CRAK
449
1
391709
HCRACK
865
0
HCRACK-W
140
110
22216 H2-HCPRG
Q-REBL2
79
711
2386H2-TREAT
140
110
5533H2-HTPRG
140
2065
207253
HTREAT 140
2065
930
HTREAT-W
104
0
374138
DIESEL-3
376
2
374138
DIESEL-2
465
4
374138
DIESEL
495
39
487974
ATM-BOT
595
5
113836
BOT-WAX
Q-REBOIL
598
348
113836BOT-WAX2
124
33
526029
COL-FEED
Q-FURN
189
17
38054
TOP-NAPH
104
34
12639HCRACK-5
104
34
308475
HCRACK-3
124
33
2339FLSHGAS1
33
0
H2O
COL-HEAT
800
15
815825FH-EX-1800
15
815825
FH-EXHST
150
17
79525
NAPHTHA1
129
17
112920
NAPHTHA2
48
33
41470
HCHT-NAP
477
348
408423
HC-WAX
376
1
391709
HCRACK-1
104
0
83234 CRAK-GAS 104
0
308475 HCRACK-2
104
4
12639HCRACK-4
137
34
22216H2HCPRG2
140
34
5533H2HTPRG2
104
34
70595
CRAKGAS2
48
33
56873CRAKGAS3
521
15
815825
FH-EXH-2
D-PUMPW=8
D-COOL2Q=-88
D-COOL1Q=-33
VAC-COLQC=-175QR=215QF=0
BOT-PUMPW=83
ATM-COLQC=-18QR=137
FLASHQ=0
FIRED-HTQ=-753
RSTOIC
NOX-ADJQ=0
Q
MIXER
HEAT-MIX
NAP-MIX NAP-MIX2
WAX-MIX
HC-SEPQ=-81
HC-PUMP2W=1
NAP-SEPQ=-4
HC-VLVE
HT-VLVE
TG-MIX
H2-SPLT
HC-PUMPW=16
CG-COMPW=2887
H2O-MIX
NAP-COOLQ=-3
CRK-COOLQ=-31
WAX-COOLQ=-27
MPS-GENQ=-65
LPS-GENQ=-33
Temperature (F)
Pressure (psia)
Mass Flow Rate (lb/hr)
Q Duty (MMBtu/hr)
W Power(kW)
Product Upgrading and Refining
����

376343
408423
WAXHC-WAX2(IN)
79711
5519
H2-CRAK H2-CRAK(IN)
4491
391709
HRACK-7 HCRACK(OUT)
8650H2O
HCRACK-W(OUT)
140110
22216
H2-PURGE H2-HCPRG(OUT)
Q-REBL Q-REBL2(OUT)
3781076
408423
WAX-2
18510768960H2-CRAK4
6191076
204214CRK-WAX2
7001066
621586
WAX-3
HEAT
7021028
621586HCRACK
7581028
621586
HCRACK-2
5401026
621586
HCRACK-3
6142
204214
CRK-WAX
3491026
621586
HCRACK-4
140865
25656H2-REC
140865
595930
HCRACK-5
140855
3440
H2-REC2
120855
5519
H2-CRAK2
128855
8960
H2-CRAK3
3311
595922
HCRACK-7
1171
595922
HCRACK-6
WAX-PMP1W=495
HC-PRHTQ=125
HCRAK-R1Q=0
HCRAK-R2Q=0
HC-RECPQ=-125
WAX-PMP2W=424
H2-FLASHQ=-81
PSAQ=0
H2-MIX
H2-COMPW=233
H2-COMP2W=521
HCRK-FRCQC=-312QR=402QF=0
HC-VLVE
COMPR
PSA-PWR
W=3
RECUP
Q=87
Temperature (F)
Pressure (psia)
Mass Flow Rate (lb/hr)
Q Duty (MMBtu/hr)
W Power(kW)
Used to includePSA power requirement
in utility calcs.
Hydrocracking
���

79711
2386
H2TRT H2-TREAT(IN)
117338
211331
MDFT-MID-D(IN)
140110
5533
H2-PURGE H2-HTPRG(OUT)
1402065
207253
HTREAT-3 HTREAT(OUT)
1402065930
H2O HTREAT-W(OUT)
1252290
211331
MD-2
22622909613H2TRT-4
6452280
220944
MD-3
HEAT
7382245
220944
HTREAT
2782245
220944
HTREAT-2
1402065
12760 H2-REC
14020557227
H2-REC2
36620552386
H2TRT-2
19620559613
H2TRT-3
HT-PUMPW=718
HT-PRHT
Q=93
HT-RECP
Q=-93HTREAT-R
Q=0
PSAQ=0
H2-COMPW=703
H2-COMP2W=297
H2-MIX
H2-FLASH
Q=-22COMPR
PSA-PWR
W=4
Temperature (F)
Pressure (psia)
Mass Flow Rate (lb/hr)
Q Duty (MMBtu/hr)
W Power(kW)
Used to includePSA power requirement
in utility calcs.
Hydrotreating
���

12015
102236
MAKEUP BFW-MKUP(IN)
417300
294273FT-DA
16417
5586645BFW-1
21717
5880918
BFW-3
21717
1933717
MPGEN-121717
257811
LPGEN-1
21717
3689390FTGEN-1
10517
4314806CON-4
503700
13145
MP-COND
217150
257811
LPGEN-2
217300
3689390
FTGEN-2
218700
1933717
MPGEN-2
503700
1818336MP-STM-2417300
1818336
T-EFF-1
417300
1686979KO-1-VAP
417300
2610276FT-STM-3
358150
4297256
T-EFF-2
358150
4170825 KO-2-VAP
358150
41745LP-STM-2
1051
4212570T-EFF-3
417300
144502
CON-1
358150
1055774
CON-2
1051
4314806CON-3
417300
2904549
FT-STM-2
503700
1933717
MP-STM
417300
3689390
FT-STM
358150
257811
LP-STM
417300
784841FT-USRS
417300
784841
FT-COND503700
13145
MP-USRS
358150
216065
LP-USRS
358150
216065
LP-COND
417300
3689390
FT-STM-1
0FT-INJ
358150
257811
LP-STM-1
0LP-INJ
503700
1933717
MP-STM-1
503700
102236
MP-INJ
DABFW-SPLT
COND-MIX
LP-PUMPW=43
FT-PUMPW=1103
MP-PUMPW=1409
S-TURB-1W=-29898
S-TURB-2W=-58247
S-TURB-3W=-313533
KO-1Q=0 KO-2
Q=0
CONDSR-2Q=-3616
C-PUMP-2W=71
FT-SPLT2
MP-GENQ=1961
FT-GENQ=3750
LP-GENQ=260
FT-USEQ=-635
MP-USEQ=-9
LP-USEQ=-187
FT-SPLT1
LP-SPLT1
MP-SPLT1
Temperature (F)
Pressure (psia)
Mass Flow Rate (lb/hr)
Q Duty (MMBtu/hr)
W Power(kW)
Steam Turbines
Saturated Steam Turbines
Note: If you change the design specthat controls the deaerator temperature,be sure to update the utility inlet specsfor all three steam levels.
����

7015
156438379
AIR-1AIR-CT(IN)
6715
7871452
MU-H2OCT-MKUP(IN)
10415
163430531
AIR-3 CT-EX(OUT)
8630
879299
BLOWDOWN CT-BD(OUT)
10330
484996116
CWR-3
HEAT
10415
478003964
CWS-1
10415
163430531AIR-2
10315
484996116
CWR-2
8615
485875415
CWS-3
8630
485875415
CWS-4
8630
122124832
CWS-6
12225
122124832CWR-1
8615
485875415
CWS-2
8630
484996116
CWS-5
9625
362871285
CWR-1-C
8630
362871285
CWS-6-C
CT-FLASH
Q=10153
CT-PUMPW=7259
CWS-PUMPW=7545
CT-FANW=3696
CW-USERSQ=4386
CT-COOLQ=-10153
BLOWDOWN
COLDWELL
Q=0
HOT-WELL
CW-USERCQ=3616
Temperature (F)
Pressure (psia)
Mass Flow Rate (lb/hr)
Q Duty (MMBtu/hr)
W Power(kW)
Warnings
Cooling Tower���

104491
35944COND-1
COND-BD(IN)
10315
221499GFR-1
GFR-BD(IN)
1402065930REF-1
REF-BD(IN)
11625
25806RECT-1
RECT-BD(IN)
8630
879299COOL-1
COOL-BD(IN)
6015
7732999MKUP-1
MAKEUP(IN)
11315
14073SCOT-1
SCOT-BD(IN)
115328
808003
FT-1
FT-BD(IN)
12015
102236
TO-HRSGTO-HRSG(OUT)
27515
298161
EVAP-EXHZLD-EX(OUT)
120150TO-GFR
TO-GFR(OUT)
7015
7871452TO-CT
TO-CT(OUT)
7015
1448890
TO-ELEC TO-ELEC(OUT)
10515
35944COND-2
10515
35944COND-3
11215
834739DGST-EFF27242
16259SCOT-3
11815
1108441BIO-EFF
12315
879299COOL-2
12015
1689579RO-EFF
12015
298161
RO-BD
12015
102236
TO-BFW
6015
7732999MKUP-2
12015
1587343
TO-MKUP
29460
2350
LPS
11345
14073SCOT-2
26739
164
S-GAS
MIXER
CN-OXYL
MIXER
NH3-NH4
MIXER
BIOTREAT
FSPLIT
UF-RO
MIXER
POLISH
MIXER
DIGESTER
HEATER
ZLDQ=336
MIXER
SOFTEN
MIXER
CLARIFY
SPLIT
S-STRIP
QC=-0QR=0
PUMPW=1
COMPR
PWR-CALCW=13016
SPLIT2
Temperature (F)
Pressure (psia)
Mass Flow Rate (lb/hr)
Q Duty (MMBtu/hr)
W Power(kW)
Routed backto Claus
Simplified Water Treatment
����

300226
322074
NH3-VAP1
104224
322074
NH3-LIQ1
-3512
322074
NH3-VAP2
-4110
322074NH3-VAP3
CONDENSR
Q=-195
VALVEEVAPORTR
Q=142
COMPRESR
W=26169
Temperature (F)
Pressure (psia)
Mass Flow Rate (lb/hr)
Q Duty (MMBtu/hr)
W Power(kW)
Refrigeration Unit
3-Stages;Efficiency=75%
����

Conventional G
TL
N
uclear Integration G
TL
Inputs
Natural G
as Feed Rate (M
MSC
FD) 1
427 390
%
Carbon to Liquid Product
71.9%
79.3%
# H
TGR
s (600 MW
t )N
/A
0.75 O
utputsTotal Liquid Products (bbl/day)t
49,994 49,998
Diesel
34,581 35,410
Naphtha
11,892 11,674
LPG
3,521 2,914
Utility Sum
mary
Total Power (M
W)
66.6 69.7
Power C
onsumed
-330.1 -402.3
Secondary H
elium C
irculator N
/A
-48.4
ASU
-132.7
-131.3
Natural G
as Reform
ing -68.0
-68.9
CO
2 Com
pression/Liquefaction N
/A
-11.7
Fischer Tropsch & R
efining Processes -53.8
-60.3
Refrigeration
-41.5 -47.1
C
ooling Tower
-18.8 -20.8
W
ater Treatment
-15.4 -13.9
Power G
enerated 396.7
471.9
Saturated Turbines 396.7
471.9 W
ater Requirements 2
Water C
onsumed (gpm
) 13,790
14,552
W
ater Consum
ed/lb Feed (lb/lb) 8.55
9.86
W
ater Consum
ed/bbl Product (bbl/bbl) 9.5
10.0 C
O2 Sum
mary
Total CO2 Produced (ton/day)
7,164 4,190
Emitted
7,164 841
Capturable
N/A
3,349
Nuclear Integration Sum
mary
Electricity (MW
) N
/A -13.9
HTG
R H
ouse Loads N
/A
-13.9 B
alance of Fossil Plant N
/A
N/A
H
TGR H
eat Use (M
MBTU
/hr)N
/A 1,633
Reform
er N
/A
1,057 R
efinery N
/A
741 From
Secondary Circulator
N/A
-165
1Standard temperature of 60 degrees F.
2Does not include w
ater usage for HTG
R.
����

D
C
B
A
4 3 2 1
D
C
B
A
4 3 2 1
Conventional Gasto Liquids Process with
Recycle
Natural Gas9,690 ton/day427 MMSCFD
Water13,225 gpm
CO2 Emitted7,619 ton/day
Electricity Produced46 MWe
Products Produced49,995 bbl/day Liquids
34,582 Diesel11,891 Naphtha
3,521 LPG
Nuclear AssistedGas to Liquids Process
with Recycle
449 MWt HTGR1 – 449 MWt 700°C – Heat
Natural Gas8,862 ton/day390 MMSCFD
Water13,250 gpm
CO2 Emitted841 ton/day
Products Produced50,001 bbl/day Liquids
35,412 Diesel11,675 Naphtha
2,914 LPG
Nuclear Heat479 MWt
D
C
B
A Gas to LiquidsSummary Comparison
SHEET 1 OF 1
REV
2
DWG NO
GTL-SUM-1
Date
Sep. 30, 2011
PREPARED BY A. Gandrik
SIZE
LTR
TYPE Summary Diagram
Electricity Produced46 MWe
Capturable CO23,349 ton/day
����

Preforming & AutothermalReforming
Air Separation
Fischer-TropschSynthesis
ProductUpgrading &
Refining
NaturalGas Syngas FT
Liquids
TailGas
TailGas
LPGNaphthaDiesel
O2
N2
Air
D
C
B
A
4 3 2 1
D
C
B
A
4 3 2 1
Gas to Liquids
SHEET 1 OF 1
REV
2
DWG NO
GTL-BFD-1
Date
Sep. 30, 2011
PREPARED BY A. Gandrik
SIZE
LTR
TYPE Block Flow Diagram
SulfurRemoval
GasMix
SteamPlantWater
Treatment
PowerProduction
Tail GasRecycle
CoolingTowers
����

BFW
BFW Pump
Generator
SaturatedSteam Turbines
Compression
Gas
Separation
Water
HeavyLiquids
MiddleDistillate
&Light
Liquids
Hydrocracker
DistillationColumns Heavy
Liquids
NaphthaProduct
DieselProduct
F-TReactor
Compression
H2
BFW
Steam
CryogenicASU &
O2Compression
Air
O2
N2
PSA
Separation
LPGProduct
Hydrotreater
D
C
B
A
4 3 2 1
D
C
B
A
4 3 2 1
Gas to Liquids
SHEET 1 OF 1
REV
2
DWG NO
GTL-PFD-1
Date
Sep. 30, 2011
PREPARED BY A. Gandrik
SIZE
LTR
TYPE Process Flow Diagram
Fired Heater
GasCompressor
NaturalGas
SulfurRemoval
Pre-Reforming
Steam
Air
LightGas
AutothermalReformer
Exhaust
SynthesisGas
BFW
Steam
Light GasRecycle
SaturatedSteam
Compression
CO H2
TailGas
TailGas
Water Treatment
System
����

Calculator Block SUMMARY
FEED SUMMARY:
NATURAL GAS PROPERTIES:
MASS FLOW = 9690. TON/DY VOLUME FLOW = 427. MMSCFD @ 60°F HHV = 23063. BTU/LB HHV = 1047. BTU/SCF @ 60°F ENERGY FLOW = 446948. MMBTU/DY
COMPOSITION: METHANE = 93.571 MOL.% ETHANE = 3.749 MOL.% PROPANE = 0.920 MOL.% BUTANE = 0.260 MOL.% PENTANE = 0.040 MOL.% HEXANE = 0.010 MOL.% NITROGEN = 1.190 MOL.% OXYGEN = 0.010 MOL.% CO2 = 0.250 MOL.% C4H10S = 1. PPMV C2H6S = 0. PPMV H2S = 0. PPMV
PRODUCTS:
LIQUID PRODUCTS PRODUCED = 519998. LB/HR LIQUID PRODUCTS PRODUCED = 6240.0 TON/DY DIESEL = 368066. LB/HR DIESEL = 4417. TON/DY NAPHTHA = 115035. LB/HR NAPHTHA = 1380. TON/DY LPG = 36897. LB/HR LPG = 443. TON/DY LIQUID PRODUCTS PRODUCED = 49994. BBL/DY DIESEL = 34581. BBL/DY NAPHTHA = 11892. BBL/DY LPG = 3521. BBL/DY LIQUIDS PRODUCED / NATURAL GAS FED = 0.64 LB/LB LIQUIDS PRODUCED / NATURAL GAS FED = 117.14 BBL/MMSCF
FUEL PROPERTIES: DIESEL NAPHTHA LPG PROD. RATE, BBL/DAY 34581. 11892. 3521. LHV RATE, MMBTU/DAY 167237. 48894. 13289. MW 189.9 78.6 56.2 API GRAVITY 54.1 94.9 DENSITY, LB/GAL 6.08 5.53 5.99 CETANE N0. 95.9 35.7 HHV CONTENT, BTU/LB 20366. 19110. 16216. LHV CONTENT, BTU/LB 18932. 17710. 15007. % CARBON 84.7 79.0 70.1 D86T CURVE, DEG. C: 0% 148. -104. 10% 184. 16. 20% 202. 46. 50% 251. 83. 90% 327. 125. 100% 355. 177.
POWER CALCULATIONS:
POWER GENERATORS:
���

SATURATED TURBINE POWER OUTPUT = 396.7 MW TOTAL POWER GENERATED = 396.7 MW
POWER CONSUMERS: ASU POWER CONSUMPTION = 132.7 MW NG REFORMER POWER CONSUMPTION = 68.0 MW FISHER TROPSCH POWER CONSUMPTION = 37.1 MW REFINERY POWER CONSUMPTION = 11.7 MW POWER BLOCK POWER CONSUMPTION = 5.0 MW REFRIGERATION POWER CONSUMPTION = 41.5 MW COOLING TOWER POWER CONSUMPTION = 18.8 MW WATER TREATMENT POWER CONSUMPTION = 15.4 MW TOTAL POWER CONSUMED = 330.1 MW
NET PLANT POWER (+ GEN, - CONS)= 66.6 MW
WATER BALANCE:
EVAPORATIVE LOSSES: COOLING TOWER EVAPORATION = 16721.9 GPM ZLD SYSTEM EVAPORATION = 806.4 GPM TOTAL EVAPORATIVE LOSSES = 17528.3 GPM
WATER CONSUMED: BOILER FEED WATER MAKEUP = 1927.3 GPM COOLING TOWER MAKEUP = 16432.6 GPM TOTAL WATER CONSUMED = 18359.9 GPM
WATER GENERATED: NATURAL GAS REFORMING BLOWDOWN = 1900.2 GPM FT PROCESS BLOWDOWN = 1606.7 GPM REFINERY PROCESS BLOWDOWN = 1.6 GPM COOLING TOWER BLOWDOWN = 1867.5 GPM TOTAL WATER GENERATED = 5376.0 GPM
PLANT WATER SUMMARY: NET MAKEUP WATER REQUIRED = 13790.2 GPM WATER CONSUMED / NATURAL GAS FED = 8.55 LB/LB WATER CONSUMED / LIQUID PRODUCT = 9.5 BBL/BBL
CARBON BALANCE SUMMARY:
% CARBON TO LIQUID FUEL = 71.9 % % CARBON TO TAILGAS = 27.3 % % UNACCOUNTED CARBON = 0.7 %
CO2 EMITTED = 7164. TON/DY CO2 EMITTED = 125. MMSCFD FROM REFINERY = 2822. TON/DY LHV TO REFINERY = 21740. MMBTU/DY FROM REFORMER = 4342. TON/DY LHV TO REFORMER = 33452. MMBTU/DY CO2 EMMITED / LIQ PROD = 1.15 LB/LB CO2 EMMITED / NATURAL GAS FED = 0.01 LB/LB
STARTUP FLARE SUMMARY:
CO2 FROM FLARE = 134. TON/DY LHV TO FLARE = 2073. MMBTU/DY
EFFICIENCY CALCULATIONS:
HEAT IN (HHV BASED): NATURAL GAS HEAT CONTENT = 18622.9 MMBTU/HR
���

HEAT OUT (HHV BASED): NET POWER = 227.3 MMBTU/HR LIQUID HEAT CONTENT = 10292.7 MMBTU/HR
PLANT EFFICIENCY (HHV BASED): EFFICIENCY = 56.5 %
Calculator Block NG-RFMR Hierarchy: NG-RFMR
SULFUR REMOVAL CONDITIONS:
INLET BED TEMPERATURE = 757. °F
PREFORMER CONDITIONS:
INLET TEMPERATURE = 915. °F STEAM TO CARBON MOLAR RATIO = 1.00
AUTOTHERMAL REFORMER CONDITIONS:
INLET TEMPERATURE = 1092. °F STEAM TO CARBON MOLAR RATIO = 0.94 OXYGEN TO CARBON MOLAR RATIO = 0.57 OUTLET TEMPERATURE = 1870. °F H2/CO PRE PSA = 2.219 (H2 - CO2)/(CO + CO2) = 1.520 H2/CO POST PSA= 2.138
OUTLET COMPOSITION (PRE-CONDENSER): H2 47.3123 MOL.% CO 21.3198 MOL.% CO2 5.9098 MOL.% H2O 24.1853 MOL.% CH4 0.6451 MOL.%
OUTLET COMPOSITION (POST-PSA): H2 61.3647 MOL.% CO 28.7014 MOL.% CO2 7.9550 MOL.% H2O 0.2753 MOL.% CH4 0.8685 MOL.% INERTS 8.7880 MOL.%
����

HIERARCHY
ASU
HIERARCHY
COOL-TWR
HIERARCHY
FT
HIERARCHY
H2O-TRTM
HIERARCHY
NG-RFMR
HIERARCHY
REFINERY
HIERARCHY
RU
HIERARCHY
ST
47333
43966
FT-NAP
428353
270755
FT-WAX
117343
229814
FT-MID-D
104395
7803
H2-REF2
7015
717317AIR-REF
59322
177858
TG-FH
10415
368066
DIESEL
10615
115035
NAPHTHA
1402065785
REF-H2O
5333
68443
TG-REF
37615
895175
FH-EXH
7015
175464050
AIR-CT
6915
8222856
CT-MKUP
10015
182746537
CT-EX
8630
934511
CT-BD
7015
4982100
AIR-ASU
9917
3347785N2-1
9517
955462OXYGEN
9517
645800 ENR-AIR
10494
33053
ASU-BD
104405
2176797
SYNGAS-1
47333
828075TG-FT
115333
804009FT-H2O
11315
964414
BFW-MKUP
1402065785
REF-BD
8630
934511
COOL-BD
6015
6900639
MAKEUP
104405
950850
RFMR-BD
115333
804009
FT-BD
11315
964414
TO-HRSG
23015
403523
ZLD-EX
6915
8222856
TO-CT
70315
807479
NAT-GAS
5951500
964414
STM-RFMR
7015
1103727
AIR-RFM
59322
273668
LG-ATRPH
59322
408095LG-REC
104405
950850RFMR-H2O
37617
1377396
RFMR-EXH
104395
7802
H2-REF1
287340
68443
TG-REF-2
79333
896518
TG-TOT
27330
896518TG-LPG2
-3325
859621TG-LPG3
-3325
36897
LPG
59322
859621
TG-LPG-4
59322
681763
TG-REC1
59322
681763
TG-REC2
TG-MIX
REC-COMPW=3820
COOLERQ=-12
PRECOOLQ=18
TG-SPLT
NG-SPLT
Temperature (F)
Pressure (psia)
Mass Flow Rate (lb/hr)
Q Duty (MMBtu/hr)
W Power(kW)
Warnings
Conventional Natural Gas to Liquid Fuels
Reconcile
Reconcile
Reconcile
Reconcile
Color Legend
Water or Steam
CO2 Source
���

7015
4982100AIR
AIR-ASU(IN)
9917
3347785N2
N2-1(OUT)
9517
955462O2
OXYGEN(OUT)
9517
645800WASTE
ENR-AIR(OUT)
10494
33053BLOWDOWN
ASU-BD(OUT)
10494
4949047
AIR-3
10494
4602614
AIR-3B
10494
346433AIR-3A
104109
346433
AIR-5
-29617
3347785N2-1
-29517
955462
O2-1
-30717
645800
C2-WASTE
-274102
346433AIR-6
-27887
4602614
TO-HPCOL
10494
4982100
AIR-2
10494
33053
MS-LIQ
-29517
955462
LPCOLBOT
10494
4982100AIR-1
940KO-LIQ -311
17346433
TO-LPCOL
-31817
1979124
HP-TOP-3
-31017
2623490 HP-BOT-2
-31817
3347785
LPCOLTOP
-28687
1979124
HPCOLTOP
-27987
2623490
HPCOLBOT
-28687
1979124
HP-TOP-1
-31287
1979124HP-TOP-2
-31217
2623490HP-BOT-1
138109
346433AIR-4
AIR-SPLT
H-EXQ=472
MOLSIEVE
COLD-1BQ=86
ACOMP-1
W=133293
KO-DRUM
H20-MIX
LP-COL
QC=0QR=204
HP-COL
QC=-204QR=0
COLD-1AQ=-86
VALVE-2
VALVE-1
COLD-2BQ=19
COLD-2AQ=-84
ACOMP-2
W=830
CW-EXCHQ=-3
COLD-2CQ=64
A-EXPAND
W=-1441
Temperature (F)
Pressure (psia)
Mass Flow Rate (lb/hr)
Q Duty (MMBtu/hr)
W Power(kW)
Air Separation Unit
4-Stages;Efficiency=83%
Efficiency=83%
����

70
315
807479
NAT-GASNAT-GAS(IN)
595
1500
964414
STEAMSTM-RFMR(IN)
95
17
955462
OXYGENOXYGEN(IN)
70
15
1103727
AIR-BNRAIR-RFM(IN)
59
322
273668
LG-BNRLG-ATRPH(IN)
59
322
408095
LG-RECLG-REC(IN)
104
405
950850
RFMR-H2O RFMR-H2O(OUT)
104
405
2176797
SYNGAS SYNGAS-1(OUT)
376
17
1377396
BNR-EXH5 RFMR-EXH(OUT)
104
395
7802
H2-REFIN H2-REF1(OUT)
757
456
1222454 LG-6
70
15
2
S-CAPTUR
757
449
1222452
LG-7
137
470
1215574LG-2105
470
6880
H2O-RFMR
127
470
1222454LG-4
626
449
2186866
LG-8
230
470
955462
OXYGEN-2
104
405
6880
WATER-2
137
470
1215574
LG-1
488
439
2186866
LG-10
906
439
2186866
LG-11
915
442
2186866
LG-9
1092
432
3142328
ATHMR
1870
425
3142328SG
376
410
3142328
SG-4
104
405
2184598SG-5
104
405
957729H2O-COND
614
420
3142328SG-2
104
458
0
CO2P-CON
107
0
SG-H2O
104
405
6880
WATER-1
104
458
0CO2-P-5
1202
432
2186866LG-12
392
465
955462 O2-ATR-2
230
470
955462
O2-ATR
230
470
0
O2-CO2-P
366
470
1CO2PFEED
2209
467
2
CO2-P
137
470
0
LG-3
614
464
2CO2-P-2
376
461
2CO2-P-3
376
461
0
CO2-P-4376
461
1 CO2-REC
398
500
1CO2-R-V2
376
500
0CO2-R-L2
HEAT-1
376
458
1CO2-R-V
376
458
0
CO2-R-L
104
405
93985
SG-PSA
104
110
86183PSA-TG
104
405
2090613
SG-6
104
450
86183PSA-TG-2
104
107
86183PSA-TG-3
HEAT-3435
415
3142328SG-3
215
28
1103727
AIR-BNR22465
25
1377396
BNR-EXH
2387
23
1377396
BNR-EXH2
1514
21
1377396
BNR-EXH3
400
19
1377396
BNR-EXH4
750
463
1222454LG-5
HEAT-2
S-REMOVEQ=0
SATURATR
MIX-1
O2-COMPW=43794
H2O-PUMPW=2
NG-COMPW=10579
PREFORM2Q=0
PREFORM1Q=0
SEC-RFMRQ=0
CONDENSRQ=-1462
MPS-GENQ=-2330
SPLT-3
MIX-3
O2-SPLTBURNER2
Q=0
NG-SPLT
MPS-GEN2Q=-0
LPS-GEN2Q=-0
REC-SPLT
REC-MIX
CONDNSR2Q=-0
PF-PH-1Q=390
CO2-COMPW=0
FLASHQ=0
CO2-PUMPW=0
COMPR
PSA-PWR
W=7
PSAQ=0
SG-SPLT
SG-MIX
SG-COMPW=2265
F-AT-PHQ=435
LPS-GENQ=-101
BURNERQ=-435
PF-PH-2Q=-390AIR-COMP
W=11370LPS-GEN3Q=-9
HTREAT-RQ=0
SR-PH-1Q=451
O2-AT-PHQ=36
SR-PH-2Q=-451
FTS-GENQ=-310
H2O-KOQ=0
Temperature (F)
Pressure (psia)
Mass Flow Rate (lb/hr)
Q Duty (MMBtu/hr)
W Power(kW)
(4-Stages;Efficiency = 83%)
Natural Gas Autothermal Reforming
Reconcile
Not currently used in themodel, a placeholder ifCO2 must be cofed to theATR.
These streams would actually befed separately to the ATR, mixed to calculate feed ratios.
����

104405
2176797SYNGAS-1
SYNGAS-1(IN)
47333
828075
FT-TG TG-FT(OUT)
428353
270755
FT-WAXFT-WAX(OUT)
117343
229814
FT-MID-D FT-MID-D(OUT)
47333
43966
FT-NAP FT-NAP(OUT)
115333
804009
FT-WATER FT-H2O(OUT)
376348
9067952
FT-GAS-2
117343
8057010
FT-GAS-3
117343
781128 WATER-2
428353
9067952
FT-GAS-1
428358
9338707
FT-PROD1
3530
WATER-1
41338
8057010
FT-GAS-4
47333
7990164FT-GAS-5
47333
22881WATER-3
FT-REF-1
Q
47333
7162089
REC-GAS1110475
7162089
REC-GAS2
117343
781128
H2O-MIX1
428398
9338886SYNGAS-2
FT-HX
FT-MPS-1
Q
MID-SEP1
Q=-1678
COOL-1Q=-179
WAX-SEP1
Q=0
NAP-SEP1Q=0
COOL-2Q=-210
GAS-SPLT
REC-COMPW=37055
H2O-MIX1 H2O-MIX2
SG-PRHT1
Q=1192
FT-RX-1Q=-3134
Temperature (F)
Pressure (psia)
Mass Flow Rate (lb/hr)
Q Duty (MMBtu/hr)
W Power(kW)Fischer Tropsch Synthesis
����

HIERARCHY
HYDCRACK
HIERARCHY
HYDTREAT
47333
43966
FT-NAPFT-NAP(IN)
428353
270755
FT-WAXFT-WAX(IN)
117343
229814
FT-MID-D FT-MID-D(IN)
1043957803
H2-REFT H2-REF2(IN)
7015
717317
AIR-REFAIR-REF(IN)
59322
177858
TG-FHTG-FH(IN)
10415
368066
DIESEL-4DIESEL(OUT)
10615
115035
NAPHTHA3NAPHTHA(OUT)
1402065785
REF-H2O REF-H2O(OUT)
5333
68443
TAILGAS TG-REF(OUT)
37615
895175
FH-EXH-3FH-EXH(OUT)376348
397161
HC-WAX2
1043955303
H2-CRAK
4431
380274
HCRACK
8650
HCRACK-W
140110
22186 H2-HCPRG
Q-REBL2
1043952500H2-TREAT
140110
12567 H2-HTPRG
1402065
218962
HTREAT 1402065785
HTREAT-W
1040
368066
DIESEL-3
3762
368066
DIESEL-2
4594
368066
DIESEL
50239
494473
ATM-BOT
5895
126407
BOT-WAX
Q-REBOIL
591353
126407
BOT-WAX2
12433
527601
COL-FEED
Q-FURN
18917
33128
TOP-NAPH
10434
11762HCRACK-5
10434
301459
HCRACK-3
12433
4578FLSHGAS1
330
H2O
COL-HEAT
80015
895175FH-EX-180015
895175
FH-EXHST
14917
71069
NAPHTHA1
11117
115035
NAPHTHA2
4833
37941
HCHT-NAP
482353
397161
HC-WAX
3761
380274
HCRACK-1
1040
78815 CRAK-GAS1040
301459 HCRACK-21044
11762HCRACK-413734
22186H2HCPRG2
13934
12567H2HTPRG2
10434
67053
CRAKGAS2
4833
63865 CRAKGAS3
61415
895175
FH-EXH-2
D-PUMPW=8
D-COOL2Q=-86
D-COOL1Q=-32
VAC-COLQC=-168QR=204QF=0
BOT-PUMPW=92
ATM-COLQC=-16QR=137
FLASHQ=0
FIRED-HTQ=-728
RSTOIC
NOX-ADJQ=0
Q
MIXER
HEAT-MIX
NAP-MIX NAP-MIX2
WAX-MIX
HC-SEPQ=-78
HC-PUMP2W=1
NAP-SEPQ=-4
HC-VLVE
HT-VLVE
TG-MIX
H2-SPLT
HC-PUMPW=16
CG-COMPW=2744
H2O-MIX
CRK-COOLQ=-30
WAX-COOLQ=-28
MPS-GENQ=-47
LPS-GENQ=-58
NAP-COOLQ=0
Temperature (F)
Pressure (psia)
Mass Flow Rate (lb/hr)
Q Duty (MMBtu/hr)
W Power(kW)
Product Upgrading and Refining
����

376348
397161
WAXHC-WAX2(IN)
104395
5303
H2-CRAK H2-CRAK(IN)
4431
380274
HCRACK HCRACK(OUT)
8650H2O
HCRACK-W(OUT)
140110
22186
H2-PURGE H2-HCPRG(OUT)
Q-REBL Q-REBL2(OUT)
3781076
397161
WAX-2
31210768540H2-CRAK4
6131076
192722CRK-WAX2
7001066
598420
WAX-3
HEAT
7021028
598420HCRK
7531028
598420
HCRK-2
5411026
598420
HCRK-3
6082
192722
CRK-WAX
3501021
598420
HCRK-4
140865
25423H2-REC
140865
572999
HCRK-5
140855
3237
H2-REC2
308855
5303
H2-CRAK2
244855
8540
H2-CRAK3
3321
572999
HCRK-7
1171
572999
HCRK-6
WAX-PMP1W=479
HC-PRHTQ=118
HCRAK-R1Q=0
HCRAK-R2Q=0
HC-RECPQ=-118
WAX-PMP2W=402
H2-FLASHQ=-78
PSAQ=0
H2-MIX
H2-COMPW=1092
H2-COMP2W=592
HCRK-FRCQC=-302QR=386QF=0
HC-VLVE
COMPR
PSA-PWR
W=3
RECUPQ=83
Temperature (F)
Pressure (psia)
Mass Flow Rate (lb/hr)
Q Duty (MMBtu/hr)
W Power(kW)
Used to includePSA power requirement
in utility calcs.
Hydrocracking
����

104395
2500
H2TRT H2-TREAT(IN)
117343
229814
MDFT-MID-D(IN)
140110
12567
H2-PURGE H2-HTPRG(OUT)
1402065
218962
HTREAT-3 HTREAT(OUT)
1402065785
H2O HTREAT-W(OUT)
1252290
229814
MD-2
2842290
10800H2TRT-4
6452280
240614
MD-3
HEAT
7242245
240614
HTREAT
2662245
240615
HTREAT-2
1402065
20867H2-REC
14020558300
H2-REC2
62720552500
H2TRT-2
2522055
10800
H2TRT-3
HT-PUMPW=766
HT-PRHT
Q=98
HT-RECP
Q=-98HTREAT-R
Q=0
PSAQ=0
H2-COMPW=1337
H2-COMP2W=361
H2-MIX
H2-FLASH
Q=-22
COMPR
PSA-PWR
W=5
Temperature (F)
Pressure (psia)
Mass Flow Rate (lb/hr)
Q Duty (MMBtu/hr)
W Power(kW)
Used to includePSA power requirement
in utility calcs.
Hydrotreating
����

11315
964414
MAKEUP BFW-MKUP(IN)
417300
421160
FT-DA
14517
5962991BFW-1
21717
6384151
BFW-3
21717
2408887
MPGEN-1 21717
432109
LPGEN-1
21717
3543155FTGEN-1
10517
4093694CON-4
358150
904884
LP-COND2
11317
964414
MAKEUP-2
217150
432109
LPGEN-2
217300
3543155
FTGEN-2
2191500
2408887
MPGEN-2
5961500
1444473MP-STM-2
417300
1444473
T-EFF-1
417300
1207182 KO-1-VAP
417300
2567230FT-STM-3
358150
3774412T-EFF-2
0MP-COND 417300
237290
CON-1
1051
4093694
T-EFF-3
1051
4093694
CON-3
417300
2988390
FT-STM-2
5961500
2408887
MP-STM
417300
3543155
FT-STM
358150
432109
LP-STM
417300
554765FT-USRS
417300
554765FT-COND
0
MP-USRS
358150
0
LP-USRS
358150
0
LP-COND
417300
3543155
FT-STM-1
0FT-INJ358150
432109
LP-STM-1
358150
432109LP-STM-2
0 LP-INJ
5961500
2408887
MP-STM-1
5961500
964414
MP-INJ
358150
3661584KO-2-VAP358150
904884CON-2
DA
BFW-SPLT
COND-MIX
LP-PUMPW=68
FT-PUMPW=1059
MP-PUMPW=3777
S-TURB-1W=-40889
S-TURB-2W=-51161
KO-1Q=0
CONDSR-2Q=-3512
C-PUMP-2W=67
FT-SPLT2
MP-GENQ=2359
FT-GENQ=3602
LP-GENQ=436
FT-USEQ=-449
MP-USE
LP-USEQ=-0
FT-SPLT1LP-SPLT1
MP-SPLT1
S-TURB-3W=-304686
KO-2Q=0
LP-MIX
MU-PMP
W=3
Temperature (F)
Pressure (psia)
Mass Flow Rate (lb/hr)
Q Duty (MMBtu/hr)
W Power(kW)
Warnings
Steam Turbines
Saturated Steam Turbines
Note: If you change the design specthat controls the deaerator temperature,be sure to update the utility inlet specsfor all three steam levels.
���

7015
175464050
AIR-1AIR-CT(IN)
6915
8222856
MU-H2OCT-MKUP(IN)
10015
182746537
AIR-3 CT-EX(OUT)
8630
934511
BLOWDOWN CT-BD(OUT)
10330
482272743
CWR-3
HEAT
10415
474984399
CWS-1
10415
182746537AIR-2
10315
482272743
CWR-2
8615
483207255
CWS-3
8630
483207255
CWS-4
8630
129793224
CWS-6
12225
129793224CWR-1
8615
483207255
CWS-2
8630
482272743
CWS-5
9625
352479520
CWR-1-C
8630
352479520
CWS-6-C
CT-FLASH
Q=-9992
CT-PUMPW=7219
CWS-PUMPW=7507
CT-FANW=4095
CW-USERSQ=4661
CT-COOLQ=9992
BLOWDOWN
COLDWELL
Q=0
HOT-WELL
CW-USERCQ=3512
Temperature (F)
Pressure (psia)
Mass Flow Rate (lb/hr)
Q Duty (MMBtu/hr)
W Power(kW)
Warnings
Cooling Tower
���

300226
510232
NH3-VAP1
104224
510232
NH3-LIQ1
-3512
510232
NH3-VAP2
-4110
510232NH3-VAP3
CONDENSR
Q=-309
VALVEEVAPORTR
Q=226
COMPRESR
W=41457
Temperature (F)
Pressure (psia)
Mass Flow Rate (lb/hr)
Q Duty (MMBtu/hr)
W Power(kW)
Refrigeration Unit
3-Stages;Efficiency=75%
����

1402065785REF-1
REF-BD(IN)
8630
934511COOL-1
COOL-BD(IN)
6015
6900639MKUP-1
MAKEUP(IN)
104405
950850RFMR-1
RFMR-BD(IN)
115333
804009FT-1
FT-BD(IN)
11315
964414
TO-HRSGTO-HRSG(OUT)
23015
403523
EVAP-EXHZLD-EX(OUT)
6915
8222856
TO-CT TO-CT(OUT)
10815
1755643DGST-EFF
10815
1755643BIO-EFF
12315
934511COOL-2
11315
2286631RO-EFF
11315
403523
RO-BD
11315
964414
TO-BFW
6015
6900639MKUP-2
11315
1322218
TO-MKUP
MIXER
BIOTREAT
FSPLIT
UF-RO
MIXER
POLISH
MIXER
DIGESTER
HEATER
ZLDQ=451
MIXER
SOFTEN
MIXER
CLARIFY
SPLITMIX
COMPR
PWR-CALCW=15405
Temperature (F)
Pressure (psia)
Mass Flow Rate (lb/hr)
Q Duty (MMBtu/hr)
W Power(kW)
Simplified Water Treatment��

D
C
B
A
4 3 2 1
D
C
B
A
4 3 2 1
Fischer-TropschSynthesis
ProductUpgrade &
RefiningSyngas FT
Liquids
TailGas
LPGNaphthaDiesel
4 3 2 1
GTL Nuclear Integration Opportunities
SHEET 1 OF 1
REV
2
DWG NO
GTL-NUCLEAR-BFD-1
Date
Sep. 30, 2011
PREPARED BY A. Gandrik
SIZE
LTR
TYPE Block Flow Diagram
Tail GasRecycle
Nuclear Heat Integration
PlantWater
Treatment
Preforming & AutothermalReforming
Air Separation
NaturalGas
O2
N2
Air
CO2 Removal, Hydrotreating
and SulfurRemoval
GasMix
Steam
PowerProduction
HTGR850°C ROT
Heat Generation
Nuclear Heat(He 675°C)
He Return
Hot He
Hot He
CoolingTowers
���

D
C
B
A
4 3 2 1
D
C
B
A
4 3 2 1
CO, H2
Compression
Gas
Separation
Water
HeavyLiquids
MiddleDistillate
&Light
Liquids
Hydrocracker
DistillationColumns
ReboilerDuty
HeavyLiquids
NaphthaProduct
DieselProduct
F-TReactor
Compression
H2
TailGas
BFW
Steam
CryogenicASU &
O2Compression
Air
O2
N2
TailGas
PSA
Separation
LPGProduct
Hydrotreater
D
C
B
A Gas to LiquidsNuclear Integration Opportunities
SHEET 1 OF 1
REV
2
DWG NO
GTL-NUCLEAR-PFD-1
Date
Sep. 30, 2011
PREPARED BY A. Gandrik
SIZE
LTR
TYPE Process Flow Diagram
Natural GasCompressor
NaturalGas
SulfurRemoval
Pre-Reforming
Steam
AutothermalReformer
SynthesisGas
BFW
Steam
Tail Gas
Light GasRecycleCompression
SulfurRemovalPreheat
Pre-Reforming
Preheat
Autothermal ReformerPreheat
Water Treatment
System
Nuclear Heat Integration
BFW
BFW Pump
Generator
SaturatedSteam Turbines
SaturatedSteam
CO2 Removal withFluor Propylene
Carbonate Solvent
Light GasRecycle
CO2
HRSG
LightGas
PurgeLight GasRecycle
Steam
���

CALCULATOR BLOCK NUC-SUM
REACTOR HEAT SUMMARY: DUTY REQUIRED = 1633.6 MMBTU/HR DUTY REQUIRED = 478.8 MWT HELIUM MASS FLOW = 1925350. LB/HR INLET TEMPERATURE = 1247. DEG. F OUTLET TEMPERATURE = 563. DEG F. PRESSURE DROP = -20.3 PSI TOTAL HEAT REQ. = 527.1 MWT SEC. CIRC. HEAT GEN. = 48.4 MWT
Calculator Block SUMMARY
FEED SUMMARY:
NATURAL GAS PROPERTIES:
MASS FLOW = 8862. TON/DY VOLUME FLOW = 390. MMSCFD @ 60°F HHV = 23063. BTU/LB HHV = 1047. BTU/SCF @ 60°F ENERGY FLOW = 408781. MMBTU/DY
COMPOSITION: METHANE = 93.571 MOL.% ETHANE = 3.749 MOL.% PROPANE = 0.920 MOL.% BUTANE = 0.260 MOL.% PENTANE = 0.040 MOL.% HEXANE = 0.010 MOL.% NITROGEN = 1.190 MOL.% OXYGEN = 0.010 MOL.% CO2 = 0.250 MOL.% C4H10S = 1. PPMV C2H6S = 0. PPMV H2S = 0. PPMV
PRODUCTS:
LIQUID PRODUCTS PRODUCED = 518713. LB/HR LIQUID PRODUCTS PRODUCED = 6224.6 TON/DY DIESEL = 376925. LB/HR DIESEL = 4523. TON/DY NAPHTHA = 112135. LB/HR NAPHTHA = 1346. TON/DY LPG = 29654. LB/HR LPG = 356. TON/DY LIQUID PRODUCTS PRODUCED = 49998. BBL/DY DIESEL = 35410. BBL/DY NAPHTHA = 11674. BBL/DY LPG = 2914. BBL/DY LIQUIDS PRODUCED / NATURAL GAS FED = 0.70 LB/LB LIQUIDS PRODUCED / NATURAL GAS FED = 128.09 BBL/MMSCF
FUEL PROPERTIES: DIESEL NAPHTHA LPG PROD. RATE, BBL/DAY 35410. 11674. 2914. LHV RATE, MMBTU/DAY 171260. 49176. 12092. MW 190.1 81.1 59.8 API GRAVITY 54.0 86.8 DENSITY, LB/GAL 6.08 5.49 5.82 CETANE N0. 96.2 40.5 HHV CONTENT, BTU/LB 20365. 19718. 18355.
���

LHV CONTENT, BTU/LB 18932. 18273. 16990. % CARBON 84.7 80.6 75.7 D86T CURVE, DEG. C: 0% 148. -112. 10% 184. 24. 20% 203. 55. 50% 251. 100. 90% 327. 131. 100% 355. 182.
POWER CALCULATIONS:
POWER GENERATORS: SATURATED TURBINE POWER OUTPUT = 471.9 MW TOTAL POWER GENERATED = 471.9 MW
POWER CONSUMERS: ASU POWER CONSUMPTION = 131.3 MW NG REFORMER POWER CONSUMPTION = 68.9 MW CO2 LIQUEFACTION POWER CONSUMPTION = 11.7 MW FISHER TROPSCH POWER CONSUMPTION = 44.0 MW REFINERY POWER CONSUMPTION = 11.6 MW POWER BLOCK POWER CONSUMPTION = 4.7 MW REFRIGERATION POWER CONSUMPTION = 47.1 MW COOLING TOWER POWER CONSUMPTION = 20.8 MW WATER TREATMENT POWER CONSUMPTION = 13.9 MW SEC. CIRCULATOR POWER CONSUMPTION = 48.4 MW TOTAL POWER CONSUMED = 402.3 MW
NET PLANT POWER (+ GEN, - CONS)= 69.7 MW
WATER BALANCE:
EVAPORATIVE LOSSES: COOLING TOWER EVAPORATION = 17835.3 GPM ZLD SYSTEM EVAPORATION = 655.9 GPM TOTAL EVAPORATIVE LOSSES = 18491.2 GPM
WATER CONSUMED: BOILER FEED WATER MAKEUP = 1135.4 GPM COOLING TOWER MAKEUP = 17134.1 GPM TOTAL WATER CONSUMED = 18269.4 GPM
WATER GENERATED: NATURAL GAS REFORMING BLOWDOWN = 1104.5 GPM FT PROCESS BLOWDOWN = 1641.2 GPM REFINERY PROCESS BLOWDOWN = 1.5 GPM COOLING TOWER BLOWDOWN = 1625.6 GPM TOTAL WATER GENERATED = 4372.9 GPM
PLANT WATER SUMMARY: NET MAKEUP WATER REQUIRED = 14552.4 GPM WATER CONSUMED / NATURAL GAS FED = 9.86 LB/LB WATER CONSUMED / LIQUID PRODUCT = 10.0 BBL/BBL
CARBON BALANCE SUMMARY:
% CARBON TO LIQUID FUEL = 79.3 % % CARBON TO TAILGAS = 3.5 % % CARBON TO CO2 REM. = 16.4 % % UNACCOUNTED CARBON = 0.8 %
CO2 EMITTED = 4190. TON/DY CO2 EMITTED = 73. MMSCFD FROM FIRED HEATER = 841. TON/DY
���

LHV TO REFINERY = 8514. MMBTU/DY FROM REFORMER = 3349. TON/DY LHV TO REFORMER = 0. MMBTU/DY CO2 EMMITED / LIQ PROD = 0.67 LB/LB CO2 EMMITED / NATURAL GAS FED = 0.01 LB/LB
STARTUP FLARE SUMMARY:
CO2 FROM FLARE = 123. TON/DY LHV TO FLARE = 1896. MMBTU/DY
EFFICIENCY CALCULATIONS:
HEAT IN (HHV BASED): NATURAL GAS HEAT CONTENT = 17032.5 MMBTU/HR
HEAT OUT (HHV BASED): NET POWER = 237.7 MMBTU/HR LIQUID HEAT CONTENT = 10431.6 MMBTU/HR
PLANT EFFICIENCY (HHV BASED): EFFICIENCY = 62.6 %
Calculator Block NG-RFMR Hierarchy: NG-RFMR
SULFUR REMOVAL CONDITIONS:
INLET BED TEMPERATURE = 760. °F
PREFORMER CONDITIONS:
INLET TEMPERATURE = 915. °F STEAM TO CARBON MOLAR RATIO = 0.58
AUTOTHERMAL REFORMER CONDITIONS:
INLET TEMPERATURE = 1058. °F STEAM TO CARBON MOLAR RATIO = 0.50 OXYGEN TO CARBON MOLAR RATIO = 0.54 OUTLET TEMPERATURE = 1870. °F H2/CO PRE PSA = 2.218 (H2 - CO2)/(CO + CO2) = 1.773 H2/CO POST PSA= 2.138
OUTLET COMPOSITION (PRE-CONDENSER): H2 51.7300 MOL.% CO 23.3247 MOL.% CO2 3.7404 MOL.% H2O 15.2905 MOL.% CH4 1.4578 MOL.%
OUTLET COMPOSITION (POST-PSA): H2 60.0448 MOL.% CO 28.0842 MOL.% CO2 4.5034 MOL.% H2O 0.2740 MOL.% CH4 1.7552 MOL.% INERTS 9.8329 MOL.%
���

HIERARCHY
ASU
HIERARCHY
CO2-COMP
HIERARCHY
COOL-TWR
HIERARCHY
FT
HIERARCHY
H2O-TRTM
HIERARCHY
NG-RFMR
HIERARCHY
REFINERY
HIERARCHY
RU
HIERARCHY
ST-HRSG
48333
40769
FT-NAP
428353
273128
FT-WAX
117343
230065
FT-MID-D
104395
8141
H2-REF2
804956
1925350
HE-2
10415
376925
DIESEL
11515
112135
NAPHTHA
1402065753
REF-H2O
5333
62263
TG-REF
494899
1925350HE-3
7015
185771602
AIR-CT
11415
8573884
CT-MKUP
10015
193547433
CT-EX
8630
813470
CT-BD
7015
4930197
AIR-ASU
9917
3312907N2-1
9517
945508OXYGEN
9517
639072 ENR-AIR
10494
32709
ASU-BD
104405
2241243
SYNGAS-1
48333
876219TG-FT
114333
821274FT-H2O
11415
568135
BFW-MKUP
57322
63619
SYNG-PRG
7015
283193
AIR-BLR
33015
346813
TG-EXH
1402065753
REF-BD
8630
813470
COOL-BD
6015
7282039
MAKEUP
104405
552715
RFMR-BD
114333
821274
FT-BD
11415
568135
TO-HRSG
23015
328232
ZLD-EX
6815
8573884
TO-CT
70315
738523
NAT-GAS
5951500
568135
STM-RFMR
57322
845228
TG-REC2
12471015
1925350
HE-IN
104405
552715RFMR-H2O104395
8142
H2-REF1
11029
295293CONCO2EX
286340
62263
TG-REF-2
77333
938482
TG-TOT
26330
938482TG-LPG2
-3325
908847TG-LPG3
-3325
29654
LPG
57322
908847TG-REC
57322
845228
TG-REC1
5631036
1925350
HE-OUT
12471015
1925350
HE-IN-2
1042005
295293
CO2-EOR
TG-MIX REC-COMPW=3624
COOLERQ=-11
PRECOOLQ=18
SYNG-SPL
HE-CMPW=48364
IHXQ=1634
Temperature (F)
Pressure (psia)
Mass Flow Rate (lb/hr)
Q Duty (MMBtu/hr)
W Power(kW)
Warnings
Nulcear-Integrated Natural Gas to Liquid Fuels
Reconcile
Reconcile
Reconcile
Reconcile
7% purge required to maintaininert fraction to FT column around10 mol%.
Color Legend
Water or Steam
CO2 Source
Nuclear Heat Use
���

7015
4930197AIR
AIR-ASU(IN)
9917
3312907N2
N2-1(OUT)
9517
945508O2
OXYGEN(OUT)
9517
639072WASTE
ENR-AIR(OUT)
10494
32709BLOWDOWN
ASU-BD(OUT)
10494
4897488
AIR-3
10494
4554664
AIR-3B
10494
342824AIR-3A
104109
342824
AIR-5
-29617
3312907N2-1
-29517
945508
O2-1
-30717
639072
C2-WASTE
-274102
342824AIR-6
-27887
4554664
TO-HPCOL
10494
4930197
AIR-2
10494
32709
MS-LIQ
-29517
945508
LPCOLBOT
10494
4930197AIR-1
940KO-LIQ -311
17342824
TO-LPCOL
-31817
1958505
HP-TOP-3
-31017
2596158HP-BOT-2
-31817
3312907
LPCOLTOP
-28687
1958505
HPCOLTOP
-27987
2596158
HPCOLBOT
-28687
1958505
HP-TOP-1
-31287
1958505HP-TOP-2
-31217
2596158HP-BOT-1
138109
342824AIR-4
AIR-SPLT
H-EXQ=467
MOLSIEVE
COLD-1BQ=85
ACOMP-1
W=131904
KO-DRUM
H20-MIX
LP-COL
QC=0QR=202
HP-COL
QC=-202QR=0
COLD-1AQ=-85
VALVE-2
VALVE-1
COLD-2BQ=19
COLD-2AQ=-83
ACOMP-2
W=822
CW-EXCHQ=-3
COLD-2CQ=64
A-EXPAND
W=-1426
Temperature (F)
Pressure (psia)
Mass Flow Rate (lb/hr)
Q Duty (MMBtu/hr)
W Power(kW)
Air Separation Unit
4-Stages;Efficiency=83%
Efficiency=83%
��

HIERARCHY
CO2-REM
70
315
738523
NAT-GASNAT-GAS(IN)
595
1500
568135
STEAMSTM-RFMR(IN)
95
17
945508
OXYGENOXYGEN(IN)
57
322
845228
LG-RECTG-REC2(IN)
1247
1015
1925350
HE-1HE-IN(IN)
104
405
552715
RFMR-H2O RFMR-H2O(OUT)
104
405
2241243
SYNGAS SYNGAS-1(OUT)
104
395
8142
H2-REFIN H2-REF1(OUT)
804
956
1925350
HE-5 HE-2(OUT)
110
29
295293
CO2-EXH CONCO2EX(OUT)
70
304
549935
LG-REC-2
760
456
1297636 LG-6
70
15
2
S-CAPTUR
760
449
1297634
LG-7
148
470
1288458LG-2105
470
9178
H2O-RFMR
135
470
1297636LG-4
671
449
1865769
LG-8
230
470
945508
OXYGEN-2
104
405
9178
WATER-2
148
470
1288458
LG-1
378
439
1865769
LG-10
975
439
1865769
LG-11
915
442
1865769
LG-9
1058
432
2811277
ATHMR
1870
425
2811277SG
376
410
2811277
SG-4
104
405
2249384SG-5
104
405
561893H2O-COND
614
420
2811277SG-2
104
458
0
CO2P-CON
104
405
9178
WATER-1
104
458
0CO2-P-5
1202
432
1865769LG-12
230
470
945508
O2-ATR
230
470
0
O2-CO2-P
365
470
1CO2PFEED
2232
467
2
CO2-P
148
470
0
LG-3
614
464
2CO2-P-2
376
461
2CO2-P-3
376
461
0
CO2-P-4
376
461
1 CO2-REC
398
500
1CO2-R-V2
376
500
0CO2-R-L2
HEAT-1
376
458
1CO2-R-V
376
458
0
CO2-R-L
104
405
95238
SG-PSA
104
110
87097
PSA-TG
104
405
2154146
SG-6
104
500
87097PSA-TG-2
HEAT-3435
415
2811277SG-3
1123
995
1925350
HE-2
1001
975
1925350
HE-4
750
463
1297636LG-5
HEAT-2
S-REMOVEQ=0
SATURATR
MIX-1
O2-COMPW=43337
H2O-PUMPW=2
NG-COMPW=13317
PREFORM2Q=0
PREFORM1Q=0
SEC-RFMRQ=0
CONDENSRQ=-1006
MPS-GENQ=-2102
SPLT-3
MIX-3
O2-SPLT
BURNER2Q=0
NG-SPLT
MPS-GEN2Q=-0
LPS-GEN2Q=-0
REC-SPLT
REC-MIX
CONDNSR2Q=-0
PF-PH-1Q=291
CO2-COMPW=0
FLASHQ=0
CO2-PUMPW=0
COMPR
PSA-PWR
W=7
PSAQ=0
SG-SPLT
SG-MIX
SG-COMPW=2524F-AT-PH1
Q=296
LPS-GENQ=-92
PF-PH-2Q=-291
HTREAT-RQ=0
SR-PH-1Q=470
SR-PH-2Q=-470
FTS-GENQ=-281
F-AT-PH2Q=-296
Temperature (F)
Pressure (psia)
Mass Flow Rate (lb/hr)
Q Duty (MMBtu/hr)
W Power(kW)
(4-Stages;Efficiency = 83%)
Natural Gas Autothermal Reformer
Reconcile
Not currently used in themodel, a placeholder ifCO2 must be cofed to theATR.
These streams would actually befed separately to the ATR, mixed to calculate feed ratios.
��

57322
845228
LG-RECLG-REC(IN)
11029
295293
CO2 CO2-EXH(OUT)
70304
549935
LG-REC-2 LG-REC-2(OUT)
0322
845196
VAP
70304
549903
LG-REC-1
032232
LIQ
SEP
CO2-REMQ=24
LG-CONDQ=-16
MIX
HEATER
PCCHIL
Q=-3
COMPR
PC-EU
W=9679
HEATER
PC-CWU
Q=-1
Temperature (F)
Pressure (psia)
Mass Flow Rate (lb/hr)
Q Duty (MMBtu/hr)
W Power(kW)
CO2 Removal with Propylene Carbonate(Fluor Solvent)
���

11029
295293
CO2-INCONCO2EX(IN)
1042005
295293
CO2-EOR CO2-EOR(OUT)
1822005
295293
CO2-7
180700
295293
CO2-1
104700
295293
CO2-3
1761160
295293
CO2-4
1041160
295293
CO2-6
ST8-COOLQ=-5
ST6-COOLQ=-5
ST7-COOLQ=-5
STAGE-8W=1510
STAGE-7W=1388
STGS-1-6
W=8779
Temperature (F)
Pressure (psia)
Mass Flow Rate (lb/hr)
Q Duty (MMBtu/hr)
W Power(kW)
CO2 Compression/Liquefaction
(8-Stages Total; Efficiency = 84.4)
��

104405
2241243SYNGAS-1
SYNGAS-1(IN)
48333
876219
FT-TG TG-FT(OUT)
428353
273128
FT-WAXFT-WAX(OUT)
117343
230065
FT-MID-D FT-MID-D(OUT)
48333
40769
FT-NAP FT-NAP(OUT)
114333
821274
FT-WATER FT-H2O(OUT)
376348
9546816
FT-GAS-2
117343
8521426
FT-GAS-3
117343
795329WATER-2
428353
9546816
FT-GAS-1
428358
9819944
FT-PROD1
3530
WATER-1
41338
8521426
FT-GAS-4
48333
8454712FT-GAS-5
48333
25945WATER-3
FT-REF-1
Q
48333
7578493
REC-GAS1115475
7578702
REC-GAS2
117343
795329
H2O-MIX1
428398
9819944SYNGAS-2
FT-HX
FT-MPS-1
Q
MID-SEP1
Q=-1741
COOL-1Q=-188
WAX-SEP1
Q=0
NAP-SEP1Q=0
COOL-2Q=-223
GAS-SPLT
REC-COMPW=44031
H2O-MIX1 H2O-MIX2
SG-PRHT1
Q=1235
FT-RX-1
Q=-3198
Temperature (F)
Pressure (psia)
Mass Flow Rate (lb/hr)
Q Duty (MMBtu/hr)
W Power(kW)Fischer Tropsch Synthesis
���

HIERARCHY
HYDCRACK
HIERARCHY
HYDTREAT
48333
40769
FT-NAPFT-NAP(IN)
428353
273128
FT-WAXFT-WAX(IN)
117343
230065
FT-MID-D FT-MID-D(IN)
1043958141
H2-REFT H2-REF2(IN)
804956
1925350
HE-1HE-2(IN)
10415
376925
DIESEL-4DIESEL(OUT)
11515
112135
NAPHTHA3NAPHTHA(OUT)
1402065753
REF-H2O REF-H2O(OUT)
5333
62263
TAILGAS TG-REF(OUT)
494899
1925350
HE-OUT HE-3(OUT) 376348
404471
HC-WAX2
1043955637
H2-CRAK
4431
388727
HCRACK
8650
HCRACK-W
140110
21360 H2-HCPRG
Q-REBL2
1043952504H2-TREAT140
1108812H2-HTPRG
1402065
223005
HTREAT 1402065753
HTREAT-W
1040
376925
DIESEL-3
3762
376925
DIESEL-2
4594
376925
DIESEL
50339
508273
ATM-BOT
5895
131348
BOT-WAX
Q-REBOIL
591353
131348
BOT-WAX2
12433
540603
COL-FEED
Q-FURN
18917
32330
TOP-NAPH
10434
11804HCRACK-5
10434
308996 HCRACK-3
12433
3200FLSHGAS1
330
H2O
14917
71365
NAPHTHA1
12017
112135
NAPHTHA2
4833
39035
HCHT-NAP
483353
404471
HC-WAX
3761
388727
HCRACK-1
1040
79731 CRAK-GAS1040
308996 HCRACK-2
1044
11804HCRACK-4
13734
21360H2HCPRG2
13934
8812H2HTPRG2
10434
67927
CRAKGAS2
4833
59064 CRAKGAS3
640936
1925350
HE-2
552918
1925350
HE-3
D-PUMPW=8
D-COOL2Q=-88
D-COOL1Q=-33
VAC-COLQC=-172QR=208QF=0
BOT-PUMPW=95
ATM-COLQC=-15QR=140
FLASHQ=0
NAP-MIX NAP-MIX2
WAX-MIX
HC-SEPQ=-80
HC-PUMP2W=1
NAP-SEPQ=-4
HC-VLVE
HT-VLVE
TG-MIX
H2-SPLT
HC-PUMPW=16
CG-COMPW=2784
H2O-MIX
NAP-COOLQ=0
CRK-COOLQ=-30
WAX-COOLQ=-29
H-EXH-1Q=-393
H-EXH-2Q=-208
H-EXH-3Q=-140
Temperature (F)
Pressure (psia)
Mass Flow Rate (lb/hr)
Q Duty (MMBtu/hr)
W Power(kW)
Product Upgrading and Refining
Ensure outlet temperatureof H-EXH-2 is above 607 F, otherwise adjust HE design spec.
���

376348
404471
WAXHC-WAX2(IN)
104395
5637
H2-CRAK H2-CRAK(IN)
4431
388727
HCRACK HCRACK(OUT)
8650H2O
HCRACK-W(OUT)
140110
21360
H2-PURGE H2-HCPRG(OUT)
Q-REBL Q-REBL2(OUT)
3781076
404471
WAX-2
31310768915H2-CRAK4
6131076
199375CRK-WAX2
7001066
612740
WAX-3
HEAT
7011028
612740HCRK
7571028
612740
HCRK-2
5451026
612740
HCRK-3
6082
199375
CRK-WAX
3521021
612740
HCRK-4
140865
24638H2-REC
140865
588102
HCRK-5
140855
3278
H2-REC2
308855
5637
H2-CRAK2
245855
8915
H2-CRAK3
3341
588102
HCRK-7
1181
588102
HCRK-6
WAX-PMP1W=486
HC-PRHTQ=120
HCRAK-R1Q=0
HCRAK-R2Q=0
HC-RECPQ=-120
WAX-PMP2W=414
H2-FLASHQ=-80
PSAQ=0
H2-MIX
H2-COMPW=1120
H2-COMP2W=604
HCRK-FRCQC=-308QR=393QF=0
HC-VLVE
COMPR
PSA-PWR
W=3
RECUP
Q=86
Temperature (F)
Pressure (psia)
Mass Flow Rate (lb/hr)
Q Duty (MMBtu/hr)
W Power(kW)
Used to includePSA power requirement
in utility calcs.
Hydrocracking
���

104395
2504
H2TRT H2-TREAT(IN)
117343
230065
MDFT-MID-D(IN)
140110
8812
H2-PURGE H2-HTPRG(OUT)
1402065
223005
HTREAT-3 HTREAT(OUT)
1402065753
H2O HTREAT-W(OUT)
1252290
230065
MD-2
2872290
10314H2TRT-4
6452280
240379
MD-3
HEAT
7242245
240379
HTREAT
2672245
240379
HTREAT-2
1402065
16622H2-REC
14020557810
H2-REC2
62720552504
H2TRT-2
2552055
10314
H2TRT-3
HT-PUMPW=766
HT-PRHT
Q=97
HT-RECP
Q=-97HTREAT-R
Q=0
PSAQ=0
H2-COMPW=1292
H2-COMP2W=343
H2-MIX
H2-FLASH
Q=-22
COMPR
PSA-PWR
W=5Temperature (F)
Pressure (psia)
Mass Flow Rate (lb/hr)
Q Duty (MMBtu/hr)
W Power(kW)
Used to includePSA power requirement
in utility calcs.Hydrotreating
���

114
15
568135
MAKEUP BFW-MKUP(IN)
57
322
63619
FUEL-GAS SYNG-PRG(IN)
70
15
283193 AIR-BLR
AIR-BLR(IN)
330
15
346813
FG-EXH-6 TG-EXH(OUT)
417
300
540177FT-DA
123
17
5863303
BFW-2
217
17
6403480BFW-3
217
17
2142454
MPGEN-1 217
17
369229
LPGEN-1
217
17
3891798FTGEN-1
105
17
4923326CON-4358
150
371842
LP-COND-
114
17
568135
MAKEUP-2
122
17
5863303
BFW-1
217
150
369229
LPGEN-2
217
300
3891798
FTGEN-2
219
1500
2142454
MPGEN-2
676
1485
1574319
MP-STM-3
417
300
1574319
T-EFF-1
417
300
1474807KO-1-VAP
493
285
3066041FT-STM-4
358
150
4540847
T-EFF-2
358
150
4554098KO-2-VAP
395
135
369229LP-STM-3
105
1
4923326T-EFF-3
0MP-COND
417
300
99513
CON-1
417
300
285580 FT-COND
358
150
371842
CON-2 105
1
4923326CON-3
417
300
3606218
FT-STM-2
417
300
3066041
FT-STM-3
596
1500
2142454
MP-STM
417
300
3891798
FT-STM
358
150
369229
LP-STM
417
300
285580 FT-USRS
0
MP-USRS
0
LP-USRS
0
LP-COND
417
300
3891798
FT-STM-1
0FT-INJ 358
150
369229
LP-STM-1
358
150
369229
LP-STM-2
0 LP-INJ
596
1500
2142454
MP-STM-1
596
1500
1574319
MP-STM-2
596
1500
568135
MP-INJ
3380
15
346813
FG-EXH-1
3379
15
346813FG-EXH-2
2050
15
346813
FG-EXH-3
511
15
346813
FG-EXH-4
413
15
346813
FG-EXH-5 DA
BFW-SPLT
COND-MIX
LP-PUMPW=59
FT-PUMPW=1164
MP-PUMPW=3375
S-TURB-1W=-51427
S-TURB-2W=-60541
S-TURB-3W=-359972
KO-1Q=0 KO-2
Q=0
CONDSR-2Q=-4256
C-PUMP-2W=81
FT-SPLT2
MP-GENQ=2098
FT-GENQ=3956
LP-GENQ=372
FT-USEQ=-231
MP-USE
LP-USE
FT-SPLT1LP-SPLT1
MP-SPLT1
RSTOIC
NOX-ADJ1Q=0
D-FIRE-1Q=0
PR-HTQ=153
PR-HT-2Q=161
PR-HT-3Q=9
PR-HT-4Q=8
LP-MIX
MU-PMP
W=2
Temperature (F)
Pressure (psia)
Mass Flow Rate (lb/hr)
Q Duty (MMBtu/hr)
W Power(kW)
Warnings
Steam Turbines
Saturated Steam Turbines
Note: If you change the design specthat controls the deaerator temperature,be sure to update the utility inlet specsfor all three steam levels.
���

7015
185771602
AIR-1AIR-CT(IN)
11415
8573884
MU-H2OCT-MKUP(IN)
10015
193547433
AIR-3 CT-EX(OUT)
8630
813470
BLOWDOWN CT-BD(OUT)
10130
540112723
CWR-3
HEAT
10415
532352309
CWS-1
10415
193547433AIR-2
10115
540112723
CWR-2
8615
540926193
CWS-3
8630
540926193
CWS-4
8630
112981932
CWS-6
12225
112981932
CWR-1
8615
540926193
CWS-2
8630
540112723
CWS-5
9625
427130791
CWR-1-C
8630
427130791
CWS-6-C
CT-FLASH
Q=-10831
CT-PUMPW=8082
CWS-PUMPW=8404
CT-FANW=4335
CW-USERSQ=4057
CT-COOLQ=10831
BLOWDOWN
COLDWELL
Q=0
HOT-WELL
CW-USERCQ=4256
Temperature (F)
Pressure (psia)
Mass Flow Rate (lb/hr)
Q Duty (MMBtu/hr)
W Power(kW)
Warnings
Cooling Tower
���

300226
579152
NH3-VAP1
104224
579152
NH3-LIQ1
-3512
579152
NH3-VAP2
-4110
579152NH3-VAP3
CONDENSR
Q=-351
VALVEEVAPORTR
Q=256
COMPRESR
W=47057
Temperature (F)
Pressure (psia)
Mass Flow Rate (lb/hr)
Q Duty (MMBtu/hr)
W Power(kW)
Refrigeration Unit
3-Stages;Efficiency=75%
��

1402065753REF-1
REF-BD(IN)
8630
813470COOL-1
COOL-BD(IN)
6015
7282039MKUP-1
MAKEUP(IN)
104405
552715RFMR-1
RFMR-BD(IN)
114333
821274FT-1
FT-BD(IN)
11415
568135
TO-HRSGTO-HRSG(OUT)
23015
328232
EVAP-EXHZLD-EX(OUT)
6815
8573884
TO-CT TO-CT(OUT)
10915
1374741DGST-EFF
10915
1374741BIO-EFF
12315
813470COOL-2
11415
1859979RO-EFF
11415
328232
RO-BD
11415
568135
TO-BFW
6015
7282039MKUP-2
11415
1291845
TO-MKUP
MIXER
BIOTREAT
FSPLIT
UF-RO
MIXER
POLISH
MIXER
DIGESTER
HEATER
ZLDQ=366
MIXER
SOFTEN
MIXER
CLARIFY
SPLITMIX
COMPR
PWR-CALCW=13930
Temperature (F)
Pressure (psia)
Mass Flow Rate (lb/hr)
Q Duty (MMBtu/hr)
W Power(kW)
Simplified Water Treatment��

Form 412.09 (Rev. 10)
Idaho National Laboratory
HTGR-INTEGRATED COAL AND GAS TO
LIQUIDS PRODUCTION ANALYSIS
Identifier: Revision: Effective Date:
TEV-672
2
09/30/2011 Page: B-1
Appendix B CTL Baseline Stream Results.xlsx
[Electronic]

Form 412.09 (Rev. 10)
Idaho National Laboratory
HTGR-INTEGRATED COAL AND GAS TO
LIQUIDS PRODUCTION ANALYSIS
Identifier: Revision: Effective Date:
TEV-672
2
09/30/2011 Page: C-1
Appendix C CTL HTGR Stream Results.xlsx
Electronic

Form 412.09 (Rev. 10)
Idaho National Laboratory
HTGR-INTEGRATED COAL AND GAS TO
LIQUIDS PRODUCTION ANALYSIS
Identifier: Revision: Effective Date:
TEV-672
2
09/30/2011 Page: D-1
Appendix D GTL Baseline Stream Results.xlsx
[Electronic]

Form 412.09 (Rev. 10)
Idaho National Laboratory
HTGR-INTEGRATED COAL AND GAS TO
LIQUIDS PRODUCTION ANALYSIS
Identifier: Revision: Effective Date:
TEV-672
2
09/30/2011 Page: E-1
Appendix E GTL HTGR Stream Results.xlsx
[Electronic]