Embed Size (px)
Citation preview
The Correlation of Upper Elementary Spelling Levels and Morphological Awareness as
Measured Using Student Interviews
Abstract
Eighty-seven 4th, 5th and 6th grade students were administered the Derivational Relatedness
Interview (DRI) to explore students’ understanding of derivational morphology. During the same
week, the subjects were also administered an Upper-Level Spelling Inventory (USI) to determine
the students’ level of orthographic development. The DRI interviews were coded for higher level
cognitive responses and then compared to each student’s performance on the USI. MAXQDA
was used to code performance on the DRI using L3, a learning level lens developed for this
study. Correlations between the coded categories of the DRI and each student’s qualitative
spelling inventory (USI) were determined using Pearson r. Results showed a high correlation
between the increasing gradients of morphological comprehension as measured by L3© coding
and increasing USI scores.

The Correlation of Upper Elementary Spelling Levels and Morphological Awareness as
Measured Using Student Interviews
Table of Contents
Abstract…………………………………………………………………………………………….i
Table of contents……………………………………......................................................................ii
INTRODUCTION
What is morphology and why is it important…………….…………………………….………….1
Correlations between morphology and reading comprehension…………………………………..3
Correlations between morphology and orthography ……………………………………..…...…..4
Relationships between morphology, orthography and reading comprehension…………………..5
Morphology’s current inclusion in literacy development…………………………………………6
Assessments in morphological understanding……………………………………………………7
Interviews as assessments…………………………………………………………………………8
Purpose of this study……………………………………………………………………………..13
METHOD
Pre-existing data………………………………………………………………………………….13
Upper-level spelling inventory………...………………………………………………...………15
Table 1 Predictive and concurrent validity for USI……………………………………..15
Table 2 Upper-level spelling inventory (USI)…………………………………………..16
Table 3 Reliability and validity for USI…………………………………….………..…17
Derivational Relatedness Interview………………………………………………….…………..17
Table 4 Derivational relatedness interview flow chart…………………….……………18
Dissertation research design…………………………………………………….……………….19
Figure 1 Explanatory design of study………………………………….………………..20
MAXQDA coding…………………………………………………………………………….….20
L3© coding………………………………………………………………………………………21
Coding of pauses…………………………………………………………………………………22
Table 5 L3© (Lens for Learning Levels) coding parameters…………………..……….25
RESULTS
Table 6 Guilford’s suggested interpretations for values of r ……………………….…..26
L3© coding results……………………………………………………………………………….27
Table 7 Interview Pearson r correlations…………………………………………….….28
Table 8 Interview coefficient of determination……………………………………...….29
DISCUSSION…………………………………………………………………………………...30
Limitations of the present study…………………………………………………………………36
Conclusions and future prospects………………………………………………………………..36
REFERENCES…………………………………………………………………………………37

The Correlation of Upper Elementary Spelling Levels and Morphological Awareness as
Measured Using Student Interviews
What is Morphology and Why is it Important?
For centuries, spelling was used to capture the sounds of speech in order to place them on
documents for the purpose of sharing thoughts with others, and so the first step in learning to
read was to learn spelling (Mathews, 1966). English spelling has been similarly viewed simply as
a mirror of speech, with those words that diverged from the sound-to-letter correspondence
considered only deviations (Venezky, 1967). Since the 1980’s, English spelling has been
recognized as a combination of phonology (sound) and meaning, and reading comprehension has
been understood to depend on one’s grasp of this orthographic knowledge. Sounding out the
word phonetically and following rules of spelling patterns can trigger word recognition (tap and
tape), but recognizing spelling units that are related to another more familiar word is also useful
in word recognition (oppose and opposition) (Berninger, Abbott, Nagy, & Carlisle, 2010;
Templeton, 1989; Templeton & Morris, 2000).
The spelling of words captures their morphology – how they are assembled through the
combination of meaningful word parts (Templeton, Bear, Invernizzi, & Johnston, 2010).
Morphology has been variously defined in the literature (Bryant & Nunes, 2006; Carlisle, 2003;
Jarmulowicz & Hay, 2009; Mahony, Singson, & Mann, 2000; Nippold & Sun, 2008; Templeton
et al., 2010) as the study of how words are built and includes the study of morphemes, the
smallest units of meaning in a language. These can be free morphemes – free-standing words
such as soft, or bound morphemes – non-word units with meaning that are bound to words, such
as the suffix (–en in soften). Morphology also includes compounding (combining words to make

a single concept like strawberry), inflectional morphology which involves the grammatical
processes of inflection (marking categories like person, tense, and case; for example -s, -ed, -er),
and derivational morphology which involves deriving new words by adding prefixes and suffixes
(affixes) to existing root words (e.g., acceptable from accept, signal from sign) and Latin and
Greek roots (e.g., inspect from in- + -spect-; phonic from phon- + -ic). All prefixes and suffixes,
root words, and Greek and Latin roots are morphemes. A word itself can consist of one
morpheme (eg., salamander, house) or two or more morphemes (eg., predictable – pre- + -dict-
+ -able). The transparency of the word can be either phonologically neutral, where the root
word’s pronunciation does not change, or phonologically nonneutral (opaque), where the root
changes in stress and pronunciation. For example, open to openness, flavor to flavorful, and
small to smaller, maintain their phonological transparency, while vain to vanity, active to
activity, and atom to atomic, do not, and are therefore opaque. The combination of derivational
suffixes and root words can create nouns from adjectives and verbs (eg., happy to happiness and
invent to invention) as well as adjectives from nouns and verbs ( joy to joyful and read to
readable).
Whether morphemes are recognizable in print or in speech, their identification can be a
useful tool in the decoding of words, and being able to recognize a false relation in a foil pair is
also important (eg., tail to tailor, ear to earth, and numb to numbers) (Anglin, 1993; Freyd &
Baron, 1982; Henry, 1988; Henry, 1989; Templeton, 1992; Templeton, 2004; White, Power, &
White, 1989; Verhoeven & Perfetti, 2011). By isolating and correctly assigning meaning to a
morpheme, the reader theoretically can limit the effort required for comprehension of the
otherwise unfamiliar word (Baumann et al., 2002; Berninger, Abbott, Nagy, & Carlisle, 2010;
Carlisle, McBride-Chang, Nagy & Nunes, 2010; Cunningham, 2006; Ebbers & Denton, 2008;

Harris, Schumaker, & Deshler, 2011; Keiffer & Lesaux, 2007; Kieffer & Lesaux, 2010; Larsen
& Nippold, 2007).
Correlations between Morphology and Reading Comprehension
Reading’s ultimate objective has been comprehension, and schools continuously refine
approaches to find the best way to help all students achieve that goal. The correlation between
derivational morphological knowledge and reading comprehension is well documented (Anglin,
1993; Berninger, Abbott, Nagy, & Carlisle, 2010; Carlisle, 2000; Freyd & Baron, 1982; Mahony,
1994; Mahony et al., 2000). In school text books, the morphologically-derived words increase
dramatically between grades four and seven, and the student’s knowledge of derivational
morphological relationships among words presumably increases in tandem (White, Power, &
White, 1989). Having an accurate measure of a student’s understanding of morphology could be
used to confirm the best methods to teach morphology and, by extension, accelerate the increase
in student’s reading comprehension.
A few studies have shown that understanding morphology is related to reading
comprehension (Carlisle, 2000; Freyd & Baron, 1982; Nagy, Berninger, & Abbott, 2006).
Baumann, Kame’enui,, and Ash (2003) reviewed the research on vocabulary learning and
reiterated that the evidence of a causal link between vocabulary (including morphology) and
comprehension was historically long but empirically soft. Though they reported only a few
studies supporting the effectiveness of directly teaching morphology, all basal reading programs
contain instruction in structural elements such as base or root words, inflections, contractions,
derivations, and compound words. While they reported some studies that suggested that teaching
specific morphemic elements could show a statistically significant increase in the comprehension
of morphemically similar words, the efficacy of such instruction was documented to be limited.

They note that morphological knowledge has been shown to increase with increasing level of
reading comprehension, and vice-versa, so the question is raised whether the administered testing
is adequate to measure the improvement.
Correlations between Morphology and Orthography
Early research on the relationship between morphological awareness and spelling is
found in Rubin (1988). The study finds that early elementary students (kindergarten and first
grade) are less likely to include the sound of the final morpheme in two morpheme words in their
spelling when they demonstrated low scores on oral morphological awareness tasks. Carlisle
(1988) reports that with typically developing upper elementary students (Grade 4, 5, and 6) their
spelling of derived forms of a word lags behind their ability to orally generate the derived form.
These early researchers demonstrated a general relationship between morphology and spelling.
Almost thirty years later, Deacon, Kirby, and Casselman-Bell (2009) measured
morphological awareness in typically developing early elementary students at in Grade 2, and
then assessed their spelling two years later in Grade 4. They report that while the results of
their study of children in grades 2 and 4 offer a first step in determining that morphological
awareness is a robust variable in determining spelling outcomes, “the research field is still in the
process of determining whether morphological awareness deserves a place as a robust factor in
literacy development” (p. 301). Casalis, Deacon, and Pacton (2011), reporting on French
children in Grades 3 and 4, write that while their results suggest that morphological awareness
exerts a broad influence on spelling, the link between the two did seem to be general because the
morphological awareness scores correlated with spelling words regardless of whether they
involved morphology or not. The word’s phonological structure and developmental level of the
child were also suggested to play a part in the link between morphological awareness and

spelling, thus agreeing with prior research that morphological awareness appears to be generally
connected to spelling outcomes. This general connection suggests “that the greater a child’s
awareness of morphology, the more accurately (and possibly fluently) he or she will spell” (p.
509).
It is noteworthy that there are models of spelling development that include morphological
awareness as a driver of spelling progress (e.g., Bear, Invernizzi, Templeton, & Johnston, 2008)
that are widely used in public schools.
Relationships between Morphology, Orthography and Reading Comprehension
Sensitivity to derivational morphemes not only is related to proficiency in reading and
spelling but is also a developmental skill that increases with age into adolescence (Anglin, 1993;
Carlisle, 2000; Carlisle & Fleming, 2003; Singson et al., 2000; Windsor, 1994). Morphology
should be considered as just one part of an overall comprehensive vocabulary and reading
comprehension program for upper elementary students (Kieffer & Lesaux, 2007).
Kieffer and Lesaux, (2007) report that morphology was equally important for reading
comprehension in native English speakers and English language learners. They suggest that
teachers can get a sense of the level of morphological understanding their students possess by
administering a developmental spelling inventory to inform the teacher’s instruction. By
correctly identifying where their students are on this developmental continuum, teachers can rely
on informed decision making to help their students better understand word structure in academic
vocabulary, thus aiding comprehension.
The Upper Level Spelling Inventory (USI) (Bear, Ivernizzi, Templeton, & Johnston,
2008), by tracking increasing accuracy in spelling, including the morphological aspects of

spelling, has been positively correlated with reading comprehension in upper elementary students
(Center for Research in Educational Policy [CREP], 2007).
Mann and Singson (2003) suggest that by Grade 4 (10 years of age), knowledge about the
structure of words is a better predictor of decoding ability than is phonological awareness.
Carlisle (2003) concludes that as children encounter longer, more complex words, morphological
awareness becomes critical for developing good literacy skills.
Morphology’s Current Inclusion in Literacy Development
Carlisle et al. (2010) integrative review of 16 studies notes that the current models of
literacy development seldom include morphological awareness. The studies in this review
represent a beginning effort in the link of morphological awareness to literacy development. The
various studies included instruction using activities, direct instruction of affixes and base words,
morphological problem solving, and instruction accompanied by morphological analysis
addressing word meanings, but most of the studies did not provide documentation of the transfer
or maintenance of the skills, and the research quality was subject to questions concerning reliable
and valid results. “(L)ittle has been done since 1970 to investigate the nature and value of
instruction in morphological awareness…(and) much work remains to be done” (pg. 481).
What is believed about morphology with the research conducted to date? First,
morphological awareness can support literacy skills like word identification, comprehension and
reading fluency. Second, morphological knowledge can increase literacy skills by addressing
vocabulary skills and comprehension skills, and may support spelling patterns. Third,
phonologically opaque morphological tasks are more strongly associated with good reading than
phonologically transparent tasks (Green, 2009). However, there is still no compelling body of
research evidence for the efficacy of instruction in contextual and morphemic analysis that

would expand the vocabulary or the reading comprehension of children to date. This could
indicate a number of possibilities: (a) is the length of intervention sufficient, (b) is the length of
time between pre and post testing sufficient, (c) is the knowledge of morphology that is acquired
by a student accomplished as the knowledge is needed rather than being taught by a teacher
when it is required by the curriculum, and (d) are the instruments of measurement sensitive
enough to accurately quantify the increase in knowledge.
Assessments in Morphological Understanding
A consistent theme to the discussion of morphological interventions has been variability,
including assessment measures. Most measures have reported validity and reliability, but the
reliability of some of the assessment measures used in morphological studies has also been
questioned (Goodwin & Ahn 2010). Some of the usual methods include cloze, multiple choice,
fill in the blank, and looking for errors by keeping track of right/wrong responses, analyzing for
the presence of word or word parts, frequency of words or word parts, and spelling of words or
word parts (Anglin 1993; Apel & Thomas-Tate 2009; Carlisle 2000; Collins 2005; Conti-
Ramsden, 2011; Jarmulowicz, 2006; Jarmulowicz & Hay 2009; Larsen & Nippold, 2007;
Mahoney, 1994). While these measures vary, they are based on an answer being judged correct
or incorrect, present or absent.
Eleven assessment tasks commonly used in educational research are employed by Siegel
(2008) to correlate morphological awareness with various reading and spelling tasks. The
sample size was large (1238 6th grade students) and all correlations in the study are significant (p
< .0001) but are limited to the moderate range and below. The correlations of morphological
awareness with reading and spelling range from .300 - .520, with a mean of .434, SD = .06.
These moderate correlations are reported to be consistent with prior studies that have shown

morphological awareness to be related to both reading and spelling, but while moderate
correlations indicate that the tasks are related, they still measure abilities that are somewhat
different. If the coefficient of determination is calculated, the highest reported morphological r
value (.520) equals an r2 = .27, indicating a shared variance of only 27%. 73% remains
unexplained.
Finding a measure that accurately tracks incremental increases in morphological
understanding occurring in upper elementary students has been problematic (Pressley, Disney, &
Anderson, 2007; Reed, 2008). While direct teaching methods are research based, the quantitative
paper and pencil testing outcomes that would demonstrate a statistically significant correlation to
the students’ understanding have not been consistent. Conducting interviews in addition to the
usual testing has been tried, but the categorization methods have not proven sensitive enough to
demonstrate that long-term learning has taken place (Nagy, Herman, & Anderson, 1985a).
Typically those categories have been based on identification of specific knowledge, such as base
words, prefix and suffix. This type of analysis can be superficial and might be a reflection of
memorized or short term knowledge (Tyler & Nagy, 1990).
Interviews as Assessments
Typically, student answers are considered to be either correct or incorrect. Testing is
built on the assumption that a correct answer means that the student knows the answer. In the
intervention studies reviewed to this point, morphology has been taught directly, and then tested
after the teaching and/or intervention, most frequently with forced-choice instruments such as
Likert scale tests, multiple choice, yes/no questions, and fill-the-blank formats that check more
for memory than understanding (Constantinou, Hadjilouca, & Papadouris, 2010; Otterman, 1955;
Swanborn & de Glopper, 1999; Thompson, 1958, in Baumann, Kame’enui, & Ash, 2003). It is

also possible that research testing results reported as positive are subject to test sensitization
where higher scores are associated with familiarization (partial word knowledge) rather than
understanding (Swanborn & de Glopper, 1999). Teaching to the test does give the most effective
short term results (Pressley, Disney, & Anderson, 2007) and so immediate effects are usually
larger than delayed effects. Bauman et al. (2002) reported that the effect of the morphological
instruction provided to the 88 5th grade students in their study seemed to degrade over time so
there were no residual instructional effects on the 5 week delayed post-tests checking for an
increase in both morphemic and contextual analysis.
With respect to assessing or probing knowledge more broadly, Maclellan (2004)
explores the history of assessment tasks accompanied by the thoughts of twelve contemporary
academics on the likelihood of a truly authentic assessment. It was agreed that assessment tasks
themselves drive student learning and “the reproduction of cued knowledge, the application of
algorithms and the performance of drills and exercises do not of themselves reflect
understanding” (pg. 20), so most agree that a more accurate assessment should allow students to
demonstrate what they could do through both written and oral opportunities. Oral assessments
are given higher import than written. Even though the ability to accurately and reliably assess
critical thinking and reflection have yet to be fully developed, the need to delineate higher order
skills such as justification, analysis, and evaluation is deemed desirable, with the current
practices of assessing regurgitated or “knowledge” recall needing to be reduced. Marker
consistency and a simple marking system to differentiate between “trivial and non-trivial”
learning is high on their list to make the assessment workable. They also acknowledge that
cognitive activity is not directly observable, so there are many problems involved with

interpreting competence simply from observation. Nonetheless, talking with students remains the
best way to accurately assess what they are really thinking.
Student interviews are used infrequently to assess morphological awareness/knowledge
(Berninger, Abbott, Nagy, & Carlisle, 2010; Carlisle, McBride-Chang, Nagy, & Nunes, 2010;
Goodwin & Ahn, 2010; Larsen & Nippold, 2007) and typically yield less conclusive information
than multiple choice tests (Nagy, Herman, & Anderson, 1985b). Researchers have asked whether
the testing used was accurately measuring the knowledge obtained by students (Wysocki &
Jenkins, 1987). Nagy and Scott (2000) suggested that new research should consider that gauging
student development of word understanding should not be all-or-nothing (correct or incorrect)
but should gauge the growth incrementally. The National Research Council (NRC) calls for three
elements in all assessments: cognition, observation, and interpretation (NRC, 2001). Adams and
Wieman (2011) acknowledge that student interviews are rarely used in educational testing but
argue that interviews are valuable for their ability to examine how new knowledge makes sense
in terms of the student’s prior knowledge. “Student interviews are necessary to verify that
students interpret the question consistently and as intended” (pg. 1301).
Devising categories to accurately identify the higher learning or comprehension
demonstrated in children’s interviews has led to a variety of criteria, including variations on the
right/wrong reasoning approaches. Constantinou, Hadjilouca, and Papadouris (2010)
investigating students’ understanding concerning the distinction between science and technology,
code student responses in written tests (multiple-choice with an open-ended question) and
follow-up interviews, using a variety of coding categories. Written responses were coded as
either correct or incorrect, while interviews and open-ended written responses were subjected to
phenomenographic analysis. The 36 interviewed students’ responses are judged using six

different categories based on variations of perceived differences, with each main category being
subdivided into as many as five additional sub-categories. Within the 24 different forms of
coding, responses were evaluated using criteria including (a) depth and level of detail, (b)
insufficient or ambiguous discrimination, (c) irrelevant answers, (d) circular reasoning, (e)
incorrect answers, and (f) no answer. While the coding procedure is complex and time
consuming, the authors hold that their assessment approach using interviews to explore
variations of distinction could assist the shift from only assessing conceptual understanding to
help monitor student epistemological understandings.
Using a different approach, Larsen and Nippold (2007) used a teacher directed interview
(DATMA: Dynamic Assessment Task of Morphological Analysis) where dynamic assessment
techniques were used to prompt additional student information, rate student answers on a scale of
one to five points, with five points given for a correct definition and correct reference to the root
morpheme in each question without further prompting, down to zero points when the child could
not select the correct meaning after 6 different prompts. Each answer was coded for either being
correct or incorrect, weighted depending on the number of prompts, then collectively analyzed.
While the teacher directed interview did reveal a range of skills, the relationship of the interview
results to other aspects of literacy (word knowledge and reading comprehension) were positive,
statistically significant, but moderate. When word scores were analyzed for the high, medium
and low student subgroups, the score of 1 was obtained more frequently in the low subgroup than
the high subgroup, but no other word scores were found to lie in any one subgroup more than
another. Other than the score of 1, there were no significant differences reported between
subgroups with their scoring method when analyzed by Tukey’s procedure.
The DATMA is a structured interview for 5th grade students where the answers are either
right or wrong. The interviewer has scripted prompts for incorrect answers, and the more
prompts needed to obtain the correct answer, the fewer points were given. When correlating the
DATMA results to the Oregon standardized achievement test for literacy development (OSA)
and the Peabody Picture Vocabulary Test (PPVT), DATMA to OSA was r = 0.50 , p = .0002 and
DATMA to PPVT was r = 0.36, p = .01, both reported as moderate positive correlations that
indicated that DATMA was moderately and positively related to the children’s literacy levels.
The published correlation between the OSA and the PPVT was r = 0.65, p < .0001, which was
reported as strongly positively correlated (Larsen & Nippold, 2007).
Teasing out the components of comprehension has allowed a comparison to skill
acquisition typically obtained through direct teaching. Sesma, Mahone, Levine, Eason, and
Cutting (2009) examine higher level executive brain functions in 60 children aged 9-15 years
old. Using seven different standardized measures from different instruments thought to measure
cognitive processes supporting reading comprehension, they concluded that the executive
functions make a significant contribution to reading comprehension, but not to word recognition
skills. Their definition of executive function included goal-directed behavior that included
holding and manipulating information in working memory, multistep task planning, and coming
up with the “big picture” from details. Rapp, Van den Broek, McMaster, Kendeou, and Espin
(2007) also address investigation of higher-order comprehension processes as a key to helping
struggling readers. The traits, (a) comparing similarities and differences, (b) extrapolation to
associated concepts, and (c) summarization or integration (gist), are outlined as processes
underlying higher-order, coherence-oriented comprehension that could be used in research as
vehicles to investigate instructional approaches.

Taken together, these varied research perspectives suggest that coding should be as
simple as possible and that the student learning should be gauged as a range rather than simply
deemed right or wrong. The variety of coding categories that were reviewed fell into four major
categories: (a) correct answers using higher learning responses that verbalized similarity,
difference, gist, or extrapolation; (b) confused responses where partially correct, vague or
circular answers were given; (c) one word answers or simple phrases retelling information
recently taught directly (memorized by the student) or recollected (for example: Do you know
this word?); and (d) incorrect answers, questions that were answered with “I don’t know” or a
similar phrase, or questions that were simply not answered.
Purpose of this Study
Student interviews possess the potential to verify student knowledge. If categories based
on the degrees of higher cognitive reflections could accurately tap a student’s derivational
morphological knowledge-base, then the statistics generated should correlate either positively or
negatively to the results of their Upper Level Spelling Inventory (USI), a well-known
orthographic measure, and a proven correlate of reading comprehension.
Method
Pre-existing data
An overview of the unpublished study by Templeton, Smith, Maloney, VanPelt, and Ives
(2009), which was presented at the 59th annual meeting of the Literacy Research Association,
will describe the participant selection and the measures used to collect the data. In the 2007-08
school year, working with the Director of Elementary Curriculum and Instruction in a large
western United States urban school district, a number of schools were identified, contacted and
invited to participate in a study to investigate morphological knowledge and vocabulary. Of the

63 elementary schools in the district, eight principals in schools representing a cross-section of
socioeconomic neighborhoods within the district expressed interest and subsequently
participated in the study. Within those schools, the 4th, 5th and 6th grade teachers met with the
investigators where the project was described. A total of 28 teachers consented to participate. Of
the eight participating schools, five were Title I, and three were low-middle SES. In all
classrooms, student assent and parental consent was obtained. In addition, in order to administer
additional one-on-one assessments, three students were randomly selected from each of the 28
classrooms for additional assessments of morphological knowledge and vocabulary. This
subpopulation of 84 students provided the one-on-one interviews that are the subject of this
study. Data were not gathered on whether students were second language learners, though
students who were identified as special needs were not selected. All participating students were
administered the Upper Level Spelling Inventory (USI) (Bear, Invernizzi, Templeton, &
Johnston, 2008) which provides information about the level of students’ orthographic knowledge
and specific orthographic features that characterize those different developmental levels. Three
additional measures were individually administered with the randomly selected subpopulation of
84 students. These measures are the Test of Morphological Structure (Carlisle, 2000), the
Peabody Picture Vocabulary Test (Dunn. Dunn, & Pearson Assessments, 2007), and the
Derivational Relatedness Interview (DRI). This study examines each student’s performance on
the USI in relation to their performance on the DRI using MAXQDA (www.maxqda.com), a
computer assisted mixed-methods software program. Pearson r is the statistical function selected
to measure the correlation between the described measures.

Upper-Level Spelling Inventory
The Upper-Level Spelling Inventory (USI) (Bear, Invernizzi, Templeton, & Johnston,
2008) has a predictive validity of 0.617 with p > .001 for 5th grade reading comprehension,
indicating reliable differentiation between higher and lower performing students (Center for
Research in Educational Policy [CREP], 2007) (see Table 1).
Table 1.Predictive and Concurrent Validity for USI
Upper Form Spelling Inventory (USI)Predictive and Concurrent Validity
Includes all studentsExcludes ELL, SPED, Gifted students
Predictive Concurrent Predictive Concurrent
Validity Validity Validity Validity
Fifth Grade
Reading 0.638 0.611 0.559 0.544
Word Analysis Vocabulary 0.647 0.660 0.577 0.637
Reading Comprehension 0.617 0.583 0.535 0.467
Literacy Response and Analysis 0.543 0.534 0.463 0.459
Writing Conventions 0.522 0.533 0.5 0.539
Writing Strategies 0.480 0.464 0.355 0.376
CST ss ELA 0.633 0.589 0.519 0.492
CST pl ELA 0.585 0.601 0.525 0.568Center for Research in Educational Policy [CREP], 2007, pg.19.
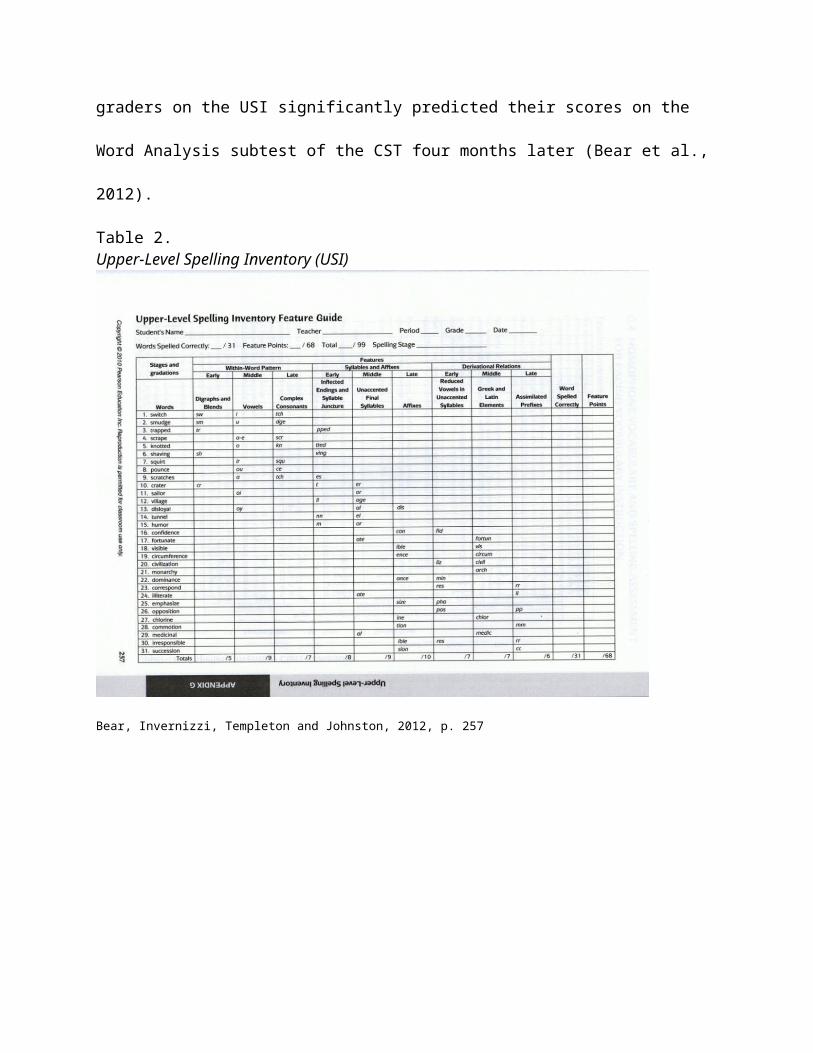
According to Bear, Invernizzi, Templeton, and Johnston (2012) this upper form USI is
used widely from upper elementary and middle school through college level. Used to assess
students orthographic knowledge, the score from this upper-level list (see Table 2) is an
indication of a student’s ability to make meaning connections using the word’s orthography,
whether there are similarities in sound (sail to interpret sailor) or differences in sound (medicine
to interpret medicinal). Based on the increasing word difficulty, both the number of words
spelled correctly and the correct spelling of the specified word parts combine to provide a score
that indicates the ability of a student to make morphological connections between words, and to
target areas where a student would need additional assistance. These USI scores are also used to

identify the student’s spelling stage which then suggests the student’s reading stage. The USI is
highly reliable (see Table 3). For example, scores of 183 fifth graders on the USI significantly
predicted their scores on the Word Analysis subtest of the CST four months later (Bear et al.,
2012).
Table 2.Upper-Level Spelling Inventory (USI)
Bear, Invernizzi, Templeton and Johnston, 2012, p. 257

Table 3.Reliability and Validity for USI
Bear, Invernizzi, Templeton and Johnston, 2012, pg. 29
Derivational Relatedness Interview
The Derivational Relatedness Interview (DRI) was developed as a measure of explicit
morphological knowledge (Templeton, Smith, Moloney, & Ives, 2007; Templeton, Smith,
Moloney, VanPelt, & Ives, 2009). The instrument consists of seven word pairs that are
derivationally related plus two unrelated word pairs that graphically appear similar (see Table 4).
For administration, the researcher visually presents each word pair with bases or roots aligned in
order to make the relatedness of the words more salient. The researcher asks the participant to
read each word; the word is supplied if there is no response within three seconds, or if the word
is mispronounced. The participant is asked if s/he has seen or heard the word before. The
researcher then initiates the conversation of each word pair with the prompt: “Tell me a way
these two words are similar to each other.” A flow chart is followed in order to standardize
subsequent probing questions; however, the exact phrasing of follow-up questions is based on
the wording of individual responses. Before moving on to the next word pair, the researcher asks,
“What does the word ______mean to you?” for each word (see Table 4).

Table 4. Derivational Relatedness Interview Flow Chart
READ: I am going to be asking you questions about words. There is no right or wrong answer to these questions; we really just want to know what you think about certain pairs of words. Your thoughts about these words will help teachers learn how to teach vocabulary better.
First, I will show you a pair of words and ask you to read them. Then, I will ask you some questions about that pair of words. Let’s try a couple of practice word pairs.
POINT: Show word pair. Wait two seconds; if the participant does not read the words, read them aloud. Point to each word as you say it aloud.
Sample 1 hunthunted
Sample 2 triptriple
Pair 1 trustdistrust
Pair 2 predictpredictable
Pair 3 admireadmiral
Pair 4 cavecavity
Pair 5 equalequality
Pair 6 fractionfracture
Pair 7 mistakeunmistakable

The word pairs, other than the two unrelated pairs, are derivationally related with varying
levels of transparency, and range from simple affixation (trust/distrust) to affixation with sound
and/or spelling change (equal/equality; cave/cavity). To mitigate the influence of vocabulary,
base words were chosen that, according to Dale and O’Rourke (1981) are known by a majority
of fourth through sixth-grade students. Audio recordings were made of each interview and later
transcribed. Each taped interview was approximately 10-15 minutes in length.
Dissertation Research Design
The study is a mixed methods research design is defined by Creswell and Plano Clark
(2007) as follows:
As a method; it focuses on collecting, analyzing, and mixing both quantitative andqualitative data in a single study or series of studies. Its central premise is that theuse of quantitative and qualitative approaches in combination provides a betterunderstanding of research problems than either approach alone. (p. 5)
In this study, qualitative data is collected (student interviews) and it is transformed by
MAXQDA into quantitative data by counting the number of coded responses and by counting the
number of keystrokes in each response. Concurrent with the qualitative data collection,
quantitative data is collected (USI). According to Creswell and Plano Clark (2007) this type of
content analysis study is included as a ‘gray area’ of mixed methods studies because “both
qualitative and quantitative data analysis is going on” (pg. 11, 12).
In this study, the Explanatory Design is used to help explain and to build upon the initial
quantitative results. The Explanatory Design is explained as a four-phase mixed-method. First,
the quantitative portion of the research was conducted and the data were analyzed. Quantitative
data analysis helped identify results that would confirm or deny the interpretation of the collected
qualitative data and the validity of the coding. Figure 1 presents the schematic Explanatory
Design of this mixed-methods study. In Figure 1, the term quantitative is referred to as “quan”,

and the term qualitative is referred to as “QUAL”. Using capitalization of the letters in mixed-
methods research is recommended by Tashakkori and Teddlie (1998) to more clearly illustrate
the relative priority that each method contributes to the study. In this study the emphasis was
placed on collection and analysis of qualitative data to explore its relationship to the quantitative
data.
Figure 1. Explanatory Design of study
MAXQDA Coding
MAXQDA is a software program used to analyze qualitative data by integrating both
qualitative and quantitative methods (www.MAXQDA.com). The collected qualitative data can
be coded so that the data can be classified and transformed into quantitative data with
quantitative aspects such as number of segments and frequency of occurrence. In this way, a
mixed type of analysis can be performed by transforming the occurrence of codes as well as their
frequencies into categorical variables. The numerical data of codes and attributes can then be
exported into Microsoft Excel and/or PASW Statistics (formerly SPSS) to be analyzed in terms
of statistical correlation. “Text search tools, such as MAXQDA…allows researchers to
interrogate the data set, look for co-occurrences of codes or themes, relationships between codes,
and to play with ideas in an exploratory fashion (Lewins & Silver, 2008, p. 11, in D’Andrea,

Waters, & Rudd, 2011 pg. 49). In this study, MAXQDA is used to tabulate and record each
coded answer (‘number’ of responses), as well as the number of typed characters contained in
each coded answer (‘amount’ in response).
L3© Coding (lens for learning levels)
To code the student interviews, each interview was first listened to in its entirety, to gain
insight into prosody and meaning that is captured by the student’s spoken word. Mauthner and
Doucet (1998) suggest that by listening, the researcher can “retain some grasp over the blurred
boundary between their narratives and our interpretation” (pg. 127-128). It has also been
suggested that listening to the taped interview not only checks for accuracy of transcription, but
aids the coder in forming initial reactions and informed assumptions that influence interpretation.
This active listening allows a better sense of how the person interviewed wants to be understood
(McCormack, 2004).
All interviews were coded to identify the levels of learning (L3© - lens for learning levels)
using the following guidelines:
1. GOOD COMPREHENSION – Student verbiage indicates some higher knowledge, where
there is probably no need to reteach. Student use of words indicate some higher learning
connections (similarity, difference, gist and/or extrapolation). It is important to keep in
mind that these are elementary students with grade school vocabularies. For instance
when students were asked to define a word, if they used their own words to correctly
explain the meaning and/or related the word to an experience as a correct explanation, it
was coded GOOD. If the student was asked if they knew another word that started with
the prefix or suffix being discussed, and then gave a correct word, it was coded GOOD.

When there was even a small amount of higher learning connection found in a student’s
correct response, it was coded GOOD.
2. INCOMPLETE COMPREHENSION – Student verbiage indicates somewhat correct
answers but appears to be “using but confusing”; either it is probable that a mini-lesson
would be sufficient to either correct the misunderstanding or link to a higher learning
understanding, or there is some correct basis verbalized, indicating an existing knowledge
that could be used to build on that would likely require a small effort on the part of both
student and teacher to take to good understanding. Most of the student responses fell into
this coding category.
3. LACKING COMPREHENSION – Student verbiage indicates a wrong answer, and is
usually accompanied by the impression that it would take time to discover a basis for
knowledge building, or to discover what the misunderstanding is.
Coding of Pauses
Listening to students’ interviews brought an additional student response to light that had not
been addressed by the previously referenced studies. Many students included frequent pauses of
varying lengths that were either silent or filled with vocalizations such as “erm’s”, “um’s” and
“er’s”. A literature search suggested some options for coding. Over the last 50 years, the
understanding of the purpose of pauses has evolved from being primarily viewed as performance
errors and as a nuisance, to being recognized as correlating to the processes involved with speech
production (including grammatical, stylistic and articulatory function) as well as being linked to
brain functions accessing higher learning centers for thought production (Edrington, Buder, &
Jarmulowicz, 2009; Hawkins, 1971; Ruhlemann, Bagoutinov, & O’Donnell, 2011). In
spontaneous speech, when the speaker found themselves at a loss of words, pauses were the

result, and it was reported that pause length increased to longer than three seconds with
increasing indecision on the part of the speaker (Goldman-Eisler, 1958a; Goldman-Eisler, 1958b;
Goldman-Eisler, 1960). Conversational narrative has had four different types of pauses identified
and investigated: two types of filled pauses, the short silent pause, and the long silent pause. The
short filled pauses (both the “er” and the “erm”) served as discourse markers and placeholders
for planning/recall time, the short silent pause (up to five seconds) served both as planning and
time to recall facts from memory as well as time for necessary articulatory processes, and long
silent pauses (longer than five seconds) were used to temporarily suspend conversation
(Ruhlemann, Bagoutinov, & O’Donnell, 2011). Schonpflug (2008) reported that in retelling a
story, children between the ages of 8 and 10 used fewer and shorter pauses when using gist than
when trying to recall the story verbatim. The conclusion was that fluent retrieval with the shorter
pauses was an indication of higher cognitive processing. However, very short pauses were also
caused by speech production processes (Goldman-Eisler, 1960). Traditionally, minimum cut-off
points for pause durations have ranged from 0.25 seconds to close to 2 seconds since proper
articulation requires short periods of silence (Kowal, Wiese, & O’Connell, 1983).
The timing of student pauses in response to teacher questions revealed that the more difficult
questions were related to an increase in the student’s pause, with the average pause length being
just over 3 seconds for all answered questions (Arnold, Atwood, & Rogers, 1974). Providing
adequate wait-time to allow a sufficient amount of time for the student to think has proven
difficult for teachers, with wait-times reported in normal school teaching situations lasting
around one second (Arnold, Atwood, & Rogers, 1974; Gambrell, 1983). When wait-time was
increased to a value just above three seconds, student discourse improved and higher cognitive
achievement was reported (Honea, 1982; Torbin, 1987). The proper amount of wait time

appropriate for the student was reported to vary depending on the difficulty of the question and
the knowledge base of the student, and was determined to be best decided by the questioner.
Lengthy pauses could be unproductive. As a guideline, uncomfortable lengthy pauses were
reported to last around 5 seconds or more, so the instructor needed to remain sensitive to every
student’s needs in order to avoid an increase of confusion or heightened frustration (Stahl, 1994).
Based on this presented research on pauses, very short pauses (2 seconds and less) had been
associated with thinking time when there was good comprehension, as well as with speech
production issues. Pauses lasting around 3-4 seconds, whether filled or unfilled, have been
associated with incomplete higher comprehension, where more recall time was needed to access
information. Longer unfilled pauses that were determined by the questioner to be uncomfortable
had been associated with an absence of knowledge.
For this study, all short unfilled pauses of less than four seconds will not be coded. These
short pauses have been identified with processes of speech production as well as adequate and
inadequate knowledge, but differentiation cannot be accurately determined in this study’s
interviews. Short, filled pauses of less than four seconds will be coded as incomplete
comprehension as they have been associated with more time needed for recall. Long unfilled
pauses (more than 4 seconds) will be coded as lacking comprehension based on Stahl’s
observation of unproductive wait-time.
The coding parameters for L3© , including examples, are presented in Table 5.

Table 5.L3
© (Lens for Learning Levels) Coding Parameters
Quantitative Parameters Qualitative Parameters Examples
GOODResponse
Correct answers accompanied by higher level learning comments.
Higher level learning is identified by verbalization containing similarity, difference, gist, and/or extrapolation
Student verbiage includes higher knowledge, where there is probably no need to reteach.
It is important to keep in mind that these are elementary students with grade school vocabularies.
When a student is asked to define a word, and they use their own words (synonyms for the original word) to correctly explain the meaning and/or relate the word to an experience as a correct explanation (gist/extrapolation).
Specific example: When asked “What does mistake mean to you?” a GOOD response is “That you did something wrong that you didn’t want to do.” (gist/extrapolation)
When a student is asked if they knew another word that started with the prefix or suffix being discussed and gives a correct word (extrapolation).
INCOMPResponse
Generally correct answers that are not accompanied by higher level learning comments.
Can appear as one word answers or simple phrases that appear to be simple memorization.
Confused responses where partially correct, vague or circular answers are given.
Short filled pauses of less than a 4 second duration.
Student verbiage shows that it is probable that a mini-lesson would be sufficient to either correct the misunderstanding or link to a higher learning level.
Verbiage includes somewhat correct answers but appears to be ‘using but confusing’.
Verbiage shows some correct basis, where an existing knowledge could be used to build on that would likely require a small effort on the part of both student and teacher to take the student to GOOD understanding.
Specific example: When asked “Why do you think equal are both together in both of these words?” (equal & equality), an INCOMP response is “Because they might kind of mean the same thing”.
Specific example: When asked “Can you read the bottom word for me?”, the student response of the correct pronunciation of the written word such as, “trust”, is INCOMP because while correct, it does not indicate higher level learning.
Specific example: When asked “What does hunt mean to you?” and the student response defines only by using the word as in, “It means to hunt something.”
LACKINGResponse
Incorrect answers.
Questions answered with “I don’t know” or similar response.
Unfilled long pauses lasting for more than 4 seconds.
Student verbiage leaves the impression that it would take a chunk of time to discover a basis for knowledge building.
Verbiage indicates it would take a chunk of time to discover what the misunderstanding is.
Specific example: When asked “Take a guess at what admiral might mean” a LACKING response is “Um like a diamond or something.”


Inter-rater reliability was determined following a protocol suggested by Armstrong et al.
(1997). Fifteen percent of the DRI interviews were randomly selected from the pool of student
interviews and the coding was done together as a group. The disagreements averaged less than
10% and were discussed by the group until consensus was reached.
The Pearson r correlation is used to measure the correlation between the DRI and the
USI. In addition, Pearson r2 is calculated to report the coefficient of determination, which
explains the percent of variance shared between the DRI and the USI.
Results
This study examines each student’s performance on the USI in relation to their
performance on the DRI as measured with coding by the lens for learning levels (L3©) using
MAXQDA (www.maxqda.com), a computer assisted mixed-methods software program. Pearson
r is the statistical function selected to measure the correlation between the described measures. .
The suggested interpretations for values of r that will be used to describe the results of this study
were taken from Sprinthall (2003), pg. 287, and are presented in Table 6.
Table 6.
Guilford’s suggested interpretations for values of r___________________________________________________________________ r Value Interpretation___________________________________________________________________
Less than .20 Slight; almost negligible relationship.20-.40 Low correlation; definite but small relationship.40-.70 Moderate correlation; substantial relationship.70-.90 High correlation; marked relationship.90-1.00 Very high correlation; very dependable relationship___________________________________________________________________
L3© Coding Results
A total of 70 DRI student interviews were coded using the L3© protocol. Each interview
lasted approximately 10-15 minutes. The basic structure of the interviews remained constant, but
students talked at different rates, did different amounts of talking for their responses, and the
researcher probed with different numbers of questions to explore a specific student’s knowledge
base. These differences account for the differing interview times. Because the interview is semi-
structured, the number and content of the questions and student responses varied with each
interview. The total number of coded student responses range from 45 to 91 and average 68.
There is zero correlation between the student total number of responses and the total USI. The
amount of student talking is measured by counting the number of keystrokes in the typed
transcript of the student verbal responses. The total quantity of keystrokes (reported as amount)
per interview, range from 980 to 4842 with an average of 2168 keystrokes. There is zero
correlation between the student total amount (quantity of keystrokes) and the total USI.
Because the interviews varied considerably by number of responses and the amount of
talking done by the student, each coding category is reported as a percent of the total for each
student’s interview. The ‘number’ of responses for GOOD, INCOMPLETE, and LACKING is
expressed as a percent, with the number of responses within each category divided by the total
number of responses coded for each interview. The ‘amount’ in the response for GOOD,
INCOMPLETE, and LACKING is expressed as a percent, with the number of keystrokes
recorded for each category divided by the total number of keystrokes coded for each interview.
The researcher’s coding validity was verified with an initial inter-rater reliability of 91%,
with all disagreements being discussed until consensus was reached. Using Excel, Pearson r was

calculated for each L3© coded parameter to attain the correlations with the student’s total USI
score. The data is presented in Table 7.
Table 7.Interview Pearson r correlations (N=70) –Pearson r correlations between L3
© coding categories and Total USI Score -
Correlation between % in Number (GOOD, INCOMPLETE, and LACKING) and USI total score; Correlation between % of Amount (GOOD, INCOMPLETE, and LACKING) and USI total score______________________________________________________________________ % No. % No. % No. % Amount % Amount % Amount GOOD INCOMP LACKING GOOD INCOMP LACKING__ +0.66** +0.07 -0.56** +0.73** -0.53** -0.47**______________________________________________________________________
**p< .01
The number of GOOD responses (r = 0.66, p < .01) indicates a statistically significant
moderate positive correlation with the USI. The number of LACKING responses (r = -0.56, p
< .01) indicates a statistically significant moderate negative correlation with the USI. The
number of INCOMPLETE responses did not correlate with the USI (r = 0.07).
The amount in GOOD responses (r = 0.73, p < .01) indicates a statistically significant
high positive correlation with the USI. The amount in INCOMPLETE responses (r = -0.53, p
< .01) and the amount in LACKING responses (r = -0.47, p < .01) both indicated statistically
significant moderate negative correlations with the USI.
In summary, all coding categories but one, the number of INCOMPLETE, indicate
statistically significant moderate to high correlations to the USI. All of the coding categories for
the amount in the responses indicate statistically significant moderate to high correlations with
the student USI.

Pearson r expresses associational meanings, but they are not proportional. To uncover the
strength of proportion, for instance whether one number has twice the predictive power of
another, Pearson r must be squared to produce r 2, the coefficient of determination (Sprinthall,
2003). The coefficient of determination data is presented in Table 8.
Table 8.Interview coefficient of determination (N=70)–Pearson r2 correlations between L3
© coding categories and Total USI Score -
Correlation between % in Number (GOOD, INCOMPLETE, and LACKING) and USI total score; Correlation between % of Amount (GOOD, INCOMPLETE, and LACKING) and USI total score
______________________________________________________________________ % No. % No. % No. % Amount % Amount % Amount GOOD INCOMP LACKING GOOD INCOMP LACKING__ 0.43 0.0 0.31 0.53 0.28 0.22
Viewing the L3© coding parameters as a coefficient of determination, only the percent of
the amount of GOOD student responses shows a little over half of the information derived from
the DRI interview L3© coding is contained and can explain the results of the total USI score. The
number of GOOD responses is close to half, but the rest fall below one-third. In other words, if
all students had the same USI score, the variation in the coding in GOOD responses (both
amount and number) would decrease by around 50%, meaning more uniformity of the coding for
any level of USI score (Sprinthall, 2003, p. 289). The remaining coding parameters would
decrease variations by less than 33%, which does explain an amount of the variation, but not as
much as the GOOD responses. The coefficient of determination provides a more precise
explanation of the high correlations of the USI with the L3© coding by pointing out the amount of
variations that are/are not explained by the coding parameters (Sprinthall, 2003, p. 287-89).

The coefficient of determination, because it is based on equal intervals (unlike the
Pearson r), also allows the relative predictive power of one category to be compared to another.
In this way, the amount in GOOD responses is around 20% more effective than the calculation of
the number of GOOD responses in correlating with the USI (0.53 / 0.43 = 1.23 = 23% more).
The number of LACKING responses is around 40% more effective than the amount of talking a
student does with a LACKING response (0.31 / 0.22 = 1.41 = 41% more). The ratio of
INCOMPLETE amount/number could not be calculated due to the lack of correlation (0.0) to the
USI by the number of INCOMPLETE responses, however the correlation reported for amount in
INCOMPLETE responses (0.28) was more highly correlated to the USI than the number of
INCOMPLETE responses (0.0).
Discussion
The purpose of this mixed methods study was to attempt to construct a lens for coding
interviews exploring students’ knowledge of morphology that could tease out the higher learning
levels of student knowledge. If categories based on the degrees of higher cognitive reflections
could accurately tap a student’s derivational morphological knowledge-base, then the statistics
generated should correlate either positively or negatively to the results of their Upper Level
Spelling Inventory (USI), a proven correlate of reading comprehension.
The coding lens that resulted from those efforts, L3© , was constructed by first looking for
aspects of higher learning that were based on evidence of similarity, difference, gist and
extrapolation within each individual student response in order to tease out the higher learning
functions (GOOD). The remaining student responses were categorized as wrong answers
(LACKING), or those falling somewhere in-between (INCOMPLETE). All three coding
categories included counting both the number of responses and the amount in the responses. The

final coding rubric contains both quantitative and qualitative aspects. This is a previously
unpublished rubric for coding interviews. All three coding categories were figured in two ways:
by ‘amount’ in responses and by ‘number’ of responses. The amount of talking was compiled by
counting the number of keystrokes within each transcribed response then totaling the amounts
for each L3© category, and the number of responses was tallied by keeping count of the number
of responses that were coded for each L3© category.
The percent amount in GOOD was the only coding category that was highly correlated
with the USI. This marked relationship to the USI suggests that the amount of talking in a
GOOD response could be used as a tool to assist accurate assessment of a student’s
morphological knowledge (see Table 7).
The number of GOOD responses and the number of LACKING responses were
moderately correlated to the USI, along with the amount in INCOMPLETE and the amount in
LACKING responses. While all four categories are statistically significant with r values that
range from 0.47 to 0.66, the fact is that they are only moderate correlations to the USI, and are
not expected to be as reliable in their ability to group students homogeneously in the classroom
as the amount of talking in a GOOD response, with its high correlation and marked relationship
to the USI. Results showed a high correlation between the increasing gradients of comprehension
of morphology as measured by L3© coding and increasing upper level spelling inventory scores.
While the literature reviewed suggests that there is still no compelling body of research evidence
for the efficacy of instruction in contextual and morphemic analysis that would expand the
vocabulary or the reading comprehension of children, whether this indicates that the knowledge
of morphology must be acquired by a student as the knowledge is needed rather than by being
taught by a teacher when it is required by the curriculum, or whether the instruments of

measurement are not sensitive enough to accurately quantify the increase of knowledge remains
to be determined with continued research.
Alternative assessments have been used in assessing student achievement, but they are
time consuming to administer and evaluate. A central problem with alternative assessments is
figuring out how to accomplish the assessment in a manageable time period (Maeroff, 1991).
Student interviews, which are time consuming to administer, transcribe and code, are used
infrequently in educational research to assess morphological awareness/knowledge (Berninger,
Abbott, Nagy, & Carlisle, 2010; Carlisle, McBride-Chang, Nagy & Nunes, 2010; Goodwin &
Ahn, 2010, Larsen & Nippold, 2007) and have typically yielded less conclusive information than
multiple choice tests (Nagy, Herman, & Anderson, 1985b). These concerns are valid
impediments for general use of student interviews as an assessment of student knowledge, and
the question of the relative sensitivity of the measurement is ongoing. Our understanding of what
learning entails and how to accurately assess the learning continues to evolve.
Traditionally, only the number or percentage of right and wrong answers has been used
to determine the extent of student knowledge. L3© parameters redefine the traditional right/wrong
lens, and go a step further. By factoring in the amount of student talking (i.e., the number of
keystrokes in the words the child said) the results from this study indicate there could be an
improvement in the accuracy of determining student knowledge when compared to merely
tallying the number of responses (see Table 7). The percentage of GOOD responses does show a
substantial correlation to the USI, but using the determinant of correlation, the amount of student
talking about a concept that they really know indicates an increased correlation of more than
20% when compared to using only the number of responses. The amount of talking in the L3©
GOOD category correlates more highly to the USI than the number of GOOD responses.

The INCOMPLETE category was developed to include student responses that indicated
they were “using but confusing.” When tallying the percent of the number of those responses,
there was no significant correlation to the student’s total USI. When the amount of talking was
taken into consideration, there was a significant and moderate, negative correlation. The more a
student talked and tried to explain when they did not completely understand a concept, the lower
their USI, and conversely, the less a student had to say about what they were not sure of, the
higher their USI. The data indicates that when a student understood that they were confused or
lacked sufficient knowledge, they gave short answers and did not elaborate. When the student
was unsure or did not explicitly recognize that they were not correct, their responses were
extended by giving circular answers, talking about something related to the subject, being
redundant, or going into details that gave insight into their thinking. This extended amount of
talking was hidden and not able to be described by the simple tallying of the number of
INCOMPLETE answers (r2 = 0) (see Table 8), but is clearly shown to exist by using the L3© code
and MAXQDA that quantifies the amount of student talking (r2 = 0.28; r = - 0.53, p < .01, a
moderate negative correlation of the amount of INCOMPLETE responses to the USI). The
amount of talking in the INCOMPLETE L3© category shows an increased negative correlation
with the USI when compared to the number of INCOMPLETE responses. The higher amount of
talking contained in the INCOMPLETE category was a more accurate indicator of student lack
of understanding than the simple number of responses in the INCOMPLETE category, which
had no correlation to the USI.
Both L3© LACKING categories correlated moderately and negatively to the USI. But
unlike the GOOD and INCOMPLETE categories, the number of LACKING responses correlated
more highly to a lower USI score (r2 = 0.31) than the amount of talking the student did to explain

their LACKING response (r2 = 0.22). The number of LACKING responses was 41% more
closely correlated to the student’s USI score than the amount of talking they did (0.31 / 0.22 =
1.41 = 41% more). Similar to the INCOMPLETE response results, the less a student talked, the
higher their USI score tended to be, and conversely, the more a student talked, the lower their
USI score tended to be. In this L3© LACKING category, however, the number of responses
showed a higher correlation to the USI than the amount in the responses.
The moderate negative correlation to the USI with the LACKING category is a
significant contribution to the study’s results, and more can be learned by looking at the
difference between the amount in the responses and the number of responses in this category.
The increased predictive power of number over amount was not expected in the LACKING
category, because most students gave short answers, or answered ‘No’ or not at all when
responding to a question where they lacked knowledge. In reviewing the data, the coders
remarked that while the LACKING responses by students demonstrated a complete lack of
understanding, occasionally there were students who gave long answers that justified a logical,
yet completely incorrect response. Upon further examination, many of those responses did come
from students with higher USI scores. Those students’ long answers are a confounding factor for
the LACKING L3© category, but because they were recognized after the coding process had been
completed, they were not removed or recoded for this study. It was not expected that the negative
correlations of both L3© LACKING categories with the USI would radically change with the
elimination or recoding of those particular responses, but it was considered possible that the
amount in the response would show a different relative correlation to the number of responses. A
restructuring of the parameters for coding LACKING category to better account for this
phenomenon and remove it from this category could change the results of L3© LACKING

category. The possibility of increasing the ability to fine tune a student assessment by taking into
consideration the amount that is spoken is an unexpected positive result of this study.
Pearson r correlations between each L3© category with the total USI score demonstrated
statistically significant moderate to high correlations with the total USI score in five out of the
six L3© coding categories. The L3
© coding of the amount of talking contained in the student
responses to the interviewer’s questions provided more significant results (all were significant)
and generally larger correlations to the USI than the data derived from the number of responses
that a student gave for each L3© category. The only L3
© that was not significantly related to the
USI was from the number of L3© INCOMPLETE response category.
To summarize, in the GOOD responses the amount of talking that the student does in
responding to the question seems to indicate that the more they talk, the more they know: a
positive and high correlation to the USI. The amount of talking demonstrates a 23% increased
predictive power of the amount of knowledge than by tallying the number of responses that
contained higher thinking parameters. The INCOMPLETE responses indicate that the more the
student talked, the less they knew. The amount in INCOMPLETE responses correlated
moderately and negatively with the USI, while the number of INCOMPLETE responses has
close to a 0.0 correspondence with the USI. The amount of talking, again, provides a more
accurate indication of the amount of higher thinking in this category. In the LACKING category,
the data indicates that for both number of responses as well as the amount in responses, the more
entries, the lower the student level of knowledge. Unlike the GOOD and INCOMPLETE
categories, the number of LACKING responses correlate more highly to the USI than the amount
in the responses. Pearson r2 describes the number of responses producing a 41% increased
predictive power of the lack of knowledge than the amount of talking in the LACKING category.

Limitations of the Present Study
L3© coding entails structuring the interview, recording, transcribing, coding, and
interpretation of the results. As such, it is too time intensive for regular classroom use.
Conclusions and Future Prospects
The insights gained using Pearson r and r2 help explain learning levels within a
population of 4th, 5th and 6th Grade students. The high correlation (r = .73) of the amount of
GOOD student response with the USI suggests that cognitive reflections coded using L3© could
be used to more accurately assess orthographic knowledge of 4th, 5th and 6th grade students as
measured by the USI to link orthography and morphology than other more customary
assessments.
The coding lens for learning levels, L3© , offers a method to assess student interviews that
expands the more traditional right/wrong differentiation into variations of learning levels. L3©
high correlation to the USI suggests that interviews could be used as an additional assessment
measure to correlate a student’s knowledge of morphology and orthography.
Teachers customarily use informal student interviews to assess student knowledge in the
classroom, but there has been no reliable way to report the findings. If teachers can listen for the
higher learning levels as coded by L3© and find that their results correlate with the other usual
and customary assessment measures used in the classroom, interviews could then be more easily
used as a valid assessment vehicle by the elimination of the transcription and coding which made
interviews time consuming to administer and evaluate. Further study is needed to explore the
efficacy of using L3© to simply listen to student responses to scientifically determine a student’s
knowledge level.

References
Adams, W. K., & Wieman, C. E. (2011). Development and validation of instruments to measure
learning of expert-like thinking. International Journal of Science Education, 33(9), 1289-
1312.
Anglin, J. M. (1993). Vocabulary development: A morphological analysis. Monographs of the
Society of Research in Child Development, 58 (10, Serial No. 238).
Apel, K., & Thomas-Tate, S. (2009). Morphological awareness skills of fourth-grade African
American students. Language, Speech, and Hearing Services in Schools, 40, 312-324.
Arnold, D. S., Atwood, R. K., & Rogers, V. M. (1974). Question and response levels and lapse
time intervals. The Journal of Experimental Education, 43(1), 11-15.
Armstrong, Gosling, Weinman, & Marteau. (1997). The place of inter-rater reliability in
qualitative research: An empirical study. Sociology, 31(3), 597-606.
Baumann, J. F., Edwards, E. E., Font, G., Tereshinski, C. A., Kame’enui, E. J., & Olejnik, S.
(2002). Teaching morphemic and contextual analysis to fifth-grade students. Reading
Research Quarterly, 37(2), 150-176.
Baumann, J. F., Kame’enui, E. J., & Ash, G. E. (2003). Research on vocabulary instruction:
Voltaire redux. In J. Flood, J. Jensen, P. Lapp, & J. R. Squire (Eds.), Handbook of
research on teaching the English language arts (pp. 752-785). Mahwah, NJ: Earlbaum.
Bear, D., Invernizzi, M., Templeton, S., & Johnston, F. (2008). Words their way: Word study for
phonics, vocabulary, and spelling instruction. Upper Saddle River, NJ: Prentice Hall.
Bear, D. R., Invernizzi, M., Templeton, S., & Johnston, F. J. (2012). Words their way (5th ed.).
Boston, MA: Pearson/Allyn & Bacon.
Berninger, V. W., Abbott, R. D., Nagy, W., & Carlisle, J. (2010). Growth in phonological,
orthographic, and morphological awareness in grades 1 to 6. Journal of Psycholinguistic
Research, 39, 141-163.
Bryant, P., & Nunes, N. (2006). Morphemes and literacy: A starting point. In T. Nunes, P.
Bryant, U. Pretzlik, & J. Hurry (Eds.), Improving Literacy by Teaching Morphemes (pp.
3-33). New York, NY: Routledge.
Carlisle, J.F. (1988). Knowledge of derivational morphology and spelling ability in fourth, sixth
and eighth grades. Applied Psycholinguistics, 9, 247-266.
Carlisle, J. F. (2000). Awareness of the structure and meaning of morphologically complex
words: Impact on reading. Reading and Writing Journal, 12, 169-190.
Carlisle, J. F. (2003). Morphology matters in learning to read: A commentary. Reading
Psychology, 24, 291-322.
Carlisle, J. F., McBride-Chang, C., Nagy, W., & Nunes, T. (2010). Effects of instruction in
morphological awareness on literacy achievement: An integrative review. Reading
Research Quarterly, 45(4), 464-487.
Carlisle, J. F., & Fleming, J. (2003). Lexical processing of morphologically complex words in
the elementary years. Scientific Studies of Reading, 7, 230-254.
Casalis, S., Deacon, S.H., & Pacton, S. (2011). How specific is the connection between
morphological awareness and spelling? A study of French children. Applied
Psycholinguistics, 32, 499-511.
Center for Research in Educational Policy. (2007, February). Words Their Way spelling
inventories: Reliability and validity analysis (Fact Sheet). Memphis, TN: University of
Memphis.

Collins, L. (2005). Accessing second language learners’ understanding of temporal morphology.
Language Awareness, 14(4), 207-220.
Constantinou, C., Hadjilouca, R., & Papadouris, N. (2010). Students’ epistemological awareness
concerning the distinction between science and technology. International Journal of
Science Education, 32(2), 143-172.
Conti-Ramsden, G., Durkin, K., Simkin, Z., Lum, J. A., & Marchman, V. (2011). The PTT-20:
UK normative data for 5- to 11-year-olds on a 20-item past-tense task. International
Journal of Language Communication Disorders, 46(2), 243-248.
Creswell, J., & Plano Clark, V. (2007). Research design: Qualitative, quantitative, and mixed
methods approaches (2nd ed.). Thousand Oaks, CA: Sage.
Cunningham, P. (2006). What if they can say the words but don’t know what they mean? The
Reading Teacher, 59(7), 708-711.
Dale, E., & O’Rourke, J. (1981). Living word vocabulary. Chicago, IL: World Book/Childcraft
International.
Deacon, S.H., Kirby, J.R., & Casselman-Bell, M. (2009). How robust is the contribution of
morphological awareness to general spelling outcomes? Reading Psychology, 30, 301-
318.
Dunn, L. M., Dunn, D. M., & Pearson Assessments (2007). Peabody picture vocabulary test
[educational test]. Published instrument. Minneapolis, MN: Pearson Assessments.
D’Andrea, L. M., Waters, C., & Rudd, R. (2011). Using computer assisted qualitative software
(CAQDAS) to evaluate a novel teaching method for introductory statistics. International
Journal of Technology in Teaching and Learning, 7(1), 48-60.

Ebbers, S. M., & Denton, C. A. (2008). A root awakening: Vocabulary instruction for older
students with reading difficulties. Learning Disabilities Research & Practice, 23(2), 90-
102.
Edrington, J. L., Buder, E. H., & Jarmulowicz, L. (2009). Hesitation patterns in third grade
children’s derived word productions. Clinical Linguistics & Phonetics, 23(5), 348-374.
Freyd, P., & Baron, J. (1982). Individual differences in acquisition of derivational morphology.
Journal of Verbal Learning and Verbal Behavior, 21, 282-295.
Gambrell, L. B. (1983). The occurrence of think-time during reading comprehension instruction.
The Journal of Educational Research, 77(2), 77-80.
Goldman-Eisler, F. (1958a). Speech production and the predictability of words in context.
Quarterly Journal of Experimental Psychology, 10, 96-106.
Goldman-Eisler, F. (1958b). The predictability of words in context and the length of pauses in
speech. Language & Speech, 1(3), 226-231.
Goldman-Eisler, F. (1960). The distribution of pause durations in speech. Language & Speech,
4(1), 232-237.
Goodwin, A. P., & Ahn, S. (2010). A meta-analysis of morphological interventions: effects on
literacy achievement of children with literacy difficulties. Annals of Dyslexia, 60, 183-
208.
Green, L. (2009). Morphology and literacy: Getting our heads in the game. Language, Speach
and Hearing Services in Schools, 40, 283-285.
Harris, M. L., Schumaker, J. B., & Deshler, D. D. (2011). The effects of strategic morphological
analysis instruction on the vocabulary performance of secondary students with and
without disabilities. Learning Disability Quarterly, 34(1), 17-33.

Hawkins, P. R. (1971). The syntactic location of hesitation pauses. Language & Speech, 14(3),
277-288.
Henry, M. K. (1988). Beyond phonics: Integrated decoding and spelling instruction based on
word origin and structure. Annals of Dyslexia, 38, 259-275.
Henry, M. K. (1989). Children’s word structure knowledge: Implications for decoding and
spelling instruction. Reading and Writing: An Interdisciplinary Journal, 2, 135-152.
Honea, Jr, J. M. (1982). Wait-time as an instructional variable: An influence on teacher and
student. The Clearing House, 56(4), 167-170.
Jarmulowicz, L. (2006). School-aged children’s phonological production of derived English
words: Theoretical/review article. Journal of Speech, Language and Hearing Research,
49, 294-308.
Jarmulowicz, L., & Hay, S. E. (2009). Derivational morphophonology: Exploring errors in third
graders’ productions. Language, Speech and Hearing Services in Schools, 40, 299-311.
Kieffer, M. J., & Lesaux, N. K. (2007). Breaking down words to build meaning: Morphology,
vocabulary, and reading comprehension in the urban classroom. The Reading Teacher,
61(2), 134-144.
Kieffer, M. J., & Lesaux, N. K. (2010). Morphing into adolescents: Active word learning for
English-language learners and their classmates in middle school. Journal of Adolescent &
Adult Literacy, 54(1), 47-56.
Kowal, S., Wiese, R., & O’Connell, D. C. (1983). The use of time in storytelling. Language and
Speech, 26(4), 377-392.

Larsen, J. A., & Nippold, M. A. (2007). Morphological analysis in school-age children: Dynamic
assessment of a word learning strategy. Language, Speech, and Hearing Services in
Schools, 38, 201-212.
MAXQDA-10 (2007). MAXQDA - The Professional Tool for Qualitative Data Analysis
[Software]. Published instrument. Available at www.MAXQDA.com
Maclellan, E. (2004). Authenticity in assessment tasks: a heuristic exploration of academics’
perceptions. Higher Education Research & Development, 23(1), 19-33.
Maeroff, G. I. (1991). Assessing alternative assessment. The Phi Delta Kappan, 73(4), 272-281.
Mahony, D. (1994). Using sensitivity to word structure to explain variance in high school and
college level reading ability. Reading and Writing: An Interdisciplinary Journal, 6, 19-
44.
Mahony, D., Singson, M., & Mann, V. (2000). Reading ability and sensitivity to morphological
relations. Reading and Writing: An Interdisciplinary Journal, 12, 191-218.
Mann, V., & Singson, M. (2003). Linking morphological knowledge to English decoding
ability: Large effects of little suffixes. In E. Assink & D. Sandra (Eds.), Reading complex
words: Cross-language studies (pp. 1-25). Dordrecht, the Netherlands: Kulwer.
Mathews, M. M. (1966). Teaching to read: Historically considered. Chicago, IL: The University
of Chicago Press.
Mauthner, N., & Doucet, A. (1998). Reflections on a voice-centred relational method. In J.
Ribbens & R. Edwards (Eds.), Feminist dilemmas in qualitative research (pp. 119-146).
London: Sage Publications.
McCormack, C. (2004). Storying stories: a narrative approach to in-depth interview
conversations. International Journal of Social Research Methodology, 7(3), 219-236.

NCR (National Research Council) (2001). Knowing what students know. The science and design
of educational assessment. In J. W. Pellegrino, N. Chudowsky, & R. Glaser (Eds.),
Committee on the foundations of assessment (Board on Testing and Assessment Center
for Education Division of Behavioral and Social Sciences and Education) (pp. 1-14).
Washington, DC: National Academy Press.
Nagy, W., Berninger, V. W., & Abbott, R. D. (2006). Contributions of morphology beyond
phenology to literacy outcomes of upper elementary and middle-school students. Journal
of Educational Psychology, 98, 134-147.
Nagy, W. E., Herman, P. A., & Anderson, K. (1985). Learning word meanings from context:
How broadly generalizable? (Tech. Rep. No. 347). Urbana-Champaign: University of
Illinois: Center for the Study of Reading.
Nagy, W. E., & Scott, J. A. (2000). Vocabulary processes. In M. I. Kamil, P. Mosenthal, P. D.
Pearson, & R. Barr (Eds.), Handbook of reading research (Vol. 3, pp. 269-284).
Mahwah, NJ: Erlbaum.
Nagy, W., Herman, P., & Anderson, R. (1985b). Learning words from context. Reading
Research Quarterly, 20, 233-253.
Nippold, M. A., & Sun, L. (2008). Knowledge of morphologically complex words: A
developmental study of older children and young adolescents. Language, Speech, and
Hearing Services in Schools, 39, 365-373.
Otterman, L. M. (1955). The value of teaching prefixes and word-roots. The Journal of
Educational Research, 48(8), 611-616.
Pressley, M., Disney, L., & Anderson, K. (2007). Landmark vocabulary instructional research
and the vocabulary instructional research that makes sense now. In R. K. Wagner, A. E.

Muse, & K. R. Tannenbaum (Eds.), Vocabulary acquisition: Implications for reading
comprehension (pp. 205-232). New York, NY: The Guilford Press.
Rapp, D. N., Van den Broek, P., McMaster, K. L., Kendeou, P., & Espin, C. A. (2007). Higher-
order comprehension processes in struggling readers: A perspective for research and
intervention. Scientific Studies of Reading, 11(4), 289-312.
Reed, D. K. (2008). A synthesis of morphology interventions and effects on reading outcomes
for students in grades K-12. Learning Disabilities Research & Practice, 23, 36-49.
Rubin, H. (1988). Morphological knowledge and early writing ability. Language and Speech,
31(4), 337-355.
Ruhlemann, C., Bagoutinov, A., & O’Donnell, M. B. (2011). Windows on the mind: Pauses in
conversational narrative. International Journal of Corpus Linguistics, 16(2), 198-230.
Schonpflug, U. (2008). Pauses in elementary school children’s verbatim and gist free recall of a
story. Cognitive Development, 23, 385-394.
Sesma, H. W., Mahone, E. M., Levine, T., Eason, S. H., & Cutting, L. E. (2009). The
contribution of executive skills to reading comprehension. Child Neuropsychology, 15(3),
232-246.
Siegel, L.S. (2008). Morphological awareness skills of English language learners and children
with dyslexia. Topics in Language Disorders, 28 (1),15-27.
Singson, M., Mahony, D., & Mann, V. (2000). The relation between reading ability and
morphological skills: Evidence from derivation suffixes. Reading and Writing, 12, 191-
218.
Sprinthall, R.C. (2003). Basic Statistical Analysis. (7th ed.). Boston, MA: A and B.

Stahl, R. J. (1994). Using “think-time” and “wait-time” skillfully in the classroom (ERIC
Development Team-ED370885 1994-05-00). Retrieved from Eric Digests:
http://www.eric.ed.gov
Swanborn, M. S., & de Glopper, K. (1999). Incidental word learning while reading: A meta-
analysis. Review of Educational Research, 69(3), 261-285.
Tashakkori, A., & Teddlie, C. (1998). Mixed-methodology: Combining qualitative and
quantitative approaches. Thousand Oaks, CA: Sage.
Templeton, S. (1989). Tacit and explicit knowledge of derivational morphology: Foundations for
a unified approach to spelling and vocabulary development in the intermediate grades and
beyond. Reading Psychology, 10(3), 233-253.
Templeton, S. (1992). Theory, nature, and pedagogy of higher-order orthographic development
in older students. In S. Templeton, & D. R. Bear (Eds.), Development of the orthographic
knowledge and the foundations of literacy: A memorial festschrift for Edmund H.
Henderson (pp. 253-277). Hillsdale, NJ: Erlbaum.
Templeton, S. (2004). The vocabulary-spelling connection: orthographic development and
morphological knowledge at the intermediate grades and beyond. In J. F. Baumann, & E.
J. Kame’enui (Eds.), Vocabulary instruction: Research to practice (pp. 118-138). New
York, NY: The Guilford Press.
Templeton, S., Bear, D. R., Invernizzi, M., & Johnston, F. (2010). Vocabulary their way: Word
study with middle and secondary students. Boston, MA: Pearson.
Templeton, S., & Morris, D. (2000). Spelling. In M. Kamil, P. Mosenthal, P. D. Pearson, & R.
Barr (Series Ed.), Handbook of reading research: Vol. 3. , (pp. 525-543). Mahway, NJ:
Erlbaum.

Templeton, S., Smith, D., Maloney, K., & Ives, B. (2007, December). The nature of morphology
in a developmental model of word knowledge. Paper presented at the 57th annual meeting
of the National Reading Conference, Orlando, FL.
Templeton, S., Smith, D., Moloney, K., Van Pelt, J., & Ives, B. (2009, December). Generative
vocabulary knowledge: Learning and teaching higher-order morphological aspects of
word structure in grades 4, 5, and 6. Paper presented at the 59th annual meeting of the
National Reading Conference, Albuquerque, NM.
Tobin, K. (1987). The role of wait time in higher cognitive level learning. Review of Educational
Research, 57(1), 69-95.
Tyler, A., & Nagy, W. (1990). Use of derivational morphology during reading. Cognition, 36,
17-34.
Venezky, R. L. (1967). English orthography: Its graphical structure and its relation to sound.
Reading Research Quarterly, 1, 59-85.
Verhoeven, L., & Perfetti, C. A. (2011). Morphological processing in reading acquisition: A
cross-linguistic perspective. Applied Psycholinguistics, 32, 457-466.
White, T. G., Power, M. A., & White, S. (1989). Morphological analysis: Implications for
teaching and understanding vocabulary growth. Reading Research Quarterly, 24(3), 283-
304.
Windsor, J. (1994). Children’s comprehension and production of derivational suffixes. Journal
of Speech and Hearing Research, 37, 408-417.
Wysocki, K., & Jenkins, J. R. (1987). Deriving word meanings through morphological
generalization. International Reading Association, 22(1), 66-81.