Embed Size (px)
Citation preview

HSM Global Market Study
Ponemon Institute© Research Report
Sponsored by HP Atalla Independently conducted by Ponemon Institute LLC Publication Date: July 2014

Ponemon Institute© Research Report Page 1
HSM Global Market Study Ponemon Institute, July 2014
Part 1. Introduction Ponemon Institute is pleased to present the HSM Global Market Study sponsored by HP Atalla. The purpose of this research is to provide a competitive analysis of the hardware security module (HSM) marketplace in three global regions.1 We surveyed 580 IT and IT security practitioners in the United States, Asia and Latin America about their use of hardware security modules (HSM).2 All organizations represented in this research use HSMs. Seventy-one percent of respondents say their use of HSMs is extensive or moderate and 28 percent say usage is light. Seventy-two percent are the primary users of the vendor’s products and 53 percent influenced the selection of the vendor. Some of the most noteworthy findings according to the topics above are shown below: § HSMs are mostly used for key management purposes or payments. On average,
organizations have approximately 13 HSMs for key management purposes followed by an average of 8 HSMs for payments.
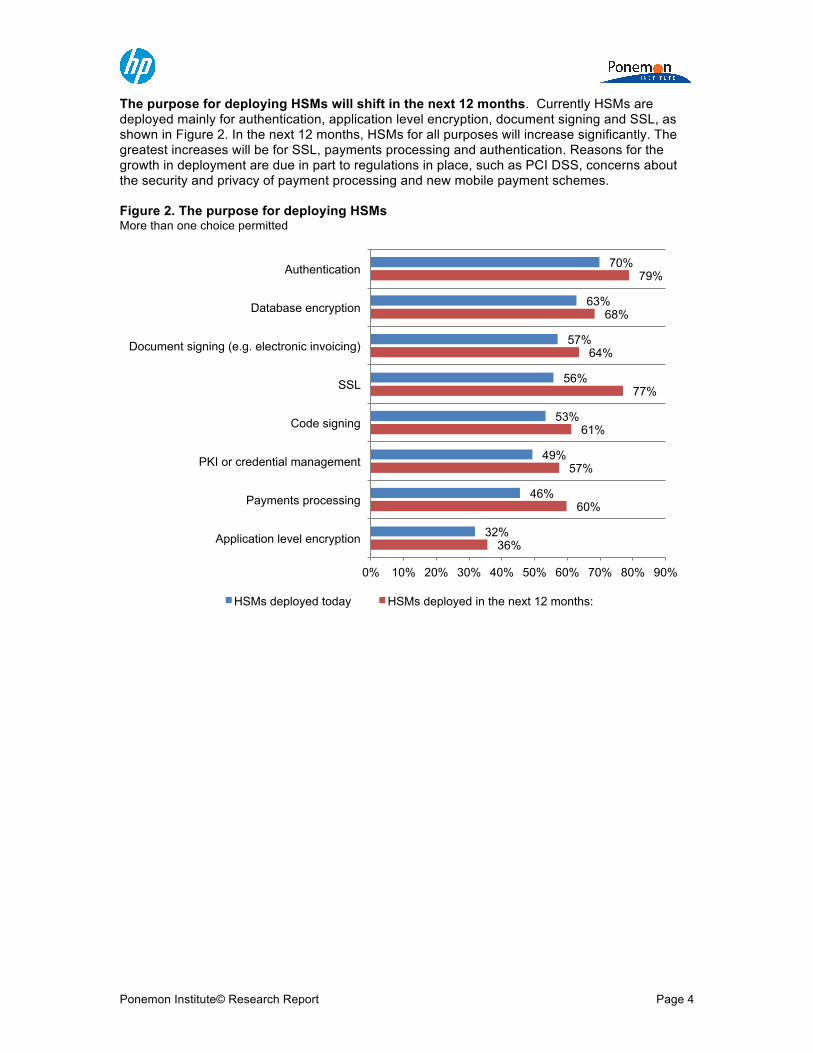
§ The purpose for deploying HSMs will shift in the next 12 months. Currently HSMs are
deployed mainly for authentication, application level encryption, document signing and SSL. In the next 12 months, HSMs for all purposes will increase significantly. The greatest increases will be for SSL, payments processing and authentication. Reasons for the growth in deployment are due in part to regulations in place, such as PCI DSS, concerns about the security and privacy of payment processing and new mobile payment schemes.
§ What is the importance of the physical security of HSMs? The need for HSM physical
security is most important for key management solutions, tokenization/format preserving encryption (FPE) solutions and payments HSMs.
§ What do organizations want in their HSM solutions? The features considered most
important are: automated management of keys, automated enforcement of policy, system performance and latency, tamper resistance by dedicated hardware and centralized management interface.
§ What is the ideal solution? The most important reasons for selecting their present HSM
solution or vendor are the cost and value of the solution, high interoperability with other encryption or key management solutions and ease of use. Of least concern are proven track record of the product or vendor, worry-free installation and product certification.
1The Asian regional cluster sample is composed of English speaking Asia-Pacific countries, including: Australia, New Zealand, India, Singapore and Malaysia. The LATAM cluster is composed of Spanish-speaking countries in Central and South America plus Mexico. 2Approximately 36 percent of all initial sample returns indicated that the respondents’ organizations did not use HSM in any capacity. These individuals were screened from the final sample.
Hardware Security Modules (HSM) are devices specifically built to create a tamper-resistant environment in which to perform cryptographic processes (e.g. encryption or digital signing) and to manage keys associated with those processes. HSMs often provide cryptographic acceleration that is measured in terms of operations. These devices are used to protect critical data processing activities associated with server based applications and can be used to strongly enforce security policies and access controls. These modules are physical devices that traditionally come in the form of a plug-in card or an external network connected appliance and are often validated against security standards such as FIPS 140-2 level 3.

Ponemon Institute© Research Report Page 2
§ Respondents generally hold positive perceptions about their HSM solution providers. The most positive perceptions are: the HSM solution cannot be compromised by operational or environmental conditions and they are completely tamperproof. Respondents in the US are especially positive about the HSM logging mechanisms that are fully protected against unauthorized modification, substitution or deletion.
§ How important is HSM to key management strategies? Most organizations represented in
this research say HSM is either very important (35 percent of respondents) or important (31 percent of respondents) to their encryption key management strategy. The level of importance increases in the next 12 months. Thirty-eight percent say it will be very important and 32 percent say it will be important to their key management strategy.
§ The development of key management systems is mostly outsourced. The source of their
organization’s key management systems is mostly externally developed custom system (57 percent of respondents) and commercial, off-the-shelf key management component (52 percent of respondents).
§ Will organizations deploy key management interoperability protocol (KMIP)? Seventy-
nine percent of respondents say their organization has deployed or plans to deploy sometime in the future key management interoperability protocol (KMIP). Sixty-two percent say KMIP adoption is very important or important to HSM procurement and deployment decisions.
§ Key management strategies improve security and reduce costs. The majority of
respondents (53 percent) say they do not have a key management strategy that is independent of the various uses of cryptography within their organization. Of the 47 percent who say they do have a strategy, the primary drivers are to improve security (64 percent) and reduce operational cost (55 percent).

Ponemon Institute© Research Report Page 3
Part 2. Key findings In this section we present an analysis of the consolidated key findings for the U.S., Asia and LATAM. The complete audited findings are presented in the appendix of this report. We have organized the report according to the following themes: § Current and projected use of HSMs § Solution features & vendor perception § Drivers for adoption § Current and projected budget § The global view § Competitive analysis Current and projected use of HSMs HSMs are mostly used for key management purposes or payments. As shown in Figure 1, on average, organizations have approximately 13 HSMs for key management purposes followed by an average of 8 HSMs for payments, an average of 7 for general purposes and an average of 6 for tokenization/FPE. Figure 1. How many HSMs does your organization currently deploy? Extrapolated average
12.62
7.71 6.63
5.62
0.00
2.00
4.00
6.00
8.00
10.00
12.00
14.00
Key management Payments HSMs General purpose HSMs Tokenization/FPE
Ponemon Institute© Research Report Page 4
The purpose for deploying HSMs will shift in the next 12 months. Currently HSMs are deployed mainly for authentication, application level encryption, document signing and SSL, as shown in Figure 2. In the next 12 months, HSMs for all purposes will increase significantly. The greatest increases will be for SSL, payments processing and authentication. Reasons for the growth in deployment are due in part to regulations in place, such as PCI DSS, concerns about the security and privacy of payment processing and new mobile payment schemes. Figure 2. The purpose for deploying HSMs More than one choice permitted
36%
60%
57%
61%
77%
64%
68%
79%
32%
46%
49%
53%
56%
57%
63%
70%
0% 10% 20% 30% 40% 50% 60% 70% 80% 90%
Application level encryption
Payments processing
PKI or credential management
Code signing
SSL
Document signing (e.g. electronic invoicing)
Database encryption
Authentication
HSMs deployed today HSMs deployed in the next 12 months:

Ponemon Institute© Research Report Page 5
What is the importance of the physical security of HSMs? The need for HSM physical security is most important for key management solutions, tokenization/format preserving encryption (FPE) solutions and payments HSMs (Figure 3). Figure 3. How important is the physical security of HSMs 0 = least important to 10 = most important
7.69 6.93 6.88 6.81
0.00
1.00
2.00
3.00
4.00
5.00
6.00
7.00
8.00
9.00
10.00
Key management solutions
Tokenization/FPE Payments HSMs General Purpose HSMs

Ponemon Institute© Research Report Page 6
Solution features & vendor perception What do organizations want in their HSM solutions? Features considered most important are: automated management of keys and enforcement of policy, system performance and latency, tamper resistance by dedicated hardware and centralized management interface (Figure 4). Figure 4. Important features associated with HSM solutions Very important and important response combined
What is the ideal solution? The most important reasons for selecting their present HSM solution or vendor are the cost and value of the solution, high interoperability with other encryption or key management solutions and ease of use (Figure 5). Of least concern is the proven track record of the product or vendor. Figure 5. Most important reasons for selecting your present HSM solution/vendor Three responses permitted
80%
81%
82%
85%
90%
0% 10% 20% 30% 40% 50% 60% 70% 80% 90% 100%
Centralized management interface
Tamper resistance by dedicated hardware
System performance and latency
Automated enforcement of policy
Automated management of keys
15%
16%
17%
19%
28%
41%
52%
53%
58%
0% 10% 20% 30% 40% 50% 60% 70%
Proven track record of the product/vendor
Worry-free installation
Product certification
Reputation of the product/vendor
Vendor’s responsiveness to urgent needs or requests
High performance reliability
Ease of use
High interoperability with other encryption or key management solutions
Cost/value

Ponemon Institute© Research Report Page 7
Respondents generally hold positive perceptions about their HSM solution providers. Figure 6 lists the perceptions respondents have about their vendors. The most positive perceptions concern the security of their HSM solutions. Specifically, HSM solutions cannot be compromised by operational or environmental conditions and they are completely tamperproof. Respondents are not as positive about the scalability, cost effectiveness and interoperability of their solutions or vendors. Figure 6. Perceptions about the HSM product/vendor 0 = Disagree completely to 10 = Agree completely
6.43
6.58
6.63
6.67
6.88
6.98
7.03
7.03
7.12
7.24
7.28
8.10
8.14
0.00 1.00 2.00 3.00 4.00 5.00 6.00 7.00 8.00 9.00 10.00
Have a high level of interoperability with other data protection or security technologies
Cost efficient and provide good value
Solutions are very scalable
Easy to operate and maintain
Able to detect false authentication data
Ensures cryptographic keys are only used for a single cryptographic function or purpose
Provides excellent support and training
Easy to install
Supports multiple applications
Meet or exceed regulatory, policy and legal obligations
Provides logging mechanisms protected against unauthorized modification, substitution or
deletion
Solutions are completely tamperproof
Cannot be compromised by operational or environmental conditions

Ponemon Institute© Research Report Page 8
Drivers for adoption How important is HSM to key management strategies? According to Figure 7, most organizations represented in this research say HSM is either very important (35 percent of respondents) or important (31 percent of respondents) to their encryption key management strategy. The level of importance increases significantly in the next 12 months. Thirty-eight percent say it will be very important and 32 percent say it will be important to their key management strategy. Figure 7. How important is HSM to your key management strategy?
The key management systems used. The key management systems most often used are multiple installations of a common key management system that is deployed throughout the organization to address the same use case (47 percent of respondents) followed by a single key management system deployed across the organization to manage a single use case (20 percent of respondents), as shown in Figure 8. Figure 8. Types of key management systems in use More than one choice permitted
35% 31%
25%
9%
38%
32%
27%
3%
0%
5%
10%
15%
20%
25%
30%
35%
40%
Very important Important Somewhat important Not important
Importance now Importance in the next 12 months
14%
19%
20%
47%
0% 5% 10% 15% 20% 25% 30% 35% 40% 45% 50%
Single key management system deployed across the organization to manage multiple use cases
Multiple and different key management systems each deployed for specific use cases
Single key management system deployed across the organization to manage a single use case
Multiple installations of a common key management system that is deployed throughout
the organization to address the same use case

Ponemon Institute© Research Report Page 9
The development of key management systems is mostly outsourced. Figure 9 reveals that the source of their organization’s key management systems is mostly externally developed custom system (57 percent of respondents) and commercial, off-the-shelf key management component (52 percent of respondents). Figure 9. What is the source of your organization’s key management system(s)? More than one choice permitted
Will organizations deploy key management interoperability protocol (KMIP)? According to Figure 10, 79 percent of respondents say their organization has deployed or plan to deploy sometime in the future key management interoperability protocol (KMIP). Sixty-two percent say KMIP adoption is very important or important to HSM procurement and deployment decisions. Figure 10. Does your organization deploy, or plan to deploy, KMIP?
1%
35%
37%
42%
52%
57%
0% 10% 20% 30% 40% 50% 60% 70%
Other
In-house development
Native capability or bundled item with an encryption solution
Commercial, off-the-shelf centralized key management system
Commercial, off-the-shelf key management component
Externally developed custom system
29%
24% 27%
21%
0%
5%
10%
15%
20%
25%
30%
Yes, already deployed Yes, within the next 12 months
Yes, in more than 12 months
No

Ponemon Institute© Research Report Page 10
Key management strategies improve security and reduce costs. The majority of respondents (53 percent) say they do not have a key management strategy that is independent of the various uses of cryptography within their organization. As shown in Figure 11, of the 47 percent who say they do have a strategy, the primary drivers are to improve security (64 percent) and reduce operational cost (55 percent). Figure 11. The primary drivers for developing a key management strategy Two choices permitted
Current and projected budget What organizations are spending on HSM. The total IT budget for the organizations represented in this research is extrapolated at an average of $146 million. Figure 12 shows the current and expected allocation of budget for HSM solutions. Spending on HSM is expected to increase an average of 9 percent. Figure 12. Percentage of IT security budget spent on HSM
19%
19%
43%
55%
64%
0% 10% 20% 30% 40% 50% 60% 70%
Increase business efficiency
Demonstrate compliance
Reduce complexity
Reduce operational cost
Improve security
3%
8%
27%
17% 17%
7%
21%
3%
7%
21%
16% 17%
6%
29%
0%
5%
10%
15%
20%
25%
30%
35%
Zero 1% to 2% 3% to 4% 5% to 6% 7% to 8% 9% to 10% > 10%
2014 IT security budget to be spent on HSM 2015 IT security budget to be spent on HSM

Ponemon Institute© Research Report Page 11
The global view Survey results across three global regions are generally consistent for product features, vendor selection criteria and the importance of HSM physical security. However, as shown in Figure 13, there are differences in the current and projected usage of HSMs. Specifically, respondents in the US report the highest rate of usage for all HSM use cases – namely, payments, general purpose, tokenization/FPE and key management. Respondents in Asia report the lowest use of HSMs for tokenization/FPE and general purposes. Figure 13. How many HSMs does your organization currently deploy? Extrapolated average
In the U.S., respondents have slightly greater concern for the physical security of HSMs, as revealed in Figure 14. The region with the least concern about physical security is Asia. Figure 14. How important is the physical security of HSMs? 0 = least important to 10 = most important
13.65
9.26 7.72
6.9
12.36
6.03 5.07
3.56
10.45
6.07 5.91 5.07
0
2
4
6
8
10
12
14
16
Key management Payments HSMs General purpose HSMs Tokenization/FPE
US Asia Latam
8.15 7.23 7.21 7.09 7.08
6.34 6.24 6.28
7.32 6.93 6.87 6.79
0
1
2
3
4
5
6
7
8
9
Key management solutions
Tokenization/FPE Payments HSMs General Purpose HSMs
US Asia Latam

Ponemon Institute© Research Report Page 12
According to Figure 15, the top reasons to use HSMs among all regions is authentication and database encryption. Respondents in the U.S. are more likely to use HSM solutions for all purposes with the exception of application level encryption. Figure 15. The purpose for deploying HSMs
25%
38%
35%
51%
43%
49%
55%
69%
35%
45%
46%
46%
56%
50%
61%
68%
33%
49%
57%
58%
61%
64%
67%
71%
0% 10% 20% 30% 40% 50% 60% 70% 80%
Application level encryption
Payments processing
PKI or credential management
Code signing
SSL
Document signing
Database encryption
Authentication
US Asia Latam

Ponemon Institute© Research Report Page 13
The purposes for deploying HSMs will increase over the next 12 months, according to Figure 16. The U.S. will use the most HSMs for SSL, document and code signing. Asia will increase HSMs use for application level encryption. Figure 16. HSMs deployed in the next 12 months
27%
52%
37%
64%
56%
55%
76%
71%
40%
56%
51%
69%
47%
54%
83%
76%
37%
65%
69%
70%
71%
72%
78%
80%
0% 10% 20% 30% 40% 50% 60% 70% 80% 90%
Application level encryption
Payments processing
PKI or credential management
Database encryption
Code signing
Document signing (e.g. electronic invoicing)
Authentication
SSL
US Asia Latam

Ponemon Institute© Research Report Page 14
The reasons for selecting a vendor seem to be consistent across all regions, according to Figure 17. However, LATAM respondents see vendor responsiveness as more important than respondents in other regions. Figure 17. Most important reasons for selecting your present HSM solution/vendor Three responses permitted
According to Figure 18, LATAM will increase its deployment the most in more than 12 months. The region less likely to deploy KMIP is Asia. Figure 18. Does your organization deploy, or plan to deploy, KMIP?
34%
41%
50%
55%
57%
25%
38%
52%
57%
59%
28%
42%
53%
51%
58%
0% 10% 20% 30% 40% 50% 60% 70%
Vendor’s responsiveness to urgent needs or requests
High performance reliability
Ease of use
High interoperability with other encryption or key management solutions
Cost/value
US Asia Latam
32%
25% 27%
16%
28%
23% 21%
28%
21% 22%
33%
24%
0%
5%
10%
15%
20%
25%
30%
35%
Yes, already deployed Yes, within the next 12 months
Yes, in more than 12 months
No
US Asia Latam

Ponemon Institute© Research Report Page 15
As revealed in Figure 19, the majority of respondents in all regions consider the adoption of KMIPs as very important or important to HSM procurement and deployment decisions. Figure 19. How important is the adoption of KMIP to your HSM procurement and deployment decisions?
41%
23%
18%
11% 7%
36%
24% 21%
10% 9%
30% 33%
18% 14%
5%
0%
5%
10%
15%
20%
25%
30%
35%
40%
45%
Very important Important Somewhat important
Not important Irrelevant
US Asia Latam

Ponemon Institute© Research Report Page 16
Competitive analysis Our survey included the analysis of nine leading HSM solution providers. Respondents were asked to rate their vendors according to 14 attributes listed in Figure 20. This bar chart reports the results for users of HP/Atalla compared to average results for all nine vendors. Each attribute is rated using a 0-to-10 point scale from disagree completely (0) to agree completely (10). As can be seen, HP Atalla earns ratings that are above the average for 11 of 14 attributes. HP Atalla’s highest product/vendor ratings pertain to meeting regulatory obligations, excellence in vendor support and training, and scalability of HSM solutions. Figure 20. HSM product or vendor attributes 0 = Disagree completely to 10 = Agree completely
6.46
7.07
7.25
7.31
7.49
7.50
7.53
7.66
7.87
8.03
8.05
8.18
8.79
8.86
6.68
6.53
7.03
7.28
6.98
6.43
6.58
7.13
6.88
8.10
8.13
6.62
7.03
7.24
0.00 1.00 2.00 3.00 4.00 5.00 6.00 7.00 8.00 9.00 10.00
Easy to operate and maintain
Does not impair system performance
Easy to install
Provides logging mechanisms protected against unauthorized modification
Ensures cryptographic keys are only used for a single function or purpose
Have a high level of interoperability with other security technologies
Cost efficient and provide good value
Support multiple applications
Able to detect false authentication data
Solutions are completely tamperproof
Cannot be compromised by operational or environmental conditions
Solutions are very scalable
Provides excellent support and training
Meet or exceed regulatory, policy and legal obligations
Average for 9 vendors HP Atalla

Ponemon Institute© Research Report Page 17
Figure 21 reports the average attribute scores for nine vendors including HP Atalla. Please note that competitor names are removed to preserve confidentiality. As shown, HP Atalla and vendor A achieve the highest average score at 7.72 on the 0-to-10 scale described above. The overall average score (indicated by the dashed line) is 7.04, which suggests respondents tend to hold a favorable view of HSM solutions deployed by their organizations. Figure 21. Average HSM attribute scores for nine vendors Each bar reflects the grand average for 14 product/vendor attributes
Figure 22 reports the average promoter scores for nine vendors including HP Atalla. Here again, HP Atalla achieves the highest promoter score at 8.08, which means it is the most likely HSM vendor to be recommended to friends and colleagues. The average promoter score (indicated by the dashed line) is 6.99, which supports our proposition that respondents hold a favorable view of their HSM solutions provider. Figure 22. Average promoter scores for nine vendors 0 = Not at all likely to 10 = Extremely likely
7.72 7.72 7.28 6.94 6.79 6.71 6.51 6.35 6.06
0.00
1.00
2.00
3.00
4.00
5.00
6.00
7.00
8.00
9.00
HP Atalla A B C D E F G H
Overall score Average
8.08 8.01 7.45 7.21 7.02 6.79
6.34 5.99 5.99
0.00 1.00 2.00 3.00 4.00 5.00 6.00 7.00 8.00 9.00
HP Atalla A B C D E F G H
If you had the opportunity, how likely would you be to recommend [name of vendor] for HSM solutions to a friend or colleague?
Average

Ponemon Institute© Research Report Page 18
Part 3. Methods
A sampling frame of 28,265 experienced IT and IT security practitioners in the United States, Asia and Latin America were selected as participants to this survey. Table 1 shows 991 total returns. Screening and reliability checks required the removal of 411 surveys. Our final sample consisted of 580 surveys or a 2.1 percent response rate. Table 1. Sample response Freq Pct% Total sampling frame 28,265 100.0% Total survey returns 991 3.5% Rejected and screened surveys 411 1.5% Final sample 580 2.1%
Pie Chart 1 reports the respondent’s organizational level of their current position within the organization. By design, 51 percent of respondents are at or above the manager/supervisory level. Pie Chart 1. Current position within the organization
Pie Chart 2 reports the respondents functional location within the organization Forty-one percent of respondents are located within IT operations and 23 percent report their job function is in Corporate IT. Pie Chart 2. The functional area that best describes your organizational location
3%
16%
32%
47%
1%
Executive/VP Director Manager/Supervisor Associate/Staff/Technician Other
41%
23%
17%
10%
6% 3%
IT operations
Corporate IT
IT security
Lines of business
Compliance/audit
Other
Ponemon Institute© Research Report Page 19
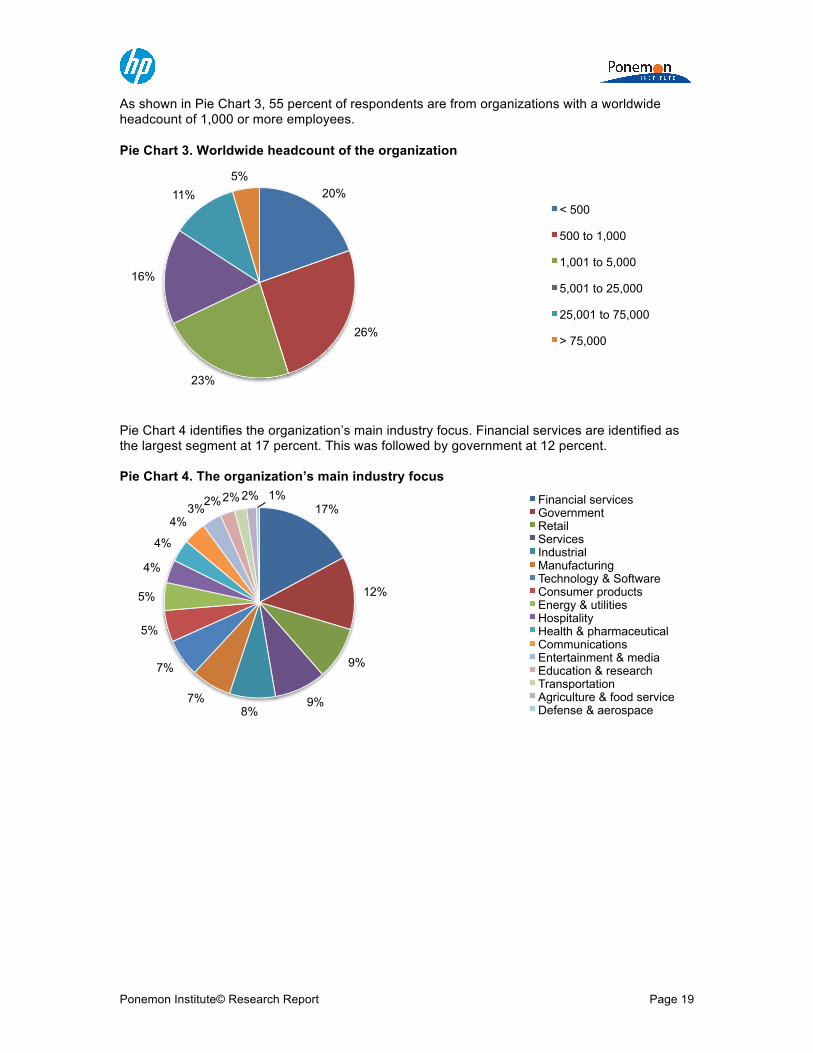
As shown in Pie Chart 3, 55 percent of respondents are from organizations with a worldwide headcount of 1,000 or more employees.
Pie Chart 3. Worldwide headcount of the organization
Pie Chart 4 identifies the organization’s main industry focus. Financial services are identified as the largest segment at 17 percent. This was followed by government at 12 percent. Pie Chart 4. The organization’s main industry focus
20%
26%
23%
16%
11% 5%
< 500
500 to 1,000
1,001 to 5,000
5,001 to 25,000
25,001 to 75,000
> 75,000
17%
12%
9%
9% 8%
7%
7%
5%
5%
4%
4%
4% 3% 2% 2% 2% 1% Financial services
Government Retail Services Industrial Manufacturing Technology & Software Consumer products Energy & utilities Hospitality Health & pharmaceutical Communications Entertainment & media Education & research Transportation Agriculture & food service Defense & aerospace

Ponemon Institute© Research Report Page 20
Part 4. Caveats to this study There are inherent limitations to survey research that need to be carefully considered before drawing inferences from findings. The following items are specific limitations that are germane to most web-based surveys. ! Non-response bias: The current findings are based on a sample of survey returns. We sent
surveys to a representative sample of individuals, resulting in a large number of usable returned responses. Despite non-response tests, it is always possible that individuals who did not participate are substantially different in terms of underlying beliefs from those who completed the instrument.
! Sampling-frame bias: The accuracy is based on contact information and the degree to which
the list is representative of individuals who are IT or IT security practitioners. We also acknowledge that the results may be biased by external events such as media coverage. Finally, because we used a web-based collection method, it is possible that non-web responses by mailed survey or telephone call would result in a different pattern of findings.
! Self-reported results: The quality of survey research is based on the integrity of confidential
responses received from subjects. While certain checks and balances can be incorporated into the survey process, there is always the possibility that a subject did not provide accurate responses.
Ponemon Institute© Research Report Page 21
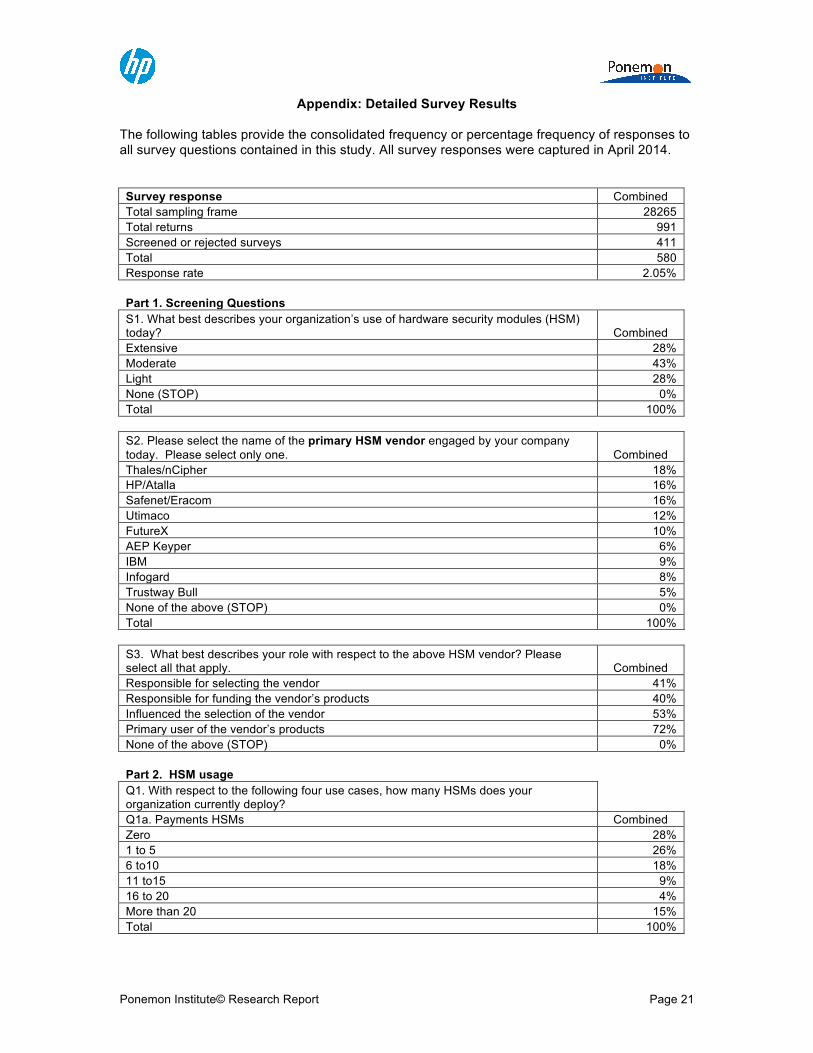
Appendix: Detailed Survey Results
The following tables provide the consolidated frequency or percentage frequency of responses to all survey questions contained in this study. All survey responses were captured in April 2014.
Survey response Combined Total sampling frame 28265 Total returns 991 Screened or rejected surveys 411 Total 580 Response rate 2.05%
Part 1. Screening Questions S1. What best describes your organization’s use of hardware security modules (HSM)
today? Combined Extensive 28% Moderate 43% Light 28% None (STOP) 0% Total 100%
S2. Please select the name of the primary HSM vendor engaged by your company today. Please select only one. Combined Thales/nCipher 18% HP/Atalla 16% Safenet/Eracom 16% Utimaco 12% FutureX 10% AEP Keyper 6% IBM 9% Infogard 8% Trustway Bull 5% None of the above (STOP) 0% Total 100%
S3. What best describes your role with respect to the above HSM vendor? Please select all that apply. Combined Responsible for selecting the vendor 41% Responsible for funding the vendor’s products 40% Influenced the selection of the vendor 53% Primary user of the vendor’s products 72% None of the above (STOP) 0%
Part 2. HSM usage Q1. With respect to the following four use cases, how many HSMs does your
organization currently deploy? Q1a. Payments HSMs Combined
Zero 28% 1 to 5 26% 6 to10 18% 11 to15 9% 16 to 20 4% More than 20 15% Total 100%

Ponemon Institute© Research Report Page 22
Q1b. General purpose HSMs Combined Zero 34% 1 to 5 26% 6 to10 17% 11 to15 9% 16 to 20 5% More than 20 11% Total 100%
Q1c. Tokenization/FPE Combined Zero 36% 1 to 5 28% 6 to10 17% 11 to15 8% 16 to 20 5% More than 20 6% Total 100%
Q1d. Key management Combined Zero 10% 1 to 5 26% 6 to10 15% 11 to15 8% 16 to 20 6% More than 20 36% Total 100%
How important is the physical security of HSMs used by your organization today? Please use the 0 to 10-point scale below each one of the four use cases presented.
Q2a. Payments HSMs (i.e., transaction switching/authorization, terminal key management, and card issuing) Combined Zero 3% 1 to 2 9% 3 to 4 11% 5 to 6 14% 7 to 8 17% 9 to 10 45% Total 100%
Q2b. General Purpose HSMs (i.e., signing, certificate operations, and application crypto support) Combined Zero 3% 1 to 2 9% 3 to 4 12% 5 to 6 16% 7 to 8 16% 9 to 10 44% Total 100%

Ponemon Institute© Research Report Page 23
Q2c. Tokenization/Format Preserving Encryption (FPE) solutions Combined Zero 3% 1 to 2 9% 3 to 4 10% 5 to 6 16% 7 to 8 17% 9 to 10 46% Total 100%
Q2d. Key management solutions Combined Zero 3% 1 to 2 6% 3 to 4 6% 5 to 6 10% 7 to 8 13% 9 to 10 62% Total 100%
Q3. For what purpose does your organization presently deploy or plan to deploy HSMs? Please select all that apply.
Q3a. HSMs deployed today: Combined Application level encryption 32% Database encryption 63% SSL 56% PKI or credential management 49% Document signing (e.g. electronic invoicing) 57% Code signing 53% Authentication 70% Payments processing 46% Other (please specify) 0%
Q3b. HSMs deployed in the next 12 months: Combined Application level encryption 36% Database encryption 68% SSL 77% PKI or credential management 57% Document signing (e.g. electronic invoicing) 64% Code signing 61% Authentication 79% Payments processing 60% Other (please specify) 0%

Ponemon Institute© Research Report Page 24
Part 3. Perceptions about the HSM product/vendor. Please rate each statement about your primary HSM product/vendor using the 0 to 10-point scale from “Disagree completely” to “Agree completely” below each item. Combined Q4. My organization’s HSM solutions are completely tamperproof. 8.10 Q5. My organization’s HSM solutions cannot be compromised by operational or environmental conditions. 8.14 Q6. My organization’s HSM solutions are able to detect false authentication data. 6.88 Q7. My organization’s HSM solutions meet or exceed regulatory, policy and legal obligations. 7.24 Q8. My organization’s HSM solutions provide logging mechanisms that are fully protected against unauthorized modification, substitution or deletion. 7.28 Q9. My organization’s HSM solutions ensure cryptographic keys are only used for a single cryptographic function or purpose. 6.98 Q10. My organization’s HSM solutions support multiple applications. 7.12 Q11. My organization’s HSM solutions have a high level of interoperability with other data protection or security technologies. 6.43 Q12. My organization’s HSM solutions are very scalable. 6.63 Q13. My organization’s HSM solutions are easy to install. 7.03 Q14. My organization’s HSM solutions are easy to operate and maintain. 6.67 Q15. My organization’s HSM vendor provides excellent support and training. 7.03 Q16. My organization’s HSM solutions are cost efficient and provide good value. 6.58
Q18. How important are the following 14 features associated with HSM solutions? Please rate each feature using the adjacent scale from very important to irrelevant. Very important and important responses combined Combined Automated enforcement of policy 85% Automated management of keys 90% Support for the widest range of applications 58% Centralized management interface 80% System scalability 65% Tamper resistance by dedicated hardware 81% Conformance with security standards 55% Support for format preserving encryption 58% Support for tokenization 43% Support for point-to-point encryption 64% System performance and latency 82% Support for emerging algorithms 59% Supports longer encryption keys 44% Formal product security certifications 56%
Q19. What are the most important reasons for selecting your present HSM solution/vendor? Please select your top three choices. Combined Cost/value 58% Ease of use 52% Worry-free installation 16% High performance reliability 41% High interoperability with other encryption or key management solutions 53% Proven track record of the product/vendor 15% Reputation of the product/vendor 19% Vendor’s responsiveness to urgent needs or requests 28% Product certification 17% Total 300%
Ponemon Institute© Research Report Page 25
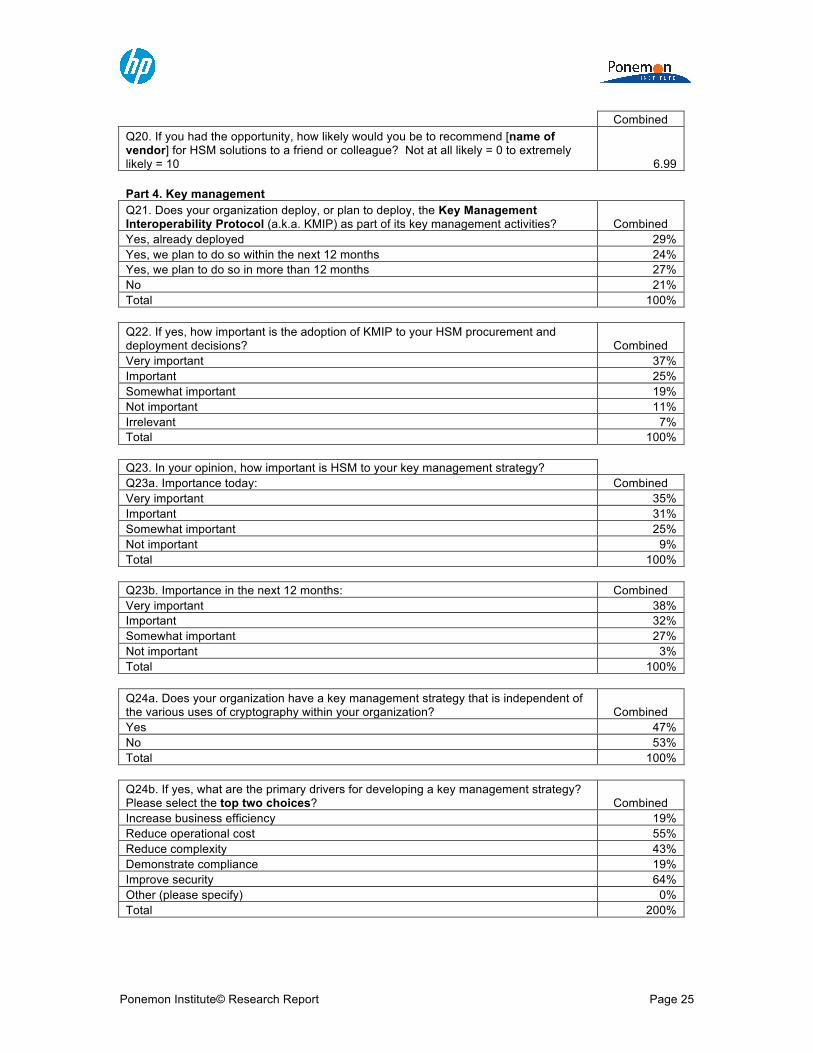
Combined Q20. If you had the opportunity, how likely would you be to recommend [name of vendor] for HSM solutions to a friend or colleague? Not at all likely = 0 to extremely likely = 10 6.99
Part 4. Key management Q21. Does your organization deploy, or plan to deploy, the Key Management
Interoperability Protocol (a.k.a. KMIP) as part of its key management activities? Combined Yes, already deployed 29% Yes, we plan to do so within the next 12 months 24% Yes, we plan to do so in more than 12 months 27% No 21% Total 100%
Q22. If yes, how important is the adoption of KMIP to your HSM procurement and deployment decisions? Combined Very important 37% Important 25% Somewhat important 19% Not important 11% Irrelevant 7% Total 100%
Q23. In your opinion, how important is HSM to your key management strategy? Q23a. Importance today: Combined
Very important 35% Important 31% Somewhat important 25% Not important 9% Total 100%
Q23b. Importance in the next 12 months: Combined Very important 38% Important 32% Somewhat important 27% Not important 3% Total 100%
Q24a. Does your organization have a key management strategy that is independent of the various uses of cryptography within your organization? Combined Yes 47% No 53% Total 100%
Q24b. If yes, what are the primary drivers for developing a key management strategy? Please select the top two choices? Combined Increase business efficiency 19% Reduce operational cost 55% Reduce complexity 43% Demonstrate compliance 19% Improve security 64% Other (please specify) 0% Total 200%

Ponemon Institute© Research Report Page 26
Q25. What types of key management systems does your organization use? Please select all that apply. Combined Single key management system deployed across the organization to manage multiple use cases (e.g. tape backup, email, etc) 14% Single key management system deployed across the organization to manage a single use case 20% Multiple installations of a common key management system that is deployed throughout the organization to address the same use case 47% Multiple and different key management systems each deployed for specific use cases (e.g. tape backup, email, etc) 19% Total 100%
Q26. What is the source of your organization’s key management system(s)? Please check all that apply. Combined In-house development 35% Externally developed custom system 57% Native capability or bundled item with an encryption solution 37% Commercial, off-the-shelf centralized key management system 42% Commercial, off-the-shelf key management component (e.g. HSM) 52% Other (please specify) 1%
Part 5: Budget estimation Q27a. Are you responsible for managing all or part of your organization’s encryption
and/or key management budget? Combined Yes 59% No (Go to Part 5) 41% Total 100%
Q27b. Approximately, what is the dollar range that best describes your organization’s total IT budget for 2014 including the amortized value of capital (CapX) expenditures? Combined < $1 million 3% $1 to 5 million 10% $6 to $10 million 11% $11 to $50 million 15% $51 to $100 million 25% $101 to $250 million 17% $251 to $500 million 10% > $500 million 9% Total 100%
Q27c. Approximately, what percentage of the 2014 IT budget will go to IT security activities? Combined Zero 0.00 1% to 2% 0.15 3% to 5% 0.28 6% to 10% 0.29 11% to 20% 0.17 21% to 30% 0.09 > 30% 0.02 Total 1.00

Ponemon Institute© Research Report Page 27
Q27d. Approximately, what percentage of the 2014 IT security budget will be spent on HSMs?
Q27d-1. Payments HSMs Combined Zero 3% 1% to 2% 8% 3% to 4% 27% 5% to 6% 17% 7% to 8% 17% 9% to 10% 7% > 10% 21% Total 100%
Q27d-2. General purpose HSMs Combined Zero 6% 1% to 2% 12% 3% to 4% 25% 5% to 6% 28% 7% to 8% 17% 9% to 10% 7% > 10% 6% Total 100%
Q27d-3 Tokenization/FPE Combined Zero 14% 1% to 2% 13% 3% to 4% 23% 5% to 6% 27% 7% to 8% 16% 9% to 10% 7% > 10% 0% Total 100%
Q27d-4 Key management Combined Zero 0% 1% to 2% 12% 3% to 4% 20% 5% to 6% 18% 7% to 8% 17% 9% to 10% 7% > 10% 26% Total 100%
Q27e. Estimating one year into the future, what percentage of the 2015 IT security budget will be spent on HSM?
Q27e-1. Payments HSMs Combined Zero 3% 1% to 2% 7% 3% to 4% 21% 5% to 6% 16% 7% to 8% 17% 9% to 10% 6% > 10% 29% Total 100%

Ponemon Institute© Research Report Page 28
Q27e-2. General purpose HSMs Combined Zero 6% 1% to 2% 12% 3% to 4% 25% 5% to 6% 21% 7% to 8% 20% 9% to 10% 7% > 10% 9% Total 100%
Q27e-3. Tokenization/FPE Combined Zero 9% 1% to 2% 11% 3% to 4% 26% 5% to 6% 28% 7% to 8% 15% 9% to 10% 7% > 10% 4% Total 100%
Q27e-4. Key management Combined Zero 0% 1% to 2% 6% 3% to 4% 18% 5% to 6% 18% 7% to 8% 15% 9% to 10% 7% > 10% 35% Total 100%
Part 6: Organizational and respondent characteristics D1. What organizational level best describes your current position? Combined
Executive/VP 3% Director 16% Manager/Supervisor 32% Associate/Staff/Technician 47% Other (please specify) 1% Total 100%
D2. Check the functional area that best describes your organizational location. Combined Corporate IT 23% IT operations 41% IT security 17% Compliance/audit 6% Lines of business (LOB) 10% Other (please specify) 3% Total 100%
D3. What is the worldwide headcount of your organization? Combined < 500 20% 500 to 1,000 26% 1,001 to 5,000 23% 5,001 to 25,000 16% 25,001 to 75,000 11% > 75,000 5% Total 100%

Ponemon Institute© Research Report Page 29
D4. What best describes your organization’s main industry focus? Combined Agriculture & food service 2% Communications 4% Consumer products 5% Defense & aerospace 1% Education & research 2% Energy & utilities 5% Entertainment & media 3% Financial services 17% Health & pharmaceutical 4% Hospitality 4% Industrial 8% Manufacturing 7% Government 12% Retail 9% Services 9% Technology & Software 7% Transportation 2% Other 0% Total 100%
Ponemon Institute
Advancing Responsible Information Management Ponemon Institute is dedicated to independent research and education that advances responsible information and privacy management practices within business and government. Our mission is to conduct high quality, empirical studies on critical issues affecting the management and security of sensitive information about people and organizations. As a member of the Council of American Survey Research Organizations (CASRO), we uphold strict data confidentiality, privacy and ethical research standards. We do not collect any personally identifiable information from individuals (or company identifiable information in our business research). Furthermore, we have strict quality standards to ensure that subjects are not asked extraneous, irrelevant or improper questions. About HP Atalla HP Atalla solutions build on HP’s more than 35 years of innovation in encryption technology, and deliver advanced protection for data stored on-premise and in the Cloud as well as unstructured data such as; confidential emails, payment information and electronic health records. Designed for organizations that need to protect sensitive information, including financial institutions, retailers, energy companies, healthcare providers and governments. HP Atalla encryption solutions safeguard data throughout its entire life cycle – whether at rest, in motion, or in use – across cloud, on-premises and mobile environments, to ensure continuous protection of an organization’s most sensitive information, while maintaining optimal performance and flexibility. More info: hp.com/go/atalla