Embed Size (px)
Citation preview

HSC Syllabus Summary
Economics

Topic 1: The Global Economy
1. Features of the Global Economy
a) Nature of the Global Economy and Globalisation
a. The Global Economy consists of all countries in the world that produce G&S and
thereby contribute to World GDP.
b. Gross World Product (GWP): The aggregate value of all goods and services
produced worldwide each year measured in $US. This also equals the total gross
domestic product. (US$44,795,448 as of 2005). Measured by a country GDP at PPP
so that total value of G&S produced in the world is adjusted for national variance in
price.
c. Globalisation: The actual, potential and capacity to move trade, investment,
technology, finance and labour (LIFTT) across nations.
i. Trade:Annual growth of trade has consistently been twice the level of world
economic growth. In times of economic downturn global trade has also
contracted faster than world economic output highlighting the greater
volatilityof trade compared with gross world product. Increased from
$US8.5 (1990) to $US17.3 trillion (2003). Account for 50% of global output
ii. Investment and Technology: Short term speculative money shifts known as
finance, long term flows of money to buy or establish businesses known as
investments. Measure of investment is Foreign Direct Investment (FDI)and
level of mergers and takeovers. Technology: leading technology innovators
have a major trading opportunity, able to reduce costs for businesses.
Reduce economies of scale and greater labour production.
iii. Finance: Most globalised feature of world economy because money moves
more quickly between countries than G&S or people.
iv. Labour: Less internationalised than other markets. Occurs mainly at top and
bottom ends of labour markets. Shift of businesses between economies is
also evident in globalisation of labour.
d. International Business Cycle: The strong and weak periods of economic growth
globally. Similar to business cycle of individual economies. Usually strong growth for
one country when rest of world is growing and weaker when other countries are
experiencing downturn.
Factors that Strengthen Int. Bus. Cycle Factors that weaken Int. Bus. Cycle
Trade Flows Domestic Interest Rates
Investment Flows Government Fiscal Policies
Transnational Corporations Exchange Rates
Financial Flows Structural Factors
Technology and Confidence Regional Factors
Global Interest Rates
International Organisations

b) Trade and Financial Flows
a. Changes in size, pattern and direction of trade and investment: Significant increase
during globalisation era. Raw materials and capital inputs to production have played
a greater role in international trade, vast importance of manufactured goods in
merchandise trade. Services now constitute 20% of global trade. Decrease in share
of high income economies with an increase in East Asia and Pacific Region
experiencing most rapid increase. Shifts in trade can affect structure of domestic
economy overtime (e.g. Increase in Australian wine lead to increase in vineyard
plantations.) High Income Economies global trade declined 80% to 74% and China &
India increased from 5% to 10% from 1990-2003
b. Foreign Exchange Market (FOREX):Network of buyers and sellers exchanging one
currency for another where the value of a currency is expressed in terms of another
currency. 95% of foreign exchange turnover is for seeking short term gains from
currency movements.
c. Main participants in FOREX:
i. Speculators: General aim of these transactions is to gain from short term
movements in currency. Speculation can lead to volatility on foreign
exchange markets.
ii. Traders: Importers and exporters to make purchase of G&S between
economies.
iii. Investors: Purchasing assets within a country must exchange their currency
for the local one before making the purchase.
d. Impact of changes in trade and financial flows on economies:
i. A countries trade performance is normally influenced by exchange rate
movements. E.g. High exchange rate = exports become less competitive and
imports cheaper.
ii. Many countries become export orientated and rely on International funds
to finance economic expansion, this has made them more susceptible to
changes within these areas while offering opportunities to achieve higher
growth
iii. Changes in financial flows can have an effect on the confidence within a
country. E.g. when money is flowing out and exchange rate falling can
weaken domestic confidence.
iv. Large currency movements can destabilise financial markets. In extreme
cases of downturn the IMF (International Monetary Fund) may step in and
provide crisis funds.
v. Must consider international consequences of domestic policy making

c) Free trade and Protection
a. The Basis of Free Trade – its ad’s and dis’s:
i. Free trade can be defined as a situation where governments impose no
artificial barriers to trade that restrict the free exchange of G&S between
countries with the aim of shielding domestic producers from foreign
competitors.
ii. Allows one nation to produce a G&S more efficiently than another and is
based on a countries combination of resources. They can also specialise in
produce of a G&S if it is efficient. The surplus produced from production can
also be used to import G&S a country is less efficient in and allows a greater
variety of G&S
iii. Based on concept of comparative advantage (produce at lower opportunity
cost than other countries). Absolute advantage: Nation can produce more
or a commodity with less resources than other countries.
iv. Advantages:
1. Trade allows countries to obtain G&S that they cannot produce
themselves or in sufficient quantities.
2. Free trade allows a country to specialise in the production of G&S in
which they are most efficient.
3. Free trade encourages efficient allocation of resources.
4. Greater tendency for specialisation leads to increasedeconomies of
scale
5. International competitiveness will improve as domestic markets
face greater competitive pressures
6. Free trade encourages innovation
7. Free trade leads to higher standard of living as a result of low prices
8. Great range of G&S can be accessed
v. Disadvantages:
1. Increase in short term unemployment
2. Protected industries must re-structure, resulting in unemployment
3. Increased free trade makes individual countries more dependent on
other nation’s well-being.
4. New industries may find it more difficult to establish themselves
5. Production surpluses may be ‘dumped’ on domestic market.
6. Can be a disadvantage if other countries do not adopt free trade
policies (not on same playing field)
b. Reasons for protection:
i. Reduce dependence on foreign producers
ii. Limit trade deficit
iii. Infant Industries: New industries face many difficulties in early years.
Usually start small scale with relatively higher costs than those of more
established firms. Argued that infant industries need protection in short run
to enable them to expand scale and reduce costs
iv. Prevention of Dumping: Dumping occurs when foreign firms attempt to sell
their goods in another country’s market at unrealistically low prices. Used to
dispose of large quantities of surpluses or to establish market position.
Usually temporary but can harm domestic producers.
v. Domestic Employment: Protection saves local jobs. If local producers are
protected from competition with cheaper foreign imports, the demand for
local goods will be greater. Protection tends to distort allocation of
resources away from areas of more efficient production.
vi. Defence and self-sufficiency: Major countries want to retain certain
industries so in times of war they can produce what’s needed (e.g. defence
equipment). Retaining own food supply in case of emergency (war).
vii. Others:
1. Trade Unions say to not use G&S of countries using low cost labour
2. Environmental harm involved in production of some goods
3. Protect certain industries because of ‘spill over’ benefits
c. Methods of protection:
i. Voluntary Export Restraints: Restrict
the number of exports to another
country when in trade negotiations with
a country in return for a similar
concession.
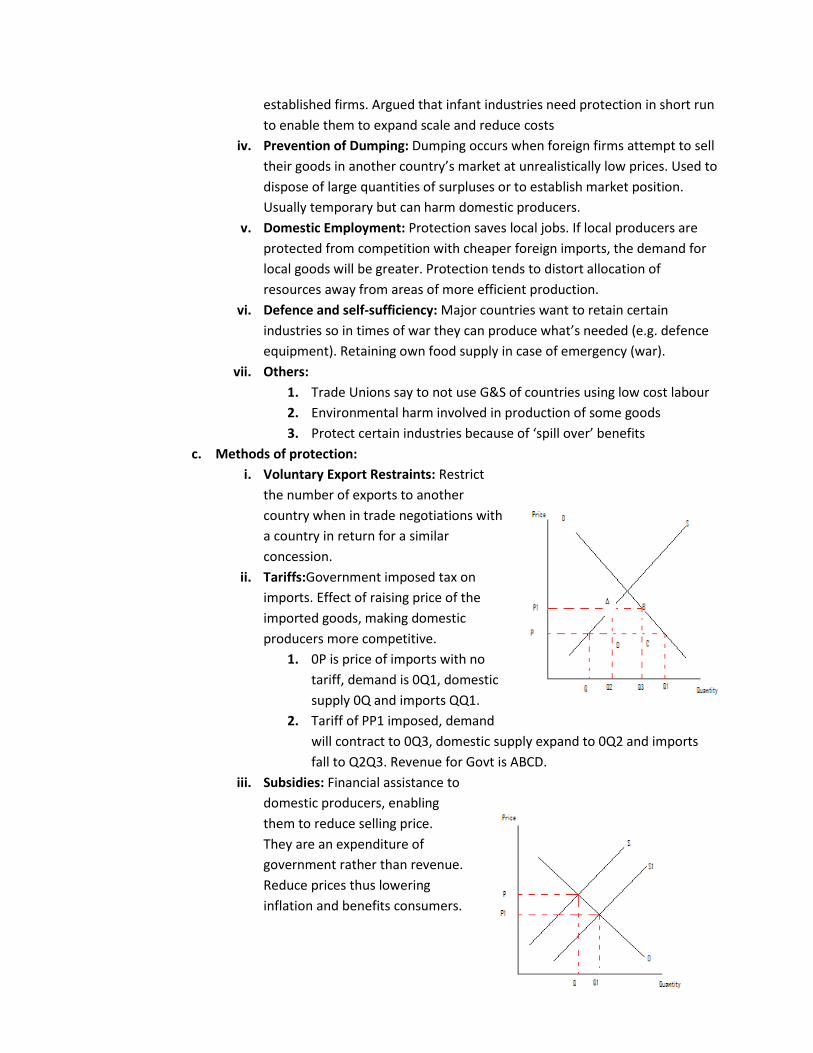
ii. Tariffs:Government imposed tax on
imports. Effect of raising price of the
imported goods, making domestic
producers more competitive.
1. 0P is price of imports with no
tariff, demand is 0Q1, domestic
supply 0Q and imports QQ1.
2. Tariff of PP1 imposed, demand
will contract to 0Q3, domestic supply expand to 0Q2 and imports
fall to Q2Q3. Revenue for Govt is ABCD.
iii. Subsidies: Financial assistance to
domestic producers, enabling
them to reduce selling price.
They are an expenditure of
government rather than revenue.
Reduce prices thus lowering
inflation and benefits consumers.
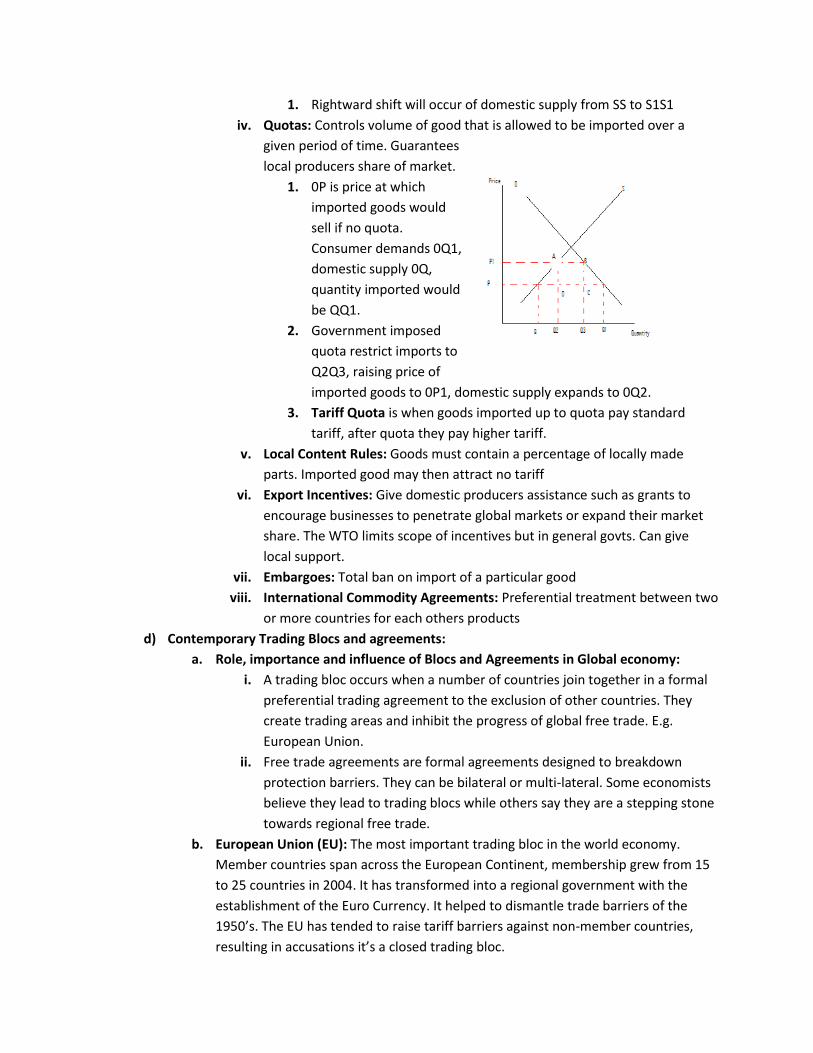
1. Rightward shift will occur of domestic supply from SS to S1S1
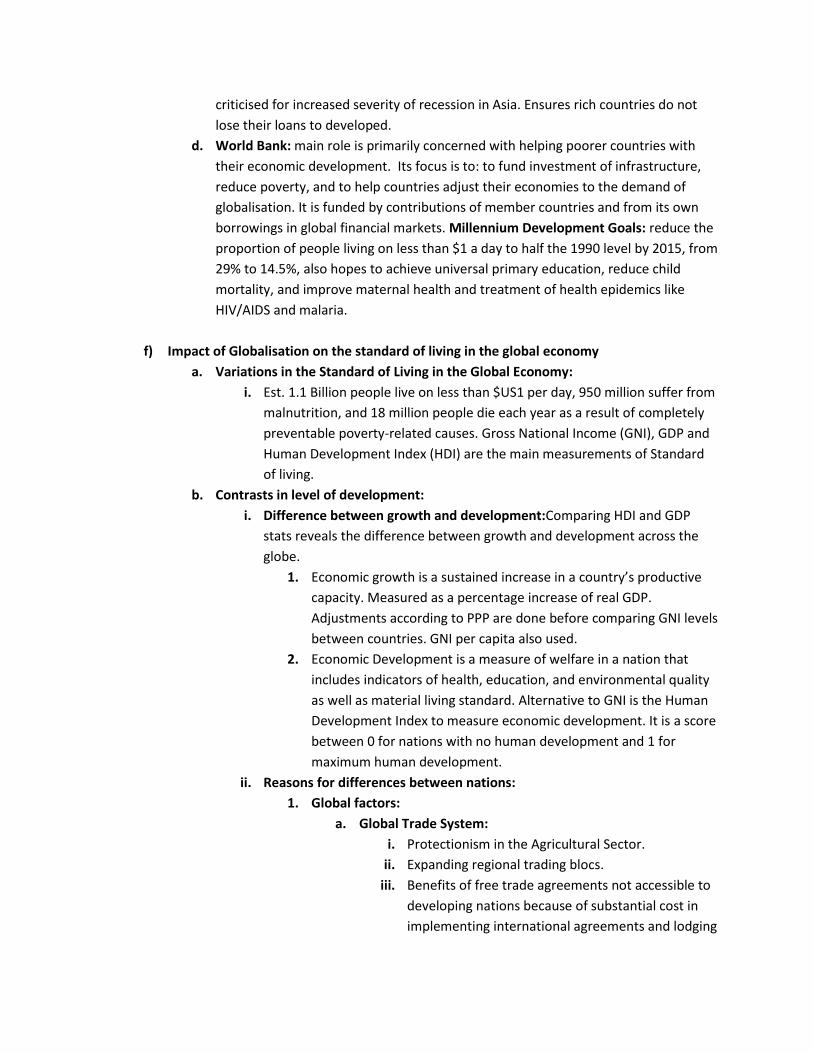
iv. Quotas: Controls volume of good that is allowed to be imported over a
given period of time. Guarantees
local producers share of market.
1. 0P is price at which
imported goods would
sell if no quota.
Consumer demands 0Q1,
domestic supply 0Q,
quantity imported would
be QQ1.
2. Government imposed
quota restrict imports to
Q2Q3, raising price of
imported goods to 0P1, domestic supply expands to 0Q2.
3. Tariff Quota is when goods imported up to quota pay standard
tariff, after quota they pay higher tariff.
v. Local Content Rules: Goods must contain a percentage of locally made
parts. Imported good may then attract no tariff
vi. Export Incentives: Give domestic producers assistance such as grants to
encourage businesses to penetrate global markets or expand their market
share. The WTO limits scope of incentives but in general govts. Can give
local support.
vii. Embargoes: Total ban on import of a particular good
viii. International Commodity Agreements: Preferential treatment between two
or more countries for each others products
d) Contemporary Trading Blocs and agreements:
a. Role, importance and influence of Blocs and Agreements in Global economy:
i. A trading bloc occurs when a number of countries join together in a formal
preferential trading agreement to the exclusion of other countries. They
create trading areas and inhibit the progress of global free trade. E.g.
European Union.
ii. Free trade agreements are formal agreements designed to breakdown
protection barriers. They can be bilateral or multi-lateral. Some economists
believe they lead to trading blocs while others say they are a stepping stone
towards regional free trade.
b. European Union (EU): The most important trading bloc in the world economy.
Member countries span across the European Continent, membership grew from 15
to 25 countries in 2004. It has transformed into a regional government with the
establishment of the Euro Currency. It helped to dismantle trade barriers of the
1950’s. The EU has tended to raise tariff barriers against non-member countries,
resulting in accusations it’s a closed trading bloc.

c. North American Free Trade Agreement (NAFTA):Established in 1994 with United
States, Canada and Mexico. Has resulted in a substantial increase in trade amongst
members. A significant increase in exports has resulted for Canada and Mexico
while the US has benefited from moving production facilities to Mexico where
wages are substantially lower.
d. Asia-Pacific Economic Cooperation (APEC) Forum: In early 1990’s countries in
Australia’s region established APEC in response to the formation of trading blocs in
other areas. The forum contains 21 member countries including: Australia, Canada,
China, Hong Kong, Russia, Singapore and others. The APEC forum accounts for half
of world GDP and 45% of world trade, mainly because it includes US and Japan. It is
intended to be a non-discriminatory grouping, in that trade will occur with outside
nations on the same basis as member nations.
e. Association of South East Asian Nations (ASEAN): Covers newly industrialised
groups in South East Asia but does not include any large advanced economies. It has
acted as a counter-weight to the APEC forum. Australia and New Zealand began
negotiations to combine AFTA with CERTA.
f. Closer Economic Relations Trade Agreement (CERTA): Bilateral agreement between
Australia and New Zealand. It began in 1983 and one of the most comprehensive
trade agreements in the world. It has been extended in recent years with the
harmonisation of business regulations between AUS and NZ.
e) International Organisations:
a. Role, Importance and Influence of Int. Organisations on global economy:
i. Managing instability on global financial markets and minimising the risk of
global financial collapse.
ii. Providing assistance to countries who are experiencing an economic crisis
iii. Developing global standards for environmental protection and management
of resources such as water supply.
iv. Establishing global rules on freeing up world trade and resolving trade
disputes between countries.
b. World Trade Organisation (WTO): One of the most powerful global economic
institutions. Its role is to implement and advance global trade agreements and to
resolve trade disputes between economies. Formed in 1995 and is the first
international organisation to enforce trade agreements across the world. It can
settle disputes between countries via a process of dispute resolution if no
agreement can be reached directly, a WTO panel will hear the complaint and then
issue a decision. If the country involved does not comply, the other country or
countries may then impose trade sanctions on the offending nation.
c. International Monetary Fund (IMF): Its role is to maintain international financial
stability, particularly in relation to foreign exchange markets. When a financial crisis
occurs in an economy, region or the world, the IMF plays a critical role in minimising
the crisis. The IMF’s policies are to support free trade of G&S and free movement of
finance and capital throughout world markets. E.g. Structural Adjustment Policy
criticised for increased severity of recession in Asia. Ensures rich countries do not
lose their loans to developed.
d. World Bank: main role is primarily concerned with helping poorer countries with
their economic development. Its focus is to: to fund investment of infrastructure,
reduce poverty, and to help countries adjust their economies to the demand of
globalisation. It is funded by contributions of member countries and from its own
borrowings in global financial markets. Millennium Development Goals: reduce the
proportion of people living on less than $1 a day to half the 1990 level by 2015, from
29% to 14.5%, also hopes to achieve universal primary education, reduce child
mortality, and improve maternal health and treatment of health epidemics like
HIV/AIDS and malaria.
f) Impact of Globalisation on the standard of living in the global economy
a. Variations in the Standard of Living in the Global Economy:
i. Est. 1.1 Billion people live on less than $US1 per day, 950 million suffer from
malnutrition, and 18 million people die each year as a result of completely
preventable poverty-related causes. Gross National Income (GNI), GDP and
Human Development Index (HDI) are the main measurements of Standard
of living.
b. Contrasts in level of development:
i. Difference between growth and development:Comparing HDI and GDP
stats reveals the difference between growth and development across the
globe.
1. Economic growth is a sustained increase in a country’s productive
capacity. Measured as a percentage increase of real GDP.
Adjustments according to PPP are done before comparing GNI levels
between countries. GNI per capita also used.
2. Economic Development is a measure of welfare in a nation that
includes indicators of health, education, and environmental quality
as well as material living standard. Alternative to GNI is the Human
Development Index to measure economic development. It is a score
between 0 for nations with no human development and 1 for
maximum human development.
ii. Reasons for differences between nations:
1. Global factors:
a. Global Trade System:
i. Protectionism in the Agricultural Sector.
ii. Expanding regional trading blocs.
iii. Benefits of free trade agreements not accessible to
developing nations because of substantial cost in
implementing international agreements and lodging
appeals against other countries protectionist
features.
b. Global Financial Architecture:
i. Long term international flows favour developed
nations.
ii. Short term financial flows favour the more
prosperous developing countries which offer better
returns for currency and stock market speculators.
iii. Role of International Monetary Fund. Major
criticism is it advocates serve the interests of rich
countries.
c. Global Aid and Assistance:
i. Relatively low development aid by rich countries.
(0.25, commitment was 0.7%GDP)
ii. Substantial amount of foreign aid it ‘tied aid’ in the
form of G&S instead of the aid necessarily needed.
iii. Developed nations give more aid to those that are
their military allies.
d. Global technology Flows: Developed nations have decision
on scientific research and funds for development.
Developing nations cannot also afford the intellectual rights
to access the technologies.
2. Domestic Factors:
a. Economic Resources:
i. Natural resources
ii. Labour Supply and Quality
iii. Access to capital and indebtedness – higher levels
of Foreign Debt make it harder for domestic
businesses to gain access to loans.
iv. Entrepreneurial Culture
b. Institutional Factors:
i. Political and Economic Institutions
ii. Government Response to Globalisation
iii. Developing Economies:
1. Suffer from low income levels
2. Weak human resources
3. Large numbers of people living in absolute poverty
4. Weak political and economic institutions
5. Dependence on agricultural production for income, employment
and trade opportunities
6. Reliance on foreign aid

iv. Newly Industrialised Countries (NICs):
1. Experienced rapid economic growth over past two decades
2. Transition from developing to high income economy
v. Transition Economies:
1. Socialist economies prior to collapse of socialism In 1980’s
2. Privatisation of state enterprises
3. Introduction of free market business laws
4. Shift towards western-style economic and financial institutions
5. Trade and financial market liberalisation
vi. High Income Economies:
1. Countries with high levels of economic development
2. Close economic ties with each other
3. Liberal-democratic political/economic institutions.
4. Known as Advanced Industrialised Economies (AIEs)
5. Gross National Income per capita levels above $US10,066
c. Impact of Globalisation
i. International Convergence: Economies begin to run in sync with each other
as a result of closer economic integration. E.g. when one economy
experiences a downturn in economic growth, other countries may
experience the same. Spread of technology, increased migration
ii. Economic Growth, Development& Quality of Life: Affected different
countries in various ways, high income economies and newly industrialised
have benefitted most. Economies of lower standards of living have suffered
greatly with little growth or development. Fundamentally, economic
development cannot occur without growth. Many OECD’s improved HDI
while sub-Saharan Africa have worsened
iii. Trade, Investment and TNC’s: Trade and investment have been boosted by
globalisation. Foreign investment is increasing rapidly as it is now easier to
finance investment abroad because of the emergence of a sophisticated
international finance system. Some transnational corporations have
experienced sales that exceed GDP of some developed countries.
iv. Distribution of Income & Wealth: Effectively the rich have got richer and
the poor have got poorer as a result of globalisation.
v. Environmental Consequences: Globalisation offers the best opportunity to
protect world’s environment from harm by making individual nations to
face their global responsibility for environmental preservation. On the other
hand low income economies desperate to earn foreign exchange engage in
behaviour with devastating effects on environment e.g. deforestation.
vi. Financial Markets: Globalisation has produced a very sophisticated financial
system that allows funds to be transferred with relative ease. This has lead
to a rapid increase in the turnover of financial securities, as well as the
emergence of a destabilising effect. E.g. 1997-8 Asian crisis. Need for capital
control to decrease losses and more international policy coordination to
reduce financial crisis’ occurring
vii. International Business Cycle: Growing interdependence between nations
has lead to an almost universal business cycle that the majority of
economies now follow. E.g. When America experiences a downturn
Australia is likely to experience the same. Expose other nations to down
turns
viii. Implications for Government Economic policies: Greater similarity between
policies between economies all over the world. Described as the
‘Washington Consensus’ of market-friendly policies.
1. Washington Consensus: Fiscal Discipline, Focused public
expenditure on education, health, infrastructure; Tax Reform
(broadening of tax base), Interest rates determined by market
forces, Competitive exchange rates, trade liberalisation, openness
to FDI, privatisation of state enterprises, deregulation, Legal security
for property rights.

Topic 2: Australia’s Place in the Global Economy
1. Australia’s Trade and Financial Flows
a. Value, Composition and Direction of Australia’s Trade and Financial flows
i. Trends in Australia’s Trade patterns:
1. Size: Australia’s trade dependency (i.e. exports + imports as a % of GDP)
has risen from around 12% in the mid 1980’s to 23% currently. Over the
past decade, the total value of exports has risen from $60,634m to
$121,180m (a 99% increase). Over the same period, imports rose from
$59,934m to $121,937m – a 103% increase in value.
2. Composition:The composition of exports has changed distinctly over
the past two decades. Whilst rural and mining exports account for
around 50% of exports, manufactured exports grew from 10% to 20%.
This represents a broadening of our export base. Australia relies on
imports of manufactured goods, machinery, transport equipment and
intermediate goods used in the production of other goods. There has
also been strong growth in services throughout the 1990’s. Service
exports include freight, transport, travel, tourism, education, finance
business services and insurance. The growth in service exports has
outstripped growth in service imports, thus decreasing the balance on
net services, thus improving the CAD. Tourism makes up 12% of export
earnings, whilst education now takes up 7% of export earnings.
3. The major change in Australia’s direction of trade is the switch away
from British and European markets to Japan and Asia. In 2000-01, Asian
countries alone counted for 55% of exports. However, recently there
has been a shift back towards traditional markets in light of the Asian
Financial crisis.
ii. Trends in Financial Flows:
1. Size: Investment flows increased dramatically after deregulation of the
financial markets in 1983. The level of foreign Investment into Australia
increased during the 1980’s and 1990’s from a total of $326 million in
1991-92 to $813 million in 2000-01, whilst Australian investment abroad
grew from -$108 million to -$417 million. The high level of foreign
investment mainly from the political stability of Australia. Foreign
investment can take three forms:
a. Direct investment – this is international investment that reflects
the objective of obtaining a lasting interest by a resident in one
economy in an enterprise in another economy. It involves the
purchase of over 10%
b. Other – trade credits, loans, currency and deposits
c. Portfolio investment – covers investment into equity (shares,
options etc.) and debt (bonds etc.) where an interest less than
10% is obtained.
2. Composition: Over the past 30 years, investment grew at almost 20%
p.a. In Australia in 1970, the ratio of direct to portfolio investment was
2:1. By 1990, it was 1:1, and by 2000 it was 1:2. This trend mirrors the
world, and has been caused by the growth in funds management as a
result of the emergence of a global financial system. The net foreign
liability has rapidly increased since 1990 from 45% of GDP to 60% in
2000.
3. Direction: The main sources of foreign investment into Australia are the
USA, Britain, Japan, Hong Kong, China, Singapore and New Zealand.
Australia is a capital deficit country and relies on capital surplus
countries such as Japan and Germany to make up the shortfall
b. Australia’s Balance of Payments
i. All transactions between Australia and the rest of the world.
ii. Structure: see page 14 & 15


1.
2. Current Account (Irreversible): A record of all transactions between
Australia and the rest of the world, of actual G&S, interest payments on
loans, and remitted profits by overseas-owned companies. The balance
on current account is the total of the balance on goods and services, net
income and current transfers.
3. Capital Account (Reversible): The Capital and Financial account is a
record of all international borrowing and lending transactions of
Australia’s private and public sectors. Basically concerned with the
purchase and sale of assets.
iii. Links between key Balance of Payments categories: There is an important link
between the Current Account and the Capital and Financial Account – both
accounts add up to zero (allowing for O + E). The floating $A plays the key role in
ensuring there is a balance in the BOP. Under a floating exchange rate,
equilibrium occurs where:
Therefore, equilibrium occurs when: Supply of $A = Demand for $A M + Y debits
+ K outflow = X + Y debits + K inflow M – X + Y debits – Y credits = K inflow – K
outflow Balance on Current account = Balance on capital and financial account
The strongest link between the categories is seen on the net income part of the
CA. in the long term, a KAFA surplus will result in a larger deficit on the net
income account because regardless of its form, any foreign financial flow which
comes to Australia must earn some kind of return for its owner, and is therefore
recorded as a debit on the income account.
Debt – requires interest payments (net income account)

Equity – requires returns on investment e.g. dividends etc. (net
income account)
There is also the possibility of a country falling into a debt trap scenario i.e.
where reserves are sold off or further funds borrowed to service foreign
liabilities. Some economists argue that Australia has fallen into the debt trap,
with net income deficit averaging around 3-4% of GDP over the past decade and
causing most of the increase in foreign liabilities. Another link between the
categories can be seen through savings. Australia’s low level of savings makes it
necessary to attract a high financial inflow on the KAFA. Between the mid 1980’s
and 90’s, economists blamed Australia’s CAD on low international
competitiveness (i.e. CA), however, recently there has been a focus on the
deficiency of savings as a cause, because low savings results in requirement of
foreign capital inflow to fund investment in Australia (i.e. KAFA).
iv. Trends in the size and composition of Australia’s Balance of Payments:
Throughout the 1970’s Australia’s CAD averaged around 2.5% of GDP, however
since the 1980’s, this average has worsened to 4.75% of GDP, making it one of
the worst performances of high income economies. The CAD as a % of GDP
tends to hit danger levels of 6% every 5 years
v. Reasons for these trends: Reasons are both cyclical and structural
1. Cyclical: When the domestic economy grows faster than the world
economy or the economies of our trading partners, import demand
tends to outstrip export demand. Also, if the world economy is
experiencing a recession, commodity prices for Australia’s exports tend
to fall, reducing export income. This may result in import spending
increasing faster than export income, thus causing a deterioration of the
balance of G&S. (Vice Versa)
2. Structural: Much of it has been owed to the lack of export performance
and domestic savings within the Australian economy. The composition
of Australia's export structure is mostly based on primary goods -
agriculture & minerals. These are often subjected to cyclical fluctuations
within the global economy, agricultural products are especially
susceptible to over-supply and cut-throat competition from the
European Union's (EU) Common Agricultural Policy which has been
known to dump huge surpluses onto the global market. The rise of
globalisation and the move towards neo-liberal free market ideology
since the 1980s will see Australia's economy being pushed further into
the primary sector, further decreasing the stability of Australia's CAD.
Secondly, the high amounts of investment inflows from overseas
demonstrate Australia's lack of savings which can be used for
investment. Australia's level of savings has been slowly decreasing over
the last 30 years. This creates two factors to induce international
investment inflows, firstly using a simple supply and demand diagram, a
decreasing level of savings (left ward shift in supply) combined with
steady demand will result in a high interest rate, the Mundell Flemming
model suggest that investment will flow to areas of high interest, hence
increasing the CAD through the net income section. Secondly, a simpler
answer, the relatively high levels of interest rates within Australia has
become an increasing opportunity cost for not borrowing from
overseas.
c. Issues associated with trends in the balance of payments, including:
i. Terms of Trade: Measures relationship between the price of a country’s exports
and price of imports. The terms of trade index is calculated by the following
formula:
1. Terms of Trade Index =
2. Export price index and import price index measures relative changes in
prices received over a period of time, measured against a base year
which always has an index of 100.
3. If other year has Terms of Trade of:
a. 100 – no change
b. Greater than 100 – exports increased (ability to purchase more
imports with same amount of exports)
c. Less than 100 – Exports have decreased (ability to purchase less
imports with same amount of exports)
4. Since mid-1950s Australia’s Terms of Trade have deteriorated from
composition of imports & exports
5. Primary commodities have increased price slower than imported
manufactured goods, this has caused problems with Current Account
forcing production of more exports.
ii. Size of Current Account balance as a percentage of Gross Domestic Product:
1. Australia has consistently recorded CAD since 1950s. In 1980s a crisis
occurred when CAD doubled from 1983-84 and 1985-86 (peaked at
6.3% of GDP. Contributing factors include:
a. Loss of International confidence:
i. High inflation compared to major trading partners in
1980s and early 1990s
ii. Higher labour costs from ‘wages blowout’
iii. Overvalued currency in 1970s and early 1980s
b. Deterioration of Terms of Trade – high percentage of primary
products exported
c. High levels of domestic demand for imports. (Economic growth
increase corresponds in demand for imports)
d. Cost of servicing foreign debt
e. Depreciation of $AUD in late 1990s and 2000. (Short term
increase in CAD)
iii. Foreign Debt and Foreign Liabilities:
1. Foreign Debt:
a. Gross Foreign Debt: Total of Australian Liabilities to rest of
world
b. Net Foreign Debt: Gross foreign debt, less rest of worlds
liabilities to Australia
c. Consistent CADs being financed by borrowings overseas (Capital
inflow). This increases interest and dividend payments on
outstanding loans (Servicing of Debt)
d. Foreign Debt rise leads to income debits to rise, putting more
pressure on CAD
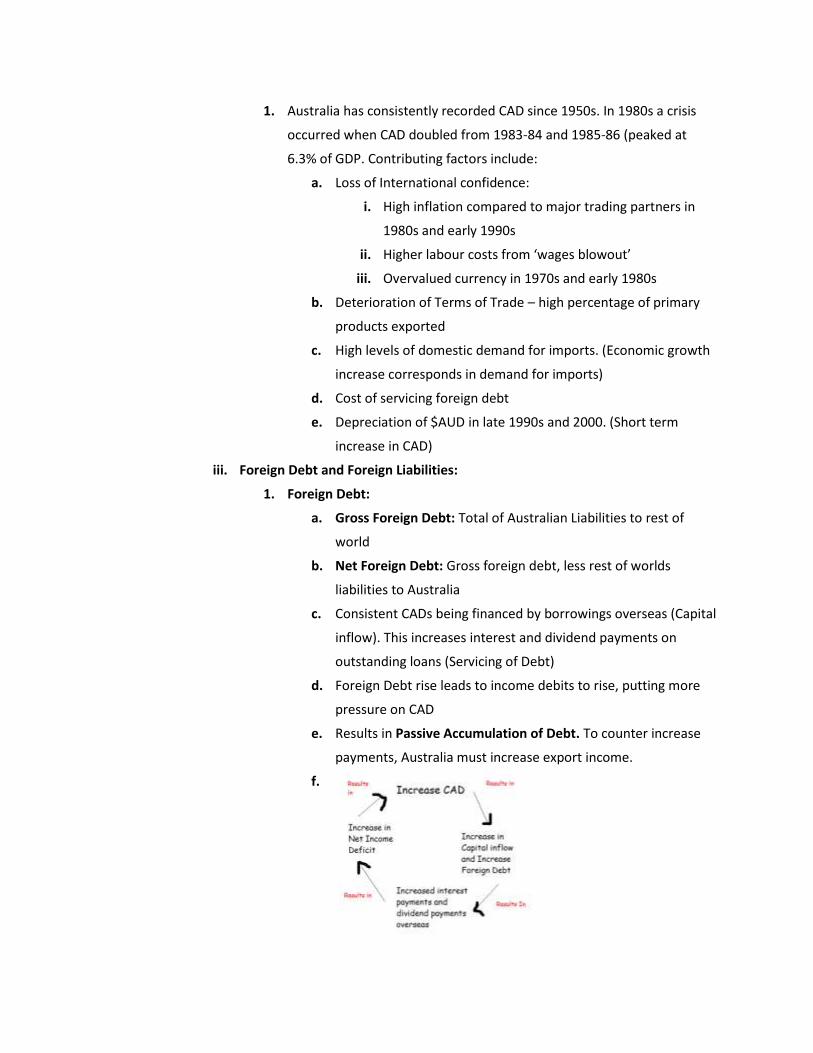
e. Results in Passive Accumulation of Debt. To counter increase
payments, Australia must increase export income.
f.

2. Foreign Equity:
a. Gross Foreign Equity: Australia’s ownership of overseas
businesses
b. Net Foreign Equity: Gross Foreign Equity, less foreign
ownership of Australian Businesses.
iv. International Competitiveness:
1. The ability to match other world producers with price & quality of
exports.
2. Labour costs and productivity levels affects businesses ability to be
competitive.
3. Non cost issues:
a. Quality of Goods
b. Reliability of supply
c. Effectiveness of marketing efforts
d. Quality of customer service
4. Need to pay more attention to competitiveness of specific Australian
industries
5. General structural change can help to improve international
competitiveness.
v. Structural Change: Microeconomic reform is required to diversify Australian
export base and improve international competitiveness. Australia has
implemented an extensive range of microeconomic reform policies aiming to
lower costs and improve reliability/quality.
1. Structural Factors include:
a. Inflation: Higher inflation than other countries competing with
puts exports at a competitive disadvantage. Increased levels of
competition has enabled rate to be kept low since early 1990s.
b. Wages growth: Competitive labour costs are important to keep
costs of production low. Increased wages above productivity
growth puts businesses at a competitive disadvantage.
c. Productivity levels: in 1990s productivity performance
improved dramatically, reflecting impact of microeconomic
reform. Must sustain productivity growth to be competitive.
d. Efficiency of public sector: Changing role of government
resulting in a smaller more efficient public sector since 1980s.
Most government businesses have been privatised and
government given high priority to keeping budget deficits under
control. Widely accepted view amongst international investors
that greater competitiveness achieved with a smaller public
sector.
2. Exchange Rates:
a. Measurement of Relative Exchange Rates: The price of Australian currency in terms of
another country’s currency.
i. To other individual economies: This occurs when the value of one unit of
currency is stated relative to another currency. Changes reflect a change in
purchasing power. Exchange rates can be measured by the direct method (the
amount of local currency needed to purchase one unit of another currency e.g.
$A1.60 = $US1.00) or the indirect method (the amount a unit of local currency
will be of foreign currency e.g. $A1.00 = $US0.59). This is a bilateral
measurement of an exchange rate.
ii. Trade Weighted Index: Measures Australia’s dollar against a basket of
currencies of Australia’s main trading partners (20-25 countries)
1. One limitation is that movements are weighted according to volumes of
trade regardless of what currency export and import contracts are
invoiced in.
2. The $A/$US exchange rate is more important than the TWI when
determining the impact of movements of $A against $US and TWI on
Australian trade and financial flows.
b. Factors affecting the demand and supply of Australian Dollars:
i. Demand:
1. Size of Financial flows into Australia
2. Expectations of a future appreciation
3. Demand for Aus. Exports:
a. Historically changes in commodity prices and TOT have tended
to have immediate impact on the dollar.
b. Demand for exports influenced by international
competitiveness
c. Changes in global economic conditions – dependent on growth
of export partners
d. Tastes and preferences of overseas consumers
ii. Supply:
1. Level of financial flows out of Australia
2. Speculators in foreign exchange market who expect value to go down
3. Domestic demand for imports:
a. Level of domestic income
b. Domestic inflation rate and competitiveness of domestic firms
c. Tastes and preferences of domestic consumers
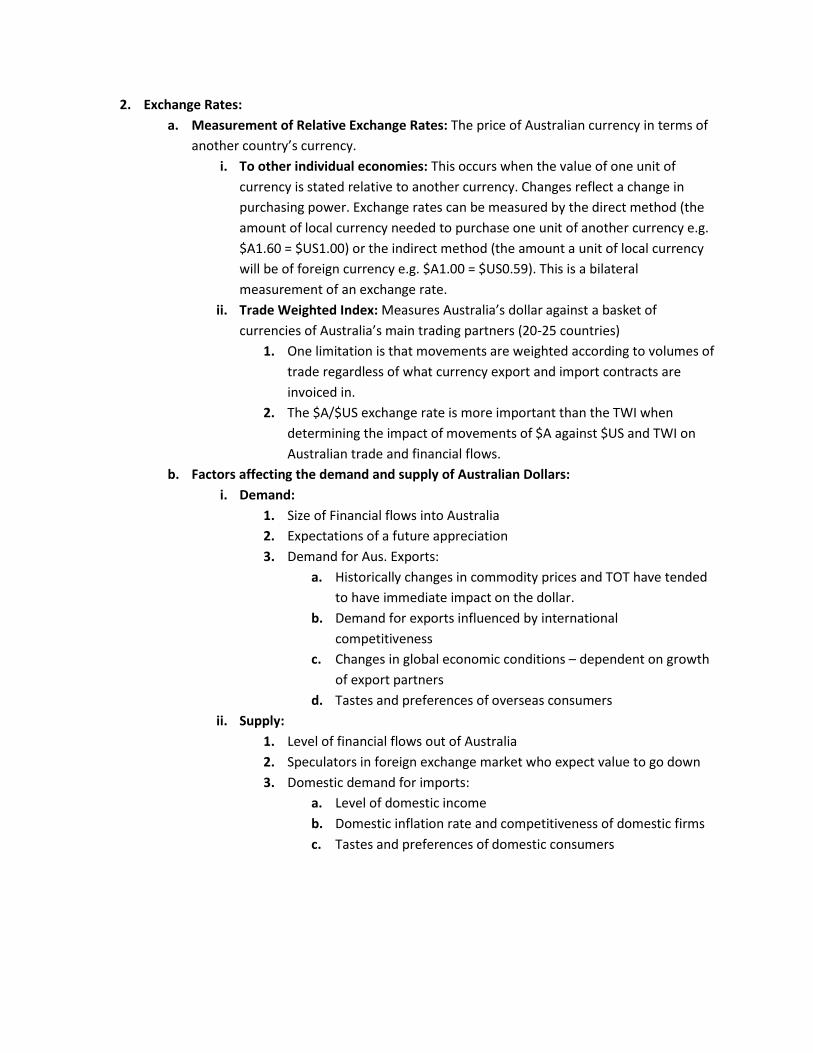
c. Changes in exchange rates:
i. Appreciation (exports dearer, imports cheaper):
1. Increase in demand (2a) or Decrease in supply (2b):
ii. Depreciation (exports cheaper, imports dearer):
1. Decrease in demand (3a) or Increase in Supply (3b):

d. Determination of exchange rates including fixed, flexible and managed rates:
i. Fixed rate: Government
determines exchange rate for
a period of time based on the
value of another countries
currency such as the US
dollar. This occurs by the
government or RBA buying or
selling foreign currency to
keep the rate at price desired.
It requires the government to
have large sums of foreign
currency or gold. The
government may decide to change the rate to prevent adverse effects on the
economy e.g. overvalued or undervalued exchange rate.
1. Devaluation: Deliberate action taken by government to decrease the
value on the FOREX market
2. Revaluation: deliberate action by government to increase the value on
the FOREX market
ii. Flexible/Floating rate:
Market forces of supply
and demand determine
the exchange rate. Under
a free market with no
government intervention
this is referred to as a
‘clean float’.
iii. Manages (fixed pegged)
rate: Where the
government intervenes in
the market to influence
the exchange rate or set the rate for short periods such as a day or week.
e. The influence of the Reserve Bank of Australia on exchange rates: The RBA may
intervene for a variety of reason such as:
i. Exchange rate deviates from its long term path
ii. Exchange rate may be deemed inefficient if excess speculation occurs
iii. To prevent excessive depreciation or appreciation
The RBA uses a variety of methods to intervene in the FOREX market:
iv. Dirtying the Float: The RBA intervenes into the market as either a buyer or
seller in order to stabilise the $A. The RBAs ability it limited by the size of its
foreign currency holdings, in reality the size of these funds is relatively small.
v. Monetary Policy: Monetary policy decisions are an indirect way of influencing
exchange rates. It does this by adjusting interest rates. Increasing interest rates
to prevent a rapid depreciation and vice versa. This policy is only effective for a
short period of time; it is an unusual method as monetary policy is the primary
tool for influencing the domestic market.
Exchange rate movements could be so large at times that they may affect the
stability of the economy or level of inflation prompting the adjustment of
interest rates.
f. The effects of fluctuations in exchange rates on the Australian economy:
i. Depreciation:
1. Advantages:
a. Enhances competitiveness of tradeable goods sector
b. Increase in capital inflow as domestic assets are relatively
cheaper than foreign assets.
c. Structural adjustment. E.g. depreciation in 1980s and early
1990s assisted growth of manufactured and service exports
2. Disadvantages:
a. Higher domestic inflation through higher import prices
b. Increase the value of foreign debt denominated in foreign
currencies
c. Depreciation will raise the debt servicing ratio – higher interest
repayments could lead to a higher net income deficit, therefore
a larger CAD
ii. Appreciation:
1. Advantages:
a. Less inflationary pressures as imports are now cheaper
b. Reduce foreign debt denominated in foreign currencies
c. Reduce the debt servicing ratio
2. Disadvantages:
a. Reduction in the competitiveness of the tradeable goods sector
b. Higher levels of capital outflow from Australia as domestic
assets become more expensive than foreign ones
c. A rise in short term unemployment while industries restructure
3. Free Trade and Protection:
a. Australia’s protection policies regarding free trade and protection:
i. Free trade: trade arrangements where tariffs and other barriers to the free
flow of G&S are eliminated.
ii. Protection: the imposition of duties or quotas on imports in order to protect
domestic industry against foreign competition.
iii. Governments aims:
1. Exposing local industries to imported goods → more competitiveness
2. Focus resources on areas of economy Australia has a competitive
advantage
3. Benefiting from globalisation → consumers and businesses have access
to G&S on global market at lower price
4. Aim of encouraging efficient firms to produce what the world economy
demands → structural changes in economy → increased economies of
scale in production
iv. Policies:
1. Historically one of the most highly protected country in the world, because manufacturer found it hard to compete because of small population + ↑cost.
2. 1970-1980: Program to phase out all tariffs.
3. 1974: Whitlam Government, 25% cut on all tariffs.
4. 1988: Hawke Government reduces most tariffs to 5% by 1996 & abolishes quotas + tariffs to 15% on cars, and tariff on textile, clothing and footwear (TCF) to 25% in 2000.
5. Howard Government slowed the schedule of Hawke Government in 2000 because of concern for job losses in Passenger motor vehicle (PMV) and TCF.
6. 1999: several hundred “nuisance tariffs” we abolished.
7. Australia’s reductions on protection have gone beyond the requirement of WTO and APEC.
8. Australia now tends to reduce trade barrier in exchange for greater access to markets in other countries.
b. Implications of Australia’s policies for individuals, firms and governments:
i. Individuals:
1. Increase in unemployment associated with restructuring of firms and industries
2. Import competing industries close (mostly labour based), workers will need to retrain and find new jobs. Can be especially hard for those who have immigrated and do not speak English
3. Short term structural unemployment as workers transition from manufacturing industry to service industry
4. Consumers will be able to have access to more variety of goods at cheaper price
5. Increased living standards as a result of higher competition between firms.

ii. Firms:
1. Forced to compete at global level leading to more efficiencies and increased economies of scale
2. Firms will restructure and reallocate resources to areas where Australia has a comparative advantage, also find new export markets as domestic market decreases
3. Some firms benefit from cheaper capital goods and commodities in the global economy
4. More diverse export base
iii. Governments:
1. Decreased tariffs lead to a decrease in revenue. Tariffs are now only a minor source of revenue compared to past.
2. Government has to assist with structural changes leading to more government spending on retrain and unemployment benefits
3. The policy is unpopular as the costs are visible e.g. structural unemployment, but the benefits are not so visible.
iv. Other economic effects:
1. CAD likely to worsen in the short term from phasing out of protection
2. Long term reduction in CAD and improve international competitiveness
3. Slow phasing out of protection of twenty year period helps industries to adjust better. Problems are easier to manage
4. Full effects of reduction take around two decades to be experienced.
c. Implications for Australia of protectionist policies of other countries and international organisations:
i. Protectionist policies and Government subsidies cause hardships for Australian exporters. E.g. USA subsidies farmers income causing our agricultural goods to have less demand
ii. Australia largely affected by Agricultural products
iii. WTO though made an agreement of 36% tariff cut on agricultural products, some countries find loopholes in agreement, causing hardship for agricultural export countries
iv. Service sectors in many countries closed to outside entrants. E.g. banking, telecommunications
v. In the Doha Round Australia pushed for agricultural trade liberation and arguing against the loopholes that countries exploit in the agreement to reduce.
vi. Future for Australia:
1. Service based industries will continue to grow as a proportion of economy
2. Technology related sectors expected to experience high levels of growth over the long term.
3. Specialised manufacturers will expand their markets by producing high quality goods aimed at specific market niches
4. Primary industries likely to retain important role in Australia’s trade patterns. If agricultural barriers decrease, industries that value-add to agriculture are likely to play larger role in exports.

Topic 3: Economic Issues
1. Economic Issues in the Australian Economy:
a. Economic Growth: A sustained increase in a country’s productive capacity over time.
Commonly measured by percentage increases in an economies GDP
i. Aggregate Demand and its components: AD= C+G+I+(X-M)
1. Factors affecting economic activity:
a. John Maynard Keynes developed a theory that stated the most
important influence on economic growth was the total level of
expenditure in the economy. (aggregate demand)
b. Aggregate Demand (AD): Total level of expenditure in an
economy over a given period of time. Includes consumption,
Government spending, investment and net exports.
c. Aggregate supply(Y): Total level of income in the economy over
a given period of time. Part of national income is collected by
the government through taxation, and the rest is either spent
on consumption of saved.
d. For the economy to be in equilibrium aggregate demand and
aggregate supply must be equal.
i. AD = C+G+I+(X-M)
1. C -Consumption by households
2. I –Investment by businesses
3. G –Government spending
4. X –Export Revenue
5. M –Import expenditure
e. GDP (Total market value of all final goods and services produced
in an economy in a year) is equal to aggregate supply. It can be
measured in 3 ways:
i. Income received method
ii. Final expenditure method
iii. Value added method
iv. Averaging the gives the average GDP
2. Injections and Withdrawals (I+G+X;S+T+M)
a. Injections: Money added to the circular flow
b. Withdrawals (Leakages): Money taken out of circular flow
c. Equilibrium occurs when injections equal leakages
(I+G+X=S+T+M)
d. Injections > Leakages – Economy expands and national
income↑
e. Injections < Leakages –Economy shrinks and national income ↓
3. Simple Multiplier (k=1/(1-MPC)):
a. Allows us to calculate increase in national income from
increases in injections
b. Defined as the number of times an increase in national income
exceeds the increase in aggregate demand that caused it
c. Occurs because of additional spending injected into the
economy, which in turn stimulates further spending and so on
d. Dependent on the MPC as higher spending has a greater
multiplier effect
e. MPC – Change in consumption spending
i. MPC =
ii.
4. Measurement of growth through changes in real GDP:
a. Economic growth measured by increase in real GDP
b. Real GDP measures changes in quantities of final G&S produced
by keeping prices constant
c. Real GDP = nominal GDP x
5. Sources and effects of Economic growth in Australia:
a. Sources:
i. Changes in economic growth are driven by changes in
the level of aggregate demand, which is comprised of
consumption, investment, government spending and
net exports
ii. The largest component of aggregate demand tends to
be consumption. Consumption is influenced by
consumer confidence levels, government policies
(especially interest rates) and the distribution of income
iii. Investment levels depend upon government policies
and business expectations about the future strength of
the economy
iv. Government spending is largely determined by the
political and economic objectives of the government in
power. Changes to government spending are
announced in the annual budget
v. Net exports are influenced by domestic economic
conditions, exchange rate movements, inflation rates
and the international business cycle
vi. Technology changes also improve efficiency in
production
b. Effects:

i. Living Standards: Rise in real wages gives people more
disposable income and therefore higher standard of
living
ii. Economic growth will help to reduce cyclical
unemployment, as stronger growth increases the
demand for labour, leading to an increase in the
availability of jobs.
iii. Strong growth leads usually leads to an increase in
import spending, which will worsen the CAD
iv. High rates of economic growth will also tend to put
strain on an economy’s natural resources, leading to
environmental degradation
v. High levels of economic growth present the risk of
demand-pull inflationary pressures, especially when the
economy is already operating at close to full capacity
6. Business Cycle – Trends:
a. Economic growth for 2007 was 4.1%, increase from 2.6%
previous year, 17 year record long growth
b. Consumption:
i. 2001-04: Reduction in domestic interest rates, increase
in borrowing for homes →housing price boom, increase
in consumption levels.
ii. 2007: High levels of consumer spending as a result from
increase in incomes from commodities boom. CPI for
March 2008 was 4.1%
c. Investment:
i. Commodities boom:
1. Companies searching to build more mines
2. Increase in investment in rural mining towns
ii. Contributed 6% to growth rate in 07
iii. Determined by business confidence
d. Government Spending:
i. Influenced by annual budget
ii. Contributed 0.5% to growth in 07
iii. Mild stimulus to growth
e. Net Exports:
i. Inhibited growth, behaving as a speed limit
ii. Higher imports due to increase in consumption (spill
over effect)
f. Interest Rates:
i. Past year interest rates increased 3 times
ii. Acts as a speed limit on growth
b. Unemployment:
i. Measurement:
1. Labour Force:
a. Consists of:
i. Persons aged 15years and over currently working at
least one hour per week of paid work
ii. Self employed working at least one hour in their own
family owned business
iii. Unemployed 15 years and over currently available and
actively seeking work
b. Not included:
i. Under 15 years
ii. Fulltime, non-working students 15yrs +
iii. People performing fulltime domestic duties
iv. Unemployed not willing to actively apply for jobs or not
available to start work
v. Retired people
2. Participation Rate:
a. Percentage of working age population who are in the labour
force. E.g. Working or actively seeking work
b.
3. Unemployment Rate:
a. Number of people out of work, but are actively seeking work
b. ABS undertakes a monthly survey of the labour force
c. Calculates total number of unemployed and rate of
unemployment
d.
4. Problems with measurements:
a. Effect of underemployment
b. Official unemployment stats don’t take into account hidden
employment
ii. Trends:
1. Unemployment is currently at record lows sitting at 4.1% as at Feb 08.
Lowest in 33 years
2. Participation rate is currently at 65.2% also a record high. Feb 08
3. Currently structural unemployment is the highest contributing factor.
The high level of growth and economic activity has meant a depletion in
cyclical unemployment.
4. Microeconomic reform and structural changes have allowed for the
decrease

iii. Types and Causes:
1. Types:
a. Cyclical:
i. Occurs from downturn in the level of economic activity.
Falling demand and production means fewer
employment opportunities
b. Structural:
i. Occurs from changes in technology or the pattern of
demand for G&S. Workers struggle to match their skills
with different job opportunities in a different industry
c. Frictional:
i. People who are temporarily unemployed as they
change jobs. During change over period between
finishing a job and starting a new one, a person is
considered unemployed and is inevitable in an economy
d. Seasonal:
i. Occurs at regular times throughout the year because of
seasonal change to some work. E.g. Fruit picking,
Christmas. Accounts for the influx of school leavers and
tertiary institution leavers from Dec to March. Official
figures are usually seasonally adjusted
e. Hidden:
i. Those who are unemployed but do not fit into the ABS
definition of unemployment and thus not included in
stats. Includes those discouraged from working and no
longer seeking employment. Est. 820,000 of
discouraged workers in 2004
f. Long Term:
i. Those out of employment for more than 12 months,
usually a result of structural unemployment. Lack the
necessary skills for a job and have difficulty re-entering
the workforce.
g. Hardcore:
i. Long-term unemployed considered unemployable due
to personal reasons. E.g. Mental or physical disability.
Most are on disability support pension and not included
in official stats.
2. Causes:
a. Level of Economic growth:
i. Labour is a derived demand
ii. Fall in production levels result in less jobs required. E.g.
Recession in 1990-92

iii. Unemployed closely related to level of economic
growth:
1. ↑Growth ↓Unemployment
2. ↓Growth ↑Unemployment
b. Stance of Macroeconomic policies:
i. Expansionary policy leads to higher growth and lower
unemployment
ii. Contractionary policy leads to lower growth and higher
unemployment
iii. Interest rate levels also have an impact
c. Constraints on economic growth:
i. Significant constraint results in struggle to create jobs
ii. A sustained growth level is necessary to reduce
unemployment
d. Rising participation rate:
i. Increase in labour force participation will cause a short-
term rise in unemployment
ii. More people looking for work results in more
unemployed till they find a job
e. Structural Change:
i. Loss of jobs in less efficient industries
ii. Workers required to find new jobs in new industry
requiring retraining of skills
iii. E.g. Car production lines in Adelaide. Workers forced to
find new jobs
f. Technological Change:
i. Improved manufacturing can result in capital
substituting labour in methods of production. Usually
structural unemployment as workers must change skills
g. Productivity:
i. Low productivity encourages employees to use capital
ii. Increased productivity would mean more production
with less workers, also resulting in short-medium term
unemployment
h. Inadequate training and investment:
i. Mismatch of skills of unemployed and those desired by
employees
ii. Skills shortages. E.g. Tradespeople means a weakness in
education and training system. People are not
adequately prepared for demands of labour market
i. Rapid increase in labour costs:
i. Wages increase from demand by unions, increase by
IRC or a substantial rise in labour on-costs
ii. Businesses cannot afford extra payments for all staff to
be kept employed
j. Inflexibility in the labour market:
i. Regulations resulting in higher minimum wages than
those that would be set through the interaction
between demand and supply of labour
ii. Howard governments IR system changes have lead to a
decrease in minimum wage and unemployment
iv. Natural rate of Unemployment:
1. Rate of unemployment that is consistent with full employment in the
labour market. Occurs when only frictional, structural and hardcore
unemployment exist and there is no cyclical unemployment
2. Represents the supply constraints of the economy
3. Once natural rate of unemployment is reached any further cuts in
wages or stimulus to aggregate demand will not lead to permanent
reductions in unemployment
4. NAIRU: Non-Accelerating Inflation Rate of Unemployment
a. Inflation should not increase at natural rate of unemployment
b. Attempts to reduce unemployment below the NAIRU will cause
the rate of inflation to increase
c. NAIRU varies overtime, currently estimated above 4.1%
v. Main groups affected by Unemployment:
1. Youths:
a. Employers seeking greater skills and experiences, something
lacking in young workers
b. Reason for increasing school retention rate, means students
gain more education and training
2. Indigenous Australians:
a. Low level of labour force participation
b. Relatively high rates in rural areas
c. 20% unemployment in 2001 by ABS
3. People born outside Australia:
a. Language barrier as many do not speak English
b. Acute problem for foreigners 15-19yrs. 20% in May 2005
vi. Effects of Unemployment – Economic and Social Costs:
1. Economic:
a. Opportunity Cost:
i. Economic resources not being used to full capacity.
Results in the economy operating below its production
possibility frontier

b. Lower Living Standard:
i. High unemployment means a lower production of G&S
→ Lower economic growth→ Lower standard of living
ii. Reduced production of capital goods will decrease
future capacity to produce G&S
c. Decline in Labour skills for long term unemployed:
i. Those unemployed for long periods of time leads to a
loss of skills
ii. Loss of skills, self-esteem and experience making them
less enjoyable
iii. Short term cyclical unemployment can turn into long
term structural unemployment, know as hysteresis
iv. New members will not develop skills if unable to obtain
a job
d. Costs to government:
i. Falling incomes means less tax revenue for government
ii. Less revenue means more for transfer payments
iii. More unemployed also means more transfer payments
iv. Deteriorates government budget balance
e. Lower wage growth:
i. High levels unemployment creates an excess of supply
in labour and lead to a fall in equilibrium of wages
ii. Regulations such as high minimum wage, high
unemployment more likely to lead to slower wage
growth
2. Social Costs:
a. Increased inequality:
i. More low income earners become unemployed
ii. Inequality in income widens as these people have less
money than high income earners
b. Other Social Costs:
i. Severe financial hardship and poverty
ii. Increased levels of debt
iii. Boredom
iv. Homelessness
v. Increased social isolation
vi. Increased levels of crime
vii. These problems result in economic costs, more
resources must be directed to dealing with them

c. Inflation:
i. A sustained increase in the general level of prices in the economy
ii. Measurement – current ABS measure
1. Most widely used measure is the percentage change in the CPI
(Consumer Price Index)
2. CPI:
a. A basket of goods and services weighted according to their
significance to the average Australian household
b. Compiled by the ABS every 3 months
c. Covers a wide selection of items reflecting average household
spending patterns
d. Exclude changes in mortgage interest rate and consumer credit
charges
e. Does not include residential property prices
3. Underlying Inflation is also used:
a. Excludes seasonal factors, interest rate changes and influence of
other policy changes
b. Intended to measure relationship between Aggregate Demand
and Aggregate Supply
4. Inflation rate Formula:
5. The RBA has an inflation target band between 2-3%
iii. Trends:
1. Current Inflation rate as at March 2008 is 4.2%
2. 01-02: Introduction of the GST saw inflation double to 6% within a few
months but then stabilising
3. 03-06: Inflation generally stayed within target band
4. 06-07: Increase in consumer spending
5. Currently:
a. Cost-push inflation
b. Result of cost of minerals
c. Inflation is being influenced by external factors
d. Domestic consumer confidence at low levels
e. Reports suggest Australia is facing most difficult inflation
problem since the onset of the low inflation in 1990s
iv. Causes and Effects:
1. Causes:
a. Demand-pull Inflation:
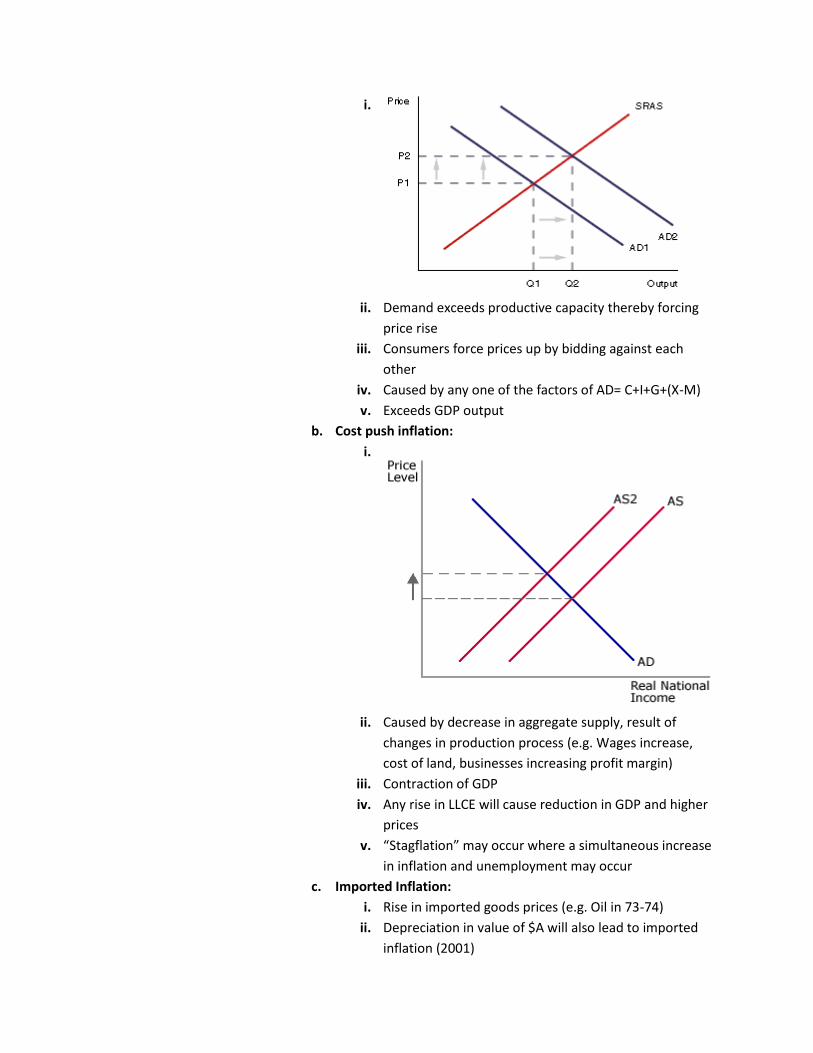
i.
ii. Demand exceeds productive capacity thereby forcing
price rise
iii. Consumers force prices up by bidding against each
other
iv. Caused by any one of the factors of AD= C+I+G+(X-M)
v. Exceeds GDP output
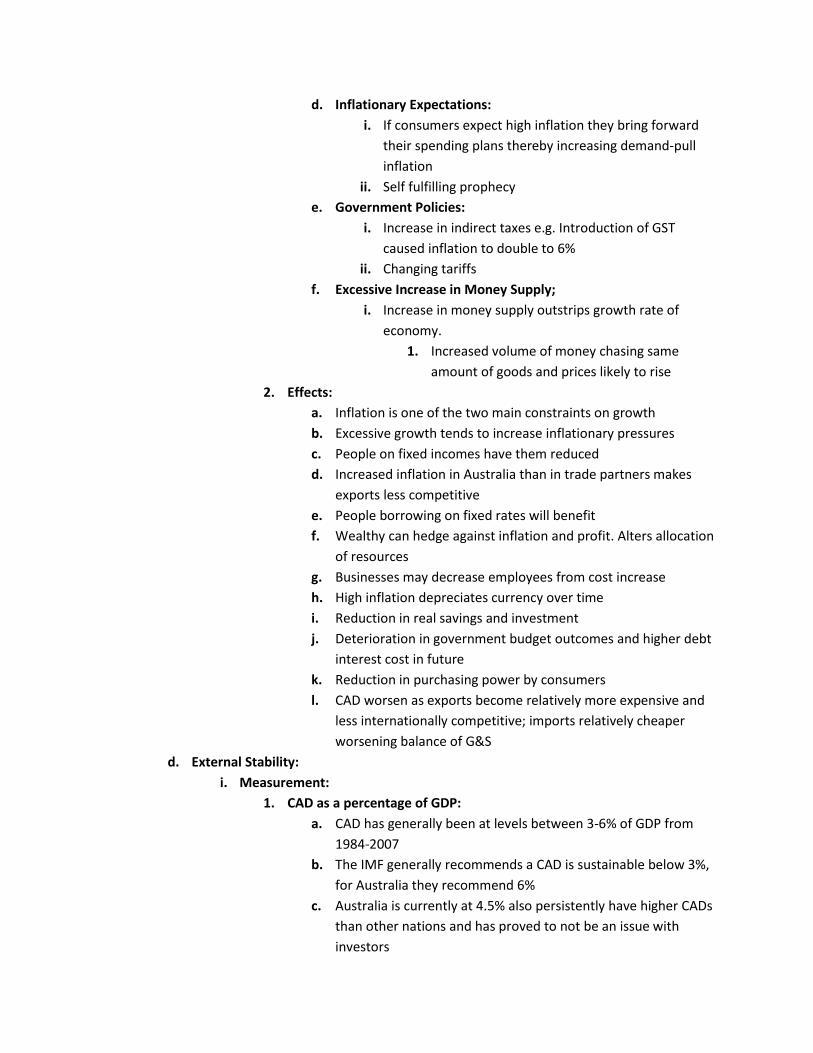
b. Cost push inflation:
i.
ii. Caused by decrease in aggregate supply, result of
changes in production process (e.g. Wages increase,
cost of land, businesses increasing profit margin)
iii. Contraction of GDP
iv. Any rise in LLCE will cause reduction in GDP and higher
prices
v. “Stagflation” may occur where a simultaneous increase
in inflation and unemployment may occur
c. Imported Inflation:
i. Rise in imported goods prices (e.g. Oil in 73-74)
ii. Depreciation in value of $A will also lead to imported
inflation (2001)
d. Inflationary Expectations:
i. If consumers expect high inflation they bring forward
their spending plans thereby increasing demand-pull
inflation
ii. Self fulfilling prophecy
e. Government Policies:
i. Increase in indirect taxes e.g. Introduction of GST
caused inflation to double to 6%
ii. Changing tariffs
f. Excessive Increase in Money Supply;
i. Increase in money supply outstrips growth rate of
economy.
1. Increased volume of money chasing same
amount of goods and prices likely to rise
2. Effects:
a. Inflation is one of the two main constraints on growth
b. Excessive growth tends to increase inflationary pressures
c. People on fixed incomes have them reduced
d. Increased inflation in Australia than in trade partners makes
exports less competitive
e. People borrowing on fixed rates will benefit
f. Wealthy can hedge against inflation and profit. Alters allocation
of resources
g. Businesses may decrease employees from cost increase
h. High inflation depreciates currency over time
i. Reduction in real savings and investment
j. Deterioration in government budget outcomes and higher debt
interest cost in future
k. Reduction in purchasing power by consumers
l. CAD worsen as exports become relatively more expensive and
less internationally competitive; imports relatively cheaper
worsening balance of G&S
d. External Stability:
i. Measurement:
1. CAD as a percentage of GDP:
a. CAD has generally been at levels between 3-6% of GDP from
1984-2007
b. The IMF generally recommends a CAD is sustainable below 3%,
for Australia they recommend 6%
c. Australia is currently at 4.5% also persistently have higher CADs
than other nations and has proved to not be an issue with
investors

2. Net Foreign Debt as percentage of GDP:
a. Total stocks of loans owed by Australians to foreigners, minus
the total stock of loans owed by foreigners to Australians
b. Relatively little foreign borrowings until 1980s when the
deregulation of the financial sector occurred leading to a steady
increase in borrowing in the future years
c. 1983 Foreign Debt measured 12.9% of GDP
d. 2007 Foreign Debt measured 56.3% of GDP
3. Net Foreign Liabilities as a percentage of GDP:
a. Net Foreign liabilities = Net FD + Net FE
b. Net Foreign Equity: Total value of assets in Australia owned by
foreigners minus overseas assets owned by Australians
c. Sustainable under 40% of GDP
d. 1983 measured 25.3% of GDP
e. 2007 measured 68% of GDP
f. The Debt Servicing Ratio (Interest payments as a proportion of
export income)
i. 1980s measured 20%
ii. 2007 measured 11%
iii. Recommended sustainable below 10%
ii. Trends:
1. Australia has consistently had a high CAD
a. Normally seen as an issue but has not really affected Australia
(Pitchford Thesis)
b. Australia has consistently relied on foreign investment to fill
gaps between domestic savings and investment
c. Investors still persist with positive actions towards Australia.
They are confident in our economy and continue to invest
d. Commodities boom has seen a vast expansion in mining
exploration. Many international companies investing into
Australia and buying Australian mining companies
iii. Causes and Effects:
1. Causes:
a. Changes in Australia’s Terms of Trade:
i. If TOT decreases Australia needs to sell more exports in
order to purchase the same number of imports
ii. Currently experiencing an increase in the TOT
1. High level of activity with more imports being
purchased
b. Fluctuating Exchange rate:
i. High $A leads to more imports thereby worsening the
CAD

ii. Reduced international competitiveness of exports
c. Level of Economic Activity within the economy:
i. ↑Growth, ↑Consumption and Investment > Spill over
in trade>increased imports
d. Level of Economic activity in Australia’s major trading
partners:
i. The need for our exports can affect the CAD
ii. Reduced export income means less available to service
the debt
iii. China & India’s growth is shielding Australia from the
downturn in the global economy
e. Increased Foreign Debt:
i. Foreign Debt ↑ > ↑interest payments
ii. Recorded in CAD, adding to deficit
1. Two Reasons:
a. Increasing CAD
b. Depreciating $A
2. Effects:
a. Increasing CAD:
i. Increased level of foreign debt
ii. Government trying to lower domestic activity (increase
interest rates)
b. Large CAD act as ‘speed limit’ on economic growth
c. Growing CAD may deter Foreign investors to doubt economies
ability to repay debt
i. May lead to capital flight
d. May cause rise in inflation ↓$A > ↑Import prices, ↑Import
inflation
e. ↑FD > ↑Debt Servicing > Debt Trap
f. Increased vulnerability to external shocks
g. Increased development opportunities
h. Most of Debt is private and so is not an issue (Pitchford Thesis)
e. Distribution of Income and Wealth:
i. Income: Amount of funds or other benefits measured in money terms, that flow
to individuals or households from the sale of factors of production
ii. Wealth: Holding of assets both financial and physical held by an individual at
any given point in time
iii. Measurement:
1. Lorenz Curve: Diagram used to compare the percentages of income
received against the percentages of income recipients
a. Line of total equality represents more the income recipients
receive if they all got the same income

b. The more a countries Lorenz curve deviates from the total
equality line the greater the income inequality is
c.
2. Gini Coefficient:
a.
b. Single stat that summarises the income across the population
c. Calculated from area between Line of Equality and Lorenz Curve
and total area underneath LOE
d. Ranges between 0-1
i. 0= all incomes equal, 1= Single household receives all
income
e. Smaller the coefficient the better the distribution of income
iv. Sources of Income as a percentage of Household income:
1. Gross Income: The returns of selling factors of production plus
government benefits and pension
2. Wages and Salaries: Income derived from supply of labour. Accounted
54.9% of peoples income
3. Transfer Payments: Payments received from the government, 11.9%
4. Superannuation: Savings for retirement. Increasing at a steady rate
5. Rent: Return from land. 10.1%
6. Profit: Received from provision of entrepreneurship. 18.4%
7. Interest and Dividends: 4.7%
v. Sources of Wealth:
1. Wealth distribution is significantly uneven
2. Four Main sources:
a. Inheritance: Helps ensure perpetuation of inequality
b. Income inequality: People with higher incomes can save more
and build wealth
c. Different Propensities to Save: People who save a higher
proportion of income will increase their wealth
d. Entrepreneurial and Investment Luck/Talent: Some are
successful in investing wealth and increasing its size
vi. Dimensions and Trends:
1. Age: Middle age earn the most. Young and old the least. The mean
average income in 06/07 was $644/wk while the median income was
$563/wk
2. Gender: Men consistently receive higher wages than women.
a. Reasons include: Gaps in womens careers, Childcare and
Stereotypes (Glass Ceiling)
b. Large proportion working part time/casual
3. Occupation and Education:
a. Highly skilled jobs tend to pay more
b. More people staying in school longer to gain higher skills
4. Family Structures:
a. One parent families considered very dependent on government
assistance
b. Generally couples with no dependents earn most
c. Singles earn the least
5. Geography:
a. ACT citizens earn most ($1067/wk)
b. Tasmania the least
c. Highest incomes generally in the cities, lowest in country
regions
6. Ethnic Background:
a. Migrants from English speaking countries tend to earn most
b. Non-English speaking struggle with language barrier and tend to
have lower incomes
c. Dependency on amount of time they have been here
d. ATSI struggle and continue to suffer very low incomes
vii. Economic and Social Costs & Benefits of Inequality:
1. Economic:
a. Benefits:
i. Encourages the labour force to increase education and
skills levels
1. Higher qualifications given higher incomes
ii. As long as low incomes can afford to pay for education,
encourage increase in the equality of labour
iii. Encourages labour force to work longer and harder:

1. Enhance economic growth > More hours and
overtime
iv. Labour Force more mobile:
1. Higher incomes an incentive to move to get
more pay
v. Encourage entrepreneurs to accept risks more readily
vi. Greater potential for higher savings and capital
formation
1. High income, more proportion saved
2. Provide less reliance on foreign investment
vii. Technological progression
b. Costs:
i. Reduces overall utility:
1. Reduction in level of satisfaction
2. E.g. Extra $1 worth more to lower income
earner than higher income
3. Reduce economic growth
a. Faster growth if income more widely
distributed
4. Reduces consumption and investment
a. Low income: more spent on necessities,
less spent on wants > less economic
activity, less employment and investing,
lower living standards
5. Creates conspicuous consumption
a. Individuals sense of self worth
dependent on their relative position in
the wealth/income hierarchy
6. Creates poverty and social problems
a. Homelessness
b. Health issues
7. Increase cost of welfare
2. Social:
a. Benefits:
i. Formation of a structured society
b. Costs:
i. Social class division
ii. Poverty> Health, Crime, Low self-esteem. Lower life
expectancy
iii. Strain on government
iv. Vicious cycle > Affluent engage in conspicuous
consumption

f. Environmental Management:
i. Ecologically Sustainable Development:
1. Bruntland Report (1987) defines ESD as “development that meets the
needs of the present generation without compromising the ability of
the future generations to meet their own needs”
2. Recent decades have seen increasing pressure placed on environmental
considerations in the economic decision making process
3. Current and future development should involve the use of resources in
a way that also conserves them, so that ecological processes on which
life depends are maintained
4. Balance between Economic growth and ecological preservation
5. 3 Common elements of views on sustainable development:
a. Equity both inter-generational and intra-generational
b. Quality of environment and ability to continue supporting
community at a certain level
c. Concepts of quality of the life and human-needs satisfaction
ii. Private and Social Costs & benefits – market failure:
1. Businesses, consumers and governments all want to achieve a
maximum level of economic growth as it has great private benefits:
a. Businesses increase profits
b. Consumers increase incomes, improves material standard of
living
c. Governments increase progress, living standards, lower
unemployment and increased revenue
2. Price at which goods sold is the Price mechanism
a. Involves interaction of supply and demand to reach equilibrium
price and quantity
b. Does not factor in environmental factors. Private benefits but
are not directly affected by social costs
c. Market failure occurs from account of private benefits/costs but
not social costs
3. Price mechanism ignores several costs:
a. Social cost of production as these are not borne by individual
producers or consumers
b. Does not factor in future demand for G&S from use of resources
that have been depleted or destroyed
c. May not account for any depletion of resources that will affect
the economy’s ability to grow in the future. Depreciation of
natural capital
4. Tragedy of the Commons: Environmental goods overused and destroyed
as a price or value for the good cannot be determined
iii. Public and Private Goods – Free Riders:
1. Public Goods:
a. Non-excludable: Available to everyone no matter their
circumstances
b. Non-rural: Consumption by one does not reduce the use by
another
2. Private Goods:
a. A good temporarily or permanently used up when someone
consumes it and is easy to exclude people who are unwilling to
pay for benefits
3. Free Riders: When groups or individuals benefit from a G&S without
contributing to the cost of supplying the G&S. As a consequence the
G&S is likely to be under supplied in relation to the total demand
iv. Issues:
1. Preservation of Natural Environments:
a. Most important issue in managing the economy
b. Environmental damages affect human health through greater
levels of air and water pollution
c. Preservation can include measures such as:
i. Restriction on development in environmentally
sensitive areas, such as mining in national parks
ii. Controls over emission of waste
iii. Requiring new plantation in areas where logging has
occurred
iv. Actively protecting the natural environment from
threats such as non-native plants
d. Governments can face problems:
i. Short term reduction in economic growth and a
‘distortion’ of the price mechanism
ii. Industries face higher costs if they have to comply with
rigorous environmental standards, making us less
internationally competitive
iii. Cost of repair often borne by taxpayers rather than
those who caused the economic damage
2. Pollution Control:
a. Pollution occurs when the natural environment is degraded in
some way
i. Chemical, noise, rubbish
ii. Affects water, land, atmosphere and wildlife
b. Particularly serious issue since Industrial revolution
c. Affects often felt far from the source
d. Kyoto Protocol: required industrial nations to reduce average
national emissions by appro 5% below 1990 levels by 2008-12

i. Australia ratified agreement in December 2007
e. Government have a range of options including banning
production of some goods, implement quotas on production or
emissions, subsidise environmentally friendly practices
f. Price mechanism fails to include environmental cost
3. Externalities:
a. Social and environmental costs associated with economic
activity, which are not reflected in the actual cost of production
are known as externalities
b. Costs and benefits that affect society as a whole
c. Generally not dealt with by those responsible for them
d. Negative Externalities (Costs to society):
i. Price mechanism only accounts for private costs and
benefits
ii. E.g. Air pollution from cars not factored into production
cost
e. Positive Externalities (Benefit to Society):
i. E.g. Trucks on roads provide more jobs and increase
demand for roadside food stop
4. Depletion of renewable and non-renewable resources:
a. Renewable resource: Can naturally regenerate in a short
amount of time. Over exploitation may lead to the resource
becoming non-renewable
b. Non-renewable resource: Naturally occurring resources that
cannot regenerate in short period of time e.g. Oil, Coal
c. Sustainable Management aims to ensure present generation
does not over consume resources so they are available for
future generations
Topic Four: Economic Policies and Management
1. Economic Objectives in relation to:
a. Economic Growth:
i. Government aims to maintain a stable level of economic growth that provides
full employment and low inflation
ii. Tries to ensure growth does not become too low or high
iii. Offers benefits such as:
1. Increased standard of living
2. Improved job prospects
3. Opportunity for increased investment in infrastructure and public
services
b. Full Employment:
i. Aim to achieve natural rate of unemployment (removing cyclical
unemployment)
ii. Can be achieved through macroeconomic policies and microeconomic reform in
the long term
iii. Benefits include:
1. Maximising economies capacity to produce
2. Minimise adverse economic and social problems
c. Price Stability:
i. Maintain a low level of inflation
1. Sustain at a level that causes minimal distortion to the economy
ii. RBA has a target band of 2-3% underlying inflation
iii. High inflation may:
1. Reduce real value of income and wealth
2. Reduce international competitiveness
3. Depreciate the exchange rate
4. Create uncertainty of future costs and distort economic decision making
5. Distort pattern of resource allocation
d. External Stability:
i. Achieve a sustainable position on current account
ii. Maintain confidence in the value of the dollar on global financial markets
iii. Maintain acceptable level of foreign debt:
1. Sustainable debt servicing ratio
iv. Australia has consistently had a high CAD, above 6% of GDP is considered a
problem
e. Environment:
i. Ecologically sustainable development (ESD)
ii. Attempt to reduce greenhouse emissions and ensure resources are not over
used
iii. Conflicts with economic growth and have short term side effects
iv. Private benefits outweigh social costs
f. Distribution of Income:
i. Aim to reduce the gap in income levels
ii. Does not intend to remove inequality but aim to help those not able to provide
for themselves
iii. Redistribute income through tax and transfer payments
iv. Mainly focus on policies that will increase economic growth as this impacts
incomes
g. Potential Conflicts between objectives:
i. Achieving simultaneous reduction in employment and inflation:
1. Low unemployment may lead to higher inflation from demand
2. High unemployment will have low inflation from decrease in demand
ii. Achieving Economic growth and external balance:
1. Strong growth > deteriorate current account
2. Balance of payments constraint: limitation on rate of growth because of
the impact of high growth on the CAD
iii. Economic growth at cost of environment and greater income inequality
iv. Short and long term goals may conflict. E.g. Structural change may have
negative short term impact
2. The Main Policies available from economic management:
a. Macroeconomic Policies:
i. Rationale for macroeconomic policies- stabilisation and shifts in aggregate
demand:
1. Aim to manage the business cycle by stabilising the ups and downs
2. Also known as counter-cyclical policies
3. Stimulate or reduce economic activity
4. Difficult to deal with long term issues but effective in short term
5. Types include: Fiscal Policy, Monetary Policy, etc.
b. Microeconomic Policies:
i. Rationale for microeconomic policies including shifts in aggregate supply and
efficiency:
1. Aim to improve resource allocation between firms and industries in
order to maximise output from scarce resources
2. Microeconomic reform central to addressing long term issues in
constraints on growth
3. Mainly influences supply side economics by improving competitiveness,
productivity and efficiency of Australian industries
4. Policies range from individual government departments to entire
industries
5. Aim is to encourage the efficient operation of markets as determined
by:
a. Allocative efficiency: Allocation to industries which reflect
consumer demand
b. Productive Efficiency: Producing in long run at lowest average
cost
c. Dynamic Efficiency: Adaptability to a changing environment
d. Inter-temporal Efficiency: Allocation between current
consumption and investment
c. Fiscal Policy:
i. Federal Government Budgets and budget outcomes:
1. Fiscal policy involves the use of the Commonwealth governments
budget in order to achieve the Governments economic objectives
2. The two main instruments are Revenue (Taxes) and Expenditure:
3. By manipulating the level and composition of taxation and government
spending the result can impact the following:
a. Aggregate demand and level of economic activity
b. Pattern of resource allocation
c. Distribution of Income
4. Budget Outcomes:
a. Balanced Budget: Government revenue = Spending
b. Budget Surplus: Revenue > Spending
c. Budget Deficit: Revenue < Spending
d. Two measures of outcomes:
i. Accrual accounting method: Total revenue less total
expenses less net capital investment. Is considered
most accurate long term indicator.
ii. Cash accounting method: Underlying cash outcome.
Best indicator of fiscal policy on level of economic
activity this year.
iii. Removal of one off transactions occur in both methods
as they can distort the budget outcome
e. Fiscal policy operates in two ways:
i. Discretionary Changes in Policy: Deliberate changes
e.g. changing tax rates. They influence the structural
component of the Budget outcomes.
ii. Non Discretionary Changes: Influences other than
those planned, caused by changes in economic activity.
Managed by application of automatic stabilisers
iii. Two main stabilisers include:
1) Unemployment benefits: More assistance
provided in recession, while assistance will
decrease as more are employed when higher
level of economic activity occur

2) Income Tax System: Progressive system means
as people earn more they are charged a higher
rate of tax and when earning lower are charged
lower rate thereby helping to control the level
of spending
3) Play a counter-cyclical role in the budget,
though not strong enough on their own they
can assist with discretionary changes
ii. Effects of Budgetary Changes on resource use, income distribution and
economic activity:
1. Impact on Resource Use:
a. Directly occur through spending in a particular are of the
economy. E.g. Constructing an underground tunnel
b. Indirectly through imposing taxes to make a resource less
attractive used in a particular way or by offering a subsidy to
influence the use of a resource more
c. Government will use direct measures if the private sector will
not provide resources quick enough. E.g. Direct Relief in a
natural disaster
2. Impact on Income Distribution:
a. Changes in taxation will affect the distribution of income
i. Adjusting the income tax levels thereby making the
system more or less progressive
b. Adjust the amount pain in transfer payments to those on lower
incomes
c. Adjustments in spending on community services e.g. Adult
education and training programs for unemployed can affect the
income distribution as lower income earners may have to pay
more for services that were previously free thereby increasing
inequality
3. Impact on Economic Activity:
a. Impact can be described as three different effects:
i. Expansionary: Government plans to increase economic
activity, this can occur through a smaller surplus
(reduce taxes) or a larger deficit (increase spending)
1) Leads to a multiplied increase in consumption
and investment stimulating aggregate demand
ii. Contractionary: Government plans to decrease
economic activity. Occurs by:
1) Smaller Deficit (Reduced Spending)
2) Larger Surplus (Increased taxes)

3) Leads to a multiplied decrease in consumption
and investment dampening aggregate demand
iii. Neutral:
1) Government plans to maintain the gap in
revenue and spending the same as previous
year
2) Should have no effect on overall level of
economic activity
iii. Methods of Financing Deficits: There are 3 main ways to finance a deficit
1. Borrowing money from domestic private sector:
a. Selling treasury bonds under a tender system
b. Government sets value of bonds to be sold, purchasers tender
to buy a certain amount at a particular rate of interest
c. Government starts with lowest rate of interest through to
highest until all are sold
d. Crowding out effect: Deficit results in private sector having less
savings to use and forced to borrow from overseas
2. Borrowing from the RBA (Monetary Financing):
a. Government sells assets to RBA who then print money for the
government
b. May increase money supply and add to inflation pressures
3. Borrowing from Overseas:
a. Borrowing from overseas lenders, minimises crowding out
effect
b. May increase governments share of public debt which will need
to be payed back
c. May influence exchange and interest rates by overseas
borrowing
4. Alternative method is the selling of government assets (privatisation)
a. One off transaction and do not affect budget outcome
b. Money can be used to finance a deficit
iv. Use of a Surplus:
1. There are 3 main options for a surplus:
a. Deposit with RBA: Accumulate for future spending
b. Use to pay off Public Sector Debt thereby reducing interest and
liabilities to private sector or overseas lenders.
d. Monetary Policy:
i. Purpose of Monetary Policy:
1. Monetary policy refers to actions taken by the RBA to influence the
supply and cost of credit in the economy. The main tool used by the RBA
is its Domestic Market Operations to influence the cash rate in the

economy on overnight loans from the cash market or short term money
market
2. There are 3 main objectives of Monetary Policy as found in the Reserve
Bank Act 1959
a. Minimising the risk of inflation, maintaining stability in the value
of the $A
b. Maintain full employment
c. Sustain long term growth helping to increase the living
standards
3. The RBA has a target band of 2-3% of CPI, it also acts independent of the
Government so that political matters will not harm the economy
4. NZ was the first country to create the concept of an inflation target and
has now been adopted by many countries around the world
5. Various indicators considered when determining inflation situation.
a. Inflation Rate
b. Inflationary Expectations
c. Wages Growth
d. Unemployment
e. Rate of Economic growth
f. Interest and Exchange rates
g. Balance of Payments
ii. Implementation of Monetary Policy – Reserve Bank of Australia:
1. Two Instruments for conducting MP
a. RBA may control growth in the Money Supply in the economy in
its control of the money base
b. Influencing the general level of interest rates by setting the
short run cash rate
2. Monetary targeting used to be the method used in the 70s and 80s but
was found to be ineffective. The main method now is through the
interest rate instrument
3. Since the market is now deregulated the RBA cannot directly influence
interest rates but do so through its DMO’s
4. Domestic Market Operations (DMOs):
a. DMOs are conducted directly between the financial institutions
and the RBA through their exchange settlement accounts (ESA)
b. Banks required to keep a certain amount of funds with the RBA
in ESAs to settle payments with other banks and the RBA. E.g.
Cheque drawn on the ANZ Bank, needing to be paid to someone
in Westpac Bank
c. Banks needing to borrow while some may have a surplus from
daily transactions is known as the market for settlement funds

d. Increase in funds in the short term money market > Cash rate of
interest falls
e. Decrease in funds > Cash rate of interest increases
f. RBA can exercise control by buying and selling second hand CGS
(known as DMO process). Thus affecting supply in short term
market and the cash rate of interest
g. Demand on banks ES accounts requires RBA to constantly
intervene to maintain cash rate at desired level
h. By affecting the cash rate, RBA creates a flow on affect to long
term and mortgage rates within the banks as they try to
maintain profit margins
i. RBA can tighten MP by ↑Int. Rates
j. RBA can loosen MP by ↓ Int. Rates
MP Stance DMO O/N Cash Mkt
Cash rate Mkt Int. Rate
Tighten RBA sells CGS
Shortage of funds
Rises Rise
Loosen RBA buys CGS
Excess of Funds
Falls Fall
iii. Impact of Changes in Interest Rates on Economic Activity, Exchange Rate:
1. MP sometimes referred to as transmission mechanism
2. Fall in rates should encourage borrowing by both businesses and
consumers →↑Spending and Investment→↑Eco. Activity
a. Businesses: Capital, Expansions, Upgrades
b. Consumers: Major Purchases e.g. house, car
3. Cost of servicing existing loan becomes cheaper leaving excess for
additional spending
4. Discourages financial inflows→ Depreciation of currency making Aus
goods relatively competitive in both dom. & O/S markets →Stimulating
AD & Eco. Activity→↑Inflation pressures
5. Increase in AD lead to higher output and employment or spill over into
high prices and wages growth if economy at Full employment
6. ↑ Aggregate spending lead to ↑in demand for money
7. Increase in rates will dampen consumer and investment spending
→↓Eco Activity & Inflation →↑U/E
8. Changes can be made immediately but take 6-18mths for full impact to
be felt
a. Poses problems as difficult to determine what may happen in
the future
9. Current Stance on MP:
a. Tightening MP since May 2006
i. 12 cash rate increases
b. Current rate at 7.25% as of March 2008
e. Structural Change:
i. Effects of microeconomic policies on individual product and factor markets
and the economy:
1. Structural change refers to the process of change in the pattern of
production in an economy overtime
2. Structural Change can occur from a range of influences including:
a. Changes in the pattern of consumer demand
b. Technological Change
3. Different growth rates occur between and within different industries
overtime
4. Movement of resources from one area to another represents a key
constraint on the speed of structural adjustment:
a. Workers must acquire new skills
b. Existing capital adjusted or replaced
c. Entrepreneurs must find new ways to convince consumers to
buy
5. Important to remain competitive in a fast-changing global economy
a. Slow change may result in consumers turning to imports
i. Low productivity growth
6. Microeconomic policy reform is action taken by Government to improve
resource allocation between firms and industries in order to maximise
output from scarce resources
a. Known as a supply side economic strategy
7. Aim of reform is to encourage the efficient operation of markets
8. Achieved through three aims of a more efficient allocation:
a. Allocative Efficiency: Moving resources to areas where they are
used more efficiently
b. Technical Efficiency: Powerful financial incentives to maximise
efficiency and minimise costs for producers
c. Dynamic Efficiency: Producers able to respond quickly to change
in both domestic and global economy
9. Main Instruments for microeconomic reform include:
a. Reduced protection
b. Deregulation
c. Competition Policy (against anti-competitive behaviour)
d. Taxation Reform (improve incentives)
e. Reform of public monopolies (decreases natural monopolies,
allow private accesses)
f. User paying prices (more private & more competitive)
g. Corporatisation or Privatisation (make PTEs commercially
viable)
h. Labour Market Reform (bring about more competitive, flexible
market)
10. Basic Rationale:
a. ↑Efficiency & productivity →↑National Output→↑National
income→↑Savings→↓CAD (in reality output increases as
savings decreases as consumers spend more. Thus CAD
worsens)
ii. Regulation & Deregulation:
1. Deregulation:
a. Simplification or removal of rules that constrain the operation
of market forces, and aims to improve the efficiency of
industries. Mainly occurred since 1980s
b. E.g. Financial Sector:
i. First occurred with floating $A then allow foreign banks
to enter Australia
ii. Followed by allowing financial institutions to compete
with banks (increasing competition, reducing prices)
c. E.g. Transport Industries:
i. Deregulated in 1990, ended two airline policy
ii. 4 airlines now conduct domestic travel at increasingly
low prices
iii. Est. Civil Aviation Authority and Federal Airports
Corporation
2. Competition Regulation:
a. Concentration of ownership, mergers and excessive market
control have created the need for government control of
business behaviour to ensure consumer protection
i. E.g. trade Practices Act. 1975
ii. ACCC (Australian Competition Consumer Commission)
b. Prohibits: Price discrimination, exclusive dealing, anti-
competitive behaviour, misuse of market power, etc.
c. National Competition Policy:
i. Response to 1993 Hilmer Report
ii. Began in 1995, agreement between state and federal
government to implement reforms to increase
competition in sectors which monopolies operated
iii. Setup the ACCC
3. Public Enterprise Reform:
a. Three types of Reform:

i. Privatisation: Partial or total sale of PTE to private
sector
ii. Corporatisation: PTEs operate independently from
government to operate as if private enterprise
iii. Deregulation & introduced competition: Where natural
monopolies exist introduce franchise solution
f. Trade Policy:
i. Direct and indirect policies to promote or restrict trade:
1. Tariffs mainly in the manufacturing industry have consistently been
reduced since 1980s
2. Government provided export assistance in place of tariffs
3. Australia has had generally high tariffs in manufacturing and motor
vehicles:
a. Reduced as they promote inefficiency and misallocation of
resources
b. Aust. Now has a general tariff level of 5% to import
ii. Trade and Industry Policies in Australia:
1. Most significant bilateral agreement to Australia would be CERTA, has
lead to free trade between Aus and NZ
2. APEC has been Australia’s focus for policies of fostering regional trade
liberalisation and est. Free trade by 2020
3. Trade Agreements have three dimensions:
a. Bi-Lateral: between two nations e.g. CERTA in 1983
b. Multi-lateral: Between multiple nations or particular regions.
E.g. APEC, ASEAN
c. WTO process: Ensuring other countries comply with the WTO
agreement. Ability to lodge complaints when O/S countries
have affected Aust. Export to O/S markets
4. Annual trade statement shows changes to Government trade
negotiation policies
g. Prices and Incomes Policy:
i. Reasons for Prices and Incomes Policies:
1. Involves Government action to influence the terms of pay and the
conditions under which Australians work
2. No current Prices and Incomes Policy
a. Existed in Hawke and Keating government
3. Reasons include:
a. Reducing Inflation and Unemployment:
i. Freely functioning labour market may allow a wages
breakout, undermining government efforts to maintain
low inflation

b. International Competitiveness: Maintaining low wages costs in
1980s would help raise international competitiveness
c. Reducing Strike levels: Have an effective mechanism to reduce
wages disputes and minimise industrial conflicts
d. Fairer Distribution of Income: Wage earners with greater
bargaining power are able to negotiate larger increases than
those with limited power
e. Achieving Specific Policy objectives:
i. Gives government an additional macro policy
instrument to achieve its objectives e.g. Keating used
policy to introduce compulsory superannuation
ii. Possible Prices and Incomes Policies in Australia:
1. Possible Prices Policies:
a. Main role to control inflation
b. Never been of major significance as Commonwealth
government does not have constitutional power to control
prices
c. Can influence through the ACCC. E.g.:
i. Conduct inquiries into price structure
ii. Recommend changes to regulatory policies for specific
industries
d. ACCC powers seen as part of its function rather than parts of a
prices policy to reduce inflation
2. Possible Incomes Policies:
a. Centralised wage determination system:
i. Existed from 1904 when Commonwealth Conciliation
and Arbitration Commission was est. To make federal
awards
ii. Became AIRC until enterprise bargaining began in 1991
iii. FPC exists now to determine minimum wage rates
b. Decentralised Wage Determination System:
i. Involves employees negotiating with employers at their
workplace
ii. Gradually been phased in
iii. Advantages and Disadvantages of Centralised and Decentralised Policies:
1. Centralised:
a. Advantages:
i. Protects interests of wage earners
ii. Restrains excessive wage increases to minimise inflation
and increase employment
iii. May help to achieve key economic objectives
b. Disadvantages:

i. Lack of flexibility and incentive for productivity
improvements
ii. Can lock in high inflation
2. Decentralised:
a. Advantages:
i. More efficient allocation of resources and structural
change
ii. Gives employees greater incentive to work productively
iii. Reduces inflationary pressures, improve international
competitiveness and business confidence
iv. More flexible labour market
v. Reduces Unemployment
b. Disadvantages:
i. Leads to greater inequality
ii. Increased level of industrial disputes
iii. No mechanism against wage-push inflation
iv. May increase underemployment
h. Labour Market Policies:
i. Current Industrial Framework:
1. Safety Net, Wage Cases, Enterprise bargaining, Workplace
Agreements:
a. Safety Net:
i. Industrial awards are a set of pay and conditions
specific to a particular industry or sector
ii. Provide safety net of minimum wage and conditions
iii. Since 1998 AIRC has been reconstructing awards to
cover 20 key principles e.g. pay rates, holidays,
allowances etc.
iv. 2006 Howard government changes reduced from 20 to
16 principles
1) AFPC now conducts minimum wage setting
b. Wage Cases:
i. AFPC now determines minimum wage
1) Occurs less regularly than with the AIRC
c. Enterprise Bargaining:
i. Employees and workers collectively negotiate
agreements regarding wage adjustments, conditions,
practices and reforms to productivity
1) From 1994-06 ‘no disadvantage test’ ensured
employees did not become worse off. If
satisfied it was approved by AIRC
ii. 2006 onwards: Employers only have to pay minimum
and can remove provisions e.g. Overtime
d. Workplace Agreements (AWAs):
i. Introduced in 2006 as part of IR reforms
ii. Individual contracts to create maximum flexibility to
adjust work and conditions to the circumstances of the
workplace
iii. Negotiate individually or collectively, each employee
must sign individually
iv. Apply a ‘community standards test’ by OEA
v. 2006 reforms encouraged to make AWAs larger
proportion of IR system
2. Role of the courts, tribunals and the employment advocate:
a. Role of the Courts:
i. High Court: Contract Law, Secondary Boycotts
ii. Federal Court: Injunctions ordering employees to work
if in industrial dispute outside the bargaining period
b. Tribunals:
i. ACCC: Secondary Boycotts (Union Bans) in Trade
Practices Act 1974
ii. AIRC: Hearing Safety Net Review Wage Cases
c. Employment Advocate:
i. Administration of AWAs
ii. Investigate breaches of AWAs
iii. Referring AWAs to AIRC if in doubt over the 10
community standards
3. Arguments for and against the current mix of market and non-market
forces used to determine the returns to labour:
a. Significant deregulation
b. Labour Market to become more flexible and competitive
i. Higher labour productivity, increased output growth,
employment creation
ii. Majority of workers to be caused by AWAs
c. Income distribution gap will widen; increased inequality
d. Higher skilled workers have more bargaining power
e. Low paid workers likely to lose benefits. E.g. overtime, leave
loading, penalty rates
f. Employees will only have to pay minimum set in award.
Removal of ‘no disadvantage test’
g. Less bargaining power for unions
h. Removal of unfair dismissal legislation by large firms
ii. Work Practices:

1. Shift towards more decentralised system
2. Stronger focus on individual conditions of companies and enterprises in
negotiation process
3. Encouragement of multi-skilling workers, increasing productivity and
technical efficiency
4. Development of employment career paths with prospects of
professional development and higher wages as incentives
5. Broadening awards to develop a variety of specialist labour skills
6. Development of competencies in job training, allow transfer and apply
skills to variety of occupation
7. Emphasis on training and education, acquisition of formal skills in areas
of specialist labour skills
iii. Dispute Resolution:
1. AIRC historically played an important role in resolving disputes, its role
has diminished since early 90s
2. Two processes:
a. Conciliation: AIRC acts as mediator to try help parties reach a
mutual agreement, outcome not binding
b. Arbitration: Industrial tribunal or court makes a legally binding
ruling
3. Federal Court of Australia also plays a role in dispute resolution
a. AIRC decisions must be registered with Federal Court to enforce
decisions
b. Also Issue injunctions e.g. ordering employees to return to work
iv. Education, Training and Employment Programs:
1. MAATS (Modern Australia Apprenticeship and Traineeship System):
a. Provides apprenticeship and traineeship opportunities
particularly for young people
b. Subsidies for employers to provide training
c. Stronger links between Schools, TAFE colleges and employers
i. Response to low Apprentice and Trainee levels
2. Employment Programs:
a. Work for dole scheme introduced in 1996 now abolished
b. 1998 replaced CES with Job Network
c. Centrelink provides welfare payments and assistance to find
paid work
d. 2005 Budget introduced welfare to work package aiming to
move welfare recipients into workforce
i. New conditions on payments to push people into work.
E.g. Single parents with children 6-15 must work p/t
min. 15hrs as a condition of receiving parenting
payments.

3. Limitations on Policy Implementation:
a. Time Lags:
Policy Implementation Lag Impact Lag
Monetary Short term (Monthly RBA meeting
Medium Term 6-18mths
Fiscal Medium Term (annual budget)
Short Term (Few months)
Microeconomic Reform Long Term (few years) Long Term (Up to 20yrs)
b. Political Constraints:
i. Economic Policy decisions are made in a political context
1. Governments are sensitive to public support for or against, and support
within its own party
ii. Three Year Political Cycle often regarded as a constraint on good policy
1. 1st Year: Implement long term (less popular) policies
2. 2nd Year: Begin preparing for next election
3. Final Year: Generally reluctant to do anything unpopular. Often
implement irresponsible popular policies. E.g. Spending/Tax cuts
iii. Senate: Many reforms can only occur through legislation approved in both
houses of parliament
1. 2004: Coalition gained majority. 1st in 25yrs
iv. Interest groups – Lobbyists and special interest groups can have much publicity
and persuasion
c. Global Factors:
i. Maintain confidence of International investors and global financial markets
1. Tend to support open economies and minimal government involvement
a. E.g. Reduced trade barriers, deregulation
2. Directly influence Monetary Policy
3. Restricts policy option for government (ensure confidence)
ii. International business cycle;
1. Restricts scope of policy e.g. Domestic growth when international in
decline
iii. International Organisations:
1. WTO – trade policies
2. G8: Unofficial coordinator of global macroeconomic policy settings
4. Policy responses and their effects in dealing with the economic issues:
a. Economic Growth:
i. Substantial growth on a 17 year record length
ii. Constraints with structural change and capacity have inhibited expansion
b. Unemployment:
i. Recent years has seen unemployment down to 4.1%
ii. Removal of all cyclical unemployment
iii. Gone below NAIRU estimated 5-6% adding to inflation pressures and wages
growth
iv. High level of underemployment
c. Inflation:
i. Worked well since early 90s with target inflation being achieved comfortably
(MP)
ii. In recent years external factors including the resource boom from China and
India has heavily impacted on inflation
iii. Currently at 4.2% for the year
iv. Possible wages growth and supply constraints to create further impact
d. External Stability:
i. Increase in CAD since march 2008
ii. Exchange rate stable, possibility of becoming parity with US by end of year
e. Distribution of Income & Wealth:
i. Distribution more unequal from economic growth
ii. Rich have profited while poorer have suffered from job losses in structurally
adjusted industries
f. Management of Environment:
i. Signing of Kyoto protocol in December 2007 by Kevin Rudd
ii. Possible Carbon Trading Scheme
iii. Subsidy to Toyota for Hybrid Camry in Australia ($35 billion)