Embed Size (px)
Citation preview
Vietnam Economic Outlook 2012 - 2013October 2012
Lam Phi Yen
Head of Corporate Sales HCM – Global Markets, Vietnam
+84-8-3520 4113
Agenda
• Vietnam Economic Update
• Reform
• Doing business in Vietnam
• Q & A
Vietnam Economic Update
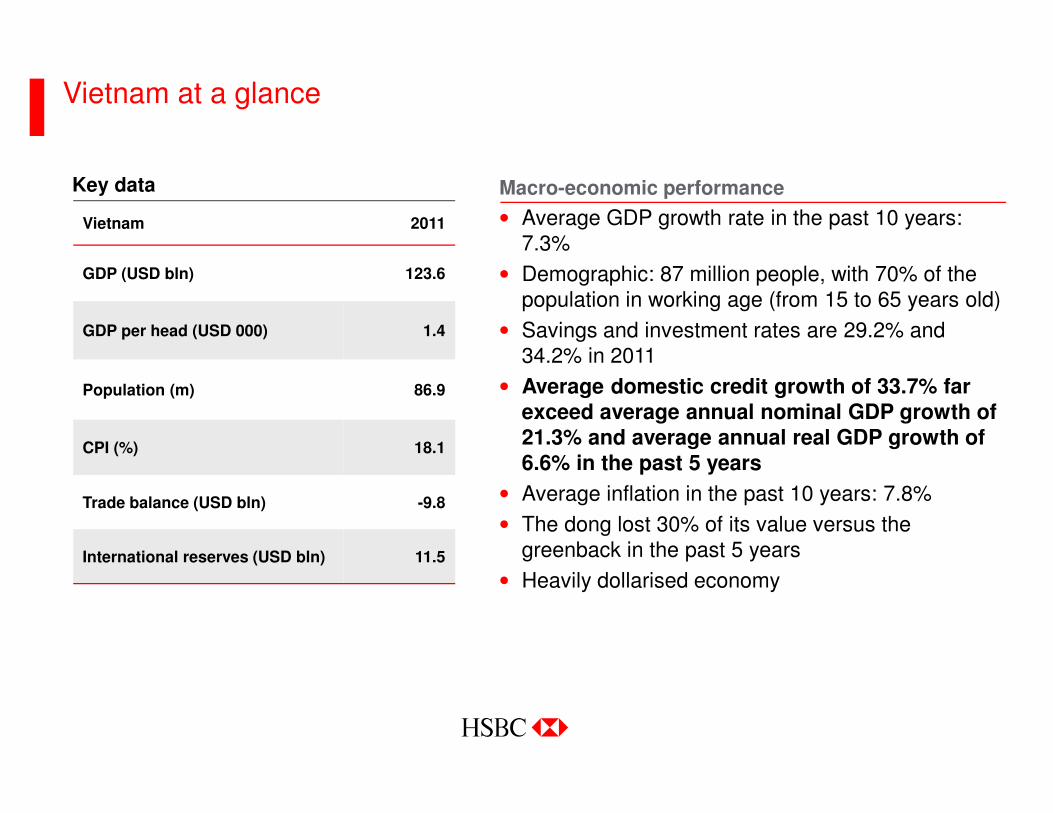
Macro-economic performance
• Average GDP growth rate in the past 10 years: 7.3%
• Demographic: 87 million people, with 70% of the population in working age (from 15 to 65 years old)
• Savings and investment rates are 29.2% and 34.2% in 2011
• Average domestic credit growth of 33.7% far exceed average annual nominal GDP growth of 21.3% and average annual real GDP growth of 6.6% in the past 5 years
• Average inflation in the past 10 years: 7.8%
• The dong lost 30% of its value versus the greenback in the past 5 years
• Heavily dollarised economy
Vietnam 2011
GDP (USD bln) 123.6
GDP per head (USD 000) 1.4
Population (m) 86.9
CPI (%) 18.1
Trade balance (USD bln) -9.8
International reserves (USD bln) 11.5
Key data
Vietnam at a glance
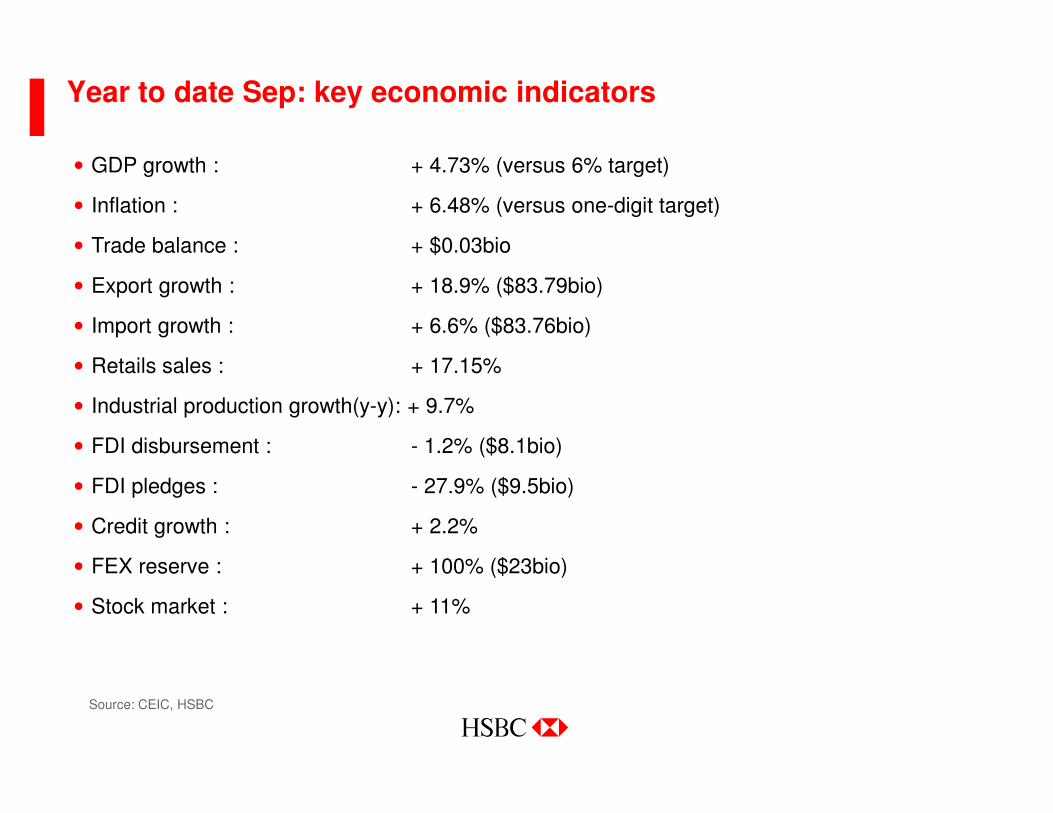
Year to date Sep: key economic indicators
• GDP growth : + 4.73% (versus 6% target)
• Inflation : + 6.48% (versus one-digit target)
• Trade balance : + $0.03bio
• Export growth : + 18.9% ($83.79bio)
• Import growth : + 6.6% ($83.76bio)
• Retails sales : + 17.15%
• Industrial production growth(y-y): + 9.7%
• FDI disbursement : - 1.2% ($8.1bio)
• FDI pledges : - 27.9% ($9.5bio)
• Credit growth : + 2.2%
• FEX reserve : + 100% ($23bio)
• Stock market : + 11%
Source: CEIC, HSBC

What’s Behind Vietnam’s Growth?
• Private consumption makes up about 68% of GDP in Vietnam
• Government consumption usually constitutes around 7% of GDP
• Investment represents about 39% of GDP
• Exports make up around 70% of GDP (in 2010 it was 77.5% of GDP)
• Credit expansion
• Labor force
Source: CEIC, HSBC
Contribution to GDP has changed
15.00
20.00
25.00
30.00
35.00
40.00
45.00
1985 1990 1995 2000 2005 2010 Year
%
Agriculture Industry Service
Industry, 42%
Service, 42%
Agriculture,
16%

7
Average growth rate in working age population (% y-o-y)
-1.00
-0.50
0.00
0.50
1.00
1.50
2.00
2.50
3.00
3.50
AU CH HK IN ID JP SK MY NZ PH SG SL TW TH VN
1990s 2000s 2010s 2020s
Source: UNPD, HSBC

8
The economy is reliant on credit growth
10
15
20
25
30
35
40
45
50
2003 2004 2005 2006 2007 2008 2009 2010 2011 2012f 2013f
5
5.5
6
6.5
7
7.5
8
8.5
9
Credit grow th GDP grow th
Source: CEIC, HSBC

9
Growth is affected by low demand, both internal and external
• Though contracted, the pace of contraction of both new orders and new export orders has been much slower than previous month
• Externally, growth is affected by
Euro zone crisis, sluggish US
recovery process and slowing
China growth. The prospect for
exports in coming months is not
really positive
40
45
50
55
60
Mar-11 Jun-11 Sep-11 Dec-11 Mar-12 Jun-12 Sep-12
New Orders New Ex port Orders
HSBC PMI
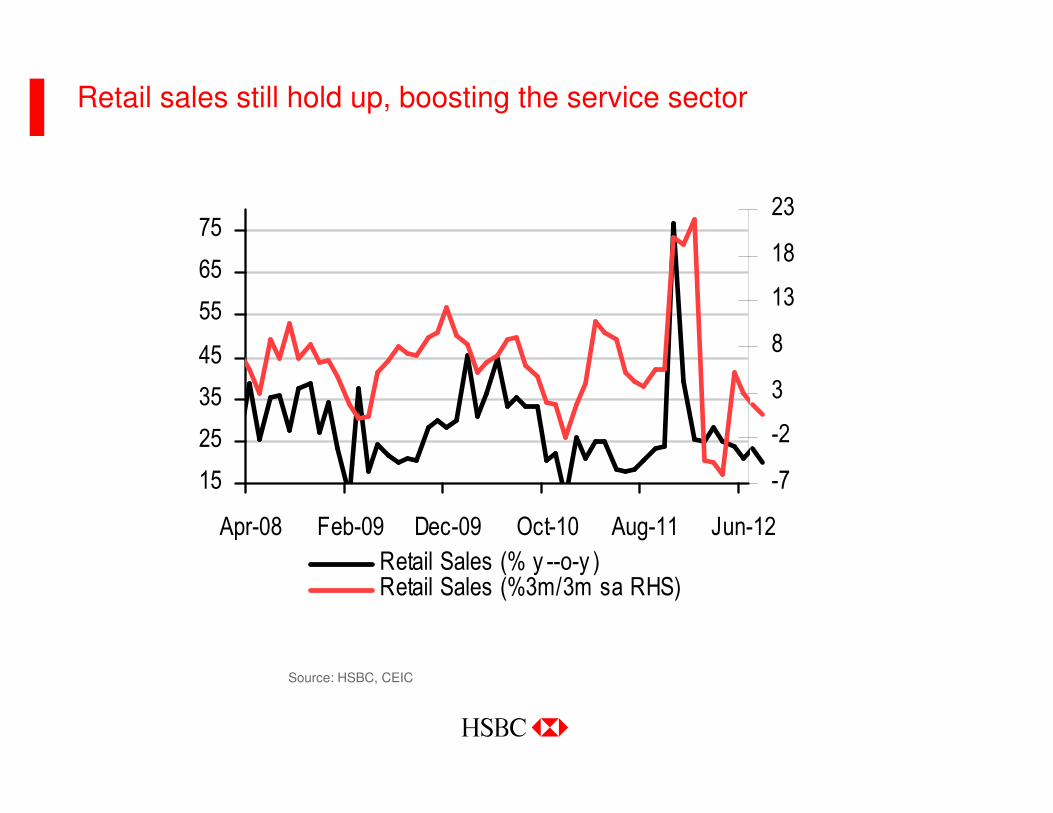
Retail sales still hold up, boosting the service sector
15
25
35
45
55
65
75
Apr-08 Feb-09 Dec-09 Oct-10 Aug-11 Jun-12
-7
-2
3
8
13
18
23
Retail Sales (% y --o-y )Retail Sales (%3m/3m sa RHS)
Source: HSBC, CEIC

Investment by sector
15
25
35
45
55
1995 1997 1999 2001 2003 2005 2007 2009 2011
State Non State Foreign Inv ested Sector
• State makes up 51% of total
investment (average figure of
the last 10 years)
• Contributes about 40% GDP
• Inefficient but requires
continued support to exist
Investment by value

12
Service sector recovers and leads the growth, followed by the industry
13
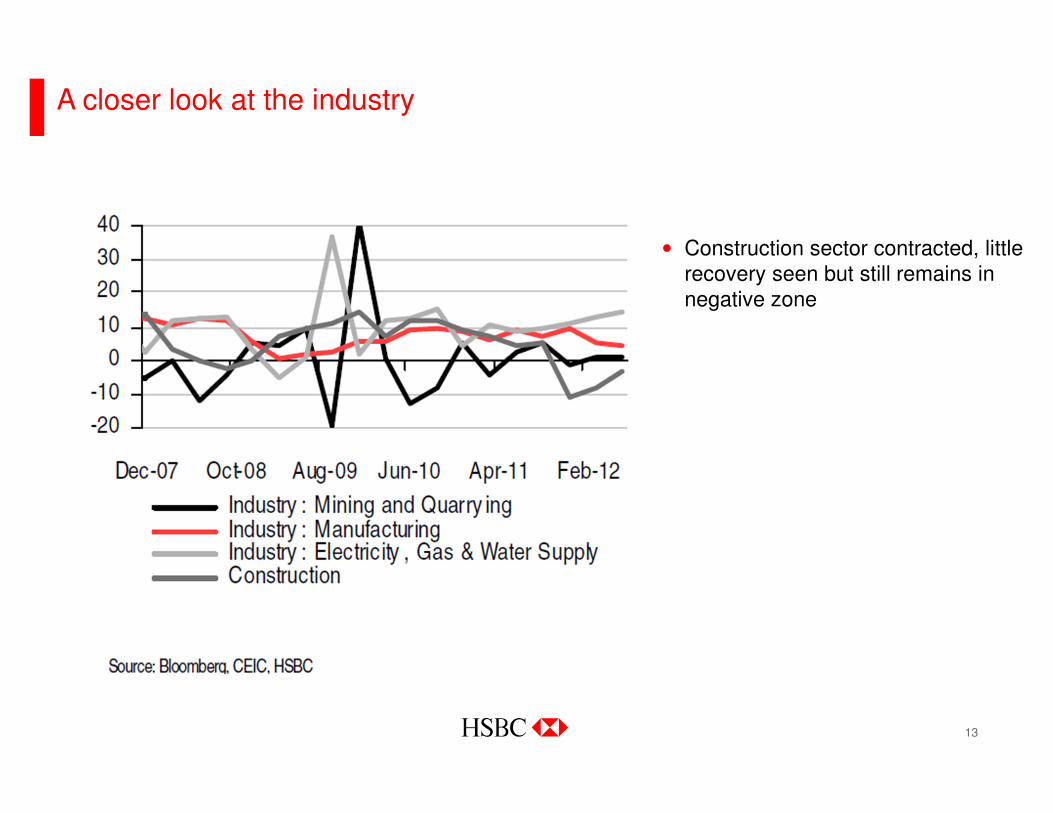
A closer look at the industry
• Construction sector contracted, little recovery seen but still remains in negative zone
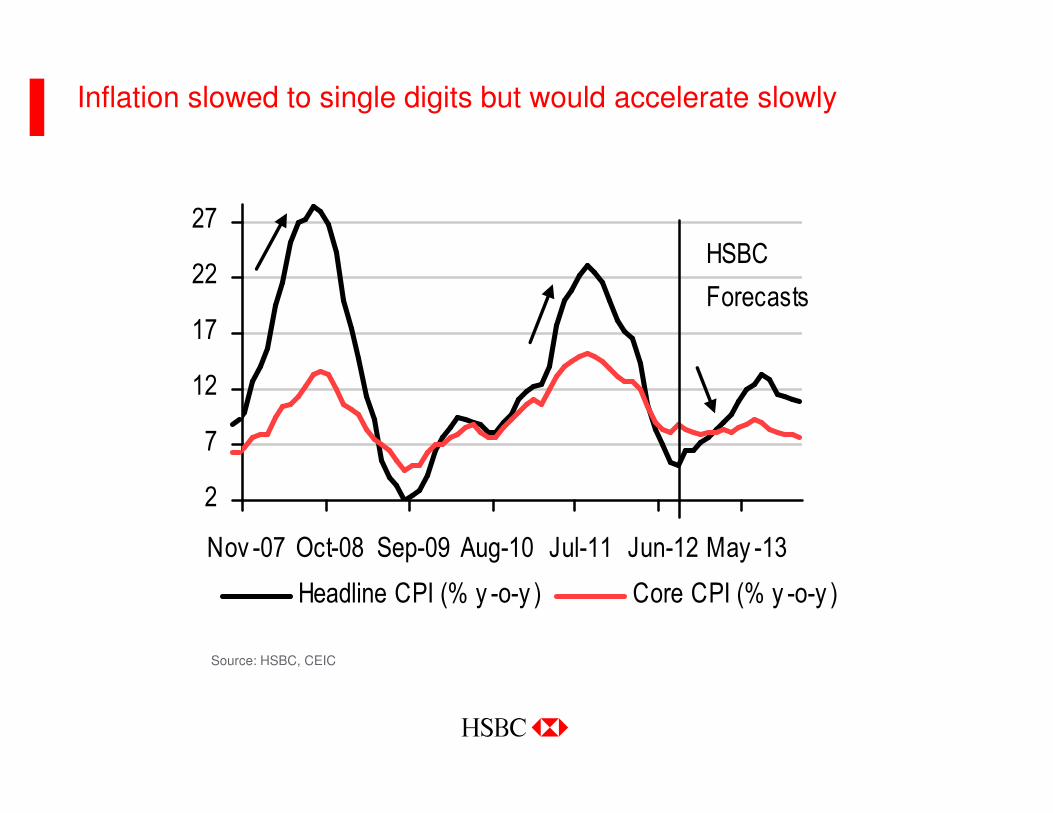
Inflation slowed to single digits but would accelerate slowly
Source: HSBC, CEIC
2
7
12
17
22
27
Nov -07 Oct-08 Sep-09 Aug-10 Jul-11 Jun-12 May -13
Headline CPI (% y -o-y ) Core CPI (% y -o-y )
HSBC
Forecasts

15
But the outlook may be less optimistic
Source: CEIC, HSBC
Input price is rising The trend is turning on inflation
Source: CEIC, HSBC, GSO
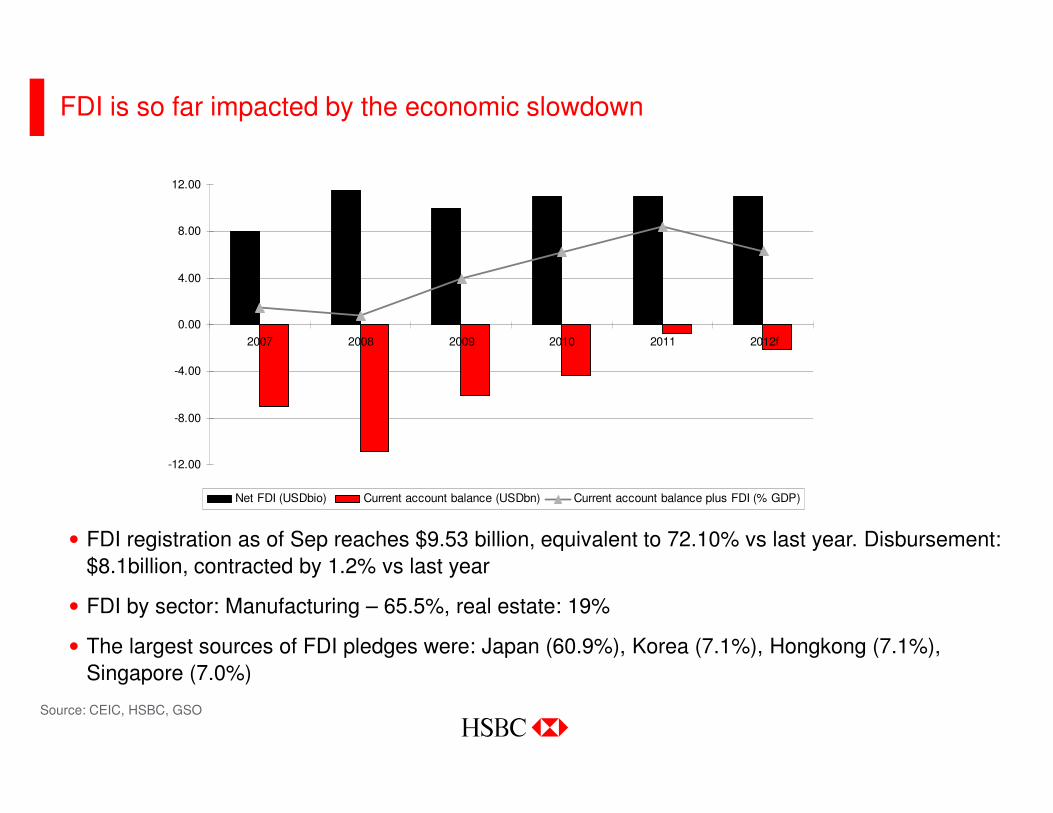
FDI is so far impacted by the economic slowdown
• FDI registration as of Sep reaches $9.53 billion, equivalent to 72.10% vs last year. Disbursement:
$8.1billion, contracted by 1.2% vs last year
• FDI by sector: Manufacturing – 65.5%, real estate: 19%
• The largest sources of FDI pledges were: Japan (60.9%), Korea (7.1%), Hongkong (7.1%),
Singapore (7.0%)
-12.00
-8.00
-4.00
0.00
4.00
8.00
12.00
2007 2008 2009 2010 2011 2012f
Net FDI (USDbio) Current account balance (USDbn) Current account balance plus FDI (% GDP)
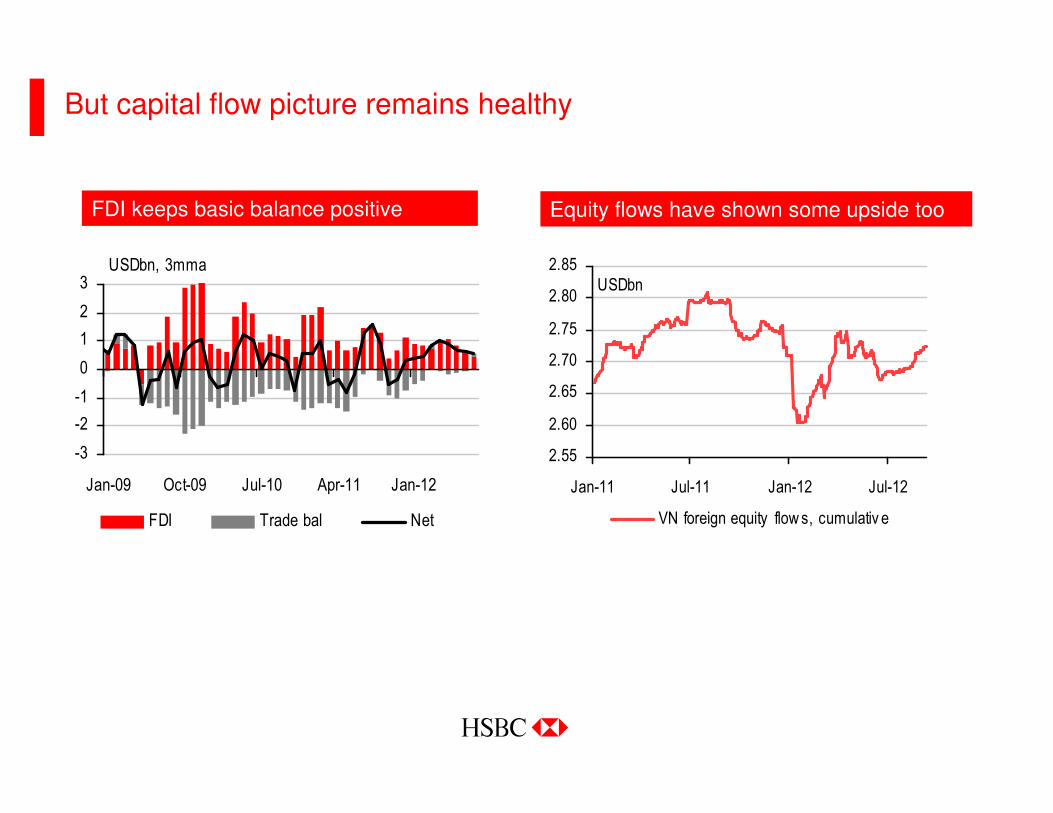
But capital flow picture remains healthy
-3
-2
-1
0
1
2
3
Jan-09 Oct-09 Jul-10 Apr-11 Jan-12
FDI Trade bal Net
USDbn, 3mma
2.55
2.60
2.65
2.70
2.75
2.80
2.85
Jan-11 Jul-11 Jan-12 Jul-12
VN foreign equity flows, cumulativ e
USDbn
FDI keeps basic balance positive Equity flows have shown some upside too

18
Trade deficit turns surplus
Source: CEIC, HSBC
• YTD Sep trade balance is USD 30m
surplus
• Robust export performance
• Import number is steady
Trade deficit
0
2
4
6
8
10
12
14
16
18
20
2003 2004 2005 2006 2007 2008 2009 2010 2011 2012
(e)
Year
bio
US
D
Trade deficit (bio USD)
19
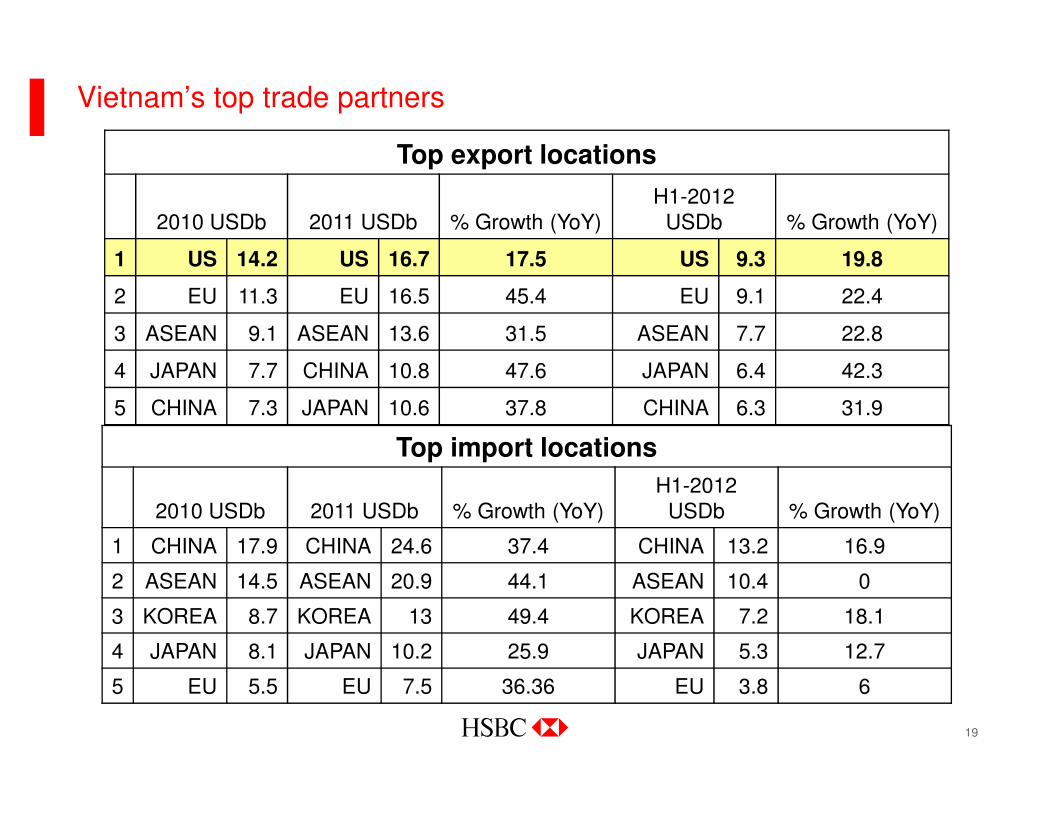
Vietnam’s top trade partners
Top export locations
2010 USDb 2011 USDb % Growth (YoY)H1-2012
USDb % Growth (YoY)
1 US 14.2 US 16.7 17.5 US 9.3 19.8
2 EU 11.3 EU 16.5 45.4 EU 9.1 22.4
3 ASEAN 9.1 ASEAN 13.6 31.5 ASEAN 7.7 22.8
4 JAPAN 7.7 CHINA 10.8 47.6 JAPAN 6.4 42.3
5 CHINA 7.3 JAPAN 10.6 37.8 CHINA 6.3 31.9
Top import locations
2010 USDb 2011 USDb % Growth (YoY)H1-2012
USDb % Growth (YoY)
1 CHINA 17.9 CHINA 24.6 37.4 CHINA 13.2 16.9
2 ASEAN 14.5 ASEAN 20.9 44.1 ASEAN 10.4 0
3 KOREA 8.7 KOREA 13 49.4 KOREA 7.2 18.1
4 JAPAN 8.1 JAPAN 10.2 25.9 JAPAN 5.3 12.7
5 EU 5.5 EU 7.5 36.36 EU 3.8 6
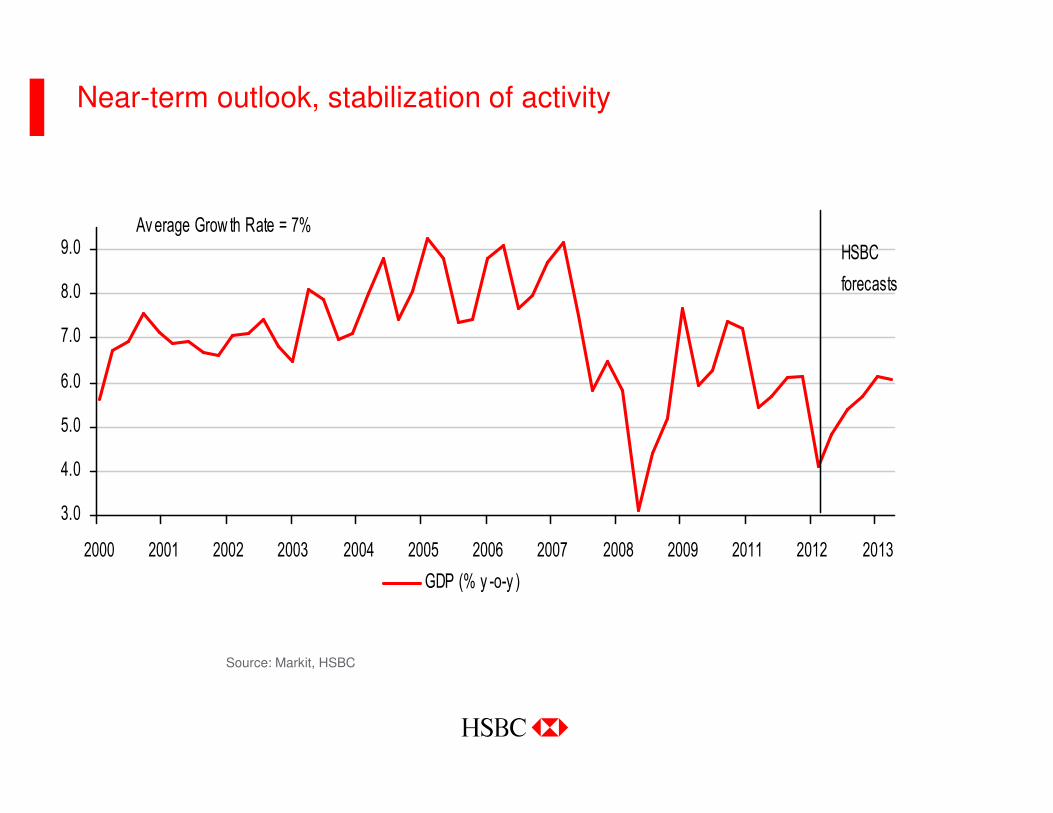
Near-term outlook, stabilization of activity
Source: Markit, HSBC
3.0
4.0
5.0
6.0
7.0
8.0
9.0
2000 2001 2002 2003 2004 2005 2006 2007 2008 2009 2011 2012 2013
GDP (% y -o-y )
HSBC
forecasts
Average Grow th Rate = 7%
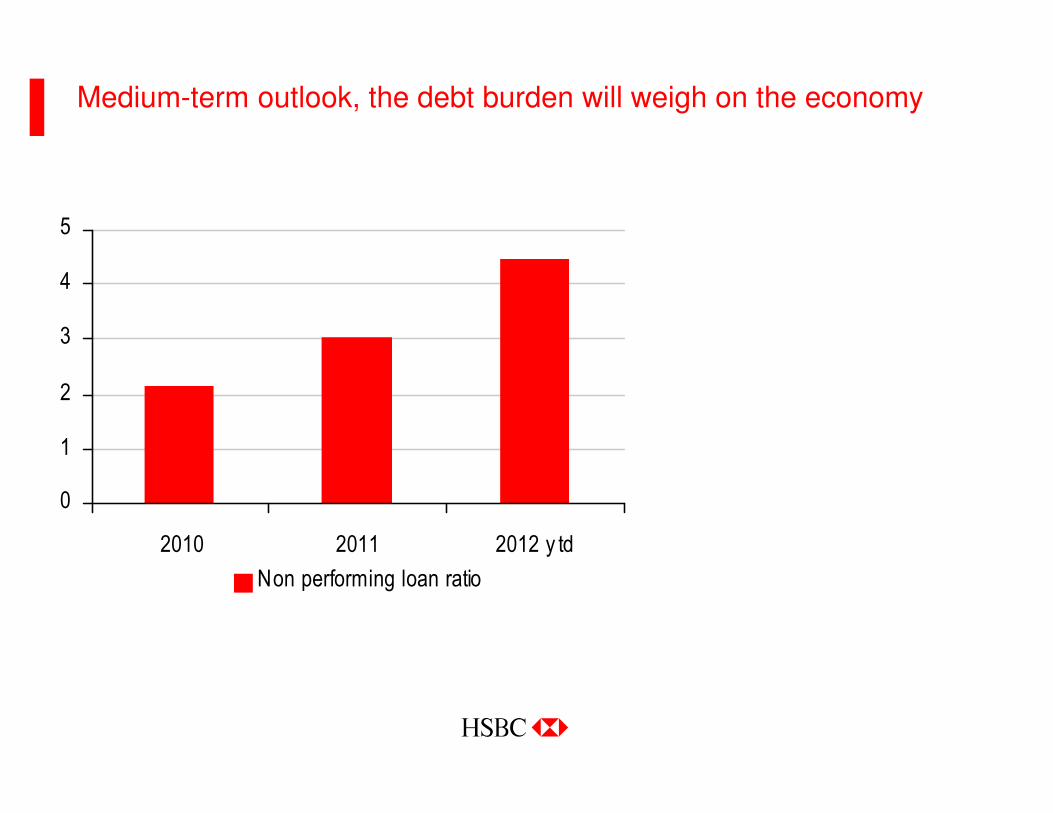
Medium-term outlook, the debt burden will weigh on the economy
0
1
2
3
4
5
2010 2011 2012 y td
Non performing loan ratio
Reform?
• Vietnam has broken the booming period
• Heavily-debted SOEs
• Banking system weakness
• Real estate market is frozen
• Slowing GDP growth with higher inflation has been hurting our workers and farmers
• Last but not least, the whole market is lack of “TRUST”
Hmmmm!!!
Stress…
23
• Banking system and SOE reforms
• “Growth with stability”
• Inflation has been whipped, markets are stable and the currency restores
• Some local banks have been forced to merge; and more to come…
• SOEs are requested to restructure their businesses
• TRUST is being building up slowly; yet a lot of things MUST be done more…
• People are still reluctant to spend
• Companies are still waiting for a clearer picture to expand their business
• Sharply wider budget deficit in the first nine months
What has been going on here…?
24
• Policy discipline is required, and this is a challenge because reform likely needs two phases
• Phase 1: sorting out macro problems…may be the easier part
• Phase 2: solving these problems, especially in banking system and SOEs regime…may be much more difficult
Step by step starting with Phase 1
25
Phase 2
• The Government has made significant progress in consolidating banks and SOEs, but that is not enough
• Real number on NPLs: ?% on $135bn of outstanding loans
• The SBV has a reasonable work-out program involving bank consolidations, bad debts reduction
• The shortfall of recoverable collateral against loans is estimated at $5bio
• How to resolve?
26
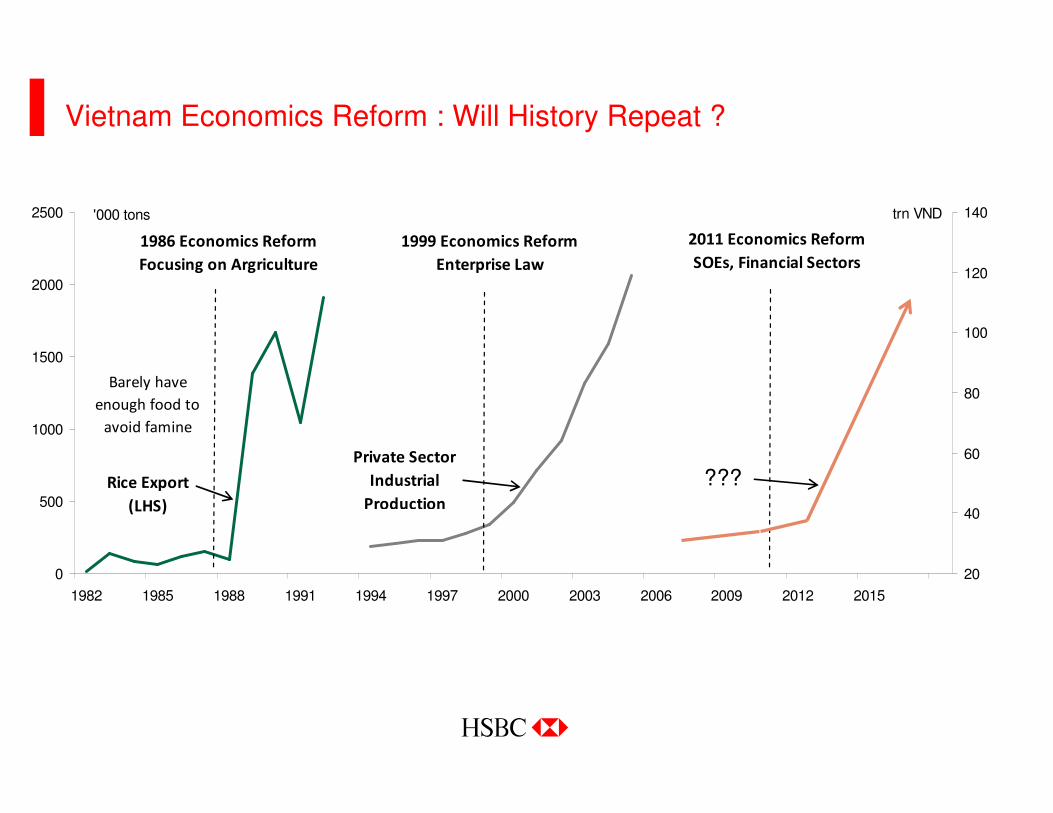
Vietnam Economics Reform : Will History Repeat ?
0
500
1000
1500
2000
2500
1982 1985 1988 1991 1994 1997 2000 2003 2006 2009 2012 2015
'000 tons
20
40
60
80
100
120
140trn VND
1986 Economics Reform
Focusing on Argriculture
1999 Economics Reform
Enterprise Law
2011 Economics Reform
SOEs, Financial Sectors
Barely have
enough food to
avoid famine
Rice Export
(LHS)
Private Sector
Industrial
Production
???

Doing business in Vietnam
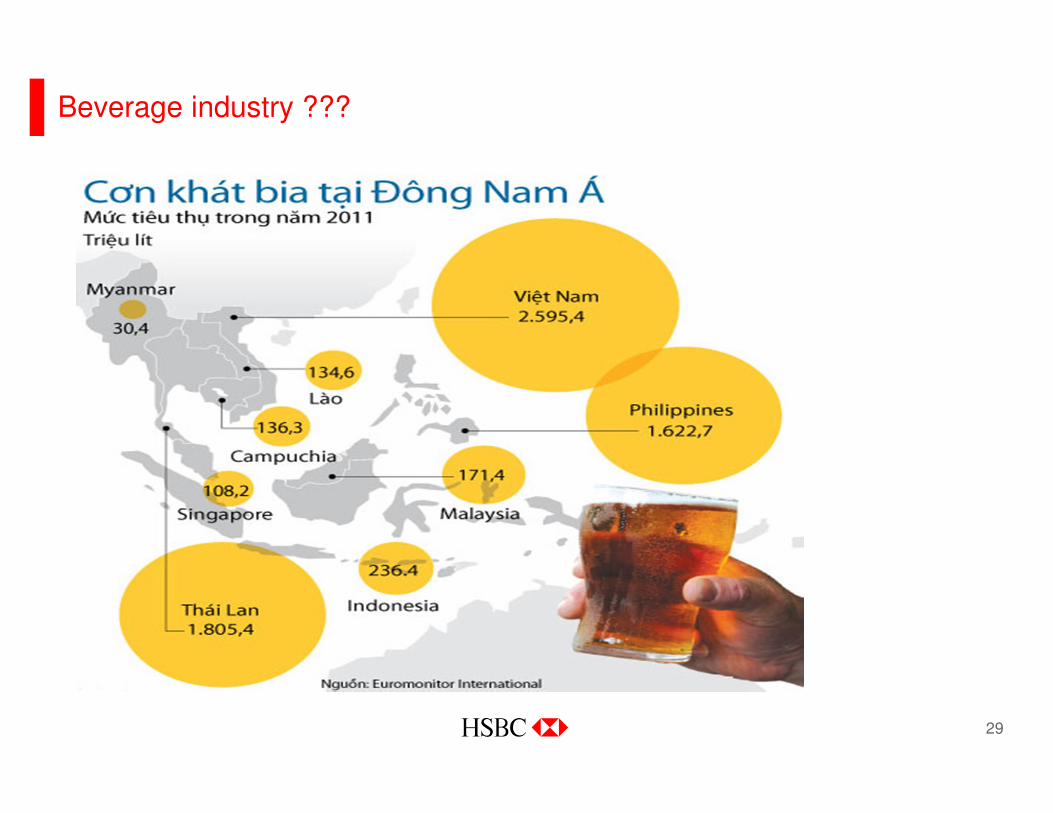
Beverage industry ???
29
• Vietnam ranks the first in consuming beer in ASEAN and the fourth globally
• Vietnam is among top 10 cigarette consumption; around 80 bio cigarettes per annum
• Vietnam ranks No.4 in consuming instant noodle
• Vietnam ranks No.4 in consuming motor bikes in the world
• Vietnamese always love physical GOLD…stay at position No.8 globally
• Vietnamese young generation adore high-tech products
And what will follow these appetites and habits ???
• Retails sales industry
• Healthcare service
• …
Other good businesses…
30
31
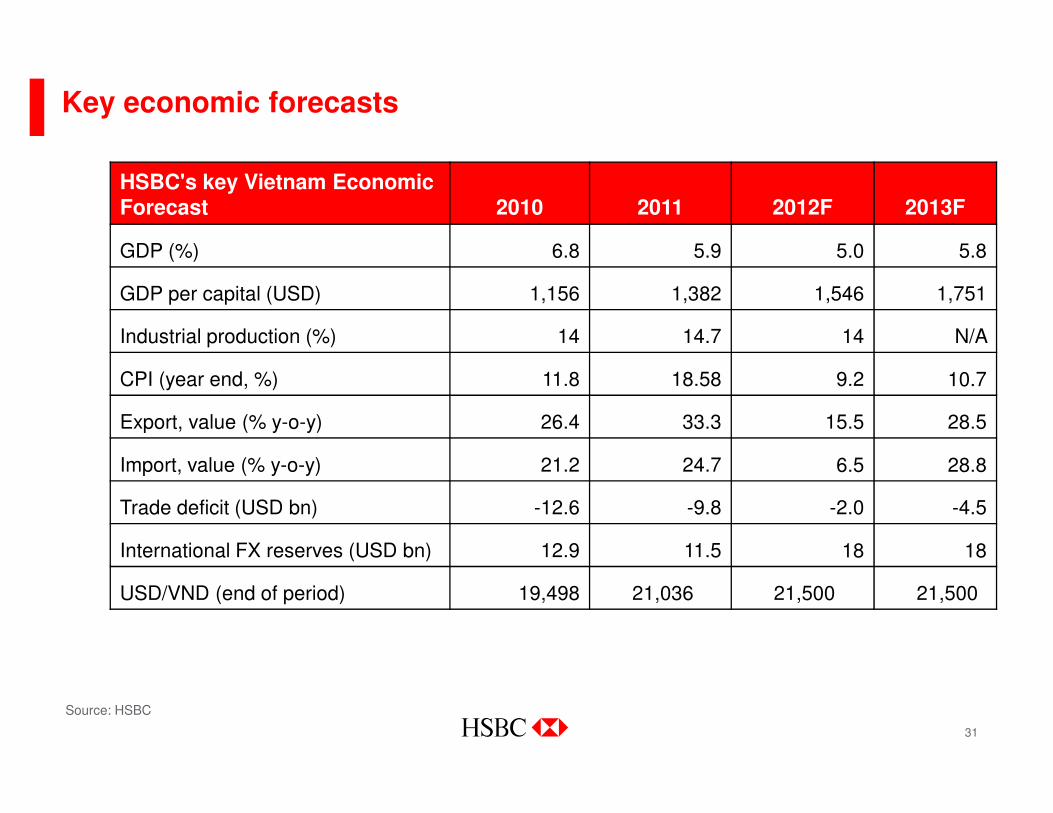
Source: HSBC
HSBC's key Vietnam Economic Forecast 2010 2011 2012F 2013F
GDP (%) 6.8 5.9 5.0 5.8
GDP per capital (USD) 1,156 1,382 1,546 1,751
Industrial production (%) 14 14.7 14 N/A
CPI (year end, %) 11.8 18.58 9.2 10.7
Export, value (% y-o-y) 26.4 33.3 15.5 28.5
Import, value (% y-o-y) 21.2 24.7 6.5 28.8
Trade deficit (USD bn) -12.6 -9.8 -2.0 -4.5
International FX reserves (USD bn) 12.9 11.5 18 18
USD/VND (end of period) 19,498 21,036 21,500 21,500
Key economic forecasts
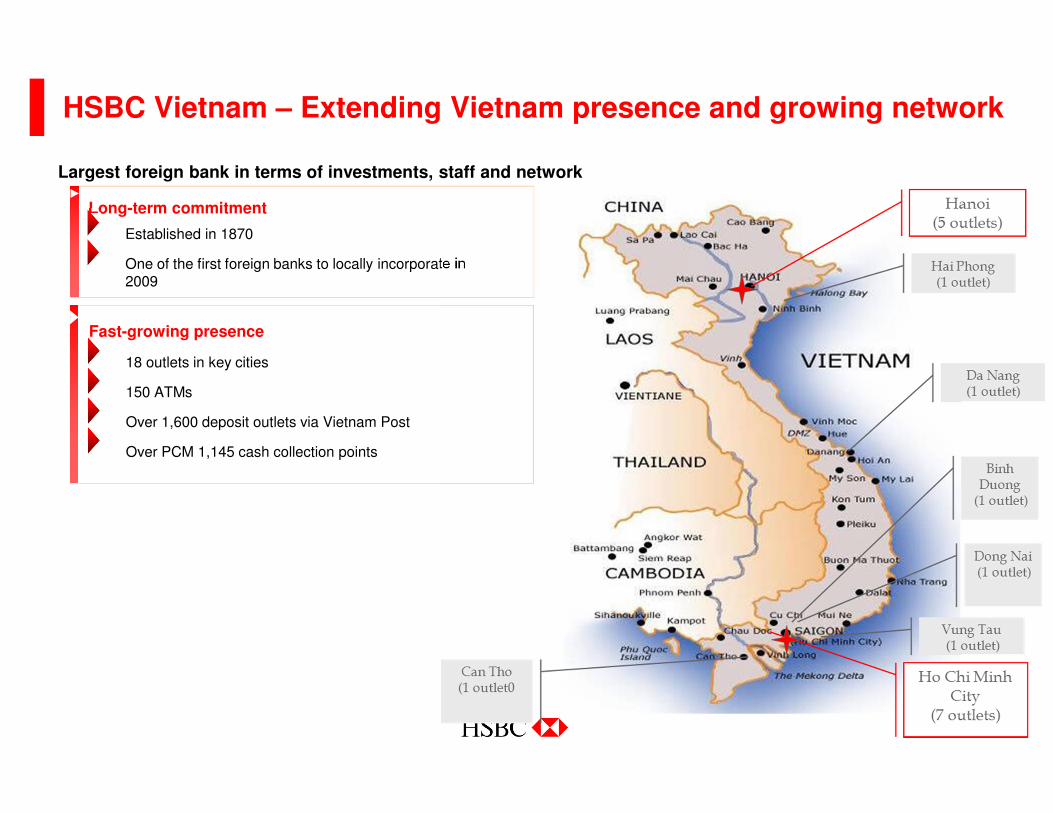
HSBC Vietnam – Extending Vietnam presence and growing network
Fast-growing presence
18 outlets in key cities
150 ATMs
Over 1,600 deposit outlets via Vietnam Post
Over PCM 1,145 cash collection points
Long-term commitment
Established in 1870
One of the first foreign banks to locally incorporate in 2009
Largest foreign bank in terms of investments, staff and network