Embed Size (px)
Citation preview

– 1 –
Hong Kong Exchanges and Clearing Limited and The Stock Exchange of Hong Kong Limited take no responsibility for the contents of this document, make no representation as to its accuracy or completeness and expressly disclaim any liability whatsoever for any loss howsoever arising from or in reliance upon the whole or any part of the contents of this document. HSBC Holdings plc Incorporated in England with limited liability. Registered in England: number 617987. Registered Office and Group Management Office: 8 Canada Square, London E14 5HQ, United Kingdom. Web: www.hsbc.com Hong Kong Stock code: 5 3 August 2009
HSBC HOLDINGS PLC
2009 INTERIM RESULTS - HIGHLIGHTS Consistently delivering results in challenging times • Pre-tax profit was US$7.5 billion, broadly in line with the first half of 2008, on an underlying
basis and excluding movements in fair value on our own debt related to credit spreads. • On a reported basis, pre-tax profit was US$5 billion, down 51 per cent on the first half of 2008
but significantly better than the second half of 2008. • Diversified business model delivered strong revenues 10 per cent higher than in the first half of
2008, on an underlying basis and excluding movements in fair value on our own debt related to credit spreads. On a reported basis, revenues were down 12 per cent.
• On a reported basis, earnings per share down 63 per cent to US$0.21 (first half 2008: US$0.57, after adjusting for the rights issue).
• Total dividends in respect of the first half of 2009 are US$0.16 per ordinary share, with a value of US$2.8 billion.
Generating capital and further enhancing liquidity • Tier 1 ratio further improved to 10.1 per cent. At 31 December 2008, the tier 1 ratio was 8.3 per
cent, or 9.8 per cent on a pro forma basis (including the proceeds of the rights issue). • Strengthened liquidity position. Ratio of customer advances-to-deposits was 79.5 per cent at
30 June 2009. • Conservatively positioned balance sheet. Risk-weighted assets in line with end of 2008. Managing the business through the downturn and positioning for the upturn • Achieved record profits in Global Banking and Markets. • Delivered solid profitability in Commercial Banking. • Maintained profitable Personal Financial Services business, outside North America. • Improved our position as leading international bank in mainland China. Value of three largest
strategic investments grew by US$8.2 billion, and on track to have 100 outlets by year-end. • Strengthened our position in other faster-growing markets. For example, doubled presence in
Indonesia, and first foreign bank to incorporate locally in Vietnam. • Made progress in US run-off portfolio. • Cut costs by 3 per cent on an underlying basis and excluding the goodwill impairment incurred
in 2008. On a reported basis our cost efficiency ratio improved by 3.1 percentage points to 47.9 per cent.
• Further enhanced our brand. HSBC was ranked the world’s no.1 banking brand, and named Euromoney’s Global Bank of the Year.
• HSBC strongly positioned for the upturn, but economic outlook remains uncertain.

HSBC Holdings plc
________________________________________________________________________________ HSBC HOLDINGS REPORTS PRE-TAX PROFIT OF US$5,019 MILLION HSBC made a profit before tax of US$5,019 million, a decrease of US$5,228 million, or 51 per cent, compared with the first half of 2008. Net interest income of US$20,538 million was US$640 million, or 3 per cent, lower than the first half of 2008. Net operating income before loan impairment charges and other credit risk provisions of US$34,741 million was US$4,734 million, or 12 per cent, lower than the first half of 2008. Total operating expenses of US$16,658 million decreased by US$3,482 million, or 17 per cent, compared with the first half of 2008. On an underlying basis, and expressed in terms of constant currency, operating expenses decreased by 6 per cent. HSBC’s cost efficiency ratio was 47.9 per cent compared with 51.0 per cent in the first half of 2008. Loan impairment charges and other credit risk provisions were US$13,931 million in the first half of 2009, US$3,873 million higher than the first half of 2008. The tier 1 and total capital ratios for the Group remained strong at 10.1 per cent and 13.4 per cent, respectively, at 30 June 2009. The Group’s total assets at 30 June 2009 were US$2,422 billion, a decrease of US$105 billion, or 4 per cent, since 31 December 2008.
– 2 –
HSBC Holdings plc
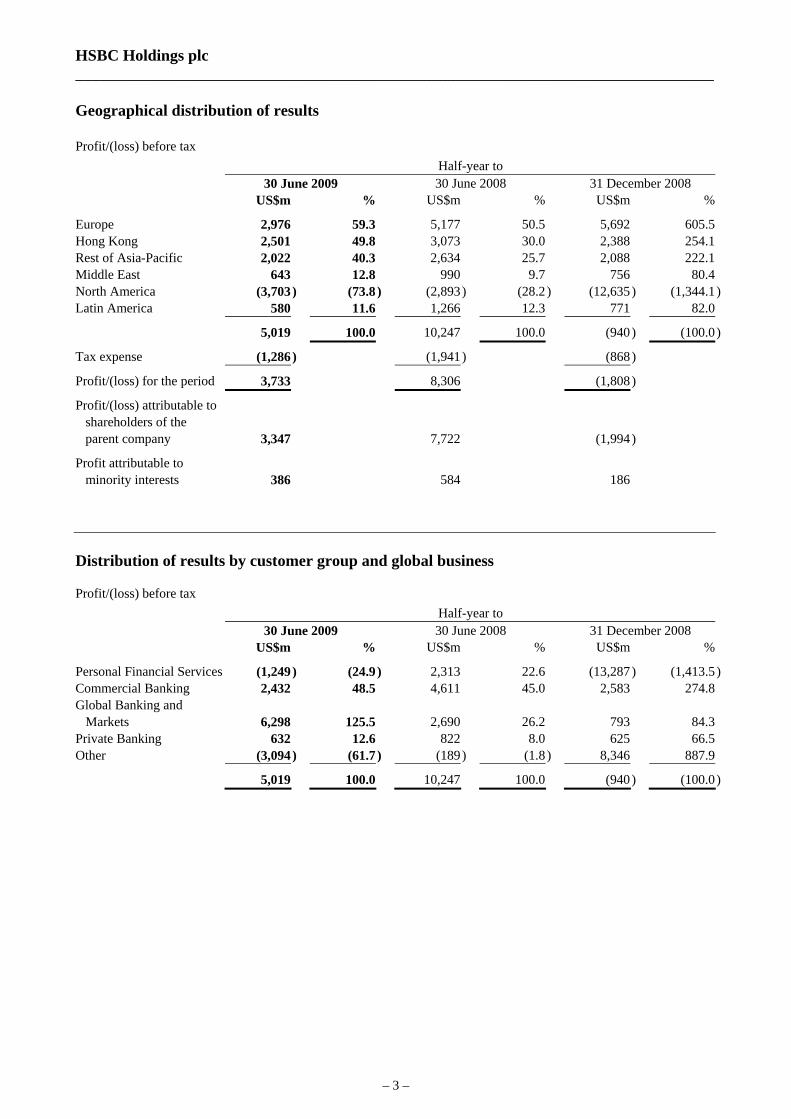
________________________________________________________________________________ Geographical distribution of results Profit/(loss) before tax Half-year to 30 June 2009 30 June 2008 31 December 2008 US$m % US$m % US$m %
Europe 2,976 59.3 5,177 50.5 5,692 605.5 Hong Kong 2,501 49.8 3,073 30.0 2,388 254.1 Rest of Asia-Pacific 2,022 40.3 2,634 25.7 2,088 222.1 Middle East 643 12.8 990 9.7 756 80.4 North America (3,703 ) (73.8 ) (2,893) (28.2 ) (12,635 ) (1,344.1) Latin America 580 11.6 1,266 12.3 771 82.0
5,019 100.0 10,247 100.0 (940 ) (100.0)
Tax expense (1,286 ) (1,941) (868 )
Profit/(loss) for the period 3,733 8,306 (1,808 )
Profit/(loss) attributable to shareholders of the parent company 3,347 7,722 (1,994 )
Profit attributable to minority interests 386 584 186
Distribution of results by customer group and global business Profit/(loss) before tax Half-year to 30 June 2009 30 June 2008 31 December 2008 US$m % US$m % US$m %
Personal Financial Services (1,249 ) (24.9 ) 2,313 22.6 (13,287 ) (1,413.5) Commercial Banking 2,432 48.5 4,611 45.0 2,583 274.8 Global Banking and Markets 6,298 125.5 2,690 26.2 793 84.3 Private Banking 632 12.6 822 8.0 625 66.5 Other (3,094 ) (61.7 ) (189) (1.8 ) 8,346 887.9
5,019 100.0 10,247 100.0 (940 ) (100.0)
– 3 –

HSBC Holdings plc ________________________________________________________________________________ Statement by Stephen Green, Group Chairman Consistently delivering in an uncertain world In the first half of 2009, we have delivered what we set out to achieve. In this unprecedented economic environment, every financial institution has had to consider carefully what level of risk is appropriate for its business model in light of mixed economic and financial market indicators. We have continued to position HSBC’s balance sheet conservatively, while focusing on enhancing the capabilities which will enable us to deliver sustainable long-term growth once the current global downturn has ended. Michael Geoghegan highlights these actions in his statement. Our performance proves our ability to deliver profit, generate capital and make distributions to our shareholders throughout the business cycle – even in challenging market conditions. We are pleased with our results and profitability overall is ahead of the expectations we had at the outset of this year. In large part this reflects an excellent performance in our Global Banking and Markets business. It also reflects progress made in the US, where we announced our decision to run off a major part of our consumer finance business in March. Following the very difficult conditions experienced in the latter part of last year, provisioning in 2009 has been lower at this stage than might have been expected given the rise in unemployment. On a reported basis, pre-tax profit was US$5 billion, US$6 billion higher than the second half of 2008, but down 51 per cent on the first half. On an underlying basis and excluding movements in fair value on our own debt credit spreads, our pre-tax profit was US$7.5 billion, broadly in line with the first half of 2008. HSBC fundamentally remains a deposit-led banking group, with a business model committed to long-term customer relationships and an emphasis on the world’s faster-growing markets. This gives us revenue streams diversified by both customer group and geography, providing resilience for the Group in these difficult economic conditions. Building capital strength HSBC is both strongly capitalised and highly liquid. The completion of our rights issue in April boosted our financial position, raising US$17.8 billion of shareholders’ equity. In an environment where many institutions are reliant on government help, the 97 per cent support for our rights issue, given its scale and the environment in which it was launched, was a powerful vote of confidence in our future by you, our shareholders, and we are truly grateful for your support. Notwithstanding that the rewards from attracting deposits from both personal and corporate customers are currently lower than normal, these remain at the heart of our banking philosophy, and the ratio of published customer advances-to-deposits remained conservative at 79.5 per cent. The tier 1 ratio further improved to 10.1 per cent. At 31 December 2008, the tier 1 ratio was 8.3 per cent or 9.8 per cent on a pro-forma basis including the proceeds of the rights issue. The core equity tier 1 ratio was 8.8 per cent at 30 June 2008.
– 4 –

HSBC Holdings plc ________________________________________________________________________________ As projected at the time of the rights issue, we paid a first interim dividend of 8 cents per ordinary share on 8 July, and the Directors have approved a second interim dividend of 8 cents per ordinary share, payable on 7 October with a scrip alternative. Pursuing a clear strategy HSBC’s strategy remains unchanged. This is to combine our emerging markets leadership with a global network that offers the advantage of international connectivity and scale, making HSBC the leading international bank. If anything, the recent financial and economic turmoil has only reinforced our conviction that this strategy is the right one. By retaining this focus, we remain confident in our ability to deliver sustainable growth and believe that a return on total shareholders’ equity within our target range of 15 to 19 per cent remains achievable over the full business cycle. The proceeds from the rights issue have reinforced our capital strength, allowing us to navigate the economic and regulatory environment, take long-term decisions in support of our brand and customer relationships and look confidently at expansion opportunities consistent with our strategy. Growth in emerging markets At a time when some organisations may be finding it difficult to look beyond the near-term, our appetite for developing business in emerging markets remains undiminished. Many banks have disposed of their stakes in strategic investments to generate capital. HSBC has not done so, and we have continued to bring a long-term strategic approach to these relationships. The market value of our three largest strategic investments in mainland China has grown significantly since we acquired them, and increased by US$8.2 billion during the first half of 2009. In this period of uncertainty, we are very disciplined in reviewing the new opportunities which emerge, but we continue to expand organically in line with our strategy and where there is customer appetite. In mainland China, where HSBC has the largest investment and largest branch network of any international bank, we became the first to settle cross-border trade in renminbi in July and we launched the first floating rate renminbi bond in Hong Kong in June. In Vietnam, HSBC became the first foreign bank to incorporate locally. We have increased the number of HSBC Premier customers to 2.9 million, of whom over half are based in emerging markets. During the first half of 2009 we completed our previously announced acquisition in Indonesia and fully integrated our acquired business in India. We also received regulatory approval for a new jointly held insurance entity in mainland China. Changing industry and regulatory trends Consensus has rightly emerged that regulation must change, and that the quality and quantity of bank capital and liquidity must be improved. The debate is now underway about how this regulatory change should be applied to individual institutions in a way that is proportionate to the risks they assume, and in a way that enhances systemic stability without choking the supply of credit or increasing its cost unnecessarily. As a restructuring of the financial landscape takes place, there is clearly an important role for diversified and integrated banks which can provide services to customers requiring a wide range of financial products and operating across borders.
– 5 –

HSBC Holdings plc ________________________________________________________________________________ We are therefore pleased that there has been a rejection of calls for a return to ‘narrow banking’ and the separation of wholesale banking from retail and commercial banking that this would involve. It is unrealistic to believe that this approach would deliver greater financial stability; no banking model has emerged from the crisis unscathed and some of the greatest casualties of the crisis so far have been smaller and narrowly-focused institutions. It would be dangerous to pursue any approach that acts as a further brake on global growth and constrains responsible financial innovation and credit formation. Finally, it is unreasonable to compel customers to use different types of institutions for different financial services in an age of global markets. Of course, regulation cannot be a panacea for the failings that have been exposed in the financial system and the process of renewal must include instilling the right values across our industry. At HSBC we have been carefully developing and nurturing our culture and values for over 140 years. As Group Chairman I know that there can be no more important topic on the Board agenda and it is one of my responsibilities to make sure that we remain true to our standards and focused on the fundamentals of banking. Economic outlook remains highly uncertain Operating conditions in the financial sector have continued to improve as the effects of government and central bank policies work through the system and it may be that we have passed, or are about to pass, the bottom of the cycle in the financial markets. Nonetheless, the timing, shape and scale of any recovery in the wider economy remains highly uncertain. Our view continues to be cautious as long as a number of serious impediments to growth remain. Despite the macroeconomic uncertainty, we are confident in HSBC’s continued ability to deliver results. Sustainable banking is our priority and, as we pursue a strategy of growth in faster-growing markets and in products where connectivity and scale can give us commercial advantage, we are convinced of our ability both to generate sustainable long-term growth for our shareholders and to contribute to balanced economic development in a way that benefits wider society.
– 6 –

HSBC Holdings plc ________________________________________________________________________________ Review by Michael Geoghegan, Group Chief Executive Managing the business through the downturn, and positioning for the upturn In these tough times, we are deploying our capital base conservatively in order to build long-term, sustainable returns for our shareholders. We continue to provide responsible support for our customers, both depositors and borrowers. During this period of industry change we are taking opportunities to build market share in our target markets. We are adopting a conservative approach to risk management and have maintained a strong grip on costs. The value of HSBC’s brand has been reinforced and we were delighted to be recognised as Euromoney’s Global Bank of the Year for 2009. In the first half, we saw much that is encouraging for our future. We have continued to enhance HSBC’s signature financial strength. We have further improved the core equity tier 1 ratio that we strengthened through the rights issue after meeting the dividend payments indicated at the time. By attracting core deposits, we have maintained a conservative advances-to-deposits ratio, which was 79.5 per cent at the end of the period. Although deposit spreads remained compressed in the challenging economic environment, HSBC is fully committed to its strong and distinctive liquidity position. We delivered a significant increase in underlying operating revenues, excluding movements in fair value on our own debt related to credit spreads. We have stood aside from the aggressive competition for deposits driven by government-influenced banks but, thanks to our strong brand and selective pricing, we retained and grew the high level of personal balances gained during the market turmoil of 2008. We have continued to strengthen our position in the world’s faster-growing markets and we were especially pleased that the 2009 PwC survey Foreign Banks in China ranked HSBC top in ten major categories, confirming our position as the leading international bank in the country. We have balanced our revenue growth with tight cost control. We reduced our total operating expenses and excluding movements in fair value of own debt credit spreads, our cost efficiency ratio was 44.8 per cent, better than our target range. This careful positioning of our balance sheet and our focus on the needs of our customers means that HSBC is well placed to build on opportunities as they emerge, as the record performance in Global Banking and Markets shows. Furthermore, as economies begin to recover and interest rates start to rise, we are confident that our deposit strength will reinforce our profitability and our flexibility to respond to new customer demand. Growing the business in faster-growing markets HSBC continues to strengthen its position in the world’s faster-growing markets. Mainland China remains key to our growth strategy. We opened 8 new HSBC-branded outlets in the country during the period, and remain on track to have around 100 by the year-end. We have the strongest rural presence of any international bank in mainland China, and added 2 new rural banks, bringing the total to 5. Hang Seng Bank also opened 2 new outlets in the period, bringing their total to 36.
– 7 –

HSBC Holdings plc ________________________________________________________________________________ Elsewhere, completion of our acquisition of Bank Ekonomi almost doubled our presence in Indonesia to 207 outlets in 26 cities. In India we successfully integrated the operations of IL&FS Investsmart, which has added further capabilities and 77 outlets to our wealth management business. We grew customer accounts by over US$17 billion in Asia during the period, notably in Hong Kong, India and mainland China. We also attracted deposits in Latin America in the commercial and global banking sectors. Record performance in Global Banking and Markets Global Banking and Markets reported a record pre-tax profit for the first half of 2009 of US$6.3 billion, more than double pre-tax profit for the first half of 2008, and a seven-fold increase compared with the second half. The success of our emerging markets-led and financing-focused strategy was proven by strong revenues in both developed and faster-growing markets. This was driven by market share gains in trading and financing as activity increased from earlier depressed conditions. Market conditions were also favourable and our performance in the second half of 2009 will depend in part on whether and how these change. A record performance in the rates business and continued strong revenues in foreign exchange underscored the strength of our core products. The value of our client franchise was illustrated by strong growth in financing revenues, which rose by 17 per cent to US$1.6 billion compared with the first half of 2008. HSBC ranked first in the Bloomberg bond league table combining all issuance in Europe, the Middle East, Asia excluding Japan, and Latin America, up from third. Euromoney named HSBC Best Global Debt House for the first time, as well as Best Debt House in Asia, the Middle East and Latin America. The benefits of our integrated business model have been reinforced in the current low interest rate environment. In Balance Sheet Management we generated significantly higher treasury revenues of US$3.4 billion as a result of positioning for lower interest rates. Global Transaction Banking contributed revenues of US$1.5 billion, a decline of US$0.7 billion compared with the first half of 2008. This was largely driven by lower assets under custody and by the low interest rate environment, partially offset by higher deposit balances than in the comparable period in 2008. With greater liquidity in financial markets and capital concerns receding, credit spreads improved considerably. Write-downs on legacy positions in credit trading, leveraged and acquisition financing, and monoline credit exposures amounted to US$762 million, significantly lower than in both the first and second halves of 2008. Asset-backed securities held within our available-for-sale portfolios continued to perform in line with expectations and within the parameters of the stress testing we disclosed in March. The carrying value of the portfolio reduced from US$56.2 billion to US$47.1 billion during the first half of 2009, primarily through the sales of government-sponsored enterprise securities and through repayments. Loan impairment charges rose in Global Banking due to adverse economic conditions, driven by deterioration in the credit position of a small number of clients.
– 8 –

HSBC Holdings plc ________________________________________________________________________________ Commercial Banking resilient Commercial Banking delivered a pre-tax profit of US$ 2.4 billion in the first half of 2009, a solid performance in the current environment. Underlying pre-tax profit declined by 39 per cent compared with the first half of 2008 as the economic environment weakened. However, given the speed and depth of the downturn, credit quality remained remarkably resilient, and loan impairment charges were in line with the second half of 2008. Commercial Banking continues to be at the heart of HSBC's strategy of expansion in faster-growing markets and serving customers with international needs. We increased customer numbers to 3.1 million during the period, with 61 per cent of new customers based in emerging markets. We saw strong growth in international product revenues, especially from foreign exchange and in trade and supply chain services. The volume of international referrals through our Global Links programme was 7 per cent higher than in the first half of last year. During the period, our revenues benefited from a wide range of successful asset re-pricing initiatives, begun in 2008 across both emerging and developed markets. Our ability to re-price assets further in 2009 has reduced somewhat as the availability of credit has started to improve in many economies. Revenues also reflected a lower contribution from Global Transaction Banking, which declined by US$0.5 billion to US$1.9 billion, primarily due to lower deposit margins. Customer deposits remained high, which we believe reflects in part a flight to quality since 2008. However customer loans and advances held up well despite the downturn, and we supported small and medium size businesses by launching our international SME Fund in Malaysia and further increasing our commitment in Hong Kong to HK$16 billion in July. Personal Financial Services – taking the long term view The economic environment has been hard for depositors, who make up the majority of our Personal Financial Services customers. As a deposit-rich bank, HSBC has suffered too, and our liability revenues have been particularly depressed. As a result, Personal Financial Services reported a loss before tax of US$1.2 billion in the first half of 2009, as our profitability outside the US was more than offset by losses within the US. Outside the US, credit quality deteriorated, but remains satisfactory in our view in light of economic conditions. Our commitment to personal customers is unchanged and our liquidity position will drive strong revenue opportunities when a more normal interest rate environment returns. Even in the challenging current climate, we continue to deliver growth in our target customer segments. Through a focus on relationship banking and differentiated service, HSBC is winning new and affluent customers, and the total number of HSBC Premier customers has grown by 23 per cent over the last twelve months. We committed £15 billion for new mortgage lending in the UK, of which we lent £6.7 billion during the first half of the year. We increased our share of UK mortgage sales from 4.5 per cent to 9.5 per cent and were one of the first major players to come back into the market to support first time buyers. In Hong Kong, we also maintained our leading position in new mortgage lending. Our market share increased to 32 per cent in June, while loan impairment charges remained very low.
– 9 –

HSBC Holdings plc ________________________________________________________________________________ Good progress in US Personal Financial Services In the US, Personal Financial Services reported a pre-tax loss of US$2.9 billion for the first half of 2009, compared with a loss of US$2.2 billion in the first half of 2008 and a loss of US$15.2 billion in the second half including the goodwill impairment of US$10 billion. HSBC Finance completed the closure of 813 Consumer Lending branches, incurring US$156 million in restructuring costs, which was lower than expected, and we are on track to achieve the financial savings we set out in March. We are satisfied with the progress achieved on our run-off business at this point. The majority of our customers continue to meet their obligations and dollar delinquency stabilised in the first half of the year. Loan impairment charges increased at a lower rate than we expected, and were lower than in the second half of 2008. This was driven by early action in prior years to reduce exposure to higher risk segments, tight management of accounts and collections, lower loan balances and the impact of government stimulus programmes. Our customers saw fewer opportunities for refinancing, which slowed the rate of run-off in the mortgage portfolio in the first half of the year. However, all parts of the exit consumer finance portfolio declined during the period and since we began to run down the portfolio, starting with the Mortgage Services business in the first quarter of 2007, we have cut balances by US$34 billion, or 27 per cent in total, to US$91 billion, including a US$9 billion reduction in the first half of 2009. We also continue to support customers in difficulty where we can. During the first half of 2009, HSBC Finance modified over 69,000 real estate customer loans with an aggregate balance of US$9.8 billion under the foreclosure avoidance account modification programme. Our cards business was profitable in the first half of 2009, despite difficult economic conditions. The cards portfolio reduced faster than expected during the period due to actions taken to lower origination volumes and reduce credit limits, and the effect of lower customer spending. Overall, our cards performance in the first half of the year was better than expected, due in part to active management of our credit appetite in recent years and government stimulus programmes. Returns in Private Banking remain healthy Private Banking reported a pre-tax profit of US$632 million, a decline of 23 per cent compared with the record first half of 2008, but in line with the second half. Revenues were affected by a reduction in the value of funds under management, which reflected falls in equity markets and lower transaction volumes in equities, funds and structured products as a result of lower client risk appetite. In addition, disposal gains recorded in 2008 did not recur. Client assets remained stable at US$345 billion despite continued deleveraging by clients and our decision not to compete at uneconomic pricing levels for deposits. Net new money fell during the period, although there were net inflows from Asia and Latin America, while intra-group referrals generated more than US$2 billion of net new money.
– 10 –
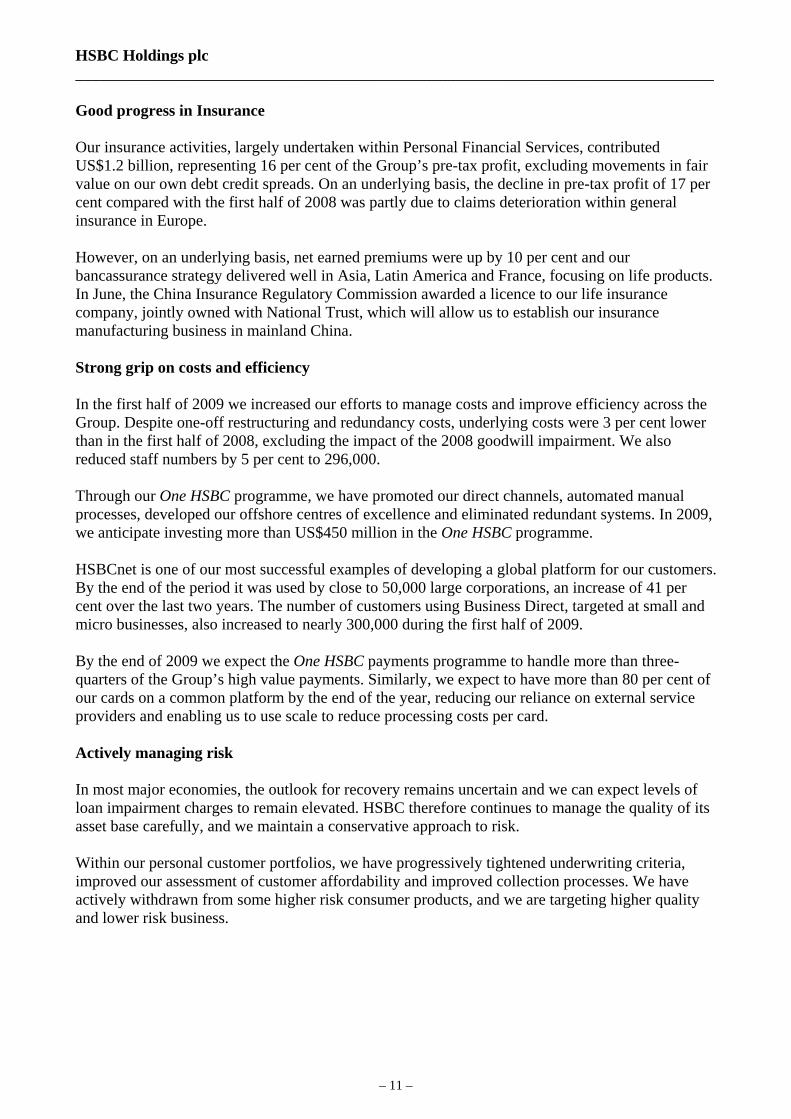
HSBC Holdings plc ________________________________________________________________________________ Good progress in Insurance Our insurance activities, largely undertaken within Personal Financial Services, contributed US$1.2 billion, representing 16 per cent of the Group’s pre-tax profit, excluding movements in fair value on our own debt credit spreads. On an underlying basis, the decline in pre-tax profit of 17 per cent compared with the first half of 2008 was partly due to claims deterioration within general insurance in Europe. However, on an underlying basis, net earned premiums were up by 10 per cent and our bancassurance strategy delivered well in Asia, Latin America and France, focusing on life products. In June, the China Insurance Regulatory Commission awarded a licence to our life insurance company, jointly owned with National Trust, which will allow us to establish our insurance manufacturing business in mainland China. Strong grip on costs and efficiency In the first half of 2009 we increased our efforts to manage costs and improve efficiency across the Group. Despite one-off restructuring and redundancy costs, underlying costs were 3 per cent lower than in the first half of 2008, excluding the impact of the 2008 goodwill impairment. We also reduced staff numbers by 5 per cent to 296,000. Through our One HSBC programme, we have promoted our direct channels, automated manual processes, developed our offshore centres of excellence and eliminated redundant systems. In 2009, we anticipate investing more than US$450 million in the One HSBC programme. HSBCnet is one of our most successful examples of developing a global platform for our customers. By the end of the period it was used by close to 50,000 large corporations, an increase of 41 per cent over the last two years. The number of customers using Business Direct, targeted at small and micro businesses, also increased to nearly 300,000 during the first half of 2009. By the end of 2009 we expect the One HSBC payments programme to handle more than three-quarters of the Group’s high value payments. Similarly, we expect to have more than 80 per cent of our cards on a common platform by the end of the year, reducing our reliance on external service providers and enabling us to use scale to reduce processing costs per card. Actively managing risk In most major economies, the outlook for recovery remains uncertain and we can expect levels of loan impairment charges to remain elevated. HSBC therefore continues to manage the quality of its asset base carefully, and we maintain a conservative approach to risk. Within our personal customer portfolios, we have progressively tightened underwriting criteria, improved our assessment of customer affordability and improved collection processes. We have actively withdrawn from some higher risk consumer products, and we are targeting higher quality and lower risk business.
– 11 –

HSBC Holdings plc ________________________________________________________________________________ In our commercial businesses, we have continued to support customers in the downturn through more active relationship management and, in our wholesale businesses, we are focused on serving our long-standing core customers and have lowered our risk appetite for certain vulnerable and high-risk industry sectors. Other actions taken to manage risk over the last few years have also produced results. We started to reduce our appetite for exposure to commercial real estate in 2007. We are now seeing the benefits of this, and have to date avoided any significant impairments within the Group. Our appetite for highly leveraged and acquisition financing opportunities has always been modest and concentrated on the top end of the market. We considerably reduced our exposure to the major US auto manufacturers and had no material exposure to those which fell into bankruptcy. Finally, HSBC’s exposure to Eastern Europe, where certain economies have suffered particular stress recently, has remained modest. Leveraging our brand and competitive position We are encouraged by HSBC’s performance in the first half of 2009. We have again proven our ability to deliver consistently through diversity, and to execute on our strategic priorities. Despite the continuing economic uncertainty, we remain confident in our ability to do so. We are proud of HSBC’s strong global reputation and during the period we were named the world’s top banking brand by Brand Finance. We are equally proud of our staff and I would like to thank all of them for their continued hard work and commitment to our customers around the world. Because of this powerful brand and our excellent team of people, we can be confident that customers will continue to choose HSBC for deposits, borrowing and all other financial services. As a result, we are confident that HSBC is strongly and competitively placed both to attract market share in developed markets and to grow our business in the faster-growing markets of the future.
– 12 –
HSBC Holdings plc
Financial Overview
________________________________________________________________________________
Half -year to Half-year to 30 June 30 June 30 June 31 December
2009 2009 2008 2008 £m HK$m US$m US$m US$m
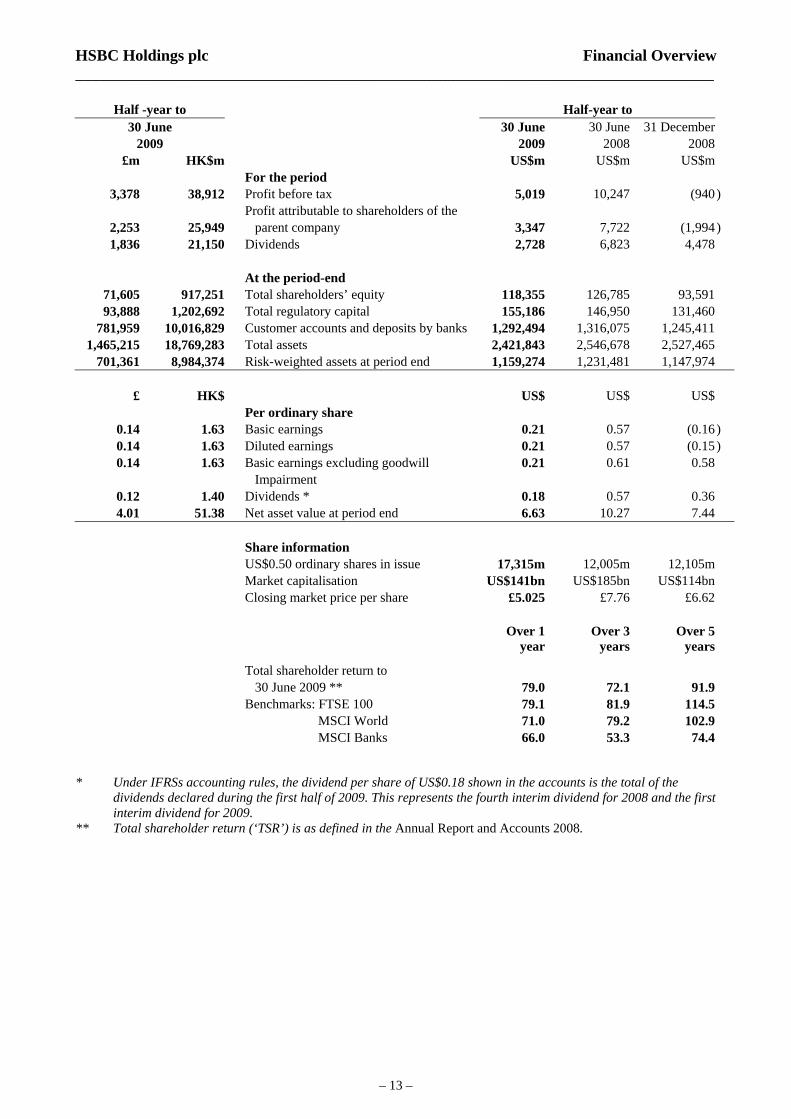
For the period 3,378 38,912 Profit before tax 5,019 10,247 (940) Profit attributable to shareholders of the 2,253 25,949 parent company 3,347 7,722 (1,994) 1,836 21,150 Dividends 2,728 6,823 4,478
At the period-end
71,605 917,251 Total shareholders’ equity 118,355 126,785 93,591 93,888 1,202,692 Total regulatory capital 155,186 146,950 131,460
781,959 10,016,829 Customer accounts and deposits by banks 1,292,494 1,316,075 1,245,411 1,465,215 18,769,283 Total assets 2,421,843 2,546,678 2,527,465
701,361 8,984,374 Risk-weighted assets at period end 1,159,274 1,231,481 1,147,974
£ HK$ US$ US$ US$ Per ordinary share
0.14 1.63 Basic earnings 0.21 0.57 (0.16) 0.14 1.63 Diluted earnings 0.21 0.57 (0.15) 0.14 1.63 Basic earnings excluding goodwill 0.21 0.61 0.58
Impairment 0.12 1.40 Dividends * 0.18 0.57 0.36 4.01 51.38 Net asset value at period end 6.63 10.27 7.44
Share information US$0.50 ordinary shares in issue 17,315m 12,005m 12,105m Market capitalisation US$141bn US$185bn US$114bn Closing market price per share £5.025 £7.76 £6.62 Over 1
year Over 3
years Over 5
years
Total shareholder return to 30 June 2009 ** 79.0 72.1 91.9 Benchmarks: FTSE 100 79.1 81.9 114.5 MSCI World 71.0 79.2 102.9 MSCI Banks 66.0 53.3 74.4
* Under IFRSs accounting rules, the dividend per share of US$0.18 shown in the accounts is the total of the
dividends declared during the first half of 2009. This represents the fourth interim dividend for 2008 and the first interim dividend for 2009.
** Total shareholder return (‘TSR’) is as defined in the Annual Report and Accounts 2008.
– 13 –

HSBC Holdings plc
Financial Overview
(continued)________________________________________________________________________________ Half-year to 30 June 30 June 31 December 2009 2008 2008 % % % Performance ratios Return on average invested capital1 5.0 11.1 (3.2 ) Return on average total shareholders’ equity 6.4 12.1 (3.4 ) Post-tax return on average total assets 0.31 0.68 (0.14 ) Post-tax return on average risk-weighted assets 0.66 1.39 (0.31 ) Efficiency and revenue mix ratios Cost efficiency ratio - as reported 47.9 51.0 68.6 - excluding goodwill impairment 47.9 49.7 44.8 As a percentage of total operating income: – net interest income 51.0 49.4 46.8 – net fee income 20.9 25.6 19.8 – net trading income 15.5 8.9 6.0 Capital ratios – Tier 1 10.1 8.8 8.3 – Total capital 13.4 11.9 11.4 1 Return on invested capital is based on the profit attributable to ordinary shareholders. Average invested capital is
measured as average total shareholders’ equity after adding back goodwill previously written-off directly to reserves, deducting average equity preference shares issued by HSBC Holdings and deducting/(adding) average reserves for unrealised gains/(losses) on effective cash flow hedges and available-for-sale securities. This measure reflects capital initially invested and subsequent profit.
– 14 –

HSBC Holdings plc
Consolidated Income Statement
________________________________________________________________________________Half-year to Half-year to
30 June 30 June 30 June 31 December 2009 2009 2008 2008
£m HK$m US$m US$m US$m
21,858 251,810 Interest income 32,479 47,164 44,137 (8,036 ) (92,579 ) Interest expense (11,941 ) (25,986 ) (22,752)
13,822 159,231 Net interest income 20,538 21,178 21,385
6,859 79,011 Fee income 10,191 13,381 11,383 (1,186 ) (13,669 ) Fee expense (1,763 ) (2,390 ) (2,350)
5,673 65,342 Net fee income 8,428 10,991 9,033
2,894 33,346 Trading income excluding net interest income 4,301 639 208 1,316 15,149 Net interest income on trading activities 1,954 3,195 2,518
4,210 48,495 Net trading income 6,255 3,834 2,726
Changes in fair value of long-term debt issued (1,548 ) (17,832 ) and related derivates (2,300 ) 577 6,102
Net income/(expense) from other financial 523 6,024 Instruments designated at fair value 777 (1,161 ) (1,666)
Net income/(expense) from financial (1,025 ) (11,808 ) instruments designated at fair value (1,523 ) (584 ) 4,436
217 2,504 Gains less losses from financial investments 323 817 (620) 38 442 Dividend income 57 88 184
3,373 38,858 Net earned insurance premiums 5,012 5,153 5,697 – – Gain on disposal of French regional banks – – 2,445
779 8,979 Other operating income 1,158 1,435 373
27,087 312,043 Total operating income 40,248 42,912 45,659
Net insurance claims incurred and (3,706 ) (42,696 ) movement in liabilities to policyholders (5,507 ) (3,437 ) (3,452)
Net operating income before loan impairment 23,381 269,347 charges and other credit risk provisions 34,741 39,475 42,207
Loan impairment charges and other credit (9,376 ) (108,007 ) risk provisions (13,931 ) (10,058 ) (14,879)
14,005 161,340 Net operating income 20,810 29,417 27,328
(6,196 ) (71,382 ) Employee compensation and benefits (9,207 ) (10,925 ) (9,867) (4,211 ) (48,519 ) General and administrative expenses (6,258 ) (7,479 ) (7,781)
Depreciation and impairment of property, (548 ) (6,311 ) plant and equipment (814 ) (863 ) (887)
– – Goodwill impairment – (527 ) (10,037) (255 ) (2,938 ) Amortisation and impairment of intangible assets (379 ) (346 ) (387)
(11,210 ) (129,150 ) Total operating expenses (16,658 ) (20,140 ) (28,959)
2,795 32,190 Operating profit/(loss) 4,152 9,277 (1,631)
583 6,722 Share of profit in associates and joint ventures 867 970 691
3,378 38,912 Profit/(loss) before tax 5,019 10,247 (940)
(865 ) (9,970 ) Tax expense (1,286 ) (1,941 ) (868)
2,513 28,942 Profit/(loss) for the period 3,733 8,306 (1,808)
– 15 –

HSBC Holdings plc
Consolidated Income Statement
(continued)
Half-year to Half-year to
30 June 30 June 30 June 31 December 2009 2009 2008 2008
£m HK$m US$m US$m US$m
Profit/(loss) attributable to shareholders 2,253 25,949 of the parent company 3,347 7,722 (1,994)
260 2,993 386 Profit attributable to minority interests 584 186
– 16 –

HSBC Holdings plc
Consolidated Statement of Comprehensive Income
________________________________________________________________________________ Half-year to 30 June 30 June 31 December 2009 2008 2008 US$m US$m US$m
Profit/(loss) for the period 3,733 8,306 (1,808 ) Other comprehensive income Available-for-sale investments: – fair value gains/(losses) taken to equity 4,067 (8,475 ) (15,247 ) – fair value gains transferred to income statement on disposal (720 ) (920 ) (396 ) – amounts transferred to the income statement in respect of impairment losses 872 384 1,395 – income taxes (349 ) 705 650
3,870 (8,306 ) (13,598 )
Cash flow hedges: – fair value gains/(losses) taken to equity (111 ) 914 (2,634 ) – fair value gains/(losses) transferred to income statement 856 (1,134 ) 2,888 – income taxes (293 ) 25 65
452 (195 ) 319
Actuarial gains/(losses) on defined benefit plans – before income taxes (3,578 ) (910 ) (699 ) – income taxes 969 215 219
(2,609 ) (695 ) 480
Share-based payments – income taxes (9 ) (9 ) (9 ) Share of other comprehensive income of associates and joint ventures 105 (342 ) (217 ) Exchange differences 3,450 3,170 (15,375 )
Other comprehensive income for the period, net of tax 5,259 (6,377 ) (29,342 )
Total comprehensive income for the period 8,992 1,929 (31,150 ) Total comprehensive income for the period attributable to: – shareholders of the parent company 8,388 1,523 (30,748 ) – minority interests 604 406 (402 )
8,992 1,929 (31,150 )
– 17 –
HSBC Holdings plc
Consolidated Balance Sheet
________________________________________________________________________________
At At At At 30 June 30 June 30 June 31 December
2009 2009 2008 2008 £m HK$m US$m US$m US$m
ASSETS
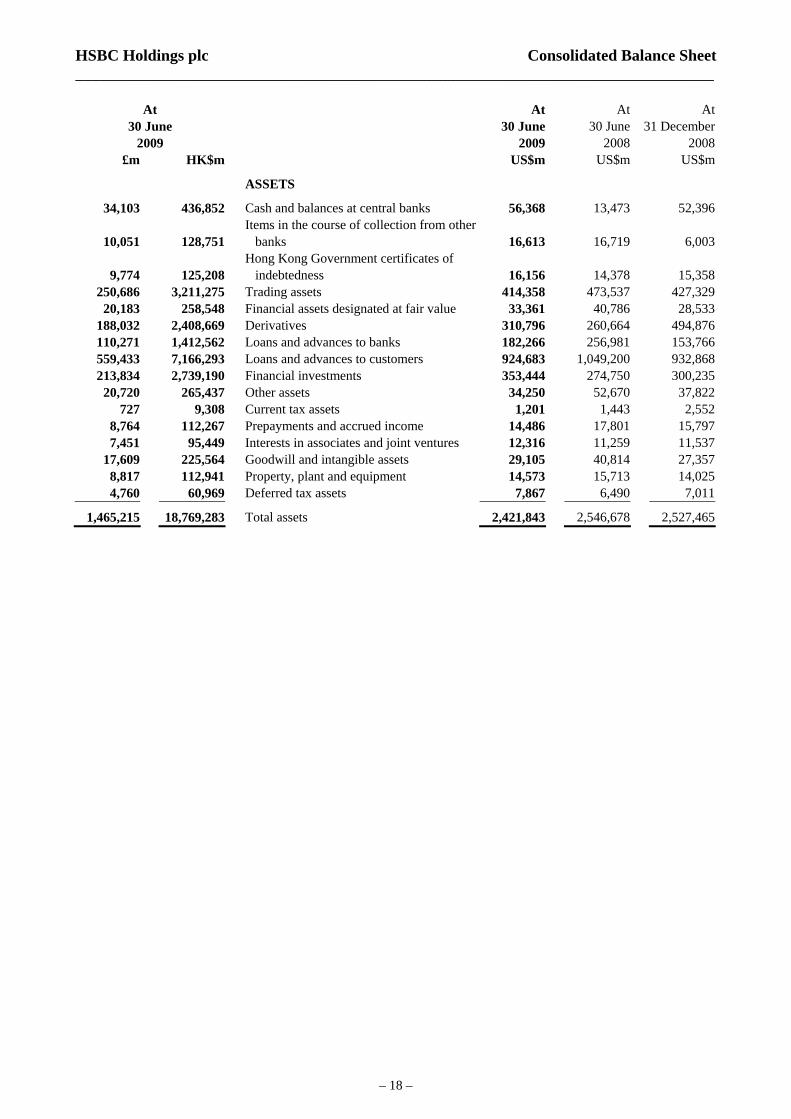
34,103 436,852 Cash and balances at central banks 56,368 13,473 52,396 Items in the course of collection from other
10,051 128,751 banks 16,613 16,719 6,003 Hong Kong Government certificates of
9,774 125,208 indebtedness 16,156 14,378 15,358 250,686 3,211,275 Trading assets 414,358 473,537 427,329
20,183 258,548 Financial assets designated at fair value 33,361 40,786 28,533 188,032 2,408,669 Derivatives 310,796 260,664 494,876 110,271 1,412,562 Loans and advances to banks 182,266 256,981 153,766 559,433 7,166,293 Loans and advances to customers 924,683 1,049,200 932,868 213,834 2,739,190 Financial investments 353,444 274,750 300,235
20,720 265,437 Other assets 34,250 52,670 37,822 727 9,308 Current tax assets 1,201 1,443 2,552
8,764 112,267 Prepayments and accrued income 14,486 17,801 15,797 7,451 95,449 Interests in associates and joint ventures 12,316 11,259 11,537
17,609 225,564 Goodwill and intangible assets 29,105 40,814 27,357 8,817 112,941 Property, plant and equipment 14,573 15,713 14,025 4,760 60,969 Deferred tax assets 7,867 6,490 7,011
1,465,215 18,769,283 2,421,843 Total assets 2,546,678 2,527,465
– 18 –

HSBC Holdings plc
Consolidated Balance Sheet
(continued)________________________________________________________________________________
At At At At 30 June 30 June 30 June 31 December
2009 2009 2008 2008 £m HK$m US$m US$m US$m
LIABILITIES AND EQUITY Liabilities
9,774 125,208 Hong Kong currency notes in circulation 16,156 14,378 15,358 78,136 1,000,920 Deposits by banks 129,151 154,152 130,084
703,823 9,015,908 Customer accounts 1,163,343 1,161,923 1,115,327 Items in the course of transmission to other
9,684 124,054 banks 16,007 15,329 7,232 160,060 2,050,356 Trading liabilities 264,562 340,611 247,652
46,775 599,185 Financial liabilities designated at fair value 77,314 89,758 74,587 180,820 2,316,289 Derivatives 298,876 251,357 487,060
94,500 1,210,542 Debt securities in issue 156,199 230,267 179,693 42,426 543,466 Other liabilities 70,125 48,435 72,384 1,376 17,624 Current tax liabilities 2,274 3,082 1,822
29,151 373,426 Liabilities under insurance contracts 48,184 46,851 43,683 7,976 102,176 Accruals and deferred income 13,184 17,592 15,448 1,179 15,105 Provisions 1,949 1,872 1,730 1,119 14,330 Deferred tax liabilities 1,849 1,924 1,855 4,379 56,095 Retirement benefit liabilities 7,238 3,619 3,888
18,231 233,539 Subordinated liabilities 30,134 31,517 29,433
1,389,409 17,798,223 Total liabilities 2,296,545 2,412,667 2,427,236
Equity 5,238 67,100 Called up share capital 8,658 6,003 6,053 5,076 65,023 Share premium account 8,390 8,097 8,463 1,290 16,531 Other equity instruments 2,133 2,134 2,133
11,608 148,692 Other reserves 19,186 27,561 (3,747) 48,393 619,905 Retained earnings 79,988 82,990 80,689
71,605 917,251 Total shareholders’ equity 118,355 126,785 93,591 4,201 53,809 Minority interests 6,943 7,226 6,638
75,806 971,060 Total equity 125,298 134,011 100,229
1,465,215 18,769,283 Total equity and liabilities 2,421,843 2,546,678 2,527,465
– 19 –

HSBC Holdings plc
Consolidated Statement of Cash Flows
________________________________________________________________________________ Half-year to 30 June 30 June 31 December 2009 2008 2008 US$m US$m US$m Cash flows from operating activities Profit/(loss) before tax 5,019 10,247 (940 )
Adjustments for: – non-cash items included in profit before tax 16,255 12,900 28,405 – change in operating assets (37,279 ) (101,131 ) 119,254 – change in operating liabilities 22,246 69,395 (132,808 ) – elimination of exchange differences (7,878 ) (11,632 ) 47,764 – net gain from investing activities (911 ) (1,555 ) (2,640 ) – share of profits in associates and joint ventures (867 ) (970 ) (691 ) – dividends received from associates 195 405 250 – contribution paid to defined benefit plans (440 ) (416 ) (303 ) – tax paid 118 (2,152 ) (2,962 )
Net cash generated from/(used in) operating activities 3,542 (24,909 ) 55,329
Cash flows from investing activities Purchase of financial investments (163,988 ) (123,464 ) (153,559 ) Proceeds from the sale and maturity of financial investments 112,927 126,384 96,754 Purchase of property, plant and equipment (781 ) (1,112 ) (1,873 ) Proceeds from the sale of property, plant and equipment 2,203 2,156 311 Proceeds from the sale of loan portfolios 3,961 – 9,941 Net purchase of intangible assets (463 ) (553 ) (616 ) Net cash inflow/(outflow) from acquisition of and increase in stake of subsidiaries (574 ) 1,608 (295 ) Net cash inflow from disposal of subsidiaries – 440 2,539 Net cash outflow from acquisition of and increase in stake of associates (20 ) (122 ) (233 ) Net cash inflow from the consolidation of funds – – 16,500 Proceeds from disposal of associates and joint ventures 308 (8 ) 109
Net cash generated from/(used in) investing activities (46,427 ) 5,329 (30,422 )
Cash flows from financing activities Issue of ordinary share capital – rights issue 18,179 – – – other 2 52 415 Issue of other equity instruments – 2,134 (1 ) Net purchases and sales of own shares for market-making and investment purposes (51 ) (202 ) 8 Purchases of own shares to meet share awards and share option awards (62 ) (783 ) (25 ) On exercise of share options – 14 13 Subordinated loan capital issued 2,763 5,582 1,512 Subordinated loan capital repaid (154 ) 6 (356 ) Dividends paid to shareholders of the parent company (2,426 ) (3,825 ) (3,386 ) Dividends paid to minority interests (433 ) (394 ) (320 ) Dividends paid to holders of other equity instruments (89 ) – (92 )
Net cash generated from/(used in) financing activities 17,729 2,584 (2,232 )
Net increase/(decrease) in cash and cash equivalents (32,240 ) (16,996 ) 22,675
Cash and cash equivalents at beginning of period 278,872 297,009 287,538 Exchange differences in respect of cash and cash equivalents 5,064 7,525 (31,341 )
Cash and cash equivalents at end of period 251,696 287,538 278,872
– 20 –
HSBC Holdings plc
Consolidated Statement of Changes in Equity
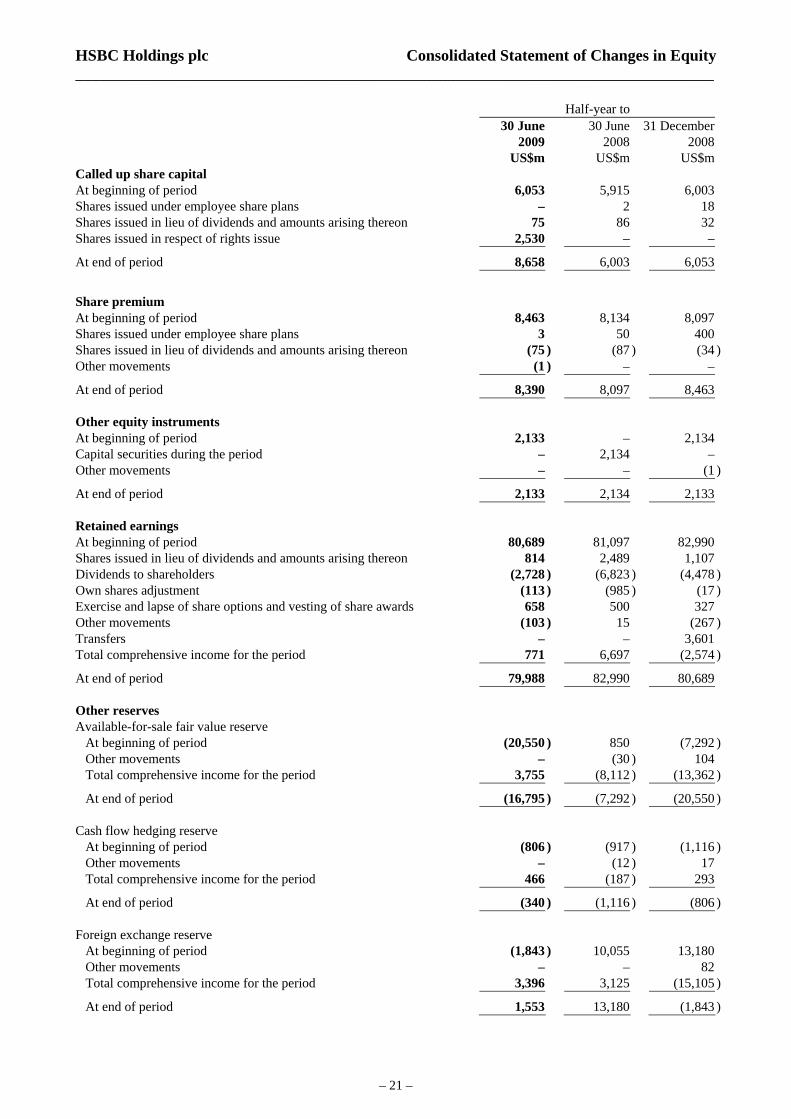
________________________________________________________________________________ Half-year to 30 June 30 June 31 December 2009 2008 2008 US$m US$m US$m Called up share capital At beginning of period 6,053 5,915 6,003 Shares issued under employee share plans – 2 18 Shares issued in lieu of dividends and amounts arising thereon 75 86 32 Shares issued in respect of rights issue 2,530 – –
At end of period 8,658 6,003 6,053
Share premium At beginning of period 8,463 8,134 8,097 Shares issued under employee share plans 3 50 400 Shares issued in lieu of dividends and amounts arising thereon (75 ) (87 ) (34 ) Other movements (1 ) – –
At end of period 8,390 8,097 8,463 Other equity instruments At beginning of period 2,133 – 2,134 Capital securities during the period – 2,134 – Other movements – – (1 )
At end of period 2,133 2,134 2,133 Retained earnings At beginning of period 80,689 81,097 82,990 Shares issued in lieu of dividends and amounts arising thereon 814 2,489 1,107 Dividends to shareholders (2,728 ) (6,823 ) (4,478 ) Own shares adjustment (113 ) (985 ) (17 ) Exercise and lapse of share options and vesting of share awards 658 500 327 Other movements (103 ) 15 (267 ) Transfers – – 3,601 Total comprehensive income for the period 771 6,697 (2,574 )
At end of period 79,988 82,990 80,689 Other reserves Available-for-sale fair value reserve At beginning of period (20,550 ) 850 (7,292 ) Other movements – (30 ) 104 Total comprehensive income for the period 3,755 (8,112 ) (13,362 )
At end of period (16,795 ) (7,292 ) (20,550 ) Cash flow hedging reserve At beginning of period (806 ) (917 ) (1,116 ) Other movements – (12 ) 17 Total comprehensive income for the period 466 (187 ) 293
At end of period (340 ) (1,116 ) (806 ) Foreign exchange reserve At beginning of period (1,843 ) 10,055 13,180 Other movements – – 82 Total comprehensive income for the period 3,396 3,125 (15,105 )
At end of period 1,553 13,180 (1,843 )
– 21 –

HSBC Holdings plc
Consolidated Statement of Changes in Equity
(continued) Half-year to 30 June 30 June 31 December 2009 2008 2008 US$m US$m US$m Share-based payment reserve At beginning of period 1,995 1,968 1,731 Exercise and lapse of share options and vesting of share awards (699 ) (587 ) (261 ) Cost of share-based payment arrangements 355 427 392 Other movements 11 (77 ) 133
At end of period 1,662 1,731 1,995 Merger reserve At beginning of period 17,457 21,058 21,058 Shares issued in respect of rights issue 15,649 – – Transfers – – (3,601 )
At end of period 33,106 21,058 17,457 Total shareholders equity At beginning of period 93,591 128,160 126,785 Shares issued under employee share plans 3 52 418 Shares issued in lieu of dividends and amounts arising thereon 814 2,488 1,105 Shares issued in respect of rights issue 18,179 – – Capital securities issued during the period – 2,134 – Dividends to shareholders (2,728 ) (6,823 ) (4,478 ) Own shares adjustment (113 ) (985 ) (17 ) Exercise and lapse of share options and vesting of share awards (41 ) (87 ) 66 Cost of share-based payment arrangements 355 427 392 Other movements (93 ) (104 ) 68 Total comprehensive income for the period 8,388 1,523 (30,748 )
At end of period 118,355 126,785 93,591 Minority interests At beginning of period 6,638 7,256 7,226 Dividends to shareholders (513 ) (506 ) (307 ) Other movements 12 (5 ) 78 Net increase in minority interest arising on acquisition, disposal and capital issuance 202 75 43 Total comprehensive income for the period 604 406 (402 )
6,943 At end of period 7,226 6,638
– 22 –

HSBC Holdings plc
Consolidated Statement of Changes in Equity
(continued) Half-year to 30 June 30 June 31 December 2009 2008 2008 US$m US$m US$m Total equity At beginning of period 100,229 135,416 134,011 Shares issued under employee share plans 3 52 418 Shares issued in lieu of dividends and amounts arising thereon 814 2,488 1,105 Shares issued in respect of rights issue 18,179 – – Capital securities issued during the period – 2,134 – Dividends to shareholders (3,241 ) (7,329 ) (4,785 ) Own shares adjustment (113 ) (985 ) (17 ) Exercise and lapse of share options and vesting of share awards (41 ) (87 ) 66 Cost of share-based payment arrangements 355 427 392 Other movements (81 ) (109 ) 146 Net increase in minority interest arising on acquisition, disposal and capital issuance 202 75 43 Total comprehensive income for the period 8,992 1,929 (31,150 )
125,298 At end of period 134,011 100,229
– 23 –
HSBC Holdings plc Additional Information________________________________________________________________________________ 1. Basis of preparation (a) Compliance with International Financial Reporting Standards
The interim consolidated financial statements of HSBC have been prepared in accordance with IAS 34 ‘Interim Financial Reporting’ (‘IAS 34’) as issued by the International Accounting Standards Board (‘IASB’) and as endorsed by the EU. In order to present fairly the financial position, financial performance and cash flows of the Group, as required by IAS 1 ‘Presentation of Financial Statements’, and give a true and fair view of the assets, liabilities, financial position and profit or loss of the Group, as required by section 393 of the Companies Act 2006, HSBC has departed from the requirements of IAS 32 ‘Financial Instruments: Presentation’ (‘IAS 32’) in so far as this standard requires the offer of rights by HSBC to its shareholders in March 2009 to be classified as a derivative financial liability, in order to achieve a fair presentation of the Group’s performance. Further details of this departure including its financial effect are provided in Note 12. The Directors have concluded that the interim consolidated financial statements prepared on this basis present fairly, and give a true and fair view of, the Group’s financial position, financial performance and cash flows. The consolidated financial statements of HSBC at 31 December 2008 were prepared in accordance with International Financial Reporting Standards (‘IFRSs’) as issued by the IASB and as endorsed by the EU. EU endorsed IFRSs may differ from IFRSs as issued by the IASB if, at any point in time, new or amended IFRSs have not been endorsed by the EU. At 31 December 2008, there were no unendorsed standards effective for the year ended 31 December 2008 affecting the consolidated financial statements at that date, and there was no difference between IFRSs endorsed by the EU and IFRSs issued by the IASB in terms of their application to HSBC. Accordingly, HSBC’s financial statements for the year ended 31 December 2008 were prepared in accordance with IFRSs as issued by the IASB. At 30 June 2009, there were no unendorsed standards effective for the period ended 30 June 2009 affecting these interim consolidated financial statements, and there was no difference between IFRSs endorsed by the EU and IFRSs issued by the IASB in terms of their application to HSBC. IFRSs comprise accounting standards issued by the IASB and its predecessor body as well as interpretations issued by the International Financial Reporting Interpretations Committee (‘IFRIC’) and its predecessor body. During the period ended 30 June 2009, HSBC adopted the following significant standards and revisions to standards: • On 1 January 2009, HSBC adopted IFRS 8 ‘Operating Segments’ (‘IFRS 8’), which
replaced IAS 14 ‘Operating Segments’. IFRS 8 requires an entity to disclose information about its segments which enables users to evaluate the nature and financial effects of its business activities and the economic environments in which it operates. HSBC’s operating segments are organised into six geographical regions, Europe, Hong Kong, Rest of Asia-Pacific, Middle East, North America and Latin America. Because of the nature of the Group, HSBC’s chief operating decision-maker regularly reviews operating
– 24 –

HSBC Holdings plc Additional Information
(continued)________________________________________________________________________________
activity on a number of bases, including by geography, by customer group, and by retail businesses and global businesses. HSBC’s IFRS 8 operating segments were determined to be geographical segments because the chief operating decision-maker uses information on geographical segments in order to make decisions about allocating resources and assessing performance.
• IFRS 8 requires segment financial information to be reported using the same measures
reported to the chief operating decision-maker for the purpose of making decisions about allocating resources to the operating segments and assessing their performance. Information provided to the chief operating decision-maker of HSBC to make decisions about allocating resources and assessing performance of operating segments is measured in accordance with IFRSs.
• On 1 January 2009, HSBC adopted the revised IAS 1 ‘Presentation of Financial Statements’ (‘IAS 1’). The revised standard aims to improve users’ ability to analyse and compare information given in financial statements. The adoption of the revised standard has no effect on the results reported HSBC’s consolidated financial statements. It does, however, result in certain presentational changes in HSBC’s financial statements, including:
– the presentation of all items of income and expenditure in two financial statements,
the ‘Consolidated income statement’ and ‘Consolidated statements of comprehensive income’; and
– the presentation of the ‘Consolidated statement of changes in equity’ as a financial
statement, which replaces the ‘Equity’ note on the financial statements.
During the period ended 30 June 2009, HSBC adopted a number of amendments to standards and interpretations which had an insignificant effect on the consolidated financial statements. These are described on pages 342 to 344 of the Annual Report and Accounts 2008.
(b) Changes in composition of the Group
Acquisition of PT Bank Ekonomi Raharja Tbk (‘Bank Ekonomi’) In May 2009, HSBC completed the acquisition of 88.89 per cent of Bank Ekonomi, in Indonesia, for cash consideration of US$608 million. Following acquisition of the initial stake, HSBC was required under Indonesia law to make a mandatory tender offer for a further holding of up to 10.11 per cent. HSBC completed the mandatory tender offer in July 2009.
– 25 –

HSBC Holdings plc Additional Information
(continued)________________________________________________________________________________ 2. Dividends The Directors have declared a second interim dividend for 2009 of US$0.08 per ordinary share, a distribution of approximately US$1,386 million. The second interim dividend will be payable on 7 October 2009 to holders of ordinary shares on the Register at the close of business on 21 August 2009. The dividend will be payable in cash, in US dollars, sterling or Hong Kong dollars, or a combination of these currencies, at the exchange rates quoted by HSBC Bank plc in London at or about 11.00 am on 28 September 2009, and with a scrip dividend alternative. Particulars of these arrangements will be mailed to shareholders on or about 1 September 2009, and elections must be received by 23 September 2009. As this dividend was declared after the balance sheet date, it has not been included in ‘Other liabilities’ at 30 June 2009. The dividend will be payable on shares held through Euroclear France, the settlement and central depositary system for Euronext Paris, on 7 October 2009 to the holders of record on 21 August 2009. The dividend will be payable in cash, in euros at the exchange rate on 28 September 2009, and with a scrip dividend alternative. Particulars of these arrangements will be announced through Euronext Paris on 17 August 2009 and 26 August 2009. The dividend will be payable on American Depositary Shares (‘ADSs’), each of which represents five ordinary shares, on 7 October 2009 to holders of record on 21 August 2009. The dividend of US$0.40 per ADS will be payable in cash in US dollars and with a scrip dividend alternative of new ADSs. Particulars of these arrangements will be mailed to holders on or about 1 September 2009. Elections must be received by the depositary on or before 17 September 2009. Alternatively, the cash dividend may be invested in additional ADSs for participants in the dividend reinvestment plan operated by the depositary. HSBC Holdings’ ordinary shares will be quoted ex-dividend in London, Hong Kong, Paris and Bermuda on 19 August 2009. The ADSs will be quoted ex-dividend in New York on 19 August 2009.
– 26 –

HSBC Holdings plc
Additional Information
(continued)________________________________________________________________________________ Dividends to shareholders of the parent company were as follows:
Half-year to 30 June 2009 30 June 2008 31 December 2008
Per share
US$ Total
US$m
Settled in scrip
US$m
PershareUS$
Total US$m
Settledin scripUS$m
Per share US$
Total US$m
Settledin scripUS$m
Dividends declared on ordinary shares In respect of previous year: – fourth interim dividend 0.10 1,210 624 0.39 4,620 2,233 – – –In respect of current year: – first interim dividend 0.08 1,384 190 0.18 2,158 256 – – –– second interim dividend – – – – – – 0.18 2,166 727– third interim dividend – – – – – – 0.18 2,175 380
0.18 2,594 814 0.57 6,778 2,489 0.36 4,341 1,107
Quarterly dividends on preference shares classified as equity March dividend 15.50 22 15.50 22 – –June dividend 15.50 23 15.50 23 – –September dividend – – – – 15.50 22December dividend – – – – 15.50 23
31.00 45 31.00 45 31.00 45
Quarterly coupons on capital securities classified as equity July coupon – – 0.541 47October coupon – – 0.508 45January coupon 0.508 44 – –April coupon 0.508 45 – –
1.016 89 1.049 92 3. Earnings and dividends per ordinary share Half-year to 30 June 30 June 31 December 2009 2008 2008 US$ US$ US$
Basic earnings per ordinary share 0.21 0.57 (0.16 ) Diluted earnings per ordinary share 0.21 0.57 (0.15 ) Basic earnings per ordinary share excluding goodwill impairment 0.21 0.61 0.58 Dividends per ordinary share 0.18 0.57 0.36
6.63 Net asset value at period end 10.27 7.44
Dividend pay out ratio1 85.7% 100% – 1 Dividends per ordinary share expressed as a percentage of basic earnings per ordinary share.
– 27 –

HSBC Holdings plc
Additional Information
(continued)________________________________________________________________________________ Basic earnings per ordinary share was calculated by dividing the profit attributable to ordinary shareholders of the parent company by the weighted average number of ordinary shares outstanding, excluding own shares held. Diluted earnings per ordinary share was calculated by dividing the basic earnings, which require no adjustment for the effects of dilutive potential ordinary shares, by the weighted average number of ordinary shares outstanding, excluding own shares held, plus the weighted average number of ordinary shares that would be issued on conversion of dilutive potential ordinary shares. In April 2009, HSBC Holdings plc completed a rights issue, details of which are provided in Note 12. The effect of the bonus element included within the rights issue has been included within the calculation of basic and diluted earnings per share for the period, through an adjustment to the weighted average number of ordinary and dilutive potential ordinary shares outstanding. Comparative data has been restated on this basis. Half-year to 30 June 30 June 31 December 2009 2008 2008 US$m US$m US$m
Profit attributable to shareholders of the parent company 3,347 7,722 (1,994 ) Dividend payable on preference shares classified as equity (45 ) (45 ) (45 )
(89 ) – (92Coupon payable on capital securities classified as equity )
3,213 7,677 (2,131 ) Profit/(loss) attributable to ordinary shareholders of the parent company 4. Tax expense Half-year to 30 June 30 June 31 December 2009 2008 2008 US$m US$m US$m
UK corporation tax charge 60 991 680 Overseas tax 1,472 1,306 397
Current tax 1,532 2,297 1,077 Deferred tax (246 ) (356 ) (209 )
1,286 1,941 Tax expense 868 Effective tax rate 25.6% 18.9% (92.3)% The UK corporation tax rate applying to HSBC was 28 per cent (2008: 30 per cent to 1 April 2008 and 28 per cent thereafter). Overseas tax included Hong Kong profits tax of US$416 million (first half of 2008: US$529 million; second half of 2008: US$317 million). Subsidiaries in Hong Kong provided for Hong Kong profits tax at the rate of 16.5 per cent (2008: 16.5 per cent) on the profits for the period assessable in Hong Kong. Other overseas subsidiaries and overseas branches provided for taxation at the appropriate rates in the countries in which they operate. The following table reconciles the overall tax expense which would apply if all profits had been taxed at the UK corporation tax rate:
– 28 –

HSBC Holdings plc
Additional Information
(continued)________________________________________________________________________________ Analysis of overall tax expense: Half-year to 30 June 30 June 31 December 2009 2008 2008 US$m US$m US$m
Taxation at UK corporation tax rate of 28 per cent (2008: 28.5 per cent) 1,405 2,920 (268 ) Goodwill impairment – 150 2,860 Effect of taxing overseas profit in principal locations at different rates (598 ) (560 ) (779 ) Tax-free gains (34 ) (267 ) (749 ) Adjustments in respect of prior period liabilities (5 ) 2 (69 ) Low income housing tax credits (49 ) (51 ) (52 ) Effect of profit in associates and joint ventures (243 ) (263 ) (210 ) Effect of previously unrecognised temporary differences (60 ) (80 ) (18 ) Deferred tax temporary differences not provided 852 – – Other items 18 90 153
Overall tax expense 1,286 1,941 868 5. Analysis of net fee income Half-year to 30 June 30 June 31 December 2009 2008 2008 US$m US$m US$m
Cards 2,209 3,089 2,755 Account services 1,771 2,260 2,093 Funds under management 945 1,572 1,185 Broking income 749 954 784 Credit facilities 729 639 674 Insurance 688 942 829 Global custody 471 757 554 Imports/Exports 438 496 518 Underwriting 348 204 121 Remittances 281 307 303 Corporate finance 164 232 149 Unit trusts 137 337 165 Trust income 134 164 161 Taxpayer financial services 91 154 14 Mortgage servicing 62 56 64 Maintenance income on operating leases 55 70 60 Other 919 1,148 954
Total fee income 10,191 13,381 11,383 Less: fee expense (1,763) (2,390 ) (2,350)
8,428 10,991 Net fee income 9,033
– 29 –

HSBC Holdings plc
Additional Information
(continued)________________________________________________________________________________ 6. Loan impairment charge Half-year to 30 June 30 June 31 December 2009 2008 2008 US$m US$m US$m Individually assessed impairment allowances: – Net new allowances 2,284 390 1,787 – Recoveries (34) (58 ) (55)
2,250 332 1,732 Collectively assessed impairment allowances: – Net new allowances 11,426 10,046 12,742 – Recoveries (343) (421 ) (300)
11,083 9,625 12,442 Total charge for impairment losses 13,333 9,957 14,174
13,320 Customers 9,957 14,120 13Banks – 54
– 30 –

HSBC Holdings plc
Additional Information
(continued)________________________________________________________________________________ 7. Capital resources At At At 30 June 30 June 31 December 2009 2008 1 2008 1
US$m US$m US$m
Composition of regulatory capital Tier 1 capital: Shareholders’ equity2 118,355 126,785 93,591 Minority interests 6,943 7,226 6,638 Less: Preference share premium (1,405 ) (1,405 ) (1,405 ) Preference share minority interests (2,342 ) (2,170 ) (2,110 ) Goodwill capitalised and intangible assets (28,130 ) (40,360 ) (26,861 ) Unrealised losses on available-for-sale debt securities – consolidated entities3 2,020 1,830 5,191 – de-consolidated entities3,4 16,207 7,245 16,248 Other regulatory adjustments4,5 (6,568 ) (4,083 ) (8,360 ) 50% of excess of expected losses over impairment allowances (3,375 ) (3,490 ) (2,660 )
Core equity tier 1 capital 101,705 91,578 80,272
Preference share premium 1,405 1,405 1,405 Preference share minority interests 2,342 2,170 2,110 Innovative tier 1 securities and other regulatory adjustments6 11,901 12,698 11,549
Total tier 1 capital 117,353 107,851 95,336 Tier 2 capital Reserves arising from revaluation of property and unrealised gains on available-for-sale equities 2,250 2,768 1,726 Collective impairment allowances7 3,917 3,564 3,168 Perpetual subordinated debt 2,972 3,113 2,996 Term subordinated debt 44,027 44,036 41,204 Minority and other interests in tier 2 capital 300 300 300
Total qualifying tier 2 capital before deductions 53,466 53,781 49,394
Unconsolidated investments8 (10,568 ) (11,183 ) (9,613 ) 50% of excess of expected losses over impairment allowances (3,375 ) (3,490 ) (2,660 ) Other deductions (1,690 ) (9 ) (997 )
Total deductions other than from tier 1 capital (15,633 ) (14,682 ) (13,270 )
Total regulatory capital 155,186 146,950 131,460 Risk-weighted assets Credit and counterparty risk 962,055 1,071,482 956,596 Market risk 76,105 52,533 70,264 Operational risk 121,114 107,466 121,114
1,159,274 1,231,481 1,147,974
– 31 –

Additional Information
(continued)HSBC Holdings plc
7. Capital resources (continued) At At At 30 June 30 June 31 December 2009 2008 2008 % % % Capital Ratios
8.8 Core equity tier 1 ratio 7.4 7.0 Tier 1 ratio 10.1 8.8 8.3
13.4 Total capital ratio 11.9 11.4 1 The FSA published a definition of core equity tier 1 capital in May 2009. Comparatives have been restated
accordingly. 2 Includes externally verified profits for the half-year to 30 June 2009. 3 Under FSA rules, unrealised gains/losses on debt securities net of deferred tax must be excluded from capital
resources. 4 Relates to entities (mainly SPEs) that are not consolidated for regulatory purposes. 5 Includes removal of the fair value gains and losses, net of deferred tax, arising from the credit spreads on debt
issued by HSBC Holdings and its subsidiaries and designated at fair value. 6 Includes a tax credit adjustment in respect of the excess of expected losses over impairment allowances. 7 Under Basel II, only collective impairment allowances on loan portfolios on the standardised approach are
included in tier 2 capital. 8 Mainly comprise investments in insurance entities.
– 32 –

HSBC Holdings plc
Additional Information
(continued)________________________________________________________________________________ 8. Notes on the statement of cash flows Half-year to 30 June 30 June 31 December 2009 2008 2008 US$m US$m US$m Non-cash items included in profit before tax Depreciation, amortisation and impairment 1,153 1,766 11,601 Revaluations on investment property 43 (27 ) 119 Share-based payment expense 355 427 392 Loan impairment losses gross of recoveries 13,710 10,436 14,598 Provisions for liabilities and charges 368 107 484 Impairment of financial investments 872 418 1,361 Charge for defined benefit plans (150 ) 234 256 Accretion of discounts and amortisation of premiums (96 ) (461 ) (406 )
16,255 12,900 28,405 Change in operating assets Change in prepayments and accrued income 1,311 2,294 1,884 Change in net trading securities and net derivatives 1,922 (29,675 ) 6,382 Change in loans and advances to banks (28,458 ) 1,605 20,991 Change in loans and advances to customers (9,279 ) (76,452 ) 83,731 Change in financial assets designated at fair value (4,946 ) 2,923 9,834 Change in other assets 2,171 (1,826 ) (3,568 )
(37,279 ) (101,131 ) 119,254 Change in operating liabilities Change in accruals and deferred income (2,264 ) (4,219 ) (1,950 ) Change in deposits by banks (937 ) 20,947 (23,985 ) Change in customer accounts 46,291 63,277 (30,905 ) Change in debt securities in issue (23,494 ) (16,522 ) (50,630 ) Change in financial liabilities designated at fair value 262 (181 ) (15,171 ) Change in other liabilities 2,388 6,093 (10,167 )
22,246 69,395 (132,808 ) Cash and cash equivalents Cash and balances at central banks 56,368 13,473 52,396 Items in the course of collection from other banks 16,613 16,719 6,003 Loans and advances to banks of one month or less 157,856 244,608 165,066 Treasury bills, other bills and certificates of deposit less than three months 36,866 28,067 62,639 Less: items in the course of transmission to other banks (16,007 ) (15,329 ) (7,232 )
251,696 287,538 278,872 Interest and dividends
(16,696 ) Interest paid (31,752 ) (28,590 ) Interest received 36,975 53,945 53,074 Dividends received 835 1,339 537
– 33 –
HSBC Holdings plc
Additional Information
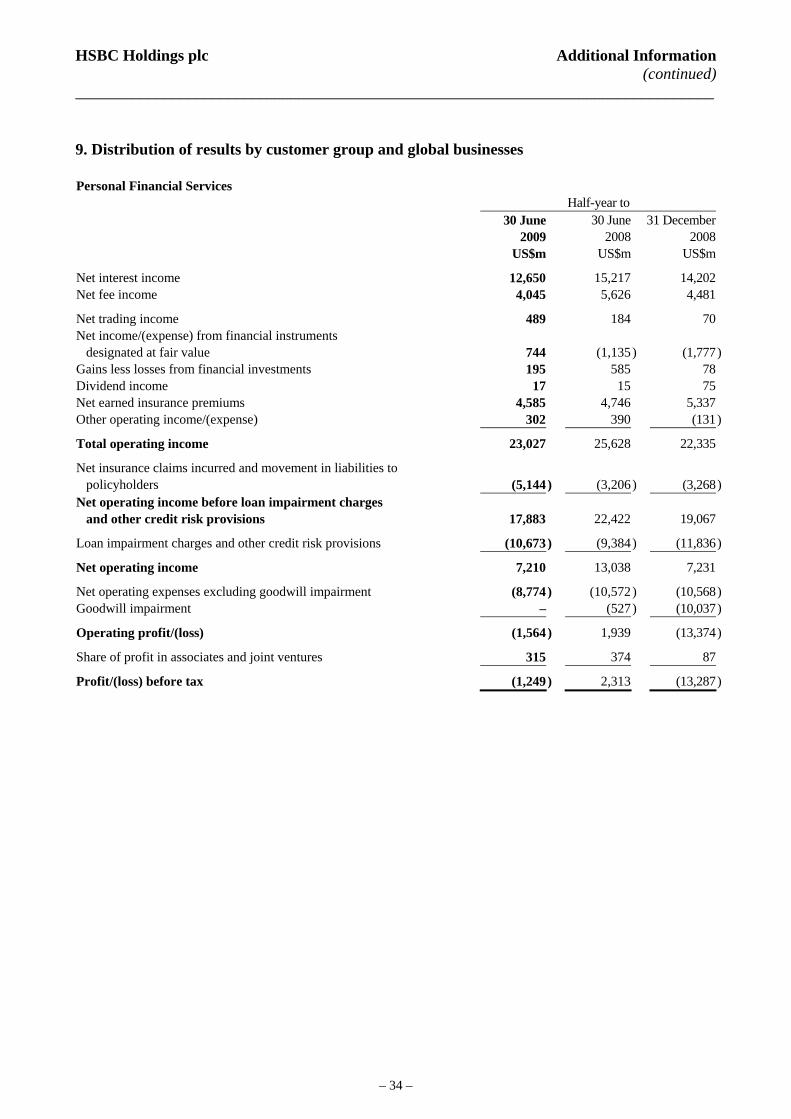
(continued)________________________________________________________________________________ 9. Distribution of results by customer group and global businesses Personal Financial Services Half-year to 30 June 30 June 31 December
2009 2008 2008 US$m US$m US$m
12,650 15,217 14,202 Net interest income 4,045 5,626 4,481 Net fee income
489 184 70 Net trading income Net income/(expense) from financial instruments
744 (1,135 ) (1,777) designated at fair value 195 585 78 Gains less losses from financial investments
17 15 75 Dividend income 4,585 4,746 5,337 Net earned insurance premiums
302 390 (131) Other operating income/(expense)
Total operating income 23,027 25,628 22,335
Net insurance claims incurred and movement in liabilities to (5,144) (3,206 ) (3,268) policyholders
Net operating income before loan impairment charges and other credit risk provisions 17,883 22,422 19,067
(10,673) (9,384 ) (11,836) Loan impairment charges and other credit risk provisions
Net operating income 7,210 13,038 7,231
(8,774) (10,572 ) (10,568) Net operating expenses excluding goodwill impairment – (527 ) (10,037) Goodwill impairment
Operating profit/(loss) (1,564) 1,939 (13,374)
315 Share of profit in associates and joint ventures 374 87
Profit/(loss) before tax (1,249) 2,313 (13,287)
– 34 –

HSBC Holdings plc
Additional Information
(continued)________________________________________________________________________________ Commercial Banking Half-year to 30 June 30 June 31 December 2009 2008 2008 US$m US$m US$m
Net interest income 3,809 4,747 4,747 Net fee income 1,749 2,165 1,932
Net trading income 194 221 165 Net expense from financial instruments designated at fair value (17) (59 ) (165) Gains less losses from financial investments 25 191 2 Dividend income 3 3 85 Net earned insurance premiums 390 360 319 Other operating income 519 718 221
Total operating income 6,672 8,346 7,306
Net insurance claims incurred and movement in liabilities to policyholders (328) (190 ) (145) Net operating income before loan impairment charges and other credit risk provisions 6,344 8,156 7,161
Loan impairment charges and other credit risk provisions (1,509) (563 ) (1,610)
Net operating income 4,835 7,593 5,551
Total operating expenses (2,740) (3,280 ) (3,301)
Operating profit 2,095 4,313 2,250
337 Share of profit in associates and joint ventures 298 333
Profit before tax 2,432 4,611 2,583
– 35 –

HSBC Holdings plc
Additional Information
(continued)________________________________________________________________________________ Global Banking and Markets Half-year to 30 June 30 June 31 December 2009 2008 2008 US$m US$m US$m
Net interest income 4,667 3,737 4,804 Net fee income 1,968 2,354 1,937
Net trading income/(expense) 4,478 633 (152) Net income/(expense) from financial instruments designated at fair value 329 (211 ) (227) Gains less losses from financial investments 158 244 (571) Dividend income 23 49 27 Net earned insurance premiums 40 62 43 Other operating income 603 551 317
Total operating income 12,266 7,419 6,178
Net insurance claims incurred and movement in liabilities to policyholders (35) (40 ) (39) Net operating income before loan impairment charges and other credit risk provisions 12,231 7,379 6,139
Loan impairment charges and other credit risk recoveries (1,732) (115 ) (1,356)
Net operating income 10,499 7,264 4,783
Total operating expenses (4,405) (4,827 ) (4,265)
Operating profit 6,094 2,437 518
204 Share of profit in associates and joint ventures 253 275
Profit before tax 6,298 2,690 793
– 36 –

HSBC Holdings plc
Additional Information
(continued)________________________________________________________________________________ Private Banking Half-year to 30 June 30 June 31 December 2009 2008 2008 US$m US$m US$m
Net interest income 784 783 829 Net fee income 602 814 662
Net trading income 163 218 204 Net income/(expense) from financial instruments designated at fair value – 1 (1) Gains less losses from financial investments (2 ) 80 (16) Dividend income 2 4 4 Other operating income 40 16 33
Net operating income before loan impairment charges and other credit risk provisions 1,589 1,916 1,715
Loan impairment charges and other credit risk provisions (14) 4 (72)
Net operating income 1,575 1,920 1,643
Total operating expenses (949) (1,098 ) (1,018)
Operating profit 626 822 625
6 Share of profit in associates and joint ventures – –
Profit before tax 632 822 625
– 37 –

HSBC Holdings plc
Additional Information
(continued)________________________________________________________________________________ Other Half-year to 30 June 30 June 31 December 2009 2008 2008 US$m US$m US$m
Net interest expense (551) (375 ) (581) Net fee income 64 32 21
Net trading income/(expense) 110 (353 ) (177) Changes in fair value of long-term debt issued and related derivatives (2,300) 577 6,102 Net income/(expense) from other financial instruments designated at fair value (279) 243 504
Net income/(expense) from financial instruments designated at fair value (2,579) 820 6,606
Gains less losses from financial investments (53) (283 ) (113) Dividend income 12 17 (7) Net earned insurance premiums (3 ) (15 ) (2) Gain on disposal of French regional banks – – 2,445 Other operating income 2,172 1,943 2,318
Total operating income (828) 1,786 10,510
Net insurance claims incurred and movement in liabilities to policyholders – (1 ) – Net operating income before loan impairment charges and other credit risk provisions (828) 1,785 10,510
Loan impairment charges and other credit risk provisions (3 ) – (5)
Net operating income/(expense) (831) 1,785 10,505
Total operating expenses (2,268) (2,019 ) (2,155)
Operating profit/(loss) (3,099) (234 ) 8,350
5 Share of profit/(loss) in associates and joint ventures 45 (4)
Profit/(loss) before tax (3,094) (189 ) 8,346
– 38 –

HSBC Holdings plc
Additional Information
(continued)________________________________________________________________________________ 10. Geographical distribution of results Europe Half-year to 30 June 30 June 31 December 2009 2008 2008 US$m US$m US$m
Interest income 10,673 18,126 16,991 Interest expense (4,695) (13,651 ) (11,770)
Net interest income 5,978 4,475 5,221
Fee income 3,998 5,666 4,559 Fee expense (1,155) (1,443 ) (1,290)
Net fee income 2,843 4,223 3,269
Net trading income 3,429 3,649 1,708
Changes in fair value of long-term debt issued and related derivatives (788) 207 2,732 Net income/(expense) from other financial instruments designated at fair value 212 (866 ) (960) Net income/(expense) from financial instruments designated at fair value (576) (659 ) 1,772
Gains less losses from financial investments (60) 608 (190) Dividend income 13 20 110 Net earned insurance premiums 2,134 2,286 3,013 Gains on disposal of French regional banks – – 2,445 Other operating income 976 1,427 669
Total operating income 14,737 16,029 18,017
Net insurance claims incurred and movement in liabilities to policyholders (2,383) (1,388 ) (1,979) Net operating income before loan impairment charges and other credit risk provisions 12,354 14,641 16,038
Loan impairment charges and other credit risk provisions (2,813) (1,272 ) (2,482)
Net operating income 9,541 13,369 13,556
Total operating expenses (6,587) (8,193 ) (7,879)
Operating profit 2,954 5,176 5,677
Share of profit in associates and joint ventures 22 1 15
Profit before tax 2,976 5,177 5,692
– 39 –
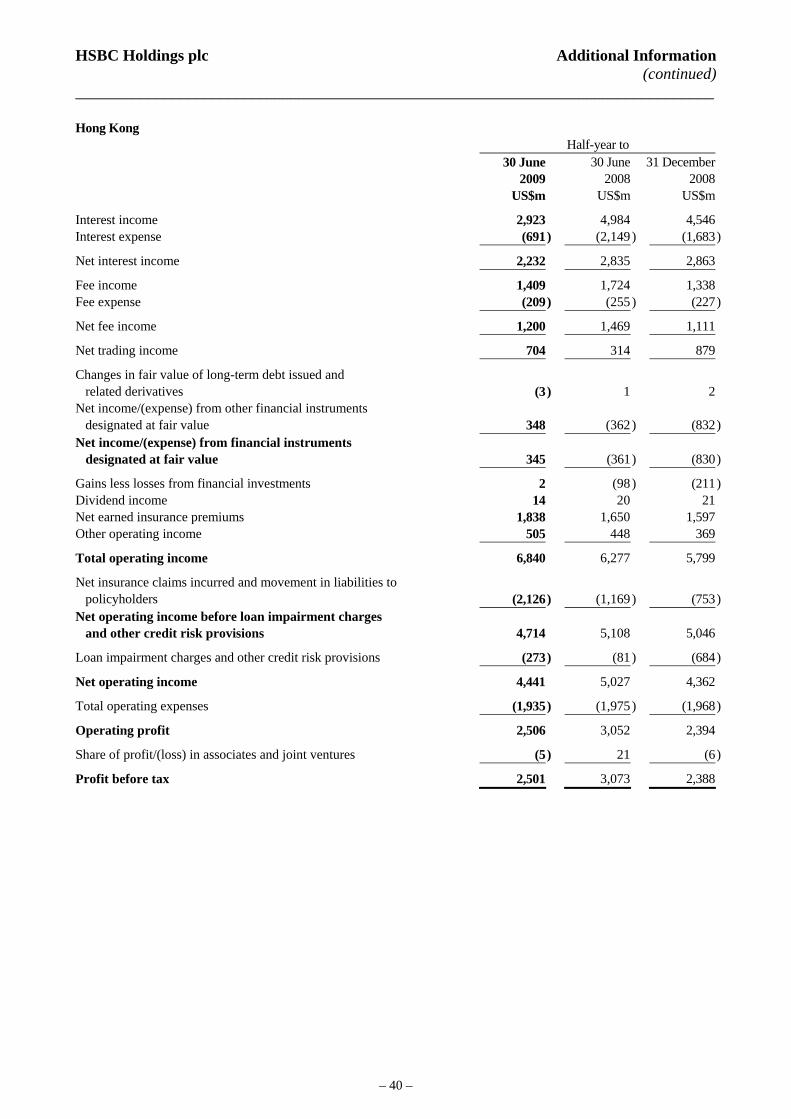
HSBC Holdings plc
Additional Information
(continued)________________________________________________________________________________ Hong Kong Half-year to 30 June 30 June 31 December 2009 2008 2008 US$m US$m US$m
Interest income 2,923 4,984 4,546 Interest expense (691) (2,149 ) (1,683)
Net interest income 2,232 2,835 2,863
Fee income 1,409 1,724 1,338 Fee expense (209) (255 ) (227)
Net fee income 1,200 1,469 1,111
Net trading income 704 314 879
Changes in fair value of long-term debt issued and related derivatives (3) 1 2 Net income/(expense) from other financial instruments designated at fair value 348 (362 ) (832) Net income/(expense) from financial instruments designated at fair value 345 (361 ) (830)
Gains less losses from financial investments 2 (98 ) (211) Dividend income 14 20 21 Net earned insurance premiums 1,838 1,650 1,597 Other operating income 505 448 369
Total operating income 6,840 6,277 5,799
Net insurance claims incurred and movement in liabilities to policyholders (2,126) (1,169 ) (753) Net operating income before loan impairment charges and other credit risk provisions 4,714 5,108 5,046
Loan impairment charges and other credit risk provisions (273) (81 ) (684)
Net operating income 4,441 5,027 4,362
Total operating expenses (1,935) (1,975 ) (1,968)
Operating profit 2,506 3,052 2,394
Share of profit/(loss) in associates and joint ventures (5) 21 (6)
Profit before tax 2,501 3,073 2,388
– 40 –

HSBC Holdings plc
Additional Information
(continued)________________________________________________________________________________ Rest of Asia-Pacific Half-year to 30 June 30 June1 31 December1 2009 2008 2008 US$m US$m US$m
Interest income 3,025 4,612 4,453 Interest expense (1,257) (2,693 ) (2,435)
Net interest income 1,768 1,919 2,018
Fee income 908 1,323 1,092 Fee expense (189) (319 ) (229)
Net fee income 719 1,004 863
Net trading income 909 1,090 952
Changes in fair value of long-term debt issued and related derivatives (2) – 1 Net income/(expense) from other financial instruments designated at fair value 31 (88 ) (84) Net income/(expense) from financial instruments designated at fair value 29 (88 ) (83)
Gains less losses from financial investments (21) 24 – Dividend income 1 1 1 Net earned insurance premiums 152 114 83 Other operating income 608 475 580
Total operating income 4,165 4,539 4,414
Net insurance claims incurred and movement in liabilities to policyholders (156) (4 ) 32 Net operating income before loan impairment charges and other credit risk provisions 4,009 4,535 4,446
Loan impairment charges and other credit risk provisions (531) (328 ) (524)
Net operating income 3,478 4,207 3,922
Total operating expenses (2,151) (2,324 ) (2,380)
Operating profit 1,327 1,883 1,542
695 751 Share of profit in associates and joint ventures 546
Profit before tax 2,022 2,634 2,088 1 The Middle East is disclosed as a separate geographical region with effect from 1 January 2009. Previously, it formed part of
Rest of Asia-Pacific. Comparative data has been restated accordingly.
– 41 –

HSBC Holdings plc
Additional Information
(continued)________________________________________________________________________________ Middle East Half-year to 30 June 30 June1 31 December1
2009 2008 2008 US$m US$m US$m
1,217 1,135 1,316 Interest income (454) (421 ) (474) Interest expense
763 714 842 Net interest income
337 363 376 Fee income (29) (29 ) (19) Fee expense
308 334 357 Net fee income
220 239 163 Net trading income
13 9 (1) Gains less losses from financial investments 2 1 1 Dividend income
63 9 – Other operating income
Total operating income 1,369 1,306 1,362
Net operating income before loan impairment charges and other credit risk provisions 1,369 1,306 1,362
(391) (41 ) (238) Loan impairment charges and other credit risk provisions
Net operating income 978 1,265 1,124
(482) (460 ) (499) Total operating expenses
Operating profit 496 805 625
Share of profit in associates and joint ventures 147 185 131
Profit before tax 643 990 756 1 The Middle East is disclosed as a separate geographical region with effect from 1 January 2009. Previously, it formed part of
Rest of Asia-Pacific. Comparative data has been restated accordingly.
– 42 –
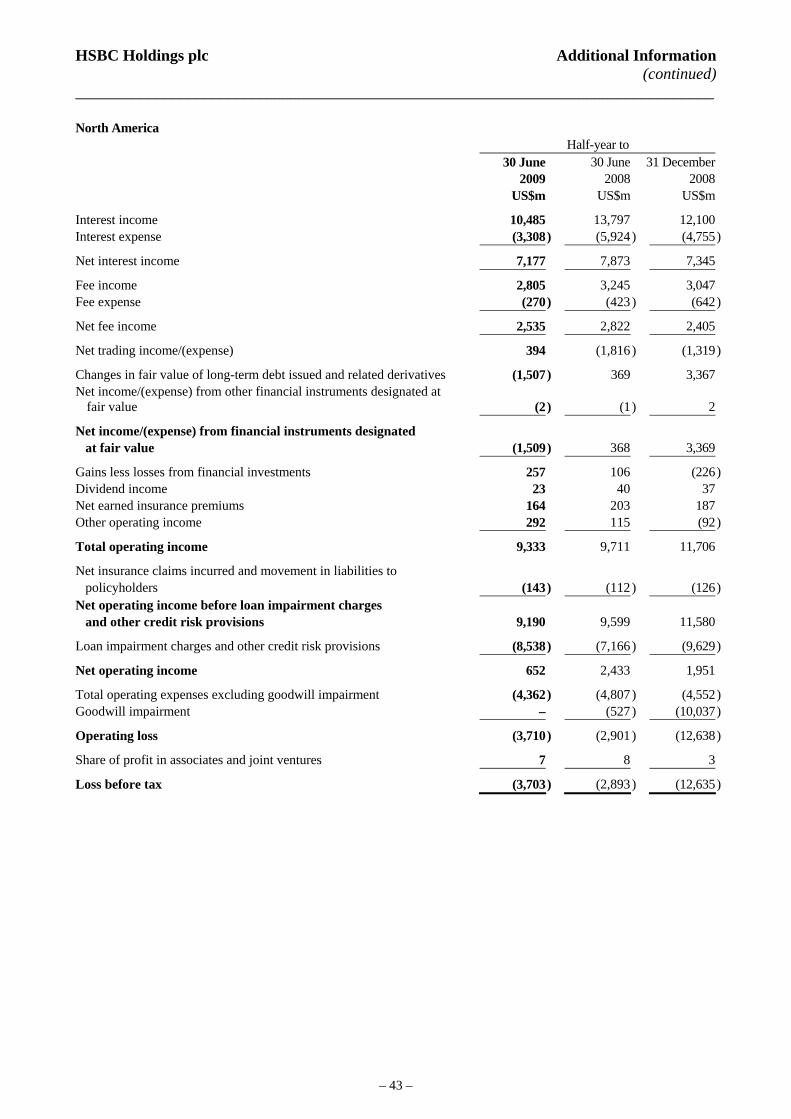
HSBC Holdings plc
Additional Information
(continued)________________________________________________________________________________ North America Half-year to 30 June 30 June 31 December 2009 2008 2008 US$m US$m US$m
Interest income 10,485 13,797 12,100 Interest expense (3,308) (5,924 ) (4,755)
Net interest income 7,177 7,873 7,345
Fee income 2,805 3,245 3,047 Fee expense (270) (423 ) (642)
Net fee income 2,535 2,822 2,405
Net trading income/(expense) 394 (1,816 ) (1,319)
Changes in fair value of long-term debt issued and related derivatives (1,507) 369 3,367 Net income/(expense) from other financial instruments designated at
fair value (2) (1 ) 2
Net income/(expense) from financial instruments designated at fair value (1,509) 368 3,369
Gains less losses from financial investments 257 106 (226) Dividend income 23 40 37 Net earned insurance premiums 164 203 187 Other operating income 292 115 (92)
Total operating income 9,333 9,711 11,706
Net insurance claims incurred and movement in liabilities to policyholders (143) (112 ) (126) Net operating income before loan impairment charges and other credit risk provisions 9,190 9,599 11,580
Loan impairment charges and other credit risk provisions (8,538) (7,166 ) (9,629)
Net operating income 652 2,433 1,951
Total operating expenses excluding goodwill impairment (4,362) (4,807 ) (4,552) Goodwill impairment – (527 ) (10,037)
Operating loss (3,710) (2,901 ) (12,638)
Share of profit in associates and joint ventures 7 8 3
Loss before tax (3,703) (2,893 ) (12,635)
– 43 –

HSBC Holdings plc
Additional Information
(continued)________________________________________________________________________________ Latin America Half-year to 30 June 30 June 31 December 2009 2008 2008 US$m US$m US$m
Interest income 4,890 5,785 5,847 Interest expense (2,270) (2,423 ) (2,751)
Net interest income 2,620 3,362 3,096
Fee income 1,060 1,418 1,298 Fee expense (237) (279 ) (270)
Net fee income 823 1,139 1,028
Net trading income 599 358 343
Changes in fair value of long-term debt issued and related derivatives – – – Net income/(expense) from other financial instruments designated at
fair value 188 156 208
Net income from financial instruments designated at fair value 188 156 208
Gains less losses from financial investments 132 168 8 Dividend income 4 6 14 Net earned insurance premiums 724 900 817 Other operating income 61 130 170
Total operating income 5,151 6,219 5,684
Net insurance claims incurred and movement in liabilities to policyholders (699) (764 ) (626) Net operating income before loan impairment charges and other credit risk provisions 4,452 5,455 5,058
Loan impairment charges and other credit risk provisions (1,385) (1,170 ) (1,322)
Net operating income 3,067 4,285 3,736
Total operating expenses (2,488) (3,023 ) (2,967)
Operating profit 579 1,262 769
1 4 2Share of profit in associates and joint ventures
Profit before tax 580 1,266 771
– 44 –

HSBC Holdings plc
Additional Information
(continued)________________________________________________________________________________ 11. Foreign currency amounts The sterling and Hong Kong dollar equivalent figures in the consolidated income statement and balance sheet are for information only. These are translated at the average rate for the period for the income statement and the closing rate for the balance sheet as follows: Half-year to 30 June 30 June 31 December 2009 2008 2008 Closing: HK$/US$ 7.750 7.800 7.750
0.605 £/US$ 0.502 0.686
7.753Average: HK$/US$ 7.797 7.787 £/US$ 0.673 0.507 0.545 12. Rights issue On 2 March 2009, HSBC Holdings announced its proposal to raise £12.5 billion (US$17.8 billion), net of expenses, by way of a fully underwritten rights issue. Under the proposal, HSBC offered its shareholders the opportunity to acquire 5 new ordinary shares for every 12 ordinary shares at a price of 254 pence per new ordinary share. For shareholders on the Hong Kong and Bermuda Overseas Branch Registers this offer was expressed in Hong Kong dollars and US Dollars respectively, fixed at published exchange rates on 27 February 2009. The proposal was subject to authorisation by the shareholders which was obtained at a general meeting held on 19 March 2009. The offer period commenced on 20 March 2009 and closed for acceptance on 3 April 2009. Dealing in the new shares began on 6 April 2009. Accounting treatment under IFRSs Although HSBC Holdings’ functional currency is the US dollar, the rights issue was substantially denominated in currencies other than US dollars, principally in sterling and Hong Kong dollars. Accordingly, under the requirements of IAS 32 paragraph 16(b)(ii), HSBC was not able to demonstrate that it was issuing a fixed number of shares for a fixed amount of cash, and would therefore be prohibited under IAS 32 from accounting for the offer of rights in shareholders’ equity. Under IAS 32, therefore, the offer of rights would be treated as a derivative financial liability. As a derivative financial liability, under IAS 39: ‘Financial Instruments: Recognition and Measurement’ (‘IAS 39’) the liability would have been measured at its fair value at inception of the offer on 20 March 2009, which is substantially the difference between the share price at that date and the issue price of 254 pence per new ordinary share. The corresponding entry on inception would have been made to shareholders’ equity. Subsequently, the liability would have been re-measured at fair value with movements in fair value recognised in the income statement until the exercise of the rights, which were exercised by 3 April 2009. On the exercise of rights the liability would have been credited to shareholders’ equity. If this accounting treatment was adopted by HSBC, a loss of US$4.7 billion would have been recognised in the income statement, which was primarily due to an increase in HSBC’s share price between 20 March 2009 and 3 April 2009. There would have been no impact on the Group’s or HSBC Holdings’ shareholders’ equity or
– 45 –

HSBC Holdings plc
Additional Information
(continued)________________________________________________________________________________ 12. Rights issue (continued) HSBC Holdings’ distributable reserves. The table below demonstrates the accounting entries for the rights issue under the accounting treatment required by IAS 32. Retained Derivative Income earnings liability statement US$m US$m US$m
Initial recognition of liability for offer of rights (9,713 ) 9,713 – – 4,747 Movement in fair value of rights (4,747 )
Exercise of rights 14,460 (14,460 ) – (4,747 ) – 4,747 Transfer to retained earnings
Effect of rights issue on retained earnings – The following table shows the impact on HSBC’s profit before tax, profit/(loss) for the period and profit/(loss) attributable to shareholders of the parent company if the offer of rights was classified as either a liability, as required by IAS 32, or an equity instrument, as reported. Half-year to 30 June 2009 Equity instrument
Liability (as instrument reported ) US$m US$m
Profit before tax 272 5,019 Profit/(loss) for the period (1,014 ) 3,733 Profit/(loss) attributable to shareholders of the parent company (1,400 ) 3,347 The following table shows the effect on HSBC’s basic and diluted earnings per share if the rights issue was accounted for as either a liability or equity instrument:
Half-year to 30 June 2009
Liability instrument Half year to 30 June 2009
Equity instrument (as reported) Number of Amount Number of Amount Loss1 shares2 per share Profit1 shares2 per share US$m (millions) US$ US$m (millions) US$
Pre-rights issue (1,534) 11,994 (0.13) 3,213 11,994 0.27Effect of rights issue 3,359 3,359
Post-rights issue (basic) (1,534) 15,353 (0.10) 3,213 15,353 0.21
Effect of dilutive ordinary shares 52 52
(1,534) 15,405 (0.10) 3,213 15,405 Post-rights issue (diluted) 0.21 1 Profit/(loss) attributable to shareholders of the parent company less dividends and coupons payable on preference
shares and capital securities, respectively, that are classified as equity instruments 2 Weighted average number of ordinary shares.
– 46 –
HSBC Holdings plc Additional Information
(continued)________________________________________________________________________________ 12. Rights issue (continued) Future accounting developments On 21 July 2009, following a recommendation from the IFRIC that IAS 32 be urgently amended, the IASB discussed this matter. As a result of that meeting, the Directors expect that an Exposure Draft will be issued by the IASB to amend IAS 32, such that, if adopted, IAS 32 would require rights issues such as HSBC’s rights issue to be accounted for as equity instruments rather than derivative financial liabilities. The Exposure Draft is expected to be published for comment in August 2009. If adopted, the resulting amendment to IAS 32 is expected to apply retrospectively, and is expected to be available for financial statements with periods ending 31 December 2009. Fair presentation In the opinion of the Directors, accounting for the rights issue in accordance with the requirements of IAS 32 as set out above would be so misleading that it would conflict with the objective of financial statements set out in the IASB’s framework. The Directors concluded that the application of IAS 32 to the rights issue would not result in a fair representation of the transaction it purports to represent, and consequently would be likely to influence economic decisions made by users of the financial statements. The Directors therefore have concluded that compliance with this specific requirement would be so misleading that the interim consolidated financial statements would not present fairly the Group’s financial position, financial performance and cash flows. In making this determination, the Directors noted that the offer of rights had been made on equal terms, so far as legal requirements permit, to all ordinary shareholders in the currency in which their shares are denominated, and that in essence the transaction is one with existing ordinary shareholders, such that it would reasonably be expected to have no effect on the profit or loss attributable to ordinary shareholders for the accounting period. The principal factor which, under the requirements of IFRSs, determined the movement in the liability over the offer period was the movement in the HSBC share price; therefore the accounting treatment under IAS 32 would have resulted in amounts being recognised in the income statement in respect of a transaction with existing ordinary shareholders, and which are primarily caused by movements in the HSBC share price. Furthermore, the Directors noted that the financial effect of this accounting treatment is material in terms of its amount, and would cause a profit attributable to shareholders to become a loss attributable to shareholders. They therefore concluded that this was a fundamental consideration in understanding the financial performance of the Group, such that the interim consolidated financial statements prepared in accordance with the specific requirements of IAS 32 as set out above would not be fairly presented and would not give a true and fair view of the Group’s financial position, financial performance and cash flows. Accordingly, HSBC has accounted for the offer of rights as an equity instrument, and has therefore not re-measured this instrument during the offer period. HSBC has therefore accounted for the offer of rights in the same way that IAS 32 would require for an offer of rights in new shares denominated in the functional currency of the issuer. Following the exercise of the rights and the allotment of new shares, the cash proceeds of the rights issue were recognised in shareholders’ equity.
– 47 –

HSBC Holdings plc Additional Information(continued)
________________________________________________________________________________ 12. Rights issue (continued) Share capital Movement on HSBC Holdings share capital
Number US$m
At 1 January 2009 12,105,265,082 6,0535,060,239,065 2,530Shares issued in respect of rights issue
347,892 –Shares issued under HSBC employee share plans 148,790,530 75Shares issued in lieu of dividends
17,314,642,569 At 30 June 2009 8,658 Merger reserve As part of the arrangement for the rights issue, HSBC Holdings entered into a share-for-share exchange with Chinnery Limited, thereby availing itself of Statutory Share Premium Relief under Section 612 of the Companies Act 2006. The nominal value of the new shares issued was credited to share capital and the remaining consideration was credited to the merger reserve and translated into US dollars at the foreign exchange rate on that date. Share options and share awards The Remuneration Committee agreed to make adjustments to all unexercised share options and share awards under HSBC’s various share plans and share schemes as a consequence of the rights issue. The adjustments were based on the theoretical ex-rights price, which was considered to be the most appropriate methodology to reflect the rights issue. The adjustments under certain share plans and share schemes have been approved by the relevant tax authorities, where necessary.
– 48 –

HSBC Holdings plc Additional Information
(continued)________________________________________________________________________________ 13. Litigation HSBC is party to legal actions in a number of jurisdictions including the UK, Hong Kong and the US, arising out of its normal business operations. HSBC considers that none of the actions is material, and none is expected to result in a significant adverse effect on the financial position of HSBC, either individually or in the aggregate. Management believes that adequate provisions have been made in respect of such litigation. HSBC has not disclosed any contingent liability associated with these legal actions because it is not practicable to do so, except as set out below. On 27 July 2007, the UK Office of Fair Trading (‘OFT’) issued High Court legal proceedings against a number of UK financial institutions, including HSBC Bank plc, to determine the legal status and enforceability of certain of the charges applied to their personal customers in relation to unauthorised overdrafts (the ‘charges’). The OFT has been investigating the fairness of the charges. Pending the resolution of the proceedings, the Financial Services Authority (‘FSA’) has granted firms (including HSBC Bank plc) a Waiver enabling them to place relevant complaints about the charges on hold and the County Courts have stayed all individual customer claims. Court judgements given to date have confirmed that HSBC Bank plc’s current and historic charges do not constitute penalties but are capable of being tested for fairness. HSBC Bank plc (and all the other financial institutions involved in the legal proceedings) has appealed this latter finding to the House of Lords and that appeal took place from 23-25 June 2009. Judgement is awaited. A wide range of outcomes of the legal proceedings is possible, depending upon the result of the appeal to the House of Lords and, if the charges are assessable, upon the outcome of the OFT’s investigation and the Court’s final assessment of the fairness of each charge across the period under review. Since July 2001, there have been a variety of charges applied by HSBC Bank plc across different charging periods under the then existing contractual arrangements. If, contrary to HSBC Bank plc’s current assessment, a final decision is reached in the case that results in a liability for HSBC Bank plc, a large number of different outcomes is possible, each of which would have a different financial impact. Given that the OFT’s investigation is ongoing, and that there is limited authority on how an assessment of fairness should be conducted and how any entitlement of customers to redress (following any finding of unfairness) should be calculated, HSBC Bank plc does not consider it practicable to provide a reliable estimate of the potential financial impact of an adverse decision. In both ‘A Better Deal for Consumers’, a White Paper presented to Parliament by the Secretary of State for Business Innovation and Skills on 2 July 2009, and ‘Reforming Financial Markets’, a White Paper presented to Parliament by the Chancellor of the Exchequer on 8 July 2009, specific reference was made to the OFT’s case on bank charges which, it was noted, could take several years to resolve. In both Papers, the Government called on the regulators and the banks to explore whether there is a quicker way of resolving consumer complaints about the charges than pursuing further litigation, which would also provide the certainty that regulators and banks need. HSBC Bank plc considers the charges to be and to have been fair, valid and enforceable, and intends strongly to defend its position through the Court process.
– 49 –
HSBC Holdings plc Additional Information
(continued)________________________________________________________________________________ 13. Litigation (continued) On 11 December 2008, Bernard L. Madoff (‘Madoff’) was arrested and charged in the United States District Court for the Southern District of New York with one count of securities fraud. That same day, the US Securities and Exchange Commission (‘SEC’) filed securities fraud charges against Madoff and his firm Bernard L. Madoff Investment Securities LLC (‘Madoff Securities’), a broker dealer and investment advisor registered with the SEC. The criminal complaint and SEC complaint each alleged that Madoff had informed senior Madoff Securities employees, in substance, that his investment advisory business was a fraud. On 15 December 2008, on the application of the Securities Investor Protection Corporation, the United States District Court for the Southern District of New York appointed a trustee for the liquidation of the business of Madoff Securities, and removed the liquidation proceeding to the United States Bankruptcy Court for the Southern District of New York. On 9 February 2009, on Madoff’s consent, the United States District Court for the Southern District of New York entered a partial judgement in the SEC action, permanently enjoining Madoff from violating certain antifraud provisions of the US securities laws, ordering Madoff to pay disgorgement, prejudgement interest and a civil penalty in amounts to be determined at a later time, and continuing certain other relief previously imposed, including a freeze on Madoff’s assets. On 12 March 2009, Madoff pleaded guilty to 11 felony charges, including securities fraud, investment adviser fraud, mail fraud, wire fraud, three counts of money laundering, false statements, perjury, false filings with the SEC, and theft from an employee benefit plan. On 29 June 2009, Madoff was sentenced to 150 years in prison. The relevant US authorities are continuing their investigations into the fraud. There remains significant uncertainty as to the facts of the fraud and the total amount of assets that will ultimately be available for distribution by the Madoff Securities trustee. Various non-US HSBC group companies provide custodial, administration and similar services to a number of funds incorporated outside the United States of America whose assets were invested with Madoff Securities. Based on information provided by Madoff Securities, as at 30 November 2008, the aggregate net asset value of these funds (which would include principal amounts invested and unrealised gains) was US$8.4 billion. Proceedings concerning Madoff and Madoff Securities have been issued by different plaintiffs (including funds, fund investors, and the Madoff Securities trustee) in various jurisdictions against numerous defendants and HSBC expects further proceedings to be brought. Various HSBC group companies have been named as defendants in suits in the United States, Ireland, Luxembourg, and other jurisdictions. All of the cases where HSBC group companies are named as a defendant are at a very early stage. HSBC considers that it has good defenses to these claims and will continue to defend them vigorously. HSBC is unable reliably to estimate the liability, if any, that might arise as a result of such claims. Various HSBC group companies have also received requests for information from various regulatory and law enforcement authorities, and from the Madoff Securities trustee, in connection with the fraud by Madoff. HSBC group companies are co-operating with these requests for information.
– 50 –

HSBC Holdings plc
Additional Information
(continued)________________________________________________________________________________ 14. Events after the balance sheet date A second interim dividend for the financial year ending 31 December 2009 of US$0.08 per ordinary share (US$1,386 million) (2008: US$0.18 per ordinary share, US$2,161 million) was declared by the Directors after 30 June 2009. The second interim dividend will be payable on 7 October 2009 to holders of ordinary shares on the Register at the close of business on 21 August 2009. 15. Forward-looking statements This media release contains certain forward-looking statements with respect to the financial condition, results of operations and business of HSBC. These forward-looking statements represent HSBC’s expectations or beliefs concerning future events and involve known and unknown risks and uncertainty that could cause actual results, performance or events to differ materially from those expressed or implied in such statements. Certain statements, such as those that include the words ‘potential’, ‘estimated’, and similar expressions or variations on such expressions may be considered ‘forward-looking statements’. 16. Statutory accounts The information in this media release does not constitute statutory accounts within the meaning of Section 435 of the Companies Act 2006. The Interim Report 2009 was approved by the Board of Directors on 3 August 2009. The statutory accounts for the year ended 31 December 2008 have been delivered to the Registrar of Companies in England and Wales in accordance with Section 242 of the Companies Act 1985. The auditor has reported on those accounts. Its report was unqualified and did not contain a statement under Section 237(2) or (3) of the Companies Act 1985. The information in this media release does not constitute the unaudited interim consolidated financial statements which are contained in the Interim Report 2009. The unaudited interim consolidated financial statements have been reviewed by the Company’s auditor, KPMG Audit Plc, in accordance with the guidance contained in Bulletin 1999/4: Review of interim financial information issued by the Auditing Practices Board. On the basis of its review, KPMG Audit Plc was not aware of any material modifications that should be made to the unaudited consolidated financial statements as presented for the six months ended 30 June 2009 in the Interim Report to the shareholders. The full report of its review is included in the Interim Report 2009. 17. Dealings in HSBC Holdings plc shares Except for dealings as intermediaries by HSBC Bank plc, HSBC Financial Products (France) and The Hongkong and Shanghai Banking Corporation Limited, which are members of a European Economic Area exchange, neither HSBC Holdings plc nor any subsidiary undertaking has bought, sold or redeemed any securities of HSBC Holdings plc during the six months ended 30 June 2009.
– 51 –

HSBC Holdings plc
Additional Information
(continued)________________________________________________________________________________ 18. Registers of shareholders The Overseas Branch Register of shareholders in Hong Kong will be closed for one day, on Friday 21 August 2009. Any person who has acquired shares registered on the Hong Kong Overseas Branch Register but who has not lodged the share transfer with the Hong Kong Overseas Branch Registrar should do so before 4.00pm on Thursday 20 August 2009 in order to receive the second interim dividend for 2009, which will be payable on 7 October 2009. Transfers may not be made to or from the Hong Kong Overseas Branch Register while that Branch Register is closed. Any person who has acquired shares registered on the Principal Register in the United Kingdom or on the Bermuda Overseas Branch Register of shareholders but who has not lodged the share transfer with the Principal Registrar or the Bermuda Overseas Branch Registrar respectively, should do so before 4.00pm on Friday 21 August 2009 in order to receive the dividend. Transfers of American Depositary Shares should be lodged with the depositary by 12 noon on Friday 21 August 2009 in order to receive the dividend. 19. Proposed interim dividends for 2009 The Board has adopted a policy of paying quarterly dividends on the ordinary shares. Under this policy it is intended to have a pattern of three equal interim dividends with a variable fourth interim dividend. The proposed timetables for dividends payable on the ordinary shares in respect of 2009 that have not yet been declared are: Third interim
dividend for 2009 Fourth interim
dividend for 2009
Announcement 2 November 2009 1 March 2010
Shares quoted ex-dividend in London, Hong Kong, Paris and Bermuda 18 November 2009 17 March 2010
ADSs quoted ex-dividend in New York 18 November 2009 17 March 2010
Record date in Hong Kong 19 November 2009 18 March 2010
Record date in London, New York, Paris and Bermuda* 20 November 2009 19 March 2010
Payment date 13 January 2010 5 May 2010 * Removals to and from the Overseas Branch Register of shareholders in Hong Kong will not be permitted on these
dates. 20. Final results The results for the year to 31 December 2009 will be announced on 1 March 2010.
– 52 –

HSBC Holdings plc Additional Information
(continued)________________________________________________________________________________ 21. Corporate governance HSBC is committed to high standards of corporate governance. HSBC Holdings has complied throughout the six months to 30 June 2009 with the applicable code provisions of the Combined Code on Corporate Governance issued by the Financial Reporting Council and the Code on Corporate Governance Practices in Appendix 14 to the Rules Governing the Listing of Securities on The Stock Exchange of Hong Kong Limited. The Board of HSBC Holdings has adopted a code of conduct for transactions in HSBC Group securities by Directors. The code of conduct complies with The Model Code in the Listing Rules of the Financial Services Authority and with The Model Code for Securities Transactions by Directors of Listed Issuers (‘Hong Kong Model Code’) set out in the Rules Governing the Listing of Securities on The Stock Exchange of Hong Kong Limited, save that The Stock Exchange of Hong Kong Limited has granted certain waivers from strict compliance with the Hong Kong Model Code. The waivers granted by The Stock Exchange of Hong Kong Limited primarily take into account accepted practices in the UK, particularly in respect of employee share plans. Following specific enquiry, each Director has confirmed he or she has complied with the code of conduct for transactions in HSBC Group securities throughout the period. There have been no material changes to the information disclosed in the Annual Report and Accounts 2008 in respect of the number and remuneration of employees, remuneration policies and share option plans.
The Directors of HSBC Holdings plc as at the date of this announcement are: S K Green, M F Geoghegan, S A Catz†, V H C Cheng, M K T Cheung†, J D Coombe†, J L Durán†, R A Fairhead†, D J Flint, A A Flockhart, W K L Fung*, S T Gulliver, J W J Hughes-Hallett†, W S H Laidlaw†, J R Lomax†, Sir Mark Moody-Stuart†, G Morgan†, N R N Murthy†, S M Robertson†, J L Thornton† and Sir Brian Williamson†.
* Non-executive Director † Independent non-executive Director
The Group Audit Committee has reviewed the results for the six months to 30 June 2009.
– 53 –
– 54 –
HSBC Holdings plc
Additional Information
(continued)________________________________________________________________________________ 22. Interim Report The Interim Report 2009 will be mailed to shareholders on or about 14 August 2009. Copies of the Interim Report and this Media Release may be obtained from Group Communications, HSBC Holdings plc, 8 Canada Square, London E14 5HQ, United Kingdom; Group Communications (Asia), The Hongkong and Shanghai Banking Corporation Limited, 1 Queen’s Road Central, Hong Kong; Internal Communications, HSBC-North America, 26525 N Riverwoods Boulevard, Mettawa, Illinois 60045, USA; or from the HSBC Group website www.hsbc.com. A Chinese translation of the Interim Report 2009 may be obtained on request from Computershare Hong Kong Investor Services Limited, Hopewell Centre, Rooms 1806-07, 18th Floor, 183 Queen’s Road East, Hong Kong. The Interim Report 2009 will be available on the Stock Exchange of Hong Kong’s website www.hkex.com.hk. 23. For further information contact: Group Management Office - London Richard Beck Director of Group Communications Telephone: +44 (0)20 7991 0633
Richard Lindsay Head of Media Relations Telephone: +44 (0)20 7992 1555
Patrick McGuinness Head of Group Press Office Telephone: +44 (0)20 7991 0111
Alastair Brown Manager Investor Relations Telephone: +44 (0)20 7992 1938
Hong Kong David Hall Head of Group Communications (Asia) Telephone: +852 2822 1133
Gareth Hewett Deputy Head of Group Communications (Asia) Telephone: +852 2822 4929
Chicago Lisa Sodeika Executive Vice President Corporate Affairs Telephone: +1 224 544 3299
Paris Chantal Nedjib Director of Communications Telephone: +33 1 40 70 7729
Gilberte Lombard Investor Relations Director Telephone: +33 1 40 70 2257
An interview with Michael Geoghegan, Group Chief Executive, and Douglas Flint, Group Finance Director, is available in video, audio and text on hsbc.com and cantos.com. By Order of the Board R G Barber Group Company Secretary 3 August 2009