Embed Size (px)
Citation preview
A monthly research report from the EBRI Education and Research Fund © 2014 Employee Benefit Research Institute
June 2014 • No. 400
HSA Balances, Contributions, Distributions, and Other Vital Statistics—A First Look at Data from the EBRI HSA Database on the 10th Anniversary of the HSA By Paul Fronstin, Ph.D., Employee Benefit Research Institute
A T A G L A N C E
The EBRI HSA Database contains data collected from various HSA providers on 1.5 million accounts with total assets of $2.7 billion as of December 31, 2013. This Issue Brief is the first annual report drawing on cross-sectional data from the EBRI HSA Database. It examines account balances, individual and employer contributions, annual distributions, deductibles and type of coverage when the HSA was opened, and account- owner demographics for 2013.
This year marks the 10th anniversary of the creation of health savings accounts (HSAs) under the Medicare Prescription Drug, Improvement, and Modernization Act of 2003.
Starting from scratch a decade ago, enrollment in HSA-eligible health plans is estimated to range from 15.5 mil-lion to 20.4 million policyholders and their dependents, and it has also been estimated that there are 10.7 mil-lion accounts holding $19.3 billion in assets as of Dec. 31, 2013. Seventy percent of HSAs were opened since 2011.
The average HSA balance at the end of 2013 was $1,766, up from $1,280 at the beginning of the year. Average account balances increased with the age of the owner of the account. Account balances averaged $697 for owners under age 25 and $4,460 for owners ages 65 and older.
HSAs with either individual or employer contributions accounted for 69 percent of all accounts and 87 percent of the assets. Six percent of these accounts ended the year with a zero balance.
On average, individuals who made contributions deposited $2,032 to their account. HSAs receiving employer contributions received $1,184, on average.
Four-fifths of HSAs with a contribution also had a distribution for a health care claim during 2013.
Among HSAs with claims, the average amount distributed for health care claims was $1,953.
Distributions for health care claims increased with age, with the exception of those ages 65 and older. Average annual distributions were $667 for account owners under age 25; $2,335 for account owners ages 55–64; and $2,017 for account owners ages 65 and older. Average annual distributions were higher for accounts that were older. However, the likelihood of taking a distribution for health care claims was higher among accounts opened more recently.
HSAs are likely to keep growing: It is expected that 30 percent of larger employers will offer an HSA-eligible health plan or HRA as the only plan option by 2015.
ebri.org Issue Brief • June 2014 • No. 400 2
Paul Fronstin is director of the Health Research and Education Program at the Employee Benefit Research Institute (EBRI). This Issue Brief was written with assistance from the Institute’s research and editorial staffs. Any views expressed in this report are those of the author and should not be ascribed to the officers, trustees, or other sponsors of EBRI, EBRI-ERF, or their staffs. Neither EBRI nor EBRI-ERF lobbies or takes positions on specific policy proposals. EBRI invites comment on this research.
Suggested citation: Paul Fronstin, “HSA Balances, Contributions, Distributions, and Other Vital Statistics—A First Look at Data from the EBRI HSA Database on the 10th Anniversary of the HSA.” EBRI Issue Brief, no. 400 (June 2014).
Copyright Information: This report is copyrighted by the Employee Benefit Research Institute (EBRI). It may be used without permission but citation of the source is required.
Report availability: This report is available on the Internet at www.ebri.org
Table of Contents Introduction .......................................................................................................................................................... 5
What is an HSA? .................................................................................................................................................... 5
Eligibility ........................................................................................................................................................... 5
Contributions ..................................................................................................................................................... 6
Distributions ...................................................................................................................................................... 6
Archer Medical Savings Accounts ........................................................................................................................ 6
Rollovers ........................................................................................................................................................... 6
Trends in HSA-Eligible Health Plan Enrollment ......................................................................................................... 6
Outlook for Enrollment ....................................................................................................................................... 7
Open Accounts .................................................................................................................................................. 7
About the EBRI HSA Database .............................................................................................................................. 10
Sources of Data ............................................................................................................................................... 10
HSA Owners by Account Status ............................................................................................................................ 10
Accounts With Contributions ............................................................................................................................. 10
Accounts Without Contributions ........................................................................................................................ 11
Summary of Average Account Activity ................................................................................................................... 11
Demographics of HSA Owners .............................................................................................................................. 11
Health Coverage Characteristics ............................................................................................................................ 11
Contributions to HSAs .......................................................................................................................................... 15
Account Status Differences ................................................................................................................................... 15
Accounts With Contributions ................................................................................................................................. 17
End-of- Year 2013 Account Balances ..................................................................................................................... 19
Distributions ........................................................................................................................................................ 20
Conclusion .......................................................................................................................................................... 24
References .......................................................................................................................................................... 29
Endnotes ............................................................................................................................................................ 29
ebri.org Issue Brief • June 2014 • No. 400 3
Figures Figure 1, Statutory HSA Limits, 2004–2014 .............................................................................................................. 8
Figure 2, Enrollment in HSA-Eligible Health Plans, by Presence of Account, 2007–2013 ............................................... 8
Figure 3, Percentage of Employers Offering HSA-Eligible Health Plan/HRA, by Firm Size, 2008–2013, With Projections through 2016 ............................................................................................................................................ 9
Figure 4, Distribution of HSA Owners, by Year Account Was Opened, as of 2013 ........................................................ 9
Figure 5, Distribution of HSAs by Account Status, 2013 .......................................................................................... 12
Figure 6, Summary of Average Account Activity, 2013 ............................................................................................ 12
Figure 7, Distribution of HSA Owners, by Age, 2013 ............................................................................................... 13
Figure 8, Distribution of HSA Owners, by Gender, 2013 .......................................................................................... 13
Figure 9, Distribution of HSA Owners, by Type of Coverage When Account Was Opened, as Reported in 2013 ........... 14
Figure 10, Distribution of HSA Owners, by Deductible Level When Account Was Opened, as Reported in 2013 ........... 14
Figure 11, Distribution of HSA Owners, by Deductible Level and Type of Coverage When Account Was Opened, as Reported in 2013 .................................................................................................................................... 16
Figure 12, Distribution of HSA Owners, by Level of Individual, Employer, and Total Contributions, 2013 .................... 16
Figure 13, Distribution of HSA Owners, by Various Demographics and Account Status, 2013 ..................................... 17
Figure 14, Distribution of HSA Owners, by Type of Coverage and Deductible When Account Was Opened and Account Status, 2013 ........................................................................................................................................... 18
Figure 15, Distribution of HSA Owners With Contributions, by Level of Individual, Employer, and Total Contributions, 2013 ...................................................................................................................................................... 19
Figure 16, Distribution of HSA Owners With Contributions, by Level of Individual Contributions and End-of-Year Account Balance, 2013 ......................................................................................................................................... 21
Figure 17, Distribution of HSA Owners With Contributions, by Level of Employer Contributions and End-of-Year Account Balance, 2013 ......................................................................................................................................... 21
Figure 18, Distribution of HSA Owners With Contributions, by Level of Combined Individual and Employer Contributions and End-of-Year Account Balance, 2013 ................................................................................................... 22
Figure 19, Average End-of-Year Account Balance Among Accounts With Contributions, by Age of HSA Owner, 2013 ... 22
Figure 20, Average End-of-Year Account Balance Among Accounts With Contributions, by Gender of HSA Owner, 2013 ...................................................................................................................................................... 23
Figure 21, Average End-of-Year Account Balance Among Accounts With Contributions, by Year HSA Was Opened, 2013 ............................................................................................................................................................. 23
Figure 22, Average End-of-Year Account Balance Among Accounts With Contributions, by Type of Coverage When HSA Was Opened, 2013 .................................................................................................................................. 25
ebri.org Issue Brief • June 2014 • No. 400 4
Figure 23, Average End-of-Year Account Balance Among Accounts With Contributions, by Deductible for Individual Coverage When HSA Was Opened, 2013 .................................................................................................. 25
Figure 24, Average End-of-Year Account Balance Among Accounts With Contributions, by Deductible for Family Coverage When HSA Was Opened, 2013 .................................................................................................. 26
Figure 25, Average Annual Distributions Among Accounts With Claims and the Likelihood of Having a Distribution for a Health Care Claim, by Age of HSA Owner, 2013 ........................................................................................ 26
Figure 26, Average Annual Distributions Among Accounts With Claims and the Likelihood of Having a Distribution for a Health Care Claim, by Gender of HSA Owner, 2013 ................................................................................... 27
Figure 27, Average Annual Distributions Among Accounts With Claims and the Likelihood of Having a Distribution for a Health Care Claim, by Year HSA Was Opened, 2013 .................................................................................. 27
Figure 28, Average Annual Distributions Among Accounts With Claims and the Likelihood of Having a Distribution for a Health Care Claim, by Type of Coverage When HSA Was Opened, 2013 ...................................................... 28
Figure 29, Average Annual Distributions Among Accounts With Claims and the Likelihood of Having a Distribution for a Health Care Claim, by Deductible When HSA Was Opened, 2013 ................................................................ 28
ebri.org Issue Brief • June 2014 • No. 400 5
HSA Balances, Contributions, Distributions, and Other Vital Statistics—A First Look at Data from the EBRI HSA Database on the 10th Anniversary of the HSA
By Paul Fronstin, Ph.D., Employee Benefit Research Institute
Introduction
The Medicare Prescription Drug, Improvement, and Modernization Act of 2003 (MMA) included a provision to allow individuals enrolled in certain high-deductible health plans to open and fund a health savings account (HSA), effective Jan. 1, 2004. Hence, 2014 marks the 10-year anniversary of the introduction of HSAs. Enrollment in these HSA-eligible health plans was estimated to range from 15.5 million to 20.4 million policyholders and their dependents in 2013.1 It has also been estimated that there are 10.7 million accounts holding $19.3 billion in assets as of Dec. 31, 2013.2 The number of employers expected to offer an HSA-eligible health plan, either as a health plan option or as the only health plan option, is expected to continue to increase.3
While there is a growing literature around the use of medical services and spending among individuals in HSA-eligible plans,4 data on accounts and account-owners is scant. The most recent report by America’s Health Insurance Plans (AHIP) with data on account balances, contributions, distributions, and account owner demographics was based on 2009 data.5 Devenir reports limited, aggregate data from a survey of HSA providers.6
The EBRI/Greenwald & Associates Consumer Engagement in Health Care Survey, conducted annually since 2005, collects information on enrollees in HSA-eligible health plans but relies on self-reported information regarding HSA account balances, contributions, distributions, and account-owner demographics for individuals enrolled in HSA-eligible health plans.7 As an expansion of this research, EBRI has created the EBRI HSA Database to collect a large, representative repository of administrative information about HSAs and account owners. This Issue Brief is the first annual report drawing on cross-sectional data from the EBRI HSA Database. It examines account balances, individual and employer contributions, annual distributions, deductibles and type of coverage when the HSA was opened, and account-owner demographics for 2013.
What is an HSA? A health savings account (HSA) is a tax-exempt trust or custodial account that an individual can use to pay for health care expenses. Contributions to the account are deductible from taxable income, and distributions for qualified medical expenses from the HSA are not counted as taxable income. Tax-free distributions are also allowed for certain premiums. Any interest or other capital earnings from the account build up tax free as well.
Eligibility
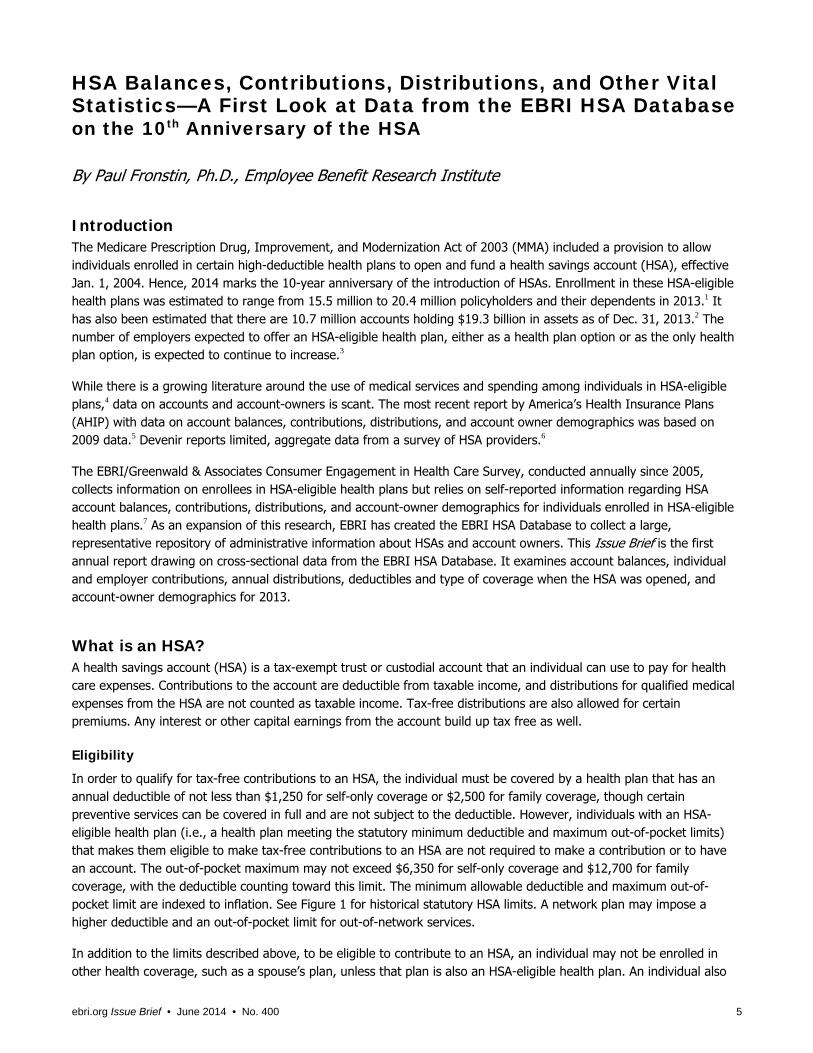
In order to qualify for tax-free contributions to an HSA, the individual must be covered by a health plan that has an annual deductible of not less than $1,250 for self-only coverage or $2,500 for family coverage, though certain preventive services can be covered in full and are not subject to the deductible. However, individuals with an HSA-eligible health plan (i.e., a health plan meeting the statutory minimum deductible and maximum out-of-pocket limits) that makes them eligible to make tax-free contributions to an HSA are not required to make a contribution or to have an account. The out-of-pocket maximum may not exceed $6,350 for self-only coverage and $12,700 for family coverage, with the deductible counting toward this limit. The minimum allowable deductible and maximum out-of-pocket limit are indexed to inflation. See Figure 1 for historical statutory HSA limits. A network plan may impose a higher deductible and an out-of-pocket limit for out-of-network services.
In addition to the limits described above, to be eligible to contribute to an HSA, an individual may not be enrolled in other health coverage, such as a spouse’s plan, unless that plan is also an HSA-eligible health plan. An individual also
ebri.org Issue Brief • June 2014 • No. 400 6
may not make an HSA contribution if he or she is claimed as a dependent on another person’s tax return. However, individuals are allowed to have supplemental coverage with deductibles below the statutory HSA-eligible health plan minimum for things such as vision care, dental care, certain specific diseases, and insurance that pays a fixed amount per day (or other stipulated period) for hospitalization. Individuals enrolled in Medicare are not eligible to make HSA contributions, although, if they have an HSA, they are able to withdraw money from it for qualified medical expenses and certain premiums.8
Contributions
Both individuals and employers are allowed to contribute to an HSA. Contributions are excluded from taxable income if made by the employer and deductible from taxable income if made by the individual account owner. The maximum annual contribution was $3,300 for individual coverage and $6,550 for family coverage in 2014, up from $3,250 for individual coverage and $6,450 for family coverage in 2013.
Additionally, individuals who have reached age 55 and are not yet enrolled in Medicare may make catch-up contributions. In 2014, a $1,000 catch-up contribution was allowed. The catch-up contribution is not currently indexed to inflation.
Distributions
Distributions from an HSA can be made at any time. An individual need not be covered by an HSA-eligible health plan to withdraw money from the HSA. Distributions are excluded from taxable income if they are used to pay for qualified medical expenses as defined under Internal Revenue Code (IRC) Sec. 213(d). Distributions for premiums for COBRA coverage, long-term care insurance, health insurance while receiving unemployment compensation, and insurance while eligible for Medicare other than for Medigap, are also tax free.
Distributions for nonqualified medical expenses are subject to regular income tax as well as a 20 percent penalty, which is waived if the owner of the HSA dies, becomes disabled, or is eligible for Medicare.
Archer Medical Savings Accounts
Prior to the availability of HSAs, Medical Savings Accounts (MSAs) were authorized as a demonstration project under the Health Insurance Portability and Accountability Act of 1996 (HIPAA). Workers were eligible to set up an MSA if employed at a firm with 50 or fewer employees. The self-employed were also eligible. Both were required to be covered by a high-deductible health plan in order to be able to contribute to an MSA. When the MMA created HSAs, existing MSAs were grandfathered, but as of Dec. 31, 2007, no new MSAs could be opened. However, individuals with an MSA were allowed to transfer those account balances to an HSA.
Rollovers
Individuals are able to roll over funds from one HSA into another without subjecting the distribution to income and penalty taxes as long as the rollover occurs within 60 days of the date funds are received.
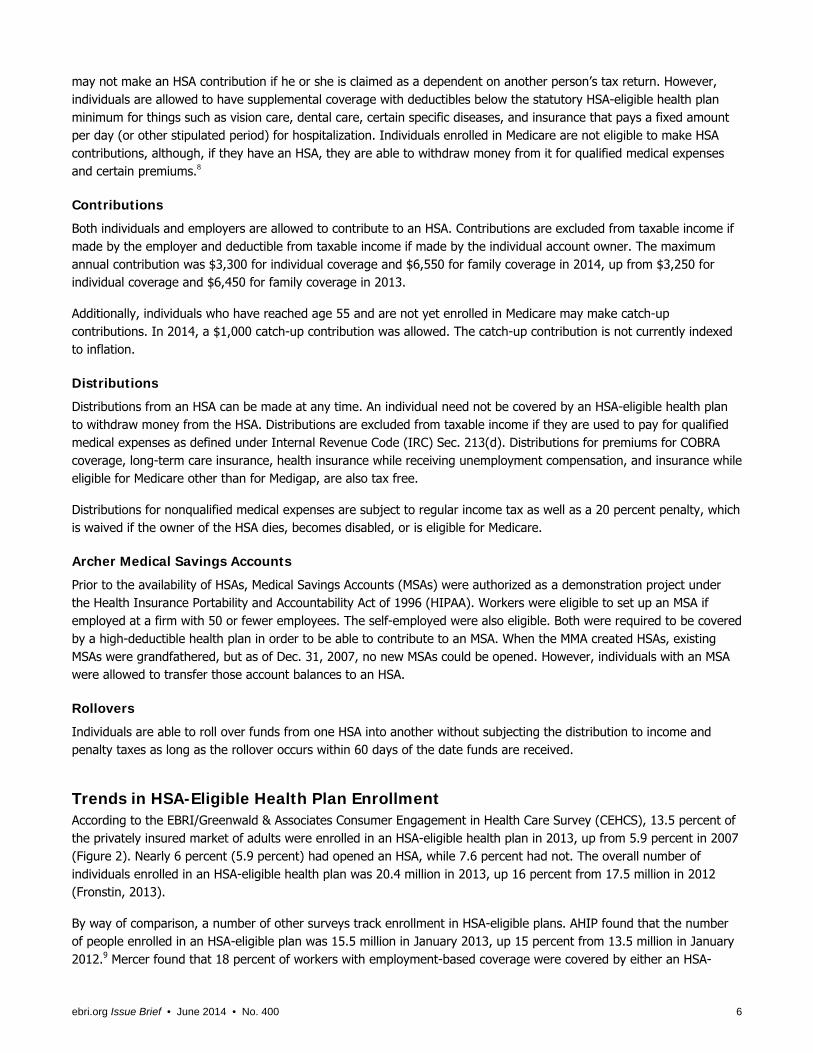
Trends in HSA-Eligible Health Plan Enrollment According to the EBRI/Greenwald & Associates Consumer Engagement in Health Care Survey (CEHCS), 13.5 percent of the privately insured market of adults were enrolled in an HSA-eligible health plan in 2013, up from 5.9 percent in 2007 (Figure 2). Nearly 6 percent (5.9 percent) had opened an HSA, while 7.6 percent had not. The overall number of individuals enrolled in an HSA-eligible health plan was 20.4 million in 2013, up 16 percent from 17.5 million in 2012 (Fronstin, 2013).
By way of comparison, a number of other surveys track enrollment in HSA-eligible plans. AHIP found that the number of people enrolled in an HSA-eligible plan was 15.5 million in January 2013, up 15 percent from 13.5 million in January 2012.9 Mercer found that 18 percent of workers with employment-based coverage were covered by either an HSA-
ebri.org Issue Brief • June 2014 • No. 400 7
eligible health plan or a health reimbursement arrangement (HRA) in 2013, up from 16 percent in 2012, a 13 percent increase.10
The increases tracked between 2012 and 2013 were similar in the CEHCS (16 percent), AHIP (15 percent), and Mercer (13 percent) surveys even though there were differences in the surveys. First, the Mercer survey combined HRA with HSA enrollment. Second, total enrollment estimates in the CEHCS were higher than AHIP’s census. The enrollment estimates in the CEHCS may have been higher for a number of reasons:
The surveys were conducted at different times. The CEHCS was conducted in August 2013, and the AHIP census was conducted in January 2013.
The AHIP census was based on 91 companies. Some insurers may not have reported HSA-eligible enrollment numbers to AHIP, which would mean that the AHIP census underestimated HSA-eligible enrollment.
The CEHCS may have overestimated the percentage of individuals in an HSA-eligible plan, as it was based on self-reported eligibility status.
In contrast to the CEHCS, AHIP, and Mercer, the National Health Interview Survey (NHIS) found that the percentage of individuals with private insurance covered by either an HSA-eligible health plan or an HRA was 10.9 percent in 2013, barely up from 10.8 percent in 2012.11 NHIS does not provide separate estimates for HSA-eligible health plan and HRA enrollees. The Kaiser Family Foundation (KFF) found that 20 percent of workers were enrolled in either an HSA-eligible health plan or HRA, up from 19 percent in 2012, a 5 percent increase.12
The detailed KFF estimates on HSAs and HRAs were different than the other surveys mentioned above. KFF found that offer rates for HSA-eligible plans fell from 26 percent to 17 percent between 2012 and 2013.13 The drop in offer rates was confined to firms with three to 199 workers and resulted in a drop in enrollment,14 but KFF also found a drop in enrollment among employers with 200‒999 workers (though the decline was not statistically significant).15 These results contrasted with AHIP’s 15 percent increase and the CEHCS’ 16 percent increase in HSA-eligible enrollment between 2012 and 2013, as well as Mercer’s 13 percent overall increase for CDHPs.
Outlook for Enrollment
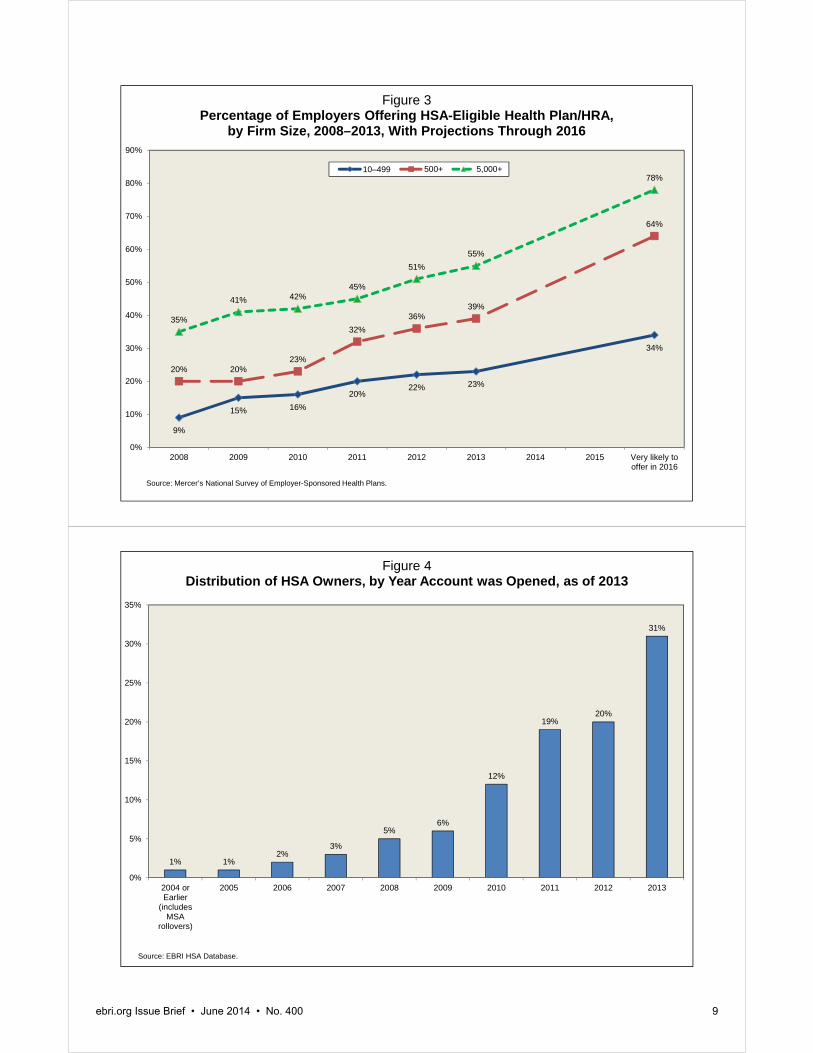
Enrollment in HSA-eligible health plans is expected to grow. According to Mercer, 23 percent of employers with 10–499 employees and 39 percent of employers with 500 or more employees offered an HSA-eligible health plan or HRA in 2013 (Figure 3). By 2016, 34 percent of employers with 10–499 employees and 64 percent of employers with 500 or more employees are very likely to offer such a health plan. It is expected that 30 percent of larger employers will offer an HSA-eligible health plan or HRA as the only plan option by 2015.16
Open Accounts
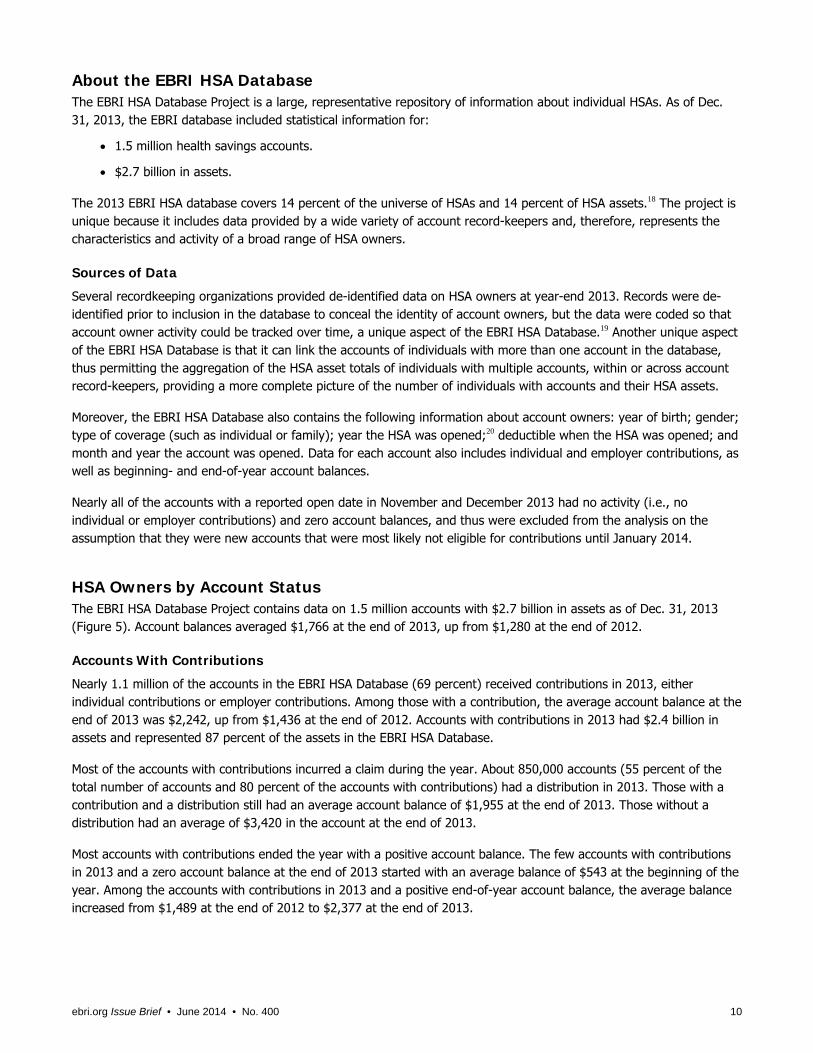
While there were somewhere between 15.5 million and 20.4 million individuals enrolled in HSA-eligible health plans in 2013, there were only 10.7 million open accounts as of Dec. 31, 2013.17 According to the EBRI HSA Database, most accounts have been opened within the past few years. Among HSAs opened prior to 2014, just over two-thirds (70 per-cent) were opened since 2011 (Figure 4). Nearly one-third (31 percent) of HSAs were opened in 2013; one-fifth (20 percent) were opened in 2012; and one-fifth (19 percent) were opened in 2011.
The number of enrollees in HSA-eligible health plans will differ from the number of accounts for various reasons. The number of enrollees is composed of the policyholder and any covered dependents, and will generally be higher than the number of accounts because one account is usually associated with a family. Hence, the number of individuals enrolled in an HSA-eligible health plan will generally be higher than the number of accounts, However, over time, the number of accounts can grow relative to the number of enrollees because when an individual or family is no longer covered by an HSA-eligible health plan, they are allowed to keep the HSA open. Furthermore, individuals and families can have more than one account.
Individual Family Individual Family Individual Family
2004 $1,000 $2,000 $2,600 $5,150 $5,000 $10,000 $500
2005 1,000 2,000 2,600 5,150 5,000 10,000 600
2006 1,050 2,100 2,700 5,450 5,250 10,500 700
2007 1,100 2,200 2,850 5,650 5,500 11,000 800
2008 1,100 2,200 2,900 5,800 5,600 11,200 900
2009 1,150 2,300 3,000 5,950 5,800 11,600 1,000
2010 1,200 2,400 3,050 6,150 5,950 11,900 1,000
2011 1,200 2,400 3,050 6,150 5,950 11,900 1,000
2012 1,200 2,400 3,100 6,250 6,050 12,100 1,000
2013 1,250 2,500 3,250 6,450 6,250 12,500 1,000
2014 1,250 2,500 3,300 6,550 6,350 12,700 1,000Source: www.treasury.gov/resource-center/faqs/taxes/pages/health-savings-accounts.aspx
Figure 1Statutory HSA Limits, 2004–2014
Per-Person catch-up contribution limit
Maximum ContributionMinimum Deductible Maximum Out-of-Pocket Limit
5.9%
4.6%
1.3%
6.5%
4.5%
2.0%
6.9%
4.9%
1.9%
7.3%
5.0%
2.3%
10.2%
6.1%
4.1%
11.2%
5.8%5.4%
13.5%
7.6%
5.9%
0%
2%
4%
6%
8%
10%
12%
14%
16%
18%
20%
Total Without Account With Account
Figure 2Enrollment in HSA-Eligible Health Plans,
by Presence of Account, 2007–2013
2007 2008 2009 2010 2011 2012 2013
Source: EBRI/Commonwealth Fund Consumerism in Health Care Survey, 2007; EBRI/Greenwald & Associates Consumer Engagement in Health Care Survey, 2008–2013.
ebri.org Issue Brief • June 2014 • No. 400 8
9%
15% 16%
20%22% 23%
34%
20% 20%23%
32%
36%39%
64%
35%
41% 42%45%
51%
55%
78%
0%
10%
20%
30%
40%
50%
60%
70%
80%
90%
2008 2009 2010 2011 2012 2013 2014 2015 Very likely tooffer in 2016
Figure 3Percentage of Employers Offering HSA-Eligible Health Plan/HRA,
by Firm Size, 2008–2013, With Projections Through 2016
10–499 500+ 5,000+
Source: Mercer’s National Survey of Employer-Sponsored Health Plans.
1% 1%2%
3%
5%6%
12%
19%20%
31%
0%
5%
10%
15%
20%
25%
30%
35%
2004 orEarlier
(includesMSA
rollovers)
2005 2006 2007 2008 2009 2010 2011 2012 2013
Figure 4Distribution of HSA Owners, by Year Account was Opened, as of 2013
Source: EBRI HSA Database.
ebri.org Issue Brief • June 2014 • No. 400 9
ebri.org Issue Brief • June 2014 • No. 400 10
About the EBRI HSA Database The EBRI HSA Database Project is a large, representative repository of information about individual HSAs. As of Dec. 31, 2013, the EBRI database included statistical information for:
1.5 million health savings accounts.
$2.7 billion in assets.
The 2013 EBRI HSA database covers 14 percent of the universe of HSAs and 14 percent of HSA assets.18 The project is unique because it includes data provided by a wide variety of account record-keepers and, therefore, represents the characteristics and activity of a broad range of HSA owners.
Sources of Data
Several recordkeeping organizations provided de-identified data on HSA owners at year-end 2013. Records were de-identified prior to inclusion in the database to conceal the identity of account owners, but the data were coded so that account owner activity could be tracked over time, a unique aspect of the EBRI HSA Database.19 Another unique aspect of the EBRI HSA Database is that it can link the accounts of individuals with more than one account in the database, thus permitting the aggregation of the HSA asset totals of individuals with multiple accounts, within or across account record-keepers, providing a more complete picture of the number of individuals with accounts and their HSA assets.
Moreover, the EBRI HSA Database also contains the following information about account owners: year of birth; gender; type of coverage (such as individual or family); year the HSA was opened;20 deductible when the HSA was opened; and month and year the account was opened. Data for each account also includes individual and employer contributions, as well as beginning- and end-of-year account balances.
Nearly all of the accounts with a reported open date in November and December 2013 had no activity (i.e., no individual or employer contributions) and zero account balances, and thus were excluded from the analysis on the assumption that they were new accounts that were most likely not eligible for contributions until January 2014.
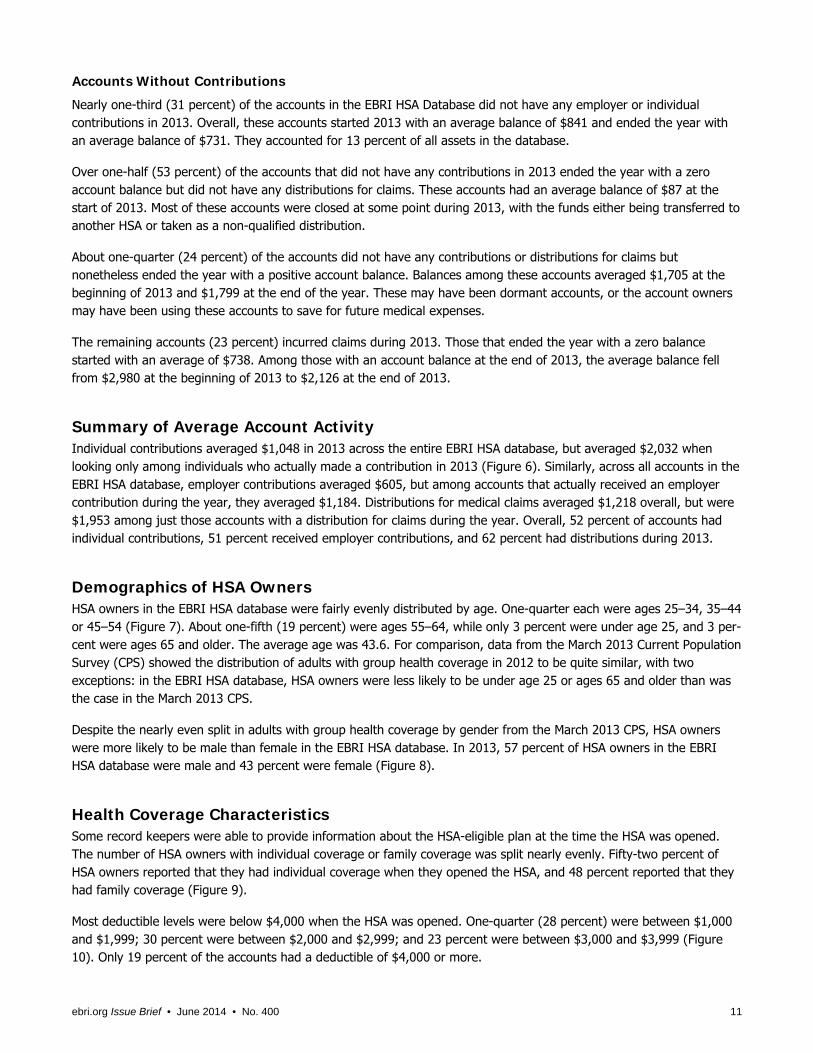
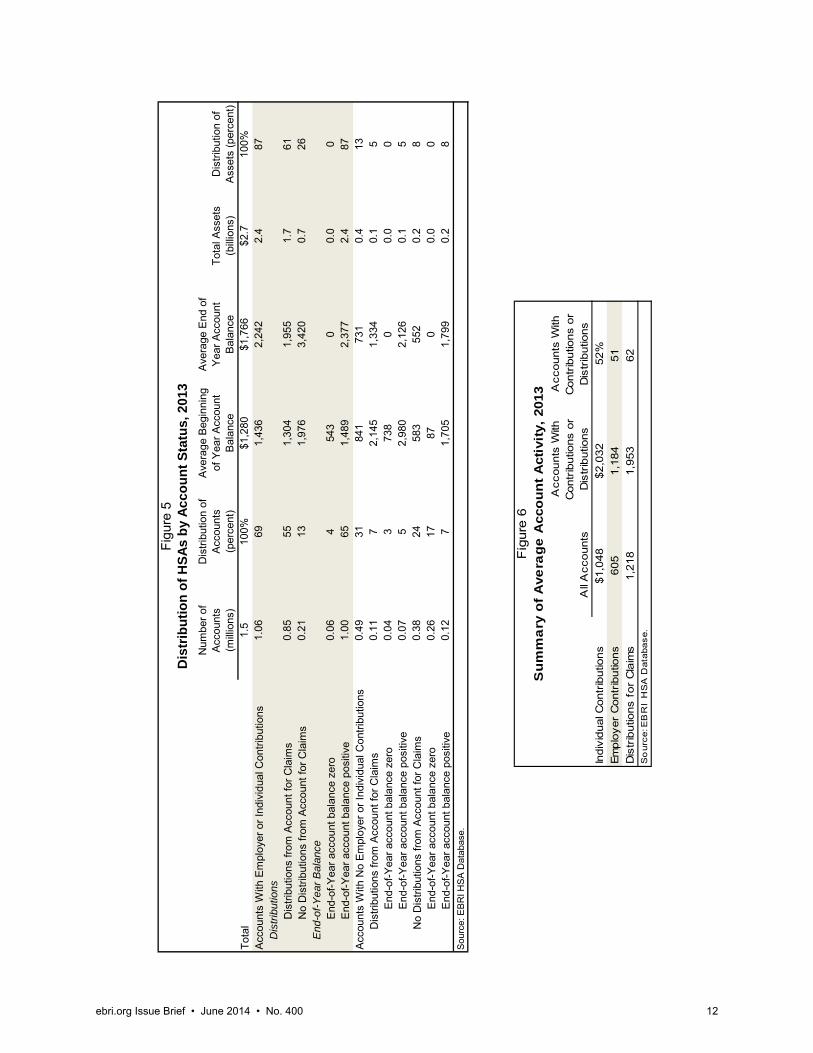
HSA Owners by Account Status The EBRI HSA Database Project contains data on 1.5 million accounts with $2.7 billion in assets as of Dec. 31, 2013 (Figure 5). Account balances averaged $1,766 at the end of 2013, up from $1,280 at the end of 2012.
Accounts With Contributions
Nearly 1.1 million of the accounts in the EBRI HSA Database (69 percent) received contributions in 2013, either individual contributions or employer contributions. Among those with a contribution, the average account balance at the end of 2013 was $2,242, up from $1,436 at the end of 2012. Accounts with contributions in 2013 had $2.4 billion in assets and represented 87 percent of the assets in the EBRI HSA Database.
Most of the accounts with contributions incurred a claim during the year. About 850,000 accounts (55 percent of the total number of accounts and 80 percent of the accounts with contributions) had a distribution in 2013. Those with a contribution and a distribution still had an average account balance of $1,955 at the end of 2013. Those without a distribution had an average of $3,420 in the account at the end of 2013.
Most accounts with contributions ended the year with a positive account balance. The few accounts with contributions in 2013 and a zero account balance at the end of 2013 started with an average balance of $543 at the beginning of the year. Among the accounts with contributions in 2013 and a positive end-of-year account balance, the average balance increased from $1,489 at the end of 2012 to $2,377 at the end of 2013.
ebri.org Issue Brief • June 2014 • No. 400 11
Accounts Without Contributions
Nearly one-third (31 percent) of the accounts in the EBRI HSA Database did not have any employer or individual contributions in 2013. Overall, these accounts started 2013 with an average balance of $841 and ended the year with an average balance of $731. They accounted for 13 percent of all assets in the database.
Over one-half (53 percent) of the accounts that did not have any contributions in 2013 ended the year with a zero account balance but did not have any distributions for claims. These accounts had an average balance of $87 at the start of 2013. Most of these accounts were closed at some point during 2013, with the funds either being transferred to another HSA or taken as a non-qualified distribution.
About one-quarter (24 percent) of the accounts did not have any contributions or distributions for claims but nonetheless ended the year with a positive account balance. Balances among these accounts averaged $1,705 at the beginning of 2013 and $1,799 at the end of the year. These may have been dormant accounts, or the account owners may have been using these accounts to save for future medical expenses.
The remaining accounts (23 percent) incurred claims during 2013. Those that ended the year with a zero balance started with an average of $738. Among those with an account balance at the end of 2013, the average balance fell from $2,980 at the beginning of 2013 to $2,126 at the end of 2013.
Summary of Average Account Activity Individual contributions averaged $1,048 in 2013 across the entire EBRI HSA database, but averaged $2,032 when looking only among individuals who actually made a contribution in 2013 (Figure 6). Similarly, across all accounts in the EBRI HSA database, employer contributions averaged $605, but among accounts that actually received an employer contribution during the year, they averaged $1,184. Distributions for medical claims averaged $1,218 overall, but were $1,953 among just those accounts with a distribution for claims during the year. Overall, 52 percent of accounts had individual contributions, 51 percent received employer contributions, and 62 percent had distributions during 2013.
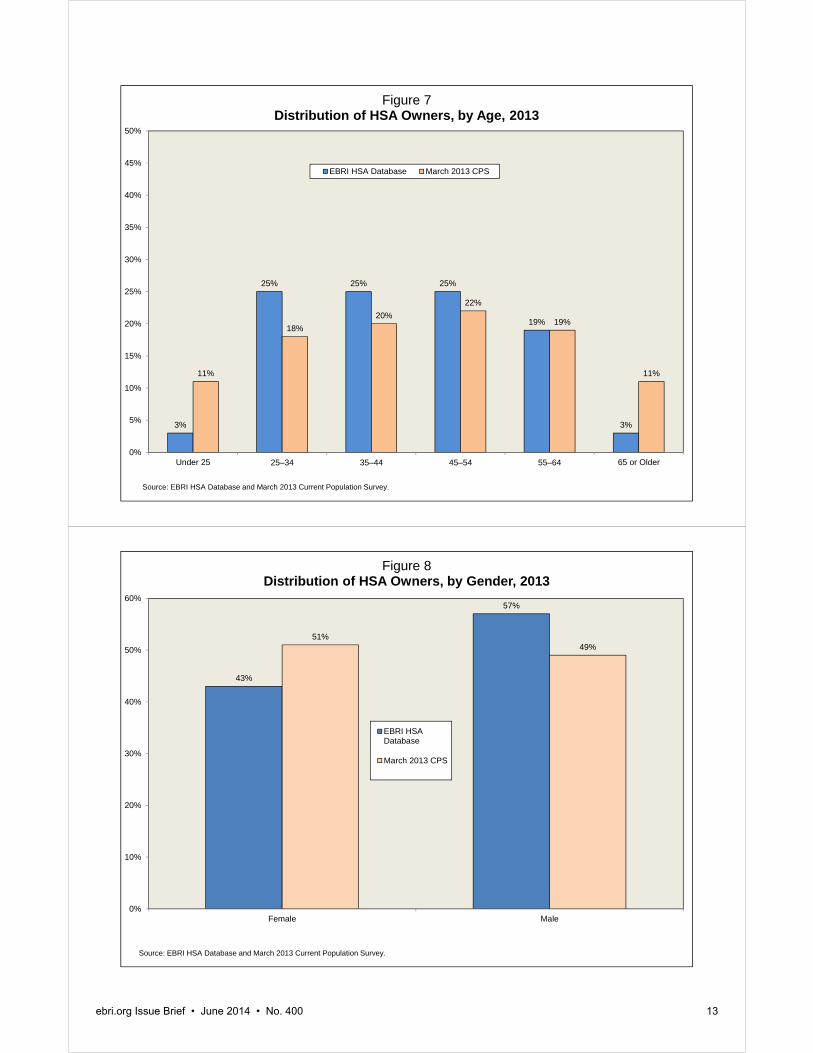
Demographics of HSA Owners HSA owners in the EBRI HSA database were fairly evenly distributed by age. One-quarter each were ages 25–34, 35–44 or 45–54 (Figure 7). About one-fifth (19 percent) were ages 55–64, while only 3 percent were under age 25, and 3 per-cent were ages 65 and older. The average age was 43.6. For comparison, data from the March 2013 Current Population Survey (CPS) showed the distribution of adults with group health coverage in 2012 to be quite similar, with two exceptions: in the EBRI HSA database, HSA owners were less likely to be under age 25 or ages 65 and older than was the case in the March 2013 CPS.
Despite the nearly even split in adults with group health coverage by gender from the March 2013 CPS, HSA owners were more likely to be male than female in the EBRI HSA database. In 2013, 57 percent of HSA owners in the EBRI HSA database were male and 43 percent were female (Figure 8).
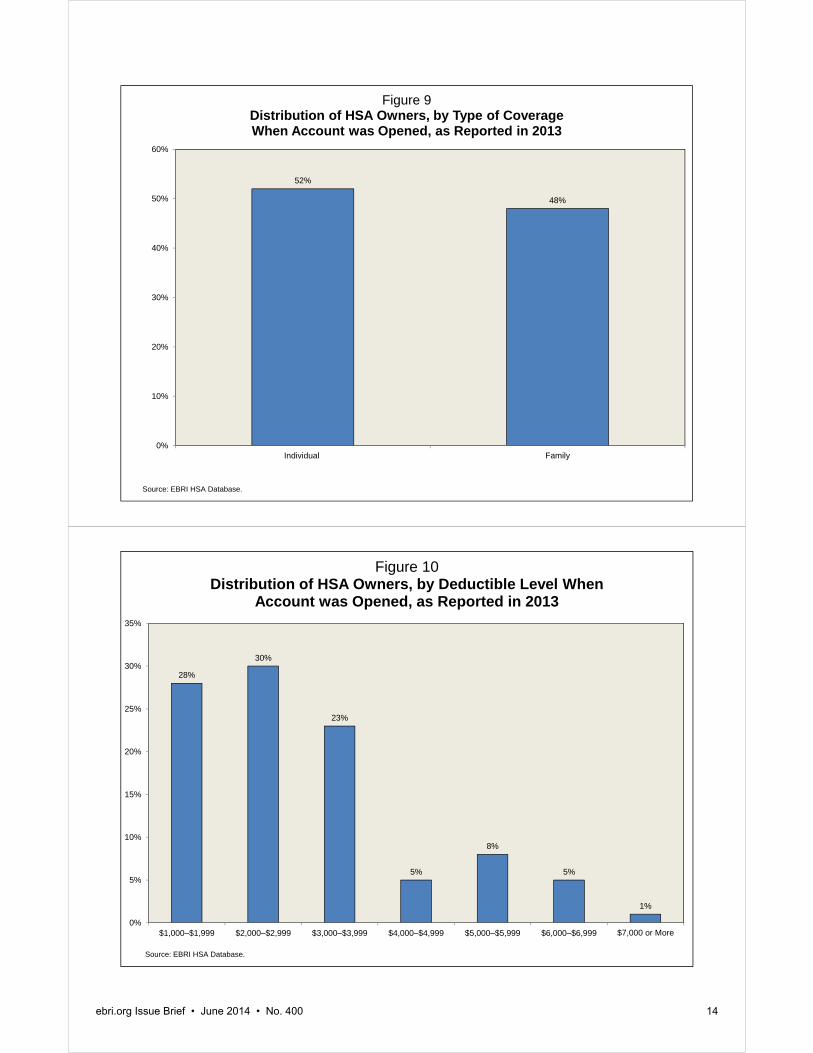
Health Coverage Characteristics Some record keepers were able to provide information about the HSA-eligible plan at the time the HSA was opened. The number of HSA owners with individual coverage or family coverage was split nearly evenly. Fifty-two percent of HSA owners reported that they had individual coverage when they opened the HSA, and 48 percent reported that they had family coverage (Figure 9).
Most deductible levels were below $4,000 when the HSA was opened. One-quarter (28 percent) were between $1,000 and $1,999; 30 percent were between $2,000 and $2,999; and 23 percent were between $3,000 and $3,999 (Figure 10). Only 19 percent of the accounts had a deductible of $4,000 or more.
Num
ber o
f A
ccou
nts
(m
illio
ns)
Dis
tribu
tion
of
Acc
ount
s
(per
cent
)
Ave
rage
Beg
inni
ng
of Y
ear A
ccou
nt
Bal
ance
Ave
rage
End
of
Yea
r Acc
ount
B
alan
ceTo
tal A
sset
s (b
illio
ns)
Dis
tribu
tion
of
Ass
ets
(per
cent
)To
tal
1.5
100%
$1,2
80$1
,766
$2.7
100%
Acc
ount
s W
ith E
mpl
oyer
or I
ndiv
idua
l Con
tribu
tions
1.06
691,
436
2,24
2 2.
487
Dis
trib
utio
nsD
istri
butio
ns fr
om A
ccou
nt fo
r Cla
ims
0.85
551,
304
1,95
5 1.
761
No
Dis
tribu
tions
from
Acc
ount
for C
laim
s0.
2113
1,97
6 3,
420
0.7
26E
nd-o
f-Y
ear
Bal
ance
End
-of-Y
ear a
ccou
nt b
alan
ce z
ero
0.06
454
3 0
0.0
0E
nd-o
f-Yea
r acc
ount
bal
ance
pos
itive
1.00
651,
489
2,37
7 2.
487
Acc
ount
s W
ith N
o E
mpl
oyer
or I
ndiv
idua
l Con
tribu
tions
0.49
3184
1 73
1 0.
413
Dis
tribu
tions
from
Acc
ount
for C
laim
s0.
117
2,14
5 1,
334
0.1
5E
nd-o
f-Yea
r acc
ount
bal
ance
zer
o0.
043
738
0 0.
00
End
-of-Y
ear a
ccou
nt b
alan
ce p
ositi
ve0.
075
2,98
0 2,
126
0.1
5N
o D
istri
butio
ns fr
om A
ccou
nt fo
r Cla
ims
0.38
2458
3 55
2 0.
28
End
-of-Y
ear a
ccou
nt b
alan
ce z
ero
0.26
1787
0
0.0
0E
nd-o
f-Yea
r acc
ount
bal
ance
pos
itive
0.12
71,
705
1,79
9 0.
28
Sou
rce:
EB
RI H
SA
Dat
abas
e.
Dis
trib
uti
on
of
HS
As
by
Acc
ou
nt
Sta
tus,
201
3Fi
gure
5
All
Acc
ount
s
Acc
ount
s W
ith
Con
trib
utio
ns o
r D
istr
ibut
ions
Acc
ount
s W
ith
Con
trib
utio
ns o
r D
istr
ibut
ions
Indi
vidu
al C
ontr
ibut
ions
$1,0
48$2
,032
52%
Empl
oyer
Con
trib
utio
ns60
51,
184
51D
istr
ibut
ions
for
Cla
ims
1,21
81,
953
62S
our
ce: E
BR
I H
SA
Dat
abas
e.
Fig
ure
6S
um
ma
ry o
f A
ve
rag
e A
cco
un
t A
cti
vit
y,
2013
ebri.org Issue Brief • June 2014 • No. 400 12
3%
25% 25% 25%
19%
3%
11%
18%
20%
22%
19%
11%
0%
5%
10%
15%
20%
25%
30%
35%
40%
45%
50%
Under 25 25–34 35–44 45–54 55–64 65 or Older
Figure 7Distribution of HSA Owners, by Age, 2013
EBRI HSA Database March 2013 CPS
Source: EBRI HSA Database and March 2013 Current Population Survey.
43%
57%
51%49%
0%
10%
20%
30%
40%
50%
60%
Female Male
Figure 8Distribution of HSA Owners, by Gender, 2013
EBRI HSADatabase
March 2013 CPS
Source: EBRI HSA Database and March 2013 Current Population Survey.
ebri.org Issue Brief • June 2014 • No. 400 13
52%
48%
0%
10%
20%
30%
40%
50%
60%
Individual Family
Figure 9Distribution of HSA Owners, by Type of Coverage When Account was Opened, as Reported in 2013
Source: EBRI HSA Database.
28%
30%
23%
5%
8%
5%
1%
0%
5%
10%
15%
20%
25%
30%
35%
$1,000–$1,999 $2,000–$2,999 $3,000–$3,999 $4,000–$4,999 $5,000–$5,999 $6,000–$6,999 $7,000 or More
Figure 10Distribution of HSA Owners, by Deductible Level When
Account was Opened, as Reported in 2013
Source: EBRI HSA Database.
ebri.org Issue Brief • June 2014 • No. 400 14
ebri.org Issue Brief • June 2014 • No. 400 15
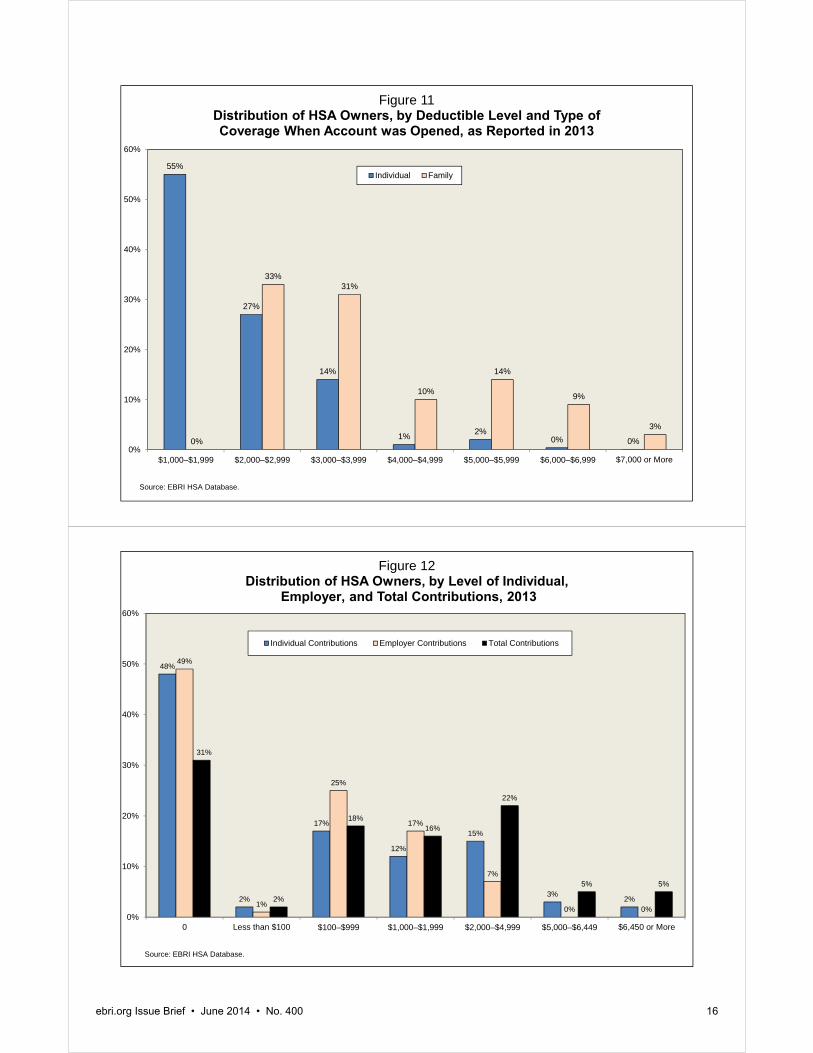
Not surprisingly, HSAs with family coverage were more likely than those with individual coverage to have a deductible of $4,000 or more. Only 3 percent of accounts with individual coverage had a deductible of $4,000 or more, whereas 36 percent of accounts with family coverage had a deductible of $4,000 or more (Figure 11).
Contributions to HSAs Just over one-half (52 percent) of HSA owners contributed to their account in 2013 (Figure 12). Twelve percent made a contribution in the range of $1,000–$1,999 and 15 percent contributed between $2,000 and $4,999. Only 2 percent contributed the maximum (at least $6,450, although individuals ages 55 or older making catch-up contributions can contribute an additional $1,000).
Similarly, just over one-half (51 percent) of HSA accounts had an employer contribution. One-quarter had an employer contribution of $100–$999; 17 percent received an employer contribution of $1,000–$1,999; and only 7 percent had an employer contribution of at least $2,000.
When accounts receiving individual and employer contributions were combined, nearly one-third (31 percent) of accounts did not have any contributions, while 5 percent had $6,450 or more in contributions.
Account Status Differences As mentioned above, HSAs can be grouped into a number of different account activity statuses. Two-thirds (65 percent) of accounts had either an individual or employer contribution in 2013 and a balance greater than zero at the end of the year. Four percent had an individual or employer contribution and a zero balance, while the remaining 31 percent did not have any contributions into the account. Just over one-half (53 percent) of those accounts had no distributions for claims during 2013, but ended the year with a zero balance. The assets in these accounts were transferred to another HSA and the accounts were probably closed.
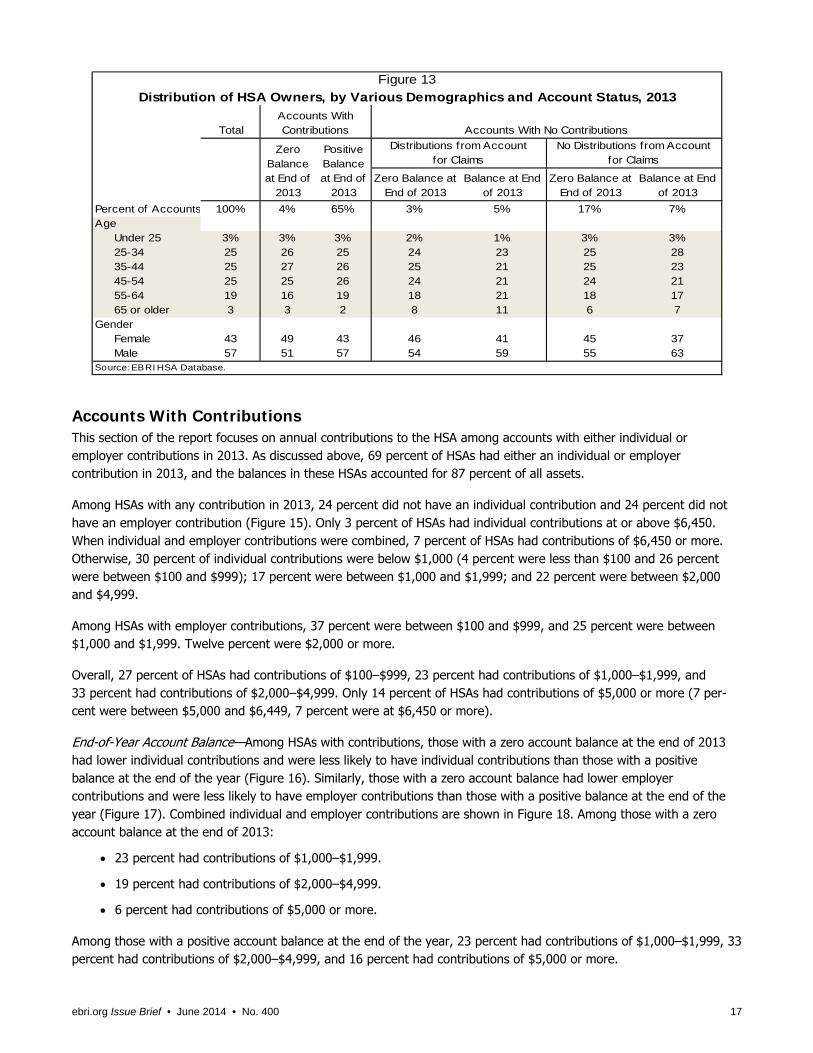
Regardless of account status, while the age distribution of the HSA owners was relatively even (Figure 13), there are some gender differences. Among accounts with contributions in 2013, those with a positive balance were more likely to be owned by men than accounts with a zero balance at the end of 2013. Similarly, among accounts that did not have an individual or employer contribution in 2013, accounts with a positive balance at the end of the year were more likely to be owned by men than accounts with a zero balance.
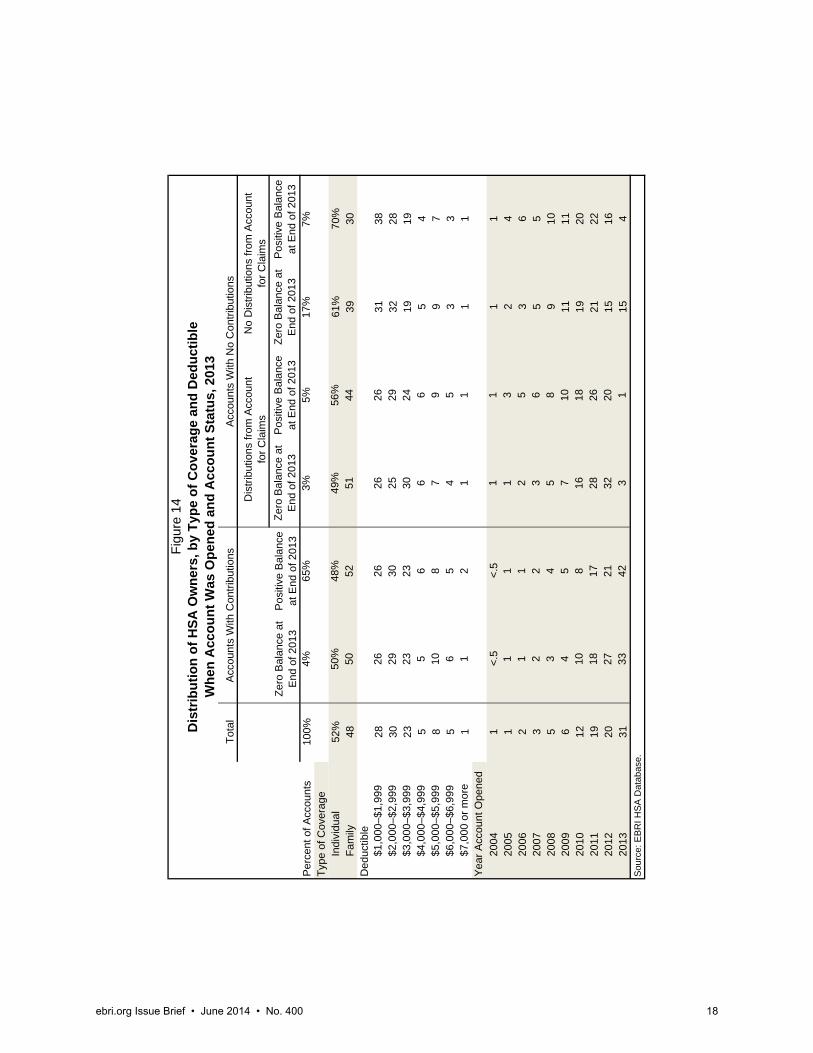
Figure 14 illustrates the distribution of type of coverage and deductible when the HSA was opened, by account status. It also examines the year the HSA was opened, by account status. There are some notable differences:
Overall, about one-half of accounts were associated with individual coverage when opened, and about one-half were associated with family coverage. However, among accounts with no contributions in 2013 and no distributions for claims, 61 percent of those with a zero balance at the end of 2013 (17 percent of all accounts), and 70 percent of those with a positive balance at the end of 2013, were associated with individual coverage when the HSA was opened.
Because accounts with no contributions and no distributions for claims were disproportionately associated with individual coverage when the HSA was opened, those accounts were also disproportionately associated with lower deductibles when the HSA was opened.
When it comes to account status and year the HSA was opened, accounts more likely to have been closed during 2013 (those with no contributions) were more likely to have been opened before 2013. In contrast, accounts with contributions during 2013 were more likely than average to have been opened in 2013.
55%
27%
14%
1%2%
0% 0%0%
33%31%
10%
14%
9%
3%
0%
10%
20%
30%
40%
50%
60%
$1,000–$1,999 $2,000–$2,999 $3,000–$3,999 $4,000–$4,999 $5,000–$5,999 $6,000–$6,999 $7,000 or More
Figure 11Distribution of HSA Owners, by Deductible Level and Type of Coverage When Account was Opened, as Reported in 2013
Individual Family
Source: EBRI HSA Database.
48%
2%
17%
12%
15%
3%2%
49%
1%
25%
17%
7%
0% 0%
31%
2%
18%16%
22%
5% 5%
0%
10%
20%
30%
40%
50%
60%
0 Less than $100 $100–$999 $1,000–$1,999 $2,000–$4,999 $5,000–$6,449 $6,450 or More
Figure 12Distribution of HSA Owners, by Level of Individual,
Employer, and Total Contributions, 2013
Individual Contributions Employer Contributions Total Contributions
Source: EBRI HSA Database.
ebri.org Issue Brief • June 2014 • No. 400 16
ebri.org Issue Brief • June 2014 • No. 400 17
Total
Zero Balance at End of 2013
Balance at End of 2013
Zero Balance at End of 2013
Balance at End of 2013
Percent of Accounts 100% 4% 65% 3% 5% 17% 7%Age
Under 25 3% 3% 3% 2% 1% 3% 3%25-34 25 26 25 24 23 25 2835-44 25 27 26 25 21 25 2345-54 25 25 26 24 21 24 2155-64 19 16 19 18 21 18 1765 or older 3 3 2 8 11 6 7
GenderFemale 43 49 43 46 41 45 37Male 57 51 57 54 59 55 63
Source: EBRI HSA Database.
Figure 13
Distribution of HSA Owners, by Various Demographics and Account Status, 2013
Accounts With Contributions Accounts With No Contributions
Zero Balance at End of
2013
Positive Balance at End of
2013
Distributions from Account for Claims
No Distributions from Account for Claims
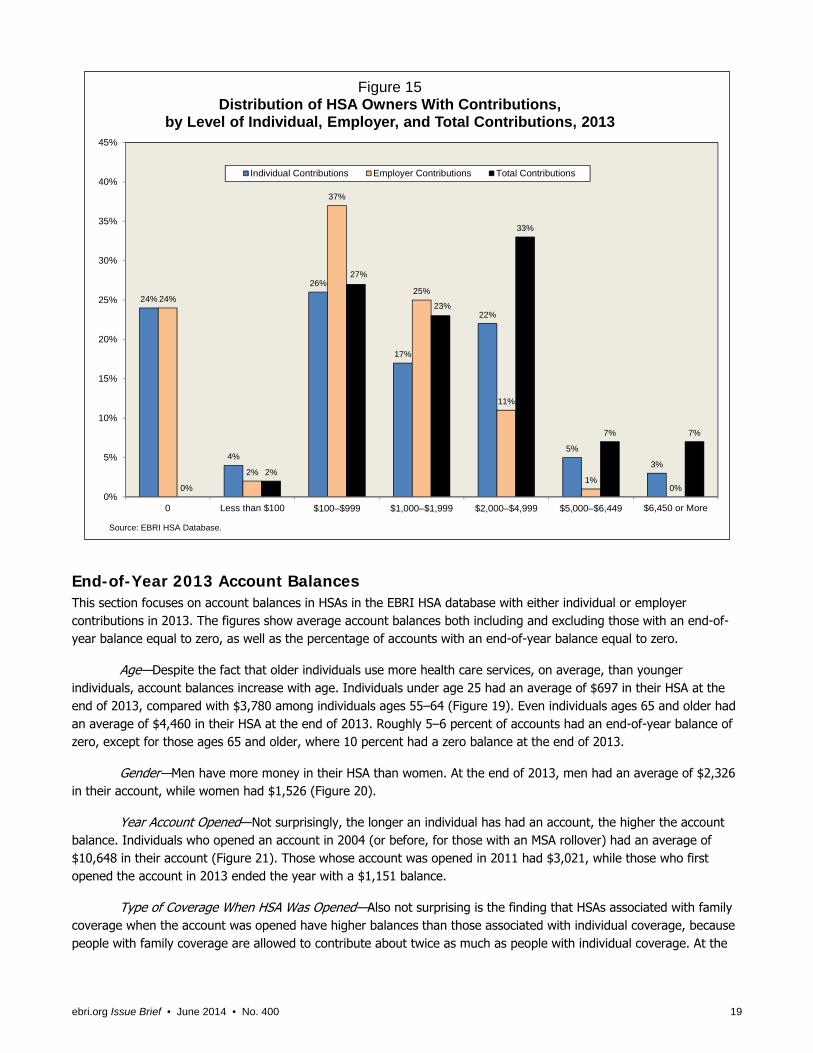
Accounts With Contributions This section of the report focuses on annual contributions to the HSA among accounts with either individual or employer contributions in 2013. As discussed above, 69 percent of HSAs had either an individual or employer contribution in 2013, and the balances in these HSAs accounted for 87 percent of all assets.
Among HSAs with any contribution in 2013, 24 percent did not have an individual contribution and 24 percent did not have an employer contribution (Figure 15). Only 3 percent of HSAs had individual contributions at or above $6,450. When individual and employer contributions were combined, 7 percent of HSAs had contributions of $6,450 or more. Otherwise, 30 percent of individual contributions were below $1,000 (4 percent were less than $100 and 26 percent were between $100 and $999); 17 percent were between $1,000 and $1,999; and 22 percent were between $2,000 and $4,999.
Among HSAs with employer contributions, 37 percent were between $100 and $999, and 25 percent were between $1,000 and $1,999. Twelve percent were $2,000 or more.
Overall, 27 percent of HSAs had contributions of $100–$999, 23 percent had contributions of $1,000–$1,999, and 33 percent had contributions of $2,000–$4,999. Only 14 percent of HSAs had contributions of $5,000 or more (7 per-cent were between $5,000 and $6,449, 7 percent were at $6,450 or more).
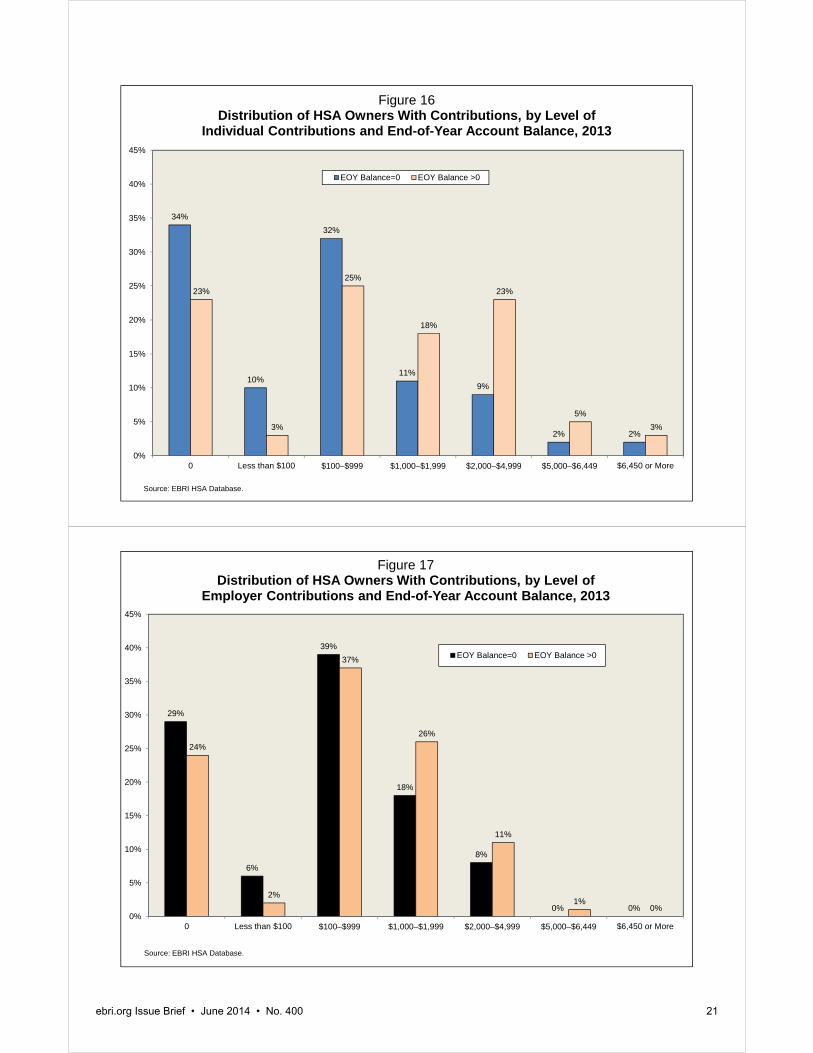
End-of-Year Account Balance—Among HSAs with contributions, those with a zero account balance at the end of 2013 had lower individual contributions and were less likely to have individual contributions than those with a positive balance at the end of the year (Figure 16). Similarly, those with a zero account balance had lower employer contributions and were less likely to have employer contributions than those with a positive balance at the end of the year (Figure 17). Combined individual and employer contributions are shown in Figure 18. Among those with a zero account balance at the end of 2013:
23 percent had contributions of $1,000–$1,999.
19 percent had contributions of $2,000–$4,999.
6 percent had contributions of $5,000 or more.
Among those with a positive account balance at the end of the year, 23 percent had contributions of $1,000–$1,999, 33 percent had contributions of $2,000–$4,999, and 16 percent had contributions of $5,000 or more.
Tot
al
Zer
o B
alan
ce a
t E
nd o
f 201
3P
ositi
ve B
alan
ce
at E
nd o
f 201
3Z
ero
Bal
ance
at
End
of 2
013
Pos
itive
Bal
ance
at
End
of 2
013
Per
cent
of A
ccou
nts
100%
4%65
%3%
5%17
%7%
Typ
e of
Cov
erag
eIn
divi
dual
52
%50
%48
%49
%56
%61
%70
%F
amily
4850
5251
4439
30D
educ
tible
$1
,000
–$1,
999
2826
2626
2631
38$2
,000
–$2,
999
3029
3025
2932
28$3
,000
–$3,
999
2323
2330
2419
19$4
,000
–$4,
999
55
66
65
4$5
,000
–$5,
999
810
87
99
7$6
,000
–$6,
999
56
54
53
3$7
,000
or
mor
e1
12
11
11
Yea
r A
ccou
nt O
pene
d
2004
1<
.5<
.51
11
120
051
11
13
24
2006
21
12
53
620
073
22
36
55
2008
53
45
89
1020
096
45
710
1111
2010
1210
816
1819
2020
1119
1817
2826
2122
2012
2027
2132
2015
1620
1331
3342
31
154
Sou
rce:
EB
RI H
SA
Dat
abas
e.
Fig
ure
14D
istr
ibu
tio
n o
f H
SA
Ow
ner
s, b
y T
ype
of
Co
vera
ge
and
Ded
uct
ible
Wh
en A
cco
un
t W
as O
pen
ed a
nd
Acc
ou
nt
Sta
tus,
201
3
Acc
ount
s W
ith C
ontr
ibut
ions
Acc
ount
s W
ith N
o C
ontr
ibut
ions
Zer
o B
alan
ce a
t E
nd o
f 201
3P
ositi
ve B
alan
ce
at E
nd o
f 201
3
Dis
trib
utio
ns fr
om A
ccou
nt
for
Cla
ims
No
Dis
trib
utio
ns fr
om A
ccou
nt
fo
r C
laim
s
ebri.org Issue Brief • June 2014 • No. 400 18
ebri.org Issue Brief • June 2014 • No. 400 19
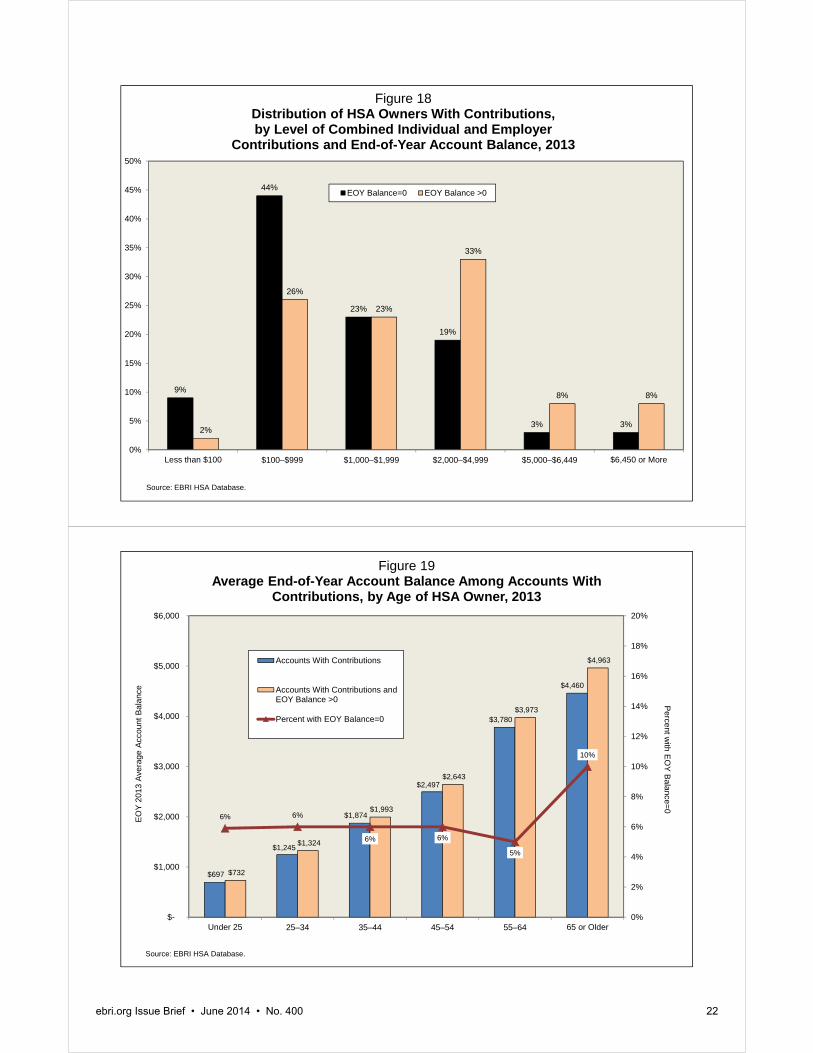
End-of-Year 2013 Account Balances This section focuses on account balances in HSAs in the EBRI HSA database with either individual or employer contributions in 2013. The figures show average account balances both including and excluding those with an end-of-year balance equal to zero, as well as the percentage of accounts with an end-of-year balance equal to zero.
Age—Despite the fact that older individuals use more health care services, on average, than younger individuals, account balances increase with age. Individuals under age 25 had an average of $697 in their HSA at the end of 2013, compared with $3,780 among individuals ages 55–64 (Figure 19). Even individuals ages 65 and older had an average of $4,460 in their HSA at the end of 2013. Roughly 5–6 percent of accounts had an end-of-year balance of zero, except for those ages 65 and older, where 10 percent had a zero balance at the end of 2013.
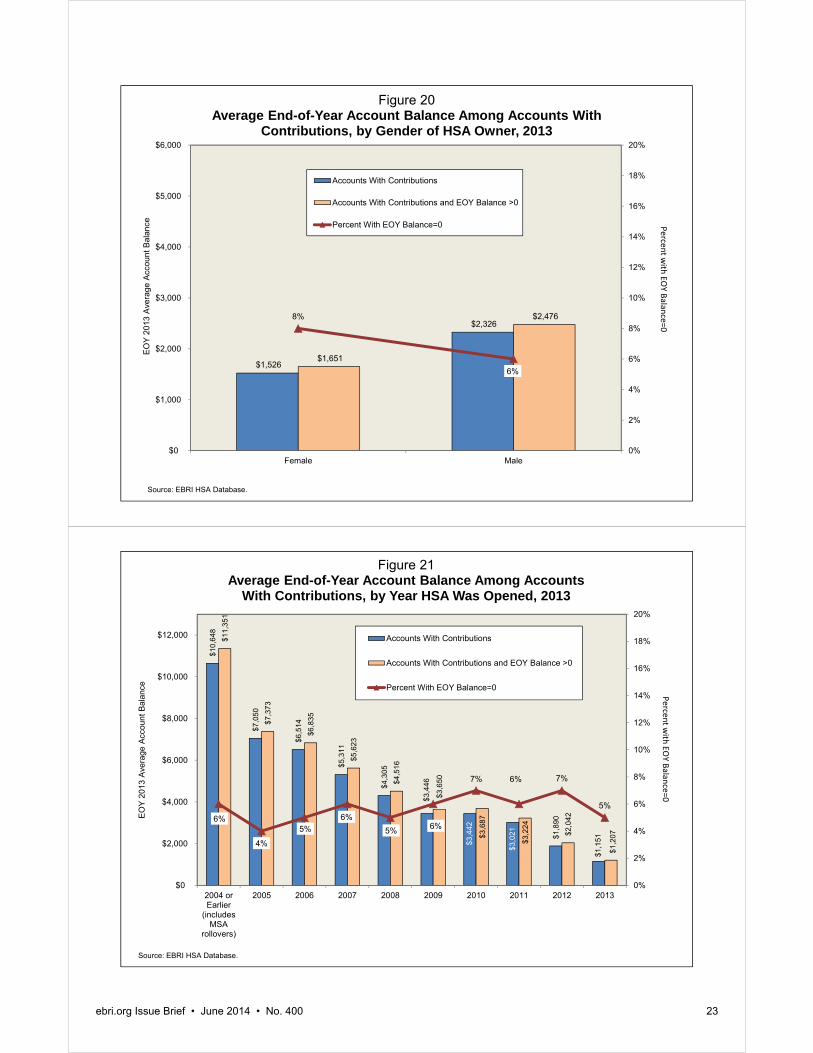
Gender—Men have more money in their HSA than women. At the end of 2013, men had an average of $2,326 in their account, while women had $1,526 (Figure 20).
Year Account Opened—Not surprisingly, the longer an individual has had an account, the higher the account balance. Individuals who opened an account in 2004 (or before, for those with an MSA rollover) had an average of $10,648 in their account (Figure 21). Those whose account was opened in 2011 had $3,021, while those who first opened the account in 2013 ended the year with a $1,151 balance.
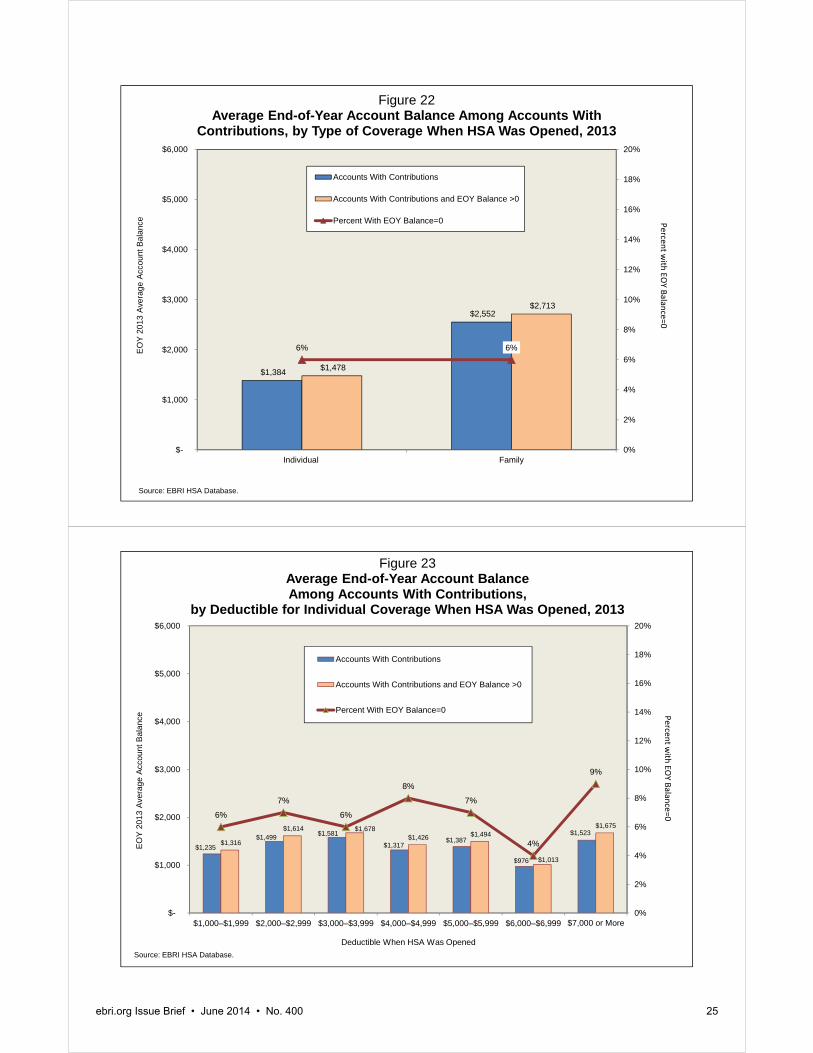
Type of Coverage When HSA Was Opened—Also not surprising is the finding that HSAs associated with family coverage when the account was opened have higher balances than those associated with individual coverage, because people with family coverage are allowed to contribute about twice as much as people with individual coverage. At the
24%
4%
26%
17%
22%
5%
3%
24%
2%
37%
25%
11%
1%0%0%
2%
27%
23%
33%
7% 7%
0%
5%
10%
15%
20%
25%
30%
35%
40%
45%
0 Less than $100 $100–$999 $1,000–$1,999 $2,000–$4,999 $5,000–$6,449 $6,450 or More
Figure 15Distribution of HSA Owners With Contributions,
by Level of Individual, Employer, and Total Contributions, 2013
Individual Contributions Employer Contributions Total Contributions
Source: EBRI HSA Database.
ebri.org Issue Brief • June 2014 • No. 400 20
end of 2013, accounts associated with individual coverage when the account was opened had accumulated $1,384, on average, while accounts associated with family coverage had $2,552 (Figure 22).
Deductible When HSA Was Opened—End of year 2013 HSA balances tend to increase with the deductible level of the HSA-eligible plan when the account was opened. Among HSA owners with individual coverage when the account was opened, the average end-of-2013 balance was $1,235 for those with a $1,000–$1,999 deductible, $1,499 for those with a $2,000–$2,999 deductible, and $1,581 for those with a $3,000–$3,999 deductible (Figure 23). End-of-year balances then fell off for HSAs with deductibles of $4,000 or more, but sample sizes also tended to decline.
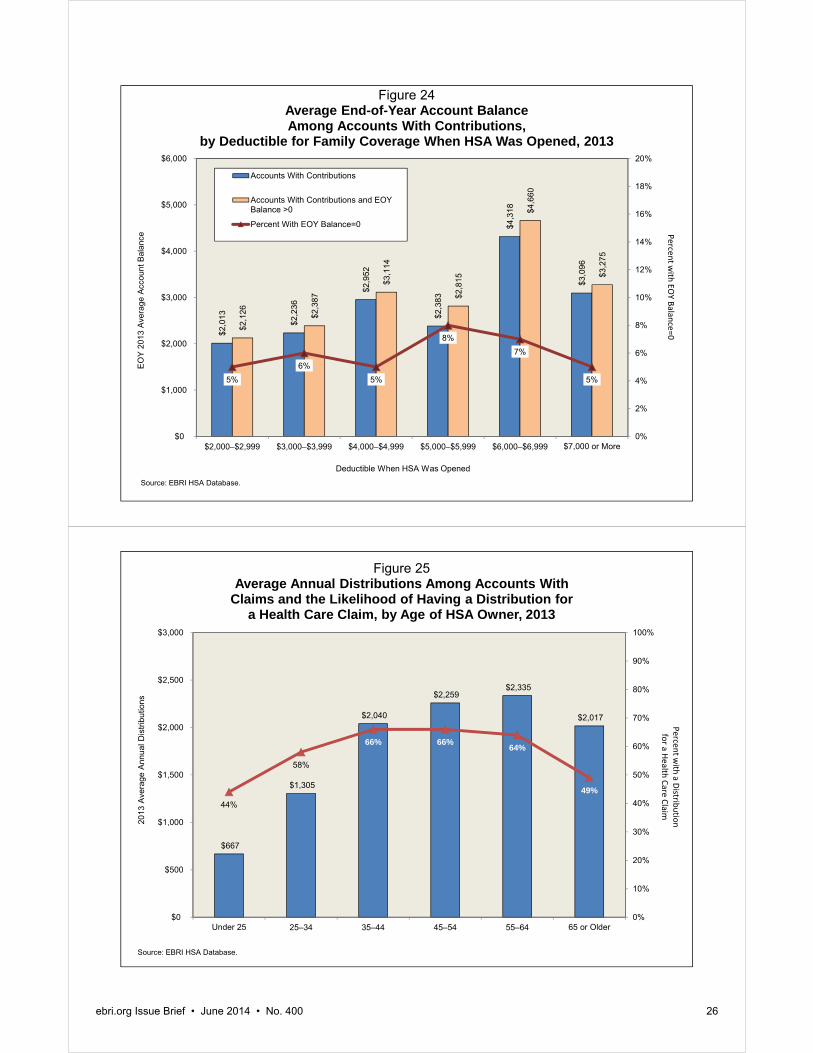
Among HSA owners with family coverage when the account was opened, the average end of 2013 balance in the EBRI HSA database was $2,013 for those with a $2,000–$2,999 deductible; $2,236 for those with a $3,000–$3,999 deductible; and $2,952 for those with a $4,000–$4,999 deductible (Figure 24). There was no clear pattern in account balances for individuals with a deductible of $5,000 or more.
Distributions The remainder of this report focuses on average annual distributions and the likelihood that an account had a distribution for a health care claim. Account owners whose family members are covered by their health plan may make distributions for health care claims incurred by those family members.
Age—The average annual amount distributed for health care claims increases with age, as does the likelihood that a distribution was made for a health care claim, until older ages. Individuals under age 25 had an average annual distribution of $667 from their HSA in 2013, compared with $2,335 among individuals ages 55–64 and $2,017 among individuals ages 65 and older (Figure 25). The likelihood of taking a distribution increased from 44 percent among individuals under age 25, to 66 percent among those ages 35–44 and 45–54. That likelihood dipped slightly (to 64 per-cent) among those ages 55–64 and still further (to 49 percent) among those ages 65 and older. The decline in the average amount distributed, as well as the likelihood of there being a distribution for health care claims at older ages, may have been a reflection of fewer people covered by the HSA-eligible health plan as fewer dependent children are covered by older account owners.
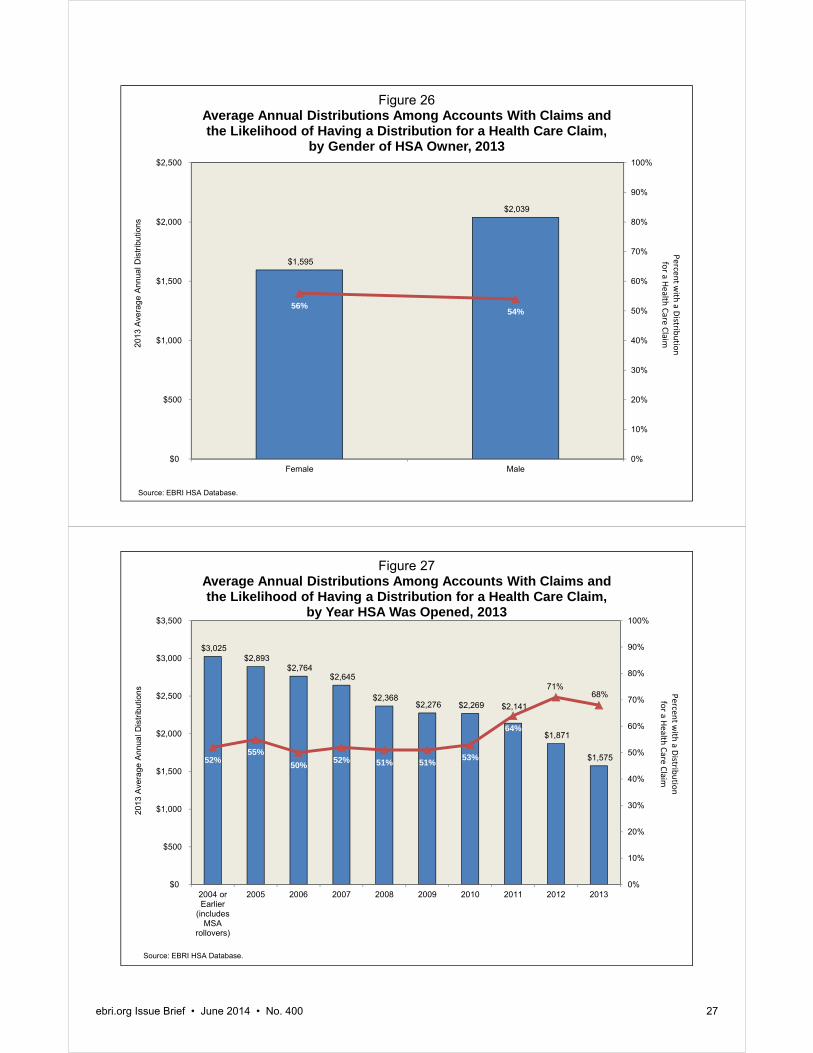
Gender—Men and women were about equally likely to have a distribution for health care claims from the accounts in the EBRI HSA database. Fifty-six percent of women and 54 percent of men had a claim in 2013 (Figure 26). However, average annual claims were higher for men ($2,039) than they were for women ($1,595).
Year Account Opened—The longer an individual has had an HSA, the higher the average amount distributed for health care claims. Individuals who opened an account in 2004 (or before, for those with an MSA rollover) had an average annual distribution of $3,025 from their account (Figure 27). Those whose account was opened in 2011 had an average annual distribution of $2,141, and those who first opened the account in 2013 had an average annual distribution of $1,575. While average amounts distributed were higher among older accounts, the likelihood of there being a distribution was higher among accounts opened since 2011. Roughly half (between 50–55 percent) of accounts opened between 2004 and 2010 had a distribution for a health care claim, whereas 64 percent of accounts opened in 2011, 71 percent of accounts opened in 2012, and 68 percent of accounts opened in 2013 had a distribution for a health care claim.
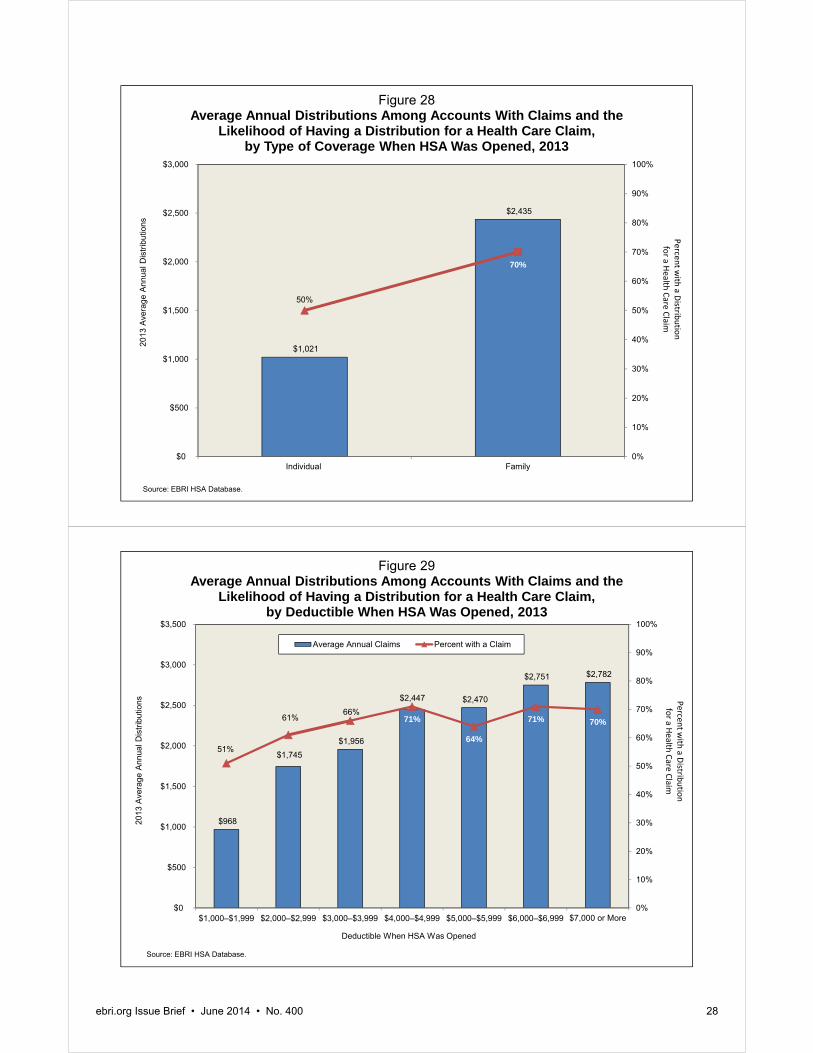
Type of Coverage When HSA Was Opened—Because of the greater number of covered individuals and higher account balances, it is not surprising that HSAs associated with family coverage when the account was opened had a higher likelihood of having a distribution for a health care claim and had higher distributions, on average. In the EBRI HSA database, 70 percent of HSAs associated with family coverage when the account was opened incurred a claim in 2013, compared with 50 percent among accounts associated with individual coverage when the account was opened (Figure 28). Annual distributions averaged $2,435 from accounts associated with family coverage when the account was opened, and $1,021 among accounts associated with individual coverage when the account was opened.
34%
10%
32%
11%
9%
2% 2%
23%
3%
25%
18%
23%
5%
3%
0%
5%
10%
15%
20%
25%
30%
35%
40%
45%
0 Less than $100 $100–$999 $1,000–$1,999 $2,000–$4,999 $5,000–$6,449 $6,450 or More
Figure 16Distribution of HSA Owners With Contributions, by Level of
Individual Contributions and End-of-Year Account Balance, 2013
EOY Balance=0 EOY Balance >0
Source: EBRI HSA Database.
29%
6%
39%
18%
8%
0% 0%
24%
2%
37%
26%
11%
1%0%
0%
5%
10%
15%
20%
25%
30%
35%
40%
45%
0 Less than $100 $100–$999 $1,000–$1,999 $2,000–$4,999 $5,000–$6,449 $6,450 or More
Figure 17Distribution of HSA Owners With Contributions, by Level of
Employer Contributions and End-of-Year Account Balance, 2013
EOY Balance=0 EOY Balance >0
Source: EBRI HSA Database.
ebri.org Issue Brief • June 2014 • No. 400 21
9%
44%
23%
19%
3% 3%2%
26%
23%
33%
8% 8%
0%
5%
10%
15%
20%
25%
30%
35%
40%
45%
50%
Less than $100 $100–$999 $1,000–$1,999 $2,000–$4,999 $5,000–$6,449 $6,450 or More
Figure 18Distribution of HSA Owners With Contributions, by Level of Combined Individual and Employer
Contributions and End-of-Year Account Balance, 2013
EOY Balance=0 EOY Balance >0
Source: EBRI HSA Database.
$697
$1,245
$1,874
$2,497
$3,780
$4,460
$732
$1,324
$1,993
$2,643
$3,973
$4,963
6% 6%
6% 6%
5%
10%
0%
2%
4%
6%
8%
10%
12%
14%
16%
18%
20%
$-
$1,000
$2,000
$3,000
$4,000
$5,000
$6,000
Under 25 25–34 35–44 45–54 55–64 65 or Older
Figure 19Average End-of-Year Account Balance Among Accounts With
Contributions, by Age of HSA Owner, 2013
Accounts With Contributions
Accounts With Contributions andEOY Balance >0
Percent with EOY Balance=0
Source: EBRI HSA Database.
EO
Y20
13 A
vera
ge A
ccou
nt B
alan
ceP
ercent with
EO
Y B
alance=0
ebri.org Issue Brief • June 2014 • No. 400 22
$1,526
$2,326
$1,651
$2,476 8%
6%
0%
2%
4%
6%
8%
10%
12%
14%
16%
18%
20%
$0
$1,000
$2,000
$3,000
$4,000
$5,000
$6,000
Female Male
Figure 20Average End-of-Year Account Balance Among Accounts With
Contributions, by Gender of HSA Owner, 2013
Accounts With Contributions
Accounts With Contributions and EOY Balance >0
Percent With EOY Balance=0
Source: EBRI HSA Database.
EOY
2013
Ave
rage
Acc
ount
Bal
ance P
erce
nt w
ithEO
Y Balan
ce=0
$10,
648
$7,0
50
$6,5
14
$5,3
11
$4,3
05
$3,4
46
$3,4
42
$3,0
21
$1,8
90
$1,1
51
$11,
351
$7,3
73
$6,8
35
$5,6
23
$4,5
16
$3,6
50
$3,6
87
$3,2
24
$2,0
42
$1,2
07
6%
4%
5%6%
5% 6%
7% 6% 7%
5%
0%
2%
4%
6%
8%
10%
12%
14%
16%
18%
20%
$0
$2,000
$4,000
$6,000
$8,000
$10,000
$12,000
2004 orEarlier
(includesMSA
rollovers)
2005 2006 2007 2008 2009 2010 2011 2012 2013
Figure 21Average End-of-Year Account Balance Among Accounts
With Contributions, by Year HSA Was Opened, 2013
Accounts With Contributions
Accounts With Contributions and EOY Balance >0
Percent With EOY Balance=0
Source: EBRI HSA Database.
EOY
2013
Ave
rage
Acc
ount
Bal
ance
Perce
nt w
ithEO
Y Balan
ce=0
ebri.org Issue Brief • June 2014 • No. 400 23
ebri.org Issue Brief • June 2014 • No. 400 24
Deductible When HSA Was Opened—The likelihood of a distribution for health care claims tended to increase with the deductible level of the HSA-eligible health plan when the account was opened, as did the amount of the average annual distribution. One-half (51 percent) of accounts associated with a $1,000–$1,999 deductible when the HSA was opened had a distribution for health care claims in 2013, compared with 64–71 percent among accounts associated with a deductible of at least $4,000 (Figure 29). Average annual distributions increased from $968 among accounts associated with a $1,000–$1,999 deductible when the HSA was opened to $2,447—$2,470 among accounts associated with a $4,000–$5,999 deductible when the HSA was opened, and nearly $2,800 among accounts associated with a deductible of at least $6,000 when the HSA was opened.
Conclusion 2014 marks the 10-year anniversary of the introduction of HSAs. Starting from scratch a decade ago, enrollment in HSA-eligible health plans is estimated to range from 15.5 million to 20.4 million policyholders and their dependents, and it has also been estimated that there are 10.7 million accounts holding $19.3 billion in assets as of Dec. 31, 2013. The number of employers expected to offer an HSA-eligible health plan either as an option or as the only health plan option is expected to continue to increase. As a result, HSA-eligible health plans and HSAs are expected to become vital components of employment-based health coverage.
This study examines data from the EBRI HSA Database, which contains data collected from various HSA providers on 1.5 million accounts with total assets of $2.7 billion. Seventy percent of HSAs were opened since 2011. Overall, average balances increased from $1,280 to $1,766 during calendar year 2013.
Nearly 70 percent of the accounts in the EBRI HSA Database had either an individual or employer contribution. Average balances in these accounts increased from $1,436 to $2,242. About 6 percent of them ended 2013 with a zero balance. Just over one-half of accounts had individual contributions, with deposits averaging $2,032. Among the 51 percent of accounts receiving employer contributions, the accounts received an average of $1,184. Distributions for health care claims averaged nearly $2,000 among the 62 percent of accounts with a distribution.
As the database expands, future studies will continue to examine trends in these important account indicators.
$1,384
$2,552
$1,478
$2,713
6% 6%
0%
2%
4%
6%
8%
10%
12%
14%
16%
18%
20%
$-
$1,000
$2,000
$3,000
$4,000
$5,000
$6,000
Individual Family
Figure 22Average End-of-Year Account Balance Among Accounts With
Contributions, by Type of Coverage When HSA Was Opened, 2013
Accounts With Contributions
Accounts With Contributions and EOY Balance >0
Percent With EOY Balance=0
Source: EBRI HSA Database.
Perce
nt w
ithEO
Y Balan
ce=0E
OY
2013
Ave
rage
Acc
ount
Bal
ance
$1,235
$1,499 $1,581
$1,317 $1,387
$976
$1,523
$1,316
$1,614 $1,678 $1,426 $1,494
$1,013
$1,675
6%
7%
6%
8%
7%
4%
9%
0%
2%
4%
6%
8%
10%
12%
14%
16%
18%
20%
$-
$1,000
$2,000
$3,000
$4,000
$5,000
$6,000
$1,000–$1,999 $2,000–$2,999 $3,000–$3,999 $4,000–$4,999 $5,000–$5,999 $6,000–$6,999 $7,000 or More
Deductible When HSA Was Opened
Figure 23Average End-of-Year Account Balance Among Accounts With Contributions,
by Deductible for Individual Coverage When HSA Was Opened, 2013
Accounts With Contributions
Accounts With Contributions and EOY Balance >0
Percent With EOY Balance=0
Source: EBRI HSA Database.
EO
Y20
13 A
vera
ge A
ccou
nt B
alan
cePerce
nt w
ithEO
Y Balan
ce=0
ebri.org Issue Brief • June 2014 • No. 400 25
$2,0
13
$2,2
36
$2,9
52
$2,3
83
$4,3
18
$3,0
96
$2,1
26
$2,3
87
$3,1
14
$2,8
15
$4,6
60
$3,2
75
5%6%
5%
8%7%
5%
0%
2%
4%
6%
8%
10%
12%
14%
16%
18%
20%
$0
$1,000
$2,000
$3,000
$4,000
$5,000
$6,000
$2,000–$2,999 $3,000–$3,999 $4,000–$4,999 $5,000–$5,999 $6,000–$6,999 $7,000 or More
Deductible When HSA Was Opened
Figure 24Average End-of-Year Account Balance Among Accounts With Contributions,
by Deductible for Family Coverage When HSA Was Opened, 2013
Accounts With Contributions
Accounts With Contributions and EOYBalance >0
Percent With EOY Balance=0
Source: EBRI HSA Database.
EOY
2013
Ave
rage
Acc
ount
Bal
ance
Perce
nt w
ithEO
Y Balan
ce=0
$667
$1,305
$2,040
$2,259 $2,335
$2,017
44%
58%
66% 66%64%
49%
0%
10%
20%
30%
40%
50%
60%
70%
80%
90%
100%
$0
$500
$1,000
$1,500
$2,000
$2,500
$3,000
Under 25 25–34 35–44 45–54 55–64 65 or Older
Figure 25Average Annual Distributions Among Accounts With
Claims and the Likelihood of Having a Distribution for a Health Care Claim, by Age of HSA Owner, 2013
Source: EBRI HSA Database.
2013
Ave
rage
Ann
ual D
istri
butio
nsPerce
nt w
itha D
istributio
n
for a H
ealth
Care
Claim
ebri.org Issue Brief • June 2014 • No. 400 26
$1,595
$2,039
56%54%
0%
10%
20%
30%
40%
50%
60%
70%
80%
90%
100%
$0
$500
$1,000
$1,500
$2,000
$2,500
Female Male
Figure 26Average Annual Distributions Among Accounts With Claims and the Likelihood of Having a Distribution for a Health Care Claim,
by Gender of HSA Owner, 2013
Source: EBRI HSA Database.
2013
Ave
rage
Ann
ual D
istri
butio
nsPerce
nt w
itha D
istributio
n
for a H
ealth
Care
Claim
$3,025 $2,893
$2,764 $2,645
$2,368 $2,276 $2,269 $2,141
$1,871
$1,575 52%55%
50%52% 51% 51%
53%
64%
71%68%
0%
10%
20%
30%
40%
50%
60%
70%
80%
90%
100%
$0
$500
$1,000
$1,500
$2,000
$2,500
$3,000
$3,500
2004 orEarlier
(includesMSA
rollovers)
2005 2006 2007 2008 2009 2010 2011 2012 2013
Figure 27Average Annual Distributions Among Accounts With Claims and the Likelihood of Having a Distribution for a Health Care Claim,
by Year HSA Was Opened, 2013
Source: EBRI HSA Database.
2013
Ave
rage
Ann
ual D
istri
butio
ns Perce
nt w
itha D
istributio
n
for a H
ealth
Care
Claim
ebri.org Issue Brief • June 2014 • No. 400 27
$1,021
$2,435
50%
70%
0%
10%
20%
30%
40%
50%
60%
70%
80%
90%
100%
$0
$500
$1,000
$1,500
$2,000
$2,500
$3,000
Individual Family
Figure 28Average Annual Distributions Among Accounts With Claims and the
Likelihood of Having a Distribution for a Health Care Claim, by Type of Coverage When HSA Was Opened, 2013
Source: EBRI HSA Database.
2013
Ave
rage
Ann
ual D
istri
butio
nsPerce
nt w
itha D
istributio
n
for a H
ealth
Care
Claim
$968
$1,745 $1,956
$2,447 $2,470
$2,751 $2,782
51%
61%66%
71%
64%
71% 70%
0%
10%
20%
30%
40%
50%
60%
70%
80%
90%
100%
$0
$500
$1,000
$1,500
$2,000
$2,500
$3,000
$3,500
$1,000–$1,999 $2,000–$2,999 $3,000–$3,999 $4,000–$4,999 $5,000–$5,999 $6,000–$6,999 $7,000 or More
Deductible When HSA Was Opened
Figure 29Average Annual Distributions Among Accounts With Claims and the
Likelihood of Having a Distribution for a Health Care Claim, by Deductible When HSA Was Opened, 2013
Average Annual Claims Percent with a Claim
Source: EBRI HSA Database.
2013
Ave
rage
Ann
ual D
istri
butio
ns Perce
nt w
itha D
istributio
n
for a H
ealth
Care
Claim
ebri.org Issue Brief • June 2014 • No. 400 28
ebri.org Issue Brief • June 2014 • No. 400 29
References Bundorf, M. Kate. "Consumer-Directed Health Plans: Do They Deliver?" Research Synthesis Report No. 24 (Robert
Wood Johnson Foundation), October 2012.
Fronstin, Paul. "Characteristics of the Population With Consumer-Driven and High-Deductible Health Plans, 2005–2013." EBRI Notes no. 4 (Employee Benefit Research Institute) April 2014: 2-8.
. "Health Savings Accounts and Health Reimbursement Arrangements: Assets, Account Balances, and Rollovers, 2006–2013." EBRI Issue Brief, no. 395 (Employee Benefit Research Institute, January 2014).
. "Findings From the 2013 EBRI/Greenwald & Associates Consumer Engagement in Health Care Survey." EBRI Issue Brief, no 393 (Employee Benefit Research Institute, December 2013).
Fronstin, Paul, and M. Christopher Roebuck. "Health Care Spending after Adopting a Full-Replacement, High-Deductible Health Plan With a Health Savings Account: A Five-Year Study." EBRI Issue Brief, no. 388 (Employee Benefit Research Institute, July 2013).
Fronstin, Paul, Martin J. Sepulveda, and M. Christopher Roebuck. "Consumer-Directed Health Plans Reduce The Long-Term Use Of Outpatient Physician Visits And Prescription Drugs." Health Affairs 32, no. 6 (June 2013): 1126-1134.
. "Medication Utilization and Adherence in a Health Savings Account-Eligible Plan." American Journal of Managed Care 19, no. 12 (December 2013): e400-e407.
Endnotes 1 America’s Health Insurance Plans (AHIP) found that 15.5 million people were enrolled in an HSA-eligible plan in January 2013 (See http://www.aahp.org/hsa2013/). CEHCS estimated that 20.4 million people were enrolled in an HSA-eligible plan in August 2013 (see http://www.ebri.org/pdf/EBRI_IB_012-13.No393.CEHCS.pdf). The actual number likely falls somewhere in between. The AHIP census was based on 91 companies. Some insurers may not have reported HSA-eligible enrollment numbers to AHIP, which would mean that the AHIP census underestimated HSA-eligible enrollment. The CEHCS may have overestimated the percentage of individuals in an HSA-eligible plan as it is based on self-reported eligibility status.
2 See www.devenir.com/research/year-end-2013-devenir-hsa-research-report/
3 See Figure 8 in http://uk.mercer.com/press-releases/1565095 and Figure 33 in http://www.towerswatson.com/DownloadMedia.aspx?media={B5CC3143-9B78-4B92-96A4-3F569300406F}
4 See the literature review in Bundorf (2012) as well as more recent research in Fronstin and Roebuck (2013); Fronstin, Sepulveda and Roebuck (June 2013); and Fronstin, Sepulveda and Roebuck (December 2013).
5 See www.ahip.org/HSAAccounts2009/
6 See www.devenir.com/research/year-end-2013-devenir-hsa-research-report/
7 See Fronstin (2013), Fronstin (January 2014), and Fronstin (April 2014).
8 Only Medicare enrollees ages 65 and older are allowed to pay insurance premiums from an HSA. A Medicare enrollee under age 65 cannot use an HSA to pay insurance premiums.
9 See www.aahp.org/hsa2013/
10 See Figure 6 in http://uk.mercer.com/press-releases/1565095
11 See Figure 6 in www.cdc.gov/nchs/data/nhis/earlyrelease/insur201309.pdf
12 See Exhibit 5.1 in http://kaiserfamilyfoundation.files.wordpress.com/2013/08/8465-employer-health-benefits-20131.pdf
13 See Exhibit 8.1 in http://kaiserfamilyfoundation.files.wordpress.com/2013/08/8465-employer-health-benefits-20131.pdf
14 See Exhibit 8.3 in http://kaiserfamilyfoundation.files.wordpress.com/2013/08/8465-employer-health-benefits-20131.pdf
ebri.org Issue Brief • June 2014 • No. 400 30
15 See Exhibit 8.4 in http://kaiserfamilyfoundation.files.wordpress.com/2013/08/8465-employer-health-benefits-20131.pdf
16 See Towers Watson/NBGH 2013/2014 Employer Survey on Purchasing Value in Health Care, http://www.towerswatson.com/DownloadMedia.aspx?media={B5CC3143-9B78-4B92-96A4-3F569300406F}
17 See www.devenir.com/research/year-end-2013-devenir-hsa-research-report/
18 According to Devenir, there were 10.7 million accounts holding $19.3 billion in assets as of Dec. 31, 2013. See www.devenir.com/research/year-end-2013-devenir-hsa-research-report/
19 At no time has any nonpublic personal information that is personally identifiable, such as Social Security number, been transferred to or shared with EBRI.
20 A very small percentage (less than 0.5 percent) of accounts have an account opening date prior to 2004. An HSA that was funded by amounts rolled over from an MSA was considered established on the date the MSA was established.
1100 13th Street NW · Suite 878 Washington, DC 20005
(202) 659-0670 www.ebri.org
www.choosetosave.org
Where the world turns for the facts on U.S. employee benefits. Retirement and health benefits are at the heart of workers’, employers’, and our nation’s economic security. Founded in 1978, EBRI is the most authoritative and objective source of information on these critical, complex issues. EBRI focuses solely on employee benefits research — no lobbying or advocacy.
EBRI stands alone in employee benefits research as an independent, nonprofit, and nonpartisan organization. It analyzes and reports research data without spin or underlying agenda. All findings, whether on financial data, options, or trends, are revealing and reliable — the reason EBRI information is the gold standard for private analysts and decision makers, government policymakers, the media, and the public.
EBRI explores the breadth of employee benefits and related issues.
EBRI studies the world of health and retirement benefits — issues such as 401(k)s, IRAs, retirement income adequacy, consumer-driven benefits, Social Security, tax treatment of both retirement and health benefits, cost management, worker and employer attitudes, policy reform proposals, and pension assets and funding. There is widespread recognition that if employee benefits data exist, EBRI knows it.
EBRI delivers a steady stream of invaluable research and analysis.
EBRI publications include in-depth coverage of key issues and trends; summaries of research findings and policy developments; timely factsheets on hot topics; regular updates on legislative and regulatory developments; comprehensive reference resources on benefit programs and workforce issues; and major surveys of public attitudes.
EBRI meetings present and explore issues with thought leaders from all sectors. EBRI regularly provides congressional testimony, and briefs policymakers, member organizations,
and the media on employer benefits. EBRI issues press releases on newsworthy developments, and is among the most widely quoted
sources on employee benefits by all media. EBRI directs members and other constituencies to the information they need and undertakes new
research on an ongoing basis. EBRI maintains and analyzes the most comprehensive database of 401(k)-type programs in the
world. Its computer simulation analyses on Social Security reform and retirement income adequacy are unique.
EBRI makes information freely available to all.
EBRI assumes a public service responsibility to make its findings completely accessible at www.ebri.org — so that all decisions that relate to employee benefits, whether made in Congress or board rooms or families’ homes, are based on the highest quality, most dependable information. EBRI’s Web site posts all research findings, publications, and news alerts. EBRI also extends its education and public service role to improving Americans’ financial knowledge through its award-winning public service campaign ChoosetoSave® and the companion site www.choosetosave.org
EBRI is supported by organizations from all industries and sectors that appreciate the value of unbiased, reliable information on employee benefits. Visit www.ebri.org/about/join/ for more.
EBRI Employee Benefit Research Institute Issue Brief (ISSN 0887137X) is published monthly by the Employee Benefit Research Institute, 1100 13th St. NW, Suite 878, Washington, DC, 20005-4051, at $300 per year or is included as part of a membership subscription. Periodi-cals postage rate paid in Washington, DC, and additional mailing offices. POSTMASTER: Send address changes to: EBRI Issue Brief, 1100 13th St. NW, Suite 878, Washington, DC, 20005-4051. Copyright 2014 by Employee Benefit Research Institute. All rights reserved. No. 400.
The Employee Benefit Research Institute (EBRI) was founded in 1978. Its mission is to contribute to, to encourage, and to enhance the development of sound employee benefit programs and sound public policy through objective research and education. EBRI is the only private, nonprofit, nonpartisan, Washington, DC-based organization committed exclusively to public policy research and education on economic security and employee benefit issues. EBRI’s membership includes a cross-section of pension funds; businesses; trade associations; labor unions; health care providers and insurers; government organizations; and service firms.
EBRI’s work advances knowledge and understanding of employee benefits and their importance to the nation’s economy among policymakers, the news media, and the public. It does this by conducting and publishing policy research, analysis, and special reports on employee benefits issues; holding educational briefings for EBRI members, congressional and federal agency staff, and the news media; and sponsoring public opinion surveys on employee benefit issues. EBRI’s Education and Research Fund (EBRI-ERF) performs the charitable, educational, and scientific functions of the Institute. EBRI-ERF is a tax-exempt organization supported by contributions and grants.
EBRI Issue Briefs is a monthly periodical with in-depth evaluation of employee benefit issues and trends, as well as critical analyses of employee benefit policies and proposals. EBRI Notes is a monthly periodical providing current information on a variety of employee benefit topics. EBRIef is a weekly roundup of EBRI research and insights, as well as updates on surveys, studies, litigation, legislation and regulation affecting employee benefit plans, while EBRI’s Blog supplements our regular publications, offering commentary on questions received from news reporters, policymakers, and others. EBRI Fundamentals of Employee Benefit Programs offers a straightforward, basic explanation of employee benefit programs in the private and public sectors. The EBRI Databook on Employee Benefits is a statistical reference work on employee benefit programs and work force-related issues.
Contact EBRI Publications, (202) 659-0670; fax publication orders to (202) 775-6312. Subscriptions to EBRI Issue Briefs are included as part of EBRI membership, or as part of a $199 annual subscription to EBRI Notes and EBRI Issue Briefs. Change of Address: EBRI, 1100 13th St. NW, Suite 878, Washington, DC, 20005-4051, (202) 659-0670; fax number, (202) 775-6312; e-mail: [email protected] Membership Information: Inquiries regarding EBRI membership and/or contributions to EBRI-ERF should be directed to EBRI President Dallas Salisbury at the above address, (202) 659-0670; e-mail: [email protected]
Editorial Board: Dallas L. Salisbury, publisher; Stephen Blakely, editor. Any views expressed in this publication and those of the authors should not be ascribed to the officers, trustees, members, or other sponsors of the Employee Benefit Research Institute, the EBRI Education and Research Fund, or their staffs. Nothing herein is to be construed as an attempt to aid or hinder the adoption of any pending legislation, regulation, or interpretative rule, or as legal, accounting, actuarial, or other such professional advice. www.ebri.org
EBRI Issue Brief is registered in the U.S. Patent and Trademark Office. ISSN: 0887137X/90 0887137X/90 $ .50+.50
© 2014, Employee Benefit Research InstituteEducation and Research Fund. All rights reserved.
Who we are
What we do
Our publications
Orders/ Subscriptions