Embed Size (px)
Citation preview

HR ANALYTICS: HOW DOES A DATA-DRIVEN APPROACH AFFECT
FAIRNESS PERCEPTIONS OF THE PERFORMANCE APPRAISAL SYSTEM?
Master thesis, MSc Human Resource Management (HRM)
University of Groningen, Faculty of Economics and Business
May 25, 2018
Pinelopi Apostolatou
Student number: 3187632
Antaresstraat 25-05
9742 LA Groningen
tel.: +31 (0) 645514561
E-mail: [email protected]
Supervisor: prof. Dr. B.A Nijstad
Human Resource Management & Organizational Behavior
Acknowledgement: I would like to thank my supervisor prof. Dr. B.A Nijstad for being so
helpful and inspiring. This thesis would be impossible without his valuable suggestions.

HR ANALYTICS: HOW DOES A DATA-DRIVEN APPROACH AFFECT
FAIRNESS PERCEPTIONS OF THE PERFORMANCE APPRAISAL
SYSTEM?
ABSTRACT
This study examines the potential of HR Analytics (HRA) to meliorate fairness perceptions of the
performance appraisal (PA) system. In particular, the relationship between the use of HRA and
perceived procedural fairness of the PA system is investigated. I propose that a high quality HRA
system would result in higher fairness perceptions than no HRA at all, while a low quality HRA
system would lead to lower fairness perceptions than no HRA at all. Moreover, I hypothesize that
human judgment would have an effect on perceived procedural fairness of the PA system. This
effect of human judgment is predicted to be weaker in case of high quality HRA. To test these
hypotheses, an online scenario-based survey (N=157) was performed. Even though none of the
hypotheses was supported, the results showed that high quality HRA led to higher procedural
fairness perceptions of the PA system than a low quality HRA. This study also identified some
significant relationships among types of fairness and work attitudes. Procedural fairness was found
to be positively correlated to distributive fairness, job satisfaction and organizational commitment,
but negatively correlated with turnover intentions. As this is one of the first attempts in which the
role of HRA on the PA system is explored, future research is needed for generalized assumptions.
Keywords: HR Analytics, performance appraisal, procedural fairness, human judgment

INTRODUCTION
The field of Human Resource Management has evolved dramatically due to the enormous
impact of technology. More specifically, technology has transformed the way HR processes are
currently managed, mainly in terms of how organizations collect, store, use, and disseminate
information about applicants and employees (Stone et al. 2015). Because of this vast increase in
the availability and reach of HR data, human resource professionals have the opportunity to more
effectively employ HR metrics to assess HR in terms of its efficiency, effectiveness, and impact
(Dulebohn & Johnson, 2013). Thus, organizations have started to use a rational decision-making
model in HR, where decisions are based on quantitative information (Popovič et al., 2012).
HR analytics (HRA) is part of this overall trend of rational decision making. It involves the
use of data and statistical analysis to make decisions about HR practices based on facts (Davenport
& Harris, 2007). This means that HRA is not only about collecting data, but also about knowing
how to use it (Castellano, 2014). For this reason, there has been an increasing focus on Decision
Support Systems and Business Intelligence tools within human resource information systems.
These systems and tools make it possible to combine HR with other organisational data in order
to provide more developed analytical tools and enable better decision-making (Dulebohn &
Johnson, 2013). In this way, HR professionals can make better decisions that affect many of the
HR practices and policies.
Performance management is one of the HR practices that could benefit from the use of
HRA. Often, the performance appraisal (PA) system accounts for a large portion of employees’
dissatisfaction in terms of perceived fairness and effectiveness (Shrivastava and Purang, 2011).
Researchers have developed and practitioners have implemented various changes to the evaluation
criteria, rating instruments, and appraisal procedures in an effort to improve the accuracy and
perceived fairness of the process (Banks & Murphy, 1985). A data-driven approach, as the one of
HRA, could be a new tool in the appraisal procedures as it has the potential to contribute to the
perceived procedural fairness of the PA system. Indeed, data-driven decision making is defined as
something that is based on data and facts instead of intuition or personal experience (McAfee &
Brynjolfsson, 2012), which makes it a less biased approach.
In order to implement HRA effectively, companies need employees with the right
knowledge and skills to collect the correct data (Marler and Boudreau, 2017). The analysis of this

data should provide results that lead to organizational outcomes. When these conditions are not
met, HRA becomes of low quality and results in misguided decision-making. In that case, there is
a serious impact on the perceived accuracy and fairness of these decisions. This is where human
judgment could help. By assessing the quality of HR Analytics and filtering the outcomes using
common sense, HR professionals could deliver more accurate performance evaluations. Therefore,
the application of HR analytics, combined with human judgment, can potentially lead to better
conclusions and practices (King, 2016).
The purpose of this paper is to investigate the potential of HRA to contribute to fairness
perceptions of the PA system. For this reason, the relationship between the use of HRA and
perceived procedural fairness of the PA system will be examined, taking into account the
moderating effect of human judgment. The relationships analyzed in this paper have both
theoretical and practical significance. First, HRA is a new trend in the field of HR that has not
been adequately researched. Second, perceived fairness of the appraisal system is an important
issue to be faced by managers (Bretz, Milkovich and Read, 1992), as it accounts for a large portion
of employees’ dissatisfaction (Shrivastava and Purang, 2011).
Thus, the research question of this paper is: How does the data-driven approach of HR Analytics
affect fairness perceptions of the Performance Appraisal system?
To answer the above-stated question, I conducted an experimental scenario-based study.
The methodology of this study is presented, right after the theoretical development of the key
concepts and their relationships.

THEORETICAL FRAMEWORK
HR Analytics
Data analytics has been described as a merge of art and science (Fitz-enz & Mattox,
2014). It transforms a set of unorganized and unprocessed facts into information through analysis.
In turn, this information becomes knowledge when its importance or relevance for a problem area
is identified. As has been previously argued, knowledge is the ultimate source of organizational
competitive advantage (Grant, 1999). Supporting this claim, wide and sophisticated use of
analytics already exists in functions such as Finance, Supply Chain and Marketing (Hoffmann,
Lesser and Ringo, 2012). Data analytics can provide quantitative information about HR
performance as well and has the potential to put HR leaders on more equal base with others in the
organization as they all compete for limited resources (Schwarz and Murphy, 2008).
Many scholars have also argued that some key factors in the transition of HRM to a
strategic partner is data processing, analysis and measurement that function as the basis for HRM
decision-making (Lawler et al., 2004; Walsh et al., 2010). HR Analytics (HRA) involves the use
of data and statistical analysis to make decisions about HR practices based on facts (Davenport
and Harris, 2007). Furthermore, HRA has been defined as a fact-based decision-making method
with the goal of improving the quality of people-related decisions for the purpose of improving
individual performance (Bassi et al., 2012). It can also give insights into how HR practices and
policies affect organizational performance and, therefore, become a powerful tool for HR functions
to add value to the organization (Lawler et al., 2004).
In this study, HRA is defined as the extensive use of data, statistical and quantitative
analysis, explanatory and predictive models, and fact-based management to drive decisions and
actions (Davenport & Harris, 2007) in HRM, by analyzing HR and business data with the goal of
predicting and directing employee performance and business outcomes (Bassi et al., 2012).
There are many factors that determine the success and quality of HRA. Minbaeva (2017)
conceptualized HRA as an organizational capability that includes three dimensions: analytical
competencies, data quality, and strategic ability to act. First, HRA is dependent on the ability,
motivation and opportunity of analytics users of the entire organization. Second, once the purposes
behind analytical efforts are realized and an understanding of how human capital could contribute
to organizational success is obtained, it is important to consider the data that will be used in

subsequent analyses (King, 2016). Data quality must be considered in terms of both missing data
and possible errors in data entries. Angrave et al. (2016) also argue that, if any meaningful insight
is to be gained, analytics must be rooted in an understanding of the collected data and their context.
Third, in order to derive meaning from these data, statistical techniques and experimental
approaches should be used in order to show causal relationships between particular HR practices
and performance metrics that affect the success of the business. These performance metrics can be
customer satisfaction, sales per employee and the profitability of particular business activities
(Lawler et al., 2004).
Based on the conceptualization of Minbaeva (2017), we can assume that quality of HRA
depends on the analytical competencies of data operators, quality of data and whether HRA can
contribute to organizational success. Thus, for the needs of this study, quality of HRA is defined
as the extent to which data operators are competent in analyzing data that is accurate, consistent,
relevant, and whose analysis generates knowledge that can add value to the organization.
However, not all the organizations are capable of implementing high quality HRA. Fitz-
enz and Mattox (2014) note that approximately 75% of HR departments do not have usable basic
metrics, such as cost per hire, overall employee turnover, and performance. This means that there
is a long way to go from their current state to the appropriate use of analytics. Similarly, Angrave
et al. (2016) argue that it is unclear whether HR has the ability to effectively utilize trends in big
data and analytics to reap organizational benefits. This means that most individuals in HR
functions do not possess the skills, knowledge, and insights required to appropriately use the HR
data they have at their disposal. Even though the skills and ability to conduct these analyses are
present, it is still a challenge to gather the data necessary to turn information into results (Fitz-enz
& Mattox, 2014). Lastly, organizations tend to collect data that is concentrated more on HRM
itself, and not on its effect on the business (Lawler et al., 2004).
Performance Appraisal & Perceived Fairness
Performance appraisal (PA) is one of the most critical HR practices in organizations by
which supervisors evaluate the performance of subordinates. More specifically, supervisors use
appraisal ratings to make pay and promotion decisions, identify training and development needs
and motivate employees (Cascio & Bernardin, 1981). Perceived fairness of these ratings is one

particular type of employee reaction that has been found to be related to acceptance or rejection of
performance appraisals (Murphy & Cleveland, 1991). Thus, reactions towards the PA system
depend on the three types of perceived fairness, namely: (1) distributive fairness which focuses on
the outcomes of the appraisal rating, (2) procedural fairness that focuses on the appraisal rating
procedures and (3) interactional fairness which focuses on the interpersonal treatment employees
receive during the appraisal process (Narcisse & Harcourt, 2008).
In this study, the focus is on procedural fairness, as it has attracted a great deal of attention
in the context of PA. Lawler (1967) discovered that in order to have a successful performance
appraisal system, ratees must have confidence in the evaluation process. This means that the
performance system must have procedural fairness. It has also been argued that people care about
the procedural fairness of the PA system because of its implications for tangible outcomes that
they will receive (Thibaut and Walker, 1975). As instrumental theory argues, people believe that
they will receive what they deserve when procedures are fair. Lastly, according to Keeping and
Levy (2000), procedures used to appraise performance and the manner in which performance-
related information is communicated play an integral role in shaping employees’ satisfaction with
the appraisal process.
In spite of the attention and resources paid to PA, it continues to generate some
dissatisfaction among employees as it is often viewed as inaccurate, unfair, and political (Skarlicki
and Folger, 1997). Evans and McShane (1988) found that perceived fairness of the prior year’s
performance appraisal affects the perceived fairness of the current year’s performance appraisal.
Furthermore, employees that have a good two-way dyadic relationship with their managers have
more control over appraisal procedures because of this high leader-member exchange (LMX)
relationship (Erdogan, 2002). Research has also found that an employee’s similarity to the rater
may have a favorable influence on one’s performance ratings (Tsui & O’Reilly, 1989). Lastly,
studies have shown that managers' performance judgments are sometimes influenced by the
gender, race, or age of the evaluatee (Murphy and Cleveland, 1995). In these cases, PA does not
depend only on the actual performance of the employees, as it is affected by biases.
It is also widely accepted that perceptions of fairness influence the way people think, feel,
and act on the job (Bies and Shapiro 1987). Research has demonstrated that perceptions of fairness
result in more favorable employee attitudes and behaviors, such as organizational citizenship

behaviours (Skarlicki and Latham, 1997) and organizational commitment (Folger and Konovsky
1989). On the other hand, serious consequences may arise from not implementing a fair
performance appraisal process, such as lower morale and productivity, and higher rates of
absenteeism and tardiness, and eventual turnover (Wright, 2004). Similarly, dissatisfaction with
performance appraisal could potentially lead to decreased motivation and feelings of inequity
(Dobbins, Cardy & Platz-Vieno, 1990). As it occurs, the perception of fairness in PA is one of the
most important factors and should considered a criterion when reviewing PA effectiveness (Jacobs,
Kafry, and Zedeck, 1980). Therefore, in order to implement effective PA, organizations need to
consider its fairness.
HR Analytics in the Performance Appraisal system
The biased performance evaluations that PA may include, create challenges for ethical
decision-making in organizations (Maas and Torres-González, 2011). Murphy and DeNisi (2008)
suggest that research needs to examine the effects of new technologies on performance appraisal,
as they have the potential to reduce these deficiencies. In this direction, Farr et al. (2013) pointed
out that incorporating technology into the PA system has various benefits over traditional PA
systems. It can provide objective measures that mitigate biases in supervisory ratings (Campbell
et al., 1998). As a result, reducing subjectivity biases through technology, makes the PA process
more accurate and reliable (Murphy and DeNisi, 2008).
HR Analytics (HRA) belongs to these new technologies that could be a potential solution
to the issues of subjectivity in the PA system. Through data analytics, the goal is to transform large
complex masses of data into knowledge and, in this way, help the decision-making process of
HRM by making more accurate and data-driven decisions (Rasmussen & Ulrich, 2015). Data-
driven decision making is often defined as something that is based on data and facts instead of
intuition or personal experience (McAfee & Brynjolfsson, 2012). When the use of HRA provides
integrated, consistent and trustworthy data (LaValle et al., 2011), it can significantly reduce biases
related to human cognition.
Folger, Konovsky and Cropanzano (1992) used a "due process" metaphor to extend
the application of justice to performance appraisal. Three essential factors, namely adequate notice,
judgment based on evidence, and fair hearing were used to describe a procedurally fair system.

HRA could positively affect all these factors. First, adequate notice involves well documented
standards and objectives, and constant feedback. When HRA is used in the PA, standards and
objectives are agreed upon, implemented and communicated beforehand. Moreover, feedback can
be easily and regularly extracted. Second, HR Analytics is a logical method that enables
technological manipulation of information to provide insight on relevant issues and an evidence-
based approach to decision making (King, 2016). By this way, employees can be convinced that
evaluations are judgments based on evidence about their actual performance, rather than being
biased by factors such as personal prejudices. Third, fair hearing refers to an opportunity to
influence the evaluation decision through evidence and argument, and an opportunity to access
and challenge this decision (Folger et al. 1992). With HRA, employees can always ask access to
the data analyzed for their evaluation and use it as evidence in case they want to support their
dissatisfaction. In case of high quality data and HR professionals with high analytical capabilities,
this evidence becomes even stronger. Thus, I hypothesize that:
Hypothesis 1: High quality HR Analytics leads to higher procedural fairness perceptions
of the PA system than no HR Analytics at all.
The purpose of HRA is to contribute to the decision-making process by increasing data
quality and improving the integration of data from different sources (Dulebohn & Johnson, 2013).
However, the primary issue with this approach is that data quality is treated as an ‘end’ goal in
itself, rather than as a ‘means’ to achieving organizational objectives (Storey, 2012). As Orr (1998)
argues, the quality of data input should be accurate, timely, and consistent enough for the
organization to make reasonable decisions. Once data inconsistency becomes an issue due to some
intentional or accidental faults, such as data input errors, and data operator’s subjective judgment
(Strong et al., 1997) or low ability, trust in data quality can be significantly impaired. In turn, poor
data quality can be a major cause for damages and losses on organizational processes. To make
the matter worse, the extent of business damages due to missing and inconsistent data can be
difficult to assess, as it becomes virtually impossible to restore the data quality (Kwon et al., 2014).
Then, the decision maker may be forced to rely on alternative solutions, including resorting to
subjective knowledge, observing others’ behaviors through social comparison or even random

walk (Kim & Tsai, 2011). This undoubtedly discourages data-driven decision making (Kwon et
al., 2014), and in case of PA, a more traditional performance evaluation would lead to higher
perceived procedural fairness.
This leads us to the following hypothesis:
Hypothesis 2: Low quality HR Analytics leads to lower procedural fairness perceptions
of the PA system than no HR Analytics at all.
HR Analytics versus human judgment in the Performance Appraisal system
As stated before, a data-driven approach has the potential to improve decision-making in
the PA system. According to Pfeffer and Sutton (2006), decisions should be based on data. As they
argue, it is the evidence that helps us to make the right choices. Furthermore, the use of HRA
provides integrated, consistent and trustworthy data (LaValle et al., 2011) that can significantly
reduce biases related to human cognition. Pfeffer and Sutton (2006) also stress the possible impact
of evidence-based decision making as “changing how every manager thinks and acts”. Lastly,
Davenport, Harris, and Morison explain that this change alters the basis of decision-making from
‘gut feeling’ and intuition to objective data and analysis (Bassi et al., 2012).
On the other hand, the use solely of data in the decision-making process has been criticized.
To start with, Davenport (2006) argues that not all decisions should be wholly grounded in
analytics. Instinct and anecdote should be used in decisions involving human capital, as research
supports that many people are able to make fast and accurate judgments of personality and
character. Moreover, analytics might offer a good excuse to treat employees as pure resources, but
special attention should be paid to the “human side” of human resources (Davenport et al., 2010).
HRA is still sometimes seen as replacement for human thinking. But, data and analytics do not
often lead directly to actions (Rasmussen & Ulrich, 2015). According to Castellano (2014), it is
more a balancing between the human judgment and analytics. Qualitative information, for example
observations and interviews, is needed in addition to hard data.
Whether performance can be evaluated only with quantitative data is another important
issue of PA. According to Fitz-enz (2010), everything in business can be measured in 5 ways: cost,
time, quantity, quality and human reaction. Moreover, the use of analytics makes it easier to
collect, document and retrieve a variety of performance data from various sources, which provides
managers with better information to observe employee performance in terms of both outcome and
behavior (Sharma, 2017). It is, therefore, essential for the organizations to be able to quantify the
multi-dimensional aspects of performance which play a dominant role in performance
measurement systems (Dervitsiotis, 2004).
However, not everything that counts can be counted, and not everything that can be counted
counts (Cameron, 1963). This means that there are some aspects of the employees’ job that cannot
be captured through quantitative measures or there are cases where the employer is not able to
measure what they require from employees. Subjectivity in performance measurement was
introduced to decrease distortion by taking into account those aspects (Kauhanen & Napari, 2012).
Subjective performance measures can be defined as the superior’s subjective judgments about the
qualitative aspects of the job performance and increased discretion of managers in performance
ratings (Moers, 2005). Thus, raters cannot rely only on numbers without taking into consideration
common sense.
Therefore, there is some debate among HR scholars and practitioners about the balance of
using intuition and data in making decisions (King, 2016). Ulrich and Dulebohn (2015) agree that
both are necessary and suggest that HR professionals need to improve their competencies in order
to be able to utilise HRA as part of the decision-making processes. All in all, the application of
HRA, combined with human judgment and managerial expertise, will lead to better conclusions
and practices than could have resulted from following the status quo of intuition and gut reaction
alone (King, 2016). Thus, human judgment will be necessary in order both the qualitative and
quantitative aspects of performance evaluation to be taken into account properly.
In case of low quality HRA, either because of the organization’s weak analytical
capabilities or inaccurate and insufficient data collection, human judgment will be even more
necessary. As stated above, poor data quality and weak capabilities of data analysts can be a major
cause for damages and losses (Kwon et al., 2014). In case of PA, there are many chances for the
performance evaluations to be inaccurate and, therefore, unfair. One could argue that HR
professionals should intervene and modify the decisions made depending on the results of a low-
quality system. Thus, comparing to high quality HRA, there are more chances for low quality HRA

to lead to misguided decision- making and, therefore, weaker procedural fairness perceptions.
That’s why the effect of human judgment is stronger in this case.
From the above, I hypothesize that:
Hypothesis 3: Human judgment on the HR Analytics results has a positive main effect on
the perceived procedural fairness of the PA system.
Hypothesis 4: The effect of human judgment on the perceived procedural fairness of the
PA system is stronger when the quality of HR Analytics is low, rather than high.
Hence, the conceptual model of Figure 1 occurs.
Figure 1 Conceptual model
Quality of HR
Analytics
Perceived
Procedural Fairness
of the PA system
Human Judgment

METHOD
Design and participants
In order to investigate the hypotheses stated above, an experimental study was conducted.
The independent variable “Quality of HR Analytics” was manipulated, creating the following two
conditions: (1) High quality HRA (2) Low quality HRA. The moderator “Human judgment” was
either present or absent. There was also a control condition with no HR Analytics at all. That lead
to a 2 (quality of HRA: high vs low) x 2 (Human judgment: presence vs absence) + 1 (control
condition without HRA) design.
The sample consisted of 89 women and 68 men, 157 participants in total. Their average
age was 29 years (SD=7.72). Only ten of the respondents did not hold a university diploma, while
70 of them had already completed a Master’s degree. Furthermore, 92.4% of the sample has
already some work experience, 51.7% is currently employed, and 35.7% is currently studying.
Last but not least, 24.8% of the respondents hold an entry level job, 29% an intermediate or
experienced level job, and 11% a first level management position. The detailed participants
demographic information can be found in the Appendix (Table 2).
Procedure
An online scenario- based survey was distributed to employees of diverse companies and
organizations located worldwide. I used my own network in order to reach out to them by phone,
email, social media, or physical meetings. After explaining the purpose and content of this study,
the respective online survey was sent to them and they could complete it voluntarily afterwards.
Apart from 157 valid answers, there were approximately 80 incomplete ones, as well as 20 that
failed the attention check. The latter were identified by the item “Please choose “Strongly agree”
to show that you are paying attention”.
Once the participants had read and agreed to the consent form, they were assigned randomly
to five different scenarios. All of them had the same start:
“Imagine that you work for a company where your performance is regularly evaluated
through a performance appraisal system. The respective appraisal ratings determine your
payment, possible internal mobility, promotion or dismissal and the identification of

training and development needs. For the last performance appraisal, however, you
received slightly lower ratings than you expected.”
In all the scenarios, it was presumed that the particular performance appraisal system lead
to a slightly disappointing evaluation. That’s because employees who receive low performance
ratings are more likely to perceive the process as unfair than those who receive high performance
ratings (Landy et al., 1980). Satisfactory ratings might have made the respondents happy and
possibly uninterested in the procedures of the appraisal process.
The rest of each scenario was different, satisfying the manipulation control of the study.
Briefly, the content of each scenario (See Appendix for detailed content) was:
Scenario 1: No HR Analytics, only human judgment
“This assessment is solely based on the evaluation by your supervisor.
Your supervisor, who is the main assessor of your performance, took into
account your performance, attitude, the relationships you have built inside
your work environment and your general behavior.”
Scenario 2: High quality HR Analytics, but no human judgment
“This assessment is solely based on information from the HR Analytics
system. In particular, your company has developed and implemented a
system where integrated data from all the departments is analyzed. This
data has been gathered for years and is accurate, consistent and
trustworthy.”
Scenario 3: High quality HR Analytics & human judgment
“This assessment is based on information from the HR Analytics system,
as well as on an evaluation by your supervisor. In particular, your
company has developed and implemented a system where integrated data
from all the departments is analyzed. This data has been gathering for
years and is accurate, consistent and trustworthy.”
Scenario 4: Low quality HR Analytics, but no human judgment
“This assessment is solely based on information from the HR Analytics
system. In particular, your company has developed and implemented a
system where integrated data from all the departments is analyzed. This

data has been gathered for years but there are some deficiencies, making
it less trustworthy in some cases.”
Scenario 5: Low quality HR Analytics & human Judgement
“This assessment is based on information from the HR Analytics system,
as well as on an evaluation by your supervisor. In particular, your
company has developed and implemented a system where integrated data
from all the departments is analyzed. This data has been gathered for
years but there are some deficiencies, making it less trustworthy in some
cases.”
After the above information had been displayed, the items regarding fairness and satisfaction with
the performance appraisal system were presented. On the next page, the impact of this rating on
job satisfaction, intentions to leave, and commitment to the company was measured. The
subsequent set of items were some statements for manipulation control purposes. Lastly, self-
evaluation of the respondents was measured and demographic data was collected.
Measures
All responses were recorded on a 5-point Likert-type scale, ranging from 1 (strongly
disagree) to 5 (strongly agree). An exploratory factor analysis was conducted for the items related
to fairness perceptions, as they were combined from different scales. Initially, four components
were identified. The item “If I had evaluated my own performance, my rating would have been
similar to the one of my supervisor” of the first procedural fairness scale did not load on the
procedural fairness factor. Reasonably, the respondents were influenced by the statement that they
received slightly lower ratings than they expected. After this item had been excluded, three
components were identified, namely system procedural fairness, supervisor procedural fairness,
and distributive fairness. The factor loadings can be found in the Appendix (table 3). Thus, the
respective items were used for the measurement of those variables.
Dependent variables
Procedural fairness. Procedural fairness was measured by items from two different scales.
The first one consisted of six items and was developed by Tang and Sarsfield- Baldwin (1996). A

sample item is “The procedures of this performance appraisal were fair”. The other one, developed
by Erdogan et al. (2001), included three items measuring system procedural fairness and six items
measuring rater procedural fairness. A sample item is “My supervisor uses this performance
appraisal system to reward the employees s/he likes” (reversed). Five of the six items from the first
scale (one was excluded due to low factor loading) and the three items representing system
procedural fairness of the second were averaged to yield a single score scale, as were the rest six
items of the second scale representing rater procedural justice. Cronbach’s alphas were .86 and .85
for system procedural fairness and rater procedural fairness, respectively.
Distributive fairness. Distributive fairness was measured by four items developed by
Colquitt (2001). An example item is “The outcome of this performance appraisal reflects the effort
I have put into my work”. This scale was specific to the performance appraisal context and its
reliability in this study was almost excellent (Cronbach’s Alpha= .899).
Satisfaction with the PA system. Satisfaction with the PA system was measured by the item
“Overall, I am satisfied with the performance appraisal of my company”.
Before the items of the following variables, the message “Please indicate how likely would the
following effects be due to this performance appraisal” was displayed.
Job satisfaction. Job satisfaction was measured by the item “My job satisfaction would be
higher”.
Turnover intentions. Turnover intentions were measured by the item “I would look for
another job”.
Commitment. Commitment was measured by the item “I would be more committed to the
organization”.
Manipulation and control variables
Quality of HRA. Quality of HRA was measured to check the manipulation of the
homonymous independent variable. The items “This system is of low quality” (R) and “This
system uses reliable data” were combined in order to yield a single variable indicating the extent
to which the system was perceived of high quality or not. The reliability was acceptable
(Cronbach’s Alpha= .732).

Human judgment. Perceived presence of human judgment was measured to check the
manipulation of the homonymous moderator. The item “This appraisal system relies both on
human judgment and data analysis” indicated if respondents identified human judgment, apart
from sole data analysis.
Self- evaluation. The control variable “Self- evaluation” was measured by a scale
developed by Judge, Locke, Durham, and Kluger (1998). Its twelve items were relevant to
neuroticism, self-esteem, self-efficacy, and locus of control. One example item measuring self-
efficacy is “I am capable of coping with most of my problems”. The Cronbach’s alpha of this scale
was .83.
RESULTS
Descriptive statistics and correlations among the main variables of the study are provided
in Table 4. Most variables have a relationship with one another. To start with, system procedural
and distributive fairness have a statistically significant positive relationship (p < .001). The
magnitude of this association is high (r=.66). Rater procedural fairness, satisfaction with the PA
system, job satisfaction, and commitment to the organization are all positively correlated with both
system procedural and distributive fairness. However, this is not the case for the intentions of
turnover, the only variable that is significantly negatively correlated with the ones mentioned
above. Moreover, gender, age, education, tenure, as well as self-evaluation did not have any
notable correlation with fairness perceptions.

Table 4
Descriptive Statistics and Intercorrelations
Variable M SD 1 2 3 4 5 6 7 8 9 10 11 12
1. System procedural fairness
2. Rater procedural fairness
3. Distributive fairness
4. Satisfaction with PA
5. Job satisfaction
6. Turnover intentions
7. Commitment
8. Self-evaluation
9. Gender1
10. Age
11. Education2
12. Tenure3
2.96
3.53
2.97
2.94
2.47
2.66
2.64
3.54
1.57
28.52
5.35
2.94
.78
.81
.89
1.06
1.15
1.10
1.14
.60
7.72
.50
.96
1.26
1
.426**
.732**
.807**
.496**
-.443**
.498**
-.113
-.160*
.100
-.190*
.028
1
.392**
.376**
.228**
-.313**
.341**
.100
-.088
.081
-.164*
.093
1
.725**
.509**
-.373**
.544**
.035
-.194*
.059
-.141
.043
1
.518**
-.411**
.505**
-.093
-.138
.071
-.142
.041
1
-.348**
.513**
-.027
-.145
.068
-.081
.028
1
-.277**
.080
.031
.056
.188*
.102
1
-.004
-.149
.007
-.166*
-.041
1
-.180*
-.018
.161*
.083
1
-.043
.051
.001
1
.177*
.779**
1
.197*
1
Notes. N=157
** Correlation is significant at the 0.01 level (2-tailed).
* Correlation is significant at the 0.05 level (2-tailed).
1 Gender: 1=Male, 2=Female 2 Education:1=less than high school, 2=high school, …,8=PhD 3 Tenure: 1=none,2=less than 2 years, …, 5= 10+ years.

Manipulation check
To check if the manipulation worked, I conducted a two-way ANOVA with dependent
variable the manipulation check “Quality of HRA” and as factors the quality of HRA and the
presence or absence of human judgment. The means of the dependent variable were significantly
different for high (M=3.50, SD=1.04) and low (M=2.77, SD= .77) quality HRA system,
F(1,118)=20.484, p=.000. The effect of human judgment was insignificant, F(1,118)=1.812,
p=.181, as well as the interaction effect, F(1,118)=3.748, p=.055. Thus, the respondents could
distinguish when the HRA system was of low or high quality only by the description of the system
and that made the manipulation of the independent variable of the study, quality of HRA,
successful.
A one-way ANOVA was used for examining if presence of the moderator, human
judgment, was noticed. The manipulation check “Human judgment” was used as dependent
variable and human judgment (presence or absence) as factor. The mean of the dependent variable
for the scenarios with only data analysis (M= 3.08, SD=1.30) was significantly lower than the mean
for the scenarios with both data analysis and human judgment (M= 3.80, SD=1.19),
F(1,120)=12.122, p=.001. Therefore, presence of human judgment was identified by the
respondents, fact that makes the second manipulation of the study also successful.
Hypotheses testing
To test hypothesis 1, which stated that high-quality HR Analytics leads to higher
procedural fairness perceptions of the PA system than no HR Analytics at all, I conducted a one-
way ANOVA. System procedural fairness was used as dependent variable and presence of HRA
as factor. Responses regarding low quality HRA were excluded. The results showed that the
respondents of the control condition without HRA found the appraisal system less fair (M=2.96,
SD=.82) than the ones of the two scenarios that had high-quality HRA system (M=3.19, SD=.83).
However, system procedural fairness did not differ significantly between these two cases,
F(1.93) =1.762, p=.188. Therefore, the first hypothesis was not supported.
Hypotheses 2 stated that low quality HR Analytics leads to lower procedural fairness
perceptions of the PA system than no HR Analytics at all. To examine this statement, I conducted
the same one-way ANOVA analysis like before, excluding responses regarding high quality HRA

this time. The results revealed that the respondents of the control condition without HRA found
the appraisal system fairer (M=2.96, SD=.82) than the ones of the two scenarios that had low
quality HRA system (M=2.72, SD=.63). However, the scores pf system procedural fairness did not
differ significantly, F(1.95) =.168, p=.682. Therefore, the second hypothesis of this study was not
supported.
To test hypotheses 3 and 4, I excluded the responses regarding the control condition
without HRA and conducted a 2 (quality of HRA: high, low) x 2 (Human judgment: presence,
absence) between-subjects ANOVA. To start with, human judgment didn’t affect perceptions of
procedural fairness of the PA system significantly, F(1,118)=1.258), p=.264. Absence of human
judgment resulted in slightly lower procedural fairness (M=2.88, SD=.85) than presence of human
judgment (M=3.03, SD=.68). Thus, the third hypothesis that was about human judgment affecting
procedural fairness of the PA system cannot be supported by the data.
In addition, no interaction effect of quality of HRA and human judgment on procedural
fairness was identified, F(1,118)=.221, p=.639. This means that the effect of human judgment was
similar across both levels of HRA quality. More specifically, for high quality HRA, presence of
human judgment resulted in slightly higher procedural fairness (M=3.30, SD=.72) than absence of
human judgment (M=3.09, SD=.92). That was also the case for low quality HRA, with an even
smaller difference in procedural fairness levels between presence (M=2.77, SD=.52) and absence
of human judgment (M=2.68, SD=.73). According to the
fourth and last hypothesis of this study, the effect of human judgment on the relationship between
HRA and procedural fairness of the PA system is stronger when the quality of HR Analytics is
low. This hypothesis was not supported.
Lastly, A statistically significant main effect of HRA quality on PA system procedural
fairness was identified, F (1,118) =12.428, p=.001. The procedures of the PA using high quality
HRA was found fairer (M=3.19, SD=.83) than the ones of the PA using low quality HRA (M=2.72,
SD=.63). This finding proves that high quality HR Analytics leads to higher procedural fairness
perceptions of the PA system than low HR Analytics.

Figure 2 Estimated marginal means of system procedural fairness
Additional Analysis
For exploratory reasons, I conducted a two-way ANOVA with dependent variable the rater
procedural fairness and as factors the quality of HRA and the presence or absence of human
judgment. In this case, only human judgment had a statistically significant effect on rater
procedural fairness, F(1,118)=5.226, P= .024. More specifically, presence of judgment leads to
lower rater procedural fairness (M=3.47, SD=.75) than absence of human judgment (M=3.79,
SD=.83). Contrary to system procedural fairness, quality of HR Analytics did not have an effect
on these results, F(1,118)=2.008, P= .159. Interaction effect of human judgment and quality of
HRA on rater procedural fairness was not significant either, F(1,118)=3.885, p= .051. However,
the p value was found marginally higher than .05. Thus, it is worth to mention that absence of
human judgment resulted in higher rater procedural fairness (M=3.83, SD=.67) than presence of
human judgment (M=3.23, SD=.71) for low quality HRA. In case of high quality HRA, presence
(M=3.75, SD=.98) and absence of human judgment (M=3.71, SD=72) resulted in similar levels of
rater procedural fairness.
Furthermore, I ran the same analysis replacing rater procedural fairness with distributive
fairness first and with satisfaction with the PA system afterwards. Both variables had similar
results with system procedural fairness. This means that high-quality HR Analytics led to higher
distributive fairness and satisfaction with the PA system. In both cases, only quality of HR

Analytics had a statistically significant effect. This means that presence or absence of human
judgment, as well as their interaction with quality of the HRA system did not have an effect on
these dependent variables.
Figure 3 Estimated marginal means of rater procedural fairness
Table 5
Means and standard deviations of dependent variables
Low quality HRA High quality HRA
Dependent variable Control condition
(no HRA)
No human
judgment
Human
judgment
No human
judgment Human
judgment
System procedural fairness
Rater procedural fairness
Distributive fairness
Satisfaction with the PA
Job satisfaction
Turnover intentions
Organizational commitment
M
2.96
3.20
2.98
2.97
2.26
2.71
2.74
SD
.82
.74
.98
1.24
1.20
1.13
1.24
M
2.68
3.83
2.70
2.56
2.38
2.78
2.50
SD
.73
.67
.80
.88
1.01
.98
1.17
M
2.77
3.23
2.74
2.63
2.60
2.80
2.30
SD
.52
.71
.72
.77
1.17
1.16
.88
M
3.09
3.75
3.08
3.00
2.40
2.50
2.60
SD
.92
.98
.84
1.05
1.16
1.20
1.20
M
3.30
3.71
3.34
3.53
2.77
2.47
3.07
SD
.72
.72
.97
1.04
1.22
1.04
1.11

DISCUSSION
Research on performance appraisal (PA) systems shows that this HR practice suffers from
a great deal of subjectivity biases (Laird & Clampitt, 1985). These biases affect perceived fairness
of the procedures with which performance information is selected, observed, organized, and
eventually evaluated. As Leventhal (1980) proposed, fair procedures include bias suppression
rather than decisions based on preconceptions. However, the human element related to rater’s
attributions and expectations (Gibbons & Kleiner, 1993), and supervisors’ cognitive ability to
recall employees’ performance over a period (Lee, 1985) are inevitable in a traditional PA system.
According to the theoretical framework of this study, a data-driven approach, as the one of HR
Analytics (HRA), could eliminate these biases. This kind of decision making is based on data and
facts instead of intuition or personal experience (McAfee & Brynjolfsson, 2012). In addition,
further human judgment on the results that analyses provide can correct any inaccuracies of the
HRA system and eventually lead to better conclusions when it comes to performance evaluation
(King, 2016).
Unfortunately, the results of this study did not provide support for the hypotheses. Firstly,
it was assumed that high quality HRA leads to higher procedural fairness perceptions of the PA
system than no HRA at all. However, the PA system of the two scenarios that involved the use of
a high quality HRA was not found significantly fairer than the one of the control condition without
HRA. One explanation for this might be that the concept of HRA seemed unfamiliar to some
respondents resulting in questioning its fairness. On the other hand, conjectural ratees’ familiarity
with the traditional appraisal process might have been the reason why higher than expected
procedural fairness was attributed to it. Furthermore, the data did not support the claim that low
quality HRA leads to lower procedural fairness perceptions than no HRA at all. One reason why
might be that employees who had negative experience with subjective performance evaluations
found the use of HRA, even if its quality was low, extremely fair. Some respondents gave feedback
unofficially after the survey and argued that, as this system would be exactly the same for all the
employees, some small mistakes are acceptable when compared to biases and subjectivity.
Nevertheless, it was found that high quality HRA leads to higher procedural fairness
perceptions of the PA system than low quality HRA. Indeed, respondents that were assigned to
scenarios that involved the use of a high quality HRA system, with or without supervisor

intervention, perceived their evaluation significantly fairer than the ones that were confronted with
a low quality HRA system. The analysis of reliable performance related data by well trained
personnel would make employees feel that their performance ratings are accurate and fair.
However, procedural fairness scores were relatively low across the board. This can be attributed
to the assumption that conjectural ratees received a slightly disappointing evaluation. Generally,
employees who get low performance ratings are more likely to perceive the process as unfair than
those who receive high performance ratings (Landy et al., 1980).
Surprisingly, human judgment was not found to have an effect on procedural fairness when
there is an HRA system established, no matter of what quality. That was also the case for the
interaction effect of human judgment and quality of HRA. This means that the description of the
system played an important role and whether there was supervisor intervention or not did not affect
fairness perceptions. According to the theoretical framework of this study, it was predicted that,
especially when the HRA system is of low quality, employees would like the supervisor to
intervene and correct possible inaccuracies of data analyses. However, that was not supported by
the data. Different opinions of the respondents might have shaped this result. More specifically,
some ratees might have perceived the intervention of the supervisor beneficial, while others
somewhat threatening. Thus, the overall impact of human judgment came across as negligible.
Lastly, exploratory analysis showed that this investigation disclosed some other
unpredicted findings. Firstly, two dimensions of procedural fairness were distinguished: system
and rater. Interestingly, HRA and human judgment did not have the same impact on both of them.
Contrary to system procedural fairness, there was not an effect due to HRA’ quality while human
judgment had a statistically significant effect on rater procedural fairness. However, its presence
lead to lower rater procedural fairness, probably due to beliefs of subjectivity and biases.
Respondents might have perceived their supervisor’s intervention as a threat and not as a way to
correct inaccuracies of the data-driven system. This study also identified some important
relationships among types of fairness and work attitudes. Procedural fairness was found to be
positively correlated to distributive fairness, job satisfaction and organizational commitment, but
negatively correlated to turnover intentions. As expected, the majority of respondents felt that fair
procedures of the appraisal process would have a positive impact on their behavior and feelings in
their work environment.

Implications for theory and practice
Drawing from the above findings, several implications for theory can be derived. To start
with, Farr et al. (2013) suggested that incorporating technology into the PA system has various
benefits over traditional PA systems, mainly because it can provide objective measures that
mitigate biases in supervisory ratings (Campbell et al., 1998). In this direction, Sharma (2017)
proposed a conceptual model where the role of HRA on PA system and its impact on employees’
willingness to improve performance were explored. This present study contributes to the relevant
literature by examining empirically fairness perceptions of the PA system when an HRA system
is established. Its main finding is that high quality HRA leads to higher procedural fairness
perceptions of the PA system than low quality HRA.
However, this investigation did not prove that the application of HRA, combined with
human judgment and managerial expertise, will lead to better conclusions and practices than could
have resulted from following the status quo of intuition and gut reaction alone (King, 2016). The
results support theories arguing that not all decisions should be wholly grounded in analytics and
that instinct should be used in decisions involving human capital (Davenport, 2006), at least in the
PA context. Analytics might indeed offer a good excuse to treat employees as pure resources
(Davenport et al., 2010). Furthermore, the claim that supervisors’ subjective judgment about the
qualitative aspects of the job performance (Moers, 2005) was introduced to decrease distortion
(Kauhanen & Napari, 2012) of the HRA system was not supported in this study. Human judgment
on the information that data analyses give did not have an effect on how accurate and fair the
appraisal procedures were perceived.
Moreover, this study offers some insights for the literature on fairness of the PA system.
Firstly, it was found that procedural and distributive fairness of the PA system are positively
related. This relationship provides support for instrumental theory, as it shows that when
procedures are fair, people think that they will receive their share of favorable outcomes (Thibaut
& Walker, 1975). It is also worth to mention that two dimensions of procedural fairness were
distinguished: system and rater. This finding confirms Erdogan et al. (2001) theory of procedural
fairness as two-dimensional construct in the PA context. Furthermore, procedural fairness was
found to be positively correlated to job satisfaction and organizational commitment, but negatively

related to turnover intentions. Indeed, prior research has shown that perceptions of procedural
unfairness can adversely affect employees’ organizational commitment and job satisfaction
(Colquitt, Conlon, Wesson, Porter, & Ng, 2001), while these perceptions result in increased
employee turnover (Dailey & Kirk 1992).
When it comes to practical implications, this study provides some insights to organizations
that could potentially, or do already, use HRA. To start with, HRA is treated as a new promising
HR tool. However, it is unclear whether most HR departments have the ability to effectively utilize
trends in big data and analytics to reap organizational benefits (Angrave et. al, 2016). It is,
therefore, suggested that organizations should assess their capability of implementing an HRA
system before starting incorporating it in their functions. As it has not been proven that HRA leads
to better performance evaluations than traditional PA systems, it would be risky and wasteful to
create a system of questionable quality and results.
If analytical capabilities of the organization are sufficient, HRA can be employed, but with
caution. As stated throughout this study, there are certain circumstances under which it can ensure
fair procedures for performance evaluation. First of all, organizations should develop and
implement a system where integrated data from all the departments is analyzed. This data needs
to be accurate, consistent, and trustworthy. Moreover, appropriate employees should receive
adequate training in order to derive valid information from every data analysis. Otherwise, poor
data quality and weak capabilities of data analysts can be a major cause for damages and losses
(Kwon et al., 2014). When high quality of the HRA system is ensured, its careful incorporation to
supervisors’ decision making during PA should take place. The purpose of all these attempts is the
higher procedural fairness of the PA system. When an organization implements a fair appraisal
process, positive consequences can be expected, such as the acceptance of the performance
evaluations, satisfaction with the appraisal process, performance improvement and employee
loyalty (Smither, 1998). Otherwise, organizations need to realize that not investing in a fair PA
system could cause lower organizational commitment and job satisfaction, both leading to eventual
turnover.
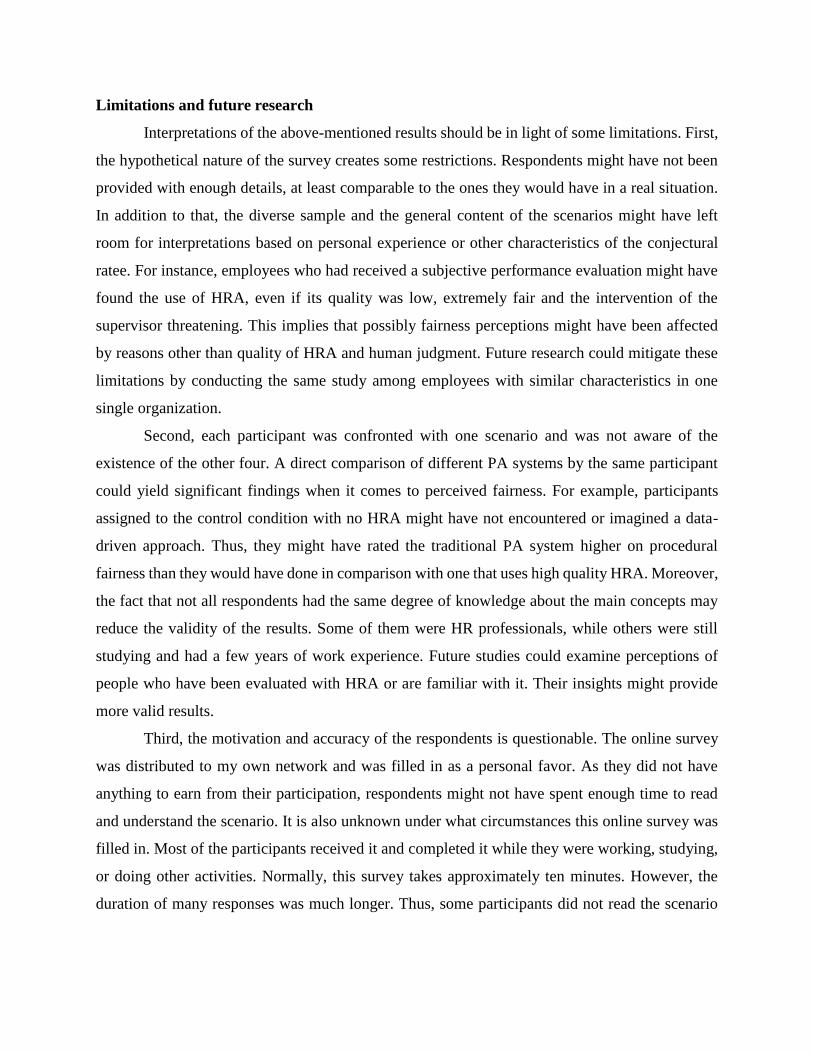
Limitations and future research
Interpretations of the above-mentioned results should be in light of some limitations. First,
the hypothetical nature of the survey creates some restrictions. Respondents might have not been
provided with enough details, at least comparable to the ones they would have in a real situation.
In addition to that, the diverse sample and the general content of the scenarios might have left
room for interpretations based on personal experience or other characteristics of the conjectural
ratee. For instance, employees who had received a subjective performance evaluation might have
found the use of HRA, even if its quality was low, extremely fair and the intervention of the
supervisor threatening. This implies that possibly fairness perceptions might have been affected
by reasons other than quality of HRA and human judgment. Future research could mitigate these
limitations by conducting the same study among employees with similar characteristics in one
single organization.
Second, each participant was confronted with one scenario and was not aware of the
existence of the other four. A direct comparison of different PA systems by the same participant
could yield significant findings when it comes to perceived fairness. For example, participants
assigned to the control condition with no HRA might have not encountered or imagined a data-
driven approach. Thus, they might have rated the traditional PA system higher on procedural
fairness than they would have done in comparison with one that uses high quality HRA. Moreover,
the fact that not all respondents had the same degree of knowledge about the main concepts may
reduce the validity of the results. Some of them were HR professionals, while others were still
studying and had a few years of work experience. Future studies could examine perceptions of
people who have been evaluated with HRA or are familiar with it. Their insights might provide
more valid results.
Third, the motivation and accuracy of the respondents is questionable. The online survey
was distributed to my own network and was filled in as a personal favor. As they did not have
anything to earn from their participation, respondents might not have spent enough time to read
and understand the scenario. It is also unknown under what circumstances this online survey was
filled in. Most of the participants received it and completed it while they were working, studying,
or doing other activities. Normally, this survey takes approximately ten minutes. However, the
duration of many responses was much longer. Thus, some participants did not read the scenario

and answered all the questions at once or were distracted during its completion. Both situations
affect negatively the validity of their responses. Future similar studies in a research lab or under
better circumstances would resolve these issues. Their results would be even more robust if
incentives were offered to the participants and enough time, concentration, and effort were
ensured.
Lastly, all the limitations of this study would be resolved at once in two cases. First, the
same hypotheses could be tested in real organizations currently using HRA in the PA system.
Questionnaires could be distributed to employees that had been evaluated also with the traditional
appraisal process. Even better, satisfaction surveys of these employees, if present in these
organizations, could be compared. Second, the impact of introducing an HRA system on fairness
perceptions could be examined in a field experiment. Both investigations would be a great
contribution to the immature literature on HRA, that could also be enriched by studies involving
other HR practices rather than performance appraisals. Researchers and HR practitioners need
more information on how this new HR tool could contribute to improved execution of HRM
activities that eventually would lead to higher organizational success.
Conclusion
This study examined whether and under what circumstances HRA should be employed in
order to lead to higher procedural fairness perceptions of the PA system. Even though results did
not support that the use of HRA is preferable over the traditional appraisal methods, some
important findings were identified. First, quality of HRA have an influence on how fair the PA
system is perceived. Ratees showed more trust in the system that used reliable data and qualified
HR analysts. Second, further human judgment on the results that data analyses give did not prove
to be of pivotal importance. Nevertheless, it led to slightly higher system procedural fairness. As
this was one of the first attempts where the role of HRA on the PA system was explored, more
research is needed in order generalizable assumptions to be derived.
Last but not least, this study contributes to the literature by exploring the use of HRA in
the context of performance appraisals as a means of objectivity and fairness. This knowledge is
also important on practical level. Organizations should grasp every possible opportunity to
improve procedural fairness perceptions of the PA system as these perceptions are highly

correlated with job satisfaction, organizational commitment, as well as turnover intentions. As this
study revealed, the decision of implementing an HRA system in performance appraisals should be
made after taking into consideration various aspects. Each organization should assess its analytical
capabilities, as well as weigh the gains and losses of such a change in its context. Nevertheless, it
is unquestionable that once HRA is in place, it needs to be of high quality in order to generate
positive outcomes.

REFERENCES
Angrave, D., Charlwood, A., Kirkpatrick, I., Lawrence, M., & Stuart, M. (2016). HR and
analytics: why HR is set to fail the big data challenge. Human Resource Management
Journal, 26(1), 1–11. https://doi.org/10.1111/1748-8583.12090
Bies, R. and Shapiro, D. (1987). Interactional fairness judgments: The influence of causal
accounts. Social Justice Research, 1(2), pp.199-218.
Bretz, R. D., Milkovich, G. T., & Read, W. (1992). The Current State of Performance
Appraisal Research and Practice: Concerns, Directions, and Implications. Journal of
Management,18(2), 321-352. doi:10.1177/014920639201800206
Cameron, W. B. (1969). Informal sociology: a casual introduction to sociological thinking.
New York: Random House.
Campbell, D. J., Campbell, K. M., & Chia, H. (1998). Merit pay, performance appraisal,
and individual motivation: An analysis and alternative. Human Resource
Management,37(2), 131-146. doi:10.1002/(sici)1099-050x(199822)37:2<131::aid-
hrm4>3.0.co;2-x
Cascio, W. F., & Bernardin, H. J. (1981). Implications Of Performance Appraisal Litigation
For Personnel Decisions. Personnel Psychology, 34(2), 211-226. doi:10.1111/j.1744-
6570.1981.tb00939.x
Castellano, S. (2014). Decision Science. Retrieved February 25, 2018, from
https://www.td.org/magazines/td-magazine/decision-science
Colquitt, J. A., Conlon, D. E., Wesson, M. J., Porter, C. O. L. H., & Ng, K. Y. (2001).
Justice at the millennium: A meta-analytic review of 25 years of organizational justice
research. Journal of Applied Psychology, 86: 425-445.
Cropanzano, R. & Folger, R. (1991). Procedural Justice and Worker Motivation. In: Steers,
R.M. and Porter, L.W., Eds., Motivation and Work Behavior, 5th Edition, McGraw-
Hill, New York, 131-143.
Dailey, R.C., and Kirk, D.J. (1992). Distributive and Procedural Justice as Antecedents of
Job Dissatisfaction and Intent to Turnover. Human Relations, 45, 3, 305–317.

Davenport, T. H., & Harris, J. G. (2007). Competing on analytics: the new science of
winning. Boston, MA: Harvard Business Review Press.
Davenport, T., Harris, J. & Shapiro, J. (2010). Competing on Talent Analytics. Harvard
Business Review. October, 2010: 52-58.
Dervitsiotis, K. N. (2004). The Design of Performance Measurement Systems for
Management Learning. Total Quality Management & Business Excellence, 15(4), 457–
473. https://doi.org/10.1080/1478336042000183596
Dobbins, G. H., Cardy, R. L., & Platz-Vieno, S. J. (1990). A Contingency Approach to
Appraisal Satisfaction: An Initial Investigation of the Joint Effects of Organizational
Variables and Appraisal Characteristics. Journal of Management, 16(3), 619-632.
doi:10.1177/014920639001600307
Dulebohn, J. H., & Johnson, R. D. (2013). Human resource metrics and decision support: A
classification framework. Human Resource Management Review, 23(1), 71-83.
doi:10.1016/j.hrmr.2012.06.005
Erdogan, B. (2002). Antecedents and consequences of justice perceptions in performance
appraisals. Human Resource Management Review, 12(4), 555–578.
https://doi.org/10.1016/S1053-4822(02)00070-0
Evans, E. M., & Mcshane, S. L. (1988). Employee perceptions of performance appraisal
fairness in two organizations. Canadian Journal of Behavioural Science/Revue
canadienne des sciences du comportement, 20(2), 177-191. doi:10.1037/h0079926
Farr, J. L., Fairchild, J., Cassidy, S. E. (2014). Technology and performance appraisal. In
Coovert, M. D., Thompson, L. F. (Eds.), The psychology of workplace technology (pp.
77–98). New York, NY: Routledge.
Fitz-enz, J. (2010). The new HR analytics: predicting the economic value of your company’s
human capital investments. New York: AMACOM.
Fitz-enz, J., & Mattox, J. (2014). Predictive analytics for human resources.
Folger, R., & Konovsky, M. A. (1989). Effects Of Procedural And Distributive Justice On
Reactions To Pay Raise Decisions. Academy of Management Journal, 32(1), 115-130.
doi:10.2307/256422

Folger, R., Konovsky, M. A., & Cropanzano, R. (1992). A due process metaphor for
performance appraisal. Research in Organizational Behavior, 14, 129–177.
Grant, R. (1999). Prospering in Dynamically-Competitive Environments: Organizational
Capability as Knowledge Integration. Knowledge and Strategy, 133-153.
doi:10.1016/b978-0-7506-7088-3.50011-5
Gibbons, F.X. and Kleiner, B.H. (1993). Factors that bias employee performance appraisals.
Management Research News, Vol. 16 No. 7, pp. 10-14.
Hoffman, C., Lesser, E., Ringo, T. (2012). Applying Analytics to Your Workforce:
Realizing Returns on Your Most Valuable Asset. Thunderbird School of Management
Jacobs, R., Kafry, D., & Zedeck, S., (1980). Expectations of behaviorally anchored rating
scales. Personnel Psychology, 33.
Kauhanen, A., & Napari, S. (2012). Performance Measurement and Incentive Plans.
Industrial Relations: A Journal of Economy and Society, 51(3), 645-669.
doi:10.1111/j.1468-232x.2012.00694.x
Keeping, L. M., & Levy, P. E. (2000). Performance appraisal reactions: Measurement,
modeling, and method bias. Journal of Applied Psychology, 85(5), 708–723.
https://doi.org/10.1037/0021-9010.85.5.708
Kim, K., & Tsai, W. (2011). Social comparison among competing firms. Strategic
Management Journal, 33(2), 115-136. doi:10.1002/smj.945
King, K. G. (2016). Data Analytics in Human Resources. Human Resource Development
Review,15(4), 487-495. doi:10.1177/1534484316675818
Kwon, O., Lee, N., & Shin, B. (2014). Data quality management, data usage experience and
acquisition intention of big data analytics. International Journal of Information
Management,34(3), 387-394. doi:10.1016/j.ijinfomgt.2014.02.002
Landy, F. J., Barnes-Farrell, J. L., & Cleveland, I. N. (1980). Perceived fairness and
accuracy of performance evaluation: A follow-up. Journal of Applied Psychology,
65(3), 355-356. doi:10.1037//0021-9010.65.3.355
Laird, A. & Clampitt, P.G. (1985). Effective performance appraisal: viewpoints from
managers. Journal of Business Communication, Vol. 22 No. 3, pp. 49-57.

LaValle, S., Lesser, E., Shockley, R., Hopkins, M.S. & Kruschwitz, N. (2011). Big data,
analytics and the path from insights to value. MIT Sloan Management Review, Vol. 52
Lawler, E. (1967). the Multitrait-Multirater Approach To Measuring Managerial Job
Performance. Journal of Applied Psychology, 51(5 PART 1), 369–381.
https://doi.org/10.1037/h0025095
Lawler, E., & Levenson, A. (2004). HR Metrics and Analytics: Use and Impact. Human
Resource Planning Journal, 27(4), 27–36. https://doi.org/10.1016/j.jwb.2009.09.014
Lee, C. (1985). Increasing performance appraisal effectiveness: matching task types,
appraisal process, and rater training. Academy of Management Review, Vol. 10 No. 2,
pp. 322-331.
Leventhal, G. S. (1980). What should be done with equity theory? New approaches to the
study of fairness in social relationships. Social exchange: Advances in theory and
research: 27-55. New York: Plenum Press.
Maas, V. S., & Torres-González, R. (2011). Subjective Performance Evaluation and Gender
Discrimination. Journal of Business Ethics, 101(4), 667–681.
https://doi.org/10.1007/s10551-011-0763-7
Marler, J. H., & Boudreau, J. W. (2017). An evidence-based review of HR Analytics.
International Journal of Human Resource Management, 28(1), 3–26.
https://doi.org/10.1080/09585192.2016.1244699
McAfee, A. & Brynjolfsson, E. (2012). Big data: the management revolution. Harward
Business Review. October 2012: 60-69.
Minbaeva, D. (2017). Human capital analytics: why aren't we there? Introduction to the
special issue. Journal of Organizational Effectiveness: People and Performance, Vol.
4 Issue: 2
Moers, F. (2005). Discretion and bias in performance evaluation: the impact of diversity and
subjectivity. Accounting, Organizations and Society, Vol. 30 No. 1, pp. 67-80.
Murphy, K.R. & DeNisi, A. (2008). A model of the appraisal process. Performance
Management Systems: A Global Perspective, Routledge: Taylor and Francis Group
Murphy, K.R., & Cleveland, J.N. (1991). Performance appraisal: An organizational
spective. Boston: Allyn and Bacon

Murphy, K. R. & Cleveland, J.N. (1995). Understanding Performance Appraisal: Social,
Organizational, and Goal- Based Perspectives. Sage Publications, Thousand oaks, CA
Narcisse, S., & Harcourt, M. (2008). Employee fairness perceptions of performance
appraisal: a Saint Lucian case study. The International Journal of Human Resource
Management, 19(6), 1152-1169. doi:10.1080/09585190802051451
Orr, K. (1998). Data quality and systems theory. Communications of the ACM 41. 66–71.
Pfeffer, J., & Sutton, R. I. (2006). Evidence-Based Management. Harvard Business Review,
84(1): 62-74
Popovič, A., Hackney, R., Coelho, P. S., & Jaklič, J. (2012). Towards business intelligence
systems success: Effects of maturity and culture on analytical decision making.
Decision Support Systems, 54, 729-739.
Rasmussen, T., & Ulrich, D. (2015). Learning from practice: How HR analytics avoids
being a management fad. Organizational Dynamics, 44(3), 236–242.
https://doi.org/10.1016/j.orgdyn.2015.05.008
Roberts, B. (2013). The benefits of big data. HR Magazine, 20-30.
Schwarz, J. L., & Murphy, T. E. (2007). Human Capital Metrics: An Approach To Teaching
Using Data and Metrics To Design and Evaluate Management Practices. Journal of
Management Education, 32(2), 164-182. doi:10.1177/1052562907307638
Sharma, A., & Sharma, T. (2017). HR analytics and performance appraisal system: A
conceptual framework for employee performance improvement. Management
Research Review, Vol. 40 Issue: 6, pp.684-697.
Skarlicki, D. P., & Folger, R. (1997). Retaliation in the workplace: The roles of distributive,
procedural, and interactional justice. Journal of Applied Psychology, 82(3), 434-443.
doi:10.1037//0021-9010.82.3.434
Skarlicki, D. P., & Latham, G. P. (1996). Increasing citizenship behavior within a labor
union: A test of organizational justice theory. Journal of Applied Psychology, 81(2),
161-169. doi:10.1037//0021-9010.81.2.161
Smither, A.W. (1998). Performance Appraisal: State of the Art in Practice. CA: Jossey-
Bass.

Stone, D. L., Deadrick, D. L., Lukaszewski, K. M., & Johnson, R. (2015). The influence of
technology on the future of human resource management. Human Resource
Management Review, 25(2), 216–231. https://doi.org/10.1016/j.hrmr.2015.01.002
Storey, V. C., Dewan, R. M., & Freimer, M. (2012). Data quality: Setting organizational
policies. Decision Support Systems, 54(1), 434–442.
https://doi.org/10.1016/j.dss.2012.06.004
Strong, D., Lee, Y. W., & Wang, R. Y. (1997). 10 potholes in the road to information
quality. IEEE Computer, 30(8), 38–46.
Thibaut, J., Walker, L. (1975). Procedural Justice: A psychological analysis. Hillsdale, NJ:
Lawrence Erlbaum Associates.
Tsui, A. S., & O'reilly, C. A. (1989). Beyond Simple Demographic Effects: The Importance
Of Relational Demography In Superior-Subordinate Dyads. Academy of Management
Journal,32(2), 402-423. doi:10.2307/256368
Walsh, K., Sturman, M. & Longstreet. (2010). Key issues in strategic human resources. The
Scholarly Commons. School of Hotel Administration Collection.
Wright, R. P. (2004). Mapping cognitions to better understand attitudinal and behavioral
responses in appraisal research. Journal of Organizational Behavior, 25(3), 339-374.
doi:10.1002/job.245

APPENDIX
Table 1
Scenarios’ content
Scenario Content
1. Human judgment
- The supervisor, who is the main assessor of the employees´ performance,
takes into account their attitudes, relationships, general behavior and
performance.
- In order to ensure that supervisors conduct the appraisals competently, fairly
and equitably, the company has enforced some general guidelines.
- However, there is always the subjectivity of human judgment.
- The supervisor takes into consideration contingencies or factors that do not
directly relate to employee’s effort, if they believe that these factors affect
employee’s performance somehow.
- This can be either favorable or disadvantageous for the employee, depending
on the situation.
2. High quality
HR Analytics
- The company has developed and implemented a system where integrated
data from all the departments is analyzed.
- Data has been gathering for years and is accurate, consistent and
trustworthy.
- A team specialized in data analysis with HR background, is in charge of
analyzing this data for HR purposes.
- The results of these analyses show how employees have performed, taking
into account internal and external factors, e.g. market condition, time of the
year, past performance, general performance etc
- The performance evaluation of the employees depends on these results. The
supervisor consults the metrics and their interpretation in order to make any
performance appraisal- related decision, according to the standards set by the
company.
- In case the supervisor disagrees with these decisions, they are not allowed to

modify them.
3.High quality
HR Analytics
& human judgment
- The company has developed and implemented a system where integrated
data from all the departments is analyzed.
- Data has been gathered for years and is accurate, consistent and trustworthy.
- A team specialized in data analysis with HR background, is in charge of
analyzing this data for HR purposes.
- The results of these analyses show how employees have performed, taking
into account internal and external factors, e.g. market condition, time of the
year, past performance, general performance etc
- The performance evaluation of the employees depends on these results. The
supervisor consults the metrics and their interpretation in order to make any
performance appraisal- related decision, according to the standards set by the
company.
- In case the supervisor disagrees with these decisions, they can modify them.
4. Low quality
HR Analytics
- The company has developed and implemented a system where integrated
data from all the departments is analyzed.
- Data has been gathered for years but there are some deficiencies, making it
less trustworthy in some cases.
- HR employees of the company recently received training in data analytics in
order to analyze this data for HR purposes. However, they are not fully
proficient yet.
- The results of these analyses show how employees have performed, taking
into account internal and external factors, e.g. market condition, time of the
year, past performance, general performance etc
- The performance appraisal of the employees depends on these results. The
supervisor consults the metrics and their interpretation in order to make any
performance appraisal- related decision, according to the standards set by the
company.
- In case the supervisor disagrees with these decisions, they are not allowed to
modify them.

5. Low quality
HR Analytics
& human judgment
- The company has developed and implemented a system where integrated
data from all the departments is analyzed.
- Data has been gathered for years but there are some deficiencies, making it
less trustworthy in some cases.
- HR employees of the company recently received training in data analytics in
order to analyze this data for HR purposes. However, they are not fully
proficient yet.
- The results of these analyses show how employees have performed, taking
into account internal and external factors, e.g. market condition, time of the
year, past performance, general performance etc
- The performance evaluation of the employees depends on these results. The
supervisor consults the metrics and their interpretation in order to make any
performance appraisal- related decision, according to the standards set by the
company.
- In case the supervisor disagrees with these decisions, they can modify them.

Table 2
Participants Demographic Information
Item % Subtotals Totals
Gender
Male
Female
43.3
56.7
68
89 157
Age
20-25 years
25-35 years
36-45 years
46-55 years
Over 55 years
35.7
49.7
8.9
3.8
1.9
56
78
14
6
3
157
Educational qualifications
High school degree
Some college, no degree
Bachelor’s degree
Master’s degree
Professional degree
Doctorate
3.2
3.2
47.1
43.3
1.9
1.3
5
5
74
68
3
2
157
Employment tenure
None
Less than 2 years
2 to 5 years
6 to 10 years
10+ years
7.6
39.5
22.9
10.8
19.1
12
62
36
17
30
157
Job title
Intern
Manual worker
Owner
Entry level
Intermediate or Experienced level
First level management
Middle level management
Senior, Executive or Top-level management
16.6
3.2
3.8
22.9
26.8
10.2
5.7
3.2
26
5
6
36
42
16
9
5
145
Sector employed
Construction
Commerce
Manufacturing
Government
Science
Tourism
Other
4.5
10.2
7.6
6.4
25.5
6.4
31.8
7
16
12
10
40
10
50
145
Organization size
1
2-9
10-24
25-99
100-499
500-999
1000-4999
5000+
.6
9.6
12.7
8.3
14
7.6
10.2
29.3
1
15
20
13
22
12
16
46
145

Table 3
Factor Analysis of Items Measuring Fairness
Item
Factor Loadings
1 2 3
1. This performance rating truly represented how well I have
performed my job.
,805 ,021 ,285
2. The procedures of this performance appraisal were fair. ,729 ,236 ,298
3. My performance has been evaluated accurately. ,709 ,150 ,375
4. My supervisor was justified in this rating of my
performance.
,548 ,164 ,344
5. This performance rating was free from bias. ,376 ,364 ,302
6. The performance appraisal system of my company is fair. ,801 ,135 ,190
7. The performance appraisal system of my company is able
to differentiate high performers from poor performers.
,519 ,114 ,364
8. Having a high or low score from this system is not related
to actual performance. (R)
,558 ,072 ,069
9. My supervisor uses this performance appraisal system to
reward the employees that s/he likes. (R)
,121 ,815 -,050
10. My supervisor uses this performance appraisal system as
a means to threaten employees. (R)
,121 ,809 ,061
11. During this performance appraisal, my supervisor
evaluates my personality instead of my performance. (R)
,132 ,639 ,085
12. I do not think my supervisor will give me a high score no
matter how good my performance is. (R)
,063 ,767 ,240
13. I think my supervisor uses this performance appraisal to
punish the employees s/he does not like. (R)
,056 ,838 ,167
14. I believe my supervisor really tries to conduct a fair and
objective appraisal.
,329 ,472 ,287
15. The outcome of this performance appraisal is appropriate
for the work I have completed.
,391 ,288 ,740
16. The outcome of this performance appraisal reflects what I
have contributed to my company.
,317 ,138 ,790
17. The outcome of this performance appraisal reflects the
effort I have put into my work.
,250 ,085 ,869
18. The outcome of this performance appraisal is justified,
given my performance.
,447 ,127 ,716
Extraction Method: Principal Component Analysis, Rotation Method: Varimax with Kaiser
Normalization.
NOTE: n=157. Factor analysis was conducted after items were reverse score (R).