Embed Size (px)
Citation preview

HPCMP Benchmarking Update
Cray HenryApril 2008
Department of DefenseHigh Performance Computing Modernization Program

Outline
Context – HPCMP
Initial Motivation from 2003
Process Review
Results

DoD HPC Modernization Program

DoD HPC Modernization Program

HPCMP Serves a Large, Diverse DoD User Community
519 projects and 4,086 users at approximately 130 sites
Requirements categorized in 10 Computational Technology Areas (CTA)
FY08 non-real-time requirements of 1,108 Habu-equivalents
156 users are self characterized as “Other”
Computational Structural Mechanics – 437 Users
Electronics, Networking, and Systems/C4I – 114 Users
Computational Chemistry, Biology & Materials Science – 408 Users
Computational Electromagnetics & Acoustics – 337 Users
Computational Fluid Dynamics – 1,572 Users
Environmental Quality Modeling & Simulation – 147 Users
Signal/Image Processing – 353 Users
Integrated Modeling & Test Environments – 139 Users
Climate/Weather/Ocean Modeling & Simulation – 241 Users
Forces Modeling & Simulation – 182 Users

Benchmarks Have REAL Impact
In 2003 we started to describe our benchmarking approach
Today benchmarks are even more important
In 2003 we started to describe our benchmarking approach
Today benchmarks are even more important

2003 Benchmark Focus
Focused on application benchmarks
Recognized application benchmarks were not enough

2003 Challenge – Move to Synthetic Benchmarks
5 years later we have made progress, but not enough to fully transition to synthetics
Supported over $300M in purchases so far

Comparison of HPCMP System Capabilities – FY 2003 - FY 2008

What Has Changed Since 2003
(TI-08) Introduction of performance modeling and predictions– Primary emphases still on application benchmarks
– Performance modeling now used to predict some application performance
– Performance predictions and measured benchmark results compared for HPCMP systems used in TI-08 to assess accuracy
(TI-08) Met one on one with vendors to review performance predictions for each vendor’s individual systems

Overview of TI-XX Acquisition Process
Determine requirements, usage, and allocations
Choose application benchmarks, test cases, and weights
Vendors provide measured and projected times on offered systems
Vendors provide measured and projected times on offered systems
Measure benchmark times on DoD standard system
Measure benchmark times on existing DoD systems
Determine performance for each offered system per application test case
Determine performance for each existing system per application test case
Determine performance for each offered system
Usability/past performance information on offered systems
Usability/past performance information on offered systems
Collective acquisition decision
Use optimizer to determine price/performance for each offered system and combination of systems
Center facility requirements
Vendor pricingVendor pricing
Life-cycle costs for offered systems

TI-09 Application Benchmarks
AMR – Gas dynamics code
– (C++/FORTRAN, MPI, 40,000 SLOC)
AVUS (Cobalt-60) – Turbulent flow CFD code
– (Fortran, MPI, 19,000 SLOC)
CTH – Shock physics code
– (~43% Fortran/~57% C, MPI, 436,000 SLOC)
GAMESS – Quantum chemistry code
– (Fortran, MPI, 330,000 SLOC)
HYCOM – Ocean circulation modeling code– (Fortran, MPI, 31,000 SLOC)
ICEPIC – Particle-in-cell magnetohydrodynamics code – (C, MPI, 60,000 SLOC)
LAMMPS – Molecular dynamics code– (C++, MPI, 45,400 SLOC)
Red = predictedBlack = benchmarkedRed = predictedBlack = benchmarked

Predicting Code Performance for TI-08 and TI-09
*The next 12 charts were provided by the Performance Modeling and Characterization Group at the San Diego Supercomputer Center.

Prediction Framework – Processor and Communications Models

Memory Subsystem Is Key in Predicting Performance

Red Shift – Memory Subsystem Bottleneck
0.01
0.1
1
10
100
1000
1982
1984
1985
1987
1989
1991
1993
1995
1997
1999
2001
2003
2005
2007n
ano
seco
nd
s
CPU Cycle Time
Multi Core Effective Cycle Time
Memory Access Time

Predicted Compute Time Per Core –HYCOM

MultiMAPS System Profile
One curve per stride pattern– Plateaus
correspond to data fitting in cache
– Drops correspond to data split between cache levels
MultiMAPS ported to C and will be included in HPC Challenge Benchmarks
0.0E+00
2.0E+03
4.0E+03
6.0E+03
8.0E+03
1.0E+04
1.2E+04
1.4E+04
1.E+03 1.E+04 1.E+05 1.E+06 1.E+07 1.E+08 1.E+09
Working Set size (8-byte words)
Me
mo
ry B
an
dw
idth
(M
B/s
) IBM p655
SGI Altix
IBM Opteron
Working Set Size (8 Byte Words)Working Set Size (8 Byte Words)
Mem
ory
B
and
wid
th (
MB
/s)
Mem
ory
B
and
wid
th (
MB
/s)
Sample MultiMAPS Output Sample MultiMAPS Output

0.00E+00
1.00E+03
2.00E+03
3.00E+03
4.00E+03
5.00E+03
6.00E+03
7.00E+03
8.00E+03
1.00E+05 1.00E+06 1.00E+07 1.00E+08 1.00E+09
Size (bytes)
Me
mo
ry B
an
dw
idth
(M
B/s
)
1255 1core
1255 4 cores
L2 cache being shared
4 Core Woodcrest Node
Modeling the Effects of Multicore

LAMMPS LRG 256
-0.5
0.0
0.5
1.0
1.5
flops
L1 cache
L2 cache
L3 cache
Main memoryOn-node lat
On-node BW
Off-node lat
Off-node BW
Performance Sensitivity of LAMMPS LRG to 2x Improvements
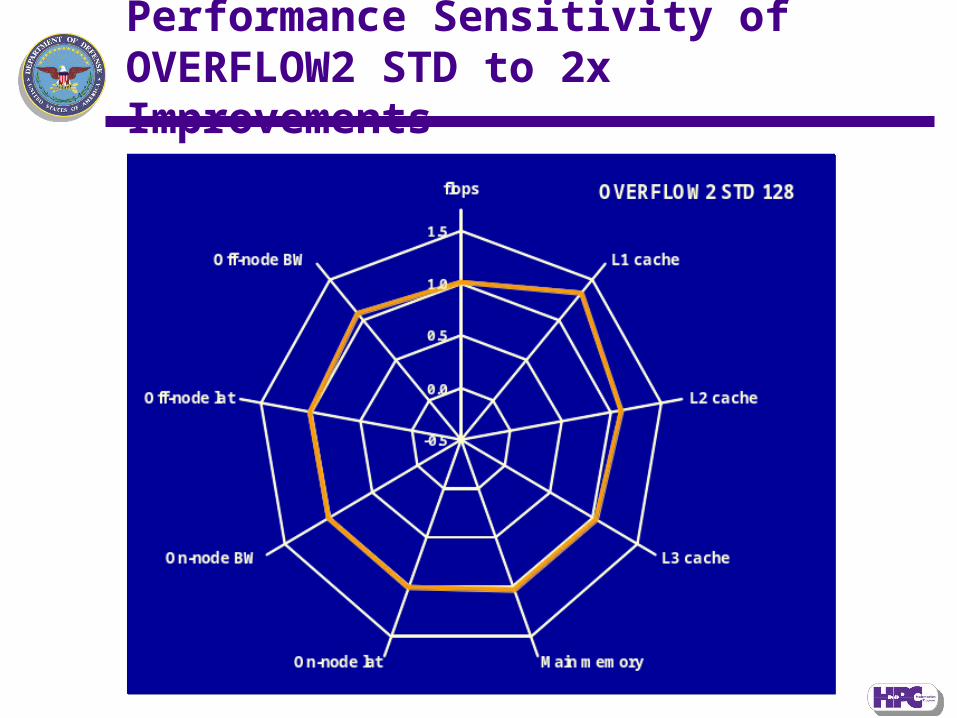
Performance Sensitivity of OVERFLOW2 STD to 2x Improvements

Performance Sensitivity of OVERFLOW2 LRG to 2x Improvements

-0.5
0.0
0.5
1.0
1.5
flops
L1 cache
L2 cache
L3 cache
Main memoryOn-node lat
On-node BW
Off-node lat
Off-node BW
WRF STD 64
AMR STD 128
LAMMPS LRG 256
Overflow2 LRG 512
Main Memory and L1 Cache Have Most Effect on Runtime

Differences Between Predicted and Measured Benchmark Times (Unsigned)
Application Test Case
System AMRStd
AMRLg
ICEPIC Std
ICEPICLg
LAMMPS Lg
OVERFLOW2 Std
OVERFLOW2 Lg
WRF Std
WRFLg
Overall
ASC HP Opteron Cluster
16.6% 6.3% - - 2.9% 8.0% 43.0% - - 15.4%
ASC SGI Altix 14.1% 3.4% 22.1% 15.6% 7.5% 4.1% 10.0% 24.3% 16.5% 13.1%
MHPCC Dell Xeon Cluster
20.7% 14.7% 6.7% 4.2% 8.1% 23.3% - - - 13.0%
NAVO IBM P5+ 11.7% - - - 9.6% 3.0% 1.8% 7.8% 16.4% 8.4%
Overall 12.4%
Note: Average uncertainties of measured benchmark times on loaded HPCMP systems are approximately 5%.

Solving the hard problems . . .04/20/23
25
ASC_HP (AMR_LG)
0.4
0.5
0.6
0.7
0.8
0.9
1.0
1.1
1.2
192 256 320 384 448 512 576 640 704 768 832
Cores
Rel
ativ
e P
erfo
rman
ce (S
app
hir
e E
q.)
Benchmark Data
Benchmark Curve
Predicted Data
Predicted Curve
STM Range (B)
STM Range (P)

Solving the hard problems . . .04/20/23
26
ASC_DC_Altix (AMR_LG)
0.7
0.8
0.9
1.0
1.1
1.2
1.3
1.4
1.5
1.6
1.7
192 256 320 384 448 512 576 640 704 768 832
Cores
Rel
ativ
e P
erfo
rman
ce (S
app
hir
e E
q.)
Benchmark Data
Benchmark Curve
Predicted Data
Predicted Curve
STM Range (B)
STM Range (P)

Solving the hard problems . . .04/20/23
27
MHPCC_DC_Dell (AMR_LG)
0.6
0.8
1.0
1.2
1.4
1.6
1.8
192 256 320 384 448 512 576 640 704 768 832
Cores
Rel
ativ
e P
erfo
rman
ce (S
app
hir
e E
q.)
Benchmark Data
Benchmark Curve
Predicted Data
Predicted Curve
STM Range (B)
STM Range (P)

MHPCC_DC_Dell (OVERFLOW2_STD)
0.0
0.5
1.0
1.5
2.0
2.5
0 64 128 192 256 320
Cores
Rel
ativ
e P
erfo
rman
ce (
Sap
phir
e E
q.)
Benchmark Data
Benchmark Curve
Predicted Data
Predicted Curve
STM Range (B)
STM Range (P)

NAVO_DC_P5+ (OVERFLOW2_LG)
0.4
0.5
0.6
0.7
0.8
0.9
1.0
1.1
192 256 320 384 448 512 576 640 704 768 832
Cores
Rel
ativ
e P
erfo
rman
ce (
Sap
phir
e E
q.)
Benchmark Data
Benchmark Curve
Predicted Data
Predicted Curve
STM Range (B)
STM Range (P)

Solving the hard problems . . .04/20/23
30
ASC_DC_Altix (ICEPIC_LG)
0.2
0.3
0.4
0.5
0.6
0.7
0.8
0.9
1.0
1.1
192 320 448 576 704 832 960 1088 1216 1344 1472 1600
Cores
Rel
ativ
e P
erfo
rman
ce (
Sap
phir
e E
q.)
Benchmark Data
Benchmark Curve
Predicted Data
Predicted Curve
STM Range (B)
STM Range (P)Pseudo Score

Solving the hard problems . . .04/20/23
31
ASC_HP (LAMMPS_LG)
0.4
0.5
0.6
0.7
0.8
0.9
1.0
1.1
1.2
1.3
1.4
192 256 320 384 448 512 576 640 704
Cores
Rel
ativ
e P
erfo
rman
ce (S
app
hir
e E
q.)
Benchmark Data
Benchmark Curve
Predicted Data
Predicted Curve
STM Range (P)
STM Range (B)

Solving the hard problems . . .04/20/23
32
ASC_DC_Altix (AMR_STD)
0.2
0.6
1.0
1.4
1.8
2.2
2.6
3.0
3.4
0 64 128 192 256 320
Cores
Rel
ativ
e P
erfo
rman
ce (S
app
hir
e E
q.)
Benchmark Data
Benchmark Curve
Predicted Data
Predicted Curve
STM Range (B)
STM Range (P)

NAVO_DC_P5+ (WRF_STD)
0.2
0.4
0.6
0.8
1.0
1.2
1.4
1.6
0 64 128 192 256 320
Cores
Rel
ativ
e P
erfo
rman
ce (
Sap
phir
e E
q.)
Benchmark Data
Benchmark Curve
Predicted Data
Predicted Curve
STM Range (B)
STM Range (P)

What’s Next?
More focus on Signature Analysis
Continue to evolve application benchmarks to represent accurately the HPCMP computational workload
Increase profiling and performance modeling to understand application performance better
Use performance predictions to supplement application benchmark measurements and to guide vendors in designing more efficient systems