Embed Size (px)
Citation preview

HP Business Service Management
for the Windows® and Linux operating systems
Software Version: 9.20
Operations Manager iConcepts Guide
Document Release Date: August 2012Software Release Date: August 2012

Legal Notices
Warranty
The only warranties for HP products and services are set forth in the express warranty statements accompanying such products and services. Nothing herein should be construed as constituting an additional warranty. HP shall not be liable for technical or editorial errors or omissions contained herein.
The information contained herein is subject to change without notice.
Restricted Rights Legend
Confidential computer software. Valid license from HP required for possession, use or copying. Consistent with FAR 12.211 and 12.212, Commercial Computer Software, Computer Software Documentation, and Technical Data for Commercial Items are licensed to the U.S. Government under vendor's standard commercial license.
Copyright Notices
© Copyright 2008-2012 Hewlett-Packard Development Company, L.P.
Trademark Notices
Adobe® and Acrobat® are trademarks of Adobe Systems Incorporated.
AMD and the AMD Arrow symbol are trademarks of Advanced Micro Devices, Inc.
Google™ and Google Maps™ are trademarks of Google Inc.
Intel®, Itanium®, Pentium®, and Intel® Xeon® are trademarks of Intel Corporation in the U.S. and other countries.
iPod is a trademark of Apple Computer, Inc.
Java is a registered trademark of Oracle and/or its affiliates.
Microsoft®, Windows®, Windows NT®, Windows® XP, and Windows Vista® are U.S. registered trademarks of Microsoft Corporation.
Oracle is a registered trademark of Oracle Corporation and/or its affiliates.
UNIX® is a registered trademark of The Open Group..
Acknowledgements
This product includes software developed by the Apache Software Foundation (http://www.apache.org/).
This product includes software developed by the JDOM Project (http://www.jdom.org/).
This product includes software developed by the MX4J project (http://mx4j.sourceforge.net).
2

Documentation Updates
The title page of this document contains the following identifying information:
• Software Version number, which indicates the software version.
• Document Release Date, which changes each time the document is updated.
• Software Release Date, which indicates the release date of this version of the software.
To check for recent updates or to verify that you are using the most recent edition of a document, go to:
http://h20230.www2.hp.com/selfsolve/manuals
This site requires that you register for an HP Passport and sign in. To register for an HP Passport ID, go to:
http://h20229.www2.hp.com/passport-registration.html
Or click the New users - please register link on the HP Passport login page.
You will also receive updated or new editions if you subscribe to the appropriate product support service. Contact your HP sales representative for details.
3

Support
Visit the HP Software Support Online web site at:
www.hp.com/go/hpsoftwaresupport
This web site provides contact information and details about the products, services, and support that HP Software offers.
HP Software online support provides customer self-solve capabilities. It provides a fast and efficient way to access interactive technical support tools needed to manage your business. As a valued support customer, you can benefit by using the support web site to:
• Search for knowledge documents of interest
• Submit and track support cases and enhancement requests
• Download software patches
• Manage support contracts
• Look up HP support contacts
• Review information about available services
• Enter into discussions with other software customers
• Research and register for software training
Most of the support areas require that you register as an HP Passport user and sign in. Many also require a support contract. To register for an HP Passport ID, go to:
http://h20229.www2.hp.com/passport-registration.html
To find more information about access levels, go to:
http://h20230.www2.hp.com/new_access_levels.jsp
4

Contents
1 Welcome to this Guide . . . . . . . . . . . . . . . . . . . . . . . . . . . . . . . . . . . . . . . . . . . . . . . . . . . . . . . . . . . . . . . . . 7
How this Guide is Organized. . . . . . . . . . . . . . . . . . . . . . . . . . . . . . . . . . . . . . . . . . . . . . . . . . . . . . . . . . . . . . 7Who Should Read this Guide. . . . . . . . . . . . . . . . . . . . . . . . . . . . . . . . . . . . . . . . . . . . . . . . . . . . . . . . . . . . . . 7
2 Introduction to BSM Operations Management . . . . . . . . . . . . . . . . . . . . . . . . . . . . . . . . . . . . . . . . . . . . 9
Licensing Structure . . . . . . . . . . . . . . . . . . . . . . . . . . . . . . . . . . . . . . . . . . . . . . . . . . . . . . . . . . . . . . . . . . . . . 9Operations Bridge for a Complete BSM Solution . . . . . . . . . . . . . . . . . . . . . . . . . . . . . . . . . . . . . . . . . . . . 10
Data Acquisition from Multiple Sources . . . . . . . . . . . . . . . . . . . . . . . . . . . . . . . . . . . . . . . . . . . . . . . . . 11Consolidated Event and Performance Management . . . . . . . . . . . . . . . . . . . . . . . . . . . . . . . . . . . . . . . . . . 12
Event Information . . . . . . . . . . . . . . . . . . . . . . . . . . . . . . . . . . . . . . . . . . . . . . . . . . . . . . . . . . . . . . . . . . 12Event Dashboards. . . . . . . . . . . . . . . . . . . . . . . . . . . . . . . . . . . . . . . . . . . . . . . . . . . . . . . . . . . . . . . . . . . 13Health Information. . . . . . . . . . . . . . . . . . . . . . . . . . . . . . . . . . . . . . . . . . . . . . . . . . . . . . . . . . . . . . . . . . 13Correlating Events . . . . . . . . . . . . . . . . . . . . . . . . . . . . . . . . . . . . . . . . . . . . . . . . . . . . . . . . . . . . . . . . . . 14
Suppressing Duplicate Events . . . . . . . . . . . . . . . . . . . . . . . . . . . . . . . . . . . . . . . . . . . . . . . . . . . . . . 15Closing Related Events Automatically. . . . . . . . . . . . . . . . . . . . . . . . . . . . . . . . . . . . . . . . . . . . . . . . 15Stream-Based Event Correlation . . . . . . . . . . . . . . . . . . . . . . . . . . . . . . . . . . . . . . . . . . . . . . . . . . . . 16Topology-Based Event Correlation . . . . . . . . . . . . . . . . . . . . . . . . . . . . . . . . . . . . . . . . . . . . . . . . . . . 16Event Storm Suppression . . . . . . . . . . . . . . . . . . . . . . . . . . . . . . . . . . . . . . . . . . . . . . . . . . . . . . . . . . 17
Structured Problem Solving . . . . . . . . . . . . . . . . . . . . . . . . . . . . . . . . . . . . . . . . . . . . . . . . . . . . . . . . . . . . . 17Managing Content with Content Packs . . . . . . . . . . . . . . . . . . . . . . . . . . . . . . . . . . . . . . . . . . . . . . . . . . . . 19
Out-of-the-Box Content Packs . . . . . . . . . . . . . . . . . . . . . . . . . . . . . . . . . . . . . . . . . . . . . . . . . . . . . . . . . 19Content Management Tools . . . . . . . . . . . . . . . . . . . . . . . . . . . . . . . . . . . . . . . . . . . . . . . . . . . . . . . . . . . 20
Scalable Architecture with Multiple Servers . . . . . . . . . . . . . . . . . . . . . . . . . . . . . . . . . . . . . . . . . . . . . . . . 21Manager-of-Managers. . . . . . . . . . . . . . . . . . . . . . . . . . . . . . . . . . . . . . . . . . . . . . . . . . . . . . . . . . . . . . . . 22
Integration Interfaces . . . . . . . . . . . . . . . . . . . . . . . . . . . . . . . . . . . . . . . . . . . . . . . . . . . . . . . . . . . . . . . . . . 23User Roles and Responsibilities . . . . . . . . . . . . . . . . . . . . . . . . . . . . . . . . . . . . . . . . . . . . . . . . . . . . . . . . . . 24
3 Operator Workflow. . . . . . . . . . . . . . . . . . . . . . . . . . . . . . . . . . . . . . . . . . . . . . . . . . . . . . . . . . . . . . . . . . . 27
The Operator Environment . . . . . . . . . . . . . . . . . . . . . . . . . . . . . . . . . . . . . . . . . . . . . . . . . . . . . . . . . . . . . . 28Health Perspective . . . . . . . . . . . . . . . . . . . . . . . . . . . . . . . . . . . . . . . . . . . . . . . . . . . . . . . . . . . . . . . . . . 28Event Browser. . . . . . . . . . . . . . . . . . . . . . . . . . . . . . . . . . . . . . . . . . . . . . . . . . . . . . . . . . . . . . . . . . . . . . 29Health Top View . . . . . . . . . . . . . . . . . . . . . . . . . . . . . . . . . . . . . . . . . . . . . . . . . . . . . . . . . . . . . . . . . . . . 29Health Indicators Pane. . . . . . . . . . . . . . . . . . . . . . . . . . . . . . . . . . . . . . . . . . . . . . . . . . . . . . . . . . . . . . . 30Other Tools . . . . . . . . . . . . . . . . . . . . . . . . . . . . . . . . . . . . . . . . . . . . . . . . . . . . . . . . . . . . . . . . . . . . . . . . 31Resolution . . . . . . . . . . . . . . . . . . . . . . . . . . . . . . . . . . . . . . . . . . . . . . . . . . . . . . . . . . . . . . . . . . . . . . . . . 31
Other Roles. . . . . . . . . . . . . . . . . . . . . . . . . . . . . . . . . . . . . . . . . . . . . . . . . . . . . . . . . . . . . . . . . . . . . . . . . . . 32
4 Monitoring Developer Workflow . . . . . . . . . . . . . . . . . . . . . . . . . . . . . . . . . . . . . . . . . . . . . . . . . . . . . . . 33
Initial Analysis. . . . . . . . . . . . . . . . . . . . . . . . . . . . . . . . . . . . . . . . . . . . . . . . . . . . . . . . . . . . . . . . . . . . . . . . 33Define Health Indicators . . . . . . . . . . . . . . . . . . . . . . . . . . . . . . . . . . . . . . . . . . . . . . . . . . . . . . . . . . . . . . . . 34
5

Other Tasks . . . . . . . . . . . . . . . . . . . . . . . . . . . . . . . . . . . . . . . . . . . . . . . . . . . . . . . . . . . . . . . . . . . . . . . . . . 34Other Roles. . . . . . . . . . . . . . . . . . . . . . . . . . . . . . . . . . . . . . . . . . . . . . . . . . . . . . . . . . . . . . . . . . . . . . . . . . . 34
5 IT Operations System Administrator Workflow . . . . . . . . . . . . . . . . . . . . . . . . . . . . . . . . . . . . . . . . . . . 35
Installation and Configuration Tasks . . . . . . . . . . . . . . . . . . . . . . . . . . . . . . . . . . . . . . . . . . . . . . . . . . . . . . 35Oversee the BSM Installation . . . . . . . . . . . . . . . . . . . . . . . . . . . . . . . . . . . . . . . . . . . . . . . . . . . . . . . . . 36Tune the Environment . . . . . . . . . . . . . . . . . . . . . . . . . . . . . . . . . . . . . . . . . . . . . . . . . . . . . . . . . . . . . . . 36Tune Infrastructure Settings . . . . . . . . . . . . . . . . . . . . . . . . . . . . . . . . . . . . . . . . . . . . . . . . . . . . . . . . . . 36Configure Users and User Roles . . . . . . . . . . . . . . . . . . . . . . . . . . . . . . . . . . . . . . . . . . . . . . . . . . . . . . . 36Other Responsibilities . . . . . . . . . . . . . . . . . . . . . . . . . . . . . . . . . . . . . . . . . . . . . . . . . . . . . . . . . . . . . . . 36
Ongoing Tasks . . . . . . . . . . . . . . . . . . . . . . . . . . . . . . . . . . . . . . . . . . . . . . . . . . . . . . . . . . . . . . . . . . . . . . . . 37Operations Bridge . . . . . . . . . . . . . . . . . . . . . . . . . . . . . . . . . . . . . . . . . . . . . . . . . . . . . . . . . . . . . . . . . . . . . 37Other Roles. . . . . . . . . . . . . . . . . . . . . . . . . . . . . . . . . . . . . . . . . . . . . . . . . . . . . . . . . . . . . . . . . . . . . . . . . . . 37Summary . . . . . . . . . . . . . . . . . . . . . . . . . . . . . . . . . . . . . . . . . . . . . . . . . . . . . . . . . . . . . . . . . . . . . . . . . . . . 38
6

1 Welcome to this Guide
This guide is an introduction to HP Business Service Management (BSM) Operations Management, and describes the main concepts underlying this comprehensive event and performance management software that is a component of an HP Business Service Management (BSM) solution.
How this Guide is Organized
This guide contains the following information:
• Introduction to BSM Operations Management on page 9:
A high-level overview of the most important features helps you understand how you can use BSM Operations Management to improve the performance, availability, and efficiency of your IT environment.
• Operator Workflow on page 27:
A description of a typical day for Dave, the IT Operations operator, and how he uses event management to prioritize his daily tasks.
• Monitoring Developer Workflow on page 33:
A description of the role of Mike, an IT Operations monitoring developer, and how he monitors a new application.
• IT Operations System Administrator Workflow on page 35:
A description of the role of Matthew, and how he oversees the BSM Operations Management environment and configures the operational infrastructure to integrate all the applications and servers in his domain.
Who Should Read this Guide
You should read this guide if you are one of these users:
• An IT Operations operator
• A DB, Exchange, SAP, or other subject matter expert who designs the monitoring scenarios for these enterprise applications
BSM Operations Management is available with an HP Business Service Management (BSM) deployment with an active Operations Manager i (OMi) license (see Licensing Structure on page 9).
For details about deployment, see the HP Business Service Management Deployment Guide.
7

• An IT Operations monitoring developer
• An IT Operations system administrator
As one of these users, you will be familiar with BSM and the fundamental concepts of enterprise monitoring and management.
8 Chapter 1

2 Introduction to BSM Operations Management
Read this chapter for a high-level overview of BSM Operations Management, and how it enables you to improve the efficiency of your IT services and infrastructure.
This chapter includes an architectural overview, shows how BSM Operations Management fits into an HP Business Service Management (BSM) solution, and describes the underlying concepts.
This chapter is structured as follows:
Licensing Structure on page 9
Operations Bridge for a Complete BSM Solution on page 10
Consolidated Event and Performance Management on page 12
Structured Problem Solving on page 17
Managing Content with Content Packs on page 19
Scalable Architecture with Multiple Servers on page 21
Integration Interfaces on page 23
User Roles and Responsibilities on page 24
Licensing Structure
BSM Operations Management is available with an HP Business Service Management (BSM) deployment with an active Operations Manager i (OMi) license.
For details about deployment, see the HP Business Service Management Deployment Guide.
The Operations Manager i (OMi) licensing structure is as follows:
• Event Management Foundation
The Event Management Foundation license is required for BSM Operations Management functionality.
• Topology-Based Event Correlation
The Topology-Based Event Correlation license is required for the topology-based event correlation (TBEC) functionality. This builds on the Event Management Foundation license.
• Target Connector
A Target Connector license is required for each system managed by a third-party (non- HP) management solution, where events are consolidated in BSM Operations Management. This builds on the Event Management Foundation license.
9

Operations Bridge for a Complete BSM Solution
BSM Operations Management is the event management foundation for a complete BSM monitoring solution. As the operations bridge, it consolidates all IT infrastructure monitoring in a central event console, and relates the events to the IT services that depend on that infrastructure. Users benefit from a common structured event management model that applies the same processes to both business service management and IT infrastructure management.
BSM Operations Management links infrastructure management with application and business service management. It combines events from HP Business Service Management components, such as Business Process Monitor (BPM), Real User Monitor (RUM), and Service Level Management (SLM), with events from the operations management components of the BSM solution, such as HP Operations Manager (HPOM) and HP Network Node Manager i (NNMi). This enables you to keep track of all the events that occur in your monitored environment.
Figure 1 shows a typical deployment example where BSM Operations Management is the operations bridge in a BSM solution. BSM Operations Management provides automated monitoring and integration of multiple external applications, and runs within the BSM platform using the common Run-Time Service Model (RTSM) database.
Figure 1 Operations Bridge in a BSM solution
10 Chapter 2

Sharing the RTSM with other BSM applications means that there is always immediate access to the very latest data stored in the RTSM. For example, IT Operations System Administrators have no additional work to maintain topology data in the RTSM.
All event and performance management originating from servers, networks, applications, storage, and other IT silos in your infrastructure, are consolidated into a single event stream in an advanced, central event console. The console displays monitoring alerts to the appropriate team of operators.
You can quickly identify, monitor, troubleshoot, report on, and resolve problems in your distributed IT environment. These abilities make it possible for you to improve the performance and availability of the infrastructure and services in your monitored environment, adding to the efficiency and productivity of your business. BSM Operations Management helps you to locate and solve event-related issues before business service quality degrades. It offers the tools that help operators solve problems without involving a subject matter expert. This frees subject matter experts to focus on strategic activities.
Data Acquisition from Multiple Sources
You can see in Figure 1 on page 10 that events, regardless of where they originate, are processed and managed in a unified manner.
Examples of event sources include:
• BSM components:
— HP Operations Manager for UNIX (HPOM for UNIX) with an Operations Manager server running on an HP-UX, SPARC Solaris, or x64 RHEL platform
— HP Operations Manager for Windows (HPOM for Windows)
— HP Network Node Manager i (NNMi)
— Business Process Monitor (BPM)
— Real User Monitor (RUM)
— HP SiteScope
— HP Systems Insight Manager
BSM alerts (CI Status Alerts, SLA Alerts, and Event Based Alerts) can also generate events in BSM Operations Management. For example, operators can collect, view, correlate, and manage events generated from Event Based Alerts from EUM components. Note that alerts forwarded from an EUM component, such as BPM, are not back-synchronized.
• Third-party management software, normally used to monitor specific environments or special needs not monitored by other solution components, such as Microsoft Systems Center Operations Manager or Oracle Enterprise Manager. Connectors to integrate third-party management software, such as Microsoft SCOM, Nagios, and IBM Tivoli, into HP BSM are also available from the HP Live Network Portal (https://hpln.hp.com).
Introduction to BSM Operations Management 11

Consolidated Event and Performance Management
The operations bridge is where events of all types from multiple sources are consolidated into a centralized console. “Perspectives” provide operators with different levels of information about the events they are responsible for. For example, general event handling is done in the Event Perspective, while the Health Perspective provides additional, service health-related information about the events. These perspectives are centered around the Event Browser.
Event Information
Events report important occurrences in the managed IT environment. They are generated by domain managers, forwarded to Operations Management, and then mapped to related configuration items (CIs) in the RTSM. These events are assigned to operators for resolution. In the Event Browser, operators can see an complete overview of all the active events that need to be worked on. They can see such things as the event severity, the type and category of event, the source of the event, the time and location of the event, and the affected configuration item.
Events pass through a “lifecycle,” which is an informative way to display and monitor the status of an event. An operator’s workflow is based around the lifecycle of an event. The lifecycle state of an event represents the progress of the investigation into the problem that caused the event. An operator assigned to an event opens an investigation and works on finding a solution to the event’s underlying problem. Experts can then assess the proposed solution, verify that it solves the problem that caused the event, and close the event, which completes the lifecycle.
Operators can configure the Event Browser to suit the requirements of their typical workflows. The contents of the Event Browser are filtered according to the selected view or configuration item. Operators can configure new filters or modify existing filters, according to their needs, to change the information displayed. Filtering the Event Browser content helps operators focus on the most useful information, for example, to identify the highest priority events, and to determine which of these events should be worked on first to minimize their impact on business services. You can also configure users and groups so that they can see only the events filtered by views associated with that user or group.
You can configure data collectors, from HP or third-party companies, to forward events to BSM Operations Management. Events are synchronized between servers. For example, BSM Operations Management and HP Operations Manager (HPOM) synchronize the state of events and messages. If a BSM Operations Management operator closes an event, a notification is automatically sent to HPOM. Similarly, HPOM notifies BSM Operations Management about the acknowledgement of messages, and BSM Operations Management automatically updates the lifecycle state of the corresponding events to “closed.”
Operators can enrich events with additional information, for example, by adding annotations to the event to either aid further problem resolution, or to document what action has already been taken.
Closed events are automatically moved to the Closed Events browser. Operators can access this list of closed events, and can use these events as a reference for solving similar problems.
For those events that require the attention of specific subject matter experts, the operations bridge can forward those events to the appropriate operators. For example, the IT Operations System Administrator can configure the system to route notifications to operators and escalations to the appropriate help desk operators who can concentrate on managing escalated events and fixing underlying problems.
12 Chapter 2

Event Dashboards
Event Dashboards provide you an at-a-glance overview of the events from your monitored environment. They enable you to quickly assess the health of the environment and to identify areas that require your attention.
Event Dashboards help you to:
• get an overview of your monitored environment
• visualize a starting point for daily management operations
• quickly apply event filters to the event browser
• keep an eye on the monitored environment while working on an event
Event Dashboards display status information using widgets as building blocks (for example, stack and pie widgets). Each widget references an event filter, a view, or both, and only displays the status of those events that match the criteria of the filter and that are related to the configuration items included in the referenced view, making it easy to customize.
Health Information
With event-based data, you can see in the Event Browser which related CI is affected by the event. Additionally, BSM health data, such as event type indicators (ETIs), health indicators (HIs), and key performance indicators (KPIs) are used to evaluate the health of related CIs in the context of the events.
Introduction to BSM Operations Management 13

For any device, such as a server, the severity of the problems directly associated with the server are collated, and combined with information about devices associated with the server. The combined data is passed to calculation rules that evaluate and set the key performance indicators that indicate the overall health of the object.
Figure 2 depicts a typical Health Perspective page, with the Health Top View showing a hierarchical overview of the relationships among the objects associated with the event.
Figure 2 Health Perspective, with Health Top View and Health Indicator panes
You can see the health status of an object, see which business rules and KPIs are being used, and see how the health status of the selected object affects the health of related objects. For example, a user can navigate to check the health of neighboring CIs. This information helps the user analyze which events to focus on, and prioritize event handling to maximize availability and minimize negative impact on business services. Users can also select views to show only the events and CIs they are responsible for.
The user can select any component and see the status of associated health indicators and KPIs. For example, an operator may want to see the status of the availability KPI for a particular server and the status of the associated health indicators.
Correlating Events
In a large environment, one of the biggest challenges is how to manage the large number of events that originate from a variety of sources. Within this sea of data, the aim is to identify the events that have a significant impact on business services. So while it is essential to
Health Top View pane Health Indicators pane
Model Explorer Event Browser
Actions pane
14 Chapter 2

minimize the number of events that appear in the Event Browser, it is even more important to highlight the events that, if unmanaged, could cause a breach in service level agreements (SLAs) and generate incidents in your help desk system.
Event correlation plays a very important part in bringing together business service management and IT infrastructure management, where the disruption of a service can be traced to a specific failure in the IT infrastructure on which the service depends.
BSM Operations Management correlates events automatically using the following forms of event correlation:
• Suppressing duplicate events
• Closing related events automatically
• Stream-based event correlation
• Topology-based event correlation
Suppressing Duplicate Events
A new event may be a duplicate of an existing event. As a simple example, due to network stability problems, the same event is sent twice by the source domain manager because it did not receive an acknowledgement quickly enough for the first instance of the event. As new events are received, they are checked against existing events. If duplicates are found, new information, such as a change in severity, is used to update the existing event, and the new event is ignored. If duplicate event suppression is enabled, new events that are duplicates of an existing event are not retained and the original event is updated.
The advantage of correlating events using duplicate event suppression is that it reduces the number of events displayed in the console, but without losing any important information.
Suppressing duplicate events can result in additional correlations of the original event (both as cause or as symptom). When a duplicate is identified, the timestamp for the original event is updated to the time when the duplicate was received. The event is then correlated again and may now be related to other events which were not available for correlation when the original event was received.
Closing Related Events Automatically
A new event can automatically close one or more existing events. When a new event arrives, a search is made for existing related events. Some specific information contained in the new event is used to match the new event to any existing events, and the new event closes the existing event. This type of event correlation is similar to the “good/bad message correlation” provided by HP Operations Manager.
For example, an existing event may be a notification of a problem or abnormal condition (a bad event) for a particular device. The bad event could be “SQL Query Performance LOW”. Consider a new event matching this existing related event which notifies that the abnormal condition no longer exists (a good event). The good event could be “SQL Query Performance HIGH”. The new (good) event closes the existing (bad) related event.
You can track related events that were closed automatically in the event history.
Introduction to BSM Operations Management 15

Stream-Based Event Correlation
Stream-based event correlation (SBEC) uses rules and filters to identify commonly occurring events or combinations of events and helps simply the handling of such events by automatically identifying events that can be withheld, removed or need a new event to be generated and displayed to the operators.
The following types of SBEC rules can be configured:
• Repetition Rules: Frequent repetitions of the same event may indicate a problem that requires attention.
• Combination Rules: A combination of different events occurring together or in a particular order indicates an issue, and requires special treatment.
• Missing Recurrence Rules: A regularly recurring event is missing, for example, a regular heartbeat event do not arrive when expected.
Topology-Based Event Correlation
The event management process is simplified not only by consolidating events from all sources in a central console, but also by categorizing events using topology-based event correlation (TBEC). Dependencies between events are analyzed to determine whether some events can be explained by other events. For example, consider a database server (DB Server) running on a server (Server1). If Server1’s CPU usage becomes persistently overloaded, the resulting event “SLA for DB Server breached” can be explained by the causal event “Server1: CPU persistently overloaded (100% for more than 10 minutes)”.
The key is to pinpoint the underlying causal events that are responsible for other symptom events, so that you can prioritize the resolution of these causal events based on the impact to your business.
If two events occur concurrently (within a configurable time span), TBEC correlation rules identify one event as the cause and the other event to be the symptom. Rule-based event management enables you to manage large numbers of similar (related) symptom events in a large network.
When any combination of cause and symptom event occurs in the monitored environment, the correlated events are flagged in the Event Browser. You can configure the Event Browser to display the root-cause event and a separate overview of all the symptom events, thus enabling you to drill down into the correlation process and browse through the hierarchy of correlated events.
Events can also be correlated across technical domains, such as databases, hardware, networks, and web applications. This comprehensive scope enables you to correlate events that, at first sight, might not seem to have any connection. The cross-domain functionality also increases productivity by reducing the amount of overlap between operators responsible for monitoring different technical areas. For example, by correlating events relating to database problems, network problems, and storage problems, you can avoid the scenario of operators from the different technical areas all separately investigating different events that are the symptoms of one root cause event.
TBEC offers a number of benefits related to resolving complex events:
• Reduces the number of events displayed in the console, but without ignoring or losing important data that enables users to drill down through the hierarchy of related events.
• Supports event correlation across multiple domains to simplify root-cause analysis of events that generate symptom events.
• Changes to topological data do not require changes to correlation rules.
16 Chapter 2

Event Storm Suppression
If a problem is experienced on a managed system that results in the generation of an abnormally high number of events within a relatively short period of time, this phenomenon is known as an event storm. It is very probable that the root cause is already known and is being addressed. However, related events are also being generated. These events do not provide any useful information but may result in significantly increased loads on the servers running Operations Management. To avoid this situation, Operations Management can be configured to look for event storms from managed systems and discard all subsequent events until the event storm condition for a particular system is over.
An event storm is detected when the number of events received within the detection time period, as a result of a problem on a system, exceeds the configured threshold required to enter an event storm condition.
When an event storm is detected on a system, events from this system are discarded until the rate of incoming events drops below the event storm end threshold. You can configure exception rules to select events from a system under event storm conditions that match a filter and either display these events in the Event Browser or close them (available in the Event Browser under Closed Event). The event storm end event automatically closes the associated event storm begin event.
Structured Problem Solving
The centralized operations bridge streamlines the whole event management process. With centralized, consolidated information, you can create consistent, reusable, and optimized processes for event response.
You can deal with the majority of the events in your environment in a highly structured way. To help you manage events more efficiently and more effectively, you can use the following:
• Tools
You can create tools to help users perform common tasks on CIs. When you create a tool, it is associated with a CI type, and you can run the tool from the centralized console. For example, you can run a command tool to check the status of an Oracle Database instance. The tool is assigned to the configuration item type Oracle Database. If you are managing multiple versions of Oracle Databases, where the tool requires different parameters and options to check the status of the Oracle Database processes, you can create copies of the most appropriate tool and customize them for the various Oracle versions using the duplicate feature. Each tool is then dedicated to a specific version of Oracle.
• Custom Actions
You can automate your event management by creating actions to run on events to help solve problems and improve operator efficiency and productivity. Administrators can define a variety of custom actions for the operator to use when resolving certain types of events. Context-sensitive actions and context-specific tools can also be defined for specific circumstances. For example, you might create a set of database diagnostic tools that are designed to be used to help solve database problems.
For guidance about script definition and creation, including sample scripts provided with the product, see the Operations Manager i Extensibility Guide.
• HPOM Actions
Introduction to BSM Operations Management 17

Events received in the Event Browser from HPOM may contain event-related actions configured in HPOM. If event-related actions exist, you can run these actions from the BSM Operations Management console. HPOM actions can be either operator-initiated, or can run automatically when an event occurs.
For a complete overview of available actions and how to run them, see the BSM Operations Management online help.
• HP Operations Orchestration Run Books
If you are already using HP Operations Orchestration (OO) to automate operator tasks for analyzing or fixing problems, these OO Run Books can be mapped to CI types within BSM. You can launch OO Run Books in an event context from the BSM Operations Management console.
In addition to manually launching Run Books, it is also possible to configure rules to automatically run a Run Book or a series of Run Books in the context of an event.
For information about how to run OO Run Books, see the BSM Operations Management online help.
• Graphs
Graphs and charts provide additional data to help you visualize and analyze performance-related problems and trends affecting the CI impacted by an event, or any neighboring CIs. Operators can even create their own personal graphs.
Structured event management processes are deployed to:
• Assign incoming events automatically to users in specific user groups. Automatic event assignment significantly increases the efficiency of event management and decreases the amount of time elapsed before a response to the event is possible. The IT Operations System Administrator can configure BSM Operations Management to automatically assign incoming events immediately to available operator groups who are responsible for resolving those events.
• Start actions on events that match a specified set of criteria after a specified time. Time-based event automation rules consist of three main elements:
— Filter defining the events to which time-based event automation rules are to be applied.
— Time period defining the duration an event has to continuously match the rule’s filter to start the rule’s actions on that event.
— List of actions to be started on matching events. Available actions are re-running automatic actions on events, modifying event attributes, forwarding events to external servers, assigning events to users and groups, running scripts, and running Run Books.
• Display and monitor the status of events using lifecycle management concepts. You can also see who is currently working on resolving the event, along with all other users who have already played a part in the solution.
• Document how an event is handled and solved. You can annotate the event to describe the problem resolution process, or capture domain expertise by tagging events with tips and hints that improve understanding and explain the event’s underlying problem.
18 Chapter 2

Managing Content with Content Packs
Content is information that BSM uses to describe and enrich the objects or configuration items that you are monitoring in your IT environment. These objects may be network hardware, operating systems, applications, services, users, and so on. Content is used to enrich the configuration item data.
The configuration item data specific to BSM Operations Management is managed in content packs. You can look at content as a set of many content packs. Content packs provide pre-configured rules, tools (including run books), and other items for specific managed applications and systems. So a content pack can contain a snapshot of all, or any part of, your content. Content packs are used to exchange customized data between instances of BSM, for example in test and production environments. You can also share content between content packs.
Content packs typically include these items:
• Correlation rules
• Mapping rules for topology synchronization
• Health indicators (HIs) definitions and mapping rules
• Event type indicator (ETI) definitions and mapping rules
• Key performance indicator (KPI) rules and assignments
• Menus
• View mappings
• Graphs and graph assignments
• Tools
• Definitions for event processing interface (EPI) and custom action scripts
• Event forwarding rules
Content that is not specific to BSM Operations Management (such as additional configuration item types) is in other packs that are managed separately with special tools.
There are two types of content packs:
• Out-of-the-box content packs to compliment data collected by, for example, NNMi or HP Operations Manager Smart Plug-ins (SPI).
• Custom content packs you develop to meet the requirements of your own applications and monitoring policies.
Typically, the Monitoring Developer creates custom content packs and the IT Operations System Administrator deploys them.
Out-of-the-Box Content Packs
If the System Administrator deploys the HP Operations Manager content packs, they provide the necessary configuration data to receive and process the events forwarded from HP Operations Manager.
If the System Administrator installs the content pack for the Oracle database, for example, it provides BSM Operations Management with information about the form and content of the events sent by the HP Operations Manager Smart Plug-in for Oracle Databases. The content pack provides the rules, tools, and graph definitions needed to use event data to evaluate the
Introduction to BSM Operations Management 19

health of Oracle-related configuration items, or to correlate Oracle-related events. As another example, the Infrastructure content pack provides the necessary configuration data, including tools, required to integrate events from NNMi.
Figure 3 shows an overview of the content that can be included in a set of content packs.
Figure 3 Content that can be included in a set of content packs
Content Management Tools
BSM has a set of tools to help manage content. You can use the Content Manager to exchange content between systems, too. For example, you can prepare content in a test environment, and then transfer the tested content to a production environment when the tests confirm that the content is working as expected.
The export and import tools also enable you to exchange content between systems so that you can keep snapshots or backup images of the content you have developed and, in addition, make sure that different instances remain synchronized and up to date.
Import/export using the RTSM Package Manager
Managed by HPOM
Files placed on file system, uploaded with command-line tool
Import/export using the Content Manager
Indicator Definitions
Indicator Mapping
Rules KPI Rules, Propagation
HI/KPI Assignments
Correlation Rules
Menus
EPI/Custom Action
Definitions
View Mappings
Tools
Graph Assignments
Graphs
RTSM Views
CI Types
HPOM SPI Policies
Topology Sync. Rules
Event forwarding
rules
20 Chapter 2

Scalable Architecture with Multiple Servers
BSM Operations Management enables you to manage widely distributed systems from a central location. In a distributed deployment, you can configure your environment hierarchically. You can then spread management responsibility across multiple management levels, according to criteria such as operator expertise, geographical location, and the time of day. This flexible management enables operators to focus on their specialized tasks, with the benefit of round-the-clock technical support available automatically and on demand.
The scalable architecture enables one or more BSM Operations Management instances to be combined into a single, powerful management solution arranged to meet the requirements of your organizational structure. So you can configure servers to forward events to other servers in your environment.
In a distributed environment, servers hosting BSM Operations Management can be configured to work not only with other like servers, but also with multiple HPOM for Windows and HPOM for UNIX management servers, other BSM servers, and even third-party domain managers.
In such an hierarchical, distributed environment, you can configure BSM Operations Management to:
• Be the central event consolidator, or “manager-of-managers” (MoM), for the whole environment at the top of the hierarchy.
• Work with other HP products, such as NNMi and HP SiteScope.
• Work with third-party domain managers, such as Microsoft Systems Center Operations Manager.
You can configure servers hosting BSM Operations Management to:
• Forward events to other servers hosting BSM Operations Management, and keep those events synchronized among the servers.
• Receive messages forwarded from multiple HPOM for Windows and HPOM for UNIX management servers, and keep those messages synchronized between servers hosting BSM Operations Management and HPOM management servers.
• Receive events forwarded from a BSM server receiving alerts from BSM components such as HP Business Process Monitor (BPM).
Introduction to BSM Operations Management 21
Manager-of-Managers
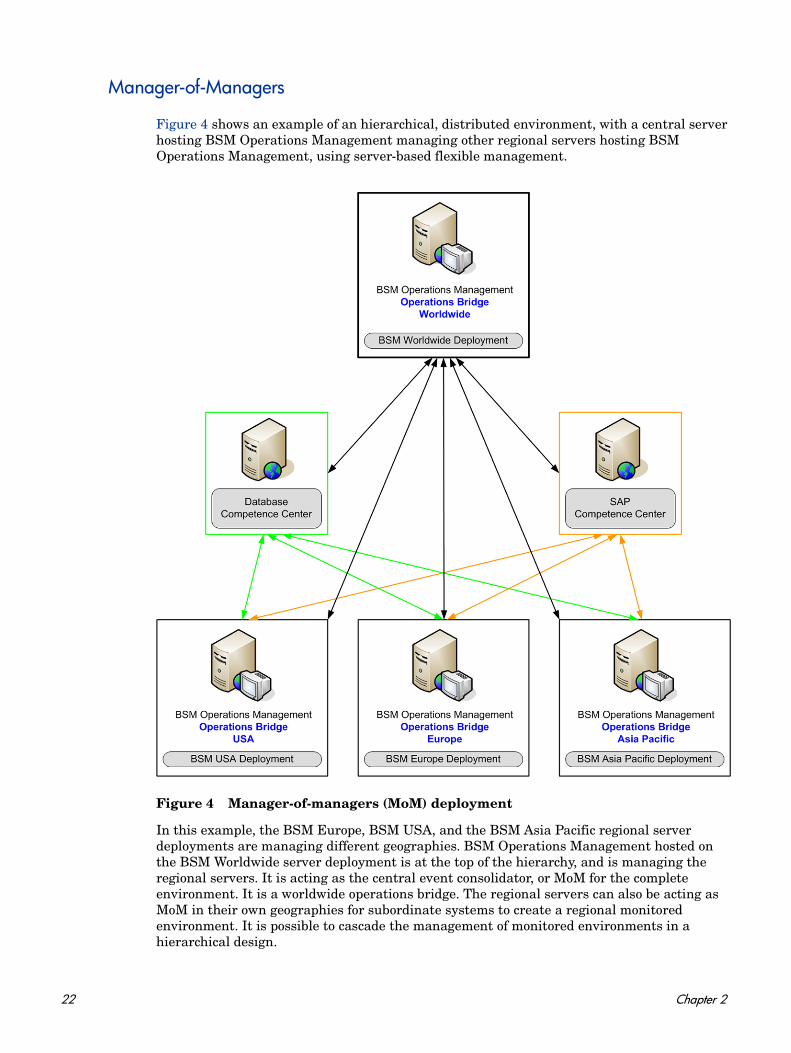
Figure 4 shows an example of an hierarchical, distributed environment, with a central server hosting BSM Operations Management managing other regional servers hosting BSM Operations Management, using server-based flexible management.
Figure 4 Manager-of-managers (MoM) deployment
In this example, the BSM Europe, BSM USA, and the BSM Asia Pacific regional server deployments are managing different geographies. BSM Operations Management hosted on the BSM Worldwide server deployment is at the top of the hierarchy, and is managing the regional servers. It is acting as the central event consolidator, or MoM for the complete environment. It is a worldwide operations bridge. The regional servers can also be acting as MoM in their own geographies for subordinate systems to create a regional monitored environment. It is possible to cascade the management of monitored environments in a hierarchical design.
22 Chapter 2

If you operate in a large enterprise with multiple management servers distributed over a wide area, specialist knowledge relating to a specific subject is not always available locally. For example, your organization might have a competence center responsible for SAP. In addition, another center of expertise may be responsible for databases.
A competence center hierarchy distributes responsibility for configuration items in the monitored environment. Regional servers are not solely responsible for configuration items.
Instead, events about specific subjects go to a competence center server, where expertise exists to solve similar problems for all configuration items in the monitored environment.
In a distributed environment, the IT Operations System Administrator can configure regional servers to forward certain messages to other servers in the network. The same System Administrator can configure regional servers to forward events to any server anywhere in the network, based on event attributes.
In Figure 4 on page 22, all regional servers (BSM Europe, BSM USA, and BSM Asia Pacific) forward all database-related events to the database competence center server, and all SAP-related events to the SAP competence center server.
In this type of scenario, the operations bridge synchronizes event actions (for example resolve, assign, severity change) among the regional servers and the competence centers. This ensures the event states are always synchronized across the enterprise environment.
Integration Interfaces
A number of interfaces are provided that enable integrations with other applications, and allow modification and customization of the event management process. For example:
• To modify and enhance events during event processing, an event processing interface enables event processing scripts to be integrated into the event processing pipeline. This enables you to enrich events:
— During event processing, for example, by adding information used in CI resolution and ETI resolution, or by influencing how duplicate events are handled.
— To provide more information after event processing has taken place, for example, additional CI-related information from asset databases, or information useful for troubleshooting purposes, such as a drill-down URL, or a links to an external knowledge base.
• To integrate events into other applications, an event web service interface enables developers and integrators to automate operator functions and event change detection. Most things that an operator can do in the console while working on events can be done programmatically to improve efficiency. This interface also provides subscription support through Atom feed functionality.
• To synchronize events between BSM Operations Management and an external event processing application, BSM Operations Management provides an event synchronization web service interface. A typical use case is to synchronize events between BSM Operations Management and an incident manager, such as Service Manager.
• To integrate directly with other domain managers, such as Microsoft Systems Center Operations Manager, BSM provides the HP BSM Integration Adapter.
Introduction to BSM Operations Management 23

The Operations Manager i Extensibility Guide in the HP Business Service Management documentation library describes these interfaces, and provides information for content developers and integrators to customize and extend the functionality of BSM Operations Management.
User Roles and Responsibilities
Installing, configuring, and running the operations bridge requires a team of people who have special skills and domain expertise. There are three primary user roles. Each role has a different set of responsibilities and tasks.
• The Operator is the hands-on event manager and troubleshooter.
• The Monitoring Developer is the health manager who decides what is to be monitored and what the appropriate performance levels should be.
• The IT Operations System Administrator installs and configures the monitoring and event management processes. What he can configure is very flexible. He adds new users in the BSM User Management area according to local requirements. He can grant permissions and restrict access to Administrative UIs, Tool Categories, and Custom Actions. He can specify rights and permissions for individual users or user types. He can also enable or disable access to events assigned to other users. For example, he can enable users to view events that are not assigned to them, but deny them the right to make any changes.
Frequently encountered titles for these three user roles, together with a summary of their responsibilities, are presented in Table 1 on page 25. Now that we know more about BSM Operations Management, we will follow three typical users in subsequent chapters to see how they manage their workday and complete their tasks.
24 Chapter 2

In the next chapter, we learn more about the daily responsibilities of Dave the operator in an enterprise environment with BSM Operations Management as the operations bridge.
Table 1 User Roles
Job Title Other Titles Responsibilities
Operator
“Dave”
• Domain Operator• IT Operations Operator
Monitors daily events assigned to him or his workgroup.
Performs routine non-BSM Operations Management operations on the applications, systems, networks he is responsible for.
Troubleshoots and resolves events that might escalate into an incident.
Monitoring Developer
“Mike”
• Domain Expert• IT Operations Monitoring
Developer• Subject-Matter Expert for
applications, networks, or other specialized areas
Customizes the way BSM Operations Management monitors a domain.
Administrator
“Matthew”
• System Administrator• IT Operations System
Administrator • BSM Operations
Management Administrator
• System Architect
Oversees the BSM Operations Management environment and task assignments. Integrates BSM Operations Management with other tools and processes.
Introduction to BSM Operations Management 25

26 Chapter 2

3 Operator Workflow
We met Dave in Chapter 2, Introduction to BSM Operations Management. Dave is the operator responsible for daily event management in a BSM deployment. An operator is usually an entry-level position in the corporate IT environment, but Dave has diverse skills that he brings to the position because he has experience with many of the technologies in the BSM Operations Management environment.Dave works a varied schedule because he is often called when problems occur. He may solve them in person, or log in remotely to ensure that his user community can work without interruption. The BSM Operations Management user interface enables him to monitor the events in his domain from any location as long as he has network access.
Dave needs to understand event management and how to use all the health-related tools at his disposal. There are tools, self-configured commands, scripts, and links to other information that help operators like Dave resolve and close different types of events that occur in the operational environment.
The operations bridge enables Dave to see alerts and events in his domain immediately. He can concentrate on managing his events and fixing the underlying problems automatically with the appropriate tools.
Dave adds value to the enterprise by prioritizing the events in his domain according to their impact on business services and continuity. Dave must resolve small problems before they become major problems that lead to degradation in the quality of supported business services.
Experience with underlying technologies can help Dave correlate events that occur in different technical domains, such as: databases, hardware, network, web applications, and so on. He monitors these disparate technologies to minimize the impact of a failure in one area that might reduce system responsiveness in another area. Minimizing problems before they escalate improves enterprise productivity by minimizing the cascading effect of an unidentified critical event.
If Dave cannot fix a problem, he can escalate it by forwarding the event (including transferring its ownership where appropriate) to an external event processing application, for example, to an HP Service Manager help desk operator.
27

The Operator Environment
The system administrator determines the events that each operator can view or modify by defining user roles and assigning user rights. Dave can see his assigned events, plus other events that he is allowed to see, in a cross-domain view. For example, he is responsible for maintaining the enterprise e-mail server, but he might be able to see events that are assigned to another operator.
Health Perspective
Figure 5 shows the Health Perspective tab with five panes that show different views of the system. Dave begins every day by opening the Health Perspective.
Figure 5 Health Perspective
The five panes provide a global view of the events in Dave’s domain:
• The Model Explorer enables Dave to select a view and an area that he is responsible for. The view shows the parent child relationships among the CIs.
• The Event Browser lists all related events and related information in a table view.
• The Health Top View of a selected event shows the key performance indicators (KPIs) of the CI related to the event, and the CIs in its neighborhood.
28 Chapter 3

• The Health Indicators pane provides detailed information about the status of any CI selected in the Health Top View pane. This view shows information about the performance, availability KPIs, and any health indicators that are relevant to the selected CI.
• The Actions pane is used to display the actions that are available for the selected event, its related CI, or the node that hosts the CI. Actions include tools, run books, custom actions, and performance graphs.
Event Browser
The Event Browser is the first area Dave looks at. He can see:
• A list of prioritized active events.
• Events assigned to him.
• Information about unresolved and unassigned events.
• Tab details that show how many events are critical, major, minor, warnings, normal, or the status is unknown.
Figure 6 shows a typical global view of event information arranged in the Event Browser pane.
Figure 6 Event Browser
Dave uses filters to see events from out-of-box views, or he can personalize his workspace by customizing filters and tabs. For example, he can use a combination of severity and priority to identify the events that need immediate attention. The first task is to determine which of the highest priority events should be examined first.
Health Top View
When Dave selects an event to investigate, the Health Top View is updated to show more information about the related CI. For example, assume that the event is caused by an exceeded storage quota on a related server. The Health Top View shows the topological view of the affected server. Dave can select it in this view to obtain more information. Figure 7 on page 30 shows a typical Health Top View of business services and CIs.
Operator Workflow 29
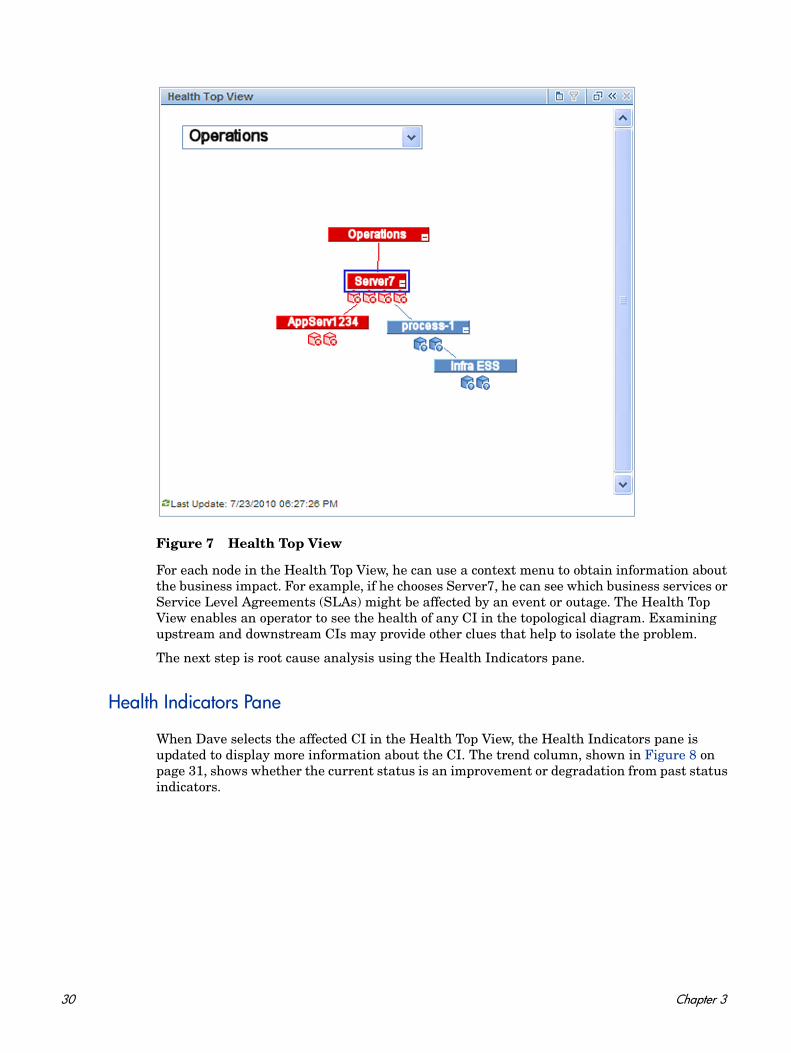
Figure 7 Health Top View
For each node in the Health Top View, he can use a context menu to obtain information about the business impact. For example, if he chooses Server7, he can see which business services or Service Level Agreements (SLAs) might be affected by an event or outage. The Health Top View enables an operator to see the health of any CI in the topological diagram. Examining upstream and downstream CIs may provide other clues that help to isolate the problem.
The next step is root cause analysis using the Health Indicators pane.
Health Indicators Pane
When Dave selects the affected CI in the Health Top View, the Health Indicators pane is updated to display more information about the CI. The trend column, shown in Figure 8 on page 31, shows whether the current status is an improvement or degradation from past status indicators.
30 Chapter 3

Figure 8 Health Indicators pane
This detailed view can show whether there is one underlying problem or a variety of contributing factors to the critical event. This information enables Dave to make quicker decisions about what he needs to do next. As he takes action, other operators will see that Dave is working on this problem so that they can concentrate on other critical events.
Dave may also use performance graphs and other tools to troubleshoot the problem.
Other Tools
The details of an event can contain instructions. Dave can select the Additional Information tab, which might contain notes or other tips to solve the problem. There may be a diagnostic tool or script that he can run to analyze CI performance in great detail, or related logs with informative error messages.
Dave has performance graphs at his disposal that are useful analysis tools. For example, if a database performance event occurs, Dave can right-click the event and select Show > Performance Graphs (Neighborhood). Performance graphs are displayed for the CI affected by the event and for its neighbor CIs, such as the affected application server. These graphs show not only the performance information at the time of the event, but can also show performance at an earlier point in time.
Note: BSM Operations Management tools are not limited to troubleshooting events. Dave can also launch tools just to perform routine daily tasks.
Resolution
There are many ways to solve a problem. For this example, Dave sees a suggestion to run a tool from the Launch menu. From the Event Browser, Dave right-clicks the event and selects Launch > Tools > Repair File System (CI). When the tool finishes, the problem is resolved and the event disappears from the list. If this did not work, Dave can access related run books from the Actions pane. Run books are scripts that execute a multi-step process to solve the problem.
Operator Workflow 31

Other Roles
The operator relies on the expertise of two other key roles:
• The monitoring developer
See Chapter 4, Monitoring Developer Workflow
• The system administrator
See Chapter 5, IT Operations System Administrator Workflow
32 Chapter 3

4 Monitoring Developer Workflow
Mike is a BSM Operations Management monitoring developer. His primary focus is to customize BSM Operations Management to meet specific business requirements.
Typically, Mike integrates new applications and CIs into the monitoring process. For example, he must define how to monitor a new group of servers that support FTP. These servers support critical business services by enabling internal departments and services to send and receive large data blocks.
Initially, the payroll department will transmit employee payroll information to the corporate payroll service from this server. The payroll service will send back internal summary reports, required governmental reports that must be archived and re-distributed to the appropriate government agencies, and deliver other payroll related outputs.
Mike must define how to monitor FTP servers to ensure their ongoing health, ensure they can process requests, and permit FTP downloads in a secure environment. If the servers are unavailable,
deadlines will be missed, and in extreme cases an outage could generate fines for failing to meet governmental requirements.
Initial Analysis
The first things Mike needs to think about are the KPIs and health indicators for FTP servers. Some key questions to answer:
• What are the KPIs that should be measured by the monitoring process?
• How should they be reported back to business service owners who use the FTP server?
• If application availability and performance is important, how should he measure those KPIs?
• What are the service level agreements (SLAs) that might be breached if FTP server availability and performance thresholds are not met?
The IT organization is not only responsible for ensuring this server and its resident applications are available, but also that all associated resources perform according to user expectations. Mike needs to factor all of this information into his selection of KPIs and definition of key health indicators.
33

Define Health Indicators
Mike turns his attention to defining the health indicators that support the selected KPIs. For example, health indicators for the application availability of a Windows FTP server could include Windows service metrics that report:
• Number of outbound connections of all types from the service
• Number of transferred bytes per second
• Server response time
Mike must configure the monitoring process, create the monitor policy, and determine how to report its status.
Fortunately, he has several HP applications that support these tasks. His experience and overall knowledge of these applications help him select the best fit for the task. For example, he might choose an HP Operations Manager agent policy, HP SiteScope, or another HP monitoring tool. Whatever he selects as a health indicator must have a supporting tool that can report the status of the health indicator.
Other Tasks
There are a variety of tasks that Mike completes to enrich the monitoring and health maintenance process for the FTP server. He might do one or more of the following:
• Create graphs that summarize the metrics collected for the FTP server, and assign them to the FTP server CI type to make them appear automatically.
• Create BSM Operations Management tools to restart the FTP server.
• Create multiple operational run books. For example, Mike could create a run book to delete obsolete files from the FTP server.
• Create content packs that contain the monitoring artifacts.
• Create correlation rules to map certain identified disk problems to certain FTP server problems.
Mike has an important role. He envisions what metrics are necessary, how they will be captured, and defines the related processes to gather data and solve problems.
Other Roles
Mike, the monitoring developer, integrates new applications and CIs into the monitoring process. These are configured by Matthew, the IT Operations system administrator, for use by the operators, Dave, and his colleagues.
For an insight into these other personas, see:
• The system administrator
See Chapter 5, IT Operations System Administrator Workflow
• The operator
See Chapter 3, Operator Workflow
34 Chapter 4

5 IT Operations System Administrator Workflow
In Chapter 2, Introduction to BSM Operations Management, we learned about the concept of an operations bridge. BSM Operations Management is the operations bridge for a complete BSM monitoring solution, providing a centralized location for event and performance management. The operations bridge provides consolidated operations management for the BSM environment.
In Chapter 3, Operator Workflow, we learned that the operations bridge provides a complete view of all operational events to enable an immediate response whenever necessary. To run efficiently, someone must configure and optimize the operations bridge. That is Matthew’s task as the IT Operations system administrator.
This is the final role that we want to investigate in our scenario. Matthew is behind the scenes, designing an efficient monitoring environment for the operations staff. In his role, he ensures ongoing maintenance, manages users and user roles, and looks for opportunities to fine-tune the monitoring process. He designs the operational system and puts
the processes in place for others to use on a daily basis. Creating new scripts and automating as many processes as possible is his specialty.
Matthew must have in-depth knowledge of the operational environment, understand the dependencies among applications, and configure an environment that is as efficient as possible.
Installation and Configuration Tasks
Matthew has the global expertise to install and configure BSM Operations Management. In a simple scenario, there would be one instance of BSM Operations Management. In a complex scenario, there could be multiple instances of BSM Operations Management in a distributed Manager of Managers (MoM) environment (see Manager-of-Managers on page 22). In a MoM deployment, seamless integration across these environments requires Matthew to integrate HP Operations Orchestration workflows, HP Network Node Manager i (NNMi) incidents, and Business Process Monitor events.
Matthew also installs the HP BSM Integration Adapter to assist with the integration of third-party domain managers, such as Microsoft System Center Operations Manager (SCOM).
35

Matthew has these responsibilities:
• Oversee the BSM Installation
• Tune the Environment
• Tune Infrastructure Settings
• Configure Users and User Roles
Oversee the BSM Installation
Matthew has domain expertise and experience with operations management. He understands how to install the BSM components, including Operations Management, and configure them correctly. He designs and supervises the end-to-end installation process of required BSM components and decides which applications should integrate with BSM. These applications include other HP enterprise solutions and third party applications, such as Microsoft SCOM.
The complexity comes from integrating multiple infrastructure and enterprise business applications according to Information Technology Infrastructure Library (ITIL®) principles. The goal is to set up and configure autonomous applications that work seamlessly with one another. Each operates independently but communicates effectively with other applications.
Tune the Environment
Matthew configures all the connected servers. Then he sets up rules for forwarding events and notifications and decides who should receive the event notification. In some cases, the event response is to use the custom scripts that Matthew identifies, or even produces himself. Finally, he designs the process that assigns new events to a specific user community. These are rule-based filters to ensure that BSM Operations Management automatically assigns each event to the right group or individual.
Tune Infrastructure Settings
These settings represent a large area of required expertise. If Matthew changes a setting, he has to understand the resulting impact on the operational environment. For example, if he limits what is written to the audit log, details of certain events will be omitted. Other settings describe different aspects of the environment (such as the SSL certificate server), how related events are managed, and duplicate event management.
Configure Users and User Roles
Matthew is responsible for defining user roles and the rights and limitations that accompany these roles. The user role is a generic way to assign the same rights to users, instead of configuring each permission separately. If a new operator or monitoring developer joins the staff, Matthew adds them to the system and assigns one of his pre-defined user roles to automatically grant the same rights and limitations that everyone else with that user role has.
Other Responsibilities
Other responsibilities include:
36 Chapter 5

• Deciding which Event Processing Interface (EPI) scripts to run at pre-defined times
• Defining custom actions
Ongoing Tasks
After initial installation and configuration, the beneficiaries are the operators whose task is to manage the events they monitor. Matthew delivers an environment to Dave the operator that simplifies his daily tasks and ensures that he can respond to critical events as quickly and efficiently as possible.
After initial configuration, maintenance is automatic until a user requires a change. Most environments must also change over time to meet new demands. Mike the monitoring developer might send new or updated content packs for Matthew to install. As the enterprise grows, Matthew must add new users and assign each one the appropriate user role and permissions.
Matthew also can see from daily operations that he needs to revise some of his original models for event forwarding and notifications. As new situations present themselves, Matthew decides whether to use existing scripts or create new response models. Tuning the environment makes the operation more efficient and monitoring more effective.
Operations Bridge
By gathering all infrastructure operations, including applications, dedicated servers, and related software and hardware under a single IT umbrella, it is possible to meet enterprise service level objectives. Matthew’s role is to configure this high-performance environment and use BSM Operations Management as the operations bridge. All components work in concert to deliver necessary internal business services to employees, and provide portal services or other application availability to external customers. Imagine an international banking environment with arrays of servers, applications, CIs, and more to ensure a 99.999% response. This type of commitment requires the type of well-designed operational environment that Matthew provides.
Other Roles
Matthew, the IT Operations system administrator configures and optimizes the operations bridge, including content developed by Mike, the monitoring developer, for use by the operators, Dave and his colleagues.
For an insight into these other personas, see:
• The monitoring developer
See Chapter 4, Monitoring Developer Workflow
• The operator
See Chapter 3, Operator Workflow
IT Operations System Administrator Workflow 37

Summary
After reading about the different users who install, configure, and manage the day-to-day operations of BSM Operations Management, you can see that it takes multiple skill sets to make everything run at optimum level. You may fill one of the roles described in this Guide. Regardless of which role you assume, you can make a difference in how well your work group delivers value to your internal customers.
38 Chapter 5